Attached files
| file | filename |
|---|---|
| 8-K/A - AMENDMENT NO. 1 TO FORM 8-K - SOLARCITY CORP | d815856d8ka.htm |
Exhibit 99.1

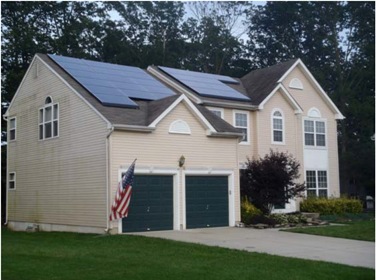
SolarCity Third Quarter 2014 Shareholder Letter
Nominal Contracted Payments Remaining Up 137% Y/Y to $4.1 Billion
Retained Value of $2.2 Billion
Record 230 MW Booked and 137 MW Deployed
November 5, 2014
Dear Fellow Shareholders:
Our long-term value creation for shareholders has never been stronger. Our Estimated Nominal Contracted Payments Remaining has grown to $4.1 billion and our forecast of Retained Value to $2.2 billion as of the end of the third quarter of 2014.
We continued to experience unprecedented demand in the quarter, while greater scale and efficiencies drove our unit costs to new lows. Total MW Booked increased 154% Y/Y to 230 MW and total MW Deployed grew 77% Y/Y to 137 MW with residential MW deployed up 100% Y/Y to 119 MW. Additionally, our total blended cost declined (11%) Y/Y to $2.90 per watt. We are very pleased with this execution, and we remain on track to reach our goal to roughly double our volume every year and lower our total cost to $2.50 per watt by 2017.

When we started SolarCity eight years ago, we set out with the earnest goal to help transform the way energy is delivered in the 21st century through cleaner, more affordable, distributed solar generation. Ultimately, our aim is to grow distributed solar into the largest source of electricity generation in the United States—greater than coal, natural gas, nuclear or any other source. At less than 1% penetration today, this means hundreds of thousands of MW of new distributed solar. Thus, we cannot sit idly by and wait for the market to gradually open up. Rather, we strongly believe we must proactively do everything possible to drive this market forward by improving distributed solar economics. We have to innovate in every aspect of the value chain—customer acquisition, installation, logistics, technology, and finance—to continue to lower the cost of solar energy to the broader public and ultimately make solar affordable on an unsubsidized basis. From Silevo and Zep technology innovation to MyPower and Solar Bonds, we have embarked on a number of new initiatives over the last few months to broaden the addressable market of distributed solar and further differentiate SolarCity as an energy provider. In our inaugural Quarterly Shareholder Letter, we will discuss these initiatives and how they fit into our broader strategic vision and lay the groundwork for sustained growth and value creation.
MyPower: Breaking New Barriers in Access to Solar
In October, we launched our most important new product since the Solar Lease in 2008. MyPower is a new solar loan product that offers customers the benefits of ownership and lower monthly energy bills with no upfront investment. We simply sell the customer the solar system and provide a 30-year loan to finance the system. Interest and principal repayments are structured like a PPA that provides customers a discount to their local utility rate. At our introductory interest rate of 4.5%-5.0%, our first loan customers will be able to own the system and lower their monthly energy bills from the start.

MyPower is also significant because it is our first product not financed through a tax equity financing fund. The unique product structure allows us to focus on efficiently financing customer payments without an intermediate tax equity investor. In a future market environment without tax credits or subsidies, this will be the most effective way to finance our business. This advance in financing is an amazing accomplishment and a critical step towards our long-term goal of opening up the solar market to the masses.
Further Innovation in Solar Technology and Finance
Our efforts to further differentiate SolarCity through technology also continued to make progress in the third quarter. Following our June announcement of the agreement to acquire Silevo, we officially closed the acquisition in September and broke ground on what is expected to be the largest solar manufacturing facility in the Western Hemisphere in partnership with the state of New York. We continue to expect our first 1 GW facility to be operating at full capacity in 2017, and to lay the groundwork for a step-change reduction in the cost of solar energy.
Demonstrating the extended benefits of last year’s acquisition of Zep Solar, we introduced two key new product innovations last month that we expect to increase installation speeds, lower costs and expand the addressable U.S. market for commercial solar even further. ZS Peak—SolarCity’s new lightweight, “snap together” mounting system for commercial flat roofs—can increase the generation capacity that can be installed on each roof by up to 20% - 50%. ZS Beam allows solar panels to be attached to carports faster, more safely and at a lower cost by eliminating unnecessary components and enabling installation from below the support structure, instead of above. In tandem, these new products will make it possible for more businesses, schools and government organizations to use solar electricity generated from their rooftops or parking lots and pay a lower rate for it than they pay for electricity from their utility company.
Finally, we also launched the nation’s first registered public offering of Solar Bonds for retail investors and a new online investment site (solarbonds.solarcity.com) to make them available directly to consumers. Solar Bonds allow the broader public to participate and invest in distributed solar’s growth and we hope it will also increase our Solar Ambassador advocates across the country.
Operations Throughput Hits New Highs as Cost Declines Continue
| • | MW Booked: 230 MW; an increase of 154% Y/Y |
| • | MW Deployed: 137 MW in total of which 119 MW were residential |
| • | Average Cost: $2.90 per watt down (11%) Y/Y with installation costs achieving a new record low of $2.19 per watt |
| • | Leadership in U.S. Residential Installations: After representing 36% of total U.S. residential solar installations in Q2 2014—more than the next 50 installers combined—we expect the 33% sequential growth in our residential deployments to lead to an even higher percentage in Q3 2014. |
|
|
Our growth engine continued to fire on all cylinders in the third quarter of 2014. Sales have never been stronger with 230 MW Booked, up 154% from a year ago. We signed up a net 27,116 new energy contracts in the period. Estimated Nominal Contracted Payments Remaining—an approximation of the revenue these new contracts are expected to generate—increased sequentially by $803 million in the third quarter of 2014. To put this in perspective, this is almost as much as we added in all of 2013. We have always viewed the increase in Estimated Nominal Contracted Payments Remaining as a better measure of our new sales activity than reported revenue, which is recognized as customer payments are received over the 20-30 life of the contracts. |

Our operations team continued to scale throughput to new heights with deployments up 77% Y/Y to 137 MW in the third quarter, and our plans to open 20 new operations centers around the country further expands our deployment capacity in Q4 2014. Our installation crew headcount ended the quarter up over 78% year-over-year and their efficiency continued to improve. Our best performing installation crews—Barracuda, Batman, Chevelle, GTO, Lake Placid, and Mustang—installed around 250 kW a month over the last quarter—close to two residential systems per working day. We remain laser-focused on reducing costs and our cycle times while maintaining our high quality standards.
| Greater efficiencies and higher throughput helped push our costs down to new lows. Installation cost of $2.19 per watt declined (4%) from our Q2 2014 cost of $2.29 per watt and (17%) Y/Y. With sales cost essentially flat Q/Q at $0.50 per watt and G&A down (21%) Q/Q to $0.21 per watt, total cost per watt declined to $2.90 per watt from $3.03 per watt in Q2 2014, better than our expectations and pushing us ahead of plan on our cost roadmap. Reconciliation of our cost per watt to our GAAP financial statements is available on the investor relations section of our website (at investors.solarcity.com). |

|
Our goal is to achieve a blended installation cost per watt of $1.90 per Watt in 2017 and SG&A cost of less than $0.60 per watt for a total all-in cost goal of better than $2.50 per watt. This would enable us to continue to deliver distributed solar to a broad section of the country while still generating attractive returns after the current planned reduction in the ITC in 2017.
Strong Foundation Underpinning Revenue and Cash Flow Outlook over the Next 30 Years
| • | Cumulative MW Deployed: 894 MW at Sept. 30, 2014. |
| • | Cumulative Customers: 168,339 |
| • | GAAP Operating Lease and Solar Energy Systems Revenue: $52 million, up 110% Y/Y |
| • | Solar Energy Systems Assets on Balance Sheet, Net: $2,440 million |
| • | Estimated Nominal Contracted Payments Remaining: $4,115 million |
| • | Retained Value Forecast: $2,180 million |
With cumulative MW deployed at 894 MW at the end of the quarter, we now operate a portfolio of power producing solar systems with the capacity to produce approximately 125 million megawatt-hours per year. In August, we hit a new record of 3.6 GWh on two separate days.
We now have more than 168,000 customers, up 105% from over 82,000 a year ago. To put this in perspective, we now have more customers than the No. 2 utility in Connecticut, the No. 1 utility in Washington D.C. as well as the sixth largest retail electric utility in California. While these are impressive figures, our penetration in the 15 markets we serve still remains under 1%, providing plenty of room to continue to grow at a rapid rate.

As Estimated Nominal Contracted Payments Remaining represents future cash receipts, Retained Value represents the unlevered discounted net cash flow forecast to SolarCity after all project-related costs before the payment of any debt service. Our Retained Value forecast at September 30, 2014 was $2.2 billion. This is calculated by adding up (1) all expected cash receipts from the
customer over the 30-year life of the system (assuming renewal for PPAs/leases) including performance-based incentives, and subtracting (2) all operations & maintenance expenses (including inverter replacement, insurance, and administrative costs) as well as (3) all liabilities due to our joint venture financing partners over the next few years, and (4) discounting to the current period. The retained value calculation is an illustration of our forecasted value of all of our customer energy contracts at a point in time and assumes no further development activity, which as we all know should not be the case!
GAAP operating lease and solar energy systems incentive revenue was $52 million in the third quarter of 2014. With solar energy system sale and components revenue of $6 million, total GAAP revenue was $58 million. Operating lease and solar energy incentive gross margin was 51%. Total GAAP operating expenses were $100 million with sales and marketing of $56 million (including $3 million of amortization of intangibles and $4 million in stock compensation), G&A of $40 million ($11 million in stock compensation), and R&D of $4 million ($2 million in stock compensation). Operating expenses included a one-time $6 million benefit related to insurance proceeds.
Financing and Normalized Net Cash Flow
| • | LMC III Securitization: $201.5 million |
| • | Convertible Bond Issuance: $500 million ($66m Greenshoe exercised in Q4 2014) |
| • | Retail-Focused Solar Bonds Launched October 2014 |
| • | Undeployed Tax Equity Financing Capacity: 150 MW (as of November 3, 2014) |
| Every leased system offers long-term revenue and substantial distributable cash flow. But every system also requires a large upfront cash investment. Our strategy is to cover our investing cash outflows with operating and financing cash flows.
On a GAAP basis in Q3 2014, net cash flow (before equity and convertible notes issuances) were ($149 million) in the third quarter of 2014, as net cash used in Operating Activities was ($23 million) and net cash used in Investing Activities was ($389 million), offset in part by net cash provided by Financing Activities (before equity and convertible notes issuances) of $263 million. We also successfully completed the issuance of $500 million in senior convertible notes in the quarter. As of September 30, 2014, cash, cash equivalents, and short-term investments totaled $733 million. |
|
Looking Ahead
Strong execution in the third quarter has provided us with excellent momentum heading into the end of the year. For the fourth quarter of 2014, we expect MW Deployed between 179 MW and 194 MW, an increase of 36% sequentially and 81% year-over-year, at the midpoint. For the full year 2014, we now expect to deploy between 505-520 MW, up 83% year-over-year at the midpoint.
With regard to Q4 2014 GAAP guidance, we expect Operating Lease and Solar Energy Systems Incentive Revenue of $47 million - $52 million as the seasonal decline in solar production from October through the start of winter in December should be offset in large part by a higher base of operating lease MW Deployed. Solar Energy System and Component Sale Revenue is expected to range between $20 million and $24 million.
Operating Lease and Solar Energy Systems Incentive Gross Margin is expected to range between 35%-40% (or 45%-50% excluding the impact of approximately $5 million in amortization of intangibles). Driven largely by an increase in sales headcount, we expect Operating Expenses of $118 million - $128 million (including between $22 million and $28 million in non-cash amortization of intangibles and stock compensation expense). In turn, Non-GAAP EPS (before Income (Loss) Attributable to Noncontrolling Interests and Redeemable Noncontrolling Interests)* is expected to range between ($1.25) – ($1.35).

Looking further ahead, based on greater confidence in our run rate and backlog heading into next year, we are increasing the low-end our 2015 guidance and now expect MW Deployed of 920 MW – 1.0 GW. Assuming the midpoint of our guidance, we will have accumulated over 2 GW Deployed at the end of 2015 generating energy at a run rate of approximately 2.8 TWh per year.
Even with this tremendous growth, we will be barely scratching the surface of the addressable market. The U.S. consumes over 4,000 TWh per year, suggesting that our 2015 output would represent less than 0.1% of our country’s total electricity demand. Throughout the last few years, we have made tremendous progress towards our goal to make distributed solar a plurality of electricity generation, but much of the heavy lifting is still ahead of us. We thank all of our customers, advocates and shareholders for their support along this journey, and we look forward to achieving our goal together in the years ahead.

|

| |||
| Lyndon Rive, CEO |
Brad Buss, CFO |
* Non-GAAP Earnings per Share [EPS] Before Noncontrolling Interests
While GAAP EPS is based upon net income (loss) attributable to common stockholders, we also report non-GAAP EPS based upon net income (loss). The only difference between GAAP EPS and non-GAAP EPS is the sole line item net income (loss) attributable to non-controlling interests and redeemable noncontrolling interests.
Under GAAP accounting, we report net income (loss) attributable to noncontrolling interests and redeemable noncontrolling interests to reflect our joint venture fund investors’ allocable share in the results of these joint venture financing funds. Income (loss) attributable to noncontrolling interests and redeemable noncontrolling interests is calculated based primarily on the hypothetical liquidation at book value, or HLBV method, which assumes that the joint venture funds are liquidated at the reporting date, even though liquidation may or may not ever occur. Additionally the returns that will be allocated to the investors over the expected terms of the funds may differ significantly from the amounts calculated under the HLBV method. Accordingly, we also report non-GAAP EPS based on earnings before net income (loss) attributable to noncontrolling interests and redeemable noncontrolling interests per share, which we view as a better measure of our operating performance.
According to this definition, non-GAAP earnings before noncontrolling interests and redeemable noncontrolling interests per share was ($0.75).
See below for a reconciliation of GAAP EPS to non-GAAP EPS.
Earnings Conference Call
We will hold a conference call today at 4:30 pm Eastern to discuss our third quarter 2014 financial results and outlook for fourth quarter 2014 and beyond. A live webcast of the call may be accessed over the Internet at the “Events and Presentations” link of the Investor Relations section of our website at http://investors.solarcity.com/events.cfm.
Participants should follow the instructions provided on the website to download and install the necessary audio applications in advance of the call. In addition, the earnings presentation slides will be available on our Investor Relations site by 4:30 pm Eastern. The conference call can be accessed live over the phone by dialing 1-877-407-0784, or for international callers, 1-201-689-8560. A replay will be available two hours after the call and can be accessed by dialing 1-877-870-5176, or for international callers, 1-858-384-5517. The passcode is 13593802. The replay will be available until November 12, 2014.
About SolarCity
SolarCity® (Nasdaq:SCTY) provides clean energy. We are disrupting the century-old energy industry by providing renewable electricity directly to homeowners, businesses and government organizations for less than they spend on utility bills. SolarCity gives customers control of their energy costs to protect them from rising rates. The company makes solar energy easy by taking care of everything from design and permitting to monitoring and maintenance. SolarCity currently serves 15 states and signs up a new customer every minute of the work day. Visit the company online at www.solarcity.com and follow the company on Facebook & Twitter.
Forward Looking Statements
This shareholder letter contains forward-looking statements that involve risks and uncertainties, including statements regarding SolarCity’s customer and market growth opportunities; financial strategies for cash generation and increasing shareholder value; the deployment of megawatts including estimated Q4 2014 and full-year 2015 megawatt deployment; GAAP revenue, gross margin, operating expenses and non-GAAP EPS for Q4 2014; estimated nominal contracted payments remaining; forecasted retained value of energy contracts; cost goals by 2017; the amount of megawatts that can be deployed based on committed available financing; expected future GAAP and non-GAAP operating results; and assumptions relating to the foregoing.
Forward-looking statements should not be read as a guarantee of future performance or results, and will not necessarily be accurate indications of the times at, or by, which such performance or results will be achieved, if at all. Forward-looking statements are subject to risks and uncertainties that could cause actual performance or results to differ materially from those expressed in or suggested by the forward-looking statements. As of the date hereof, we have bookings and financing for only a portion of the orders needed to achieve our megawatt projections and therefore expect the megawatts we need to deploy to meet our projections to be sourced substantially from new deployments of solar systems not currently under contract. In order to meet our projections, we will need to expand our workforce, increase our installation efficiency and exceed our existing bookings rate relative to what we have achieved to date. Additional key risks and uncertainties include the level of demand for our solar energy systems, the availability of a sufficient, timely, and cost-effective supply of solar panels and balance of system components, our ability to successfully integrate Silevo, Inc.’s business, operations and personnel and achieve manufacturing economies of scale and associated cost reductions, our expectations regarding the Riverbend agreement and the development and construction of the Riverbend facility, including expected capital and operating expenses and the performance of our manufacturing operations; the effects of future tariffs and other trade barriers, changes in federal tax treatment, the effect of electric utility industry regulations, net metering and related policies, the availability and amount of rebates, tax credits and other financial incentives, the availability and amount of financing from fund investors, the retail price of utility-generated electricity or the availability of alternative energy sources, risks associated with SolarCity’s rapid growth, the success of our product development efforts and customer preferences, risks that consumers who have executed energy contracts included in reported nominal contracted payments remaining and backlog may seek to cancel those contracts, assumptions as to retained value under energy contracts and contract renewal rates and terms, including applicable net present values, performance-based incentives, and other rebates, credits and expenses, SolarCity’s limited operating history, particularly as a new public company, changes in strategic planning decisions by management or reallocation of internal resources, completion of preparation of financial statements and general market, political, economic and business conditions. You should read the section entitled “Risk Factors” in our most recent Quarterly Report on Form 10-Q and subsequent Current Reports on Form 8-K (including the Current Report filed on September 23, 2014), which have been filed with the Securities and Exchange Commission, which identify certain of these and additional risks and uncertainties. We do not undertake any obligation to publicly update or revise any forward-looking statement, whether as a result of new information, future developments or otherwise, except as otherwise required by law.
SolarCity Corporation
Condensed Consolidated Balance Sheets
| (In Thousands) | December 31, 2013 |
September 30, 2014 |
||||||
| (audited) | (unaudited) | |||||||
| Assets |
||||||||
| Current assets: |
||||||||
| Cash and cash equivalents |
$ | 577,080 | $ | 696,516 | ||||
| Short term investments |
— | 36,943 | ||||||
| Restricted cash |
19,182 | 22,710 | ||||||
| Accounts receivable – net |
23,011 | 22,931 | ||||||
| Rebates receivable – net |
20,131 | 26,313 | ||||||
| Inventories |
111,394 | 185,955 | ||||||
| Deferred income tax asset |
9,845 | 12,096 | ||||||
| Prepaid expenses and other current assets |
27,020 | 46,001 | ||||||
|
|
|
|
|
|||||
| Total current assets |
787,663 | 1,049,465 | ||||||
| Restricted cash |
301 | 607 | ||||||
| Solar energy systems, leased and to be leased – net |
1,682,521 | 2,440,140 | ||||||
| Property and equipment – net |
22,407 | 64,416 | ||||||
| Goodwill and intangible assets – net |
278,169 | 524,314 | ||||||
| Other assets |
38,473 | 70,438 | ||||||
|
|
|
|
|
|||||
| Total assets |
$ | 2,809,534 | $ | 4,149,380 | ||||
|
|
|
|
|
|||||
| Liabilities and equity |
||||||||
| Current liabilities: |
||||||||
| Accounts payable |
$ | 121,556 | $ | 205,980 | ||||
| Distributions payable to noncontrolling interests and redeemable noncontrolling interests |
20,390 | 6,934 | ||||||
| Current portion of deferred U.S. Treasury grants income |
15,340 | 15,330 | ||||||
| Accrued and other current liabilities |
72,157 | 133,657 | ||||||
| Customer deposits |
8,828 | 8,268 | ||||||
| Current portion of deferred revenue |
59,899 | 83,016 | ||||||
| Current portion of long-term debt |
7,422 | 12,099 | ||||||
| Current portion of solar asset-backed notes |
3,155 | 13,462 | ||||||
| Current portion of lease pass-through financing obligation |
29,041 | 30,813 | ||||||
| Current portion of sale-leaseback financing obligation |
418 | 546 | ||||||
|
|
|
|
|
|||||
| Total current liabilities |
338,206 | 510,105 | ||||||
| Deferred revenue, net of current portion |
410,161 | 515,098 | ||||||
| Long-term debt, net of current portion |
238,612 | 263,199 | ||||||
| Convertible senior notes |
230,000 | 730,000 | ||||||
| Solar asset-backed notes, net of current portion |
49,780 | 306,480 | ||||||
| Long-term deferred tax liability |
9,238 | 11,499 | ||||||
| Lease pass-through financing obligation, net of current portion |
64,167 | 58,453 | ||||||
| Sale-leaseback financing obligation, net of current portion |
14,338 | 14,004 | ||||||
| Deferred U.S. Treasury grants income, net of current portion |
412,469 | 401,319 | ||||||
| Other liabilities and deferred credits |
193,439 | 215,119 | ||||||
|
|
|
|
|
|||||
| Total liabilities |
1,960,410 | 3,025,276 | ||||||
| Redeemable noncontrolling interests in subsidiaries |
44,709 | 169,244 | ||||||
| Stockholders’ equity: |
||||||||
| Common stock |
10 | 10 | ||||||
| Additional paid-in capital |
819,914 | 982,701 | ||||||
| Accumulated deficit |
(202,326 | ) | (254,805 | ) | ||||
|
|
|
|
|
|||||
| Total stockholders’ equity |
617,598 | 727,906 | ||||||
| Noncontrolling interests in subsidiaries |
186,817 | 226,954 | ||||||
|
|
|
|
|
|||||
| Total equity |
804,415 | 954,860 | ||||||
|
|
|
|
|
|||||
| Total liabilities and equity |
$ | 2,809,534 | $ | 4,149,380 | ||||
|
|
|
|
|
|||||
SolarCity Corporation
Condensed Consolidated Statements of Operations
| Three Months Ended | ||||||||
| (In Thousands Except per Share Amounts) | September 30, 2013 | September 30, 2014 | ||||||
| (unaudited) | (unaudited) | |||||||
| Revenue: |
||||||||
| Operating leases and solar energy systems incentives |
$ | 24,796 | $ | 52,178 | ||||
| Solar energy systems and components sales |
23,804 | 6,165 | ||||||
|
|
|
|
|
|||||
| Total revenue |
48,600 | 58,343 | ||||||
| Cost of revenue: |
||||||||
| Operating leases and solar energy systems incentives |
8,619 | 25,728 | ||||||
| Solar energy systems and components sales |
26,128 | 6,640 | ||||||
|
|
|
|
|
|||||
| Total cost of revenue |
34,747 | 32,368 | ||||||
|
|
|
|
|
|||||
| Gross profit |
13,853 | 25,975 | ||||||
| Operating expenses: |
||||||||
| Sales and marketing |
24,310 | 56,472 | ||||||
| General and administrative |
21,062 | 39,608 | ||||||
| Research and development |
364 | 4,235 | ||||||
|
|
|
|
|
|||||
| Total operating expenses |
45,736 | 100,315 | ||||||
|
|
|
|
|
|||||
| Loss from operations |
(31,883 | ) | (74,340 | ) | ||||
| Interest expense, net |
5,781 | 16,321 | ||||||
| Other expense, net |
123 | 2,961 | ||||||
|
|
|
|
|
|||||
| Loss before income taxes |
(37,787 | ) | (93,622 | ) | ||||
| Income tax (provision) benefit |
(23 | ) | 23,506 | |||||
|
|
|
|
|
|||||
| Net loss |
(37,810 | ) | (70,116 | ) | ||||
| Net loss attributable to noncontrolling interests and redeemable noncontrolling interests |
(35,707 | ) | (89,352 | ) | ||||
|
|
|
|
|
|||||
| Net (loss) income attributable to stockholders |
$ | (2,103 | ) | $ | 19,236 | |||
|
|
|
|
|
|||||
| Net (loss) income per share attributable to common stockholders: |
||||||||
| Basic |
$ | (0.03 | ) | $ | 0.21 | |||
| Diluted |
$ | (0.03 | ) | $ | 0.19 | |||
| Weighted average shares used to compute net (loss) income per share attributable to common stockholders: |
||||||||
| Basic |
79,918 | 93,324 | ||||||
| Diluted |
79,918 | 99,380 | ||||||
SolarCity Corporation
Condensed Consolidated Statements of Cash Flows
| Three Months Ended September 30, |
Three Months Ended September 30, |
|||||||
| (In Thousands) | 2013 | 2014 | ||||||
| (unaudited) | (unaudited) | |||||||
| Operating activities: |
||||||||
| Net loss |
$ | (37,810 | ) | $ | (70,116 | ) | ||
| Adjustments to reconcile net loss to net cash provided by (used in) operating activities: |
||||||||
| Loss on disposal of property and equipment and construction in progress |
12 | — | ||||||
| Depreciation and amortization net of amortization of deferred U.S. Treasury grant income |
10,047 | 26,620 | ||||||
| Interest on lease pass-through financing obligation |
3,166 | 2,885 | ||||||
| Non cash interest on investment in notes receivable |
— | (85 | ) | |||||
| Stock-based compensation, net of amounts capitalized |
5,848 | 16,769 | ||||||
| Loss on extinguishment of long-term debt |
— | 1,504 | ||||||
| Deferred income taxes |
6 | (23,703 | ) | |||||
| Reduction in lease pass-through financing obligation |
(11,286 | ) | (13,366 | ) | ||||
| Changes in operating assets and liabilities: |
||||||||
| Restricted cash |
3,045 | 1,044 | ||||||
| Accounts receivable |
(8,803 | ) | (21 | ) | ||||
| Rebates receivable |
1,077 | (1,494 | ) | |||||
| Inventories |
(22,401 | ) | (33,827 | ) | ||||
| Prepaid expenses and other current assets |
(4,732 | ) | 1,546 | |||||
| Other assets |
(1,221 | ) | (6,891 | ) | ||||
| Accounts payable |
56,120 | 60,362 | ||||||
| Accrued and other liabilities |
35,230 | (9,771 | ) | |||||
| Customer deposits |
1,390 | 1,101 | ||||||
| Deferred revenue |
63,828 | 24,905 | ||||||
|
|
|
|
|
|||||
| Net cash provided by (used in) operating activities |
93,516 | (22,538 | ) | |||||
| Investing activities: |
||||||||
| Payments for the cost of solar energy systems, leased and to be leased |
(204,951 | ) | (343,417 | ) | ||||
| Purchase of property and equipment |
(1,934 | ) | (5,810 | ) | ||||
| Investment in promissory notes receivable and other advances |
— | (4,750 | ) | |||||
| Acquisition of business, net of cash acquired |
(3,758 | ) | 1,874 | |||||
| Purchases of short term investments |
— | (46,543 | ) | |||||
| Proceeds from sales of short term investments |
— | 9,600 | ||||||
|
|
|
|
|
|||||
| Net cash used in investing activities |
(210,643 | ) | (389,046 | ) | ||||
| Financing activities: |
||||||||
| Investment fund financings, bank, and other borrowings: |
||||||||
| Borrowings under long-term debt |
22,697 | 57,155 | ||||||
| Repayments of long-term debt |
(6,074 | ) | (194,437 | ) | ||||
| Proceeds from issuance of solar asset-backed notes |
— | 196,116 | ||||||
| Repayments of borrowings under solar asset-backed notes |
— | (1,775 | ) | |||||
| Repayments of sale-leaseback financing obligation |
(99 | ) | — | |||||
| Proceeds from lease pass-through financing obligation |
10,641 | 11,123 | ||||||
| Repayment of capital lease obligations |
(382 | ) | (771 | ) | ||||
| Proceeds from investment by noncontrolling interests and redeemable noncontrolling interests in subsidiaries |
75,104 | 211,965 | ||||||
| Distributions paid to noncontrolling interests and redeemable noncontrolling interests in subsidiaries |
(40,781 | ) | (16,721 | ) | ||||
| Proceeds from (refunds of) U.S. Treasury grants |
25,332 | (18 | ) | |||||
|
|
|
|
|
|||||
| Net cash provided by financing activities before equity and convertible notes issuances |
86,438 | 262,637 | ||||||
| Equity and convertible notes issuances: |
||||||||
| Proceeds from issuance of convertible notes |
— | 488,713 | ||||||
| Purchased of capped call options |
— | (57,600 | ) | |||||
| Proceeds from exercise of stock options |
4,069 | 9,089 | ||||||
|
|
|
|
|
|||||
| Net cash provided by equity and convertible notes issuances |
4,069 | 440,202 | ||||||
|
|
|
|
|
|||||
| Net cash provided by financing activities |
90,507 | 702,839 | ||||||
|
|
|
|
|
|||||
| Net (decrease) increase in cash and cash equivalents |
(26,620 | ) | 291,255 | |||||
| Cash and cash equivalents, beginning of period |
159,606 | 405,261 | ||||||
|
|
|
|
|
|||||
| Cash and cash equivalents, end of period |
$ | 132,986 | $ | 696,516 | ||||
|
|
|
|
|
|||||
Operating Activity Metrics:
| Q3 2013 | Q2 2014 | Q3 2014 | Cumulative | |||||||||||||
| MW Booked |
91 | 218 | 230 | |||||||||||||
| MW Deployed |
78 | 107 | 137 | 894 | ||||||||||||
| Customers |
12,386 | 30,372 | 27,305 | 168,339 | ||||||||||||
| Energy Contracts |
12,339 | 28,324 | 27,116 | 156,049 | ||||||||||||
| Estimated Nominal Contracted Payments Remaining - $m |
$ | 4,116 | ||||||||||||||
Stock-Based Compensation Expense:
| Three Months Ended Sept. 30 |
Nine Months Ended Sept. 30 |
|||||||||||||||
| in thousands |
2013 | 2014 | 2013 | 2014 | ||||||||||||
| Cost of Revenue |
$ | 264 | $ | 302 | $ | 826 | $ | 1,765 | ||||||||
| Sales and Marketing |
$ | 1,275 | $ | 3,968 | $ | 2,578 | $ | 10,929 | ||||||||
| General and Administrative |
$ | 4,067 | $ | 10,725 | $ | 9,813 | $ | 29,919 | ||||||||
| Research and Development |
$ | 114 | $ | 1,756 | $ | 183 | $ | 3,047 | ||||||||
Reconciliation from GAAP EPS to Non-GAAP EPS:
| in thousands except per share |
GAAP Net Income Attributable to Stockholders |
GAAP Net Loss Attributable to Noncontrolling Interests |
Non-GAAP Net Loss | |||||||||
| Net Income (loss) |
$ | 19,236 | ($ | 89,352 | ) | ($ | 70,116 | ) | ||||
| / Weighted Average Common Shares Outstanding |
99,380 | 93,324 | 93,324 | |||||||||
|
|
|
|
|
|
|
|||||||
| = Net Loss Per Share |
$ | 0.19 | ($ | 0.96 | ) | ($ | 0.75 | ) | ||||
|
|
|
|
|
|
|
|||||||
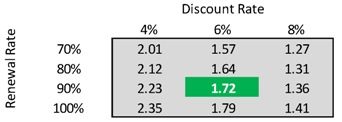
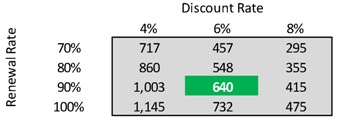
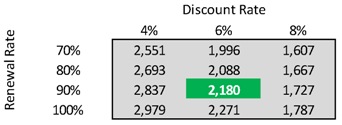
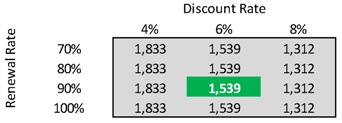
Retained Value Sensitivities:
The following tables provide quantitative sensitivity analyses of our estimates of Retained Value Under Energy Contract, Retained Value Renewal, Retained Value, and Retained Value per Watt as of September 30, 2014 on our and alternate assumptions.
| Retained Value Forecast ($M) | Retained Value Forecast ($/Watt) | |
|
|
| |
| Retained Value Under Contract ($M) | Retained Value of Renewal ($/Watt) | |
|
|
| |
Definitions:
“MW” or “megawatts” represents the DC nameplate megawatt production capacity.
“Backlog” represents the aggregate megawatt capacity of solar energy systems not yet deployed as of the date specified pursuant to Energy Contracts and contracts for solar energy system direct sales executed as of such date.
“Customers” includes all residential, commercial and government buildings where we have installed or contracted to install a solar energy system, or performed or contracted to perform an energy efficiency evaluation or other energy efficiency services.
“Energy Contracts” includes all residential, commercial and government leases and power purchase agreements and consumer loan agreements pursuant to which consumers use or will use energy generated by a solar energy system that we have installed or contracted to install. For landlord-tenant structures in which we contract with the landlord or development company, we include each residence as an individual contract. For commercial customers with multiple locations, each location is deemed a contract if we maintain a separate contract for that location.
“MW Booked” represents the aggregate megawatt production capacity of solar energy systems pursuant to customer contracts signed (with no contingencies remaining) during the applicable period net of cancellations during the applicable period. This metric includes solar energy systems booked under Energy Contracts as well as solar energy system direct sales.
“MW Deployed” represents the megawatt production capacity of solar energy systems that have had all required building department inspections completed during the applicable period. This metric includes solar energy systems deployed under Energy Contracts as well as for solar energy system direct sales.
“Nominal Contracted Payments Remaining” represents our estimate of the sum of cash payments that are customers are obligated to pay us under our Energy Contracts over the remaining term of such contracts. This metric includes Energy Contracts for solar energy systems deployed and in Backlog. As an example, if a customer is 2 years into her 20 year contract, then 18 years of contract payments remain. As an additional example, if a customer chose to pre-pay her Energy Contract, then it is included in estimated Nominal Contracted Payments Remaining only while it is in Backlog as the pre-payment has not been received. Payments for direct sales are not included.
“Retained Value” forecast represents the sum of both “Retained Value under Energy Contract” and “Retained Value Renewal.” Retained Value under Energy Contract represents our estimate of the forecasted net present value at a discount rate of 6% of Nominal Contracted Payments Remaining and estimated performance-based incentives allocated to us, net of amounts we are obligated to distribute to our fund investors, upfront rebates, depreciation, renewable energy certificates, solar renewable energy certificates and estimated operations and maintenance, insurance, administrative and inverter replacement costs, based on contractually agreed amounts as well as historic expenses. This metric includes Energy Contracts for solar energy systems deployed and in Backlog. Retained Value Renewal represents our estimate of the forecasted net present value at a discount rate of 6% of the payments we would receive upon renewal of all Energy Contracts (excluding consumer loan agreements, which have a 30 year term) through a total term of 30 years at a rate equal to 90% of the contractual rate in effect at expiration of the initial term, net of estimated operations and maintenance, insurance, administrative and inverter replacement costs, based on contractually agreed amounts as well as historic expenses. This metric includes Energy Contracts (excluding consumer loan agreements) for solar energy systems deployed and in Backlog. We assume renewal due to both (1) a higher life expectancy of the equipment used in our solar energy systems (typically 30 years or more) vs. a contract term (typically 20 years) and (2) our assumption utility retail rates continue to increase at their historic pace and our expectation that the price of our energy contracts will continue to represent an economic incentive for our customers to renew their contracts.
“Retained Value per Watt” is computed by dividing cumulative retained value as of such date by the sum of total MWs deployed under Energy Contracts as of such date plus MWs booked under Energy Contracts as of such date but not yet deployed.
“Undeployed Tax Equity Financing Capacity” represents a forecast of the amount of MW that can be deployed based on committed available tax equity financing for Energy Contracts.
| Investor Contact | ||
| Aaron Chew | ||
| investors@solarcity.com | ||
| 650-963-5920 |