Attached files
| file | filename |
|---|---|
| 8-K - 8-K - KINDRED HEALTHCARE, INC | d817701d8k.htm |
| EX-99.2 - EX-99.2 - KINDRED HEALTHCARE, INC | d817701dex992.htm |
| EX-99.1 - EX-99.1 - KINDRED HEALTHCARE, INC | d817701dex991.htm |
 Kindred
Healthcare Third Quarter Investor Update
November 6, 2014
Exhibit 99.3 |
 Forward-Looking Statements
2
This presentation includes forward-looking statements within the meaning of Section 27A of
the Securities Act of 1933, as amended, and Section 21E of the Securities Exchange Act of 1934, as amended.
These forward-looking statements include, but are not limited to, statements regarding the
proposed business combination transaction between Kindred Healthcare, Inc. (“Kindred” or the “Company”)
and Gentiva Health Services, Inc. (“Gentiva”) (NASDAQ:GTIV) (including financing of
the proposed transaction and the benefits, results, effects and timing of a transaction), all statements regarding
Kindred’s (and Kindred’s and Gentiva’s combined) expected future financial
position, results of operations, cash flows, dividends, financing plans, business strategy, budgets, capital expenditures,
competitive positions, growth opportunities, plans and objectives of management, and
statements containing the words such as “anticipate,” “approximate,” “believe,” “plan,” “estimate,” “expect,”
“project,” “could,” “would,” “should,”
“will,” “intend,” “may,” “potential,” “upside,” and other similar expressions. Statements in this presentation concerning the business outlook or future economic
performance, anticipated profitability, revenues, expenses, dividends or other financial
items, and product or services line growth of Kindred (and the combined businesses of Kindred and Gentiva),
together with other statements that are not historical facts, are forward-looking
statements that are estimates reflecting the best judgment of Kindred based upon currently available information.
Such forward-looking statements are inherently uncertain, and stockholders and other
potential investors must recognize that actual results may differ materially from Kindred’s expectations as a result
of a variety of factors, including, without limitation, those discussed below. Such
forward-looking statements are based upon management’s current expectations and include known and unknown risks,
uncertainties and other factors, many of which Kindred is unable to predict or control, that
may cause Kindred’s actual results, performance or plans with respect to Gentiva to differ materially from any
future results, performance or plans expressed or implied by such forward-looking
statements. These statements involve risks, uncertainties and other factors discussed below and detailed from time to
time in Kindred’s filings with the Securities and Exchange Commission (the
“SEC”).
Risks and uncertainties related to the proposed merger include, but are not limited to, the
risk that Gentiva’s stockholders do not approve the merger, potential adverse reactions or changes to business
relationships resulting from the announcement or completion of the merger, uncertainties as to
the timing of the merger, adverse effects on Kindred’s stock price resulting from the announcement or
completion of the merger, competitive responses to the announcement or completion of the
merger, the risk that healthcare regulatory, licensure or other approvals and financing required for the
consummation of the merger are not obtained or are obtained subject to terms and conditions
that are not anticipated, costs and difficulties related to the integration of Gentiva’s businesses and
operations with Kindred’s businesses and operations, the inability to obtain, or delays
in obtaining, cost savings and synergies from the merger, uncertainties as to whether the completion of the merger
or any transaction will have the accretive effect on Kindred’s earnings or cash flows
that it expects, unexpected costs, liabilities, charges or expenses resulting from the merger, litigation relating to the
merger, the inability to retain key personnel, and any changes in general economic and/or
industry-specific conditions.
In addition to the factors set forth above, other factors that may affect Kindred’s
plans, results or stock price are set forth in Kindred’s Annual Report on Form 10-K and in its reports on Forms 10-Q
and 8-K.
Many of these factors are beyond Kindred’s control. Kindred cautions investors that any
forward-looking statements made by Kindred are not guarantees of future performance. Kindred disclaims any
obligation to update any such factors or to announce publicly the results of any revisions to
any of the forward-looking statements to reflect future events or developments. Kindred has
provided information in this presentation to compute certain non-GAAP measurements for specified periods. A reconciliation of the non-GAAP measurements to the GAAP measurements is
included in this presentation and on Kindred’s website at
www.kindredhealthcare.com under the heading “investors.”
Additional
Information
This presentation does not constitute an offer to sell or the solicitation of an offer to buy
any securities or a solicitation of any vote or approval. This communication may be deemed to be solicitation
material in respect of the proposed merger between Kindred and Gentiva. In connection
with the proposed merger, Kindred intends to file a registration statement on Form S-4, containing a proxy
statement/prospectus, with the SEC. SHAREHOLDERS OF GENTIVA ARE URGED TO READ ALL
RELEVANT DOCUMENTS FILED WITH THE SEC, INCLUDING THE PROXY STATEMENT/PROSPECTUS, BECAUSE
THEY WILL CONTAIN IMPORTANT INFORMATION ABOUT THE PROPOSED MERGER. Investors and
security holders will be able to obtain copies of the proxy statement/prospectus as well as other filings
containing information about Kindred and Gentiva, without charge, at the SEC’s website, www.sec.gov. Those documents, when filed, as well as Kindred’s other public filings with the SEC, may be
obtained without charge at Kindred’s website at
www.kindredhealthcare.com. Participants in Solicitation
Kindred and its directors and executive officers, and Gentiva and its directors and executive
officers, may be deemed to be participants in the solicitation of proxies from the holders of Gentiva common
stock in respect of the proposed merger. Information about the directors and executive
officers of Kindred is set forth in the proxy statement for Kindred’s 2014 Annual Meeting of Shareholders, which
was filed with the SEC on April 3, 2014. Information about the directors and executive
officers of Gentiva is set forth in the proxy statement for Gentiva’s 2014 Annual Meeting of Shareholders, which was
filed with the SEC on March 25, 2014. Investors may obtain additional information regarding
the interest of such participants by reading the proxy statement/prospectus regarding the proposed merger
when it becomes available. |
 Kindred
Healthcare’s Third Quarter – Achievements and Opportunities
Continued Progress on Employee Engagement, Quality Assurance, Clinical
Outcomes and Patient Satisfaction Measures Across the Enterprise
Strong Third Quarter Results and Reaffirming Confidence in 2014 EPS Guidance
Continued Progress Advancing Integrated Care Market Strategy and
Development of Care Management Capabilities
Commencement of Growth Phase of Strategic Plan
(Repositioning and Recapitalization Complete)
Announced Definitive Agreement to acquire Gentiva, solidifying Kindred’s Position
as the Premier Post-Acute Healthcare Services Provider in the U.S.
3 |
 Third
Quarter
–
Continuing
Operations
(1)
($ millions, except statistics)
•
Key Q3 operating metrics:
Strong revenue and operating income growth, up 6% and 7%, respectively, compared to prior
year Improved operating income and operating margins across all divisions, lower
interest costs and solid cost controls across the organization driving
year-over-year results Hospital same-store volumes up 3% over prior year,
cost Per Patient Day (“PPD”) up less than 1% over prior year
Strong sequential cash flows with core operating cash flows of $95 million and core free cash
flows were $72 million
4
(1)
Before certain disclosed items reconciled in the appendix.
(2)
Prior year EPS of $0.10 is pro forma to include incremental 9.7 million shares issued in the
June 2014 equity offering. Actual core EPS for Q3 ‘13 is $0.12.
Actual
Prior Year
% change
Revenues
$1,243
$1,175
+6%
Operating expenses
1,085
1,027
Core operating income (EBITDAR)
158
148
+7
Margin
12.7%
12.6%
Net income -
core
7
7
+7
Diluted EPS -
core
$0.11
$0.10
(2)
+10
Diluted EPS -
reported
$0.03
($0.31) |
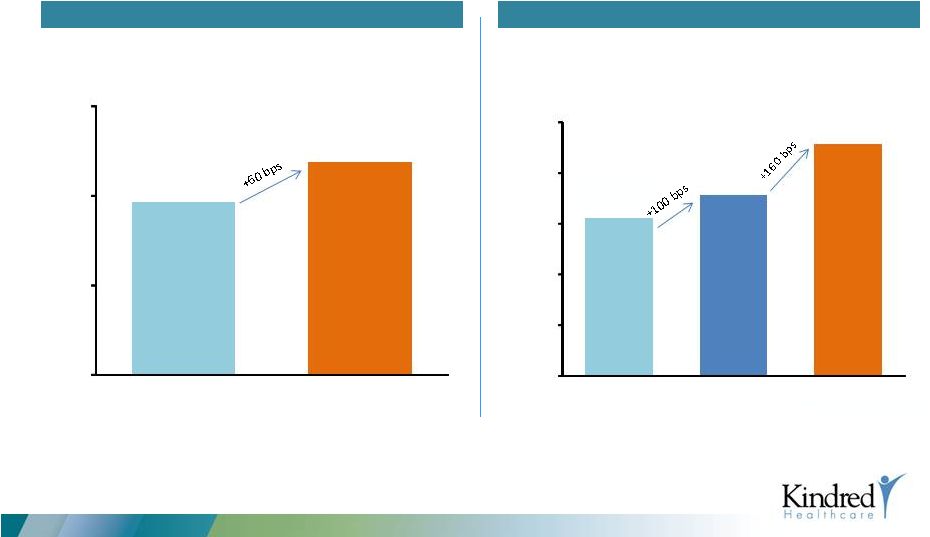
 Core Operating
Margins (1)
Margin Expansion Across Enterprise Reflects Full Recovery from Reimbursement Cuts
5
(1)
Before certain disclosed items reconciled in the Appendix.
3Q13
3Q13
3Q13
3Q13
3Q14
3Q14
3Q14
3Q14
20.0%
11.9%
11.0%
4.0%
20.1%
13.1%
11.7%
8.2%
0.0%
5.0%
10.0%
15.0%
20.0%
25.0%
Hospitals
Nursing Centers
RehabCare
Kindred at Home |
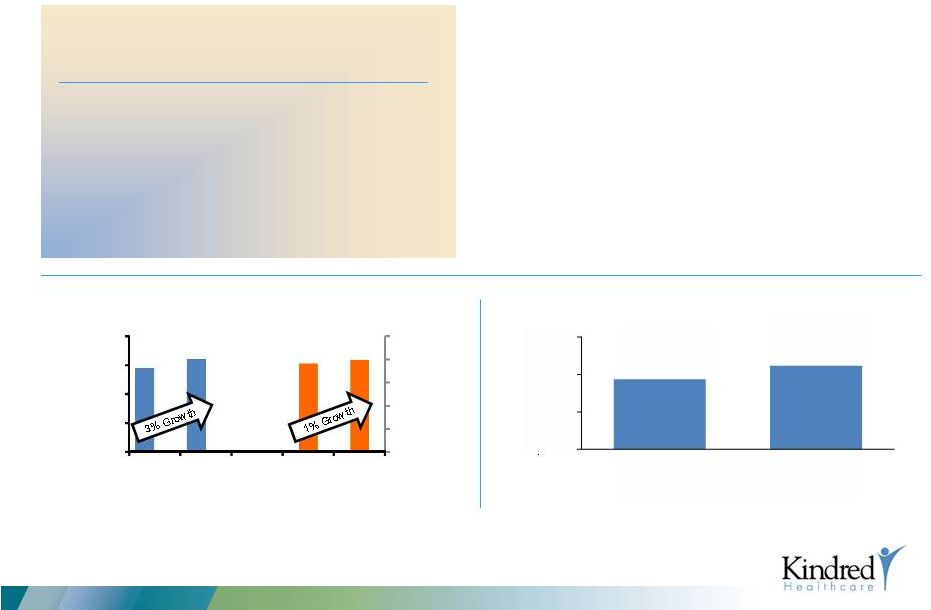 $595
$609
$1,628
$1,642
$1,250
$1,350
$1,450
$1,550
$1,650
$1,750
$450
$500
$550
$600
$650
Q3 '13
Q3 '14
Q3 '13
Q3 '14
Hospital Division
$2.5 billion Revenues
(1)
$527 million Operating Income
(2)
Transitional Care Hospitals (certified as LTAC hospitals)
•
97
Transitional
Care
Hospitals
(3)
•
7,145
licensed
beds
(3)
Inpatient Rehabilitation Hospitals (IRFs)
•
5 IRFs
(3)
•
215 licensed beds
(3)
(1)
Revenues for the twelve months ended September 30, 2014 (divisional revenues before
intercompany eliminations). (2)
Operating income for the twelve months ended September 30, 2014.
(3)
As of September 30, 2014.
(4)
Before certain disclosed items reconciled in the Appendix.
•
Continued clinical success with low rates of
rehospitalizations, reduced employee
turnover and a strong online reputation
•
Strong results with same-store admissions
increase of 3% and less than 1% growth in
core operating costs per patient day
•
Strong operating income margin of 20.1%
(4)
6
Q3 Revenue
Revenue
($ millions)
Per Patient Day Revenues
Q3 Operating Income
(4)
($ millions)
$119
$122
$100
$110
$120
$130
Q3 '13
Q3 '14 |
 •
2,264 sites of service served through
20,338 therapists
(3)
•
Including 102 hospital-based acute
rehabilitation units
(3)
•
RehabCare continues to deliver outstanding clinical
results and improved patient functional
improvement across sites of service
•
Year-over-year core operating income and margin
improvements
•
Added 90 net new skilled nursing rehabilitation
sites YTD through Q3 2014
$1.3 billion Revenues
(1)
$146 million Operating Income
(2)
(1)
Revenues for the twelve months ended September 30, 2014 (divisional revenues before
intercompany eliminations). (2)
Operating income for the twelve months ended September 30, 2014.
(3)
As of September 30, 2014.
7
Total Sites of Service
Productivity
2,139
2,264
0
600
1,200
1,800
2,400
2011
Q3 2014
80.4%
79.6%
0.0%
30.0%
60.0%
90.0%
2011
Q3 2014 |
 Nursing Center
Division •
48 Transitional Care
Centers
(Sub-Acute
facilities
licensed
as
SNFs)
(3)
•
13 Nursing and Rehabilitation Centers
(with
Transitional
Care
Units)
(3)
•
12 Hospital-Based Sub-Acute Units
(3)
•
38
Skilled
Nursing
Centers
(Traditional
SNFs)
(3)
•
Strong operations with low nursing turnover
and improved performance on CMS 5-Star
Program
•
Nursing center division core operating
income increased 16%
(4)
primarily due to
growth in revenues
•
Operating margins significantly improved due
to increased reimbursement rates, ongoing
repositioning and cost control initiatives
•
Admissions up 4% compared to prior year
•
Declines in average length of stay (ALOS)
continue to weigh on average daily census
(ADC)
$1.1 billion Revenues
(1)
$147 million Operating Income
(2)
(1)
Revenues for the twelve months ended September 30, 2014 (divisional revenues before
intercompany eliminations). (2)
Operating income for the twelve months ended September 30, 2014.
(3)
As of September 30, 2014.
(4)
Before certain disclosed items reconciled in the Appendix.
8
Nursing
Center
Operating
Income
Margin
(4)
11.9%
13.2%
13.8%
14.3%
13.1%
10.0%
12.0%
14.0%
16.0%
Q3 2013
Q4 2013
Q1 2014
Q2 2014
Q3 2014 |
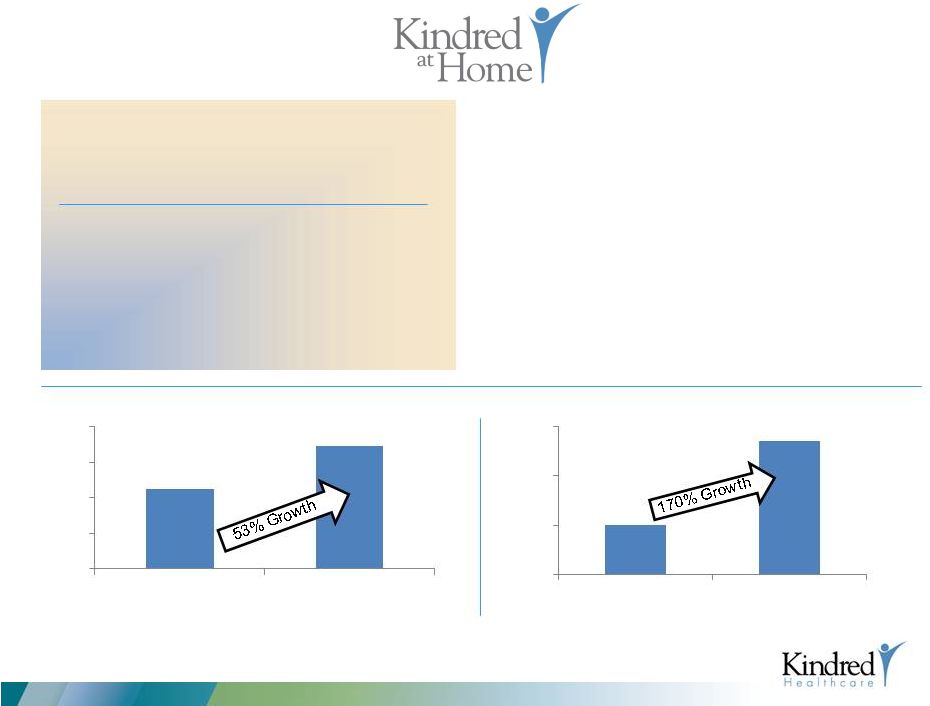 •
High rates of patient satisfaction for Home Health and
Hospice with nearly 50% of all home health locations
named to HomeCare Elite as top 25% of the nation’s
home health agencies
•
Kindred at Home division delivered 60% revenue growth
in the third quarter of 2014 and more than tripled core
operating income compared to prior year quarter
•
Focus on integration efforts has improved margin from
4.0%
(3)
in
Q3
2013
to
8.2%
(3)
in
Q3
2014
•
Combination with Gentiva creates largest home health
and hospice system in the U.S.
9
•
201
sites
of
service
in
13
states
(2)
•
4,900
caregivers
serving
17,300
patients
on
a daily basis
(2)
(1)
Annualized based upon revenues (before intercompany eliminations) and operating income for the
three months ended September 30, 2014. (2)
As of September 30, 2014.
(3)
Before certain disclosed items reconciled in the Appendix.
(4)
Operating income for the twelve months ended December 31, 2013.
Revenue
($ millions)
Operating Income
($ millions)
$345 million Revenues
(1)
$27 million Operating Income
(1)
(1)
(1)
(4)
$225
$345
$0
$100
$200
$300
$400
2013
2014
$10
$27
$0
$10
$20
$30
2013
2014 |
 Kindred and
Gentiva A Compelling Opportunity for
American Healthcare and Shareholders
10 |
 Combination
Creates One of the Nation’s Premier Healthcare Services Providers
11
Leadership Among Premium Healthcare Service Providers
2014 Wall Street
Consensus Revenue
($ in billions)
Pro Forma
Post-Acute Providers
Alternate Site Providers
(4)
$7.1
$5.5
$3.8
$3.1
$2.4
$6.4
$12.7
$4.4
IPCM
DVA
EVHC
AMSG
SCAI
The acquisition of Gentiva further strengthens Kindred’s ability to serve
patients across the full continuum of care
($ in millions)
Kindred
Gentiva
Pro Forma
States
(1)
47
40
47
Locations
(1)
2,376
493
2,869
Employees
(1)
62,600
46,600
109,200
Revenue Guidance/Consensus
$5.1 billion
(2)
$2.0 billion
(2)
$7.1 billion
Patients Per Year
(3)
535,000
550,000
1,085,000
$1.2
$2.7
$1.6
(1)
As of September 30, 2014.
(2)
Per Kindred 2014 guidance as provided on November 5, 2014 and 2014 current average analyst
consensus estimates for Gentiva. (3)
Internal company data.
(4)
Twelve months ended (LTM) as of June 30, 2014 and pro forma for Skilled Healthcare
merger. (2) |
 Revenues
(1)
$345 MM
Total States
(3)
13
Average Daily Census
(4)
17,300
Total Sites of Service
(3)
201
Home Health
141
Hospice
38
Personal Care
22
Total Caregivers
(3)
4,900
Revenues
(2)
$2.0 B
Total States
(3)
40
Average
Daily
Census
(4)
110,000
Total Sites of Service
(3)
493
Home Health
294
Hospice
165
Community Care
34
Total Caregivers
(3)
40,500
Revenues
(1) (2)
$2.3 B
Total States
41
Average Daily Census
127,300
Total Sites of Service
694
Home Health
435
Hospice
203
Community Care
56
Total Caregivers
45,400
Kindred at Home
Pro Forma Company
Combination creates
largest home health and
hospice system in the
United States
Gentiva
Kindred at Home
12
(1)
Annualized based upon revenues for the three months ended September 30, 2014 (divisional
revenues before intercompany eliminations). (2)
Current average analyst consensus estimate for 2014.
(3)
As of September 30, 2014.
(4)
Internal company data for Kindred and investor presentation for Gentiva.
Gentiva |
 Gentiva
Integration Management Office Integration Operating Principles
Integration Operating Principles
Prevent disruption to patient care
Prevent harm to target revenue
streams
Retain key talent
Meet all reporting obligations
Ensure Day 1 Readiness
Achieve synergies
INPUTS
IMO steering committee
feedback
Future state objectives
Integration red flags /
anticipated
complexities
(1)
Lessons learned from previous
Kindred IMO
(1) As identified during due diligence.
13 |
 Defining Day 1 Readiness
Day one readiness focuses on the details necessary to bring business functions
and processes into alignment at closing.
Focus Areas for Day 1 Readiness / Controls:
-
Payroll Continuity
-
Stability of revenue cycle functions:
-
Accounts receivable
-
Accounts payable
-
Financial Reporting (i.e. financial suite & systems)
-
Synergy Capture
-
Validated synergy
-
Identified initiatives for realizations
-
Developed execution plans for realization
To be completed
Assessment of
controls
Assessment of
systems
Consolidation
plan complete
Ready for Day 1
execution
Gentiva Integration Management Office
Defining Day One Readiness
14 |
 Synergy
Initiative Development
Chris Consalus
Day 1 Readiness
and Transitional
Operating Models
Employee Retention
Functional integration workstreams
IT
People Services
Finance &
Procurement
Compliance &
Legal
Operations
Sales
Applications
Networks
Hosting
Charlie Wardrip /
Russ McDonough
Payroll
Organization
Structure
Benefits & Comp
Selection
Process
Jeff Jasnoff /
Ed Reisz
Accounting
Tax & Treasury
Financial
Reporting
Internal Audit
Purchasing
Mark Laemmle /
Todd Flowers /
Eric Slusser
Legal & Regulatory
Risk Mgt &
Compliance
External Affairs
Records Retention
Kelly Priegnitz /
Joe Landenwich
/ Suzanne
Riedman / John
Camperlengo
Care Mgt
Home Health
Reimbursement
Care Mgt
Hospice
Managed Care
Facilities
Jon Rousseau /
Todd Higgins /
Susan Sender /
David Causby
Identify Overlaps
Plan Organization
Structure
Plan sales force
rationalization
David Mikula /
Dean Johnson
Plans for Revenue
Synergies
Cross-functional
integration
workstreams
Integration team structure
Executive Sponsorship
Steve Cunanan, Scott Blanchette
IMO
Mark
Douglas
Gentiva
IMO
(support):
Janet
Nicoll
KPMG
Kindred / GTIV Advisory Team:
Operations –
Jon Rousseau / David
Causby Corporate Development
–
Doug Curnutte
Finance
–
Todd Higgins / Eric
Slusser Benefits & Compensation
–
Andrea Romisher
IS/IT
–
Vance Collins
Communications
–
Susan Moss / Paula
Shoemaker We
Have
Assembled
Functional
Teams,
as
Well
as
Teams
That
Will
Help
Us
Work
On
Key
Cross-Functional
Integration
Priorities
Communication &
Change
Management
Gentiva’s functional
IMO leader indicated
in orange font
Gentiva Integration Management Office
Integration Team Structure
15
IMO Lead: |
 Transaction
Summary Purchase Price
•
$19.50 / share comprising $14.50 in cash and 0.257 shares of Kindred common stock
•
$1.8 billion total consideration, including assumption of net debt
Financial Profile
•
Pro Forma combined company revenues of approximately $7.1 billion and Operating Income or
EBITDAR
(1)
of $1.0 billion
•
Combination will enhance Kindred’s Revenue and Margin Growth Profile
Accretion
•
Immediately and significantly accretive to Kindred’s Earnings and Operating Cash Flows
(exclusive of transaction and integration costs)
Synergies
•
$70 million in expected cost synergies within two years with approximately $35 million
expected in first full year following the closing
(2)
•
Revenue synergies of more than $60 million expected over time
(approximately $20 –
$30 million expected in the first full year following the closing)
Financing
•
Fully committed financing from Citi and J.P. Morgan
•
Expect to use a combination of debt, equity and mandatory convertibles to maintain pro forma
Adjusted Debt to EBITDAR leverage
(3)
of approximately 5.5x at closing, assuming half of $70 million
run rate expected cost synergies
Expected Closing
•
Q1 2015
–
Already received Hart-Scott-Rodino clearance
16
Kindred to acquire Gentiva for $1.8 billion in a combination of cash and stock
(1)
EBITDAR, or operating income, is defined as earnings before interest, income taxes,
depreciation, amortization and rent. EBITDAR was computed by combining the mid point of
2014 guidance for Kindred as provided on November 5, 2014 (see enclosed reconciliation)
and 2014 current average analyst consensus estimates for Gentiva. In addition, pro forma EBITDAR includes full
run rate expected cost synergies of $70 million, and estimated annualized rent expense for
Gentiva of $41 million.
(2)
Excludes one-time integration costs. (3)
Pro forma Adjusted Debt to EBITDAR leverage was computed by dividing a numerator
comprised of estimated long-term debt at closing plus pro forma annual rent expense
multiplied by six, less unrestricted cash, by a denominator comprised of pro forma
EBITDAR.
|
 17
Continued Confidence in 2014
Gentiva Performance
(1)
Per Gentiva November 5, 2014 earnings release, see reconciliation in
appendix. (2)
Based upon 2014 current average analyst consensus estimates.
Sustained Improvement in Financial and Operating Performance
Further Validates Our Acquisition Thesis
Q3 Reported
(1)
Confirmed 2014
Guidance
(1)
Consensus Estimates
(mean)
(2)
Revenue
$498.0 million
$1.96 -
2.00 billion
$1.99 billion
Adjusted EBITDA
$48.5 million
$183-195 million
$191 million |
 Combined Company
Overview Confirmed Confidence in Gentiva Performance
Mid Point of 2014 Guidance/Consensus
($ in millions)
Kindred
(1)
Gentiva
(2)
Expected
Synergies
(3)
Pro Forma
Revenue
$5,100
$1,986
$7,086
EBITDAR
697
232
$70
999
EBITDAR Margin
13.7%
11.7%
14.1%
Rent
322
41
363
% of revenue
6.3%
2.1%
5.1%
EBITDA
375
191
70
636
EBITDA Margin
7.4%
9.6%
9.0%
(1)
Based upon the midpoint of earnings guidance for Kindred as of November 5, 2014.
(2)
Based upon 2014 current average analyst consensus estimates. Assumes annualized rent of $41
million. (3)
Estimated full run rate of cost synergies expected to be achieved within two years of
close. Excludes one-time transaction and integration costs. 18
Gentiva’s
announcement of
Q3 results and
confirmed EBITDA
guidance of
$183-195 million
further validates
our acquisition thesis
and diligence. |
 Significant and
Immediate Accretion to Earnings and Cash Flows
19
Acquisition is significantly accretive at the contemplated transaction value and
financing structure on both an EPS and cash flow basis
(exclusive of transaction and integration costs)
(1)
Assumes pro forma share count of 85 million shares reflecting fully diluted shares at end of Q3
2014, share consideration as part of Gentiva transaction and the anticipated equity offering to finance the
transaction. Kindred expects the acquisition to be approximately
$0.40 to $0.60 accretive to pro forma earnings, on a run rate basis, once Gentiva is fully
integrated and expected synergies are fully realized in the second full year following
the closing. (2)
Based upon 2014 net income guidance for Kindred as provided on November 5, 2014 and 2014
current average analyst consensus estimates for Gentiva and adding back depreciation and amortization per
Kindred’s 2014 guidance and adding back depreciation and amortization based upon 2014
current average analyst consensus for Gentiva and annualized stock-based compensation and deferred financing cost
amortization for both Kindred and Gentiva. In addition, expected
full run rate estimated cost synergies, net of income taxes, of
$42 million ($70 million full run rate annual costs and operating synergies less
income taxes of $28 million) are included.
EPS Accretion
(1)
$0.40 –
$0.60
+
Acceleration of cost synergies
+
Increased revenue through clinical
integration
+
Incremental development activity fueled
by combined company cash flows
+
Enhanced managed care and ACO
opportunities from expanded integrated
national platform
Drivers for Potential Upside
Pro Forma Cash Flows ($ millions)
Operating Cash Flows
before dividends, changes
in working capital and
capital expenditures
(2)
$350 –
400
Less: Routine CapEx
$120 –
130
As adjusted
$230 –
270
Fully Integrated Run Rate |
 Key
Highlights •
Expected to issue in aggregate ~$620 –
$720 million of equity to maintain
reasonable leverage
•
Expect to have shares outstanding of
~85 million at close
Financing Plan
20
Sources
($ millions)
New debt financing
$1,300 –
$1,400
New equity and mandatory
convertible securities issued
$200 –
$300
Equity issued to Gentiva
shareholders
~$200
Existing bank revolver draw
~$200
$2,000
Uses
($ millions)
Purchase Gentiva equity
$767
Retire Gentiva debt
~$1,050
Transaction fees & expenses
~$183
$2,000
Aggregate equity financing approximates
purchase price of Gentiva equity
–
Proactively raised $220 million in net
proceeds from June 2014 equity offering
–
Will issue Gentiva shareholders ~$200
million in Kindred stock as part of
purchase consideration
–
Plan to raise ~$200 – $300 million in
equity and / or mandatory convertible
securities between announcement and
close
|
 Wrap-Up
21 |
 15%
Hospital
35%
Nursing
Rehab
18%
(1)
Kindred
revenues
before
intercompany
eliminations
as
reported
in
the
respective
Form
10-K.
(2)
Per Kindred 2014 guidance as provided on November 5, 2014 and 2014 current average analyst
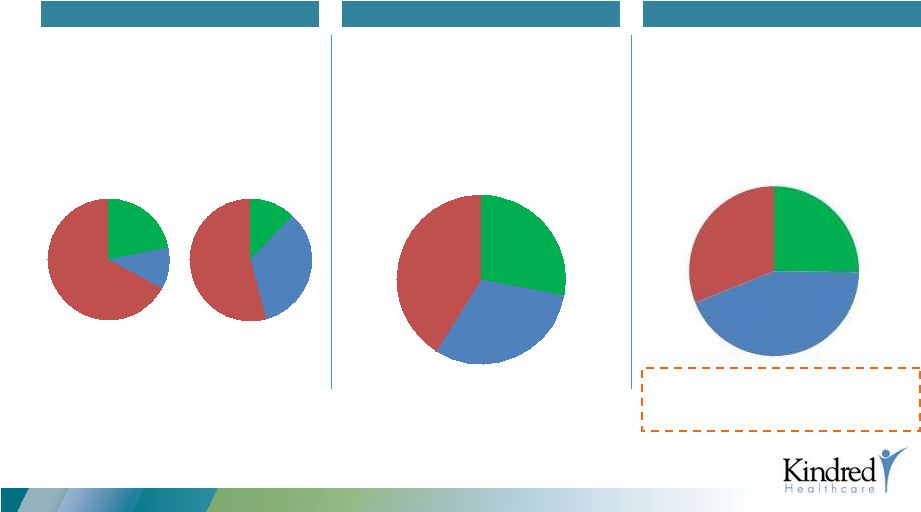
consensus estimates for Gentiva. Kindred has Significantly Diversified its
Service Offerings & Transformed its Business Mix
•
Combination with Gentiva uniquely positions Kindred as one of the leading healthcare providers
in the U.S. across a broad spectrum of critical services
–
Fundamentally different company today that is at the forefront of a changing healthcare
delivery system –
Results in a suite of services better positioned to help patients and drive shareholder
value Yesterday
Today
Tomorrow
•
A focused operator of nursing facilities
and hospitals
–
Diversified post-acute service
offerings through acquisition of
RehabCare
•
Right-sized operational footprint, yielding
a focused approach across key integrated
care markets
–
Negotiation with Ventas to exit
certain assets and sold others
•
Acquisition of Gentiva results in a well-
balanced portfolio of integrated service
offerings
–
Addition of Gentiva accelerates
capabilities to provide population
health and take risk
2010
2012
Kindred at Home 0%
Kindred at Home 2%
LTM 9/30/2014
Kindred at Home 6%
Pro Forma Kindred
(2)
22
Kindred
at Home
32%
Nursing
21%
Hospital
48%
Rehab
25%
Nursing
45%
Hospital
33%
Rehab
20%
Nursing
47%
Hospital
42%
Rehab
11% |
 (1)
Based upon current average analyst Consensus estimates for 2014 and 2015 for both Kindred and
Gentiva, including $60 million of annual run rate revenue synergies. (2)
Before certain disclosed items as reconciled in the appendix.
(3)
Based
upon
mid
point
of
2014
earnings
guidance
for
Kindred
as
of
November
5,
2014.
(4)
Based
upon
mid
point
of
2014
earnings
guidance
for
Kindred
as
of
November
5,
2014
and
based
upon
current
average
analyst
Consensus
estimates
for
Gentiva
(includes EBITDA impact of full run rate of $70 million of expected cost synergies).
Kindred has Successfully Shifted its Business to Faster
Growing Businesses, Improving Margins,
Profitability and Operating Cash Flows
Improves Margin and Profitability
Enhances Growth Profile
2014 –
2015 Revenue Growth
(1)
23
EBITDA Margin
(4)
(2)
(3)
3.9%
4.5%
0.0%
2.0%
4.0%
6.0%
Kindred
Kindred + Gentiva
6.1%
7.4%
9.0%
0.0%
2.0%
4.0%
6.0%
8.0%
10.0%
Kindred 2011
Kindred 2014
Kindred + Gentiva
PF 2014 |
 (1)
Based
upon
mid
point
of
2014
earnings
guidance
for
Kindred
as
of
November
5,
2014.
(2)
Based upon mid point of 2014 current average analyst consensus estimates for Gentiva. Assumes
annualized rent of $41 million. (3)
Leases capitalized using 6x rent, equity represents market cap and funded debt calculated as of
December 31 for 2010 and 2012. (4)
Rent expense for the twelve months ended September 30, 2014 capitalized at 6x, funded debt and
closing share price at September 30, 2014, respectively. (5)
Pro forma values shown as of 12/31/2014 and include $1.6bn of additional debt and $363mm of
annual rent expense based upon mid point of 2014 earnings guidance for
Kindred
as
of
November
5,
2014
and
an
estimate
of
annualized
rent
expense
of
$41
million
for
Gentiva.
Pro
forma
value
based
on
fully
diluted
Kindred
shares
outstanding plus newly issued shares as part of the transaction at Kindred share price of
$21.24 on October 30, 2014. Kindred has Developed a Balanced
and Flexible Capital Structure
•
Increasing traditional debt while deleveraging lease exposure will continue to drive
long-term strategic flexibility and create shareholder value
–
Rent as a percent of revenue declines from 6.3%
(1)
for Kindred today to 5.2%
(1)(2)
Yesterday
(3)
Today
(4)
Tomorrow
(5)
•
RehabCare transaction materially
shifted Kindred’s capital structure,
financed by the issuance of traditional
financial debt
•
Recent negotiations with Ventas further
reduced capitalized leases by greater
than $600 million
•
Q1 refinancing added capacity,
improved terms and Financial Flexibility
•
Gentiva transaction continues to shift
Kindred’s capital structure towards
more traditional debt/equity mix
•
Strong deleveraging profile
Equity
22%
Debt
11%
Cap.
Leases
67%
Equity
12%
Debt
34%
Cap.
Leases
54%
~5.5x net adj leverage at close with goal
to delever below 5.0x over the next
two years
24
2010
2012
As of September 30, 2014
Pro Forma Kindred
Equity
27%
Debt
32%
Cap.
Leases
41%
Equity
25%
Debt
44%
Cap.
Leases
31% |
 Kindred Has
Delivered Attractive Financial Performances
25
Operating Margin
(1)
:
12.7%
14.0%
13.6%
13.7%
Share Price & Dividends
($ millions)
Closing Share Price
Cumulative Dividends
Despite sequential years of significant
reimbursement cuts and a wholesale
restructuring of the Company’s business and
capital structure, the Company has delivered on
its promise to its patients, customers,
teammates and shareholders!
$4.2
$4.9
$4.8
$5.1
$7.1
2011
2012
2013
2014
2014 PF
Revenue
($ billions)
Operating Income
(1)
($ millions)
$11.77
$10.82
$19.74
$21.24
$0.24
$0.60
12/31/2011
12/31/2012
12/31/2013
10/30/2014
14.1%
(1)Before certain disclosed items as reconciled in the Appendix.
(2)Reimbursement cuts totaled $70 million.
(3)Reflects midpoint of Company’s November 5, 2014 earnings guidance.
(4)Assumes Gentiva was acquired on January 1, 2014, and amount for Gentiva is based upon
current analyst consensus estimates.
In
addition,
pro
forma
EBITDAR
includes
full
run
rate
expected
cost
synergies
of
$70
million,
and
estimated
annualized rent expense for Gentiva of $41 million.
(2)
(3)
(3)
(4)
(4)
Kindred and
Gentiva
Kindred and
Gentiva
$529
$679
$658
$697
$999
2011
2012
2013
2014
2014 PF |
 Kindred Is
Helping to Shape the Future of American Healthcare
•
As the U.S. population ages, demand for patient-centered healthcare is growing
rapidly –
and Kindred is pioneering an integrated approach to address this
demand –
implementing a better model to improve clinical outcomes and patient
safety, smooth care transitions and lower costs
•
Kindred’s “Continue
The
Care”
strategy delivers the services that patients need
across the full spectrum of care, from transitional inpatient hospitalization,
to post-acute rehab and skilled nursing services, to home health and hospice care
•
Kindred is growing to implement this strategy and fostering innovation to provide
more patients, in more communities, with high quality, integrated, patient-
centered care in the lowest-cost setting
26
The merger of Kindred and Gentiva accelerates the development of
this integrated approach to
patient care, creating significant value for both companies’
patients,
employees and shareholders |
 Q & A
27
*
*
* |
 Appendix
28
*
*
*
*
*
*
*
*
*
*
* |
 Explanation of
Non-GAAP Measures In addition to the results provided in accordance with GAAP,
Kindred Healthcare, Inc. (the "Company") has provided information in this presentation to
compute certain non-GAAP measurements for the three months ended September 30, 2014 and
2013, the twelve months ended September 30, 2014, December 31, 2013, 2012 and 2011
before certain charges or on a core basis and on a pro forma basis. A reconciliation of the non-GAAP measurements to
the GAAP measurements is included in this presentation.
The Company's earnings presentation also includes financial measures referred to as operating
income, or EBITDAR, and earnings before interest, income taxes, depreciation and
amortization ("EBITDA"). The Company's management uses EBITDAR or EBITDA as meaningful measures of operational performance
in addition to other measures. The Company uses EBITDAR or EBITDA to assess the relative
performance of its operating divisions as well as the employees that
operate
these
businesses.
In
addition,
the
Company
believes
these
measurements
are
important
because
securities
analysts
and
investors
use
these
measurements to compare the Company's performance to other companies in the healthcare
industry. The Company believes that income (loss) from continuing
operations
is
the
most
comparable
GAAP
measure.
Readers
of
the
Company's
financial
information
should
consider
income
(loss)
from
continuing operations as an important measure of the Company's financial performance because
it provides the most complete measure of its performance. EBITDAR or EBITDA should be
considered in addition to, not as a substitute for, or superior to, financial measures based upon GAAP as an
indicator of operating performance. A reconciliation of EBITDAR or EBITDA to income (loss)
from continuing operations provided is included in this presentation.
The
pro
forma
EBITDAR
total
of
$1.0
billion
included
in
this
presentation
includes
a
2014
EBITDAR
estimate
of
$232
million
for
Gentiva,
which
is based upon Gentiva's 2014 current average analyst consensus estimates. In addition, pro
forma EBITDAR includes full run rate expected cost synergies of $70 million from the
transaction. Also in this presentation, the Company provides the financial measure of
free cash flows excluding certain items. The Company recognizes that free cash
flows
excluding
certain
items
is
a
non-GAAP
measurement
and
is
not
intended
to
replace
the
presentation
of
the
Company’s
cash
flows
in
accordance
with
GAAP. The Company believes that this non-GAAP measurement provides important information
to investors related to the amount of discretionary cash flows that are available for
other investing and financing activities. In addition, management uses free cash flows excluding certain items in making
decisions related to acquisitions, development capital expenditures, dividends, long-term
debt repayments and other uses. The Company believes net cash flows provided by
operating activities is the most comparable GAAP measure. Readers of the Company’s financial information should consider net cash
flows provided by operating activities as an important measure of the Company’s financial
performance because it provides the most complete measure of its performance.
Free cash flows excluding certain items should be considered in addition to, not as a
substitute for, or superior to, financial measures based
upon
GAAP
as
an
indicator
of
operating
performance.
A
reconciliation
of
net
cash
flows
provided
by
operating
activities
to
free
cash
flows
excluding
certain items is included in this presentation.
29 |
 Reconciliation
of Earnings Guidance (a)
Continuing Operations
($ Millions, except per chare amounts)
30
As of November 5, 2014
Low
High
Revenues
5,100
$
5,100
$
Operating income (EBITDAR)
692
$
702
$
Rent
322
322
EBITDA
370
380
Depreciation and amortization
157
157
Interest, net
92
92
Income from continuing operations before income taxes
121
131
Provision for income taxes
44
48
Income from continuing operations
77
83
Earnings attributable to noncontrolling interests
(18)
(18)
Income from continuing operations attributable to the Company
59
65
Allocation to participating unvested restricted stockholders
(2)
(2)
Available to common stockholders
57
$
63
$
Earnings per diluted share
0.98
$
1.08
$
Shares used in computing earnings per diluted share
58.3
58.3
As of November 5, 2014
Various non-cash expenses included in earnings guidance above:
Low
High
Amortization of stock-based compensation
13
$
13
$
Amortization of deferred financing fees
8
8
Straight-line rent expense
9
9
(a)
The earnings guidance excludes the effect of reimbursement changes, debt refinancing costs,
severance, retirement, retention and restructuring costs, customer bankruptcy costs,
litigation costs, transaction costs, any further acquisitions or divestitures, any
impairment charges, any further issuances of common stock, debt or mandatory
convertible equity securities in conjunction with the Gentiva transaction and any
repurchases of common stock. |
 Reconciliation
of Non-GAAP Measures 31
($ Thousands)
Three months ended
September 30,
2014
2013
Detail of charges:
Severance, retirement and other restructuring costs
($1,686)
($1,894)
Customer bankruptcy
(1,857)
-
Facility closing costs
-
(6,043)
Litigation costs
-
(23,850)
Debt refinancing charges (other operating expenses)
-
(459)
Transaction costs
(4,114)
(613)
Debt refinancing charges (interest expense)
-
(96)
(7,657)
(32,955)
Income tax benefit
2,391
9,767
Charges net of income taxes
(5,266)
(23,188)
Allocation to participating unvested restricted stockholders
133
-
Available to common stockholders
($5,133)
($23,188)
Weighted average diluted shares outstanding
62,902
52,323
Diluted loss per common share related to charges
($0.08)
($0.44)
Reconciliation of operating income (EBITDAR) before charges:
Operating income (EBITDAR) before charges
$158,270
$148,245
Detail of charges excluded from core operating results:
Severance, retirement and other restructuring costs
(1,686)
(1,894)
Customer bankruptcy
(1,857)
-
Facility closing costs
-
(6,043)
Litigation costs
-
(23,850)
Debt refinancing charges (other operating expenses)
-
(459)
Transaction costs
(4,114)
(613)
(7,657)
(32,859)
Reported operating income (EBITDAR)
$150,613
$115,386
Reconciliation of income from continuing operations before charges:
Amounts attributable to Kindred stockholders:
Income from continuing operations before charges
$7,040
$6,585
Charges net of income taxes
(5,266)
(23,188)
Reported income (loss) from continuing operations
$1,774
($16,603)
Reconciliation of diluted income per common share from continuing operations
before charges:
Diluted income per common share before charges (a)
$0.11
$0.12
Charges net of income taxes
(0.08)
(0.44)
Other
-
0.01
Reported diluted income (loss) per common share from continuing operations
$0.03
($0.31)
Weighted average diluted shares used to compute income per common share
from continuing operations before charges
62,902
52,333
Pro forma diluted income per common share before charges
$0.10
Weighted average diluted shares used to compute pro forma income per
common share from continuing operations before charges (b)
61,954
Reconciliation of effective income tax rate before charges:
Effective income tax rate before charges
32.4%
30.5%
Impact of charges on effective income tax rate
1.0%
-1.3%
Reported effective income tax rate
33.4%
29.2%
(a)
(b)
For purposes of computing diluted earnings per common share before charges, income from
continuing operations before charges was reduced by $0.2 million for both the three
months ended September 30, 2014 and 2013, and $1.2 million and $1.4 million for the
nine months ended September 30, 2014 and 2013, respectively, for the allocation of
income to participating unvested restricted stockholders. Includes the incremental 9.7
million shares, on a weighted average basis, issued in connection with the Company's
equity offering completed in June 2014. |
 Reconciliation
of Non-GAAP Measures (continued) 32
($ Thousands)
Twelve
2013 Quarters
2014 Quarters
Months ended
First
Second
Third
Fourth
First
Second
Third
Sept. 30, 2014
Revenues:
Hospital division
657,814
$
606,604
$
594,154
$
606,988
$
646,458
$
632,156
$
609,452
$
2,495,054
$
Nursing center division
270,205
264,847
265,696
270,080
277,902
280,255
279,561
1,107,798
Rehabilitation division:
Skilled nursing rehabilitation services
258,750
249,647
245,330
243,280
254,255
253,989
247,042
998,566
Hospital rehabilitation services
74,523
69,777
68,296
74,017
73,964
75,324
74,808
298,113
333,273
319,424
313,626
317,297
328,219
329,313
321,850
1,296,679
Care management division
51,621
53,039
53,801
66,466
87,704
87,986
86,186
328,342
1,312,913
1,243,914
1,227,277
1,260,831
1,340,283
1,329,710
1,297,049
5,227,873
Eliminations:
Skilled nursing rehabilitation services
(28,657)
(28,660)
(28,151)
(28,157)
(29,646)
(30,031)
(30,788)
(118,622)
Hospital rehabilitation services
(23,609)
(23,223)
(22,520)
(22,123)
(23,233)
(22,855)
(22,172)
(90,383)
Nursing centers
(1,213)
(1,001)
(1,161)
(875)
(662)
(860)
(776)
(3,173)
(53,479)
(52,884)
(51,832)
(51,155)
(53,541)
(53,746)
(53,736)
(212,178)
1,259,434
$
1,191,030
$
1,175,445
$
1,209,676
$
1,286,742
$
1,275,964
$
1,243,313
$
5,015,695
$
Income (loss) from continuing operations:
Operating income (loss):
Hospital division
147,493
$
129,366
$
112,483
$
126,788
$
145,395
$
132,878
$
121,744
$
526,805
$
Nursing center division
29,145
36,018
31,505
35,585
38,471
36,880
36,179
147,115
Rehabilitation division:
Skilled nursing rehabilitation services
13,239
21,623
(7,209)
14,260
18,328
19,982
17,552
70,122
Hospital rehabilitation services
18,132
19,573
18,215
18,005
19,820
20,084
18,273
76,182
31,371
41,196
11,006
32,265
38,148
40,066
35,825
146,304
-
Care
management division 2,786
3,961
1,085
2,131
4,697
7,065
6,789
20,682
Corporate:
Overhead
(45,585)
(43,196)
(39,157)
(48,557)
(44,050)
(48,365)
(45,173)
(186,145)
Insurance subsidiary
(509)
(384)
(482)
(539)
(406)
(443)
(637)
(2,025)
(46,094)
(43,580)
(39,639)
(49,096)
(44,456)
(48,808)
(45,810)
(188,170)
Impairment charges
(187)
(438)
(441)
(76,127)
-
-
-
(76,127)
Transaction costs
(944)
(108)
(613)
(447)
(683)
(4,496)
(4,114)
(9,740)
Operating income (EBITDAR)
163,570
166,415
115,386
71,099
181,572
163,585
150,613
566,869
Rent
(76,519)
(77,324)
(76,762)
(80,921)
(81,048)
(80,209)
(80,192)
(322,370)
EBITDA
87,051
89,091
38,624
(9,822)
100,524
83,376
70,421
244,499
Depreciation and amortization
(41,598)
(38,554)
(36,507)
(37,547)
(39,337)
(39,442)
(39,023)
(155,349)
Interest, net
(28,074)
(27,600)
(24,389)
(23,900)
(25,616)
(78,081)
(22,173)
(149,770)
Income (loss) from continuing operations
before income taxes
17,379
22,937
(22,272)
(71,269)
35,571
(34,147)
9,225
(60,620)
Provision (benefit) for income taxes
6,505
9,208
(6,510)
(20,522)
13,585
(13,082)
3,079
(16,940)
10,874
$
13,729
$
(15,762)
$
(50,747)
$
21,986
$
(21,065)
$
6,146
$
(43,680)
$ |
 33
($ Thousands)
Reconciliation of Non-GAAP Measures
(continued)
Three months ended September 30, 2014
Charges
Severance
Before
and other
Customer
Transaction
As
charges
restructuring
bankruptcy
costs
Total
reported
Income from continuing operations:
Operating income (loss):
Hospital division
122,361
$
(617)
$
-
$
-
$
(617)
$
121,744
$
Nursing center division
36,662
(483)
-
-
(483)
36,179
Rehabilitation division:
Skilled nursing rehabilitation services
17,390
162
-
-
162
17,552
Hospital rehabilitation services
20,130
-
(1,857)
-
(1,857)
18,273
37,520
162
(1,857)
-
(1,695)
35,825
Care management division
7,110
(321)
-
-
(321)
6,789
Corporate:
Overhead
(44,746)
(427)
-
-
(427)
(45,173)
Insurance subsidiary
(637)
-
-
-
-
(637)
(45,383)
(427)
-
-
(427)
(45,810)
Transaction costs
-
-
-
(4,114)
(4,114)
(4,114)
Operating income (EBITDAR)
158,270
(1,686)
(1,857)
(4,114)
(7,657)
150,613
Rent
(80,192)
-
-
-
-
(80,192)
EBITDA
78,078
(1,686)
(1,857)
(4,114)
(7,657)
70,421
Depreciation and amortization
(39,023)
-
-
-
-
(39,023)
Interest, net
(22,173)
-
-
-
-
(22,173)
Income from continuing operations
before income taxes
16,882
(1,686)
(1,857)
(4,114)
(7,657)
9,225
Provision for income taxes
5,470
(923)
(1,017)
(451)
(2,391)
3,079
11,412
$
(763)
$
(840)
$
(3,663)
$
(5,266)
$
6,146
$
|
 34
Reconciliation of Non-GAAP Measures
(continued)
($ Thousands)
Three months ended September 30, 2013
Charges
Severance
Before
and
Facility
Debt
Transaction
As
charges
retirement
closing
Litigation
refinancing
costs
Total
reported
Income (loss) from continuing operations:
Operating income (loss):
Hospital division
118,710
$
-
$
(5,527)
$
(700)
$
-
$
-
$
(6,227)
$
112,483
$
Nursing center division
31,569
-
(64)
-
-
-
(64)
31,505
Rehabilitation division:
Skilled nursing rehabilitation services
15,941
-
-
(23,150)
-
-
(23,150)
(7,209)
Hospital rehabilitation services
18,503
(288)
-
-
-
-
(288)
18,215
34,444
(288)
-
(23,150)
-
-
(23,438)
11,006
Care management division
2,138
(601)
(452)
-
-
-
(1,053)
1,085
Corporate:
Overhead
(37,693)
(1,005)
-
-
(459)
-
(1,464)
(39,157)
Insurance subsidiary
(482)
-
-
-
-
-
-
(482)
(38,175)
(1,005)
-
-
(459)
-
(1,464)
(39,639)
Impairment charges
(441)
-
-
-
-
-
-
(441)
Transaction costs
-
-
-
-
-
(613)
(613)
(613)
Operating income (EBITDAR)
148,245
(1,894)
(6,043)
(23,850)
(459)
(613)
(32,859)
115,386
Rent
(76,762)
-
-
-
-
-
-
(76,762)
EBITDA
71,483
(1,894)
(6,043)
(23,850)
(459)
(613)
(32,859)
38,624
Depreciation and amortization
(36,507)
-
-
-
-
-
-
(36,507)
Interest, net
(24,293)
-
-
-
(96)
-
(96)
(24,389)
Income (loss) from continuing operations
before income taxes
10,683
(1,894)
(6,043)
(23,850)
(555)
(613)
(32,955)
(22,272)
Provision (benefit) for income taxes
3,257
(2,044)
(5,805)
(756)
(599)
(563)
(9,767)
(6,510)
7,426
$
150
$
(238)
$
(23,094)
$
44
$
(50)
$
(23,188)
$
(15,762)
$ |
 Reconciliation
of Non-GAAP Measures (continued)
($ Thousands)
35
2013
2012
2011
Detail of charges:
One-time bonus
(19,842)
$
$ -
$ -
Severance, retirement and other restructuring costs
(12,558)
(8,730)
(18,259)
Litigation costs
(30,850)
(5,000)
-
Impairment charges
(76,082)
(107,899)
(73,554)
Transaction costs
(2,112)
(2,231)
(33,937)
Lease cancellation charges (rent expense)
-
(1,691)
(1,819)
Debt refinancing charges (interest expense)
(1,461)
-
(13,802)
(142,905)
(125,551)
(141,371)
Income tax benefit
43,893
12,795
34,427
Charges net of income taxes
(99,012)
(112,756)
(106,944)
Allocation to participating unvested restricted stockholders
-
-
-
Available to common stockholders
($99,012)
($112,756)
($106,944)
Reconciliation of EBITDAR before charges:
Operating income (EBITDAR) before charges
$657,914
$679,488
$528,902
Rent
311,526
303,564
276,540
EBITDA
346,388
375,924
252,362
Detail of charges excluded from core operating results:
One-time bonus
(19,842)
-
-
Severance, retirement and other restructuring costs
(12,558)
(8,730)
(18,259)
Litigation costs
(30,850)
(5,000)
-
Impairment charges
(76,082)
(107,899)
(73,554)
Transaction costs
(2,112)
(2,231)
(33,937)
(141,444)
(123,860)
(125,750)
Reported operating income (EBITDAR)
$516,470
$555,628
$403,152
Reconciliation of income from continuing operations before charges:
Amounts attributable to Kindred stockholders:
Income from continuing operations before charges
$53,216
$65,891
$40,482
Charges net of income taxes
(99,012)
(112,756)
(106,944)
Reported loss from continuing operations
($45,796)
($46,865)
($66,462) |
 Three months
ended September 30,
2014
2013
Reconciliation of net cash flows provided by operating
activities to free cash flows:
Net cash flows provided by operating activities
$90,039
$110,750
Adjustments to remove certain payments (including payments
made for discontinued operations) included in net cash flows
provided by operating activities:
Capitalized lender fees related to debt refinancing
-
4,589
Severance, retirement and retention
1,271
1,181
Transaction costs
4,565
6,362
5,836
12,132
Benefit of reduced income tax payments resulting from
certain payments
(1,269)
(3,013)
4,567
9,119
Net cash flows provided by operating activities excluding certain items
94,606
119,869
Less:
Routine capital expenditures
(21,263)
(23,152)
Development capital expenditures
(1,570)
(3,235)
(22,833)
(26,387)
Free cash flows excluding certain items
$71,773
$93,482
Reconciliation of Non-GAAP Measures
(continued)
($ Thousands)
36 |
 Gentiva
Non-GAAP Disclosure (1)
37
Third quarter
2014
Adjusted EBITDA
$48.5
Cost savings initiatives and acquisition and integration activities
(0.5)
Impact of closed locations
(0.3)
Impact of merger related expenses
(1.6)
EBITDA
46.1
Depreciation and Amortization
(7.3)
Interest Expense and Other, net
(24.7)
(Loss)/Income Before Income Taxes
14.1
Income Tax Benefit / (Expense)
(5.6)
Equity in net loss of CareCentrix
(0.5)
Net (Loss)/Income
8.0
Less: Net Income Attributable to Noncontrolling
Interests -
Net (Loss) / Income Attributable to Gentiva Shareholders
$8.0
A reconciliation of Adjusted EBITDA and adjusted net income attributable to Gentiva
shareholders to net income, the most directly comparable GAAP measure, is not accessible
on a forward-looking basis without unreasonable effort due to inherent
difficulities in predicting the charges for cost savings initiatives and acquisition
and integration activities, the results of discontinued operations and the impact of
any future acquisitions or divestitures, which can fluctuate significantly and may
have a significant impact on net income.
(1) Per Gentiva November 5, 2014 earnings release.
($ Millions)
(1) |
 Kindred
Healthcare Third Quarter Investor Update
November 6, 2014 |