Attached files
| file | filename |
|---|---|
| 8-K/A - Higher One Holdings, Inc. | form8ka.htm |
| EX-99.1 - Higher One Holdings, Inc. | ex99_1.htm |
Exhibit 99.2

Q3’14 Earnings Results November 6, 2014

This presentation contains statements that constitute “forward-looking statements” within the meaning of the Private Securities Litigation Reform Act of 1995. Management’s projections and expectations are subject to a number of risks and uncertainties that could cause actual performance to differ materially from that predicted or implied. Forward-looking statements may be identified by the use of words such as “expect,” “anticipate,” “believe,” “estimate,” “potential,” “should” or similar words intended to identify information that is not historical in nature. Forward-looking statements contained herein include, among others, statements concerning bank partners, the regulatory environment, banking fees, litigation, sales, and the expected benefits of acquisitions, and such statements are based on the current beliefs and expectations of Higher One management, as applicable, and are subject to known and unknown risks and uncertainties. There are a number of risks and uncertainties that could cause actual results to differ materially from those contemplated by the forward-looking statements. These statements speak only as of the date they are made, and Higher One does not intend to update or otherwise revise the forward-looking information to reflect actual results of operations, changes in financial condition, changes in estimates, expectations or assumptions, changes in general economic or industry conditions or other circumstances arising and/or existing since the preparation of this presentation or to reflect the occurrence of any unanticipated events. The forward-looking statements in this presentation do not include the potential impact of any acquisitions or divestitures that may be announced and/or completed after the date hereof. For further information regarding the risks associated with Higher One’s business, please refer to Higher One’s filings with the Securities and Exchange Commission, including Annual Reports on Form 10-K for the most recent fiscal year end, Quarterly Reports on Form 10-Q and Current Reports on Form 8-K. Forward-Looking Statements

Q3 2014 Highlights Revenue up approximately 5% due to growth in Payment Transaction and Higher Ed revenueAdjusted EPS of 15 centsNon-refund deposit growth of 16%

Continued Diversification of Revenue Streams $ in thousands 70% 58% 53% 12% 16% 17% 16% 26% 30%

Payment Solutions and Campus Labs Completed the transition of Campus Solutions clients onto Higher One systems. Development of new CASHNet Enterprise system Developing a new user interface to make Payment suite user experience state-of-the-artCampus Labs to create more connectivity amongst the various product areas
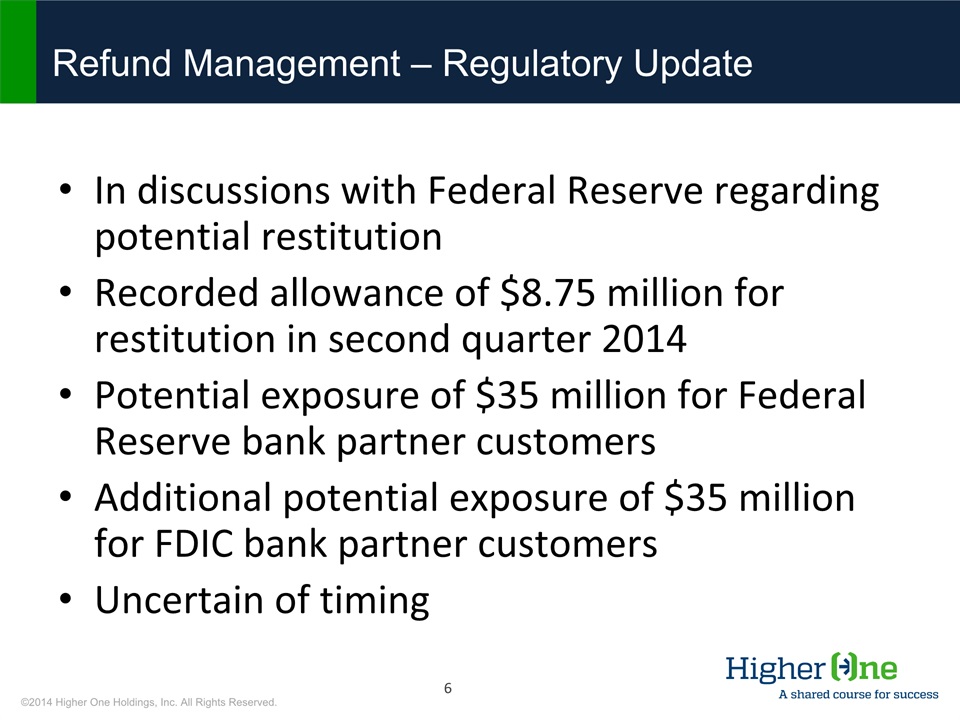
Refund Management – Regulatory Update In discussions with Federal Reserve regarding potential restitutionRecorded allowance of $8.75 million for restitution in second quarter 2014Potential exposure of $35 million for Federal Reserve bank partner customersAdditional potential exposure of $35 million for FDIC bank partner customersUncertain of timing

Refund Management – Department of Education Rulemaking Dept. of Ed. did not issue Cash Management rules by November 1 Earliest effective date of potential new rules likely to be July 1, 2016Ongoing engagement with Dept. of Ed., consumer groups and studentsContinue to enhance refund selection process

Refund Management – Sales New Refund Management sales of 47,000 SSE Lost Refund Management contracts of 36,000 SSE Net Refund Management sales of 11,000 SSE in quarterRetention rate exceeds 98%

OneAccount Strengthening value proposition for account holdersOur goal is to create an even stronger, low cost banking option for students, with simplified fee structuresAim to create excellent experience to serve as pathway to deeper engagement

Revenue Revenue (in $ millions) Y/Y Revenue Change 6% 7% (1%) 3% 11% 14% 16% 14% 5% Y/Y Organic Change* 4% 3% (5%) (7%) 1% (1%) 5% 11% 5% Gross Profit Margin 57.4% 59.9% 61.1% 55.3% 56.2% 58.3% 58.7% 42.5% 52.9% 49.8 40.0 57.1 56.6 59.8 51.2 57.4 66.6 45.5 8.8 36.7 Q2’14 Gross Margin excluding allowance for restitution: 53.6% *Calculation of organic revenue growth is included in the appendix of this presentation
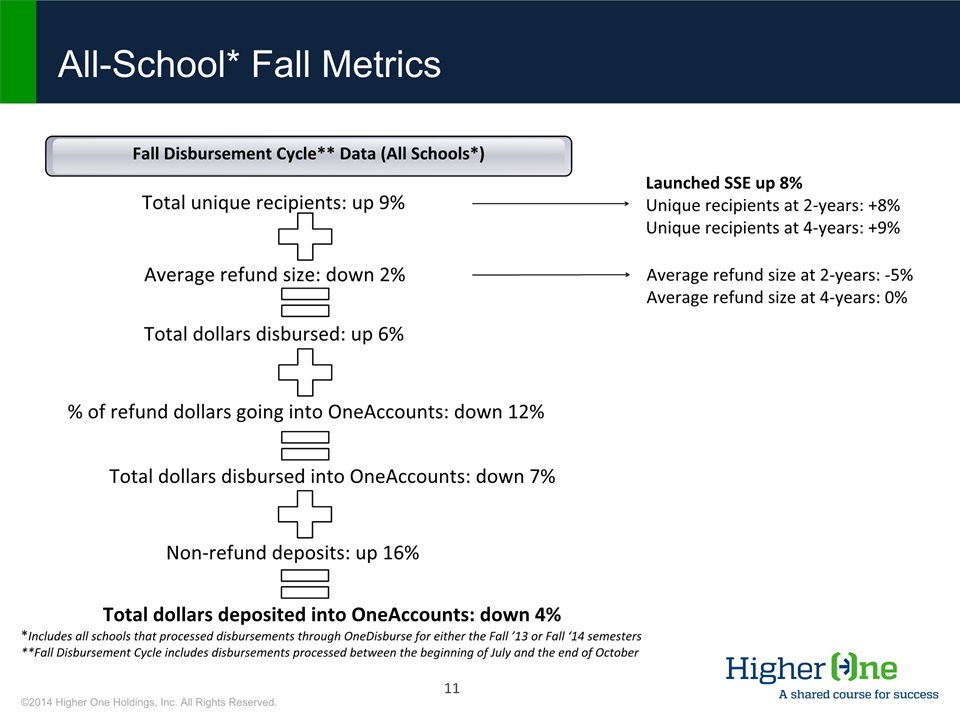
*Includes all schools that processed disbursements through OneDisburse for either the Fall ’13 or Fall ‘14 semesters**Fall Disbursement Cycle includes disbursements processed between the beginning of July and the end of October All-School* Fall Metrics Total unique recipients: up 9% Average refund size: down 2% Total dollars disbursed: up 6% % of refund dollars going into OneAccounts: down 12% Total dollars disbursed into OneAccounts: down 7% Fall Disbursement Cycle** Data (All Schools*) Launched SSE up 8%Unique recipients at 2-years: +8%Unique recipients at 4-years: +9% Average refund size at 2-years: -5%Average refund size at 4-years: 0% Non-refund deposits: up 16% Total dollars deposited into OneAccounts: down 4%

Total unique recipients: down 2% Average refund size: down 3% Total dollars disbursed: down 5% % of refund dollars going into OneAccounts: down 8% Total dollars disbursed into OneAccounts (on a same-school basis*): down 12% Fall Disbursement Cycle** Data (Same-School Basis*) Unique recipients at 2-years: -3%Unique recipients at 4-years: +2% Average refund size at 2-years: -6%Average refund size at 4-years: -3% *Includes all schools that processed disbursements through OneDisburse for the Fall ‘13 and Fall ‘14 semesters**Fall Disbursement Cycle includes disbursements processed between the beginning of July and the end of October Same-School* Fall Metrics

Q3 2013 to Q3 2014 Account Revenue Waterfall $ in millions *This chart represents management’s approximation of the relevant factors, and their relative impacts, that management believes have affected Account Revenue.

Revenue Streams $ in thousands 3Q 2013 3Q 2014 Account Revenue 58.2% 52.7% Payment Transaction Rev. 25.6% 30.4% Higher Ed. Revenue 15.8% 16.6% Other 0.4% 0.3%

Operating Expenses G&A was generally flat for quarterPrior year included transition cost related to identification of new bank partner Decreases in technology transition costs related to Campus SolutionsCapitalized costs related to software development Decreased sales support costsIncrease in amortization expenseLower discretionary marketing spend G&A (as a % of gross rev) Product Development (as a % of gross rev ) Sales & Marketing (as a % of gross rev)

Adjusted EBITDA *Calculation of Adj. EBITDA and Adj. EBITDA Margin is included in the appendix of this presentation Adj. EBITDA* (in $ millions) Y/Y Adj. EBITDA Change -8% -17% -14% -41% -14% -3% 5% 22% 4% Adj. EBITDA Margin* 32.6% 33.0% 37.6% 14.7% 25.1% 28.2% 34.1% 15.8% 25.0 %

Adjusted EPS *Calculation of Adj. EPS and Adj. Net Income Margin is included in the appendix of this presentation Adjusted Diluted EPS (in $) Y/Y Adj. EPS Change -13% -18% -2% -51% -12% -2% 2% 15% 2% Adj. Net Income Margin* 18.1% 18.6% 20.9% 5.4% 12.1% 14.4% 18.4% 5.5% 11.7%

Free Cash Flow *Calculation of Free Cash Flow is included in the appendix of this presentation Free Cash Flow (in $ millions) Y/Y FCF Change 271% 608% 31% 14% 93% -35% -102% 174% -41% FCF Yield as % of Gross Rev 18.4% 26.8% 36.0% -23.5% 31.8% 15.3% -0.6% 15.3% 18.0% CapEx as % of Gross Rev 5.2% 3.6% 3.3% 5.9% 4.4% 4.7% 3.6% 5.9% 3.3%

Cash & Investment Balance/Flows Liquidity Matters Cash and cash equivalents Investments in available for sale securities Fully liquid assets total $32.7M$10.7M in Free Cash Flow$94M outstanding on line of creditEBITDA, as defined in credit agreement, of $53.7MRequire EBITDA, as defined in credit agreement, of $50.0M$10M settlement threshold Capital and Liquidity FCF

*Refund Management Signed School Enrollment (SSE) is recorded as the total student enrollment at all schools that are contracted at quarter-end for our Refund Management product as of the date the contract is signed (using the most up-to-date IPEDS data at that point in time). +6% Refund Management and OneAccount Growth SSE in thousands* 0% OneAccount Growth Refund Management Growth

Q & A

Appendix

Calculation of Organic Gross Revenue* *Organic revenue calculation excludes the entire revenue impact from the current and prior year quarter for all acquisitions made within 15 months of a given quarter’s end

Calculation of Free Cash Flow

Calculation of Adjusted EBITDA

Calculation of Adjusted Diluted EPS