Attached files
| file | filename |
|---|---|
| 8-K - 8-K - FEDERAL HOME LOAN MORTGAGE CORP | d802372d8k.htm |
| EX-99.1 - EXHIBIT 99.1 - FEDERAL HOME LOAN MORTGAGE CORP | d802372dex991.htm |
 Third Quarter 2014
Financial Results Supplement
November 6, 2014
Exhibit 99.2 |
 ©
Freddie Mac
Table of contents
1
Financial Results
Segment Business Information
2 -
Quarterly Financial Results
10 -
Single-Family New Funding Volume
3 -
Comprehensive Income
11 -
Single-Family Guarantee Fees Charged on New Acquisitions
4 -
Treasury Draw Requests and Dividend Payments
12 -
Single-Family Risk Transfer Transactions
5 -
Financial Results - Key Drivers
13 -
6 -
Segment Financial Results
14 -
15 -
16 -
Housing Market
17 -
7 -
National Home Prices
18 -
8 -
State-by-State Home Prices: September 2013 to September 2014
19 -
9 -
20 -
21 -
22 -
Single-Family Credit Quality - Purchases
Housing Market Support
Single-Family Credit Quality - Credit Guarantee Portfolio
Multifamily Mortgage Portfolio Attributes
Multifamily Market and Freddie Mac Delinquency Rates
Investments - Purchase Agreement Portfolio Limits
Investments - Mortgage-Related Investments Portfolio Composition
Single-Family Real Estate Owned
Multifamily Business Volume and Portfolio Composition
Multifamily Securitization Volume
Single-Family Mortgage Market and Freddie Mac Delinquency Rates |
  ©
Freddie Mac
Quarterly financial results
Note: Columns and rows may not add due to rounding.
2
$ Billions
3Q14
vs
2Q14
3Q14
2Q14
1
Net interest income
$3.5
$3.7
$0.2
2
(Provision) benefit for credit losses
0.6
(0.6)
(1.2)
3
Derivative losses
(1.9)
(0.6)
1.3
4
Other non-interest income
0.5
1.4
0.9
5
Non-interest income (loss)
(1.4)
0.8
2.2
6
Non-interest expense
(0.7)
(0.8)
(0.1)
7
Pre-tax income
2.0
3.0
1.0
8
Income tax expense
(0.7)
(1.0)
(0.3)
9
Net income
1.4
2.1
0.7
10
Total other comprehensive income,
net of taxes
0.5
0.7
0.2
11
Comprehensive income
$1.9
$2.8
$0.9
12
Total equity / GAAP net worth (ending balance)
$4.3
$5.2
$0.9 |
 ©
Freddie Mac
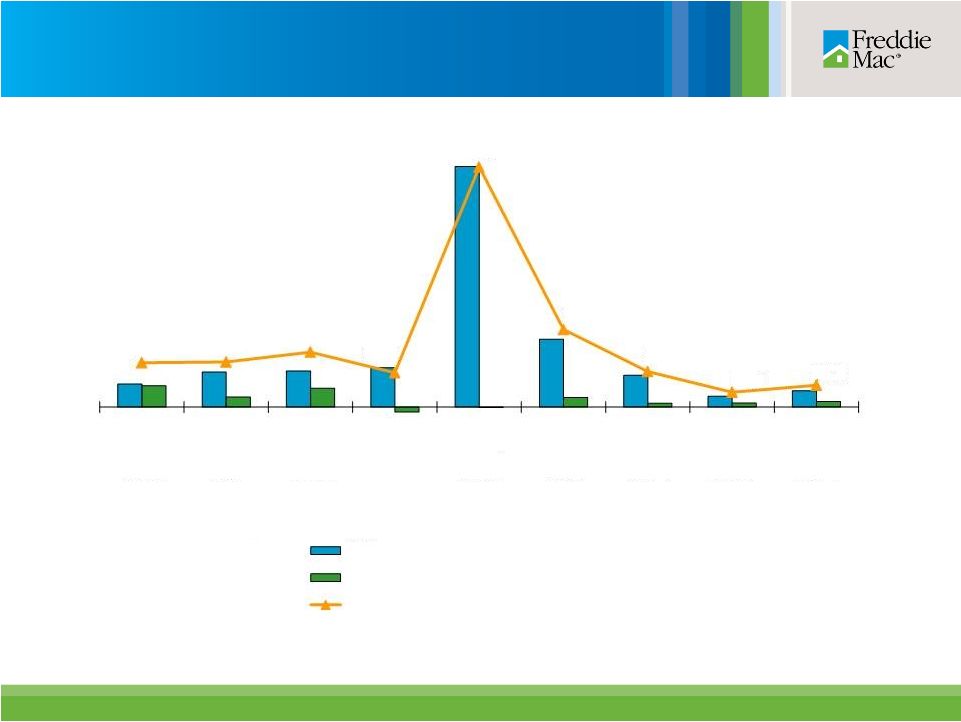
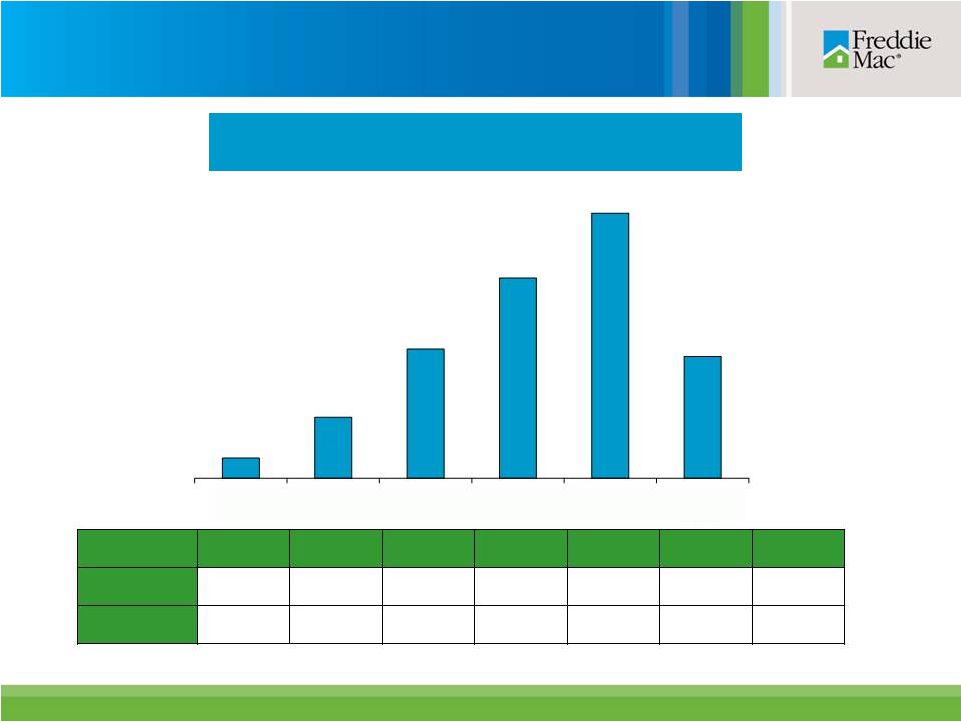
Comprehensive income
1
Net income and Comprehensive income include $23.9 billion non-cash benefit from
releasing the valuation allowance on deferred tax assets. 2
Consists of the after-tax changes in: (a) the unrealized gains and losses on
available-for-sale securities; (b) the effective portion of derivatives previously designated as cash flow
hedges; and (c) defined benefit plans.
A
B
C = A + B
1
$ Billions
3
$5.6
$5.7
$7.0
$4.4
$30.4
$9.8
$4.5
$1.9
$2.8
3Q12
4Q12
1Q13
2Q13
3Q13
4Q13
1Q14
2Q14
3Q14
Net income
Total
other
comprehensive
income
(loss),
net
of
taxes
2
Comprehensive income |
 ©
Freddie Mac
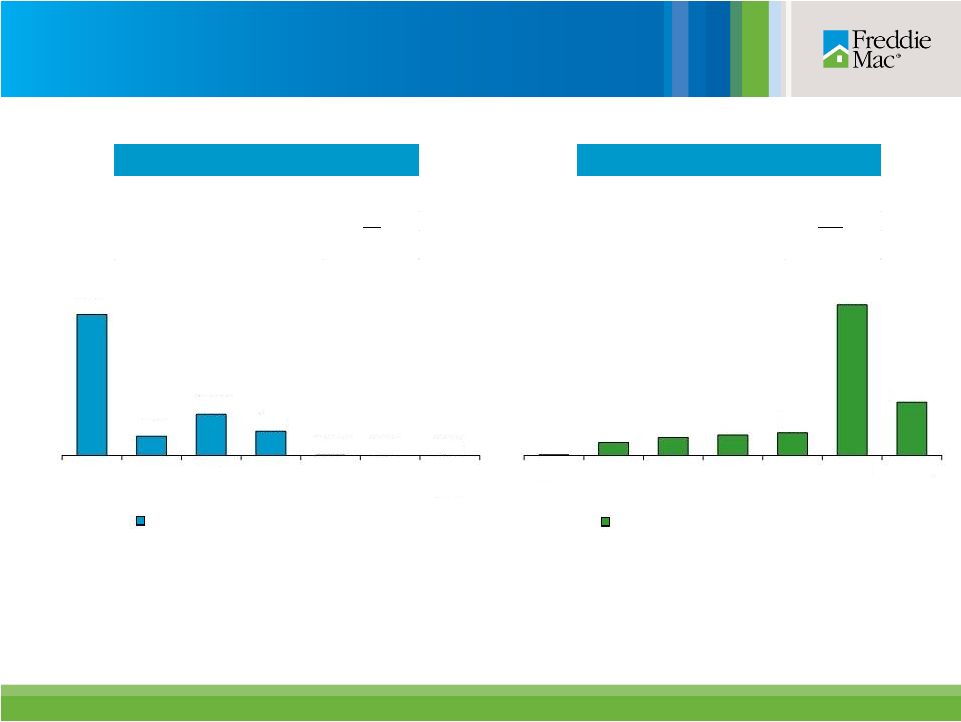
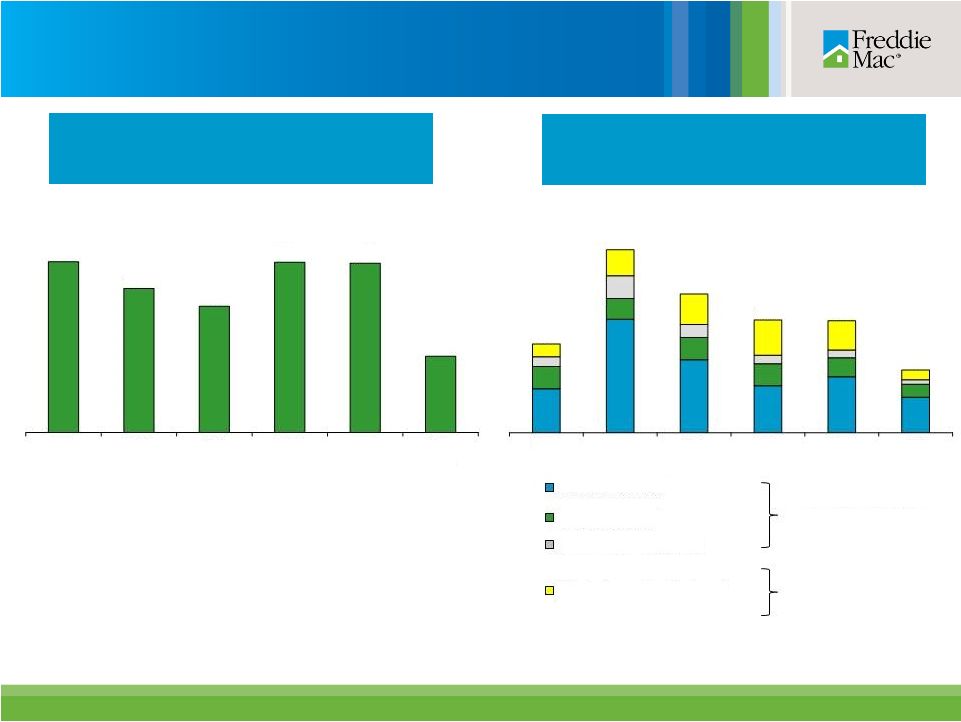
Dividend Payments to Treasury
Draw Requests from Treasury
Treasury draw requests and dividend payments
1
The initial $1 billion liquidation preference of senior preferred stock was issued
to Treasury in September 2008 as consideration for Treasury’s funding commitment. The company
received
no
cash
proceeds
as
a
result
of
issuing
this
initial
$1
billion
liquidation
preference
of
senior
preferred
stock.
2
Amounts may not add due to rounding.
3
Amount does not include the December 2014 dividend obligation of $2.8
billion. 4
Annual amounts represent the total draws requested based on Freddie Mac’s
quarterly net deficits for the periods presented. Draw requests are funded in the subsequent quarter
(e.g., $19 million draw request for 1Q12 was funded in 2Q12).
5
Represents quarterly cash dividends paid by Freddie Mac to Treasury during the
periods presented. Through December 31, 2012, Treasury was entitled to receive cumulative
quarterly cash dividends at the annual rate of 10% per year on the liquidation
preference of the senior preferred stock. However, the fixed dividend rate was replaced with a net
worth sweep dividend payment beginning in the first quarter of 2013. See the
company’s Annual Report on Form 10-K for the year ended December 31, 2013 for more information.
$ Billions
5
4
Draws From Treasury
Dividend Payments to Treasury
3
4
$0.2
$4.1
$5.7
$6.5
$7.2
$47.6
$16.8
2008
2009
2010
2011
2012
2013
YTD
2014
$44.6
$6.1
$13.0
$7.6
$0.02
$0.0
$0.0
2008
2009
2010
2011
2012
2013
YTD
2014
Cumulative
Total
Total Senior Preferred Stock
Outstanding
$72.3
Less: Initial Liquidation Preference
1
$1.0
Treasury Draws
$71.3
Cumulative
Total
Dividend Payments as of 09/30/14
$88.2
4Q14 Dividend Obligation
$2.8
Total Dividend Payments
2
$91.0 |
 ©
Freddie Mac
Financial
results
–
key
drivers
Net Interest Income
$ Billions
(Provision) Benefit for Credit Losses
$ Billions
Derivative Gains (Losses)
$ Billions
Other
Non-Interest
Income
(Loss)
1
$ Billions
1
Includes settlement benefits from private-label securities litigation.
5
$4.3
$3.8
$3.5
$3.5
$3.7
3Q13
4Q13
1Q14
2Q14
3Q14
$1.1
$0.2
($0.1)
$0.6
($0.6)
3Q13
4Q13
1Q14
2Q14
3Q14
($0.1)
$1.0
($2.4)
($1.9)
($0.6)
3Q13
4Q13
1Q14
2Q14
3Q14
$1.8
$4.8
$5.5
$0.5
$1.4
3Q13
4Q13
1Q14
2Q14
3Q14 |
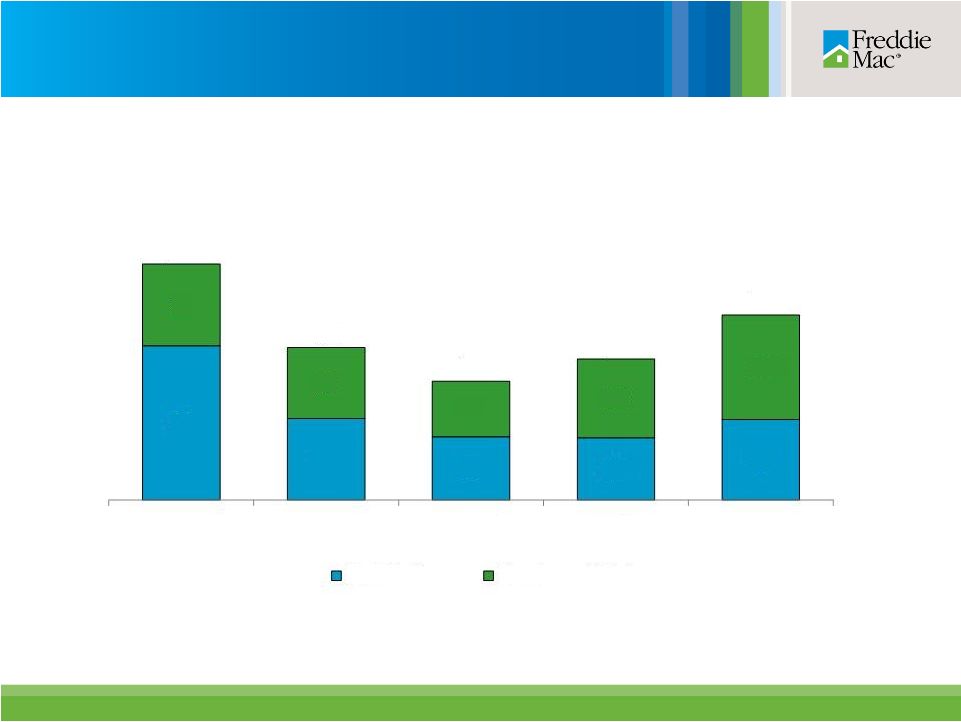
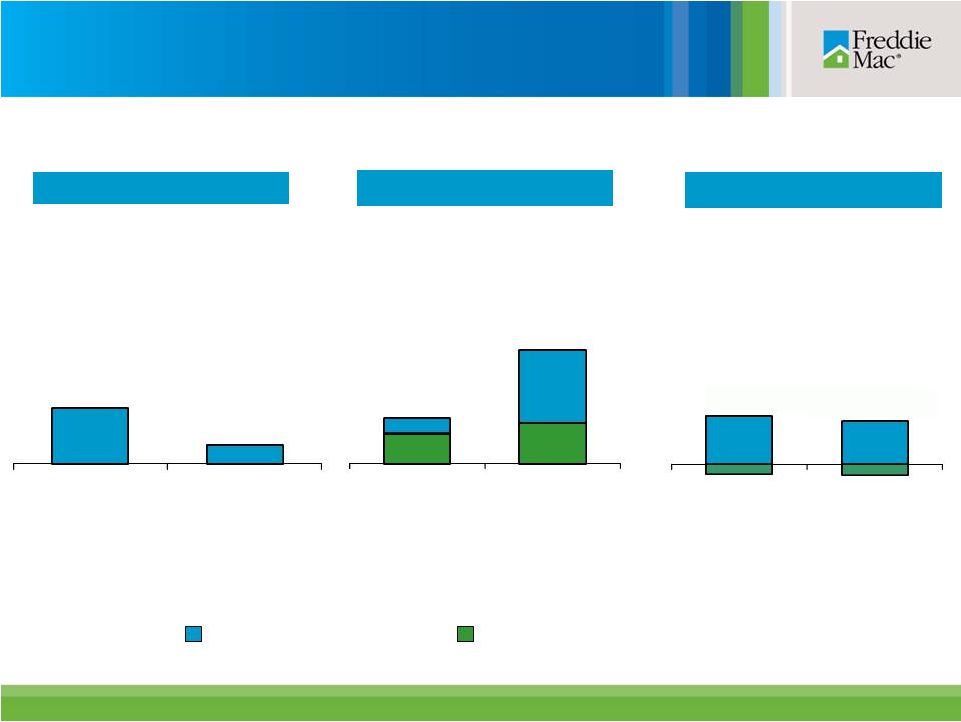 Segment financial results
$ Billions
Investments
Multifamily
Single-Family
Guarantee
1
Comprehensive Income
Segment Earnings
Segment Other Comprehensive Income (Loss)
$0.9
$0.4
$0.6
$0.3
$2.3
$0.2
1
Comprehensive income approximated segment earnings for both the second and third
quarter of 2014. 6
$0.6
$0.2
2Q14
3Q14
$0.6
$0.8
$0.3
$1.4
2Q14
3Q14
($0.1)
($0.1)
$0.5
$0.4
2Q14
3Q14
©
Freddie Mac |
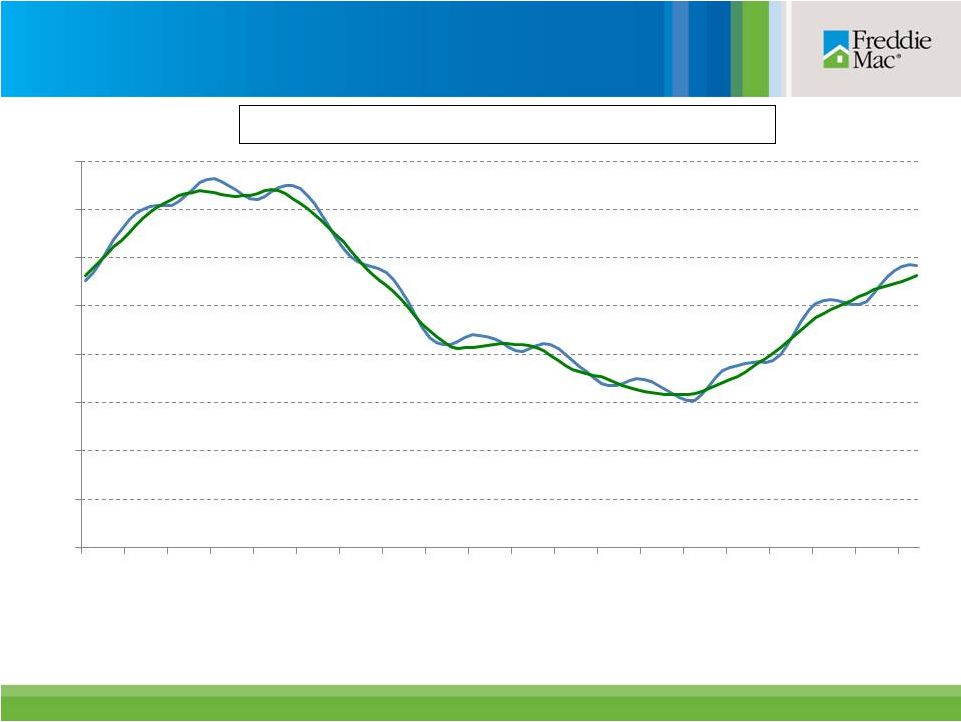 National
home
prices
1
Cumulative decline of 11% since June 2006
7
Freddie Mac House Price Index (December 2000=100)
United States (SA)
United States (NSA)
Q32014 NSA Index Growth: 0.7%
Q32014 SA Index Growth: 1.2%
90
100
110
120
130
140
150
160
170
2005
2006
2007
2008
2009
2010
2011
2012
2013
2014
©
Freddie Mac
1
Source: Freddie Mac.
National home prices use the Freddie Mac House Price Index for the U.S., which is a value-weighted
average of the state indexes where the value weights are based on Freddie Mac’s
single-family credit guarantee portfolio. Other indices of home prices may have different results, as they are determined using home prices relating to different pools of
mortgage loans and calculated under different conventions than Freddie Mac’s. Quarterly
growth rates are calculated as a 3-month change based on the final month of each quarter.
‘SA’ denotes ‘Seasonally Adjusted’ and ‘NSA’ denotes ‘Not
Seasonally Adjusted’; seasonal factors typically result in stronger house-price appreciation during the second and third
quarters. Historical growth rates change as new data becomes available. Values for the most
recent periods typically see the largest changes. Cumulative decline calculated as the
percent change from June 2006 to September 2014.
|
 ©
Freddie Mac
4%
AL
5%
AK
8%
5 to 7%
-1 to 1%
2 to 4%
The Freddie Mac House Price Index for the U.S. is a value-weighted average of
the state indexes where the value weights are based on Freddie Mac’s single-family credit
guarantee portfolio. Percent changes were rounded to nearest whole percentage
point. Source: Freddie Mac
5%
AR
4%
AZ
8%
CA
7%
CO
CT -1%
DC 7%
DE 6%
8%
FL
7%
GA
7%
HI
3%
IA
3%
ID
4%
IL
4%
IN
4%
KS
KY 3%
3%
LA
0%
4%
ME
8%
MI
1%
MN
4%
MO
5%
MS
5%
MT
NC 3%
8%
ND
5%
NE
NJ 1%
3%
NM
13%
NV
1%
NY
4%
OH
3%
OK
7%
OR
2%
PA
RI 6%
6%
SC
3%
SD
TN 6%
8%
TX
3%
UT
4%
VA
7%
WA
3%
WI
4%
WV
3%
WY
4%
0%
VT
4%
MD
MA
NH
Home price performance by state
September 2013 to September 2014
1
United States 5%
8
1 |
 ©
Freddie Mac
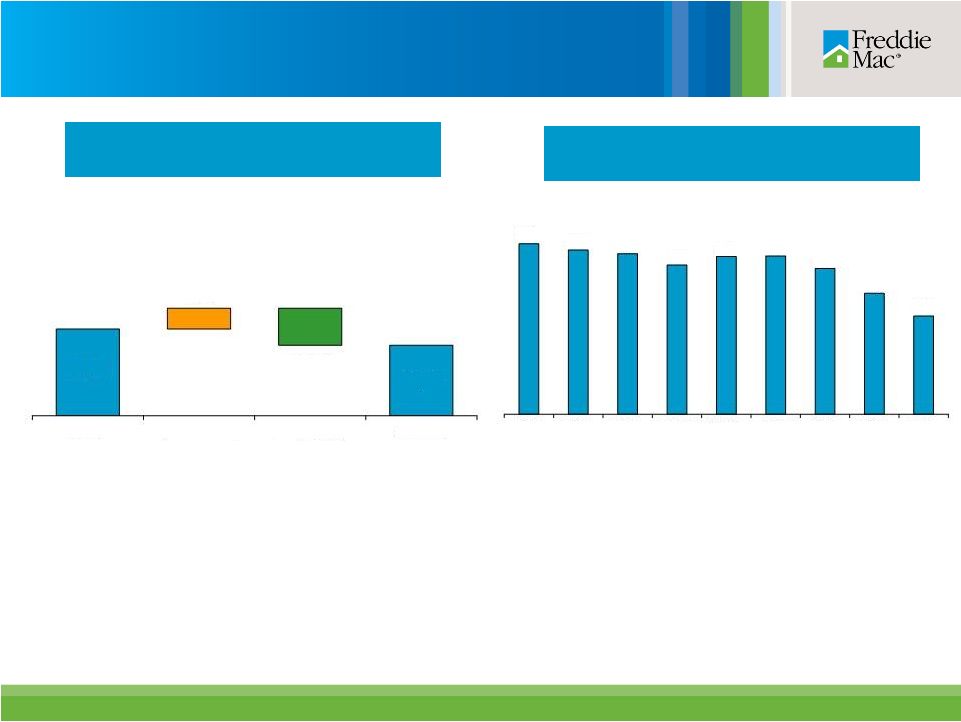
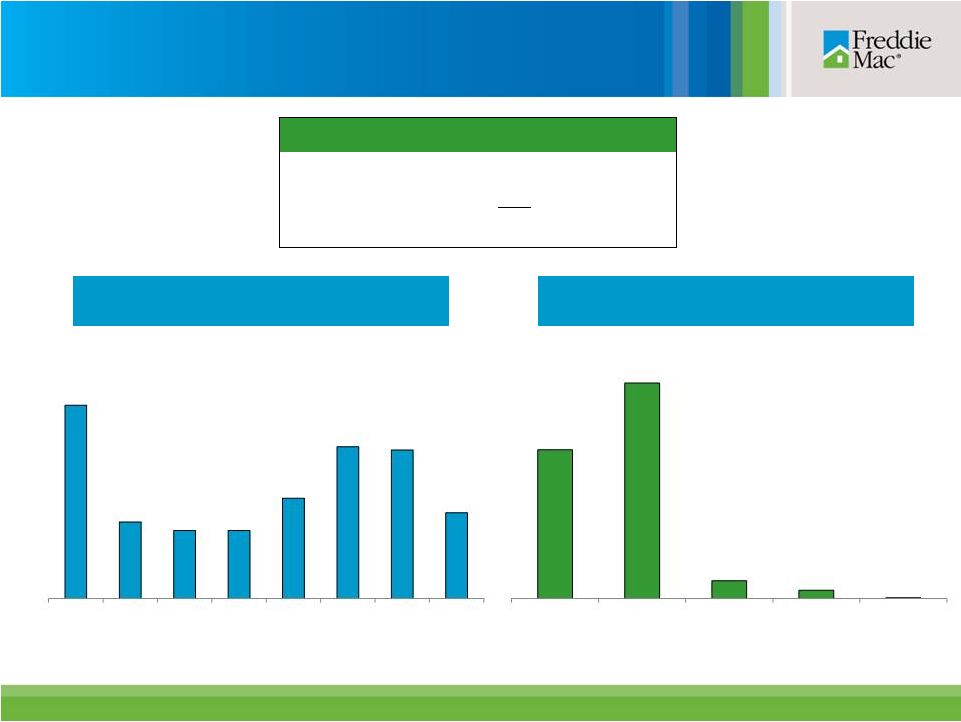
Housing market support
Number of Families Freddie Mac Helped
to
Own
or
Rent
a
Home
1
In Thousands
Single-Family
Loan
Workouts
2
Number of Loans (000)
1
Based on the company’s purchases of loans and issuances of
mortgage-related securities. For the periods presented, a borrower may be counted more than once if the company
purchased more than one loan (purchase or refinance mortgage) relating to the same
borrower. 2
Consists of both home retention actions and foreclosure alternatives.
3
These categories are not mutually exclusive and a borrower in one category may also
be included within another category in the same or another period. For example, a borrower
helped through a home retention action in one period may subsequently lose his or
her home through a short sale or deed-in-lieu transaction in a later period.
133
275
208
169
168
Repayment
plans
3
Loan modifications
3
Forbearance
agreements
3
Short sales and deed-in-lieu of
foreclosure
transactions
3
Home Retention Actions
Foreclosure Alternatives
Cumulative Since 2009: 12,427
Cumulative Since 2009: 1,047
94
9
2,480
2,089
1,830
2,472
2,458
1,098
2009
2010
2011
2012
2013
YTD
2014
2009
2010
2011
2012
2013
YTD
2014 |
 ©
Freddie Mac
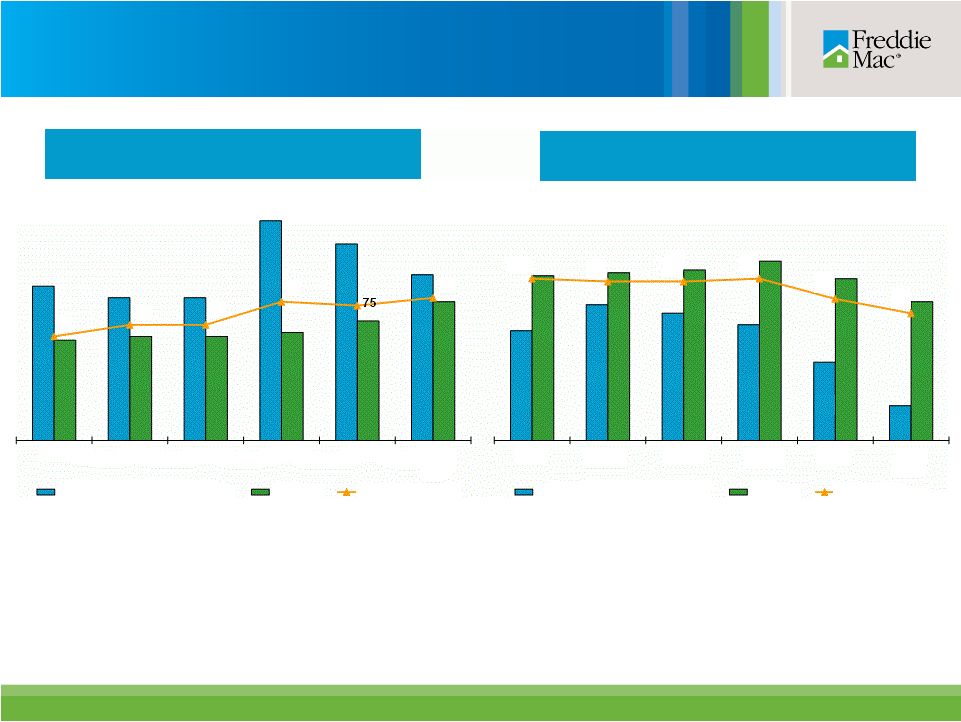
Single-family new funding volume
$ Billions
$98
$63
$49
$59
$77
10
Note: Totals may not add due to rounding.
64
34
26
26
33
34
29
23
33
43
3Q13
4Q13
1Q14
2Q14
3Q14
Refi UPB
Purchase UPB |
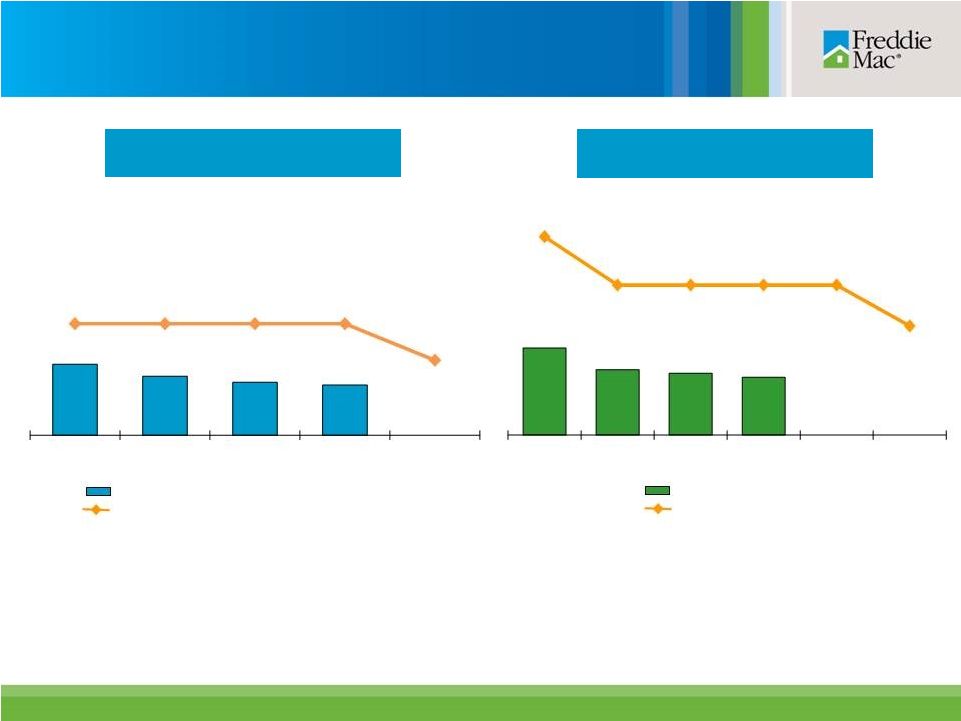
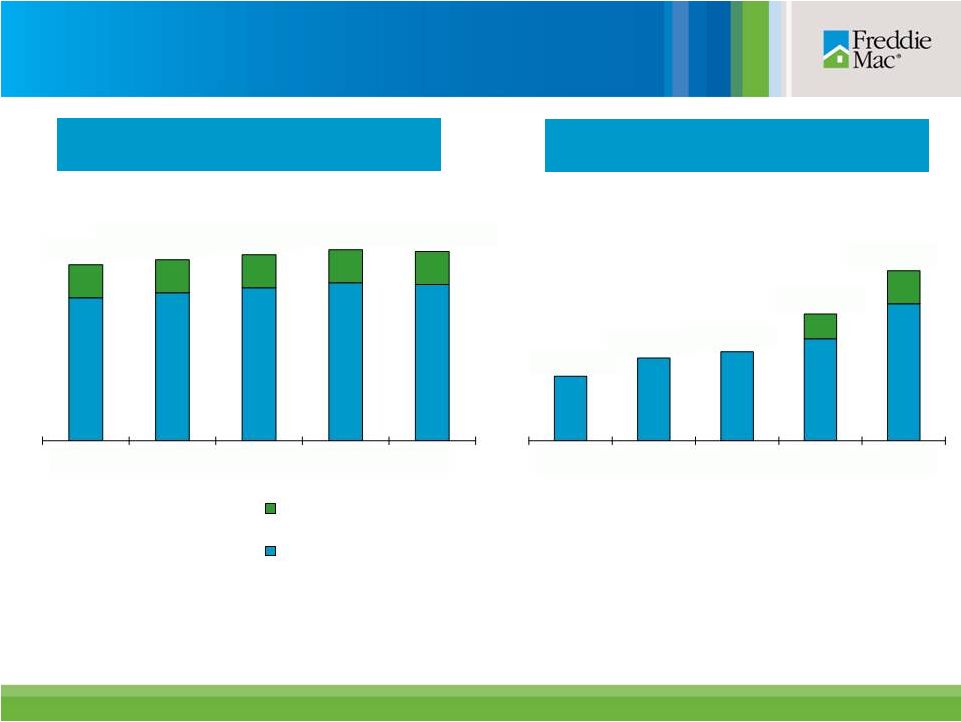 Single-family guarantee fees charged on new
acquisitions
1
1
Includes
the
effect
of
pricing
adjustments
that
are
based
on
the
relative
performance
of
Freddie
Mac’s
PCs
compared
to
comparable
Fannie
Mae
securities.
2
Effective April 1, 2012, guarantee fees charged on single-family loans sold to
Freddie Mac were increased by 10 basis points. Under the Temporary Payroll Tax Cut Continuation Act
of
2011,
Freddie
Mac
is
required
to
remit
the
proceeds
from
this
increase
to
Treasury.
3
Represents the estimated average rate of management and guarantee fees for new
acquisitions during the period assuming amortization of delivery fees using the estimated life of the
related
loans
rather
than
the
original
contractual
maturity
date
of
the
related
loans.
Quarterly
In Basis Points (bps), Annualized
Legislated
10
Basis
Point
Guarantee
Fee
Remitted
to
Treasury
2
Single-Family Guarantee Fee Charged on New Acquisitions (excluding amounts
remitted to Treasury)
3
11
Annual
In Basis Points (bps)
53
55
56
58
57
3Q13
4Q13
1Q14
2Q14
3Q14
20
25
27
38
51
2009
2010
2011
2012
2013
©
Freddie Mac |
 ©
Freddie Mac
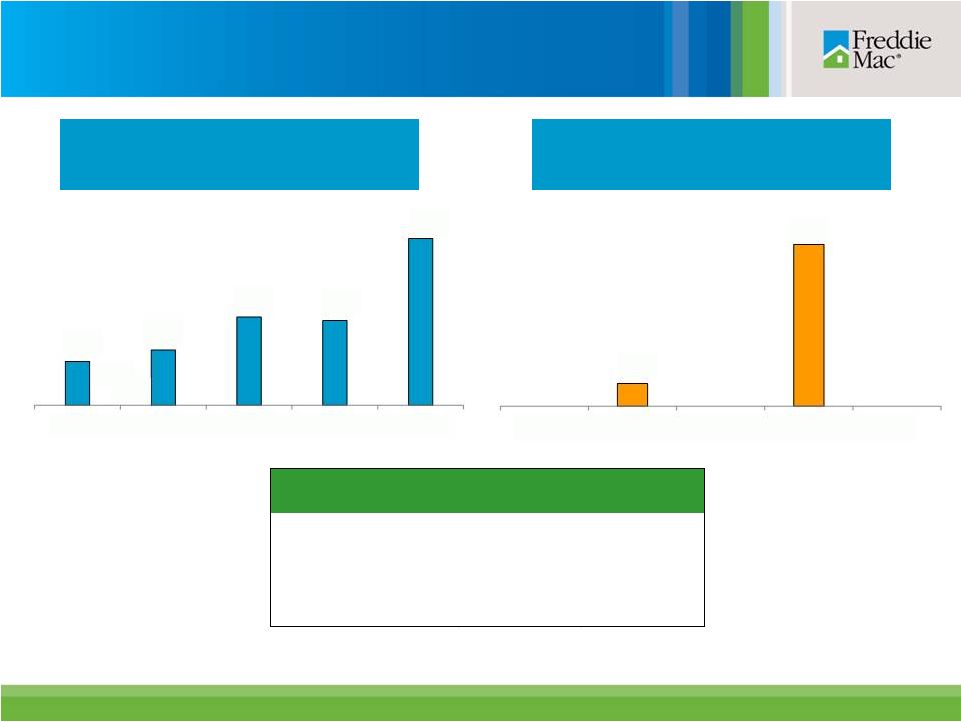
Single-family risk transfer transactions
1
Includes the first loss risk held by Freddie Mac.
Structured Agency Credit Risk
(STACR
®
)
Debt Note Issuances
$ Billions
Agency
Credit
Insurance
Structure
SM
(ACIS
SM
) Transactions
$ Millions
No
Transaction
No
Transaction
12
No
Transaction
$ Billions
YTD
2014
Cumulative
STACR Issuances
$3.9
$5.0
ACIS Transactions
$0.6
$0.6
Reference Pool UPB
1
$123.7
$181.7
$0.5
$0.6
$1.0
$1.0
$1.9
3Q13
4Q13
1Q14
2Q14
3Q14
$77.4
$553.9
3Q13
4Q13
1Q14
2Q14
3Q14
©
Freddie Mac |
 ©
Freddie Mac
Percent (%)
13
80
77
77
97
91
83
66
67
67
68
71
76
67
70
70
76
77
2009
2010
2011
2012
2013
YTD
2014
Relief refinance (includes HARP)
All other
Total purchases
738
747
744
740
727
712
757
758
759
762
756
748
756
755
755
756
749
744
2009
2010
2011
2012
2013
YTD
2014
Relief refinance (includes HARP)
All other
Total purchases
1
2
Weighted Average Original LTV Ratio
Weighted Average Credit Score
Credit score data is based on FICO scores at the time of loan origination or Freddie Mac’s
purchase and may not be indicative of the borrowers’ current creditworthiness. FICO
scores can range between approximately 300 to 850 points.
Original LTV ratios are calculated as the unpaid principal balance (UPB) of the mortgage Freddie Mac
guarantees including the credit-enhanced portion, divided by the lesser of the appraised
value of the property at the time of mortgage origination or the mortgage borrower’s purchase price. Second liens not owned or guaranteed by Freddie Mac are excluded
from the LTV ratio calculation. The existence of a second lien mortgage reduces the
borrower’s equity in the home and, therefore, can increase the risk of default.
1
2
Single-family credit quality - purchases |
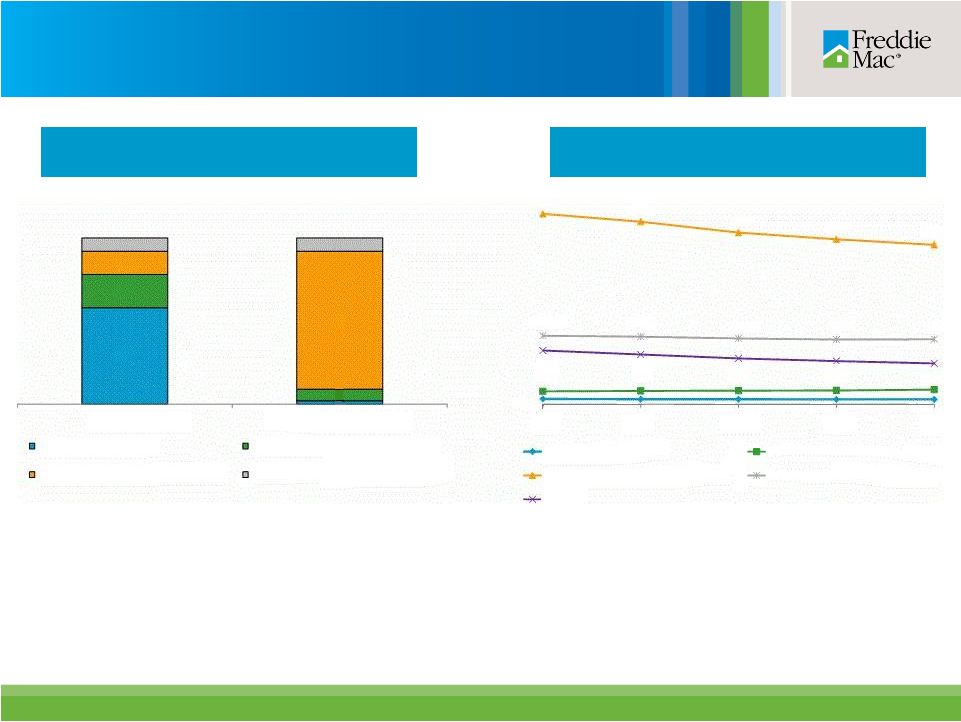 ©
Freddie Mac
1
Loans acquired after 2008. Excludes HARP and other relief refinance
loans. Concentration of Credit Risk
Percent (%) as of September 30, 2014
Serious Delinquency Rates
Percent (%)
14
58
20
14
83
8
8
% of Portfolio
% of Credit Losses
New
single-family book
HARP and other relief refinance loans
2005 -
2008 legacy single-family book
Pre-2005 legacy single-family book
0.25
0.62
0.64
0.65
0.66
0.70
9.15
8.77
8.25
7.93
7.66
3.29
3.24
3.16
3.11
3.12
2.58
2.39
2.20
2.07
1.96
3Q
2013
4Q
2013
1Q
2014
2Q
2014
3Q
2014
New
single-family
book
1
HARP and other relief refinance loans
2005 -
2008 legacy single-family book
Pre-2005 legacy single-family book
Total
0.24
0.24
0.23
0.23
2
7
Single-family credit quality – credit guarantee
portfolio
1 |
 ©
Freddie Mac
Single-family real estate owned
Property Inventory
3Q14 Activity
Historical Trend
Ending Property Inventory
(Number of Properties)
(Number of Properties)
15
36,134
29,344
8,648
(15,438)
06/30/14
Inventory
Acquisitions
Dispositions
09/30/14
Inventory
51k
36k
49k
48k
45k
47k
47k
44k
29k
3Q12
4Q12
1Q13
2Q13
3Q13
4Q13
1Q14
2Q14
3Q14 |
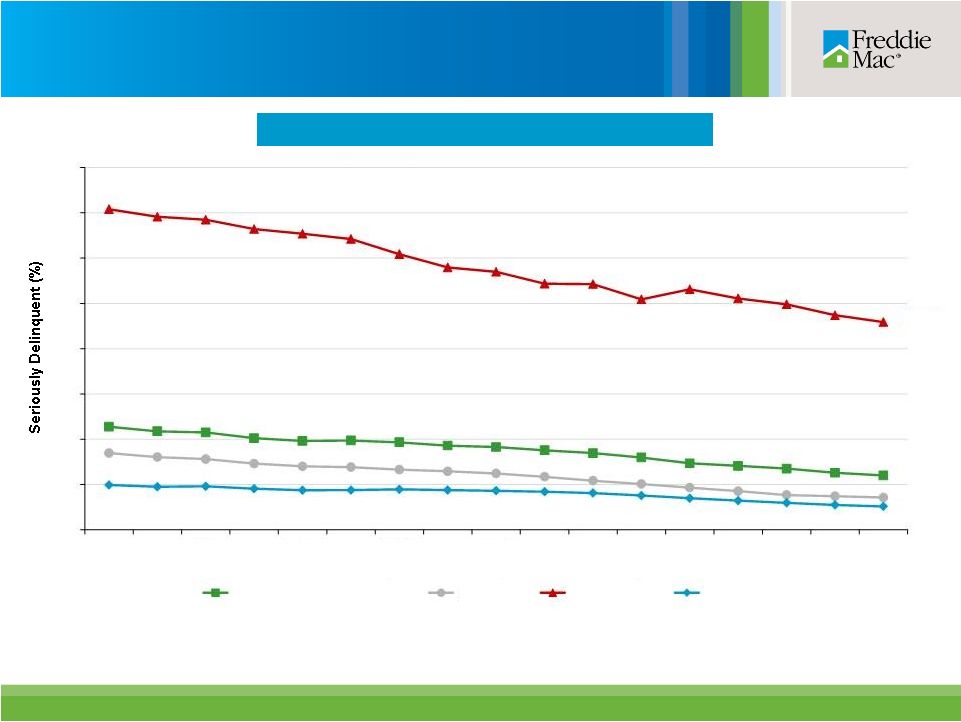 ©
Freddie Mac
1
Source: National Delinquency Survey from the Mortgage Bankers Association.
Categories represent first lien single-family loans. Data is not yet available for the third quarter of 2014.
2
Single-family Serious Delinquency Rates
Single-family mortgage market and Freddie Mac
delinquency rates
16
1
1
1
18.35%
4.80%
2.86%
2.07%
2
0
4
8
12
16
20
24
28
32
Jun-10
Dec-10
Jun-11
Dec-11
Jun-12
Dec-12
Jun-13
Dec-13
Jun-14
Total Mortgage Market
Prime
Subprime
Freddie Mac
See “MD&A – RISK MANAGEMENT – Credit Risk – Mortgage Credit Risk –
Single-Family Mortgage Credit Risk – Credit Performance – Delinquencies” in Freddie Mac’s Form 10-K
for the year ended December 31, 2013, for information about the company’s reported delinquency
rates. The single-family serious delinquency rate at September 30, 2014 was 1.96%. |
 ©
Freddie Mac
Total Multifamily Portfolio
UPB $ Billions
Multifamily business volume and portfolio
composition
Multifamily New Business Volume
$ Billions
1
Primarily K-Deals.
17
$5
$7
$3
$4
$7
3Q13
4Q13
1Q14
2Q14
3Q14
$167
$162
12/31/07
12/31/08
12/31/09
12/31/10
12/31/11
12/31/12
12/31/13
9/30/14
MF unsecuritized loan portfolio
MF investment securities portfolio
$180
$177
$169
$164
$135
$154
MF
guarantee
portfolio
1 |
 ©
Freddie Mac
K-Deal
Securitization
Volume
1
UPB $ Billions
Multifamily securitization volume
1
Represents the UPB of multifamily loans sold via Freddie Mac’s K Certificate
transactions. Note: Totals may not add due to rounding.
18
$2.1
$6.4
$13.7
$21.2
$28.0
$12.9
2009
2010
2011
2012
2013
YTD
2014
©
Freddie Mac
2009
2010
2011
2012
2013
YTD
2014
Total
Total UPB
1
$2.1
$6.4
$13.7
$21.2
$28.0
$12.9
$84.4
Transactions
2
6
12
17
19
11
67
Number of |
 Multifamily
mortgage
portfolio
attributes
1
Current Loan Size
$ Billions as of September 30, 2014
Year of Acquisition or Guarantee
$ Billions as of September 30, 2014
1
Based
on
the
unpaid
principal
balance
(UPB)
of
the
multifamily
mortgage
portfolio.
19
At September 30, 2014
UPB
$ Billions
Deliquency
Rate
Credit Enhanced
$79.5
0.03%
Non-Credit Enhanced
$55.7
0.02%
Total
$135.2
0.03%
$29.3
$11.6
$10.3
$10.3
$15.2
$23.0
$22.5
$13.0
2007
and
Prior
2008
2009
2010
2011
2012
2013
2014
$51.5
$74.6
$6.1
$2.8
$0.2
> $25M
> $5M &
<=$25M
> $3M &
<= $5M
> $750K &
<= $3M
<= $750K
©
Freddie Mac |
 ©
Freddie Mac
Multifamily market and Freddie Mac delinquency rates
Percent
1
1
20
0
2
4
6
8
10
12
14
2Q10
4Q10
2Q11
4Q11
2Q12
4Q12
2Q13
4Q13
2Q14
Freddie Mac (60+ day)
FDIC Insured Institutions (90+ day)
MF CMBS Market (60+ day)
ACLI Investment Bulletin (60+ day)
See “MD&A – RISK MANAGEMENT – Credit Risk – Mortgage Credit Risk –
Multifamily Mortgage Credit Risk ” in Freddie Mac’s Form 10-K for the year ended December 31, 2013,
for information about the company’s reported multifamily delinquency rate. The multifamily
delinquency rate at September 30, 2014 was 0.03%.
Source: Freddie Mac, FDIC Quarterly Banking Profile, TREPP (CMBS multifamily 60+ delinquency rate,
excluding REOs), American Council of Life Insurers (ACLI). Non-Freddie Mac data is
not yet available for the third quarter of 2014.
|
 ©
Freddie Mac
Mortgage-related investments portfolio ending balance
Mortgage-related investments portfolio limit
Indebtedness
1, 3
$ Billions
Mortgage Assets
1, 2
$ Billions
Indebtedness limit
Total debt outstanding
21
$461
$434
$420
$414
$553
$553
$553
$553
$470
12/31/13
03/31/14
06/30/14
09/30/14
12/31/14
$511
$458
$449
$440
$780
$663
$663
$663
$663
$564
12/31/13
03/31/14
06/30/14
09/30/14
12/31/14
01/01/15
©
Freddie Mac
1
2
3
The company’s Purchase Agreement with Treasury limits the amount of mortgage assets the company
can own and indebtedness it can incur. Under the Purchase Agreement, mortgage assets and
indebtedness are calculated without giving effect to the January 1, 2010 change in the accounting guidance related to the transfer of financial assets and
consolidation of variable interest entities (VIEs). See the company’s Annual Report on Form
10-K for the year ended December 31, 2013 for more information.
Represents the unpaid principal balance (UPB) of the company’s mortgage-related investments
portfolio. The company discloses its mortgage assets on this basis monthly in its Monthly
Volume Summary reports, which are available on its Web site and in Current Reports on Form 8-K filed with the Securities and Exchange Commission (SEC).
Represents the par value of the company’s unsecured short-term and long-term debt
securities issued to third parties to fund its business activities. The company discloses its
indebtedness on this basis monthly in its Monthly Volume Summary reports, which are available on its
Web site and in Current Reports on Form 8-K filed with the SEC. Investments – Purchase Agreement portfolio limits |
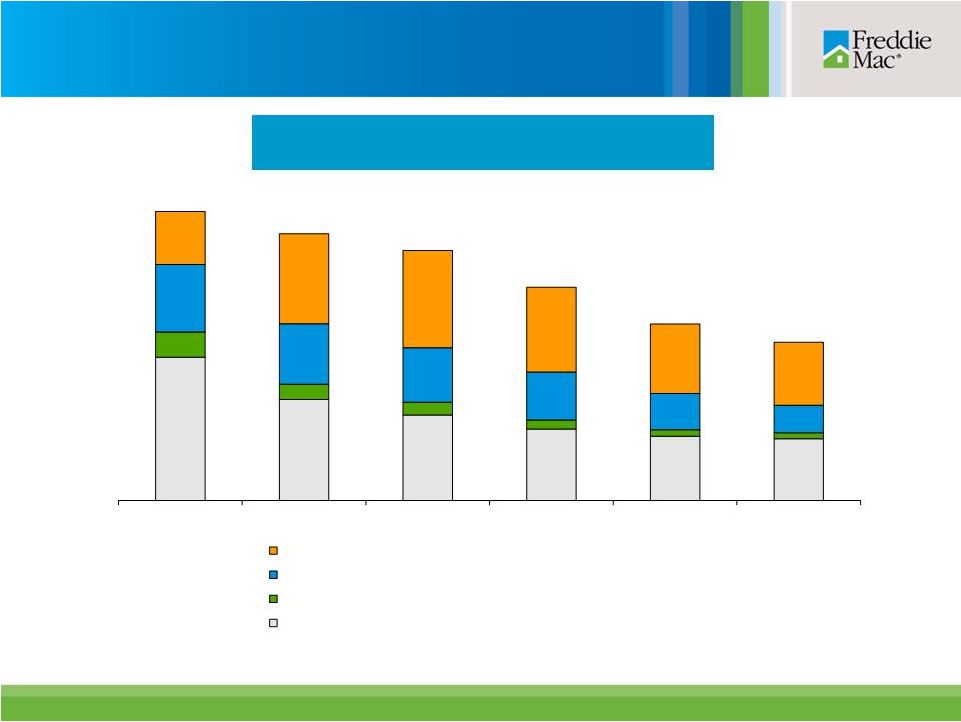 Mortgage-Related
Investments
Portfolio
1
$ Billions
2
$755
$697
$653
$558
$461
$414
22
12/31/09
12/31/10
12/31/11
12/31/12
12/31/13
9/30/14
Mortgage Loans
Non-Freddie Mac Mortgage-Related Securities (Non-Agency)
Non-Freddie Mac Mortgage-Related Securities (Agency)
Freddie Mac PCs and Structured Securities
©
Freddie Mac
Based on unpaid principal balances and excludes mortgage-related securities traded, but not yet
settled. The mortgage-related investments portfolio is determined without giving
effect to the January 1, 2010 change in accounting standards related to the transfer of financial
assets and consolidation of variable interest entities (VIEs).
Mortgage loans totaled $164.4 billion at September 30, 2014 of which $112.8 billion were
single-family and $51.7 billion were multifamily.
1
2
Investments – mortgage-related investments portfolio
composition
|
 ©
Freddie Mac
Safe Harbor Statements
23
Freddie Mac obligations
Freddie Mac’s securities are obligations of Freddie Mac only. The securities, including any
interest or return of discount on the securities, are not guaranteed by and are not debts or
obligations of the United States or any federal agency or instrumentality other than Freddie
Mac.
No offer or solicitation of securities
This presentation includes information related to, or referenced in the offering documentation for,
certain Freddie Mac securities, including offering circulars and related supplements and
agreements. Freddie Mac securities may not be eligible for offer or sale in certain
jurisdictions or to certain persons. This information is provided for your general information only,
is current only as of its specified date and does not constitute an offer to sell or a
solicitation of an offer to buy securities. The information does not constitute a sufficient basis for
making a decision with respect to the purchase or sale of any security. All information regarding or
relating to Freddie Mac securities is qualified in its entirety by the relevant offering
circular and any related supplements. Investors should review the relevant offering circular
and any related supplements before making a decision with respect to the purchase or sale of any
security. In addition, before purchasing any security, please consult your legal and financial
advisors for information about and analysis of the security, its risks and its suitability as
an investment in your particular circumstances.
Forward-looking statements
Freddie Mac's presentations may contain forward-looking statements, which may include statements
pertaining to the conservatorship, the company’s current expectations and objectives for
its single-family, multifamily and investment businesses, its loan workout initiatives and
other efforts to assist the U.S. residential mortgage market, liquidity, capital management, economic
and market conditions and trends, market share, the effect of legislative and regulatory
developments and new accounting guidance, credit quality of loans we guarantee, and results of
operations and financial condition on a GAAP, Segment Earnings and fair value basis. Forward-looking statements involve
known and unknown risks and uncertainties, some of which are beyond the company’s control.
Management’s expectations for the company’s future necessarily involve a number of
assumptions, judgments and estimates, and various factors, including changes in market
conditions, liquidity, mortgage spreads, credit outlook, actions by the U.S. government (including FHFA, Treasury and Congress),
and the impacts of legislation or regulations and new or amended accounting guidance, could cause
actual results to differ materially from these expectations. These assumptions, judgments,
estimates and factors are discussed in the company’s Annual Report on Form 10-K for
the year ended December 31, 2013, Quarterly Reports on Form 10-Q for the quarters ended March 31, 2014, June 30, 2014 and
September 30, 2014 and Current Reports on Form 8-K, which are available on the Investor Relations
page of the company’s Web site at www.FreddieMac.com/investors and the SEC’s Web
site at www.sec.gov. The company undertakes no obligation to update forward- looking
statements it makes to reflect events or circumstances occurring after the date of this presentation. |