Attached files
| file | filename |
|---|---|
| EX-23.1 - EX-23.1 - Continental Building Products, Inc. | d813943dex231.htm |
Table of Contents
As filed with the Securities and Exchange Commission on November 6, 2014
Registration No. 333-
UNITED STATES
SECURITIES AND EXCHANGE COMMISSION
WASHINGTON, D.C. 20549
FORM S-1
REGISTRATION STATEMENT
UNDER
THE SECURITIES ACT OF 1933
Continental Building Products, Inc.
(Exact name of registrant as specified in its charter)
| Delaware | 3270 | 61-7178923 | ||
| (State or other jurisdiction of incorporation or organization) |
(Primary Standard Industrial Classification Code Number) |
(I.R.S. Employer Identification Number) |
12950 Worldgate Drive, Suite 700
Herndon, VA 20170
(703) 480-3800
(Address, including zip code, and telephone number, including area code, of registrant’s principal executive offices)
Isaac Preston
Chief Executive Officer
Continental Building Products, Inc.
12950 Worldgate Drive, Suite 700
Herndon, VA 20170
(703) 480-3800
(Name, address, including zip code, and telephone number, including area code, of agent for service)
Copies to:
| Jeffrey A. Chapman Peter W. Wardle Gibson, Dunn & Crutcher LLP 2100 McKinney Ave., Suite 1100 Dallas, TX 75201 tel: (214) 698-3100 fax: (214) 571-2900 |
Douglass M. Rayburn Samantha H. Crispin Baker Botts L.L.P. 2001 Ross Avenue, Suite 600 Dallas, TX 75201 tel: (214) 953-6500 fax: (214) 953-6503 |
Approximate date of commencement of proposed sale to the public: As soon as practicable after the effective date of this registration statement.
If any of the securities being registered on this Form are to be offered on a delayed or continuous basis pursuant to Rule 415 under the Securities Act of 1933, check the following box. ¨
If this Form is filed to register additional securities for an offering pursuant to Rule 462(b) under the Securities Act, please check the following box and list the Securities Act registration statement number of the earlier effective registration statement for the same offering. ¨
If this Form is a post-effective amendment filed pursuant to Rule 462(c) under the Securities Act, check the following box and list the Securities Act registration statement number of the earlier effective registration statement for the same offering. ¨
If this Form is a post-effective amendment filed pursuant to Rule 462(d) under the Securities Act, check the following box and list the Securities Act registration statement number of the earlier effective registration statement for the same offering. ¨
Indicate by check mark whether the registrant is a large accelerated filer, an accelerated filer, a non-accelerated filer, or a smaller reporting company. See the definitions of “large accelerated filer,” “accelerated filer” and “smaller reporting company” in Rule 12b-2 of the Exchange Act.
| Large accelerated filer | ¨ | Accelerated filer | ¨ | |||
| Non-accelerated filer | x (Do not check if a smaller reporting company) | Smaller reporting company | ¨ |
CALCULATION OF REGISTRATION FEE
|
| ||||||||
| Title of Each Class of Securities to be Registered |
Amount to be Registered(1) |
Proposed Maximum Per Unit(2) |
Proposed Maximum Aggregate Offering Price(1)(2) |
Amount of Registration Fee | ||||
| Common Stock, $0.001 par value per share |
8,050,000 | $14.44 | $116,242,000 | $13,508 | ||||
|
| ||||||||
|
| ||||||||
| (1) | Includes 1,050,000 shares that the underwriters have the option to purchase. See “Underwriting.” |
| (2) | Estimated solely for the purpose of calculating the registration fee under Rule 457(c) of the Securities Act of 1933, as amended, based on the average of the high and low prices of a share of common stock on the New York Stock Exchange on October 31, 2014, which was $14.44. |
The Registrant hereby amends this Registration Statement on such date or dates as may be necessary to delay its effective date until the Registrant shall file a further amendment which specifically states that this Registration Statement shall thereafter become effective in accordance with Section 8(a) of the Securities Act of 1933 or until the Registration Statement shall become effective on such date as the Commission, acting pursuant to said Section 8(a), may determine.
Table of Contents
The information in this prospectus is not complete and may be changed. The selling stockholder may not sell these securities until the registration statement filed with the Securities and Exchange Commission is effective. This preliminary prospectus is not an offer to sell these securities and it is not soliciting an offer to buy these securities in any jurisdiction where the offer or sale is not permitted.
SUBJECT TO COMPLETION, DATED November 6, 2014
7,000,000 Shares
Continental Building Products, Inc.
Common Stock
$ per share
The selling stockholder identified in this prospectus is offering 7,000,000 shares of our common stock. We will not receive any proceeds from the sale of shares by the selling stockholder.
The selling stockholder has granted to the underwriters an option to purchase up to 1,050,000 additional shares of common stock.
Our common stock is listed on the on the New York Stock Exchange under the symbol “CBPX.”
We are an “emerging growth company” as the term is used in the Jumpstart Our Business Startups Act of 2012 and, as such, have elected to comply with certain reduced public company reporting requirements.
On November 5, 2014, the last reported sales price of a share of our common stock on the New York Stock Exchange was $16.91.
Investing in our common stock involves risks. See “Risk Factors” beginning on page 16 to read about factors you should consider before buying shares of our common stock.
Neither the Securities and Exchange Commission nor any state securities commission has approved or disapproved of these securities or determined if this prospectus is truthful or complete. Any representation to the contrary is a criminal offense.
| Per Share | Total | |||||||
| Public offering price |
$ | $ | ||||||
| Underwriting discounts and commissions(1) |
$ | $ | ||||||
| Proceeds to selling stockholder (before expenses) |
$ | $ | ||||||
| (1) | Please read “Underwriting” for a description of all underwriting compensation payable in connection with this offering. |
The underwriters expect to deliver the shares to purchasers on or about , 2014 through the book-entry facilities of The Depository Trust Company.
| Citigroup | Credit Suisse | RBC Capital Markets |
| Barclays | Deutsche Bank Securities |
, 2014
Table of Contents
Table of Contents
| Page | ||||
| 1 | ||||
| 11 | ||||
| SUMMARY HISTORICAL AND UNAUDITED PRO FORMA COMBINED FINANCIAL INFORMATION |
12 | |||
| 16 | ||||
| 32 | ||||
| 34 | ||||
| 35 | ||||
| 36 | ||||
| 37 | ||||
| 38 | ||||
| MANAGEMENT’S DISCUSSION AND ANALYSIS OF FINANCIAL CONDITION AND RESULTS OF OPERATIONS |
47 | |||
| 66 | ||||
| 81 | ||||
| 88 | ||||
| 99 | ||||
| 101 | ||||
| 103 | ||||
| 108 | ||||
| MATERIAL U.S. FEDERAL TAX CONSIDERATIONS FOR NON-U.S. HOLDERS |
111 | |||
| 116 | ||||
| 122 | ||||
| 122 | ||||
| 122 | ||||
| F-1 | ||||
We are responsible for the information contained in this prospectus and in any free-writing prospectus we prepare or authorize. We have not authorized anyone to provide you with different information, and we take no responsibility for any other information others may give you. The selling stockholder is not, and the underwriters are not, making an offer to sell these shares in any jurisdiction where the offer or sale is not permitted. You should not assume that the information contained in this prospectus is accurate as of any date other than its date.
i
Table of Contents
INDUSTRY AND MARKET DATA
We use market data and industry forecasts throughout this prospectus and, in particular, in the sections entitled “Prospectus Summary” and “Business.” Unless otherwise indicated, statements in this prospectus concerning our industry and the markets in which we operate, including our general expectations, competitive position, business opportunity and market size, growth and share, are based on information obtained from periodic industry publications, government surveys, including from the U.S. Census Bureau, and other third-party sources such as reports published by the Gypsum Association.
Management estimates are derived from the information and data referred to above, as well as our internal research, calculations and assumptions made by us based on our analysis of such information and data and our knowledge of our industry and markets, which we believe to be reasonable, although they have not been independently verified. While we believe that the market position information included in this prospectus is generally reliable, such information is inherently imprecise. Assumptions, expectations and estimates of our future performance and the future performance of the industry in which we operate are necessarily subject to a high degree of uncertainty and risk due to a variety of factors, including those described in “Risk Factors” and “Forward-Looking Statements.” These and other factors could cause results to differ materially from those expressed in the estimates made by the independent parties and by us.
ii
Table of Contents
The following is a summary of material information discussed in this prospectus. The summary is not complete and does not contain all of the information that you should consider before investing in our common stock. You should read this entire prospectus carefully, including the risks discussed under the section entitled “Risk Factors” and our financial statements and the related notes included elsewhere in this prospectus, before making an investment decision to purchase shares of our common stock. Some of the statements in this summary constitute forward-looking statements. See “Forward-Looking Statements.”
On August 30, 2013, substantially all of the assets and liabilities related to our business were acquired from Lafarge North America Inc., or Lafarge, which we refer to as the Acquisition. Prior to the Acquisition, we operated as the gypsum division of Lafarge. See “Business—The Acquisition.” Unless otherwise specified, references in this prospectus to “our,” “we,” “us,” the “Company” and “our business” (i) for periods prior to the completion of the Acquisition, refer to the gypsum division of Lafarge and (ii) for periods after completion of the Acquisition refer to Continental Building Products, Inc., in each case together with its consolidated subsidiaries. We are a holding company controlled by Lone Star Fund VIII (U.S.), L.P. and have a relatively short operating history as a stand-alone company.
All amounts in this prospectus are expressed in U.S. dollars and the financial statements have been prepared in accordance with generally accepted accounting principles in the United States, or GAAP.
Our Company
We are a leading, high margin manufacturer of gypsum wallboard and complementary finishing products. Our manufacturing facilities and sales efforts are concentrated in the eastern United States and eastern Canada. Gypsum wallboard is a primary building material used in new residential and commercial construction and in repair and remodel, or R&R. We estimate that in 2013 our market share in the United States east of the Mississippi River, a market which accounted for more than 55% of total U.S. wallboard demand, was approximately 17%, and our share is significantly higher in many of the major metropolitan areas within a shipping radius of 300 miles of our facilities, which include New York, Miami, Tampa, Orlando, Cincinnati, Cleveland, Columbus, Indianapolis, Nashville, Jacksonville and Hartford. For the fiscal year ended December 31, 2013, on a pro forma basis, we had net sales of $402.3 million, operating income of $29.8 million and Adjusted EBITDA of $102.6 million. For the nine months ended September 30, 2014, we had net sales of $303.7 million, operating income of $39.3 million and Adjusted EBITDA of $80.6 million, which represented an increase of 10.6% in Adjusted EBITDA compared to the nine months ended September 30, 2013 on a pro forma basis. See “Summary Historical and Unaudited Pro Forma Combined Financial Information” for how we define and calculate Adjusted EBITDA as a non-GAAP measure, a reconciliation thereof to operating income and a description of why we believe this measure is important.
We operate highly efficient and automated manufacturing facilities in Silver Grove (Kentucky), Palatka (Florida) and Buchanan (New York) that produce a full range of gypsum wallboard products for our diversified customer base. We are committed to operational excellence and have invested heavily in our facilities, which we believe are among the newest, largest and most efficient wallboard plants in North America. Our facilities have significant available capacity that will allow us to scale production in a cost-effective manner as wallboard demand increases. We use only synthetic gypsum in our products, which we believe enhances our manufacturing quality and consistency, reduces production costs and provides important environmental benefits relative to natural gypsum. We are the only producer of gypsum wallboard in the United States to use 100% synthetic gypsum. Our strategically positioned plants provide us with two key benefits: cost-effective access to our supplies of synthetic gypsum, which reduces our inbound transportation costs, and close proximity to many major metropolitan areas, which decreases our product delivery costs.
1
Table of Contents
We offer our customers a full range of gypsum wallboard products, including LiftLite®, our lightweight product designed to be easier to lift and install, our Mold Defense® line of products designed for enhanced protection against mold and mildew, and our Weather Defense® line of moisture and mold-resistant exterior sheathing. To complement our wallboard business and to better serve our customers, we also operate a finishing products business that manufactures a comprehensive line of joint compounds at our plant in Silver Grove (Kentucky) and our joint compound plant in Chambly (Quebec). We provide superior customer service by developing new products based on customer needs, consistently delivering high quality finished product and providing orders accurately with fast delivery times.
Our Industry
The North American gypsum wallboard industry is the largest in the world, with the world’s highest per capita consumption rate. Gypsum wallboard is a low cost, widely used building product for interior and exterior walls and ceilings in residential and commercial structures. It is highly regarded for its ease and speed of application and its superior performance in providing comfort, fire resistance and thermal and sound insulation. The primary raw material used to manufacture wallboard, gypsum, can be either natural or synthetic. Natural gypsum is a mineral mined in select areas throughout North America. Synthetic gypsum is sourced primarily via flue gas desulfurization within coal-fired power plants. According to the Gypsum Association, use of synthetic gypsum has increased from 5% of total wallboard production in 1995 to 45% in 2013. We currently use exclusively synthetic gypsum in our manufacturing process.
There are currently seven gypsum wallboard manufacturers in the United States, including us, of which we believe only six compete in the eastern United States. Gypsum wallboard has a high weight-to-value ratio, so it is advantageous to both source raw materials and produce gypsum wallboard in close proximity to where it is used. If manufacturing facilities are not located in close proximity to end markets, transportation costs can render the cost of finished goods uncompetitive compared to locally manufactured wallboard. Accordingly, competition in the industry occurs principally on a regional basis, and we believe that national scale has limited benefits. Each competitive geographic region has a different group of manufacturers and customers and, as a result, a different competitive landscape.
Although gypsum wallboard remains a regional industry, consolidation in the industry has resulted in increased market share for certain industry participants, including us. In 1997 there were thirteen gypsum wallboard producers, compared to seven in 2014. This consolidation has occurred almost entirely amongst the smaller producers. Since 1997, our national market share has grown from 3% to 10%.
New housing starts have been the most significant driver of North American wallboard demand. Starting in 2007, the North American wallboard industry suffered a dramatic decrease in demand, driven primarily by the significant downturn of the North American housing market and the associated credit crisis and global recession. U.S. housing starts fell from a cyclical peak of 2.1 million in 2005 to a 50-year low of 554,000 in 2009. Correspondingly, U.S. wallboard consumption declined by more than 50% from 36.2 billion square feet, or bsf, in 2005 to a low of 17.1 bsf in 2010. Pricing across the industry suffered over this period due to the decline in demand.
2
Table of Contents
The following chart shows historical U.S. wallboard consumption and U.S. housing starts:
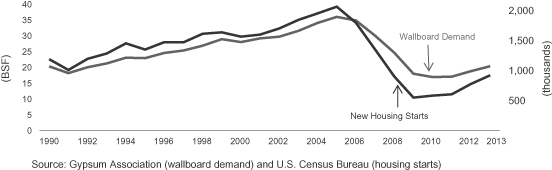
The U.S. housing market is in the early stages of a recovery. U.S. housing starts reached 0.93 million in 2013, driving U.S. wallboard consumption to 20.5 bsf. In 2014, the positive trend in housing starts has continued, with September year-to-date housing starts up 9% year-over-year to 0.76 million as of September 30, 2014, according to the U.S. Census Bureau.
The graph below shows long-term annual U.S. housing starts:

| Housing Starts |
Units (000) |
2013 |
Unit Difference |
Percentage Difference |
||||||||||||
|
Peak(1) |
2,357 | 925 | 1,432 | 155 | % | |||||||||||
| Long-Term Average(2) |
1,458 | 925 | 533 | 58 | % | |||||||||||
| Average Cyclical Low(3) |
1,131 | 925 | 206 | 22 | % | |||||||||||
Source: U.S. Census Bureau.
| (1) | Peak occurred in 1972. |
| (2) | Average housing starts from 1959 through 2013. |
| (3) | Taken as the average of the 1960, 1966, 1975, 1982 and 1991 housing starts. |
We believe that there is substantial room for continued improvement in housing starts. Housing starts have averaged 1.5 million over the past 50 years, which is approximately 58% greater than the 2013 starts of 925,000.
3
Table of Contents
Wallboard consumption has historically correlated closely with increased construction activity, typically trailing housing starts by approximately six to nine months. As housing starts return to normal levels, we expect a corresponding increase in wallboard demand.
Industry trends within our regions are particularly favorable. In the nine-month period ended September 30, 2014, building permits within our key markets grew 11% over the nine-month period ended September 30, 2013, versus 5.7% growth in the rest of the U.S., according to the U.S. Census Bureau.
The table below shows building permits by metropolitan statistical area, or MSA, in some of the key markets in which we operate, which key markets accounted for more than one-quarter of our total U.S. revenues for both the nine months ended September 30, 2014 and the fiscal year ended December 31, 2013:
| Building Permits | Growth | |||||||||||
| Continental BP Key MSA’s (all data in thousands) |
YTD 2013(1) |
YTD 2014(1) |
YoY | |||||||||
| Atlanta |
18.4 | 19.3 | 4.4 | % | ||||||||
| Chicago |
9.3 | 11.5 | 24.6 | |||||||||
| Cincinnati |
3.6 | 4.0 | 12.9 | |||||||||
| Columbus |
6.3 | 5.4 | (13.7 | ) | ||||||||
| Fort Myers |
2.3 | 3.2 | 39.7 | |||||||||
| Indianapolis |
5.5 | 6.3 | 15.5 | |||||||||
| Jacksonville |
5.5 | 6.0 | 8.6 | |||||||||
| Louisville |
2.8 | 3.3 | 19.2 | |||||||||
| Miami |
15.2 | 11.6 | (23.5 | ) | ||||||||
| Nashville |
8.3 | 9.9 | 20.3 | |||||||||
| NYC / No. NJ / Long Island |
28.0 | 36.9 | 32.0 | |||||||||
| Orlando |
12.1 | 12.6 | 3.8 | |||||||||
| Philadelphia |
8.4 | 9.4 | 12.5 | |||||||||
| Southern Michigan(2) |
6.6 | 7.5 | 13.1 | |||||||||
| Tampa |
9.3 | 9.9 | 6.5 | |||||||||
|
|
|
|
|
|
|
|||||||
| Total for all Continental BP regions |
141.5 | 157.0 | 11.0 | % | ||||||||
| Total for United States |
733.5 | 782.6 | 6.7 | |||||||||
| Total for United States ex Continental BP Regions |
592.0 | 625.6 | 5.7 | |||||||||
Source: U.S. Census Bureau
| (1) | Year-to-date through September. |
| (2) | Southern Michigan includes Detroit, Grand Rapids, and Lansing MSA’s. |
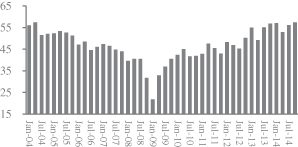
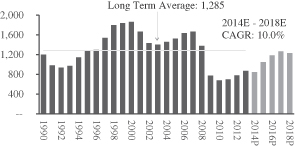
We also expect continued recovery in the repair and remodel market and improvement in the commercial construction market. The Remodeling Market Index from the National Association of Home Builders, or RMI, is based on a quarterly survey of about 2,000 residential remodelers nationwide and measures current market demand for remodeling as compared to three months prior as well as projected future market demand for remodeling, based on calls for bids, committed work for the next three months, backlog of remodeling projects and other factors. Results are seasonally adjusted. An increase in the RMI indicates that residential remodelers view remodeling conditions as more positive than in the previous quarter. The RMI has increased 163% from the trough in the fourth quarter of 2008 to the third quarter of 2014. Studies indicate that, in the residential segment, homeowners tend to spend more on remodeling projects when they first move into a home. Therefore, we believe the generally rising levels of existing home sales and home resale values over the past several years have contributed to rising levels of demand for wallboard. Additionally, according to data from McGraw Hill Construction, commercial construction square footage levels for 2013 were still near trough levels and 32% lower than the average of 1.3 billion square feet since 1990, leaving room for future growth. The data from
4
Table of Contents
McGraw Hill Construction also indicates commercial construction square footage is expected to grow at a compounded annual growth rate of 10% from 2014 to 2018.
| Quarterly Residential Remodeling Index (RMI Index Scale) |
Yearly Commercial Construction Square Footage (millions of Square Feet) | |
|
| |
| Source: National Association of Homebuilders. |
Source: McGraw Hill Construction. | |
Our Strengths
Leadership Positions in Attractive Geographic Markets
We estimate that in 2013 our market share in the eastern United States, a market which accounted for more than 55% of total U.S. wallboard demand, was approximately 17%. Importantly, our share is significantly higher in many of our primary metropolitan markets, including markets located in Florida, Georgia, the New York tri-state area, Michigan and Kentucky.
Our market leadership positions will enable us to take advantage of increased demand for gypsum wallboard associated with a recovery in the U.S. residential housing market. Annual housing starts were 0.78 million in 2012 and 0.93 million in 2013, a 19% increase on a year-over-year basis. Furthermore, the markets in which we operate have recovered particularly favorably versus the rest of the U.S. For the period ended September 30, 2014, building permits within our key markets grew 11% compared to the period ended September 30, 2013, while the growth rate over that period in the rest of the U.S. was 5.7%, according to the U.S. Census Bureau. Notwithstanding this growth, we believe gypsum wallboard demand will continue to grow significantly in the coming years, as the U.S. housing market is still at relatively low levels compared to most recent historical housing cycles, and starts would need to grow by approximately 58% from the 2013 level to achieve the 50-year average of 1.5 million.
Strong Margin Profile and Cash Flow Generation
We believe our strong margins and cash flow generation are attributable to our highly efficient, low cost manufacturing plants, attractive location of those plants relative to our customers and our sources of raw materials and management’s continuous focus on maximizing operating efficiencies. Our net sales have grown from $287.9 million for the nine months ended September 30, 2013 on a pro forma basis to $303.7 million for the nine months ended September 30, 2014. For the same periods, our Adjusted EBITDA grew from $72.9 million to $80.6 million, and our operating income improved from $14.0 million to $39.3 million. On a full year basis, our net sales have grown from $311.4 million for the year ended December 31, 2012 to $402.3 million for the year ended December 31, 2013 on a pro forma basis. For the same periods, on a pro forma basis, our Adjusted EBITDA grew from $40.7 million to $102.6 million, and our operating income improved from a loss of $45.4
5
Table of Contents
million to a gain of $29.8 million. See “Summary Historical and Unaudited Pro Forma Combined Financial Information” for how we define and calculate Adjusted EBITDA as a non-GAAP measure, a reconciliation thereof to operating income and a description of why we believe this measure is important.
For the nine months ended September 30, 2014, we generated an Adjusted EBITDA margin of 26.5%, representing an increase of 1.2 percentage points compared to the nine months ended September 30, 2013 on a pro forma basis and for the year ended December 31, 2013 we generated an Adjusted EBITDA margin of 25.5%, representing an increase of 12.4 percentage points compared to the year ended December 31, 2012 on a pro forma basis. Our operational excellence and rigorous focus on cost reduction between 2007 and 2014 has resulted in a fundamentally improved cost structure, which we believe has led to our Adjusted EBITDA margins being among the highest margins in the building products industry as a whole. Management uses Adjusted EBITDA for purposes of evaluating the Company’s performance. We have a lower cost structure today because we rationalized older, higher cost facilities and reduced our selling, general and administrative expense by reducing headcount. Further, our current facilities are new and modern and have lower costs due to greater fuel efficiency and faster lines speeds. We believe that our Adjusted EBITDA margins will continue to improve as the demand for gypsum wallboard grows and we capitalize on our significant operating leverage. We announced a 20% price increase to our customers beginning in January 2015, and certain other wallboard manufacturers in the United States also announced price increases for 2015. We believe these factors, along with capital expenditures that were 2.0% of net sales for the nine months ended September 30, 2014, will allow us to generate significant cash flow going forward. See “—Summary Historical and Unaudited Pro Forma Combined Financial Information” for how we define and calculate Adjusted EBITDA margin as a non-GAAP measure and a description of why we believe this measure is important.
Scalable Low-Cost Production
We have made over $550 million in capital investments to build our Silver Grove and Palatka plants, rebuild our Buchanan plant and make ongoing operational improvements at each of these plants. We believe that our wallboard facilities are among the largest and most modern in North America, resulting in productivity levels among the highest in the industry, and that our Silver Grove plant is the largest wallboard facility in North America. Our plant utilization rate was approximately 58% in 2012, increased to approximately 62% in 2013, and was approximately 64% for the nine months ended September 30, 2014. Due to these recent investments and our cost efficient capacity, we expect to scale production to meet increasing demand with only a modest level of incremental capital expenditures.
Our wallboard plants use only synthetic gypsum produced by power plants located near our facilities, which provides cost-effective access to one of our key raw materials. We believe our sources of synthetic gypsum provide us with a competitive advantage over plants using natural gypsum or other sources of lower quality synthetic gypsum. In comparison to natural gypsum, synthetic gypsum generally reduces production costs, provides environmental benefits and enhances manufacturing quality and consistency due to its higher purity, better binding properties and fewer required additives needed to improve overall quality of wallboard. We are the only producer of gypsum wallboard in the United States to use exclusively synthetic gypsum. We have entered into long-term agreements to purchase synthetic gypsum from a number of power plants located near our facilities, which lowers our costs because of reduced shipping distances. These synthetic gypsum suppliers provide us with amounts in excess of our current requirements, which allows for significant scalability in our wallboard production.
Strategically Situated Plants Near Both Our Primary Markets and Raw Materials
Our wallboard facilities are located in close proximity to major metropolitan areas in the eastern United States and eastern Canada, lowering both our inbound and outbound transportation costs and facilitating timely
6
Table of Contents
delivery to our customers. Each of our facilities allows us to offer same-day delivery service to many of our key metropolitan markets, including our Buchanan plant, which provides same day delivery service to customers in the New York City tri-state area and is the closest wallboard facility to Manhattan, which management believes provides us with a competitive advantage.
Our plants use exclusively synthetic gypsum produced by power plants located near our facilities, which provides cost-effective access to one of our key raw materials. We believe that this provides us with a competitive advantage over plants using natural gypsum. Because natural gypsum is typically not mined near population centers, plants using natural gypsum generally incur higher transportation costs to obtain their natural gypsum supplies or have higher product delivery costs because they are located farther from end markets.
Full Range of High-Quality Wallboard Products
We offer a full range of gypsum wallboard products, which are available with a variety of value-added enhancements for specific applications, such as moisture and mold resistance. We believe that our broad product range makes us an attractive supplier to our customers. Certain customers and markets have also favored the use of synthetic gypsum products, which we manufacture, versus natural gypsum products for the additional benefit of receiving Leadership in Energy and Environmental Design, or LEED, ratings to support environmentally responsible initiatives.
We believe our industry experience, manufacturing expertise and flexible production facilities enable us to quickly develop and implement new products in response to market needs or competitor product introductions, as evidenced by the fact that 54% of our net sales in 2013 on a pro forma basis came from products developed in the last five years. For example, in 2011 we introduced LiftLite®, a lightweight wallboard for use on interior walls and ceilings. It is formulated to be up to approximately 20% lighter than standard 1/2” wallboard, making it easier to lift, carry and install. We designed LiftLite® in a relatively short period of time with only a limited investment, and it has replaced most of our standard 1/2” wallboard.
Track Record of High-Quality Customer Service to Our Diverse Customer Base
We regularly achieve high rankings in customer service surveys and have received numerous “supplier of the year” awards from major customers. We consistently provide a high level of service to our customers through a combination of product availability and quality, on-time delivery, and timely and accurate invoicing. We sell our products through several different channels and to a broad group of customers, including gypsum wallboard distributors, buying groups, wholesalers and mass merchants. Our largest customer represented 14%, 15% and 12% of our net sales in 2013 on a pro forma basis, 2012 and 2011, respectively, and no other customer represented more than 10% of sales.
Our Strategy
Capitalize on Growth Opportunities Related to the Construction Recovery
We believe that we hold leading market positions in many of the major metropolitan areas near our facilities. We are well positioned to capitalize on the recovery in the U.S. housing market. New housing starts have traditionally been the most significant driver of wallboard demand and we expect a strong increase in wallboard demand as housing starts return to more normalized levels. We intend to take advantage of our market leadership and our scalable low-cost production capacity to increase sales and expand margins as market conditions continue to improve.
We also expect that we will benefit from continued growth in R&R, from which we are already seeing significant increased demand, and the expected recovery in new commercial construction. We believe there is
7
Table of Contents
momentum in R&R as the Remodeling Market Index has increased 163% in the past five years, according to the National Association of Home Builders. Moreover, commercial construction starts are expected to grow 10% compounded annually from 2014 to 2018, according to data from McGraw Hill Construction.
Utilize Our Significant Operating Leverage to Deliver Strong Cash Flows
One of our primary objectives is maximizing growth in cash flows. As a result of more than $550 million of investments we have made in our facilities and our ongoing rigorous cost management, we expect to experience limited incremental fixed costs as our production increases. We currently have significant additional capacity at our plants, which were operating at a 62% utilization rate in 2013 and a 64% utilization rate in the first three quarters of 2014. As the residential and commercial construction markets improve, we intend to capitalize on our operating leverage to expand our margins and cash flows. Our past investments enable us to maintain a high level of operating productivity with only a modest level of capital expenditures, which represented only 2.0% of sales during the nine months ended September 30, 2014, a level we believe to be indicative of our capital needs over the medium-term.
Maintain Strong Commitment to Operational Excellence
Our management is committed to operational excellence throughout our operations, both on the manufacturing side and in customer-facing functions. Over the last decade we have transformed our asset base and built three highly automated, high capacity wallboard facilities that we believe are among the most modern and efficient in North America. As a result, we have one of the lowest cost bases in the industry and significant available capacity. Our management is constantly measuring our performance to improve our operational excellence based on various metrics throughout the organization, including on-time customer delivery, sales force productivity, product quality and back office reliability targets.
We are similarly focused on superior customer service. We seek to offer our customers a broad range of high-quality gypsum wallboard products. Our industry experience, manufacturing expertise and flexible production facilities enable us to quickly develop and implement new products in response to market needs or product introductions by our competitors. We are focused on building and maintaining strong customer relationships based on product quality and availability, value, just-in-time delivery and prompt and accurate order processing and billing.
Evaluate Strategic Opportunities
Despite the challenging market conditions associated with the housing downturn, we have increased our commitment to the industry and made major investments in our facilities, which has contributed to our enhanced competitive position and market share. Since the mid-1990s, the building materials industry has undergone consolidation as manufacturers have sought to achieve greater cost savings and distribution efficiencies. We believe our market leadership, scale, operating efficiency, and strong cash generation position us well to participate in acquisitions and pursue other strategic opportunities both in the gypsum wallboard market and in adjacent markets within the building materials industry.
Our Sponsor
In July 2013, Lone Star Fund VIII (U.S.), L.P., which we refer to in this prospectus, along with its affiliates and associates (excluding us and other companies that it owns as a result of its investment activity), as Lone Star, or our sponsor, formed the Company and its subsidiaries for the purpose of acquiring substantially all of the assets comprising Lafarge’s North American gypsum business in the Acquisition. Lone Star is part of a leading
8
Table of Contents
private equity firm that, since the establishment of its first fund in 1995, has organized 13 private equity funds with aggregate capital commitments totaling over $52 billion. The funds are structured as closed-end, private-equity limited partnerships, the limited partners of which include corporate and public pension funds, sovereign wealth funds, university endowments, foundations, funds of funds and high net worth individuals. Immediately prior to this offering, Lone Star owned 30,539,250 shares, or 69.3%, of our outstanding common stock, and it will own approximately 53.4% of our common stock immediately following consummation of this offering, assuming no exercise of the underwriters’ option to purchase additional shares of common stock.
Risks Affecting Our Business
Our business is subject to numerous risks and uncertainties, including, but not limited to, those arising from:
| • | cyclicality in our markets, especially the new residential construction market; |
| • | the highly competitive nature of our industry and the substitutability of competitors’ products; |
| • | disruptions in our supply of synthetic gypsum due to regulatory changes or coal-fired power plants ceasing or reducing operations or switching to natural gas; |
| • | changes to environmental and safety laws and regulations requiring modifications to our manufacturing systems; |
| • | potential losses of customers; |
| • | disruptions at our manufacturing facilities or at our suppliers’ facilities; |
| • | disruptions to our supply of paperboard liner; |
| • | increases in energy and transportation costs; |
| • | our involvement in legal and regulatory proceedings; |
| • | our ability to attract and retain key management employees; |
| • | disruptions in our information technology systems; |
| • | labor disruptions; and |
| • | the seasonal nature of our business. |
You should carefully consider all of the information set forth in this prospectus and, in particular, the information under the heading entitled “Risk Factors” beginning on page 16 of this prospectus prior to making an investment in our common stock. These risks, together with the other risks identified under “Risk Factors,” could prevent us from successfully executing our strategies and could result in a material adverse effect on our business, prospects, financial condition, cash flows and results of operations.
Implications of Being an Emerging Growth Company
We qualify as an “emerging growth company” under the Jumpstart Our Business Startups Act of 2012, or the JOBS Act. As a result, we are permitted to, and intend to, rely on exemptions from certain disclosure requirements that are applicable to other public companies that are not emerging growth companies. Accordingly, we have included detailed compensation information for only our three most highly compensated executive officers and have not included a compensation discussion and analysis of our executive compensation programs in this prospectus.
In addition, for so long as we are an emerging growth company, we will not be required to:
| • | have an auditor report on our internal controls over financial reporting pursuant to Section 404(b) of the Sarbanes-Oxley Act of 2002, or the Sarbanes-Oxley Act; |
9
Table of Contents
| • | comply with any requirement that may be adopted by the Public Company Accounting Oversight Board (United States) regarding mandatory audit firm rotation or a supplement to the auditor’s report providing additional information about the audit and the financial statements (i.e., an auditor discussion and analysis); |
| • | submit certain executive compensation matters to shareholder advisory votes, such as “say-on-pay,” “say-on-frequency” and “say-on-golden parachutes” votes; and |
| • | disclose certain executive compensation-related items such as the correlation between executive compensation and performance and comparisons of the chief executive officer’s compensation to median employee compensation. |
While we are an emerging growth company, the JOBS Act permits us to delay the adoption of certain accounting standards until those standards would otherwise apply to private companies. However, we have elected to “opt out” of this extended transition period, and as a result, we will comply with new or revised accounting standards on the relevant dates on which adoption of such standards is required for non-emerging growth companies. Our decision to opt out of the extended transition period for complying with new or revised accounting standards is irrevocable.
We could be an emerging growth company for up to five full fiscal years after the date of our initial public offering, or until the earliest of (i) the last day of the first fiscal year in which our annual gross revenues exceed $1 billion, (ii) the date that we become a “large accelerated filer” as defined in Rule 12b-2 under the Securities Exchange Act of 1934, as amended, or the Exchange Act, which would occur at the end of the fiscal year during which the market value of our common stock that is held by non-affiliates exceeds $700 million as of the last business day of our most recently completed second fiscal quarter, or (iii) the date on which we have issued more than $1 billion in non-convertible debt during the preceding three year period.
Principal Executive Offices
Our executive offices are located at 12950 Worldgate Drive, Suite 700, Herndon, VA 20170. Our principal mailing address is 12950 Worldgate Drive, Suite 700, Herndon, VA 20170 and our telephone number is (703) 480-3800. Our website address is www.continental-bp.com. Information contained on our website is not part of and is not incorporated by reference into this prospectus. LiftLite®, Mold Defense®, Weather Defense®, Firecheck®, Protecta®, and Rapid Coat® and other trademarks or service marks of ours appearing in this prospectus are our property. Other trademarks and service marks appearing in this prospectus are the property of their respective holders.
10
Table of Contents
| Common stock offered by the selling stockholder |
7,000,000 shares (or 8,050,000 shares if the underwriters exercise in full their option to purchase shares) |
| Common stock to be outstanding immediately after this offering |
44,069,000 shares |
| Option to purchase additional shares of common stock |
The selling stockholder has granted the underwriters an option for a period of 30 days to purchase up to 1,050,000 additional shares of common stock. |
| Use of proceeds |
The selling stockholder will receive all net proceeds from the sale of the shares of common stock to be sold in this offering, and we will not receive any of these proceeds. See “Use of Proceeds,” “Principal and Selling Stockholders” and “Underwriting.” |
| NYSE Symbol |
“CBPX” |
| Dividend policy |
We have no present intention to pay cash dividends on our common stock. Any determination to pay dividends to holders of our common stock will be at the discretion of our board of directors and will depend upon many factors, including our financial condition, results of operations, projections, liquidity, earnings, legal requirements, restrictions in our debt agreements and other factors that our board of directors deems relevant. See “Dividend Policy.” |
| Risk factors |
You should carefully read and consider the information set forth under the section entitled “Risk Factors” beginning on page 16, together with all of the other information set forth in this prospectus, before deciding to invest in our common stock. |
Unless otherwise indicated, this prospectus:
| • | is based upon 44,069,000 shares of common stock outstanding as of November 6, 2014; |
| • | assumes no exercise of the underwriters’ option to purchase up to an additional 1,050,000 shares of our common stock from the selling stockholder; |
| • | assumes no exercise of options to purchase 142,000 shares of our common stock outstanding as of November 6, 2014, with a weighted average exercise price of $14.00; and |
| • | assumes no issuances of additional options to purchase shares of our common stock or other equity-based awards under our stock incentive plan. |
11
Table of Contents
SUMMARY HISTORICAL AND UNAUDITED PRO FORMA COMBINED FINANCIAL INFORMATION
The following financial data should be read in conjunction with the audited and unaudited financial statements and the related notes, and the unaudited pro forma combined financial information and the related notes, included elsewhere in this prospectus.
The financial statements included in this prospectus may not necessarily reflect our financial position, results of operations and cash flows as if we had operated as a stand-alone public company during all periods presented. Accordingly, the historical results should not be relied upon as an indicator of our future performance.
As discussed in more detail under “Business—The Acquisition,” we acquired the gypsum division of Lafarge North America Inc. on August 30, 2013. The accompanying financial statements are presented for the “Predecessor,” which are the combined financial statements of the Lafarge gypsum division for the period preceding the Acquisition, and the “Successor,” which are the consolidated financial statements of us and our subsidiaries for the period following the Acquisition. We were formed on July 26, 2013 and had no results of operations prior to the Acquisition on August 30, 2013. As such, our consolidated results of operations reflect activity of the acquired business for the four months from August 30, 2013 through December 31, 2013. The Predecessor’s combined statements of operations data for the years ended December 31, 2011 and 2012 and for the period from January 1, 2013 to August 30, 2013, and the Predecessor’s combined balance sheet data as of December 31, 2011 and 2012 have been derived from the audited combined financial statements of the Lafarge gypsum division, which are included elsewhere in this prospectus. Our balance sheet data as of December 31, 2013 and consolidated statements of operations for the period July 26, 2013 to December 31, 2013 are derived from the Successor audited consolidated financial statements, which are included elsewhere in this prospectus. Our balance sheet data as of September 30, 2013 and September 30, 2014 and consolidated statements of operations for the period July 26, 2013 to September 30, 2013 and the nine months ended September 30, 2014 are derived from the Successor unaudited consolidated financial statements, which are included elsewhere in this prospectus. The Predecessor’s financial statements may not necessarily be indicative of the cost structure or results of operations that would have existed if the gypsum division of Lafarge operated as a stand-alone, independent business. The Acquisition was accounted for as a business combination, which resulted in a new basis of accounting. The Predecessor’s and the Successor’s financial statements are not comparable as a result of applying a new basis of accounting. See the Notes to the audited consolidated financial statements for additional information regarding the accounting treatment of the Acquisition.
The information presented below should be read in conjunction with “Capitalization,” “Selected Historical Financial and Operating Data,” “Management’s Discussion and Analysis of Financial Condition and Results of Operations,” “Certain Relationships and Related Party Transactions” and our audited and unaudited combined financial statements and related notes, which are included elsewhere in this prospectus.
Our unaudited pro forma combined financial information has been prepared to reflect adjustments to our historical financial information that are (1) directly attributable to the transactions described below, (2) factually supportable, and (3) with respect to the unaudited pro forma combined statements of operations data, expected to have a continuing impact on our results. The unaudited pro forma combined financial information does not include non-recurring items, including, but not limited to, offering-related legal and advisory fees. The unaudited pro forma combined financial information reflects the impact of:
| • | the Acquisition; |
| • | the additional borrowings under our First and Second Lien Credit Agreements and the distribution of such borrowings to Lone Star; |
| • | the completion of our initial public offering; |
12
Table of Contents
| • | use of the net proceeds of our initial public offering to repay debt; and |
| • | other adjustments described in the notes to the unaudited pro forma combined financial information. |
Collectively, the transactions underlying these adjustments are referred to as the “Pro Forma Transactions.”
The unaudited pro forma combined financial information gives effect to the Pro Forma Transactions as though the Pro Forma Transactions had occurred as of January 1, 2012.
The information presented below should be read in conjunction with “Capitalization,” “Selected Historical Financial and Operating Data,” “Unaudited Pro Forma Combined Financial Information,” “Management’s Discussion and Analysis of Financial Condition and Results of Operations,” “Certain Relationships and Related Party Transactions” and our audited and unaudited combined financial statements and related notes, which are included elsewhere in this prospectus.
| Historical | Pro forma(1) | |||||||||||||||||||||||||||||||||||||
| Predecessor | Successor | |||||||||||||||||||||||||||||||||||||
| (Unaudited) | (Unaudited) | |||||||||||||||||||||||||||||||||||||
| Year ended December 31, |
January 1 to August 30, 2013 |
July 26, to December 31, 2013 |
July 26, to September 30, 2013 |
Nine Months Ended September 30, 2014 |
Year ended December 31, 2012 |
Year ended December 31, 2013 |
Nine Months ended September 30, 2013 |
|||||||||||||||||||||||||||||||
| 2011 | 2012 | |||||||||||||||||||||||||||||||||||||
| (in thousands, except per share and sales volume data) | ||||||||||||||||||||||||||||||||||||||
| Statement of operations data: |
||||||||||||||||||||||||||||||||||||||
| Net sales |
$ | 252,111 | $ | 311,410 | $ | 252,248 | $ | 150,066 | $ | 35,630 | $ | 303,692 | $ | 311,410 | $ | 402,314 | $ | 287,878 | ||||||||||||||||||||
| Costs, expenses and other income: |
||||||||||||||||||||||||||||||||||||||
| Cost of goods sold |
279,638 | 289,936 | 195,338 | 121,335 | 31,537 | 241,042 | 322,068 | 332,773 | 242,975 | |||||||||||||||||||||||||||||
| Selling and administrative: |
||||||||||||||||||||||||||||||||||||||
| Direct |
23,844 | 27,194 | 19,338 | 14,953 | 6,200 | 23,358 | 27,709 | 34,806 | 25,924 | |||||||||||||||||||||||||||||
| Allocated from Lafarge |
9,745 | 7,037 | 4,945 | — | — | — | 7,037 | 4,945 | 4,945 | |||||||||||||||||||||||||||||
|
|
|
|
|
|
|
|
|
|
|
|
|
|
|
|
|
|
|
|||||||||||||||||||||
| Total costs and operating expenses |
313,227 | 324,167 | 219,621 | 136,288 | 37,737 | 264,400 | 356,814 | 372,524 | 273,844 | |||||||||||||||||||||||||||||
|
|
|
|
|
|
|
|
|
|
|
|
|
|
|
|
|
|
|
|||||||||||||||||||||
| Operating income (loss) |
(61,116 | ) | (12,757 | ) | 32,627 | 13,778 | (2,107 | ) | 39,292 | (45,404 | ) | 29,790 | 14,034 | |||||||||||||||||||||||||
| Other income and (expenses): |
||||||||||||||||||||||||||||||||||||||
| Other (expense) income, net |
303 | (87 | ) | (191 | ) | (21 | ) | 85 | (5,461 | ) | (448 | ) | (212 | ) | (106 | ) | ||||||||||||||||||||||
| Interest expense, net |
(273 | ) | (212 | ) | (91 | ) | (10,542 | ) | (2,364 | ) | (24,518 | ) | (23,151 | ) | (23,443 | ) | (17,486 | ) | ||||||||||||||||||||
|
|
|
|
|
|
|
|
|
|
|
|
|
|
|
|
|
|
|
|||||||||||||||||||||
| Income (Loss) before (losses) earnings from equity method investment and income taxes |
(61,086 | ) | (13,056 | ) | 32,345 | 3,215 | (4,386 | ) | 9,313 | (69,003 | ) | 6,135 | (3,558 | ) | ||||||||||||||||||||||||
| (Losses) earnings on equity method investment |
228 | (138 | ) | (30 | ) | — | — | (257 | ) | — | — | |||||||||||||||||||||||||||
|
|
|
|
|
|
|
|
|
|
|
|
|
|
|
|
|
|
|
|||||||||||||||||||||
| Income (loss) before income taxes |
(60,858 | ) | (13,194 | ) | 32,315 | 3,215 | (4,386 | ) | 9,056 | (69,003 | ) | 6,135 | (3,558 | ) | ||||||||||||||||||||||||
| Income tax (expense) benefit |
316 | 352 | (130 | ) | (1,110 | ) | (254 | ) | (3,526 | ) | 352 | (1,240 | ) | (384 | ) | |||||||||||||||||||||||
|
|
|
|
|
|
|
|
|
|
|
|
|
|
|
|
|
|
|
|||||||||||||||||||||
| Net income (loss) |
$ | (60,542 | ) | $ | (12,842 | ) | $ | 32,185 | $ | 2,105 | $ | (4,640 | ) | $ | 5,530 | $ | (68,651 | ) | $ | 4,895 | $ | (3,942 | ) | |||||||||||||||
|
|
|
|
|
|
|
|
|
|
|
|
|
|
|
|
|
|
|
|||||||||||||||||||||
| Foreign currency translation adjustments |
1,144 | (1,197 | ) | 2,707 | (254 | ) | 266 | (1,079 | ) | (1,197 | ) | 2,453 | 2,973 | |||||||||||||||||||||||||
|
|
|
|
|
|
|
|
|
|
|
|
|
|
|
|
|
|
|
|||||||||||||||||||||
| Gain on derivatives qualifying as cash flow hedges |
— | — | — | — | — | 56 | — | — | — | |||||||||||||||||||||||||||||
|
|
|
|
|
|
|
|
|
|
|
|
|
|
|
|
|
|
|
|||||||||||||||||||||
| Comprehensive income (loss) |
$ | (59,398 | ) | $ | (14,039 | ) | $ | 34,892 | $ | 1,851 | $ | (4,374 | ) | $ | 4,507 | $ | (69,848 | ) | $ | 7,348 | $ | (969 | ) | |||||||||||||||
|
|
|
|
|
|
|
|
|
|
|
|
|
|
|
|
|
|
|
|||||||||||||||||||||
13
Table of Contents
| Historical | Pro forma(1) | |||||||||||||||||||||||||||||||||||||
| Predecessor | Successor | |||||||||||||||||||||||||||||||||||||
| (Unaudited) | (Unaudited) | |||||||||||||||||||||||||||||||||||||
| Year ended December 31, |
January 1 to August 30, 2013 |
July 26, to December 31, 2013 |
July 26, to September 30, 2013 |
Nine Months Ended September 30, 2014 |
Year ended December 31, 2012 |
Year ended December 31, 2013 |
Nine Months ended September 30, 2013 |
|||||||||||||||||||||||||||||||
| 2011 | 2012 | |||||||||||||||||||||||||||||||||||||
| (in thousands, except per share and sales volume data) | ||||||||||||||||||||||||||||||||||||||
| Net income per share, basic and diluted |
||||||||||||||||||||||||||||||||||||||
| Basic |
$ | 0.07 | $ | (0.14 | ) | $ | 0.13 | $ | (1.56 | ) | $ | 0.11 | $ | (0.09 | ) | |||||||||||||||||||||||
| Diluted |
$ | 0.07 | $ | (0.14 | ) | $ | 0.13 | $ | (1.56 | ) | $ | 0.11 | $ | (0.09 | ) | |||||||||||||||||||||||
| Weighted average shares outstanding |
||||||||||||||||||||||||||||||||||||||
| Basic |
32,304 | 32,304 | 42,561 | 44,069 | 44,069 | 44,069 | ||||||||||||||||||||||||||||||||
| Diluted |
32,304 | 32,304 | 42,569 | 44,069 | 44,069 | 44,069 | ||||||||||||||||||||||||||||||||
| Other financial data: |
||||||||||||||||||||||||||||||||||||||
| EBITDA(3) |
$ | (33,062 | ) | $ | 23,574 | $ | 49,513 | $ | 32,307 | $ | 2,487 | $ | 80,616 | $ | 21,559 | $ | 82,805 | $ | 53,114 | |||||||||||||||||||
| Adjusted EBITDA(3) |
(19,352 | ) | 41,210 | 63,904 | 39,178 | 9,358 | 80,616 | 40,695 | 102,567 | 72,876 | ||||||||||||||||||||||||||||
| Adjusted EBITDA margin(3) |
N/A | 13.2 | % | 25.3 | % | 26.1 | % | 26.3 | % | 26.5 | % | 13.1 | % | 25.5 | % | 25.3 | % | |||||||||||||||||||||
| Capital expenditures |
$ | 5,863 | $ | 5,205 | $ | 2,506 | $ | 2,798 | $ | 43 | $ | 6,090 | $ | 5,205 | $ | 5,304 | $ | 2,549 | ||||||||||||||||||||
| Selected operating data: |
||||||||||||||||||||||||||||||||||||||
| Wallboard sales volume (million square feet) |
1,814 | 1,903 | 1,334 | 827 | 195 | 1,552 | 1,903 | 2,161 | 1,528 | |||||||||||||||||||||||||||||
| Mill net sales price(2) |
$ | 98.00 | $ | 124.02 | $ | 147.55 | $ | 144.06 | $ | 144.06 | $ | 155.57 | $ | 124.02 | $ | 145.92 | $ | 147.11 | ||||||||||||||||||||
| Balance sheet data (at period end): |
||||||||||||||||||||||||||||||||||||||
| Cash |
$ | — | $ | — | N/A | $ | 11,822 | $ | 16,760 | $ | 12,156 | N/A | N/A | N/A | ||||||||||||||||||||||||
| Property, plant and equipment, net |
415,902 | 386,270 | N/A | 383,625 | 390,818 | 359,883 | N/A | N/A | N/A | |||||||||||||||||||||||||||||
| Total assets |
576,044 | 556,746 | N/A | 740,376 | 757,960 | 716,592 | N/A | N/A | N/A | |||||||||||||||||||||||||||||
| Total liabilities |
41,119 | 46,513 | N/A | 603,525 | 497,334 | 422,509 | N/A | N/A | N/A | |||||||||||||||||||||||||||||
| Total equity |
534,925 | 510,233 | N/A | 136,851 | 260,626 | 294,083 | N/A | N/A | N/A | |||||||||||||||||||||||||||||
| (1) | See “Unaudited Pro Forma Combined Financial Information” and the related notes and “Management’s Discussion and Analysis of Financial Condition and Results of Operations” included elsewhere in this prospectus. |
| (2) | Mill net sales price represents average selling price per thousand square feet net of freight and delivery costs. |
| (3) | EBITDA, Adjusted EBITDA and Adjusted EBITDA margin are non-GAAP measures. EBITDA represents operating income before depreciation and amortization. Adjusted EBITDA excludes (i) expenses related to net pension and post-retiree benefit costs that were retained by Lafarge, (ii) fees paid under the master brand agreements with Lafarge S.A., which were discontinued after the Acquisition, (iii) the payment of certain retention bonuses by Lafarge, (iv) spare parts write-off related to the closing of our Newark, New Jersey gypsum wallboard plant, (v) the payment of a lease termination fee for the Newark, New Jersey plant, (vi) the payment of a lease termination fee to discontinue the use of our co-generation power plant, (vii) payment of transaction costs associated with the Acquisition, and (viii) one month impact on cost of sales for the step-up of inventory to fair value due to the Acquisition. Adjusted EBITDA margin represents Adjusted EBITDA as a percentage of net sales. Management uses Adjusted EBITDA for purposes of evaluating the Company’s performance. We believe that Adjusted EBITDA is useful for investors because it allows them to view the Company’s business through the eyes of management and the Board of Directors, facilitating comparison of results across historical periods and providing a focus on the underlying ongoing operating performance of the business. |
14
Table of Contents
The following table reconciles operating income to EBITDA and Adjusted EBITDA (in thousands):
| Historical | Pro forma(1) | |||||||||||||||||||||||||||||||||||||
| Predecessor | Successor | |||||||||||||||||||||||||||||||||||||
| Year ended December 31, |
January 1 to August 30, 2013 |
July 26, to December 31, 2013 |
July 26, to September 30, 2013 |
Nine Months Ended September 30, 2014 |
Year ended December 31, 2012 |
Year ended December 31, 2013 |
Nine Months ended September 30, 2013 |
|||||||||||||||||||||||||||||||
| 2011 | 2012 | |||||||||||||||||||||||||||||||||||||
| Operating income (loss)—GAAP Measure |
$ | (61,116 | ) | $ | (12,757 | ) | $ | 32,627 | $ | 13,778 | $ | (2,107 | ) | $ | 39,292 | $ | (45,404 | ) | $ | 29,790 | $ | 14,034 | ||||||||||||||||
| Depreciation and amortization |
28,054 | 36,331 | 16,886 | 18,529 | 4,594 | 41,324 | 66,963 | 53,015 | 39,080 | |||||||||||||||||||||||||||||
|
|
|
|
|
|
|
|
|
|
|
|
|
|
|
|
|
|
|
|
||||||||||||||||||||
| EBITDA—Non-GAAP Measure |
(33,062 | ) | 23,574 | 49,513 | 32,307 | 2,487 | 80,616 | 21,559 | 82,805 | 53,114 | ||||||||||||||||||||||||||||
| Pension and post-retiree benefit costs retained by Lafarge(a) |
8,037 | 11,925 | 7,636 | — | — | — | 11,925 | 7,636 | 7,636 | |||||||||||||||||||||||||||||
| Master Brand Agreement(b) |
5,273 | 3,602 | 3,004 | — | — | — | 3,602 | 3,004 | 3,004 | |||||||||||||||||||||||||||||
| Special bonus(c) |
400 | 904 | — | — | — | — | 904 | — | — | |||||||||||||||||||||||||||||
| Spare parts write-off due to plant closure(d) |
— | 1,205 | — | — | — | — | 1,205 | — | — | |||||||||||||||||||||||||||||
| Newark lease termination costs(e) |
— | — | 2,556 | — | — | — | — | 2,556 | 2,556 | |||||||||||||||||||||||||||||
| Co-generation lease termination costs(f) |
— | — | 1,195 | 2,075 | 2,075 | — | — | 3,270 | 3,270 | |||||||||||||||||||||||||||||
| Acquisition closing costs(g) |
— | — | — | 3,296 | 3,296 | — | — | 3,296 | 3,296 | |||||||||||||||||||||||||||||
| Inventory step-up impacting margin(h) |
— | — | — | 1,500 | 1,500 | — | 1,500 | — | — | |||||||||||||||||||||||||||||
|
|
|
|
|
|
|
|
|
|
|
|
|
|
|
|
|
|
|
|||||||||||||||||||||
| Adjusted EBITDA—Non-GAAP Measure |
$ | (19,352 | ) | $ | 41,210 | $ | 63,904 | $ | 39,178 | $ | 9,358 | $ | 80,616 | $ | 40,695 | $ | 102,567 | $ | 72,876 | |||||||||||||||||||
|
|
|
|
|
|
|
|
|
|
|
|
|
|
|
|
|
|
|
|||||||||||||||||||||
| (a) | Lafarge retained the pension and post-retiree liabilities related to its gypsum division and no new plans have been established by Continental. The adjustment represents pension and post-retiree benefit costs allocated to the Predecessor. |
| (b) | Adjusts for the amounts paid to Lafarge S.A. under the master brand agreements by Lafarge that were discontinued after the Acquisition. |
| (c) | Adjusts for special payouts paid by Lafarge related to a retention program due to the process of disposing of its gypsum business. |
| (d) | Adjusts for the write-off of spare parts related to the closure of the Newark, New Jersey gypsum wallboard plant. |
| (e) | Adjusts for the payment of a lease termination fee to the Port of Newark related the Newark, New Jersey plant closure. |
| (f) | Adjusts for the payment of a lease termination fee to discontinue the use of the co-generation power plant. |
| (g) | Adjusts for the transaction costs associated with the Acquisition. |
| (h) | Adjusts for step-up to fair value of inventory that increased cost of sales for one month after the Acquisition. |
15
Table of Contents
Investing in our common stock involves a high degree of risk. You should carefully consider the risks and uncertainties described below, together with all of the other information in this prospectus, including the combined financial statements and the related notes appearing elsewhere in this prospectus, before making an investment decision. If any of the following risks actually occurs, our business, financial condition, results of operations and future prospects could be materially and adversely affected. The trading price of our common stock could decline due to any of these risks and, as a result, you may lose all or part of your investment in our common stock.
Risks Relating to Our Business
Demand for our products is closely related to construction activity, particularly new residential construction, which is cyclical.
Historically, demand for the products that we manufacture has been closely correlated with new residential construction in the United States and Canada and, to a lesser extent, commercial construction and R&R activity. Since 2008, new residential construction activities have remained at their lowest levels since 1946 and, correspondingly, demand for the products that we manufacture has been weak. U.S. wallboard consumption was 17.1 bsf in 2010 and 17.2 bsf in 2011, down from pre-recession highs of 36.2 bsf in 2005. Prices fell significantly across the industry as demand decreased. Our net sales declined from $502.9 million for the year ended December 31, 2006 to $244.0 million for the year ended December 31, 2010. There is significant uncertainty regarding the timing and extent of the current recovery in such construction activity and resulting product demand levels. Demand for new residential construction is influenced by mortgage availability and rates, employment levels, household formation rates, domestic population growth, immigration rates, residential vacancy and foreclosure rates, demand for second homes, existing home prices, rental prices, housing inventory levels, consumer confidence, seasonal weather factors and other general economic factors. Our growth prospects depend, to a significant extent, on the degree by which conditions in the residential construction market improve in the future. We cannot control the foregoing and, as a result, our profitability and cash flow may vary materially in response to market conditions and changes in the supply and demand balance for our primary products.
During cyclical downturns in the markets in which we operate, we may incur losses. For example, for the years ended December 31, 2011 and 2012, we incurred net losses of $60.5 million and $12.8 million, respectively, while the housing downturn continued. As a result of any possible future cyclical downturns, the price of our common stock may decline, and you may lose all or a portion of your investment.
If we cannot effectively compete in our markets, our business, financial condition and operating results may be materially and adversely affected.
Many of the wallboard products sold by our competitors are close substitutes for our products. Because of this substitutability, competition among manufacturers is based in large part on price, as well as service, quality and range of products. Actions of our competitors, many of which have significant excess capacity, or the entry of new competitors into our markets could lead to lower pricing in an effort to maintain our customer base and could also lead to lower sales volumes. At times, the price for any one or more of the products that we produce may fall below our production costs, requiring us to either incur losses on product sales or cease production at one or more of our manufacturing facilities. Prices are often subject to material changes in response to relatively minor fluctuations in supply and demand, general economic conditions and other market conditions beyond our control. There can be no assurance that prices for products sold by us will not decline in the future or that such declines will not have a material adverse effect on our business, financial condition and results of operations.
Some of our competitors are larger companies and, therefore, have access to greater financial and other resources than we do. These resources may afford those competitors greater purchasing power, increased
16
Table of Contents
financial flexibility and more capital resources for expansion and improvement, which may enable those competitors to compete more effectively than we can. If we fail to compete effectively, we could suffer a loss of sales.
If our coal-fired power plant synthetic gypsum suppliers cease operations, reduce their power generation or switch to natural gas, our supply of synthetic gypsum could be constrained and our operating results or cash flows may be materially and adversely affected.
All of the gypsum used in our plants is synthetic gypsum, which is a coal-combustion byproduct, or CCB, resulting primarily from flue gas desulfurization, or FGD, carried out by electric generation or industrial plants burning coal as a fuel. The suppliers of synthetic gypsum are primarily power companies. As a result of the increase in coal price relative to natural gas and other reasons, some power companies have recently ceased operations or reduced power generation at certain high cost plants or at plants that are not compliant with current or anticipated environmental laws or switched such plants to using natural gas instead of coal for their electric generation needs. Additionally, existing or future changes in environmental regulations could make it more difficult or costly for power providers or industrial plants to burn coal. Potential future changes in environmental regulations include the EPA’s proposed regulations issued in June 2014 as part of its “Clean Power Plan,” which have the stated goal of reducing the amount of carbon dioxide emitted from power plants by 30% from 2005 levels by the year 2030. If these rules are adopted in their current form, many believe a meaningful portion of the reduction in carbon emissions would be expected to come from reducing the output of coal fired power plants. We believe that the larger power plants with sophisticated pollution control devices that supply most of our gypsum would be less likely to be affected than smaller, less efficient plants. However, in the event any of the power companies with which we have synthetic gypsum supply agreements, for these or other reasons, reduce their power generation, switch to using natural gas instead of coal or cease operations completely, our access to synthetic gypsum may be constrained, which could have an adverse effect on our business. In that event, there can be no assurance that we could find alternative sources of synthetic gypsum in reasonable quantities or at reasonable prices. In December 2013 our synthetic gypsum supplier for the Buchanan plant, NRG Energy, announced plans to deactivate its Chalk Point and Dickerson coal fired power plants in May of 2018 (an extension from its prior announced date of May 2017). These two plants together have recently provided approximately one-third of our Buchanan plant’s synthetic gypsum. It is not certain that these plants will be deactivated at the announced time. However, even if these plants are deactivated, we believe we will have access to sufficient gypsum through multiple sources to continue economically operating the Buchanan plant at required capacity levels.
If regulatory changes affect the use of synthetic gypsum, our supply of gypsum could be constrained and our operating results or cash flows may be materially and adversely affected.
Environmental regulatory changes or changes in methods used to comply with environmental regulations could adversely affect the price and availability of synthetic gypsum. The U.S. Environmental Protection Agency, or EPA, currently classifies synthetic gypsum as a non-hazardous waste. In June 2010, following a December 2008 coal ash spill from a surface impoundment in Kingston, Tennessee, the EPA proposed two alternative regulations that would address the storage and disposal of all CCBs, including synthetic gypsum, which remain pending. One of the proposed regulations would regulate the transportation, storage and disposal of CCBs as “special” waste under subtitle C of the Resource Conservation and Recovery Act, or RCRA, which regulates hazardous waste, except when they are “beneficially used.” The EPA has stated that it considers that synthetic gypsum used in wallboard is a “beneficial use,” but the proposed regulation does not specifically address the regulatory status of synthetic gypsum prior to its incorporation into wallboard or at the time such wallboard ultimately is disposed. The second proposal would also allow beneficial use of synthetic gypsum and would regulate CCBs bound for disposal as “solid” waste under subtitle D of RCRA, which regulates non-hazardous wastes. The EPA has emphasized that it does not wish to discourage the beneficial use of CCBs under either of its two proposals. If the EPA adopts a final regulation that restricts or otherwise increases the costs associated with the use, storage or disposal of synthetic gypsum, it could have a material adverse effect on our
17
Table of Contents
results of operations, financial position or cash flows. This effect would depend on, among other things, the regulation’s impact, if any, on the cost or supply of synthetic gypsum used in manufacturing wallboard and the demand for wallboard made with synthetic gypsum. The EPA is expected to issue its final regulation in December of 2014. In February 2014, the EPA issued its risk evaluation methodology for CCBs, as well as the specific application of that methodology to synthetic gypsum. The EPA concluded that any environmental release of constituents of potential concern from synthetic gypsum is comparable or lower than those from natural gypsum. The EPA further stated that it supports the use of synthetic gypsum in wallboard.
We are subject to environmental and safety laws and regulations and these laws and regulations may change. These laws and regulations could cause us to make modifications to how we manufacture and price our products. They could also require that we make significant capital investments or otherwise increase our costs or result in liabilities to us.
We are subject to federal, state, local and foreign laws and regulations governing the protection of the environment and occupational health and safety, including those governing air emissions, wastewater discharges, the management, disposal and cleanup of hazardous materials and wastes and the health and safety of our employees. We are also required to obtain permits from governmental authorities for certain operations, and if we expand or modify our facilities, or if environmental laws change, we could be required to obtain new or modified permits. If we were to fail to comply with these laws, regulations or permits, we could incur fines, penalties or other sanctions. In addition, we could be held responsible for costs and damages arising from claims or liabilities under these laws and regulations, such as with respect to any contamination at our facilities or at third-party waste disposal sites. We cannot completely eliminate the risk of contamination or injury resulting from hazardous materials. Environmental laws and regulations tend to become more stringent over time, and we could incur material additional expenses relating to compliance with future environmental laws.
For example, as discussed further above, in 2010, the EPA proposed alternative regulations to address the storage and disposal of CCBs, which include FGD synthetic gypsum, which we use in all of our plants. It is difficult to accurately predict the regulations that will be ultimately adopted. It is possible that the EPA’s rulemaking could adversely affect our business, financial condition and results of operations, depending on how any such regulation affects our costs or the demand for our products utilizing synthetic gypsum. See “Risk Factors—If our coal-fired power plant synthetic gypsum suppliers switch to natural gas or cease operations, our supply of synthetic gypsum could be constrained and our operating results or cash flows may be materially and adversely affected.”
In addition, the U.S. Congress and several states are considering or have adopted legislation to reduce emission of “greenhouse gases,” including carbon dioxide and methane. In 2010, the EPA adopted rules to phase in requirements for all new or modified “stationary sources” that emit 100,000 tons of greenhouse gases per year, or modified sources that increase emissions by 75,000 tons per year, to annually obtain permits demonstrating that they are incorporating the “best available control technology” to minimize greenhouse gas emissions. These rules could affect all of our U.S. wallboard plants and the Seven Hills Paperboard LLC, or Seven Hills, paper mill operated as a joint venture with Rock-Tenn Company, or RockTenn, which produce greenhouse gases. The rules are subject to pending legal challenges that have been filed by certain interested parties, including states, industry groups and environmental organizations, in the U.S. federal courts. If these rules withstand challenge, they could require that we incur significant costs to satisfy permitting requirements. In addition, enactment of new climate control legislation or other regulatory initiatives by the U.S. Congress or various states, or the adoption of additional regulations by the EPA and analogous state or Canadian governmental agencies that restrict emissions of greenhouse gases in areas in which we conduct business, could have a material adverse effect on our operations and demand for our products. Our manufacturing processes for wallboard use a significant amount of energy, especially natural gas. Increased regulation of energy use to address the possible emission of greenhouse gases and climate change could materially increase our manufacturing costs.
It is difficult to accurately predict if or when currently proposed or additional laws and regulations regarding emissions and other environmental concerns will be enacted or what capital expenditures might be required as a
18
Table of Contents
result of them. Stricter regulation of emissions might require us to install emissions control or other equipment at some or all of our manufacturing facilities, requiring significant additional capital investments.
We do not have long-term contracts with our customers, and our sales volume could be reduced if our customers switch some or all of their business with us to other suppliers.
As is customary in the industry, we do not enter into long-term contracts with our customers. Our customers may choose to stop or reduce purchases of our products at any time in the future. A significant loss of our customers or a significant reduction in their purchases could have a material negative impact on our sales volume and business, or cause us to reduce our prices, which could have a material adverse effect on our business, financial condition, results of operations and cash flows.
The loss of sales to Lowe’s may have a material adverse effect on our business, financial condition and operating results.
In 2013 on a pro forma basis, 2012 and 2011, Lowe’s accounted for 14%, 15% and 12% of our net sales, respectively. If Lowe’s reduces, delays or cancels a substantial number of orders, our business, financial condition and operating results may be materially and adversely affected, particularly for the period in which the reduction, delay or cancellation occurs and also possibly for subsequent periods.
Because we do not have binding long-term purchasing agreements with Lowe’s, there can be no assurance that Lowe’s will continue to purchase products from us at current levels or at all.
A material disruption at one of our manufacturing facilities or at one of our suppliers’ facilities could prevent us from meeting customer demand, reduce our sales and/or negatively affect our financial results.
Any of our manufacturing facilities, or any of our machines within an otherwise operational facility, could cease operations unexpectedly due to a number of events, including but not limited to:
| • | major equipment failure; |
| • | fires, floods, earthquakes, hurricanes, environmental incidents or other catastrophes; |
| • | utility and transportation infrastructure disruptions; |
| • | labor difficulties; |
| • | other operational problems; or |
| • | war, acts of terrorism or other unexpected events. |
Any downtime or facility damage could prevent us from meeting customer demand for our products or require us to make unplanned capital expenditures. If our machines or facilities were to incur significant downtime, our ability to satisfy customer requirements could be impaired, resulting in decreased customer satisfaction and lower sales and operating income. Because we operate at a limited number of facilities, the effects of any particular shutdown or facility damage could be significant to our operations as a whole and pronounced in the markets near the facility affected.
In addition, our suppliers of synthetic gypsum and paperboard liner are subject to the manufacturing facility disruption risks noted above. Our suppliers’ inability to produce the necessary raw materials for our manufacturing processes may adversely impact our results of operations, cash flows and financial position. Because we rely on a limited number of suppliers, a disruption at any one of our suppliers’ facilities could have a significant impact on our business.
19
Table of Contents
We are reliant on RockTenn for paper and we may require additional supplies of paper if our current supply is disrupted or our utilization increases.
We currently purchase substantially all of our paperboard liner from the Seven Hills joint venture with RockTenn. While the joint venture has the capacity to supply us with approximately 75% of our paper needs at our full capacity and 100% of our needs at current capacity, supply disruptions or additional paper demand that cannot be fulfilled on the open market could adversely affect our business. Since we only have one major supplier of paper, our risk of supply disruption may be greater than that of some of our competitors. Paper is a significant component of our variable costs. To the extent we are required to purchase paper on the open market, paper costs would be subject to market conditions and could increase, which could have a negative impact on our results of operations.
If the cost of energy increases, our cost of goods sold will increase and our operating results or cash flows may be materially and adversely affected.
Our manufacturing processes use substantial amounts of natural gas and electricity, which are major components of our cost of goods sold. Energy costs are affected by various market factors, including the availability of supplies of particular forms of energy, energy prices and local and national regulatory decisions. Prices for natural gas and electrical power have been volatile in recent years. There may be substantial increases in the price of energy in the future, which may be pronounced if there are dislocations in the energy markets due to political instability or other unforeseeable events. We currently hedge slightly less than 50% of our natural gas based on usages for the past twelve months, and do not hedge our electricity purchases at all. Consequently, we may be adversely impacted by increases in price more than competitors utilizing a more comprehensive hedging strategy, particularly in respect of electricity purchases. There can be no assurances we will continue to utilize this hedging strategy in the future or whether it or any other strategy we implement, including not hedging at all, will be successful.
Significant changes in the cost and availability of transportation could adversely affect our business, financial condition and results of operations.
Because manufacturers are responsible for delivering wallboard to their customers in our industry, transportation costs associated with the delivery of our wallboard products are a significant portion of our variable costs. Increases in the cost of fuel or energy can result in increases in the cost of transportation, which could materially and adversely affect our operating profits. Also, reductions in the availability of certain modes of transportation, such as rail or trucking, could limit our ability to deliver our products and therefore materially and adversely affect our operating profits.
Our financial results may be affected by various legal and regulatory proceedings.
We are subject to litigation and regulatory proceedings in the normal course of business and could become subject to additional claims in the future, some of which could be material. The outcome of existing legal proceedings may differ from our expectations because the outcomes of litigation and similar disputes are often difficult to predict reliably. Various factors and developments could lead us to make changes in current estimates of liabilities and related insurance receivables, where applicable, or make additional estimates, including new or modified estimates as a result of a judicial ruling or judgment, a settlement, regulatory developments or changes in applicable law. A future adverse ruling, settlement or unfavorable development could result in charges that could have a material adverse effect on our results of operations.
We may be unable to attract and retain key management employees.
Our key management personnel are important to our success. Our ability to retain our key management personnel or to attract suitable replacements should any members of our management team leave is dependent on
20
Table of Contents
the competitive nature of the employment market. The loss of services from key management personnel or a limitation in their availability could materially and adversely impact our business.
We may experience delays or outages in our information technology system and computer networks.
We may be subject to information technology system failures and network disruptions. These may be caused by delays or disruptions due to system updates, natural disasters, malicious attacks, accidents, power disruptions, telecommunications failures, acts of terrorism or war, computer viruses, physical or electronic break-ins or similar events or disruptions. In the first quarter of 2014, we initiated implementation of an enterprise resource planning system, which was completed in October 2014. We may in the future add applications to replace outdated systems and to operate more efficiently. Predictions regarding benefits resulting from the implementation of these projects are subject to uncertainties. We may not be able to successfully implement the projects without experiencing difficulties. In addition, any expected benefits of implementing projects might not be realized or the costs of implementation might outweigh the benefits realized.
A disruption in our information technology systems due to a catastrophic event or security breach could interrupt or damage our operations. In addition, we could be subject to reputational harm or liability if confidential customer information is misappropriated from our information technology systems. Despite our security measures and business continuity plans, these systems could be vulnerable to disruption, and any such disruption could negatively affect our financial condition and results of operations.
Labor disruptions or cost increases could adversely affect our business.
A work stoppage at one of our facilities could cause us to lose sales, incur increased costs and adversely affect our ability to meet customers’ needs. A plant shutdown or a substantial modification to employment terms could negatively impact us. The current collective bargaining agreement with our unionized employees at our Buchanan plant is set to expire on November 30, 2014. We cannot assure you that we will be able to negotiate the collective bargaining agreement on the same or similar terms as those in the current agreement, or at all, without production interruptions, including labor stoppages. Approximately 15% of our 504 employees were unionized as of September 30, 2014. From time to time we have experienced union organizing efforts directed at our non-union employees. We may also experience labor cost increases or disruptions in our non-union facilities in circumstances in which we must compete for employees with necessary skills and experience or in tight labor markets. Any such cost increases, work stoppages or disruptions could have a material adverse effect on our business, financial condition, results of operations and cash flows by limiting production, sales volumes and profitability.
Our business can be seasonal in nature, and this may cause our quarterly results to vary.
Sales of our wallboard products are, similar to many building products, seasonal in that sales are generally slightly higher from spring through autumn when construction activity is greatest in our markets. As a result, our quarterly results have varied in the past and may vary from quarter to quarter in the future. Such variations could have a negative impact on the price of our common stock. Additionally, because our business is seasonal, unfavorable weather conditions during peak construction periods could have an adverse effect on our sales.
Our current indebtedness, and any future indebtedness we may incur, may limit our operational and financing flexibility and negatively impact our business.
Our subsidiary, Continental Building Products Operating Company, LLC, or OpCo, is a party to a secured credit facility that was entered into in connection with the Acquisition. As of September 30, 2014, $377.0 million was outstanding under the First Lien Credit Agreement and no revolving loans were outstanding under the Revolver. We may incur substantial additional debt in the future. This credit facility, and other debt instruments we may enter into in the future, may have important consequences to you, including the following:
| • | our ability to obtain additional financing for working capital, capital expenditures, acquisitions or general corporate purposes may be impaired; |
21
Table of Contents
| • | the requirement that we use a significant portion of our cash flows from operations to pay interest on any outstanding indebtedness, which would reduce the funds available to us for operations and other purposes; and |
| • | our flexibility in planning for, or reacting to, changes in our business and the industry in which we operate may be limited. |
We expect that we will depend primarily on cash generated by our operations for funds to pay our expenses and any amounts due under our credit facility and any other indebtedness we may incur. Our ability to make these payments depends on our future performance, which will be affected by financial, business, economic and other factors, many of which we cannot control. Our business may not generate sufficient cash flows from operations in the future and our currently anticipated growth in revenues and cash flows may not be realized, either or both of which could result in our being unable to repay indebtedness or to fund other liquidity needs. If we do not have enough money, we may be required to refinance all or part of our then existing debt, sell assets or borrow more money, in each case on terms that may not be acceptable to us. In addition, the terms of existing or future debt agreements, including our existing credit facility, may restrict us from adopting any of these alternatives. Our ability to recapitalize and incur additional debt in the future could also delay or prevent a change in control of our company, make some transactions more difficult and impose additional financial or other covenants on us. In addition, any significant levels of indebtedness in the future could place us at a competitive disadvantage compared to our competitors that may have proportionately less debt and could make us more vulnerable to economic downturns and adverse developments in our business. Our indebtedness and any inability to pay our debt obligations as they come due or inability to incur additional debt could adversely affect our business and results of operations.
The terms of our credit facility imposes operating and financial restrictions on us.
OpCo’s credit facility contains a number of significant restrictions and covenants that generally limit OpCo’s ability to, among other things:
| • | incur or guarantee additional debt; |
| • | create or incur certain liens; |
| • | make certain loan advances; |
| • | engage in acquisitions, consolidations, mergers, changes of control and sales of certain assets; |
| • | pay dividends and make other distributions; |
| • | make optional payments and modifications of junior debt instruments; |
| • | engage in certain affiliate transactions, sales and leasebacks and pledge transactions; |
| • | make certain restricted subsidiary distributions; |
| • | engage in certain lines of business or activities; and |
| • | modify certain agreements. |
The credit facility limits our ability to engage in these types of transactions even if we believe that a specific transaction would contribute to our future growth or improve our operating results. The First Lien Credit Agreement also requires OpCo and its restricted subsidiaries to maintain a specific total leverage ratio in certain circumstances. See “Management’s Discussion and Analysis of Financial Condition and Results of Operations—Liquidity and Capital Resources—Credit Facility” for more information regarding the terms of the credit facility.
Our ability to comply with these provisions may be affected by events beyond our control. A breach of any of these provisions or the inability to comply with required financial ratios in the credit facility could result in a
22
Table of Contents
default, in which case the lenders will have the right to declare all borrowings to be immediately due and payable. If we are unable to repay all borrowings when due, whether at maturity or if declared due and payable following a default, the lenders would have the right to proceed against the collateral granted to secure the indebtedness. If we breach these covenants or fail to comply with the terms of the credit facility, and the lenders accelerate the amounts outstanding under the credit facility, our business and results of operations would be adversely affected.
Our historical financial information as a division of Lafarge may not be representative of our results as an independent public company.
Certain of the historical financial information that we have included in this prospectus has been derived from the historical financial statements of Lafarge and does not necessarily reflect what our financial position, results of operations or cash flows would have been had we been an independent entity during the historical periods presented. The historical costs and expenses reflected in our combined financial statements include an allocation for certain corporate functions historically provided by Lafarge. These allocated costs are primarily related to corporate administrative expense, employee-related costs including pensions and other benefits for corporate and shared employees, and rental and usage fees for shared assets for the following functional groups: information technology, legal services, accounting and finance services, human resources, market and contract support, customer support, treasury, facility and other corporate and infrastructural services. While we believe that these allocations are reasonable reflections of the historical utilization levels of these services in support of our business, we have not made adjustments to reflect many significant changes that have occurred in our cost structure, funding and operations as a result of the Acquisition, including changes in our employee base, changes in our legal structure, potential increased costs associated with reduced economies of scale, migration of our informational technology systems, increased marketing expenses related to establishing a new brand identity and increased costs associated with being a publicly traded, stand-alone company. As a result of the Acquisition, we have had a very limited history of functioning as a stand-alone company and do not present financial results in this prospectus as a stand-alone company for any full financial reporting period. As a result of these factors, the historical financial information is not necessarily representative of the amount that would have been reflected in our financial statements had we been a stand-alone company or indicative of our future results of operations, financial position, cash flows or costs and expenses. For additional information, see “Selected Historical Financial and Operating Data,” “Management’s Discussion and Analysis of Financial Condition and Results of Operations,” “Unaudited Pro Forma Combined Financial Information” and our historical combined financial statements and notes thereto.
After the termination of our transitional services agreement, we will no longer have access to the resources of Lafarge, and we may have difficulty finding replacement services or experience increased costs resulting from decreased purchasing power.
After the termination of the transitional services agreement expected to occur in November 2014, we may not be able to adequately replace the services provided to us by Lafarge or enter into appropriate third-party agreements on terms and conditions, including cost, comparable to those that we receive from Lafarge under the transitional services agreement. Although we have made arrangements to replace the vast majority of the services previously provided by Lafarge, we may encounter difficulties adequately replacing certain services or be unable to negotiate longer-term pricing or other terms for such services or for other goods, services or supplies as favorable as those we currently have in effect.
23
Table of Contents
Risks Related to this Offering and Ownership of Our Common Stock
Because our common stock has only recently started trading in the public market, an active trading market for shares of our common stock may not be sustained following this offering and our common stock prices may be volatile and could decline substantially following this offering.
Prior to our initial public offering in February 2014, there was no market for shares of our common stock. Although our common stock is listed on the New York Stock Exchange, or NYSE, under the symbol “CBPX,” an active trading market for the shares of our common stock may not be sustained following this offering. Accordingly, no assurance can be given as to the following:
| • | the likelihood that an active trading market for shares of our common stock will be sustained; |
| • | the liquidity of any such market; |
| • | the ability of our stockholders to sell their shares of common stock; or |
| • | the price that our stockholders may obtain for their common stock. |
If an active market is not maintained, the market price of our common stock may decline and you may not be able to sell your shares. Even in an active trading market for our common stock, the market price of our common stock may be highly volatile and subject to wide fluctuations.
Some of the factors that could negatively affect or result in fluctuations in the market price of our common stock include:
| • | actual or anticipated variations in our quarterly operating results; |
| • | changes in market valuations of similar companies; |
| • | changes in the residential, commercial or R&R construction markets; |
| • | additions or departures of key personnel; |
| • | actions by stockholders, including the sale by Lone Star of its shares of our common stock; |
| • | speculation in the press or investment community; |
| • | general market, economic and political conditions, including an economic slowdown or dislocation in the global credit markets; |
| • | changes in interest rates; |
| • | our operating performance and the performance of other similar companies; |
| • | changes in securities analysts’ estimates of our financial performance or lack of research and reports by industry analysts; |
| • | changes in accounting principles; |
| • | changes in tax laws; and |
| • | passage of legislation or other regulatory developments that adversely affect us or the building industry. |
These and other factors may lower the market price of our common stock, regardless of our actual operating performance. As a result, our common stock may trade at prices significantly below the public offering price.
Furthermore, in recent years, the stock market has experienced significant price and volume fluctuations. This volatility has had a significant impact on the market price of securities issued by many companies, including companies in our industry. The changes frequently appear to occur without regard to the operating performance of the affected companies. Hence, the price of our common stock could fluctuate based upon factors that have little or nothing to do with us, and these fluctuations could materially reduce our share price and materially affect the value of your investment.
24
Table of Contents
The offering price per share of our common stock offered under this prospectus may not accurately reflect the value of your investment.
The offering price per share of our common stock offered by this prospectus was negotiated among Lone Star and the underwriters. Factors considered in determining the price of our common stock include:
| • | the history and prospects of companies whose principal business is the manufacturing and sale of wallboard; |
| • | market valuations of those companies; |
| • | our capital structure; |
| • | general conditions of the securities markets at the time of this offering; and |
| • | other factors that Lone Star and the underwriters deemed relevant. |
The offering price may not accurately reflect the value of our common stock and may not be realized upon any subsequent disposition of the shares.
Lone Star owns a substantial portion of our common stock, it may have conflicts of interest with other stockholders in the future and its significant ownership may limit your ability to influence corporate matters.
Immediately following completion of this offering, Lone Star will beneficially own approximately 53.4% (or 51.0% if the underwriters’ option to purchase additional shares is exercised in full) of our outstanding common stock. See “Principal and Selling Stockholders” for more information on our beneficial ownership. As a result of this concentration of stock ownership, Lone Star acting on its own has sufficient voting power to effectively control all matters submitted to our stockholders for approval, including director elections and proposed amendments to our bylaws. Five of the nine members of our board of directors are employees or affiliates of Lone Star.
In addition, this concentration of ownership may delay or prevent a merger, consolidation or other business combination or change in control of our company and make some transactions that might otherwise give you the opportunity to realize a premium over the then-prevailing market price of our common stock more difficult or impossible without the support of Lone Star. The interests of Lone Star may not always coincide with our interests as a company or the interests of other stockholders. Accordingly, Lone Star could cause us to enter into transactions or agreements of which you would not approve or make decisions with which you would disagree. This concentration of ownership may also adversely affect our share price. After the lock-up period related to this offering expires, Lone Star will be able to transfer control of us to a third-party by transferring their common stock, which would not require the approval of our board of directors or other stockholders.
Additionally, Lone Star is in the business of making investments in companies and may from time to time acquire and hold interests in businesses that compete directly or indirectly with us. Lone Star may also pursue acquisition opportunities that may be complementary to our business, and as a result, those acquisition opportunities may not be available to us. In recognition that principals, members, directors, managers, partners, stockholders, officers, employees and other representatives of Lone Star and its affiliates and investment funds may serve as our directors or officers, our certificate of incorporation provides, among other things, that none of Lone Star or any principal, member, director, manager, partner, stockholder, officer, employee or other representative of Lone Star has any duty to refrain from engaging directly or indirectly in the same or similar business activities or lines of business that we do. In the event that any of these persons or entities acquires knowledge of a potential transaction or matter which may be a corporate opportunity for itself and us, we will not have any expectancy in such corporate opportunity, and these persons and entities will not have any duty to communicate or offer such corporate opportunity to us and may pursue or acquire such corporate opportunity for itself or direct such opportunity to another person. These potential conflicts of interest could have a material
25
Table of Contents
adverse effect on our business, financial condition, results of operations or prospects if, among other things, attractive corporate opportunities are allocated by the sponsors to themselves or their other affiliates. The terms of our certificate of incorporation are more fully described in “Description of Capital Stock—Corporate Opportunities and Transactions with Lone Star.”
We are a “controlled company” within the meaning of the NYSE rules and, as a result, qualify for, and rely on, exemptions from certain corporate governance requirements.
Lone Star fund currently controls a majority of our common stock and upon completion of this offering, Lone Star will continue to control a majority of the voting power of our outstanding common stock. As a result, we will continue to be a “controlled company” within the meaning of the NYSE corporate governance standards. Under the NYSE rules, a company of which more than 50% of the voting power is held by a person or group is a “controlled company” and need not comply with certain requirements, including the requirement that a majority of the board of directors consist of independent directors and the requirements that our compensation and nominating and corporate governance committees be comprised entirely of independent directors. We are utilizing these exemptions. As a result, we do not have a majority of independent directors and our nominating and compensation and benefits committees do not consist entirely of independent directors. Accordingly, you will not have the same protections afforded to stockholders of companies that are subject to all of the NYSE corporate governance requirements.
Our future operating results may fluctuate significantly and our current operating results may not be a good indication of our future performance. Fluctuations in our quarterly financial results could affect our stock price in the future.
Our revenues and operating results have historically varied from period to period and we expect that they will continue to do so as a result of a number of factors, many of which are outside of our control, including the cyclicality and seasonality of our industry. If our quarterly financial results fail to meet the expectations of securities analysts and investors, our stock price could be negatively affected. Any volatility in our quarterly financial results may make it more difficult for us to raise capital in the future or pursue acquisitions that involve issuances of our stock. Our operating results for prior periods may not be effective predictors of future performance.
We have no present intention to pay dividends on our common stock.
We have no present intention to pay cash dividends on our common stock. Any determination to pay dividends to holders of our common stock will be at the discretion of our board of directors and will depend upon many factors, including our financial condition, results of operations, projections, liquidity, earnings, legal requirements, restrictions in our debt agreements and other factors that our board of directors deems relevant. See “Dividend Policy.” Accordingly, you may need to sell your shares of our common stock to realize a return on your investment, and you may not be able to sell your shares at or above the price you paid for them.
If securities or industry analysts do not continue to publish research or reports about our business, publish inaccurate or unfavorable research about our business or change their recommendations regarding our stock adversely, our stock price and trading volume could decline.
The trading market for our common stock is influenced in part by the research and other reports that industry or securities analysts may publish about us or our business. We currently have, but may not be able to continue, research coverage by industry or financial analysts. If analysts do not continue coverage of us, the trading price of our stock would likely be negatively impacted. Even if analyst coverage continues, if one or more of the analysts who cover us downgrade our stock, or if analysts issue other unfavorable commentary or inaccurate research, our stock price would likely decline. If one or more of these analysts cease coverage of our company or fail to regularly publish reports on us, we could lose visibility in the financial markets, which in turn could cause our stock price or trading volume to decline.
26
Table of Contents
Future sales of our common stock in the public market could cause our stock price to fall.
If our principal stockholder, Lone Star, sells additional substantial amounts of our common stock in the public market following this offering, the market price of our common stock could decrease significantly. The perception in the public market that Lone Star might sell substantial amounts of our common stock could also depress the market price of our common stock. Any such sale or perception could also impair our ability to raise capital or pay for acquisitions using our equity securities.
Immediately after completion of this offering, we will have 44,069,000 shares of common stock outstanding, including 23,539,250 shares that will be beneficially owned by Lone Star (or 22,489,250 shares if the underwriters exercise their option to purchase additional shares in full) or approximately 53.4% of our outstanding shares of common stock (or 51.0% if the underwriters exercise their option to purchase additional shares in full). Unless such shares are registered under the Securities Act of 1933, as amended, or the Securities Act, such shares may only be resold into the public markets in accordance with the requirements of Rule 144, including the volume limitations, manner of sale requirements and notice requirements thereof. See “Shares Eligible for Future Sale.” Additionally, we, Lone Star, and our officers and directors have signed lock-up agreements with the underwriters that will, subject to certain exceptions, restrict the sale of shares of our common stock held by them for 90 days following the date of this prospectus. The underwriters may, without notice except in certain limited circumstances, release all or any portion of the shares of common stock subject to lock-up agreements. See “Underwriting” for a description of these lock-up agreements. Upon the expiration of the lock-up agreements described above, all of such shares will be eligible for resale in the public market, subject in the case of shares held by our affiliates, to the volume, manner of sale and other limitations under Rule 144. We expect that Lone Star will be considered an affiliate of us after this offering based on their expected share ownership following this offering.
After completion of this offering, Lone Star will continue to have the right to demand that we file a registration statement with respect to the shares of our common stock held by it, and will have the right to include its shares in any registration statement that we file with the SEC, subject to certain exceptions. See “Shares Eligible for Future Sale.” Any registration of the shares owned by Lone Star would enable those shares to be sold in the public market, subject to certain restrictions in our registration rights agreement and the restrictions under the lock-up agreements referred to above.
The market price for shares of our common stock may drop significantly when the restrictions on resale by our existing stockholder lapse or if those restrictions on resale are waived. A decline in the price of shares of our common stock might impede our ability to raise capital through the issuance of additional shares of our common stock or other equity securities. In addition, we filed a registration statement on Form S-8 under the Securities Act registering shares under our stock incentive plan. Subject to the terms of the awards granting the shares included in this registration statement and except for shares held by affiliates who will have certain restrictions on their ability to sell, the shares are available for sale in the public market immediately after the vesting of the applicable award. See “Shares Eligible for Future Sale.”
In the future, we expect to issue options, restricted stock and other forms of stock-based compensation, which have the potential to dilute stockholder value and cause the price of our common stock to decline.
We currently have options outstanding to purchase 142,000 shares of common stock under our stock incentive plan, none of which are currently exercisable, and 75,000 shares of restricted stock. We expect to offer stock options, restricted stock and other forms of stock-based compensation to our directors, officers and employees in the future. If any options that we issue are exercised, or any restricted stock that we may issue vests, and those shares are sold into the public market, the market price of our common stock may decline. In addition, the availability of shares of common stock for award under our equity incentive plan, or the grant of stock options, restricted stock or other forms of stock-based compensation, may adversely affect the market price of our common stock.
27
Table of Contents
Our ability to raise capital in the future may be limited.
Our business and operations may consume resources faster than we anticipate. In the future, we may need to raise additional funds through the issuance of new equity securities, debt or a combination of both. Additional financing may not be available on favorable terms, or at all. If adequate funds are not available on acceptable terms, we may be unable to fund our capital requirements. If we issue new debt securities, the debt holders would have rights senior to common stockholders to make claims on our assets, and the terms of any debt could restrict our operations, including our ability to pay dividends on our common stock. If we issue additional equity securities, existing stockholders will experience dilution, and the new equity securities could have rights senior to those of our common stock. Because our decision to issue securities in any future offering will depend on market conditions and other factors beyond our control, we cannot predict or estimate the amount, timing or nature of our future offerings. Thus, our stockholders bear the risk of our future securities offerings reducing the market price of our common stock and diluting their interest.
We are a holding company and depend on the cash flow of our subsidiaries.
We are a holding company with no material assets other than the equity interests of our subsidiaries. Our subsidiaries conduct substantially all of our operations and own substantially all of our assets and intellectual property. Consequently, our cash flow and our ability to meet our obligations and pay any future dividends to our stockholders depends upon the cash flow of our subsidiaries and the payment of funds by our subsidiaries directly or indirectly to us in the form of dividends, distributions and other payments. Any inability on the part of our subsidiaries to make payments to us could have a material adverse effect on our business, financial condition and results of operations.
Provisions of our charter documents, Delaware law and other documents could discourage, delay or prevent a merger or acquisition at a premium price.
Provisions in our certificate of incorporation and bylaws may have the effect of delaying or preventing a change of control or changes in our management. For example, our certificate of incorporation and bylaws include provisions that:
| • | permit us to issue, without stockholder approval, preferred stock in one or more series and, with respect to each series, fix the number of shares constituting the series and the designation of the series, the voting powers, if any, of the shares of the series and the preferences and other special rights, if any, and any qualifications, limitations or restrictions, of the shares of the series; |
| • | prevent stockholders from calling special meetings; |
| • | restrict the ability of stockholders to act by written consent after such time as Lone Star owns less than a majority of our common stock; |
| • | limit the ability of stockholders to amend our certificate of incorporation and bylaws; |
| • | require advance notice for nominations for election to the board of directors and for stockholder proposals; |
| • | do not permit cumulative voting in the election of our directors, which means that the holders of a majority of our common stock may elect all of the directors standing for election; and |
| • | establish a classified board of directors with staggered three-year terms. |
These provisions may discourage, delay or prevent a merger or acquisition of our company, including a transaction in which the acquiror may offer a premium price for our common stock.
We are also subject to Section 203 of the Delaware General Corporation Law, or the DGCL, which, subject to certain exceptions, prohibits us from engaging in any business combination with any interested stockholder, as
28
Table of Contents
defined in that section, for a period of three years following the date on which that stockholder became an interested stockholder. In addition, our equity incentive plan permits vesting of stock options and restricted stock, and payments to be made to the employees thereunder in certain circumstances, in connection with a change of control of our company, which could discourage, delay or prevent a merger or acquisition at a premium price. In addition, our credit facility, and other debt instruments we may enter into in the future, may include provisions entitling the lenders to demand immediate repayment of all borrowings upon the occurrence of certain change of control events relating to our company, which also could discourage, delay or prevent a business combination transaction. See “Description of Capital Stock—Provisions of Our Certificate of Incorporation and Bylaws and Delaware Law That May Have an Anti-Takeover Effect.”
Our certificate of incorporation includes a forum selection clause, which could limit our stockholders’ ability to obtain a favorable judicial forum for disputes with us.
Our certificate of incorporation provides that, unless we consent in writing to the selection of an alternative forum, the sole and exclusive forum for any stockholder (including any beneficial owner) to bring (i) any derivative action or proceeding brought on our behalf, (ii) any action asserting a claim of breach of a fiduciary duty owed by any of our directors, officers, or employees to us or to our stockholders, (iii) any action asserting a claim arising pursuant to any provision of the DGCL or our certificate of incorporation or bylaws, or (iv) any action asserting a claim governed by the internal affairs doctrine, will be a state court located within the State of Delaware (or, if no state court located within the State of Delaware has jurisdiction, the federal district court for the District of Delaware); in all cases subject to the court’s having personal jurisdiction over the indispensable parties named as defendants. Any person or entity purchasing or otherwise acquiring any interest in shares of our capital stock is deemed to have notice of and consented to the foregoing provisions. This forum selection provision in our certificate of incorporation may limit our stockholders’ ability to obtain a favorable judicial forum for disputes with us. It is also possible that, notwithstanding the forum selection clause included in our certificate of incorporation, a court could rule that such a provision is inapplicable or unenforceable. See “Description of Capital Stock—Forum Selection Clause.”
Our internal controls over financial reporting may not be effective and our independent registered public accounting firm may not be able to certify as to their effectiveness, which could have a significant and adverse effect on our business and reputation.
As a public company, we are required to comply with the SEC’s rules implementing Sections 302 and 404 of the Sarbanes-Oxley Act, which require management to certify financial and other information in our quarterly and annual reports and provide an annual management report on the effectiveness of controls over financial reporting. Though we are required to disclose changes made in our internal controls and procedures on a quarterly basis, we will not be required to make our first annual assessment of our internal controls over financial reporting pursuant to Section 404 until the filing of our Annual Report on Form 10-K for fiscal year 2014. Additionally, as an “emerging growth company,” as defined in the JOBS Act, our independent registered public accounting firm will not be required to formally attest to the effectiveness of our internal controls over financial reporting pursuant to Section 404 until the later of the filing our Annual Report on Form 10-K for fiscal year 2014 or the date we are no longer an emerging growth company. At such time, our independent registered public accounting firm may issue a report that is adverse in the event that it is not satisfied with the level at which our controls are documented, designed or operating.
To comply with the requirements of being a public company, we may need to undertake various actions, such as implementing new internal controls and procedures and hiring accounting or internal audit staff. Testing and maintaining internal controls can divert our management’s attention from other matters that are important to the operation of our business. In addition, when evaluating our internal controls over financial reporting, we may identify material weaknesses that we may not be able to remediate in time to meet the applicable deadline imposed upon us for compliance with the requirements of Section 404. If we identify material weaknesses in our internal controls over financial reporting or are unable to comply with the requirements of Section 404 in a
29
Table of Contents
timely manner or assert that our internal controls over financial reporting is effective, or if our independent registered public accounting firm is unable to express an opinion as to the effectiveness of our internal controls over financial reporting, investors may lose confidence in the accuracy and completeness of our financial reports and the market price of our common stock could be negatively affected, and we could become subject to investigations by the SEC or other regulatory authorities, which could require additional financial and management resources.
We are an “emerging growth company” and we cannot be certain if the reduced disclosure requirements applicable to emerging growth companies will make our common stock less attractive to investors.
We are an “emerging growth company,” as defined in the JOBS Act, and we intend to take advantage of certain exemptions from various reporting requirements that are applicable to other public companies but not to emerging growth companies, including, but not limited to, an exemption from the auditor attestation requirement of Section 404 of the Sarbanes-Oxley Act, which may increase the risk that weaknesses or deficiencies in our internal control over financial reporting go undetected, and reduced disclosure obligations regarding executive compensation in our periodic reports and proxy statements, which may make it more difficult for investors and securities analysts to evaluate us.
Because we are an “emerging growth company” under the JOBS Act, we have included only three, rather than five, years of selected financial information. Accordingly, we have included only a limited operating history on which investors can base an evaluation of our business, results of operations and prospects.
We cannot predict if investors will find our common stock less attractive as a result of our taking advantage of these exemptions. If some investors find our common stock less attractive as a result of our choices, there may be a less active trading market for our common stock and our stock price may be more volatile. We may take advantage of these reporting exemptions until we are no longer an emerging growth company. We could be an emerging growth company until the last day of the fiscal year following the fifth anniversary of the completion of our initial public offering, although a variety of circumstances could cause us to lose that status earlier.
The requirements of being a public company may strain our resources and divert management’s attention, and our minimal public company operating experience may impact our business and stock price.
As a U.S. public company, we are subject to the reporting requirements of the Exchange Act, the Sarbanes-Oxley Act (other than the auditor attestation requirement of Section 404 while we continue to qualify as an “emerging growth company”), the Dodd-Frank Wall Street Reform and Consumer Protection Act, the listing requirements of the NYSE and other applicable securities rules and regulations. Compliance with these rules and regulations will increase our legal and financial compliance costs, make some activities more difficult, time-consuming or costly and increase demand on our systems and resources, particularly after we are no longer an “emerging growth company.” The Exchange Act requires, among other things, that we file annual, quarterly and current reports with respect to our business and operating results.
As a result of disclosure of information in this prospectus and in filings required of a public company, our business and financial condition will become more visible, which we believe may result in threatened or actual litigation, including by competitors and other third parties. If such claims are successful, our business and operating results could be harmed, and even if the claims do not result in litigation or are resolved in our favor, these claims, and the time and resources necessary to resolve them, could divert the resources of our management and adversely affect our business, brand and reputation and results of operations.
Being a public company and these new rules and regulations make it more expensive for us to obtain director and officer liability insurance. Potential liability associated with serving on a public company’s board could make it difficult for us to attract and retain qualified members of our board of directors, particularly to serve on our audit committee and compensation and benefits committee, and qualified executive officers.
30
Table of Contents
Our minimal public company operating experience may make it difficult to forecast and evaluate our future prospects. If we are unable to execute our business strategy, either as a result of our inability to effectively manage our business in a public company environment or for any other reason, our business, prospects, financial condition and results of operations may be harmed, which could cause our stock price to decline.
We will continue to incur increased costs as a result of being a publicly-traded company.
As a company with publicly-traded securities, we will continue to incur significant legal, accounting and other expenses not previously incurred. In addition, the Sarbanes-Oxley Act, as well as rules promulgated by the SEC and the NYSE, require us to adopt corporate governance practices applicable to U.S. public companies. These rules and regulations have increased our legal and financial compliance costs and may place a strain on our systems and resources. The Exchange Act requires that we file annual, quarterly and current reports with respect to our business and financial condition. The Sarbanes-Oxley Act requires that we maintain effective disclosure controls and procedures and internal controls over financial reporting. To maintain and improve the effectiveness of our disclosure controls and procedures, we will continue to commit significant resources, hire additional staff and provide additional management oversight. We have implemented additional procedures and processes for the purpose of addressing the standards and requirements applicable to public companies.
31
Table of Contents
This prospectus contains “forward-looking statements” within the meaning of Section 27A of the Securities Act and Section 21E of the Exchange Act, and such statements are subject to the safe harbors created thereby. These forward-looking statements are included throughout this prospectus, including in the sections entitled “Prospectus Summary,” “Risk Factors,” “Use of Proceeds,” “Management’s Discussion and Analysis of Financial Condition and Results of Operations,” “Business” and “Certain Relationships and Related Party Transactions,” and relate to matters such as our industry, business strategy, goals and expectations concerning our market position, future operations, margins, profitability, capital expenditures, liquidity, capital resources and other financial and operating information. We have used the words “approximately,” “anticipate,” “assume,” “believe,” “contemplate,” “continue,” “could,” “estimate,” “expect,” “future,” “intend,” “may,” “plan,” “potential,” “predict,” “project,” “seek,” “should,” “target,” “will” and similar terms and phrases to identify forward-looking statements in this prospectus. All of our forward-looking statements are subject to risks and uncertainties that may cause actual results to differ materially from those that we are expecting, including:
| • | cyclicality in our markets, especially the new residential construction market; |
| • | the highly competitive nature of our industry and the substitutability of competitors’ products; |
| • | disruptions in our supply of synthetic gypsum due to regulatory changes or coal-fired power plants ceasing or reducing operations or switching to natural gas; |
| • | changes to environmental and safety laws and regulations requiring modifications to our manufacturing systems; |
| • | disruptions to our supply of paperboard liner; |
| • | potential losses of customers; |
| • | changes in affordability of energy and transportation costs; |
| • | material disruptions at our facilities or the facilities of our suppliers; |
| • | changes in, cost of compliance with or the failure or inability to comply with governmental laws and regulations, in particular environmental regulations; |
| • | our involvement in legal and regulatory proceedings; |
| • | our ability to attract and retain key management employees; |
| • | disruptions in our information technology systems; |
| • | labor disruptions; |
| • | the seasonal nature of our business; |
| • | the effectiveness of our internal controls over financial reporting; |
| • | increased costs and demands on management as a public company; |
| • | our lack of public company operating experience; |
| • | our relationship, and actual and potential conflicts of interest, with Lone Star; and |
| • | additional factors discussed under the sections captioned “Risk Factors,” “Management’s Discussion and Analysis of Financial Condition and Results of Operations” and “Business.” |
The forward-looking statements contained in this prospectus are based on historical performance and management’s current plans, estimates and expectations in light of information currently available to us and are subject to uncertainty and changes in circumstances. There can be no assurance that future developments affecting us will be those that we have anticipated. Actual results may differ materially from these expectations due to changes in global, regional or local political, economic, business, competitive, market, regulatory and
32
Table of Contents
other factors, many of which are beyond our control. We believe that these factors include those described in “Risk Factors.” Should one or more of these risks or uncertainties materialize, or should any of our assumptions prove to be incorrect, our actual results may vary in material respects from what we may have expressed or implied by these forward-looking statements. We caution that you should not place undue reliance on any of our forward-looking statements. Any forward-looking statement made by us in this prospectus speaks only as of the date on which we make it. Factors or events that could cause our actual results to differ may emerge from time to time, and it is not possible for us to predict all of them. We undertake no obligation to publicly update any forward-looking statement, whether as a result of new information, future developments or otherwise, except as may be required by applicable securities laws.
33
Table of Contents
The selling stockholder will receive all net proceeds from the sale of the shares of common stock to be sold in this offering. We will not receive any of the proceeds from the sale of our common stock by the selling stockholder.
34
Table of Contents
PRICE RANGE OF OUR COMMON STOCK
Our common stock is listed on the NYSE under the symbol “CBPX.” The following table sets forth, for the periods indicated, the high and low sales prices per share for our common stock as quoted by the NYSE.
| 2014 |
High | Low | ||||||
| First Quarter (February 5, 2014 to March 31, 2014) |
$ | 20.51 | $ | 14.00 | ||||
| Second Quarter |
$ | 19.86 | $ | 14.00 | ||||
| Third Quarter |
$ | 17.90 | $ | 12.58 | ||||
| Fourth Quarter (October 1, 2014 to November 5, 2014) |
$ | 17.44 | $ | 13.27 | ||||
The closing sale price of a share of our common stock, as reported by the NYSE, on November 5, 2014, was $16.91. As of November 6, 2014, there were two holders of record of our common stock, not including beneficial owners of shares registered in nominee or street name.
35
Table of Contents
On December 2, 2013, we paid a distribution of $130 million to Lone Star from the increase in our borrowings under our First Lien Credit Agreement and Second Lien Credit Agreement. We have not made any other distributions on our equity since our formation on July 26, 2013.
We have no present intention to pay cash dividends on our common stock. Any determination to pay dividends to holders of our common stock will be at the discretion of our board of directors and will depend upon many factors, including our financial condition, results of operations, projections, liquidity, earnings, legal requirements, restrictions in our debt agreements and other factors that our board of directors deems relevant.
Our credit facility contains, and debt instruments that we enter into in the future may contain, covenants that place limitations on the amount of dividends we may pay. In addition, under Delaware law, our board of directors may declare dividends only to the extent of our surplus, which is defined as total assets at fair market value minus total liabilities, minus statutory capital, or, if there is no surplus, out of our net profits for the then current and immediately preceding year.
36
Table of Contents
The following table sets forth our cash and cash equivalents and capitalization as of September 30, 2014. You should read this table together with the information in this prospectus under “Selected Consolidated and Combined Financial Data,” “Management’s Discussion and Analysis of Financial Condition and Results of Operations” and “Description of Capital Stock,” and with the consolidated financial statements and the related notes to those statements included elsewhere in this prospectus.
| As of September 30, 2014 |
||||
| (in thousands, except share data) |
||||
| Cash and cash equivalents |
$ | 12,156 | ||
|
|
|
|||
| Debt: |
||||
| First Lien Credit Agreement |
$ | 376,988 | ||
| Borrowings under the Revolver |
— | |||
| Original issue discount |
(3,021 | ) | ||
|
|
|
|||
| Total debt |
$ | 373,967 | ||
|
|
|
|||
| Stockholders’ Equity: |
||||
| Undesignated preferred stock, par value $0.001 per share: 10,000,000 shares authorized, no shares issued and outstanding |
— | |||
| Common Stock, $0.001 par value per share, 44,069,000 shares issued and outstanding |
44 | |||
| Additional Paid-In Capital |
287,681 | |||
| Accumulated Other Comprehensive (Loss) |
(1,277 | ) | ||
| Accumulated earnings |
7,635 | |||
|
|
|
|||
| Total Stockholders’ Equity |
294,083 | |||
|
|
|
|||
| Total Capitalization |
$ | 668,050 | ||
|
|
|
|||
37
Table of Contents
SELECTED HISTORICAL FINANCIAL AND OPERATING DATA
The following financial data should be read in conjunction with the audited and unaudited financial statements and the related notes, and the unaudited pro forma combined financial information and the related notes, included elsewhere in this prospectus.
The financial statements included in this prospectus may not necessarily reflect our financial position, results of operations and cash flows as if we had operated as a stand-alone public company during all periods presented. Accordingly, the historical results should not be relied upon as an indicator of our future performance.
As discussed in more detail under “Business—The Acquisition,” we acquired the gypsum division of Lafarge North America Inc. on August 30, 2013. The accompanying financial statements are presented for the “Predecessor,” which are the combined financial statements of the Lafarge gypsum division for the period preceding the Acquisition, and the “Successor,” which are the consolidated financial statements of us and our subsidiaries for the period following the Acquisition. We were formed on July 26, 2013 and had no results of operations prior to the Acquisition on August 30, 2013. As such, our consolidated results of operations reflect activity of the acquired business for the four months from August 30, 2013 through December 31, 2013. The Predecessor’s combined statements of operations data for the years ended December 31, 2011 and 2012 and for the period from January 1, 2013 to August 30, 2013, and the Predecessor’s combined balance sheet data as of December 31, 2011 and 2012 have been derived from the audited combined financial statements of the Lafarge gypsum division, which are included elsewhere in this prospectus. Our balance sheet data as of December 31, 2013 and consolidated statements of operations for the period July 26, 2013 to December 31, 2013 are derived from the Successor audited consolidated financial statements, which are included elsewhere in this prospectus. Our balance sheet data as of September 30, 2013 and September 30, 2014 and consolidated statements of operations for the period July 26, 2013 to September 30, 2013 and the nine months ended September 30, 2014 are derived from the Successor unaudited consolidated financial statements, which are included elsewhere in this prospectus. The Predecessor’s financial statements may not necessarily be indicative of the cost structure or results of operations that would have existed if the gypsum division of Lafarge operated as a stand-alone, independent business. The Acquisition was accounted for as a business combination, which resulted in a new basis of accounting. The Predecessor’s and the Successor’s financial statements are not comparable as a result of applying a new basis of accounting. See the Notes to the audited consolidated financial statements for additional information regarding the accounting treatment of the Acquisition.
38
Table of Contents
The information presented below should be read in conjunction with the historical audited combined financial statements and related notes appearing elsewhere in this prospectus, the unaudited interim periods and related notes appearing elsewhere in this prospectus, and other financial information contained in “Risk Factors,” “The Acquisition,” and “Management’s Discussion and Analysis of Financial Condition and Results of Operations” in this prospectus.
| Historical | Pro forma | |||||||||||||||||||||||||||||||||
| Predecessor | Successor | |||||||||||||||||||||||||||||||||
|
(Unaudited) |
(Unaudited) | |||||||||||||||||||||||||||||||||
| Year ended December 31, |
January 1, to August 30, |
July 26, to December 31, |
July 26, to September 30, |
Nine Months Ended September 30, |
Year ended December 31, |
Nine Months Ended September 30, |
||||||||||||||||||||||||||||
| 2011 | 2012 | 2013 | 2013 | 2013 | 2014 | 2013 | 2013 | |||||||||||||||||||||||||||
| (in thousands, except per share and sales volume data) | ||||||||||||||||||||||||||||||||||
| Statement of operations data: |
||||||||||||||||||||||||||||||||||
| Net sales |
$ | 252,111 | $ | 311,410 | $ | 252,248 | $ | 150,066 | $ | 35,630 | $ | 303,692 | $ | 402,314 | $ | 287,878 | ||||||||||||||||||
| Costs, expenses and other income: |
||||||||||||||||||||||||||||||||||
| Cost of goods sold |
279,638 | 289,936 | 195,338 | 121,335 | 31,537 | 241,042 | 332,773 | 242,975 | ||||||||||||||||||||||||||
| Selling and administrative: |
||||||||||||||||||||||||||||||||||
| Direct |
23,844 | 27,194 | 19,338 | 14,953 | 6,200 | 23,358 | 34,806 | 25,924 | ||||||||||||||||||||||||||
| Allocated from Lafarge |
9,745 | 7,037 | 4,945 | — | — | — | 4,945 | 4,945 | ||||||||||||||||||||||||||
| Total costs and operating expenses |
313,227 | 324,167 | 219,621 | 136,288 | 37,737 | 264,400 | 372,524 | 273,844 | ||||||||||||||||||||||||||
| Operating income (loss) |
(61,116 | ) | (12,757 | ) | 32,627 | 13,778 | (2,107 | ) | 39,292 | 29,790 | 14,034 | |||||||||||||||||||||||
| Other income and (expenses): |
||||||||||||||||||||||||||||||||||
| Other (expense) income, net |
303 | (87 | ) | (191 | ) | (21 | ) | 85 | (5,461 | ) | (212 | ) | (106 | ) | ||||||||||||||||||||
| Interest expense, net |
(273 | ) | (212 | ) | (91 | ) | (10,542 | ) | (2,364 | ) | (24,518 | ) | (23,443 | ) | (17,486 | ) | ||||||||||||||||||
| Income (Loss) before (losses) earnings from equity method investment and income taxes |
(61,086 | ) | (13,056 | ) | 32,345 | 3,215 | (4,386 | ) | 9,313 | 6,135 | (3,558 | ) | ||||||||||||||||||||||
| (Losses) earnings on equity method investment |
228 | (138 | ) | (30 | ) | — | — | (257 | ) | — | — | |||||||||||||||||||||||
| Income (loss) before income taxes |
(60,858 | ) | (13,194 | ) | 32,315 | 3,215 | (4,386 | ) | 9,056 | 6,135 | (3,558 | ) | ||||||||||||||||||||||
| Income tax (expense) benefit |
316 | 352 | (130 | ) | (1,110 | ) | (254 | ) | (3,526 | ) | (1,240 | ) | (384 | ) | ||||||||||||||||||||
| Net income (loss) |
$ | (60,542 | ) | $ | (12,842 | ) | $ | 32,185 | 2,105 | $ | (4,640 | ) | $ | 5,530 | $ | 4,895 | $ | (3,942 | ) | |||||||||||||||
| Foreign currency translation adjustments |
1,144 | (1,197 | ) | 2,707 | (254 | ) | 266 | (1,079 | ) | 2,453 | 2,973 | |||||||||||||||||||||||
| Gain on derivatives qualifying as cash flow hedges |
— | — | — | — | — | 56 | — | — | ||||||||||||||||||||||||||
| Comprehensive income (loss) |
$ | (59,398 | ) | $ | (14,039 | ) | $ | 34,892 | 1,851 | $ | (4,374 | ) | $ | 4,507 | $ | 7,348 | $ | (969 | ) | |||||||||||||||
| Balance sheet data (at period end): |
||||||||||||||||||||||||||||||||||
| Cash |
$ | — | $ | — | N/A | $ | 11,822 | $ | 16,760 | $ | 12,156 | N/A | N/A | |||||||||||||||||||||
| Property, plant and equipment, net |
415,902 | 386,270 | N/A | 383,625 | 390,818 | 359,883 | N/A | N/A | ||||||||||||||||||||||||||
| Total assets |
576,044 | 556,746 | N/A | 740,376 | 757,960 | 716,592 | N/A | N/A | ||||||||||||||||||||||||||
| Total liabilities |
41,119 | 46,513 | N/A | 603,525 | 497,334 | 422,509 | N/A | N/A | ||||||||||||||||||||||||||
| Total equity |
534,925 | 510,233 | N/A | 136,851 | 260,626 | 294,083 | N/A | N/A | ||||||||||||||||||||||||||
| Other financial data: |
||||||||||||||||||||||||||||||||||
| EBITDA(1) |
$ | (33,062 | ) | $ | 23,574 | $ | 49,513 | $ | 32,307 | $ | 2,487 | $ | 80,616 | $ | 82,805 | $ | 53,114 | |||||||||||||||||
| Adjusted EBITDA(1) |
(19,352 | ) | 41,210 | 63,904 | 39,178 | 9,358 | 80,616 | 102,567 | 72,876 | |||||||||||||||||||||||||
| Adjusted EBITDA |
N/A | 13.2 | % | 25.3 | % | 26.1 | % | 26.3 | % | 26.5 | % | 25.5 | % | 25.3 | % | |||||||||||||||||||
| Capital expenditures |
$ | 5,863 | $ | 5,205 | $ | 2,506 | $ | 2,798 | $ | 43 | $ | 6,090 | $ | 5,304 | $ | 2,549 | ||||||||||||||||||
39
Table of Contents
| (1) | EBITDA, Adjusted EBITDA and Adjusted EBITDA margin are non-GAAP measures. See “Prospectus Summary—Summary Historical and Unaudited Pro Forma Combined Financial Information” for how we define and calculate EBITDA, Adjusted EBITDA and Adjusted EBITDA margin as non-GAAP measures, reconciliations thereof to operating income and a description of why we believe these measures are important. |
40
Table of Contents
UNAUDITED PRO FORMA COMBINED FINANCIAL INFORMATION
The following unaudited pro forma combined statements of operations data for the nine months ended September 30, 2014 and the years ended December 31, 2013 and 2012 has been derived by application of pro forma adjustments to our historical combined financial statements included elsewhere in this prospectus. The unaudited pro forma combined financial information is for illustrative and informational purposes only and does not purport to represent what our financial position or results of operations would have been if we had operated as a stand-alone public company during the periods presented or if the transactions described below had actually occurred as of the dates indicated, nor does it project our financial position at any future date or our results of operations or cash flows for any future period.
Our unaudited pro forma combined financial information has been prepared to reflect adjustments to our historical financial information that are: (1) directly attributable to the transactions described below; (2) factually supportable; and (3) expected to have a continuing impact on our results. The unaudited pro forma combined financial information does not include non-recurring items, including, but not limited to, legal and advisory fees related to our initial public offering. The unaudited pro forma combined financial information gives effect to the following transactions, or the Pro Forma Transactions, as if they had occurred as of January 1, 2012:
| • | the Acquisition; |
| • | the additional borrowings under our First and Second Lien Credit Agreements and the distribution of such borrowings to Lone Star; |
| • | the completion of our initial public offering; |
| • | use of the net proceeds of our initial public offering to repay debt; and |
| • | other adjustments described in the notes to the unaudited pro forma combined financial information. |
At the closing of the Acquisition, we entered into a transitional services agreement, under which Lafarge provides certain services to us that were previously provided when we were wholly owned by Lafarge for fees specified in that agreement. The services include corporate services, such as information technology, accounting and finance services, marketing support, customer support, treasury, facility and other corporate and infrastructural services. We will also incur additional costs for financial reporting and compliance, corporate governance, treasury and investor relations activities, which costs include additional compensation to current and future employees and professional fees to external service providers. In addition, general and administrative expenses are expected to increase further in the second year as a stand-alone public company due to duplication of costs arising from the continued services provided under the transitional services agreement and the development of stand-alone infrastructure. The duplicative costs from the transitional services agreement have not been quantified and are expected to be temporary. No pro forma adjustments have been made to the historical financial statements to reflect the additional costs and expenses described in this paragraph.
41
Table of Contents
Continental Building Products, Inc.
Pro Forma Combined Statement of Operations
Full Year Ended December 31, 2013
(Unaudited)
| Predecessor | Successor | |||||||||||||||||
| January 1 to August 30, 2013 |
July 26 to December 31, 2013 |
Pro Forma Adjustments |
December 31, 2013 Pro forma |
|||||||||||||||
| (in thousands) | ||||||||||||||||||
| Net Sales |
$ | 252,248 | $ | 150,066 | $ | — | $ | 402,314 | ||||||||||
| Costs, expenses and other income: |
||||||||||||||||||
| Cost of goods sold |
195,338 | 121,335 | 16,100 | (a) | 332,773 | |||||||||||||
| Selling and administrative: |
||||||||||||||||||
| Direct |
19,338 | 14,953 | 515 | (b) | 34,806 | |||||||||||||
| Allocated from Lafarge |
4,945 | — | — | 4,945 | ||||||||||||||
|
|
|
|
|
|
|
|
|
|||||||||||
| Total selling and administrative |
24,283 | 14,953 | 515 | 39,751 | ||||||||||||||
|
|
|
|
|
|
|
|
|
|||||||||||
| Total costs and operating expenses |
219,621 | 136,288 | 16,615 | 372,524 | ||||||||||||||
|
|
|
|
|
|
|
|
|
|||||||||||
| Operating income |
32,627 | 13,778 | (16,615 | ) | 29,790 | |||||||||||||
| Other (expense) income, net |
(191 | ) | (21 | ) | — | (212 | ) | |||||||||||
| Interest expense, net |
(91 | ) | (10,542 | ) | (12,810 | )(c) | (23,443 | ) | ||||||||||
|
|
|
|
|
|
|
|
|
|||||||||||
| Income (loss) before earnings (losses) on equity method investment and income tax |
32,345 | 3,215 | (29,425 | ) | 6,135 | |||||||||||||
|
|
|
|
|
|
|
|
|
|||||||||||
| Earnings (losses) from equity method investment |
(30 | ) | — | 30 | (d) | — | ||||||||||||
|
|
|
|
|
|
|
|
|
|||||||||||
| Income (loss) before income tax benefit |
32,315 | 3,215 | (29,395 | ) | 6,135 | |||||||||||||
| Income tax (expense) benefit |
(130 | ) | (1,110 | ) | — | (e) | (1,240 | ) | ||||||||||
|
|
|
|
|
|
|
|
|
|||||||||||
| Net income (loss) |
$ | 32,185 | $ | 2,105 | $ | (29,395 | ) | $ | 4,895 | |||||||||
|
|
|
|
|
|
|
|
|
|||||||||||
| Net income per share: |
||||||||||||||||||
| Basic |
$ | 0.07 | $ | 0.04 | (f) | $ | 0.11 | |||||||||||
| Diluted |
$ | 0.07 | $ | 0.04 | (f) | $ | 0.11 | |||||||||||
| Weighted average shares outstanding: |
||||||||||||||||||
| Basic |
32,304 | 11,765 | (f) | 44,069 | ||||||||||||||
| Diluted |
32,304 | 11,765 | (f) | 44,069 | ||||||||||||||
See accompanying notes to the unaudited pro forma statements of operations.
42
Table of Contents
Continental Building Products, Inc.
Pro Forma Combined Statement of Operations
Full Year Ended December 31, 2012
(Unaudited)
| Predecessor | ||||||||||||
| Year Ended December 31, 2012 |
Pro Forma Adjustments |
December 31, 2012 Pro forma |
||||||||||
| (in thousands) | ||||||||||||
| Net Sales |
$ | 311,410 | $ | — | $ | 311,410 | ||||||
| Costs, expenses and other income: |
||||||||||||
| Cost of goods sold |
289,936 | 32,132 | (a) | 322,068 | ||||||||
| Selling and administrative: |
||||||||||||
| Direct |
27,194 | 515 | (b) | 27,709 | ||||||||
| Allocated from Lafarge |
7,037 | — | 7,037 | |||||||||
|
|
|
|
|
|
|
|||||||
| Total selling and administrative |
34,231 | 515 | 34,746 | |||||||||
|
|
|
|
|
|
|
|||||||
| Total costs and operating expenses |
324,167 | 32,647 | 356,814 | |||||||||
| Operating income |
(12,757 | ) | (32,647 | ) | (45,404 | ) | ||||||
| Other (expense) income, net |
(87 | ) | (361 | ) | (448 | ) | ||||||
| Interest expense, net |
(212 | ) | (22,939 | )(c) | (23,151 | ) | ||||||
|
|
|
|
|
|
|
|||||||
| Income (loss) before earnings (losses) on equity method investment and income tax |
(13,056 | ) | (55,947 | ) | (69,003 | ) | ||||||
|
|
|
|
|
|
|
|||||||
| Earnings (losses) from equity method investment |
(138 | ) | 138 | (d) | — | |||||||
|
|
|
|
|
|
|
|||||||
| Income (loss) before income tax benefit |
(13,194 | ) | (55,809 | ) | (69,003 | ) | ||||||
| Income tax (expense) benefit |
352 | — | (e) | 352 | ||||||||
|
|
|
|
|
|
|
|||||||
| Net income (loss) |
$ | (12,842 | ) | $ | (55,809 | ) | $ | (68,651 | ) | |||
|
|
|
|
|
|
|
|||||||
| Net income per share, basic and diluted: |
||||||||||||
| Basic |
$ | (1.56 | )(f) | $ | (1.56 | ) | ||||||
| Diluted |
$ | (1.56 | )(f) | $ | (1.56 | ) | ||||||
| Weighted average shares outstanding: |
||||||||||||
| Basic |
44,069 | (f) | 44,069 | |||||||||
| Diluted |
44,069 | (f) | 44,069 | |||||||||
See accompanying notes to the unaudited pro forma statements of operations.
43
Table of Contents
Continental Building Products, Inc.
Pro Forma Combined Statements of Operations for the
Nine Months Ended September 30, 2013
(Unaudited)
| Successor | Predecessor | Pro Forma | ||||||||||||||||
| July 26 - September 30, 2013 |
January 1 - August 30, 2013 |
Pro forma Adjustments |
Nine Months Ended September 30, 2013 |
|||||||||||||||
| (in thousands, except per share data) | ||||||||||||||||||
| Net Sales |
$ | 35,630 | $ | 252,248 | $ | — | $ | 287,878 | ||||||||||
| Costs, expenses and other income: |
||||||||||||||||||
| Cost of goods sold |
31,537 | 195,338 | 16,100 | (a) | 242,975 | |||||||||||||
| Selling and administrative: |
||||||||||||||||||
| Direct |
6,200 | 19,338 | 386 | (b) | 25,924 | |||||||||||||
| Allocated from Lafarge |
— | 4,945 | — | 4,945 | ||||||||||||||
|
|
|
|
|
|
|
|
|
|||||||||||
| Total selling and administrative |
6,200 | 24,283 | 386 | 30,869 | ||||||||||||||
|
|
|
|
|
|
|
|
|
|||||||||||
| Total costs and operating expenses |
37,737 | 219,621 | 16,486 | 273,844 | ||||||||||||||
|
|
|
|
|
|
|
|
|
|||||||||||
| Operating income (loss) |
(2,107 | ) | 32,627 | (16,486 | ) | 14,034 | ||||||||||||
| Other (expense) income, net |
85 | (191 | ) | — | (106 | ) | ||||||||||||
| Interest expense, net |
(2,364 | ) | (91 | ) | (15,031 | )(c) | (17,486 | ) | ||||||||||
|
|
|
|
|
|
|
|
|
|||||||||||
| Income (loss) before earnings (losses) on equity method investment and income tax |
(4,386 | ) | 32,345 | (31,517 | ) | (3,558 | ) | |||||||||||
| Earnings (losses) from equity method investment |
— | (30 | ) | 30 | (d) | — | ||||||||||||
|
|
|
|
|
|
|
|
|
|||||||||||
| Income (loss) before income tax |
(4,386 | ) | 32,315 | (31,487 | ) | (3,558 | ) | |||||||||||
| Income tax (expense) benefit |
(254 | ) | (130 | ) | — | (e) | (384 | ) | ||||||||||
|
|
|
|
|
|
|
|
|
|||||||||||
| Net income (loss) |
$ | (4,640 | ) | $ | 32,185 | $ | (31,487 | ) | $ | (3,942 | ) | |||||||
|
|
|
|
|
|
|
|
|
|||||||||||
| Net income per share: |
||||||||||||||||||
| Basic |
$ | (0.14 | ) | $ | 0.06 | (f) | $ | (0.09 | ) | |||||||||
| Diluted |
$ | (0.14 | ) | $ | 0.06 | (f) | $ | (0.09 | ) | |||||||||
| Weighted average shares outstanding: |
||||||||||||||||||
| Basic |
32,304 | 11,765 | (f) | 44,069 | ||||||||||||||
| Diluted |
32,304 | 11,765 | (f) | 44,069 | ||||||||||||||
44
Table of Contents
NOTES TO THE UNAUDITED PRO FORMA STATEMENTS OF OPERATIONS:
(a) Purchase Accounting
The unaudited pro forma combined statements of operations reflect an adjustment for the increase in depreciation and amortization expenses related to the fair value adjustments to tangible and long-lived intangible assets with definite lives assuming the Acquisition occurred at January 1, 2012. The incremental pro forma amortization expense for long-lived intangible assets with definite lives was $10.4, $10.4 and $20.4 million for the nine months ended September 30, 2013 and full year 2013 and 2012, respectively. The incremental pro forma depreciation expense for long-lived tangible assets was $7.2, $7.2 and $10.2 million for the nine months ended September 30, 2013 and full year 2013 and 2012, respectively.
The unaudited combined statements of operations also reflect an adjustment to increase cost of sales by $1.5 million for the 2012, with a corresponding reduction to cost of sales for the nine months ended September 30, 2013 and full year 2013. This reflects the turn through cost of sales of inventory that was stepped up to fair value assuming that the transaction occurred on January 1, 2012.
(b) Equity Awards
In conjunction with our initial public offering that we completed in February 2014, we granted approximately 142,000 stock options and 75,000 restricted shares to employees. The fair value of the restricted shares is based on the share price on the date of grant, which was the offering price of $14.00 per share. The fair value of the stock options was determined using the Black Scholes option pricing model as described in Note 16 to the unaudited interim financial statements for the nine months ended September 30, 2014 included elsewhere in this prospectus. The unaudited combined statements of operations reflect compensation expense for this award assuming the awards were granted on January 1, 2012. Pro forma compensation expense of $0.4, $0.5 and $0.5 million has been recognized in selling and administrative expense for the nine months ended September 30, 2013 and full year 2013 and 2012, respectively, based on a vesting period of four years.
(c) Debt financing
In connection with the Acquisition, we entered into a $320 million First Lien Credit Agreement that also included a revolving credit facility of up to $50 million U.S. dollars, and a $120 million Second Lien Credit Agreement. At the closing of the Acquisition, US $28.5 million was borrowed under the Revolver. On December 2, 2013, we entered into amendments to the First Lien Credit Agreement and the Second Lien Credit Agreement pursuant to which we issued additional term loans in an aggregate principal amount of $95 million under the First Lien Credit Agreement and $35 million under the Second Lien Credit Agreement with the proceeds distributed as a return of capital to our owner, Lone Star. On February 10, we used the proceeds from our initial public offering to completely repay the $155 million due under the Second Lien Credit Agreement. For our pro forma statements of operations, all three of these events are assumed to have happened on January 1, 2012 and result in the unaudited pro forma combined statements of operations reflecting an adjustment for interest expense and the amortization of deferred financing costs on the $415 million First Lien term loans and approximately $28.5 million Revolver borrowings. Incremental pro forma interest expense was $15.0, $12.8 and $22.9 million for the nine months ended September 30, 2013 and full year 2013 and 2012, respectively.
The borrowings for the debt assumed to be outstanding at January 1, 2012 are floating rate at LIBOR plus a specified spread (plus 3.75% for the First Lien Term Loans and plus 3% for the Revolver), with the agreements stipulating a LIBOR floor of 1%. A rise of current interest rate levels to above the 1% floor would be required to increase our interest expense and a reduction in interest rates would have no impact. As of December 31, 2013, we had elected to use three month LIBOR with a rate of 0.25%. A hypothetical 1% increase in interest rates would have increased interest expense by $0.7 and $1.1 million for the pro forma nine months ended September 30, 2013 and full year 2013.
45
Table of Contents
The termination fee of $2.0 million for the asset advisory agreement with an affiliate of Lone Star and the $3.1 million for the 2% call premium on early repayment of our Second Lien Credit Agreement were not included in the pro forma income statement as each represents a non-recurring expense.
(d) Interest in Seven Hills
As of the Acquisition and through December 31, 2013, the equity interest in Seven Hills remained with Lafarge. Under the terms of the Asset Purchase Agreement entered into in connection with the Acquisition, Lafarge is passing through all of the benefits and burdens of the Joint Venture Agreement and the other operative agreements to us, and our supply of paper from the joint venture has continued after the closing of the Acquisition under the same terms and conditions as existed prior to the Acquisition. We elected to measure this financial interest in Seven Hills at fair value and the pro forma combined statements of operations eliminate the equity earnings of this investment.
(e) Income taxes
Due to our limited history and the history of pre-tax losses generated by the Predecessor, deferred tax benefits were not recorded on the pro forma adjustments.
(f) Adjustment to earnings per share and shares outstanding
On December 3, 2013, LSF8 Gypsum Holdings Company, LLC, the entity formed to complete the Acquisition, was converted into Continental Building Products, Inc., a Delaware corporation, the company issuing the common stock that was sold in our initial public offering. At its formation, Continental Building Products, Inc. had outstanding one thousand shares of common stock at a par value of $0.001 per share. An adjustment has been made to reflect the stock split of 32,304 new shares for every one existing share that resulted in 32.3 million shares outstanding just prior to the initial public offering.
Because the net proceeds were used to repay debt, a pro forma adjustment has been made to increase the weighted average number of shares for the entire equity offering as if the offering occurred on January 1, 2012. A corresponding adjustment to lower interest expense, as described in pro forma note (c) above, was made to reflect the lower debt from the offering proceeds.
The following summarizes the calculation of the pro forma weighted average shares outstanding (in thousands):
| Common stock outstanding after stock split and prior to the initial public offering |
32,304 | |||
| Common stock offered to the public in the initial public offering |
11,765 | |||
|
|
|
|||
| Pro forma weighted average shares outstanding—basic and diluted |
44,069 |
Note that a dividend declared in the latest year is deemed to be in contemplation of the initial public offering with the intention of repayment out of the offering proceeds to the extend the dividend exceeded earnings during the previous twelve months. As the proceeds of the initial public offering were used to reduce debt (refer to pro forma note (c) above), the entire 11.8 million shares issued in the initial public offering have already been included in the pro forma weighted average shares outstanding as of January 1, 2012. As such, no additional adjustment to the weighted average shares need be made in connection with the dividend.
46
Table of Contents
MANAGEMENT’S DISCUSSION AND ANALYSIS
OF FINANCIAL CONDITION AND RESULTS OF OPERATIONS
The following discussion and analysis is intended to help the reader understand our business, financial condition, results of operations, liquidity and capital resources. You should read this discussion in conjunction with “Selected Historical Financial and Operating Data,” and our financial statements and the related notes beginning on page F-1 of this prospectus.
Until the consummation of the Acquisition, the gypsum division of Lafarge held all of the historical assets and liabilities related to our business and is referred to as the “Predecessor.” We believe it is more meaningful also to present the historical results of operations of the Predecessor. Also included in the discussion below are the unaudited pro forma combined results of operations for the years ended December 31, 2013 and 2012 and the nine months ended September 30, 2013. The unaudited pro forma combined results of operations are based on our historical financial statements included elsewhere in this prospectus, adjusted to give effect to the Acquisition, dividend recapitalization, and our initial public offering, assuming such transactions had been completed as of January 1, 2012. The unaudited pro forma combined results of operations are presented since the historical results for 2013 are not comparable to the corresponding 2012 period, nor are the historical results for the nine months ended September 30, 2014 comparable to the corresponding period of 2013. As discussed in this prospectus, the Acquisition occurred on August 30, 2013, and therefore the 2013 historical results are presented separately for the period from January 1, 2013 to August 30, 2013 (Predecessor basis) and the periods from July 26, 2013 to September 30, 2013 and July 26, 2013 to December 31, 2013 (Successor basis). Accordingly, it is difficult to make comparisons of the historical results for 2013 to the historical results of 2012 or of the historical results for the nine months ended September 30, 2014 to the nine months ended September 30, 2013. We believe it is a more meaningful and useful discussion to compare the results of operations for the 2013 and 2012 periods on a combined pro forma basis and the actual historical nine months ended September 30, 2014 to the pro forma nine months ended September 30, 2013. The combined pro forma results discussed herein are derived from the combined pro forma financial information presented in “Unaudited Pro Forma Combined Financial Information” included in this prospectus
It should be noted, however, that the historical results for net sales for the period from January 1, 2013 to August 30, 2013, when combined with the historical results for net sales for the period from July 26, 2013 to September 30, 2013 and July 26, 2013 to December 31, 2013, as applicable, are the same as on a pro forma basis. Accordingly, the following analyzes the Company, the Predecessor, and the pro forma combined results of operations for the years ended December 31, 2013 and 2012 and for the nine months ended September 30, 2014 to the nine months ended September 30, 2013.
Unless otherwise specified, references in this prospectus to “our,” “we,” “us,” the “Company” and “our business” (i) for periods prior to the completion of the Acquisition, refer to the gypsum division of Lafarge and (ii) for periods after completion of the Acquisition refer to Continental Building Products, Inc., in each case together with its consolidated subsidiaries.
This management’s discussion and analysis of financial condition and results of operations contains forward-looking statements that involve risks, uncertainties and assumptions. See “Forward-Looking Statements” for a discussion of the risks, uncertainties and assumptions associated with those statements. Our actual results may differ materially from those discussed in the forward-looking statements as a result of various factors, including but not limited to those in “Risk Factors” and included in other portions of this prospectus.
Overview
We are a leading manufacturer of gypsum wallboard and complementary finishing products in the eastern United States and eastern Canada. We operate highly efficient and automated manufacturing facilities that produce a full range of gypsum wallboard products for our diversified customer base. We sell our products in the new residential, R&R and commercial construction markets. We believe our operating efficiencies, favorable plant locations, manufacturing expertise and focus on delivering superior customer service position us to benefit from an anticipated increase in gypsum wallboard demand as the housing market recovers from historic lows.
47
Table of Contents
Basis of Presentation
The historical consolidated financial statements for the period July 26, 2013 to December 31, 2013 and for the nine months ended September 30, 2014, which are discussed below, include operating results from the acquired gypsum business of Lafarge, which was acquired on August 30, 2013. Prior to August 30, 2013, the Company had no operating activity. As such, unaudited pro forma combined results of operations are presented because management believes they provide a meaningful comparison of operating results for the year ended December 31, 2013, to December 31, 2012, and the nine months ended September 30, 2014 to the nine months ended September 30, 2013, with both 2013 periods and the 2012 period adjusted for the impact of the Acquisition.
The historical combined financial statements of the Predecessor, which are discussed below, are prepared in accordance with GAAP and are derived from Lafarge’s consolidated financial statements and accounting records using the historical results of operations and assets and liabilities attributed to the gypsum operations, and include allocations of expenses from Lafarge. The historical financial statements and pro forma financial statements are not necessarily indicative of future performance or representative of the amounts that would have been incurred had we been a separate, stand-alone entity that operated independently of Lafarge during the periods prior to the consummation of the Acquisition.
The Predecessor statements of operations include expense allocations for certain corporate functions historically provided by Lafarge. These allocated costs primarily related to corporate administrative expenses, employee-related costs, including pensions and other benefits for corporate and shared employees, and rental and usage fees for shared assets for the following functional groups: information technology, legal services, accounting and finance services, human resources, marketing and contract support, customer support, treasury, facility and other corporate and infrastructural services. The costs of such services have been allocated based on the most meaningful respective allocation methodologies for the service provided, primarily based on proportionate revenue, proportionate headcount or proportionate direct labor costs compared to Lafarge and/or its subsidiaries. These allocations are reflected in selling and administrative expenses in the Predecessor statements of operations and totaled $4.9 million for the period January 1 to August 30, 2013, $7.0 million for the year ended December 31, 2012 and $9.7 million for the year ended December 2011.
Included in the allocations for the Predecessor are $3.0 million for the period January 1, to August 30, 2013, and $5.3 million and $3.6 million for the years ended December 31, 2011 and 2012, respectively, representing payments to Lafarge S.A. for use of the Lafarge brand under the master brand agreements which are not incurred by us as a public company. We consider these allocations to be a reasonable reflection of the utilization of services provided. The allocations may not, however, reflect the expense that we would have incurred as a stand-alone company. Actual costs that may have been incurred if we had been a stand-alone public company in 2011 and 2012 would depend on a number of factors, including our chosen organizational structure, what functions were outsourced or performed by our employees and strategic decisions made in areas such as information technology systems and infrastructure. In addition, general and administrative expenses are expected to increase in future periods as a stand-alone public company due to duplication of costs arising from the continued services provided under the transitional services agreement and the development of stand-alone infrastructure. The duplicative costs from the transitional services agreement have not been quantified and are expected to be temporary. See Note 11 to the audited combined financial statements and Note 10 to the unaudited financial statements included elsewhere in this prospectus.
Prior to the consummation of the Acquisition, the Predecessor used Lafarge’s centralized processes and systems for cash management, payroll, and purchasing. As a result, substantially all cash received by the Predecessor was deposited in and commingled with Lafarge’s general corporate funds and was not specifically allocated to the business. The net results of these cash transactions between Lafarge and the Predecessor are reflected as net Lafarge investment within equity in the combined balance sheets of the Predecessor included elsewhere in this prospectus. In addition, the net Lafarge investment represents Lafarge’s interest in the recorded net assets of the business and represents the cumulative net investment by Lafarge in the business through the dates presented, inclusive of cumulative operating results.
48
Table of Contents
Due to these and other changes in connection with our initial public offering, the historical financial information included in this prospectus is not necessarily indicative of our financial position, results of operations and cash flows in the future or what our financial position, results of operations and cash flows would have been had we been a separate, stand-alone entity that operated independently of Lafarge prior to the consummation of the Acquisition.
Our primary reportable segment is wallboard, which accounted for approximately 96% of our net sales for the nine months ended September 30, 2014 and 2013 full year net sales on a pro forma basis and 95% of 2012 net sales. We also operate other business activities, primarily finishing products, which complement our full range of wallboard products. See Note 14 to the audited combined financial statements and Note 15 to the unaudited financial statements included elsewhere in this prospectus.
Corporate Separation Transactions
Our business was operated as a division of Lafarge from 1996 until August 30, 2013, and our assets, liabilities and operating results were included in the consolidated financial statements of Lafarge during that time. As part of the Acquisition, Lafarge transferred to us the assets and liabilities of its gypsum division reflected in the combined financial statements included elsewhere in this prospectus. See “Certain Relationships and Related Party Transactions.”
Our audited and unaudited financial statements included elsewhere in this prospectus, which are discussed below, reflect the historical financial position, results of operations and cash flows of the business that was transferred to us from Lafarge pursuant to the Acquisition.
Factors Affecting our Results
Our net sales are a function of shipped volume and average net selling price. Traditionally, new housing starts have been the most significant driver of U.S. wallboard demand. Starting in 2007, the wallboard industry suffered a dramatic decrease in demand, coinciding with the significant downturn of the U.S. housing market and the associated credit crisis and global recession. U.S. housing starts fell from a cyclical peak of 2.1 million in 2005 to a low of 554,000 in 2009. Correspondingly, U.S. wallboard consumption declined by more than 50% from 36.2 bsf in 2005 to a low of 17.1 bsf in 2010. Pricing across the industry suffered over this period due to the decline in demand. Industry-wide wallboard capacity contracted during the housing downturn from a peak of approximately 39.6 bsf in 2008 to a low of 31.9 bsf in 2012 as producers shuttered older and less efficient facilities or mothballed unneeded capacity. The U.S. housing market is in the early stages of a recovery. Housing starts reached 780,600 in 2012, driving U.S. wallboard consumption to 18.9 bsf, and 925,000 in 2013. We were able to increase prices in the first quarter of 2012, the first quarter of 2013 and again in the first quarter of 2014. We and certain other wallboard manufacturers have announced price increases to be effective in January 2015. We anticipate that improving market conditions in 2014 and 2015 will drive continued growth in U.S. wallboard demand, higher industry volumes and continuation of a stronger pricing environment.
Paper and synthetic gypsum are our principal wallboard raw materials. Paper constitutes our most significant input cost and the most significant driver of our variable manufacturing costs. Energy costs, consisting of natural gas and electricity, and synthetic gypsum are the other key components of variable manufacturing costs. In total, manufacturing cash costs represented 61%, 63%, 62% and 61% of our cost of goods sold for the nine months ended September 30, 2014 (Successor), pro forma nine months ended September 30, 2013 and pro forma full years 2013 and 2012, respectively. Depreciation and amortization represented 17%, 16%, 16%, and 20% of our costs of goods sold for the nine months ended September 30, 2014 (Successor), pro forma nine months ended September 30, 2013, and the pro forma full years 2013 and 2012, respectively. Distribution costs to deliver product to our customers represented the remaining portion of our costs of goods sold, or approximately 22%, 21%, 22% and 19% of our costs of goods sold for the nine months ended September 30, 2014 (Successor), pro forma nine months ended September 30, 2013, and the pro forma full years 2013 and 2012, respectively.
49
Table of Contents
Variable manufacturing costs, including inputs such as paper, gypsum, natural gas, and other raw materials, represented 70%, 64%, 66%, and 65% of our manufacturing cash costs for the nine months ended September 30, 2014 (Successor), pro forma nine months ended September 30, 2013, and the pro forma full years 2013 and 2012, respectively. Fixed production costs excluding depreciation and amortization consisted of labor, maintenance, and other costs that represented 30%, 36%, 34%, and 35% of manufacturing cash costs for the nine months ended September 30, 2014 (Successor), pro forma nine months ended September 30, 2013, and the pro forma full years 2013 and 2012, respectively.
We currently purchase substantially all of our paperboard liner from Seven Hills, a joint venture that was originally between Lafarge and RockTenn, but was assigned to us by Lafarge effective March 13, 2014. Under the agreement with Seven Hills, the price of paper adjusts based on changes in the underlying costs of production of the paperboard liner, of which the two most significant are recovered waste paper and natural gas. The largest waste paper source used by the operation is old cardboard containers, or OCC. For our Predecessor financial statements, prior to the Acquisition, Lafarge treated the joint venture as a variable interest entity in which we were not the primary beneficiary and accounted for our investment in the joint venture using the equity method. For our Successor financial statements, we recorded an asset for the financial interest in Seven Hills at fair value through March 13, 2014, the date of assignment of the venture from Lafarge to us. Since this assignment, we have accounted for Seven Hills as an equity investment. Seven Hills has the capacity to supply us with approximately 75% of our paper needs at our full capacity utilization and all of our needs at current capacity utilization on market-based pricing terms that we consider favorable. We believe we can also purchase additional paper on the spot market at competitive prices. We manufacture all of our wallboard products using synthetic gypsum. We purchase almost all of our synthetic gypsum supplies from coal-fired power plants that are easily accessible to our wallboard facilities. To secure our gypsum supplies, we have entered into long-term agreements with major suppliers, with remaining terms (with extensions) ranging from approximately 11 years to 35 years. Our supply contracts provide for a base price with escalation provisions. These contracts are generally structured as “take-or-pay” arrangements, where the sellers are required to supply a specified annual amount of gypsum and we are required to buy a specified annual amount, or else, in either case, pay penalties under the contracts. Our long-term supply agreements fully cover all of our synthetic gypsum needs at current capacity utilization levels, which allows for significant scalability in our wallboard production. In addition, we believe that we would be able to purchase additional gypsum on the open market to the extent any production increases require it or if market conditions are favorable.
Our manufacturing processes utilize significant amounts of natural gas and electricity. We purchase both natural gas and electricity at spot prices on the open market. We currently hedge slightly less than 50% of our natural gas purchases based on usages for the past 12 months, and do not hedge our electricity purchases at all. We may in the future consider changing this hedging strategy to the extent warranted by market conditions.
50
Table of Contents
Results of Operations
| Historical | Pro forma(1) | |||||||||||||||||||||||||||||||||||||
| Predecessor | Successor | |||||||||||||||||||||||||||||||||||||
|
(Unaudited) |
(Unaudited) | |||||||||||||||||||||||||||||||||||||
| Year ended December 31, |
January 1 to August 30, 2013 |
July 26, to December 31, 2013 |
July 26, to September 30, 2013 |
Nine Months Ended September 30, 2014 |
Year ended December 31, 2012 |
Year ended December 31, 2013 |
Nine Months ended September 30, 2013 |
|||||||||||||||||||||||||||||||
| 2011 | 2012 | |||||||||||||||||||||||||||||||||||||
| (in thousands, except per share and sales volume data) | ||||||||||||||||||||||||||||||||||||||
| Statement of operations data: |
||||||||||||||||||||||||||||||||||||||
| Net sales |
$ | 252,111 | $ | 311,410 | $ | 252,248 | $ | 150,066 | $ | 35,630 | $ | 303,692 | $ | 311,410 | $ | 402,314 | $ | 287,878 | ||||||||||||||||||||
| Costs, expenses and other income: |
||||||||||||||||||||||||||||||||||||||
| Cost of goods sold |
279,638 | 289,936 | 195,338 | 121,335 | 31,537 | 241,042 | 322,068 | 332,773 | 242,975 | |||||||||||||||||||||||||||||
| Selling and administrative: |
||||||||||||||||||||||||||||||||||||||
| Direct |
23,844 | 27,194 | 19,338 | 14,953 | 6,200 | 23,358 | 27,709 | 34,806 | 25,924 | |||||||||||||||||||||||||||||
| Allocated from Lafarge |
9,745 | 7,037 | 4,945 | — | — | — | 7,037 | 4,945 | 4,945 | |||||||||||||||||||||||||||||
|
|
|
|
|
|
|
|
|
|
|
|
|
|
|
|
|
|
|
|||||||||||||||||||||
| Total costs and operating expenses |
313,227 | 324,167 | 219,621 | 136,288 | 37,737 | 264,400 | 356,814 | 372,524 | 273,844 | |||||||||||||||||||||||||||||
|
|
|
|
|
|
|
|
|
|
|
|
|
|
|
|
|
|
|
|||||||||||||||||||||
| Operating income (loss) |
(61,116 | ) | (12,757 | ) | 32,627 | 13,778 | (2,107 | ) | 39,292 | (45,404 | ) | 29,790 | 14,034 | |||||||||||||||||||||||||
| Other income and (expenses): |
||||||||||||||||||||||||||||||||||||||
| Other (expense) income, net |
303 | (87 | ) | (191 | ) | (21 | ) | 85 | (5,461 | ) | (448 | ) | (212 | ) | (106 | ) | ||||||||||||||||||||||
| Interest expense, net |
(273 | ) | (212 | ) | (91 | ) | (10,542 | ) | (2,364 | ) | (24,518 | ) | (23,151 | ) | (23,443 | ) | (17,486 | ) | ||||||||||||||||||||
|
|
|
|
|
|
|
|
|
|
|
|
|
|
|
|
|
|
|
|||||||||||||||||||||
| Income (Loss) before (losses) earnings from equity method investment and income taxes |
(61,086 | ) | (13,056 | ) | 32,345 | 3,215 | (4,386 | ) | 9,313 | (69,003 | ) | 6,135 | (3,558 | ) | ||||||||||||||||||||||||
| (Losses) earnings on equity method investment |
228 | (138 | ) | (30 | ) | — | — | (257 | ) | — | — | — | ||||||||||||||||||||||||||
|
|
|
|
|
|
|
|
|
|
|
|
|
|
|
|
|
|
|
|||||||||||||||||||||
| Income (loss) before income taxes |
(60,858 | ) | (13,194 | ) | 32,315 | 3,215 | (4,386 | ) | 9,056 | (69,003 | ) | 6,135 | (3,558 | ) | ||||||||||||||||||||||||
| Income tax (expense) benefit |
316 | 352 | (130 | ) | (1,110 | ) | (254 | ) | (3,526 | ) | 352 | (1,240 | ) | (384 | ) | |||||||||||||||||||||||
|
|
|
|
|
|
|
|
|
|
|
|
|
|
|
|
|
|
|
|||||||||||||||||||||
| Net income (loss) |
$ | (60,542 | ) | $ | (12,842 | ) | $ | 32,185 | $ | 2,105 | $ | (4,640 | ) | $ | 5,530 | (68,651 | ) | $ | 4,895 | $ | (3,942 | ) | ||||||||||||||||
|
|
|
|
|
|
|
|
|
|
|
|
|
|
|
|
|
|
|
|||||||||||||||||||||
| Other financial data: |
||||||||||||||||||||||||||||||||||||||
| EBITDA(1) |
$ | (33,062 | ) | $ | 23,574 | $ | 49,513 | $ | 32,307 | $ | 2,487 | $ | 80,616 | $ | 21,559 | $ | 82,805 | $ | 53,114 | |||||||||||||||||||
| Adjusted EBITDA(1) |
(19,352 | ) | 41,210 | 63,904 | 39,178 | 9,358 | 80,616 | 40,695 | 102,567 | 72,876 | ||||||||||||||||||||||||||||
| Adjusted EBITDA margin(1) |
N/A | 13.2 | % | 25.3 | % | 26.1 | % | 26.3 | % | 26.5 | % | 13.1 | % | 25.5 | % | 25.3 | % | |||||||||||||||||||||
| Capital expenditures |
$ | 5,863 | $ | 5,205 | $ | 2,506 | 2,798 | $ | 43 | $ | 6,090 | $ | 5,205 | $ | 5,304 | $ | 2,549 | |||||||||||||||||||||
| Selected operating data: |
||||||||||||||||||||||||||||||||||||||
| Wallboard sales volume (million square feet) |
1,814 | 1,903 | 1,334 | 827 | 195 | 1,552 | 1,903 | 2,161 | 1,528 | |||||||||||||||||||||||||||||
| Mill net sales price(2) |
$ | 98.00 | $ | 124.02 | $ | 147.55 | $ | 144.06 | $ | 144.06 | $ | 155.57 | $ | 124.02 | $ | 145.92 | $ | 147.11 | ||||||||||||||||||||
| (1) | EBITDA, Adjusted EBITDA and Adjusted EBITDA margin are non-GAAP measures. See “Prospectus Summary—Summary Historical and Unaudited Pro Forma Combined Financial Information” for how we define and calculate EBITDA, Adjusted EBITDA and Adjusted EBITDA margin as non-GAAP measures, reconciliations thereof to operating income and a description of why we believe these measures are important. |
| (2) | Mill net sales price represents average selling price per thousand square feet net of freight and delivery costs. |
51
Table of Contents
Selected Quarterly Data
The following table presents selected quarterly data for the Predecessor period for informational purposes.
| Predecessor | ||||||||||||
| Three Months Ended March 31, 2013 |
Three Months Ended June 30, 2013 |
July 1 2013
to August 30, 2013 |
||||||||||
| (in thousands, except operating data) | ||||||||||||
| Net sales |
$ | 83,450 | $ | 99,679 | $ | 69,119 | ||||||
| Costs of goods sold |
65,157 | 73,991 | 56,190 | |||||||||
| Selling and administrative |
8,340 | 8,486 | 7,457 | |||||||||
| Operating income |
9,953 | (1) | 17,202 | (2) | 5,472 | (3) | ||||||
| Wallboard sales volume |
||||||||||||
| (million square feet) |
438 | 523 | 373 | |||||||||
| Mill net sales price |
147 | 150 | 145 | |||||||||
| Depreciation and amortization |
6,242 | 6,248 | 4,396 | |||||||||
| (1) | Operating income for the three months ended March 31, 2013 includes $2,858 of pension expense and $1,120 of expense related to the Master Brands Agreement with Lafarge S.A. |
| (2) | Operating income for the three months ended June 30, 2013 includes $2,817 for pension expense and $1,140 of expense related to the Master Brands Agreement with Lafarge S.A. |
| (3) | Operating income for the period July 1, 2013 to August 30, 2013 includes $1,961 for pension expense, $744 of expense related to the Master Brands Agreement with Lafarge S.A., lease termination costs of $2,556 for the Newark facility that was closed, and lease termination costs of $1,195 to discontinue the use of our co-generation power plant. |
Nine Months Ended September 30, 2014 Compared to Pro Forma Nine Months Ended September 30, 2013
Net Sales. Net sales were $303.7 million for the nine months ended September 30, 2014 (Successor), an increase of 5.5% from $287.9 million for the pro forma nine months ended September 30, 2013. The increase was primarily attributable to the increase in the average mill net selling price for gypsum wallboard, which contributed approximately $15.9 million of additional net sales at constant exchange rates. Volumes were up by 1.6% and accounted for an additional $4.3 million in net sales. Foreign exchange losses of $2.5 million and lower sales in our other products of $1.9 million contributed to the remaining difference.
Total Costs and Operating Expenses. Total costs and operating expenses decreased by 3.4% to $264.4 million for the nine months ended September 30, 2014 (Successor) compared to $273.8 million for the pro forma nine months ended September 30, 2013. Cost of goods sold was $241.0 million for the nine months ended September 30, 2014 (Successor), a decrease of 0.8% from $243.0 million in the prior period. Approximately $5.8 million of the decrease in cost of goods sold was due to one-time lease termination costs incurred in the third quarter of 2013 with no lease terminations in the nine months ended September 30, 2014. Freight costs increased by $1.8 million, while higher raw material costs, primarily energy, combined with higher volumes, increased costs by approximately $6.5 million. Depreciation accounted for the remaining $2.6 million increase in cost of goods sold. Cost control measures reduced fixed costs by approximately $4.8 million, primarily in the area of labor, and favorable foreign exchange rates reduced costs by an additional $2.3 million.
Selling and Administrative Expense. Selling and administrative expense decreased $7.5 million, down 24.3% to $23.4 million for the nine months ended September 30, 2014 (Successor) compared to $30.9 million for the pro forma nine months ended September 30, 2013. This decrease was primarily driven by costs that did not carry over to the Successor, including $3.3 million of closing fees for the Acquisition on August 30, 2014, $2.2 million of pension costs and $3.0 million in master branding agreement costs for the pro forma nine months ended September 30, 2013. Cost control measures contributed to an additional $0.2 million decrease in selling and administrative expense. Higher labor and professional fees associated with the transition to being a stand-alone public company and $1.2 million of fees paid to Lafarge under the transitional services agreement incurred in the nine months ended September 30, 2014 (Successor) partially offset this decrease.
52
Table of Contents
Operating (Loss) Income. Operating income of $39.3 million for the nine months ended September 30, 2014 (Successor) increased from operating income of $14.0 million for the pro forma nine months ended September 30, 2013. The increase is driven by $15.8 million increase in higher net sales, $7.5 million lower selling and administrative expense and $2.0 million lower cost of goods sold.
Other (Expense) Income, Net. For the nine months ended September 30, 2014 (Successor), other (expense) income, net, was a net expense of $5.5 million, an increase from a net expense of $0.1 million for the pro forma nine months ended September 30, 2013, primarily due to the $3.1 million prepayment premium for the repayment of the Second Lien Credit Agreement and $2.0 million for the payment of termination fees to affiliates of Lone Star in connection with the termination of our assets advisory agreement.
Interest Expense, Net. Interest expense was $24.5 million for the nine months ended September 30, 2014 (Successor), higher than prior periods as it reflects the debt incurred on August 30, 2013 in connection with the Acquisition. All interest expense for the three months ended September 30, 2014 (Successor) relates to the First Lien Credit Agreement. In May 2014, the interest rate on the First Lien Credit Agreement was reduced by 0.5% due to reaching lower leverage ratios as outlined in the First Lien Credit Agreement. In August 2014, the interest rate on the First Lien Credit Agreement was further reduced by 0.25% due to a ratings upgrade by Moody’s (See Note 13 to the unaudited financial statements included elsewhere in this prospectus). As a result, the effective interest rate on the First Lien Credit Agreement as of September 30, 2014 was 4.64% and the effective interest rate on the Revolver was 3.25%. Included in the nine months ended September 30, 2014 (Successor) interest expense is a write-off of $6.9 million of original issue discount and deferred financing fees associated with the early repayment of the Second Lien Credit Agreement on February 10, 2014.
Income Tax Benefit (Expense). Income tax expense was $3.5 million for the nine months ended September 30, 2014 (Successor). A valuation allowance was not recorded as of September 30, 2014 as we believe it is more likely than not that the tax asset will be realized. Income tax (expense) was minimal in the prior Predecessor periods for 2013 due to the benefit of net operating losses that had been previously reserved with a valuation allowance.
Net income (loss). Net income for the nine months ended September 30, 2014 (Successor) was $5.5 million. Higher depreciation and amortization and interest costs due to the Acquisition were partially offset by higher prices.
July 26 to September 30, 2013
Net Sales. Net sales for the period July 26 to September 30, 2013 (Successor) was $35.6 million, which represented approximately one month of sales activity after the Acquisition on August 30, 2013.
Total Costs and Operating Expenses. Total costs and operating expenses for the period July 26 to September 30, 2013 were $37.7 million which represented approximately one month of activity after the Acquisition on August 30, 2013.
Selling and Administrative Expense. Total selling and administrative expenses for the period July 26 to September 30, 2013 (Successor) were $6.2 million, which represented approximately one month of activity after the Acquisition on August 30, 2013.
Operating (Loss) Income. Operating loss for the period July 26 to September 30, 2013 (Successor) was $2.1 million which represented approximately one month of activity after the Acquisition on August 30, 2013.
Other (Expense) Income, Net. Other (expense) income, net, for the period July 26 to September 30, 2013 (Successor) was $0.1 million which represented approximately one month of activity after the Acquisition on August 30, 2013.
53
Table of Contents
Net income (loss). Net loss for the period July 26 to September 30, 2013 (Successor) was $4.6 million which represented approximately one month of activity after the Acquisition on August 30, 2013.
July 26 to December 31, 2013
The Company was formed on July 26, 2013 and had no operating results until the acquisition of the gypsum division of Lafarge on August 30, 2013. The Acquisition was accounted for as a business combination, which required the revaluation of the net assets acquired at fair value. Also as part of the Acquisition, we issued approximately $465.0 million of debt. As a result of these factors, the Company’s and the Predecessor’s financial statements are not comparable.
Net sales for the Successor period ended December 31, 2013 were $150.1 million. Strength in gypsum wallboard volumes and pricing supported net sales throughout the period. Total costs and operating expenses were $136.3 million for the Successor period ended December 31, 2013, resulting in operating income of $13.8 million. Net interest expense for the Successor period ended December 31, 2013 was $10.5 million and relates to the $465 million of debt that was issued in conjunction with the Acquisition, along with an additional $130 million of debt added in early December 2013. Income tax expense was $1.1 million for the Successor period ending December 31, 2013, yielding an effective tax rate of approximately 34.5% for the period. Net income for this period was $2.1 million, reflecting the positive operating income offset by interest expense and income taxes.
Pro Forma Full Year Ended December 31, 2013 Compared to Pro Forma Full Year Ended December 31, 2012
The unaudited pro forma combined results of operations are based on our historical unaudited financial statements included elsewhere in this prospectus, adjusted to give pro forma effect to the Acquisition, increased debt and dividend to Lone Star, and use of proceeds from our initial public offering to repay debt. The unaudited pro forma combined results of operations are presented because management believes they provide a meaningful comparison of operating results for the year-ended December 31, 2013, to be compared with operating results for the year-ended December 31, 2012. See “—Description of Pro forma Adjustments for the Unaudited Combined Pro Forma Results of Operations for 2013 and 2012” below.
Pro Forma Net Sales. Pro forma net sales were $402.3 million for the year ended December 31, 2013, an increase of 29.2% from $311.4 million for the year ended December 31, 2012. The increase was primarily attributable to a 17.7% increase in the average mill-net selling price for gypsum wallboard, which contributed approximately $48.4 million of additional net sales, and a 13.5% increase in gypsum wallboard sales volume, which contributed approximately $39.9 million of additional net sales. Favorable foreign exchange of $1.3 million and improved sales in our other products contributed to the remaining increase.
Pro Forma Total Costs and Operating Expenses. Pro forma total costs and operating expenses increased by 4.3% to $372.5 million for the year ended December 31, 2013 compared to $356.8 million for the year ended December 31, 2012. Pro forma cost of goods sold was $332.8 million for the year ended December 31, 2013, an increase of 3.3% from $322.1 million in the prior year. Included in 2013 were costs for the termination of our Newark, New Jersey lease of $2.6 million and expenses for the termination of our co-generation power system lease of $3.3 million as compared to 2012 where we accelerated depreciation of $10.1 million for our Newark gypsum wallboard plant and wrote-off spare parts for $1.2 million. Excluding these items, cost of goods sold increased approximately $16.2 million. Higher sales volumes drove most of this increase, with additional freight increasing costs by approximately $10.0 million, higher usages of raw materials driving a $15.6 million increase, partially offset by lower raw material costs of $6.9 million and lower depreciation and amortization of $3.2 million. Foreign exchange contributed to an additional $1.3 million in costs of sales. During this time period, total plant capacity utilization rates increased from the mid 50% range for the year ended December 31, 2012 to slightly higher than 60% for 2013.
54
Table of Contents
Pro forma selling and administrative expense increased $5.0 million, up 14.4%, mostly driven by $3.3 million of acquisition closing costs. The remaining increase was comprised of higher fees associated with the master brand agreement and higher professional fees.
Pro Forma Operating (Loss) Income. The pro forma operating income of $29.8 million for the year ended December 31, 2013 improved from pro forma operating loss of $45.4 million for the year ended December 31, 2012. The improvement was driven by higher prices, improving sales volumes, and lower paperboard liner costs.
Pro Forma Other (Expense) Income, Net. Pro forma other (expense) income, net, was a net expense of $0.2 million for the year ended December 31, 2013 compared to $0.4 million net expense in the prior year. The decrease is due to third party debt issuance cost in the amount of $0.4 million recorded in the prior year.
Pro Forma Interest Expense, Net. Pro forma interest expense, net, assumes that the Acquisition debt was outstanding and that proceeds from our initial public offering were used to repay debt as of January 1, 2012. Interest expense remained stable at $23.4 million for the year ended December 31, 2013 as compared to $23.2 million for 2012.
Pro Forma Income Tax (Expense). Pro forma income tax expense rose slightly to $1.2 million for the year ended December 31, 2013 compared to a $0.4 million income tax benefit for 2012. Given the history of pre-tax losses of the Predecessor, a valuation allowance was provided on a substantial portion of the deferred tax assets in the Predecessor financial statements. This resulted in tax rates substantially different from the U.S. federal statutory rate of 35%. A valuation allowance was not recorded as of December 31, 2013. Refer to Note 9 to the audited financial statements for a reconciliation of the effective tax rate for the Successor financial statements.
Pro forma net income (loss). Pro forma net income for the year ended December 31, 2013 was $4.9 million compared to a pro forma loss of $68.7 million for 2012. The improved performance was primarily due to higher prices and volumes along with lower costs for paperboard liner.
Year Ended December 31, 2012 Compared to Year Ended December 31, 2011
Net sales. Net sales were $311.4 million for the year ended December 31, 2012, up 23.5% from $252.1 million for the prior year. The increase was primarily attributable to a 26.5% increase in the average mill-net selling price for gypsum wallboard, which contributed approximately $47.6 million of additional net sales, and a 4.9% increase in gypsum wallboard sales volume, which contributed approximately $11.6 million of additional net sales. Favorable foreign exchange of $0.3 million was offset by a decline in sales in our other products.
Total Costs and Operating Expenses. Total costs and operating expenses increased by 3.5% to $324.2 million for the year ended December 31, 2012 compared to $313.2 million in the prior year. Cost of goods sold was $289.9 million for the year ended December 31, 2012, an increase of 3.7% from $279.6 million in the prior year. The increase in cost of goods sold was primarily due to the accelerated depreciation of $10.1 million and write-off of spare parts for $1.2 million associated with the closure of our Newark, New Jersey gypsum wallboard plant. Excluding these costs, cost of goods sold was down 0.3% or by approximately $1.0 million. This decrease was driven by lower natural gas prices and lower paper prices, resulting in $9.8 million lower raw material costs offset by $8.7 million in additional expense for the higher production and shipping volumes. The impact of foreign exchange was minimal. During this time period, total plant capacity utilization rates increased from the mid 50 percent range in 2011 to slightly lower than 60 percent in 2012, helping to improve fixed cost absorption. Selling and administrative expense was up 1.9% to $34.2 million for the year ended December 31, 2012 compared to $33.6 million for the prior year as higher direct costs were offset by lower allocated costs. The increase in direct sales and administrative costs resulted primarily from an increase of pension and post-retiree benefit expenses of $0.9 million, retention bonuses of $0.5 million and higher rental costs of $0.7 million due to increased sales activity in Canada. Allocated costs declined due primarily to lower fees associated with the master brand agreements.
55
Table of Contents
Operating Loss. Operating loss declined to $12.8 million for the year ended December 31, 2012 from a loss of $61.1 million in the prior year. The improvement was driven by higher prices, improving volumes, and lower paper and natural gas costs.
Other (Expense) Income, Net. Other (expense) income, net, declined to a net expense of $0.1 million for the year ended 2012 compared to income of $0.3 million in the prior year. The change comes primarily from gains that were generated from the sale of assets in 2011.
Income Tax Benefit. The income tax benefit remained stable at $0.4 million for the year 2012 compared to $0.3 million in the prior period. Given the history of pre-tax losses, a valuation allowance was provided on a substantial portion of the deferred tax assets in the United States for both years. This resulted in lower effective tax rates of 2.7% for 2012 and 0.5% for 2011 relative to the U.S. federal statutory rate of 35%.
Net Income (Loss). Net loss for the year ended December 31, 2012 was $12.8 million compared with a net loss of $60.5 million for the prior year. The improved performance was primarily due to higher prices and volumes along with lower costs for paper and natural gas.
Liquidity and Capital Resources
Historically, our primary source of liquidity was cash from operations and borrowings or advances from Lafarge. Our business used Lafarge’s centralized processes and systems for cash management, payroll and purchasing. As a result, all cash received by the business was deposited in and commingled with Lafarge’s general corporate funds and was not specifically allocated to the business. The combined financial statements for the periods prior to the consummation of the Acquisition therefore reflect a cash sweep or contribution at the end of the relevant fiscal periods and no retained cash balances.
Since the Acquisition, our primary sources of liquidity are cash on hand and cash from operations and borrowings under the debt financing arrangements that we entered into in connection with the Acquisition. We believe these sources will be sufficient to fund our planned operations and capital expenditures.
The following table sets forth a summary of the net cash provided by (used in) operating, investing and financing activities for the Company for the nine months ended September 30, 2014 and for the period July 26 to December 31, 2013 and for the Predecessor activities for the period January 1, 2013 to August 30, 2013 and for the years ended December 31, 2012 and 2011:
| Successor | Predecessor | |||||||||||||||||||||
| Nine Months Ended September 30, |
July 26 to December 30, |
January 1 to August 30, |
Year Ended December 31, |
|||||||||||||||||||
| 2014 | 2013 | 2013 | 2012 | 2011 | ||||||||||||||||||
| Net cash provided by (used in) operating activities |
$ | 45,708 | $ | 37,357 | $ | 24,702 | $ | 16,398 | $ | (36,938 | ) | |||||||||||
| Net cash used in investing activities |
(4,336 | ) | (705,939 | ) | (2,020 | ) | (4,440 | ) | (3,971 | ) | ||||||||||||
| Net cash (used in) provided by financing activities |
(40,621 | ) | 680,466 | (22,682 | ) | (11,958 | ) | 40,909 | ||||||||||||||
| Effect of foreign exchange rates |
(417 | ) | (62 | ) | — | — | — | |||||||||||||||
|
|
|
|
|
|
|
|
|
|
|
|||||||||||||
| Net increase (decrease) in cash |
$ | 334 | $ | 11,822 | $ | — | $ | — | $ | — | ||||||||||||
|
|
|
|
|
|
|
|
|
|
|
|||||||||||||
Net Cash Provided by (used in) Operating Activities
Net cash provided by operating activities was $45.7 million for the nine months ended September 30, 2014 (Successor). Net cash provided by operating activities for the period July 26 to September 30, 2013 (Successor) was $2.0 million and for the period January 1, 2013 to August 30, 2013 (Predecessor) was $24.7 million. Net cash provided by operating activities for the nine months ended September 30, 2014 (Successor) was impacted by higher interest costs partially offset by improvements in working capital.
56
Table of Contents
Net cash provided by operating activities was $37.4 million for the period July 26, 2013 to December 31, 2013 for the Company. Net cash provided by operating activities under the Predecessor was $24.7 million for the period from January 1, 2013 through August 30, 2013, up from $16.4 million for the year ended December 31, 2012. This improvement was primarily due to net income being generated in 2013 versus a loss in 2012.
Net cash provided by operating activities was $16.4 million for the year ended December 31, 2012 compared with net cash used in operating activities of $36.9 million for 2011. The improvement was primarily due to a significantly smaller net loss, which decreased to $12.8 million in 2012 relative to a net loss of $60.5 million in 2011. Higher net sales in the later part of 2012 did result in an increase in receivables, but this was partially offset by an increase in accounts payable as we optimized payment terms.
Net Cash (Used In) Investing Activities
Net cash used in investing activities was $4.3 million for the nine months ended September 30, 2014 (Successor), $700.1 million for the period July 26 to September 30, 2013 (Successor), and $2.0 million for the period January 1, 2013 to August 30, 2013 (Predecessor). Net cash used in investing activities for the nine months ended September 30, 2014 (Successor) reflects $6.1 million in capital expenditures, partially offset by $1.8 million in distributions received from our equity investment in Seven Hills. The investing activities for the period July 26 to September 30, 2013 (Successor) include $700.1 million purchase price of the Acquisition.
Net cash used in investing activities was $705.9 million for the period July 26, 2013 to December 31, 2013. This primarily reflects the net cash paid to acquire the gypsum division of Lafarge on August 30, 2013. Net cash used in investing activities under the Predecessor was $2.0 million for period from January 1, 2013 through August 30, 2013, as compared to $4.4 million for the year ended December 31, 2012, primarily reflecting capital expenditures in both periods.
Net cash used in investing activities for the year ended December 31, 2012 was $4.4 million compared with $4.0 million in 2011. The increase was primarily related to lower proceeds from the sale of assets in 2012 as compared to 2011.
Net Cash (Used In) Provided by Financing Activities
Net cash provided by (used in) financing activities was ($40.6) million for the nine months ended September 30, 2014 (Successor), $714.9 million for the period July 26 to September 30, 2013 (Successor), and ($22.7) million for the period January 1, 2013 to August 30, 2013 (Predecessor). In 2014, net proceeds of $151.4 million from the Initial Public Offering were used to repay a portion of the Second Lien Credit Agreement. In addition, $2.1 million in quarterly principal payments were made on the First Lien Credit Agreement in addition to voluntary prepayments of $34.9 million. The next required mandatory principal payment on the First Lien Credit Agreement is the amount due at maturity on August 28, 2020.
Net cash provided by financing activities was $680.5 million for the period July 26, 2013 to December 31, 2013 and reflects the net proceeds received to fund the acquisition of the gypsum division of Lafarge and increased borrowings in December 2013 to distribute as a return of capital to our sponsor, Lone Star. Lone Star originally contributed $265.0 million in equity to the Company as of August 30, 2013, reduced by $130 million from the return of capital on December 2, 2013. Proceeds from the issuance of long-term debt under the First and Second Lien Credit Agreements totaled $565.0 million, net of original issuance discount. The amount drawn on the revolving credit facility as of August 30, 2013 was reduced to zero through the use of cash from operations. The financings resulted in the payment of debt issuance costs of $18.5 million. Net cash used in financing activities under the Predecessor was $22.7 million for January 1, 2013 to August 30, 2013, up from $12.0 million for the year ended December 31, 2012, representing distributions to Lafarge in both periods. The increase in distributions to Lafarge was due to improved operating cash flows.
57
Table of Contents
Net cash used in financing activities was $12.0 million for the year ended December 31, 2012 compared with net cash provided by financing activities of $40.9 million for 2011. The change reflects a net capital distribution to Lafarge in 2012 as operating cash flows improved relative to a net capital contribution from Lafarge in 2011.
Capital Expenditures
We have made significant capital investments in our facilities since 2000 and we believe that our facilities are among the newest and most efficient plants in North America. Our investment in the second line at Silver Grove and the renovation at Buchanan provided additional low cost capacity, significantly improved plant performance and a strong base for new product introduction. Having completed these significant investments prior to 2011, we expect capital expenditures to remain modest in the short to medium term.
All of our capital expenditures have been for sustaining purposes in the periods presented. Capital expenditures of $6.1 million and $2.8 million were made in the nine months ended September 30, 2014 and the period July 26, 2013 to December 31, 2013, respectively. In the predecessor periods, capital expenditures were $2.5 million from January 1, 2013 to August 30, 2013 and were $5.2 million and $5.9 million for 2012 and 2011, respectively.
Credit Facilities
First Lien Credit Agreement
On August 30, 2013, we and our subsidiary OpCo entered into a first lien credit agreement with Credit Suisse AG, as administrative agent, Credit Suisse Securities (USA) LLC and RBC Capital Markets, as joint lead arrangers and joint bookrunners, and Royal Bank of Canada, as syndication agent. On December 2, 2013, we and OpCo entered into an amendment to the first lien credit agreement. We refer to the first lien credit agreement as amended by such amendment as the First Lien Credit Agreement. The First Lien Credit Agreement provides OpCo a term loan facility, or the First Lien Term Loans, of $415.0 million, a U.S. dollar revolving loan facility, or USD Revolver, of $40.0 million and a Canadian dollar and/or U.S. dollar revolving facility, or CAD Revolver, which, together with the USD Revolver, we refer to as the Revolver, of $10.0 million, which may be borrowed by OpCo or by its subsidiary, Continental Building Products Canada Inc., or CBP Canada, in Canadian dollars or U.S. dollars.
Rates of interest on amounts borrowed under the First Lien Credit Agreement are based on, at our option, either the USD London Interbank Offer Rate, or LIBOR (in the case of borrowings denominated in U.S. dollars), the Canadian Dealer Offered Rate, or CDOR (in the case of borrowings denominated in Canadian dollars), or an alternate base rate, as applicable to the borrowing, plus an applicable margin rate, in each case. The margin rate is equal to 3.75% with respect to LIBOR First Lien Term Loans borrowings, 2.75% with respect to alternate base rate First Lien Term Loans borrowings, 3.00% with respect to LIBOR or CDOR Revolver borrowings, or 2.00% with respect to alternate base rate Revolver borrowings. The margin applicable to each borrowing may be reduced by 0.25% if OpCo achieves certain credit ratings by Moody’s and S&P. After the consummation of our initial public offering and for as long thereafter as our capital stock remains publicly traded, the margin applicable to each borrowing may be further reduced by 0.50% if OpCo achieves certain credit ratings by Moody’s and S&P or achieves a total leverage ratio less than a specified ratio. On August 25, 2014, we received notice that Moody’s Investor Services, Inc. upgraded our corporate family rating to B2 from B3 with a stable rating outlook, thereby reducing the our interest rate under the First Lien Credit Agreement by 0.25%. As of September 30, 2014 and December 31, 2013, the weighted average effective interest rate for the First Lien Term Loans was 4.6% and 5.2%, respectively.
Under the terms of the First Lien Credit Agreement, OpCo is required to repay the First Lien Term Loans in 27 consecutive quarterly installments of $1,037,500, beginning on December 31, 2013, and a final installment on August 28, 2020 in an amount equal to the aggregate principal amount of all First Lien Term Loans under the First Lien Credit Agreement outstanding on such date.
58
Table of Contents
As of September 30, 2014 and December 31, 2013, there were no amounts outstanding under the revolving loans and there was $377.0 million and $414.0 million, respectively, in outstanding First Lien Term Loans. As of September 30, 2014 and December 31, 2013, OpCo’s undrawn borrowing availability under the USD Revolver was $36.1 million and $37.6 million, respectively, and OpCo’s undrawn borrowing availability under the CAD Revolver was $10.0 million and $10.0 million, respectively. The First Lien Credit Agreement contains restrictive covenants, which require OpCo and its restricted subsidiaries to maintain a specific total leverage ratio, or Financial Covenant, and contains certain restrictions on us, OpCo and its restricted subsidiaries with respect to indebtedness and guarantees, liens, acquisitions, consolidations and mergers, changes of control, sales of certain assets, dividends and other distributions, loans and advances, optional payments and modifications of junior debt instruments, affiliate transactions, sales and leasebacks, negative pledge clauses, restrictions on restricted subsidiary distributions, lines of business, our activities and modifications of agreements. The Financial Covenant is in effect if, on the last day of a fiscal quarter, the amount of outstanding Revolver usage (including the face amount of any letters of credit issued under the First Lien Credit Agreement) exceeds 25% of the aggregate commitments under the Revolver at such time. When in effect, the Financial Covenant in the First Lien Credit Agreement requires OpCo and its restricted subsidiaries to maintain, at the end of each fiscal quarter, a total ratio of consolidated total debt to consolidated EBITDA for the previous 12-month period, as each such term is defined by the First Lien Credit Agreement, equal to or less than a level that varies over the term of the First Lien Credit Agreement from 6.75 to 1.00 to 5.00 to 1.00.
OpCo’s payment obligations under the First Lien Credit Agreement are guaranteed by us and certain of OpCo’s wholly-owned restricted subsidiaries, or Subsidiary Guarantors, as defined by the First Lien Credit Agreement. In addition, CBP Canada is a co-borrower with respect to the CAD Revolver and is jointly liable on OpCo’s payment obligations with respect to the CAD Revolver.
OpCo’s and CBP Canada’s payment obligations under the First Lien Credit Agreement and our guarantee obligations and the guarantee obligations of the Subsidiary Guarantors are secured by a first priority lien on substantially all of our assets and the assets of OpCo, and certain of OpCo’s wholly-owned restricted subsidiaries, as defined by the First Lien Credit Agreement. In addition, OpCo’s payment obligations under the First Lien Credit Agreement are supported by a first priority pledge of all of OpCo’s equity interest in certain wholly-owned restricted subsidiaries, as defined by the First Lien Credit Agreement, and by a first priority pledge by us, of all of the equity interests we own in OpCo.
Second Lien Credit Agreement
On August 30, 2013, we and OpCo entered into a second lien credit agreement with Credit Suisse AG, as administrative agent, Credit Suisse Securities (USA) LLC and RBC Capital Markets, as joint lead arrangers and joint bookrunners, and Royal Bank of Canada, as syndication agent. On December 2, 2013, we and OpCo entered into an amendment to the second lien credit agreement. We refer to the second lien credit agreement as amended by such amendment as the Second Lien Credit Agreement. The Second Lien Credit Agreement provided OpCo a term loan facility, or the Second Lien Term Loans, of $155.0 million. Rates of interest on amounts borrowed under the Second Lien Credit Agreement were based on, at OpCo’s option, either the LIBOR or an alternate base rate, plus an applicable margin rate, in each case. As of December 31, 2013, the weighted average effective interest rate for the Second Lien Term Loans was 9.4%. As part of the use of proceeds from our initial public offering, on February 10, 2014, all amounts outstanding under the Second Lien Credit Agreement were repaid and are no longer outstanding.
59
Table of Contents
Contractual Obligations and Other Long-Term Liabilities
The following table summarizes our significant contractual obligations as of December 31, 2013:
| Payment Due by Period | ||||||||||||||||||||
| Total | 2014 | 2015-2016 | 2017-2018 | Thereafter | ||||||||||||||||
| (in thousands) | ||||||||||||||||||||
| Operating Leases(1) |
$ | 5,486 | $ | 1,073 | $ | 1,682 | $ | 1,237 | $ | 1,494 | ||||||||||
| Purchase Commitments |
||||||||||||||||||||
| Synthetic Gypsum(2) |
155,216 | 19,998 | 35,996 | 35,718 | 63,504 | |||||||||||||||
| Paper(3) |
29,151 | 12,956 | 16,195 | — | — | |||||||||||||||
| Natural Gas |
1,846 | 1,007 | 839 | — | — | |||||||||||||||
| Long-term debt(4) |
568,962 | 4,150 | 8,300 | 8,300 | 548,212 | |||||||||||||||
| Interest on indebtedness(4) |
128,479 | 21,115 | 38,639 | 37,797 | 30,928 | |||||||||||||||
|
|
|
|
|
|
|
|
|
|
|
|||||||||||
| Total Commitments |
$ | 889,140 | $ | 60,299 | $ | 101,651 | $ | 83,052 | $ | 644,138 | ||||||||||
|
|
|
|
|
|
|
|
|
|
|
|||||||||||
| (1) | Operating lease payments reflect the minimum payments over the non-cancelable lease terms of the associated lease. |
| (2) | Reflects estimated minimum payments for synthetic gypsum over the contract terms, including transport. |
| (3) | We purchase paper under a long-term contract that specifies a two-year termination notice requirement from the anniversary date of the contract. RockTenn has the option to require us to purchase paper for up to an additional two years subsequent to termination. The table reflects the estimated minimum payments due as of December 31, 2013, assuming a notice of cancellation was delivered on that date and no exercise by RockTenn of its option. |
| (4) | See Note 13 to our audited consolidated financial statements as of December 31, 2013, for additional information regarding debt and related matters. The second lien term loan of $155 million is shown as part of thereafter under long-term debt, reflecting the contractual due date of this loan as of December 31, 2013. As the second lien term loan was completely repaid subsequent to year-end, the commitment for interest on indebtedness for this loan is reflected only through the date of debt repayment on February 10, 2014. Interest on indebtedness is calculated based on interest rates in effect at December 31, 2013. |
A purchase commitment is an enforceable and legally binding agreement to purchase goods or services that specifies significant terms, including: fixed or minimum quantities to be purchased, minimum or variable price provisions and approximate timing of the transaction. Our primary purchase obligations are for our two principal raw materials, synthetic gypsum and paper. The purchase obligation amounts in the table above are based on the minimum quantities to be purchased at estimated prices to be paid based on current market conditions. Accordingly, the actual amounts due may vary significantly from the estimates included in the table.
In connection with the Acquisition, we entered into certain debt financing transactions as described above under “Credit Facilities.”
Off-Balance Sheet Arrangements
With the exception of letters of credit of approximately $2.4 million at December 31, 2013, we have no off-balance sheet arrangements.
Quantitative and Qualitative Disclosures about Market Risk
In the normal course of business, we are exposed to financial risks such as changes in interest rates, foreign currency exchange rates, and commodity price risk associated with our input costs. With the exception of commodity purchases of natural gas for the years ended 2011 and 2012 and hedges of natural gas in 2014, we did not use derivative instruments.
60
Table of Contents
Interest Rate Risk
Our exposure to market risk for changes in interest rates relates primarily to our outstanding debt, and cash and cash equivalents. As of September 30, 2014, we had $12.2 million in cash and cash equivalents. The interest expense associated with First Lien Term Loan and any loans under the Revolver will vary with market rates. We paid down the Second Lien Term Loan in full with the proceeds from our initial public offering, and it is no longer outstanding.
Our exposure to market risk for changes in interest rates related to our outstanding debt is somewhat mitigated as the First Lien Term Loans and the Revolver have a LIBOR floor of 1% and the Second Lien Term Loan has been terminated. A rise of current interest rate levels to above the 1% floor would be required to increase our interest expense and a reduction in interest rates would have no impact on our interest expense. As of September 30, 2014, we elected to use three month LIBOR with a rate of 0.25%. A hypothetical 1% increase in interest rates would have increased interest expense by $1.1 million for the pro forma full year 2013 and by approximately $0.7 million for the nine months ended September 30, 2014.
At March 31, 2014, we entered into an interest rate cap on three months US Dollar LIBOR of 2% for a notional amount of $206.5 million, representing one-half of the principal amount due under our First Lien Credit Agreement at March 31, 2014. The notional amount of the interest rate cap declines by approximately $0.5 million each quarter through December 31, 2015, and was $205.4 million as of September 30, 2014. The objective of the hedge is to protect our cash flows for a portion of the First Lien Credit Agreement from adverse extreme market interest rate changes through March 31, 2016. As U.S. Dollar LIBOR interest rates remain below 2%, the fair value of this contract at September 30, 2014 was $0.1 million and related solely to the remaining time value of money of the premium paid for this contract.
The return on our cash equivalents balance was less than one percent. Therefore, although investment interest rates may continue to decrease in the future, the corresponding impact to our interest income, and likewise to our income and cash flow, would not be material.
Foreign Currency Risk
Approximately 9%, 10%, 12% 12% and 10% of our sales for the nine months ended September 30, 2014 (Successor), for the periods July 26, 2013 to December 31, 2013 (Successor), January 1, 2013 to August 30, 2013 (Predecessor) and years ended 2012, and 2011 (Predecessor), respectively, were in Canada. As a result, we are exposed to movements in foreign exchange rates between the U.S. dollar and Canadian dollar. We estimate that a 1% change in the exchange rate between the U.S. and Canadian currencies would impact net sales by approximately $0.2 million based on pro forma full year 2013 results. This may differ from actual results depending on the level of sales volumes in Canada. During the reported periods we did not use foreign currency hedges to manage this risk.
Commodity Price Risk
Some of our key production inputs, such as paper and natural gas, are commodities whose prices are determined by the market’s supply and demand for such products. Price fluctuations on our key input costs have a significant effect on our financial performance. The markets for most of these commodities are cyclical and are affected by factors such as global economic conditions, changes in or disruptions to industry production capacity, changes in inventory levels and other factors beyond our control.
For natural gas, we had a fixed price instrument during 2011 that expired in 2012, and we currently hedge slightly less than 50% of our natural gas purchases based on usages for the past twelve months. We use natural gas swaps contracts to manage our exposure to fluctuations in commodity prices associated with anticipated purchases of natural gas. Currently, a portion of our anticipated purchases of natural gas for 2014 and 2015 is hedged. The aggregate notional amount of these hedge contracts in place as of September 30, 2014 was
61
Table of Contents
875 thousand mmBTUs and we entered into an additional notional amount of 1.2 million mmBTUs subsequent to September 30, 2014. We review our positions regularly and make adjustments as market and business conditions warrant. The fair value of the outstanding quarter-end contracts was an unrealized gain of $0.1 million as of September 30, 2014.
Seasonality
Sales of our wallboard products are, similar to many building products, seasonal in that sales are generally slightly higher from spring through autumn when construction activity is greatest in our markets.
Critical Accounting Policies
A summary of our significant and recent accounting policies is included in Note 2 to the audited financial statements included elsewhere in this prospectus. The preparation of our financial statements requires management to make estimates and assumptions that affect the reported amounts of assets and liabilities and the disclosure of contingent assets and liabilities at the date of the financial statements and the reported amounts of revenues and expenses. Although management bases its estimates on historical experience and various other assumptions that are believed to be reasonable under the circumstances, actual results may differ to some extent from the estimates on which our financial statements have been prepared at any point in time. We believe that the critical accounting policies listed below involve our more significant judgments, assumptions and estimates and, therefore, could have the greatest potential impact on the financial statements.
Impairment or Disposal of Long-Lived Assets
We evaluate the recoverability of our long-lived assets in accordance with the provisions of Financial Accounting Standards Board Accounting Standards Codification 360 Property, Plant and Equipment, or ASC 360. ASC 360 requires that long-lived assets and certain identifiable intangibles be reviewed for impairment whenever events or changes in circumstances indicate that the carrying amount of an asset may not be recoverable. Recoverability of assets is measured by comparing the carrying amount of an asset to future undiscounted net cash flows expected to be generated by the asset. Such evaluations for impairment are significantly impacted by estimates of future prices for its products, capital needs, economic trends in the construction sector and other factors. If such assets are considered to be impaired, the impairment to be recognized is measured by the amount by which the carrying amount of the assets exceeds their fair value. Assets to be disposed of by sale are reflected at the lower of their carrying amount or fair value less cost to sell.
Determination as to whether and how much an asset is impaired involves significant management judgment involving highly uncertain matters, including estimating the future success of sales volumes, future selling prices and costs, alternative uses for the assets, and estimated proceeds from disposal of the assets. However, the impairment reviews and calculations are based on estimates and assumptions that take into account our business plans and long-term investment decisions.
We record impairment charges for assets that we permanently close if their fair value is less than their carrying value. In 2012, we closed our Newark wallboard plant and as a result, recorded an $11.3 million charge in the Predecessor financial statements related to accelerated depreciation and write-offs of spare parts and other assets.
Goodwill and Intangible Assets
The goodwill reflected in the Predecessor financial statements relates to specific transactions executed by Lafarge to acquire our business. Additional goodwill was allocated to that business based on the Lafarge S.A. buyout of the Lafarge minority interest in 2006, with the amount allocated based on the relative fair value of our business as compared to Lafarge as a whole at that time. The goodwill reflected in the Successor financial statements at December 31, 2013 relates to the acquisition of the gypsum operations from Lafarge on August 30, 2013.
62
Table of Contents
Goodwill represents the excess of costs over the fair value of identifiable assets of businesses acquired. We value goodwill and intangible assets in accordance with Financial Accounting Standards Board Accounting Standards Codification 350, Goodwill and Other Intangible Assets, or ASC 350. ASC 350 requires goodwill to be either qualitatively or quantitatively assessed for impairment annually (or more frequently if impairment indicators arise). Intangible assets that have indefinite useful lives are not amortized but are tested at least annually for impairment or whenever events or circumstances indicate an impairment may have occurred. In the Predecessor financial statements, trademarks totaling $0.3 million have been deemed as having indefinite lives. There are no indefinite lived intangible assets in the Successor financial statements. Intangible assets that are deemed to have definite lives are amortized over their useful lives.
At December 31, 2012 and 2011, the Predecessor had $94.4 million of goodwill, all of which was associated with the wallboard reporting unit, which is the same as that reported in “Segment Reporting” in Note 14 to the audited combined financial statements of the Predecessor. At December 31, 2013, we had $119.9 million of goodwill, which resulted from the acquisition of the gypsum operations from Lafarge. All goodwill is associated with our wallboard reporting unit. On an annual basis, we measure the fair value of our wallboard reporting unit on a qualitative basis or by using a discounted cash flow approach that estimates the projected future cash flows to be generated by the reporting unit, using a discount rate reflecting the weighted average cost of capital for a potential market participant. We perform our annual goodwill impairment test on the first day of our fiscal fourth quarter. Differences in assumptions used in projecting future cash flows and cost of funds could have a significant impact on the determination of fair value.
Projections are based on forecasts developed internally by management for use in managing the business. These projections include significant assumptions such as estimates of future revenues, profits, working capital requirements, operating plans and capital expenditures. Our forecasts are driven by consensus industry estimates of key economic indicators that affect our operating results, most notably new residential construction, light commercial construction, and repair and remodel activity. These economic indicators are then used to estimate future production volumes, selling prices and key input costs for our manufactured products. Our forecasts also take into consideration recent sales data and planned timing of capital projects.
A growth rate is used to calculate the terminal value in the discounted cash flow model and is the expected rate at which earnings or revenue is projected to grow beyond the forecasted period. The future cash flows are discounted at a rate that is consistent with a weighted average cost of capital for a potential market participant.
Based on the results of the first step of the goodwill impairment test, we determined that the fair value of our wallboard reporting unit exceeded the carrying amount as of October 1, 2013, 2012 and 2011 and, therefore, no goodwill impairment existed. As a result, the second step of the goodwill impairment test was not required to be completed.
Acquisition Accounting
The Company’s acquisition of the gypsum business of Lafarge North America Inc. was accounted for in accordance with Accounting Standards Codification 805, Business Combinations, or ASC 805. Pursuant to ASC 805, the assets acquired and liabilities assumed are recorded at the date of acquisition at their respective estimated fair values, with any excess of the purchase price over the estimated fair values of the net assets acquired recorded as goodwill. Significant judgment is required in estimating the fair value of certain assets and in assigning their respective useful lives. The fair value estimates are based on available historical information and on future expectations and assumptions deemed reasonable by management, but are inherently uncertain. The most significant assets acquired are property, plant and equipment and intangible assets. We determine the fair value of property, plant and equipment using the following methods: acquired buildings using the cost approach considering a variety of factors, including replacement cost; land based on comparisons to similar assets that have been recently marketed for sale or sold; and machinery and equipment using a cost approach. We use an income approach to estimate the fair value of intangible assets, which is based on forecasts of the expected
63
Table of Contents
future cash flows attributable to the respective assets. Significant estimates and assumptions inherent in the valuation reflect a consideration of the marketplace, and include the amount and timing of future cash flows and the discount rate applied to the cash flows. Unanticipated market or macroeconomic events or circumstances may occur which could affect the accuracy or validity of the estimates and assumptions.
Income Taxes
The provision for income taxes in the Predecessor financial statements is calculated as if the business completed a separate tax return apart from Lafarge, although its business was included in Lafarge’s U.S. federal and state income tax returns and non-U.S. (Canada) jurisdiction tax returns. Deferred tax assets and liabilities are recognized principally for the expected tax consequences of temporary differences between the tax basis of assets and liabilities and their reported amounts, using currently enacted tax rates. Tax attributes generated by the business are treated as transactions between the business and Lafarge. Valuation allowances are recorded to reduce deferred tax assets when it is more likely than not that a tax benefit will not be realized, which can occur when cumulative losses are recorded over several periods.
Effective upon the closing of the Acquisition, we were no longer part of the consolidated tax filings of Lafarge. Unused net operating loss carryforwards, representing $111.0 million at December 31, 2012, remained with Lafarge and will not be available to offset taxable income that might be generated by us in the future.
Since the formation of the Company on July 26, 2013, our annual tax rate is based on our income, statutory tax regulations and rates, and tax planning opportunities available to us in the various jurisdictions in which we operate. Significant judgment is required in determining our annual tax expense and in evaluating our tax positions.
Tax law requires items to be included in our tax returns at different times than when the items are reflected in the financial statements. As a result, the annual tax expense reflected in the consolidated statement of operations is different than that which will be reported in the tax returns. Some of these differences are permanent, such as expenses recorded for accounting purposes that are not deductible in the returns, and some differences are temporary and reverse over time, such as depreciation expense. Temporary differences create deferred tax assets and liabilities. Deferred tax liabilities generally represent tax expense recognized in the financial statements for which payment has been deferred, or expense for which a deduction has been taken already in the tax return but the expense has not yet been recognized in the financial statements. Deferred tax assets generally represent items that can be used as a tax deduction or credit in tax returns in future years for which a benefit has already been recorded in the financial statements. Valuation allowances are established when necessary to reduce deferred income tax assets to the amounts we believe are more likely than not to be recovered. In evaluating the amount of any such valuation allowance, the company considers the reversal of existing temporary differences, the existence of taxable income in prior carry back years, available tax planning strategies and estimates of future taxable income for each of its taxable jurisdictions. The latter two factors involve the exercise of significant judgment. As of December 31, 2013, we recognized a deferred tax asset based on the existence of taxable income in 2013 that could be used for carryback purposes.
We determine whether it is more likely than not that a tax position will be sustained upon examination by the appropriate taxing authorities before any part of the benefit is recorded in the financial statements. A tax position is measured as the portion of the tax benefit that is greater than 50% likely to be realized upon settlement with a taxing authority (that has full knowledge of all relevant information). We may be required to change our provision for income taxes when the ultimate deductibility of certain items is challenged or agreed to by taxing authorities, when estimates used in determining valuation allowances on deferred tax assets significantly change, or when receipt of new information indicates the need for adjustment in valuation allowances. Additionally, future events, such as changes in tax laws, tax regulations, or interpretations of such laws or regulations, could have an impact on the provision for income tax and the effective tax rate. Any such changes could significantly affect the amounts reported in the consolidated financial statements in the year these changes occur.
64
Table of Contents
Recent Accounting Pronouncements
In May 2014, the Financial Accounting Standards Board issued Accounting Standards Update, or ASU, 2014-09, which provides accounting guidance for all revenue arising from contracts with customers and affects all entities that enter into contracts to provide goods or services to their customers. ASU 2014-09 will be effective for the Company in the first quarter of 2017 and requires retroactive application on either a full or modified basis. Early application is not permitted. The Company is currently evaluating ASU 2014-09 to determine its impact on its consolidated financial statements and disclosures.
JOBS Act
In April 2012, the JOBS Act was enacted. Section 107 of the JOBS Act provides that an emerging growth company can take advantage of the extended transition period provided in Section 7(a)(2)(B) of the Securities Act for complying with new or revised financial accounting standards. An emerging growth company can therefore delay the adoption of certain accounting standards until those standards would otherwise apply to private companies. However, we have elected to opt out of such extended transition period and, as a result, we will comply with new or revised financial accounting standards on the relevant dates on which adoption of such standards is required for non-emerging growth companies.
65
Table of Contents
Our Company
We are a leading, high margin manufacturer of gypsum wallboard and complementary finishing products. Our manufacturing facilities and sales efforts are concentrated in the eastern United States and eastern Canada. Gypsum wallboard is a primary building material used in new residential and commercial construction and in R&R. We estimate that in 2013 our market share in the United States east of the Mississippi River, a market which accounted for more than 55% of total U.S. wallboard demand, was approximately 17%, and our share is significantly higher in many of the major metropolitan areas within a shipping radius of 300 miles of our facilities, which include New York, Miami, Tampa, Orlando, Cincinnati, Cleveland, Columbus, Indianapolis, Nashville, Jacksonville and Hartford. For the fiscal year ended December 31, 2013, on a pro forma basis, we had net sales of $402.3 million, operating income of $29.8 million and Adjusted EBITDA of $102.6 million. For the nine months ended September 30, 2014, we had net sales of $303.7 million, operating income of $39.3 million and Adjusted EBITDA of $80.6 million, which represented an increase of 10.6% in Adjusted EBITDA compared to nine months ended September 30, 2013 on a pro forma basis. See “Prospectus Summary—Summary Historical and Unaudited Pro Forma Combined Financial Information” for how we define and calculate Adjusted EBITDA as a non-GAAP measure, a reconciliation thereof to operating income and a description of why we believe this measure is important.
We operate highly efficient and automated manufacturing facilities in Silver Grove (Kentucky), Palatka (Florida) and Buchanan (New York) that produce a full range of gypsum wallboard products for our diversified customer base. We are committed to operational excellence and have invested heavily in our facilities, which we believe are among the newest, largest and most efficient wallboard plants in North America. Our facilities have significant available capacity that will allow us to scale production in a cost-effective manner as wallboard demand increases. We use only synthetic gypsum in our products, which we believe enhances our manufacturing quality and consistency, reduces production costs and provides important environmental benefits relative to natural gypsum. We are the only producer of gypsum wallboard in the United States to use 100% synthetic gypsum. Our strategically positioned plants provide us with two key benefits: cost-effective access to our supplies of synthetic gypsum, which reduces our inbound transportation costs, and close proximity to many major metropolitan areas, which decreases our product delivery costs.
The following map shows the location of our facilities.
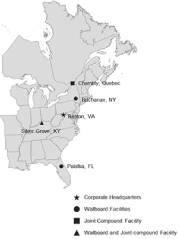
We offer our customers a full range of gypsum wallboard products, including LiftLite®, our lightweight product designed to be easier to lift and install, our Mold Defense® line of products designed for enhanced protection against mold and mildew, and our Weather Defense® line of moisture and mold-resistant exterior
66
Table of Contents
sheathing. To complement our wallboard business and to better serve our customers, we also operate a finishing products business that manufactures a comprehensive line of joint compounds at our plant in Silver Grove (Kentucky) and our joint compound plant in Chambly (Quebec). We provide superior customer service by developing new products based on customer needs, consistently delivering high quality finished product and providing orders accurately with fast delivery times.
The Acquisition
Lafarge founded its U.S. wallboard business in 1996 when it acquired two manufacturing facilities, including our Buchanan plant, from Georgia-Pacific. During the period from 2000 to 2010, Lafarge expanded its geographic footprint through acquisitions and the greenfield development of our Palatka and Silver Grove plants. During this period, Lafarge pursued a strategy of servicing customers from newer and more efficient plants by shuttering less efficient plants, investing in new facilities and modernizing existing facilities. These efforts culminated with the upgrade of the Buchanan plant in 2006 and the opening of the second production line at the Silver Grove plant in 2007, which we believe made the facility the largest in North America. These investments transformed Lafarge’s gypsum division from a regional player in the northeast to a leading competitor across the eastern United States.
On August 30, 2013, Lone Star acquired substantially all of the assets comprising Lafarge’s North American gypsum business for a purchase price of approximately $700.1 million and the assumption of certain liabilities pursuant to the terms of the Asset Purchase Agreement.
The Asset Purchase Agreement contains customary representations, warranties and covenants. Pursuant to the Asset Purchase Agreement, we are indemnified by Lafarge, subject to specified exceptions, for losses arising from, among other things:
| • | breaches by Lafarge of its representations, warranties, covenants and agreements contained in the Asset Purchase Agreement; |
| • | losses with respect to certain assets and liabilities related to Lafarge’s North American gypsum business that we did not assume in connection with the Acquisition; and |
| • | tax liabilities for periods prior to the closing of the Acquisition. |
Subject to certain exceptions, claims for indemnification under the Asset Purchase Agreement must in the aggregate exceed $7 million, after which Lafarge is required to indemnify us for all indemnifiable losses in excess of $3.5 million. Subject to certain exceptions, total indemnification payments by Lafarge may not exceed $105 million. Most claims for indemnification must be made by December 1, 2014, although claims for certain environmental matters may be made until August 30, 2016, claims for taxes with respect to pre-closing periods may be made until 60 days after the expiration of the applicable statute of limitations, claims with respect to breaches of covenants may be made until the applicable covenant is fully performed, and claims with respect to certain representations, including those relating to broker or finder fees and commissions, may be made indefinitely.
The Acquisition was financed through an equity investment from Lone Star of $265 million and borrowings of $465 million under our secured credit facilities, comprised of a $320 million First Lien Term Loan, a $120 million Second Lien Term Loan and $25 million under the Revolver.
Pursuant to the Asset Purchase Agreement, on the closing date of the Acquisition, we and Lafarge entered into a transitional services agreement under which Lafarge agreed to provide us with certain administrative transitional services through the period ending on February 28, 2015. The transitional services agreement is currently scheduled to be terminated on November 21, 2014.
67
Table of Contents
Our Industry
Industry Overview
The North American gypsum wallboard industry is the largest in the world, with the world’s highest per capita consumption rate. Gypsum wallboard is a low cost, widely used building product for interior and exterior walls and ceilings in residential and commercial structures. It is highly regarded for its ease and speed of application and its superior performance in providing comfort, fire resistance and thermal and sound insulation. The primary raw material used to manufacture wallboard, gypsum, can be either natural or synthetic. Natural gypsum is a mineral mined in select areas throughout North America. Synthetic gypsum is sourced primarily via flue gas desulfurization within coal-fired power plants. According to the Gypsum Association, use of synthetic gypsum has increased from 5% of total wallboard production in 1995 to 45% in 2013. We currently use exclusively synthetic gypsum in our manufacturing process.
New housing starts have been the most significant driver of North American wallboard demand. Starting in 2007, the North American wallboard industry suffered a dramatic decrease in demand, driven primarily by the significant downturn of the North American housing market and the associated credit crisis and global recession. U.S. housing starts fell from a cyclical peak of 2.1 million in 2005 to a 60-year low of 554,000 in 2009. Correspondingly, U.S. wallboard consumption declined by more than 50% from 36.2 billion square feet, or bsf, in 2005 to a low of 17.1 bsf in 2010. Pricing across the industry suffered over this period due to the decline in demand.
The following chart shows historical U.S. wallboard consumption and U.S. housing starts.
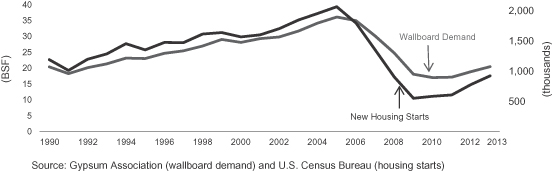
68
Table of Contents
Industry-wide wallboard capacity contracted during the housing market downturn from a peak of approximately 39.6 bsf in 2008 to a low of 31.9 bsf in 2012, as producers shuttered older and less efficient facilities or mothballed unneeded production capacity. The following chart shows industry-wide wallboard capacity and utilization rates.
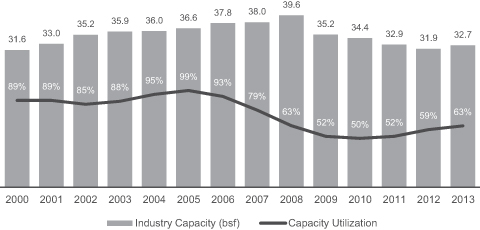
Source: Based on data compiled by the Gypsum Association.
The U.S. housing market is in the early stages of a recovery. U.S. housing starts reached 0.93 million in 2013, driving U.S. wallboard consumption to 20.5 bsf. In 2014, the positive trend in housing starts has continued, with September year-to-date housing starts up 9% year-over-year to 0.76 million as of September 30, 2014, according to the U.S. Census Bureau.
The graph below shows long-term annual U.S. housing starts.
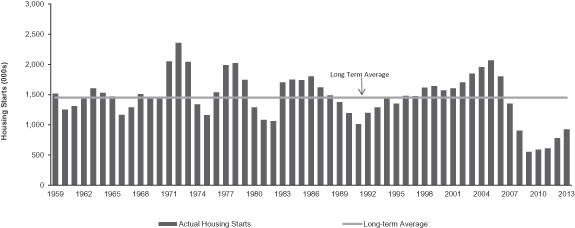
| Housing Starts |
Units (000) |
2013 | Unit Difference |
Percentage Difference |
||||||||||||
| Peak(1) |
2,357 | 925 | 1,432 | 155 | % | |||||||||||
| Long-Term Average(2) |
1,458 | 925 | 533 | 58 | % | |||||||||||
| Average Cyclical Low(3) |
1,131 | 925 | 206 | 22 | % | |||||||||||
69
Table of Contents
Source: U.S. Census Bureau.
| (1) | Peak occurred in 1972. |
| (2) | Average housing starts from 1959 through 2013. |
| (3) | Taken as the average of the 1960, 1966, 1975, 1982 and 1991 housing starts. |
We believe that there is substantial room for continued improvement in housing starts. Housing starts have averaged 1.5 million over the past 50 years, which is approximately 58% greater than the 2013 starts of 925,000. Wallboard consumption has historically correlated closely with increased construction activity, typically trailing housing starts by approximately six to nine months. As housing starts return to normal levels, we expect a corresponding increase in wallboard demand.
According to the Joint Center for Housing Studies of Harvard University, housing demand is expected to show long-term growth in large part to favorable demographic trends. From 2012 to 2015, the Joint Center for Housing Studies estimates that household growth will increase between 11.6 and 13.2 million, as millennials in their 20s and 30s and immigrants form households and aging baby boomers increase demand for new types of housing that can meeting the physical and social needs of later life.
We also expect continued recovery in the repair and remodel market and improvement in the commercial construction market. The RMI is based on a quarterly survey of about 2,000 residential remodelers nationwide and measures current market demand for remodeling as compared to three months prior as well as projected future market demand for remodeling, based on calls for bids, committed work for the next three months, backlog of remodeling projects and other factors. Results are seasonally adjusted. An increase in the RMI indicates that residential remodelers view remodeling conditions as more positive than in the previous quarter. The RMI has increased 163% since the trough in the fourth quarter of 2008 to the third quarter of 2014. Studies indicate that, in the residential segment, homeowners tend to spend more on remodeling projects when they first move into a home. Therefore, we believe that the generally rising levels of existing home sales and home resale values over the past several years have contributed to rising levels of demand for wallboard. Additionally, according to data from McGraw Hill Construction, commercial construction square footage levels for 2013 were still near trough levels and 32% lower than the average of 1.3 billion square feet since 1990, leaving room for future growth. The data from McGraw Hill Construction also indicates commercial construction square footage is expected to grow at a compounded annual growth rate of 10% from 2014 to 2018.
| Quarterly Residential Remodeling Index |
Yearly Commercial Construction Square Footage | |
| (RMI Index Scale) |
(millions of Square Feet) | |
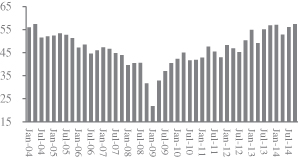
|
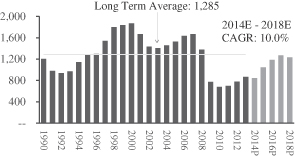
| |
| Source: National Association of Homebuilders. |
Source: McGraw Hill Construction. | |
Competitive Landscape
There are currently seven gypsum wallboard manufacturers in the United States, including us, of which we believe only six compete in the eastern United States. Gypsum wallboard has a high weight-to-value ratio, so it is advantageous to both source raw materials and produce gypsum wallboard in close proximity to where it is used. If manufacturing facilities are not located in close proximity to end markets, transportation costs can render the
70
Table of Contents
cost of finished goods uncompetitive compared to locally manufactured wallboard. Accordingly, competition in the industry occurs principally on a regional basis, and we believe that national scale has limited benefits. Each competitive geographic region has a different group of manufacturers and customers and, as a result, a different competitive landscape.
Although gypsum wallboard remains a regional industry, consolidation in the industry has resulted in increased market share for certain industry participants, including us. In 1997 there were thirteen gypsum wallboard producers, compared to seven in 2014. This consolidation has occurred almost entirely amongst the smaller producers. Since 1997, our national market share has grown from 3% to 10%.
Industry trends within our regions are particularly favorable. In the nine-month period ended September 30, 2014, building permits within our key markets grew 11% over the nine-month period ended September 30, 2013, versus 5.7% growth in the rest of the U.S., according to the U.S. Census Bureau.
The table below shows building permits by metropolitan statistical area, or MSA, in some of the key markets in which we operate, which key markets accounted for more than one-quarter of our total U.S. revenues for both the nine months ended September 30, 2014 and the fiscal year ended December 31, 2013:
| Building Permits | Growth | |||||||||||
| Continental BP Key MSA’s (all data in thousands) |
YTD 2013(1) |
YTD 2014(1) |
YoY | |||||||||
| Atlanta |
18.4 | 19.3 | 4.4 | % | ||||||||
| Chicago |
9.3 | 11.5 | 24.6 | |||||||||
| Cincinnati |
3.6 | 4.0 | 12.9 | |||||||||
| Columbus |
6.3 | 5.4 | (13.7 | ) | ||||||||
| Fort Myers |
2.3 | 3.2 | 39.7 | |||||||||
| Indianapolis |
5.5 | 6.3 | 15.5 | |||||||||
| Jacksonville |
5.5 | 6.0 | 8.6 | |||||||||
| Louisville |
2.8 | 3.3 | 19.2 | |||||||||
| Miami |
15.2 | 11.6 | (23.5 | ) | ||||||||
| Nashville |
8.3 | 9.9 | 20.3 | |||||||||
| NYC / No. NJ / Long Island |
28.0 | 36.9 | 32.0 | |||||||||
| Orlando |
12.1 | 12.6 | 3.8 | |||||||||
| Philadelphia |
8.4 | 9.4 | 12.5 | |||||||||
| Southern Michigan(2) |
6.6 | 7.5 | 13.1 | |||||||||
| Tampa |
9.3 | 9.9 | 6.5 | |||||||||
|
|
|
|
|
|
|
|||||||
| Total for all Continental BP regions |
141.5 | 157.0 | 11.0 | % | ||||||||
| Total for United States |
733.5 | 782.6 | 6.7 | |||||||||
| Total for United States ex Continental BP Regions |
592.0 | 625.6 | 5.7 | |||||||||
Source: U.S. Census Bureau
| (1) | Year-to-date through September. |
| (2) | Southern Michigan includes Detroit, Grand Rapids, and Lansing MSA’s. |
Manufacturing Process
Gypsum wallboard is manufactured by mixing finely ground, partially dehydrated, or calcinated, gypsum with water and forming the resulting slurry between two layers of continuous paperboard liner. It is allowed to harden briefly before being dried and cut to specification. The process is tightly controlled to achieve uniformity and desired board characteristics. Additives can be introduced to the slurry at the beginning of the process to give the resulting board enhanced properties. For instance, wax can be added for water resistance or fungicides added to defend against mold. Additives are also used to control the manufacturing process and to counteract impurities occurring in the gypsum.
71
Table of Contents
Natural Versus Synthetic Gypsum
Wallboard can be produced using gypsum that is either naturally quarried or mined or that is produced synthetically principally through a process known as flue gas desulfurization, or FGD. The FGD process typically takes place in scrubbing towers in coal-fired power plants, where sulfur dioxide flue gases are brought into contact with an aqueous suspension of powdered limestone. The resulting gypsum crystals are separated out from the suspension as a moist, fine crystalline powder and oxidized to be used as gypsum without further processing.
Synthetic gypsum has several advantages for wallboard manufacturing. Natural rock gypsum is typically less pure and less consistent than synthetic gypsum, which can lead to instability in the manufacturing process. To counteract impurities, additional process control additives are often used, which increases the cost to manufacture wallboard made with natural gypsum. Additionally, because synthetic gypsum is produced as a powder, it does not need to be crushed like natural gypsum, which reduces the cost of production.
Our Strengths
Leadership Positions in Attractive Geographic Markets
We estimate that in 2013 our market share in the United States east of the Mississippi River, a market which accounted for more than 55% of total U.S. wallboard demand, was approximately 17%. Importantly, our share is significantly higher in many of our primary metropolitan markets, including markets located in Florida, Georgia, the New York tri-state area, Michigan and Kentucky.
Our market leadership positions will enable us to take advantage of increased demand for gypsum wallboard associated with a recovery in the U.S. residential housing market. Annual housing starts were 0.78 million in 2012 and 0.93 million in 2013, a 19% increase on a year-over-year basis. Furthermore, the markets in which we operate have recovered particularly favorably versus the rest of the U.S. For the period ended September 30, 2014, building permits within our key markets grew 11% compared to the period ended September 30, 2013, while the growth rate over that period in the rest of the U.S. was 5.7%, according to the U.S. Census Bureau. Notwithstanding this growth, we believe gypsum wallboard demand will continue to grow significantly in the coming years, as the U.S. housing market is still at relatively low levels compared to most recent historical housing cycles, and starts would need to grow by approximately 58% from the 2013 level to achieve the 50-year average of 1.5 million.
Strong Margin Profile and Cash Flow Generation
We believe our strong margins and cash flow generation are attributable to our highly efficient, low cost manufacturing plants, attractive location of those plants relative to our customers and our sources of raw materials and management’s continuous focus on maximizing operating efficiencies. Our net sales have grown from $287.9 million for the nine months ended September 30, 2013 on a pro forma basis to $303.7 million for the nine months ended September 30, 2014. For the same periods, our Adjusted EBITDA grew from $72.9 million to $80.6 million, and our operating income improved from $14.0 million to $39.3 million. On a full year basis, our net sales have grown from $311.4 million for the year ended December 31, 2012 on a pro forma basis to $402.3 million for the year ended December 31, 2013 on a pro forma basis. For the same periods, on a pro forma basis, our Adjusted EBITDA grew from $40.7 million to $102.6 million, and our operating income improved from a loss of $45.4 million to a gain of $29.8 million. See “Prospectus Summary—Summary Historical and Unaudited Pro Forma Combined Financial Information” for how we define and calculate Adjusted EBITDA as a non-GAAP measure, a reconciliation thereof to operating income and a description of why we believe this measure is important.
For the nine months ended September 30, 2014, we generated an Adjusted EBITDA margin of 26.5%, representing an increase of 1.2 percentage points compared to the nine months ended September 30, 2013 on a pro forma basis and for the year ended December 31, 2013 we generated an Adjusted EBITDA margin of 25.5%,
72
Table of Contents
representing an increase of 12.4 percentage points compared to the year ended December 31, 2012 on a pro forma basis. Our operational excellence and rigorous focus on cost reduction between 2007 and 2013 has resulted in a fundamentally improved cost structure, which we believe has led to our Adjusted EBITDA margins being among the highest margins in the building products industry as a whole. We have a lower cost structure today because we rationalized older, higher cost facilities and reduced our selling, general and administrative by reducing headcount. Further, our current facilities are new and modern and have lower costs due to greater fuel efficiency and faster lines speeds. We believe that our Adjusted EBITDA margins will continue to improve as the demand for gypsum wallboard grows and we capitalize on our significant operating leverage. We announced a 20% price increase to our customers beginning in January 2015, and certain other wallboard manufacturers in the United States also announced price increases for 2015. We believe these factors, along with capital expenditures that were 2.0% of net sales for the nine months ended September 30, 2014, will allow us to generate significant cash flow going forward. See “Prospectus Summary—Summary Historical and Unaudited Pro Forma Combined Financial Information” for how we define and calculate Adjusted EBITDA margin as a non-GAAP measure and a description of why we believe this measure is important.
Scalable Low-Cost Production
We have made over $550 million in capital investments to build our Silver Grove and Palatka plants, rebuild our Buchanan plant and make ongoing operational improvements at each of these plants. We believe that our wallboard facilities are among the largest and most modern in North America, resulting in productivity levels among the highest in the industry, and that our Silver Grove plant is the largest wallboard facility in North America. Our plant utilization rate was approximately 62% in 2013, and was approximately 64% for the nine months ended September 30, 2014. Due to these recent investments and our cost efficient capacity, we expect to scale production to meet increasing demand with only a modest level of incremental capital expenditures.
Our wallboard plants use only synthetic gypsum produced by power plants located near our facilities, which provides cost-effective access to one of our key raw materials. We believe our sources of synthetic gypsum provide us with a competitive advantage over plants using natural gypsum or other sources of lower quality synthetic gypsum. In comparison to natural gypsum, synthetic gypsum generally reduces production costs, provides environmental benefits and enhances manufacturing quality and consistency due to its higher purity, better binding properties and fewer required additives needed to improve overall quality of wallboard. We are the only producer of gypsum wallboard in the United States to use exclusively synthetic gypsum. We have entered into long-term agreements to purchase synthetic gypsum from a number of power plants located near our facilities, which lowers our costs because of reduced shipping distances. These synthetic gypsum suppliers provide us with amounts in excess of our current requirements, which allows for significant scalability in our wallboard production.
Strategically Situated Plants Near Both Our Primary Markets and Raw Materials
Our wallboard facilities are located in close proximity to major metropolitan areas in the eastern United States and eastern Canada, lowering both our inbound and outbound transportation costs and facilitating timely delivery to our customers. Each of our facilities allow us to offer same-day delivery service to many of our key metropolitan markets, including our Buchanan plant, which provides same day delivery service to customers in the New York City tri-state area and is the closest wallboard facility to Manhattan, which management believes provides us with a competitive advantage.
Our plants use exclusively synthetic gypsum produced by power plants located near our facilities, which provides cost-effective access to one of our key raw materials. We believe that this provides us with a competitive advantage over plants using natural gypsum. Because natural gypsum is typically not mined near population centers, plants using natural gypsum generally incur higher transportation costs to obtain their natural gypsum supplies or have higher product delivery costs because they are located farther from end markets.
73
Table of Contents
Full Range of High-Quality Wallboard Products
We offer a full range of gypsum wallboard products, which are available with a variety of value-added enhancements for specific applications, such as moisture and mold resistance. We believe that our broad product range makes us an attractive supplier to our customers. Certain customers and markets have also favored the use of synthetic gypsum products, which we manufacture, versus natural gypsum products for the additional benefit of receiving LEED ratings to support environmentally responsible initiatives.
We believe our industry experience, manufacturing expertise and flexible production facilities enable us to quickly develop and implement new products in response to market needs or competitor product introductions, as evidenced by the fact that 54% of our net sales in 2013 on a pro forma basis came from products developed in the last five years. For example, in 2011 we introduced LiftLite®, a lightweight wallboard for use on interior walls and ceilings. It is formulated to be up to approximately 20% lighter than standard 1/2” wallboard, making it easier to lift, carry and install. We designed LiftLite® in a relatively short period of time with only a limited investment, and it has replaced most of our standard 1/2” wallboard.
Track Record of High-Quality Customer Service to Our Diverse Customer Base
We regularly achieve high rankings in customer service surveys and have received numerous “supplier of the year” awards from major customers. We consistently provide a high level of service to our customers through a combination of product availability and quality, on-time delivery, and timely and accurate invoicing. We sell our products through several different channels and to a broad group of customers, including gypsum wallboard distributors, buying groups, wholesalers and mass merchants. Lowes, our largest customer represented 14%, 15% and 12% of our net sales in 2013 on a pro forma basis, 2012 and 2011, respectively, and no other customer represented more than 10% of sales.
Our Strategy
Capitalize on Growth Opportunities Related to the Construction Recovery
We believe that we hold leading market positions in many of the major metropolitan areas near our facilities. We are well positioned to capitalize on the recovery in the U.S. housing market. New housing starts have traditionally been the most significant driver of wallboard demand and we expect a strong increase in wallboard demand as housing starts return to more normalized levels. We intend to take advantage of our market leadership and our scalable low-cost production capacity to increase sales and expand margins as market conditions continue to improve.
We also expect that we will benefit from continued growth in R&R, from which we are already seeing significant increased demand, and the expected recovery in new commercial construction. We believe there is momentum in R&R as the Remodeling Market Index has increased 163% in the past five years, according to the National Association of Home Builders. Moreover, commercial construction starts are expected to grow 10% compounded annually from 2014 to 2018, according to data from McGraw Hill Construction.
Utilize Our Significant Operating Leverage to Deliver Strong Cash Flows
One of our primary objectives is maximizing growth in cash flows. As a result of more than $550 million of investments we have made in our facilities and our ongoing rigorous cost management, we expect to experience limited incremental fixed costs as our production increases. We currently have significant additional capacity at our plants, which were operating at a 62% utilization rate in 2013 and a 64% utilization rate in the first three quarters of 2014. As the residential and commercial construction markets improve, we intend to capitalize on our operating leverage to expand our margins and cash flows. Our past investments enable us to maintain a high level of operating productivity with only a modest level of capital expenditures, which represented only 2.0% of sales during the nine months ended September 30, 2014, a level we believe to be indicative of our capital needs over the medium-term.
74
Table of Contents
Maintain Strong Commitment to Operational Excellence
Our management is committed to operational excellence throughout our operations, both on the manufacturing side and in customer-facing functions. Over the last decade we have transformed our asset base and built three highly automated, high capacity wallboard facilities that we believe are among the most modern and efficient in North America. As a result, we have one of the lowest cost bases in the industry and significant available capacity. Our management is constantly measuring our performance to improve our operational excellence based on various metrics throughout the organization, including on-time customer delivery, sales force productivity, product quality and back office reliability targets.
We are similarly focused on superior customer service. We seek to offer our customers a broad range of high-quality gypsum wallboard products. Our industry experience, manufacturing expertise and flexible production facilities enable us to quickly develop and implement new products in response to market needs or product introductions by our competitors. We are focused on building and maintaining strong customer relationships based on product quality and availability, value, just-in-time delivery and prompt and accurate order processing and billing.
Evaluate Strategic Opportunities
Despite the challenging market conditions associated with the housing downturn, we have increased our commitment to the industry and made major investments in our facilities, which has contributed to our enhanced competitive position and market share. Since the mid-1990s, the building materials industry has undergone consolidation as manufacturers have sought to achieve greater cost savings and distribution efficiencies. We believe our market leadership, scale, operating efficiency, and strong cash generation position us well to participate in acquisitions and pursue other strategic opportunities both in the gypsum wallboard market and in adjacent markets within the building materials industry.
Our Manufacturing Facilities
Wallboard
Our wallboard manufacturing facilities have an average capacity age of approximately 11 years. We believe that our wallboard facilities are some of the largest and most modern in North America, resulting in productivity levels amongst the highest in the industry. Our facilities operate at production speeds that are significantly faster than the industry average. Each of our facilities is able to produce a full range of our wallboard products. In 2013 and the nine months end September 30, 2014, our utilization rate across all of our wallboard facilities was approximately 62% and 64%, respectively. Each of our wallboard manufacturing facilities is subject to a mortgage under the First Lien Credit Agreement.
Silver Grove
Our Silver Grove facility is located on the Ohio River in the township of Silver Grove, Kentucky, just outside of Cincinnati. We began operations at Silver Grove in 2000, with the opening of our first high speed wallboard line, and expanded in 2007 when a second high speed wallboard line was opened. The design capacity for Silver Grove is 1.7 bsf per year, which we believe makes it the largest wallboard facility in North America. The facility is serviced by its own rail spur, enabling it to ship products by railcar and truck. We receive deliveries of synthetic gypsum at Silver Grove on barges from power plants located on the Ohio River, which we offload from a purpose-built dock adjacent to the manufacturing facility.
Palatka
Our Palatka facility is located approximately 50 miles southwest of Jacksonville, Florida, near the I-95 corridor. It was opened in 2001 and was designed to be largely identical to the first Silver Grove line. The
75
Table of Contents
design capacity of the Palatka facility is 900 million square feet, or mmsf, per year. The facility is located immediately adjacent to the Seminole Electric power plant, which supplies Palatka with synthetic gypsum directly by conveyor belt.
Buchanan
The Buchanan facility was originally built in the late 1960s. It was acquired by Lafarge in 1996. In 2006, $90 million was invested in the facility to modernize it and double its capacity to 650 mmsf per year. In 2010, a further $32 million was invested into the facility to convert it for synthetic gypsum use. The facility is located on the Hudson River, approximately 40 miles north of Manhattan. This close proximity to New York City provides for efficient delivery to the largest metropolitan wallboard market in the United States. The Buchanan facility provides same-day delivery service to customers in the New York City tri-state area. Buchanan receives deliveries of synthetic gypsum by barge from East Coast power plants.
Finishing Products
We operate two joint compound plants as part of our finishing products business.
Chambly
We acquired the Chambly plant, which is located approximately 20 miles outside of Montreal, in 1999. Since 2007, over $3 million has been invested in upgrading the plant, allowing us to manufacture a full range of joint compounds with a high degree of automation. Chambly has a design capacity of 3.8 million 17 liter equivalent joint compound units per year. We carry out new product development and production optimization research in our development laboratory located onsite.
Silver Grove
We opened the Silver Grove joint compound plant within our Silver Grove wallboard facility in January 2009. We invested $16 million in the construction of the plant and believe that it is one of the most automated joint compound plants in the industry. This high level of automation results in low manpower requirements, allowing us to minimize production costs. Locating the plant within our wallboard facility allows us to top-load joint compound on top of wallboard orders, improving our delivery options for customers. The Silver Grove plant has a design capacity of 4.1 million 17 liter equivalent joint compound units per year.
Our Products
We offer a full range of gypsum wallboard products, which are available with a variety of value-added enhancements for specific applications, such as moisture and mold resistance. We believe that our broad product range makes us an attractive supplier to our customers. Certain customers and markets have also favored the use of synthetic gypsum products, which we manufacture, versus natural gypsum products for the additional benefit of receiving LEED ratings to support environmentally responsible initiatives.
76
Table of Contents
Our wallboard product offerings include:
| Product |
Key Characteristics | |
|
LiftLite® |
Formulated to be up to approximately 20% lighter than standard 1/2” board, making it easier to lift, carry and install | |
|
Firecheck® |
Family of products designed for enhanced fire resistance | |
| Mold Defense® |
Family of products designed for enhanced mold and mildew resistance | |
| Shaftliner Drywall Products |
Family of fire-resistant gypsum wallboard for use in lining elevator shafts, ventilation shafts and stairwells, for area separation walls in residential housing and for other interior building applications requiring fire resistance | |
| Weather Defense® Platinum Sheathing |
Moisture and mold-resistant exterior wall sheathing designed to be covered by an exterior-finishing cladding | |
|
Protecta® |
Family of abuse-resistant gypsum wallboard guarding against surface abrasion, indentation, mold and mildew | |
Our complementary line of finishing products includes:
| Product |
Key Characteristics | |
| Rapid Coat® Lightweight |
All-purpose joint compound that provides easy workability with a quick-drying, two-step application | |
| Rapid Coat® Mid Weight |
Professional-grade, all-purpose joint compound that provides higher durability and lower shrinkage | |
| Rapid Coat® All Purpose |
Professional-grade, all-purpose joint compound that provides superior durability and maximum bond | |
| Rapid Coat® Low Dust |
Specially formulated to reduce airborne dust generated during sanding | |
Raw Materials and Inputs
Synthetic Gypsum
Synthetic gypsum is one of the primary raw materials used to manufacture our wallboard products. We purchase all of our synthetic gypsum supplies from coal-fired power plants with operations near, or easily accessible to, our wallboard facilities. To secure our supplies, we have entered into long-term agreements with major suppliers, with remaining terms (with extensions) ranging from approximately 11 years to 35 years. Our supply contracts provide for a base price with escalation provisions. These contracts are structured as “take-or-pay” arrangements, where the sellers are required to supply a specified annual amount of gypsum and we are required to buy a specified annual amount, or else, in either case, pay penalties under the contracts. These synthetic gypsum suppliers are required to provide us with amounts in excess of our current requirements, which allows for significant scalability in our wallboard production. Our Silver Grove and Buchanan plants have sufficient supply under contract to operate at our full design capacity, while our Palatka facility requires a small amount of additional supply at full capacity. We believe that we would be able to purchase additional gypsum on the open market to the extent any production increases require it, or if market conditions are favorable.
77
Table of Contents
Paperboard Liner
The Seven Hills joint venture with RockTenn provides us with a reliable source of high-quality paperboard liner required for consistent wallboard production. The joint venture was previously between RockTenn and Lafarge, but Lafarge assigned its interest in the joint venture and other operative agreements to us on March 13, 2014, and such agreements will continue on the same terms and conditions as were in effect with Lafarge prior to the Acquisition. We therefore have a long-term supply agreement that fulfills all of our current paper requirements and has the capacity to provide substantial additional supply as we increase production. Seven Hills has the capacity to supply us with approximately 75% of our paper needs at our full capacity, and some additional capacity can be added with a modest additional investment. We believe that we could also purchase additional paper on the spot market in the event of supply disruptions or additional demand.
Natural Gas and Electricity
Our manufacturing processes utilize significant amounts of natural gas and electricity. We purchase both natural gas and electricity on the open market. We currently hedge slightly less than 50% of our natural gas purchases based on usages for the past twelve months, and we do not currently hedge the cost of our electricity purchases at all. We may in the future consider changing this hedging strategy to the extent warranted by market conditions.
Other Inputs
Other manufacturing inputs include additives we use in manufacturing our wallboard products. We purchase these inputs through a mix of open market purchases and supply contracts.
Marketing, Sales and Distribution
Our marketing and sales strategy consists of targeted direct sales efforts to existing and potential customers using an experienced sales force. We operate a single centralized customer-service call center. We also have a centralized logistics team for all of our operations that manages freight, storage and other distribution-related tasks.
As is customary in the industry, we do not enter into long-term agreements with our customers. To encourage our customers to order our products and to increase their loyalty, we offer incentive programs, which provide for customer rebates that are triggered when specified sales volumes or net sales are reached.
We generally bear the cost of delivering our finished products to our customers. We deliver by truck and, in the case of our Silver Grove and Palatka plants, by truck and rail. At each of our facilities, we have one or two carriers under contract that provide the majority of our shipping services.
Customers
We sell our wallboard and finishing products to a diverse group of customers in the construction industry. Our customers are intermediary sellers, such as wallboard distributors, buying groups, wholesalers, home improvement centers and other retailers, who in turn sell our products to end users. Our largest customer is Lowe’s, which accounted for approximately 14%, 15% and 12% of our net sales in 2013 on a pro forma basis, 2012 and 2011, respectively. No other customer accounted for more than 10% of our net sales in 2013 on a pro forma basis, 2012 or 2011.
78
Table of Contents
Competition
The market for our wallboard and finishing products is highly competitive. We believe the key competitive factors in the market include:
| • | Price; |
| • | Service; |
| • | Product quality; and |
| • | Product range. |
There are six gypsum wallboard manufacturers in the United States that we compete with: USG, National Gypsum, Georgia-Pacific, CertainTeed, Eagle Materials, and Pabco Gypsum. Gypsum wallboard has a high weight-to-value ratio, so it is advantageous to both source raw materials and produce gypsum wallboard in close proximity to where it is used. If manufacturing facilities are not located in close proximity to end markets, transportation costs can render the cost of finished goods uncompetitive compared to locally manufactured wallboard. Accordingly, competition in the industry occurs principally on a regional basis, and we believe that national scale has limited benefits. Each competitive geographic region has a different group of manufacturers and customers and, as a result, a different competitive landscape. A number of our competitors are larger than us and may have greater resources or lower costs of capital than we do.
Employees
We had approximately 504 employees as of September 30, 2014. Our employees at our Buchanan wallboard facility, representing approximately 15% of our workforce, are unionized. Our current collective bargaining agreement with our unionized employees at our Buchanan facility expires on November 30, 2014. Our remaining employees are non-union. We believe our relationships with both our union and non-union employees are good.
Properties
We own the real property on which each of our manufacturing facilities and joint compounds finishing products businesses are located. The address of our corporate headquarters is currently 12950 Worldgate Drive, Suite 700, Herndon, Virginia, in approximately 19,500 square feet of leased office space.
We believe that our existing properties are adequate for our current requirements and our operations in the foreseeable future.
Intellectual Property
We maintain many trademarks for our wallboard and finishing products, including, among others, LiftLite®, Firecheck®, Mold Defense® and Rapid Coat®. We also rely on patents and trade secret law to protect some of our manufacturing processes.
Environmental Matters
Our wallboard and finishing products businesses are subject to numerous federal, state and local laws and regulations pertaining to health, safety and the environment. Some of these laws, such as the federal Clean Air Act and the federal Clean Water Act (and analogous state laws), impose environmental permitting obligations and govern the nature and amount of emissions that may be generated. Some laws, such as the Federal Superfund law (and analogous state laws), impose obligations to clean up or remediate spills of hazardous materials into the environment. Some laws, such as the federal Resource Conservation and Recovery Act, or RCRA, (and analogous state laws), impose obligations on us with respect to the management of waste products. None of our operations is the subject of any material local, state or federal environmental proceedings or inquiries. We do not, and have not, used asbestos in any of our products.
79
Table of Contents
In June 2010, following a December 2008 coal ash spill from a surface impoundment in Kingston, Tennessee, the EPA proposed two alternative regulations that would address the storage and disposal of all CCBs, including synthetic gypsum. One of the proposed regulations would regulate the transportation, storage and disposal of CCBs as “special” waste under subtitle C of RCRA, which regulates hazardous waste, except when they are “beneficially used.” The EPA has stated that synthetic gypsum used in wallboard is considered a “beneficial use,” but the proposed regulation does not specifically address the regulatory status of synthetic gypsum prior to its incorporation into wallboard or at the time such wallboard ultimately is disposed. The second proposal would also allow beneficial use of synthetic gypsum and would regulate CCBs bound for disposal as “solid” waste under subtitle D of RCRA, which regulates non-hazardous wastes. The EPA has emphasized that it does not wish to discourage the beneficial use of CCBs under either of its two proposals. The comment period on the EPA’s proposed rules ended on November 19, 2010 and the EPA is continuing to review comments before issuing its final rules. The EPA is expected to issue its final regulation in December of 2014. In February of 2014, the EPA issued its risk evaluation methodology for CCBs as well as the specific application of that methodology to synthetic gypsum. The EPA concluded that any environmental release of constituents of potential concern from synthetic gypsum is comparable or lower than those from natural gypsum. The EPA further stated that it supports the beneficial use of synthetic gypsum in wallboard. If the EPA adopts a final regulation that affects the use, storage or disposal of synthetic gypsum, it could have a material adverse effect on our results of operations, financial position or cash flows. See “Risk Factors—We are subject to environmental and safety laws and regulations and these laws and regulations may change. These laws and regulations could cause us to make modifications to how we manufacture and price our products. They could also require that we make significant capital investments or otherwise increase our costs or result in liabilities to us.”
The U.S. Congress and several states are considering proposed legislation to reduce emission of “greenhouse gases,” including carbon dioxide and methane. Some states have already adopted greenhouse gas regulation or legislation. In 2009, the EPA issued its findings that certain greenhouse gases, including carbon dioxide, endanger the public health and welfare. In 2010, the EPA adopted rules to phase in requirements for all new or modified “stationary sources” that emit 100,000 tons of greenhouse gases per year, or modified sources that increase emissions by 75,000 tons per year, to annually obtain permits demonstrating that they are incorporating the “best available control technology” to minimize greenhouse gas emissions. These rules would affect future modifications or expansions of all our U.S. wallboard plants and the paper mill operated as a joint venture with RockTenn, which produce greenhouse gases. The rules are subject to pending legal challenges that have been filed by certain interested parties, including states, industry groups and environmental organizations, in the U.S. federal courts. If these rules withstand challenge, they could require that we incur significant costs to satisfy permitting requirements in the event of future plant modifications or expansions. In addition, enactment of new climate control legislation or other regulatory initiatives by the U.S. Congress or various states, or the adoption of additional regulations by the EPA and analogous state or Canadian governmental agencies that restrict emissions of greenhouse gases in areas in which we conduct business, could have a material adverse effect on our operations and demand for our services or products. Our manufacturing processes for wallboard use a significant amount of energy, especially natural gas. Increased regulation of energy use to address the possible emission of greenhouse gases and climate change could materially increase our manufacturing costs. From time to time, legislation has been introduced proposing a “carbon tax” on energy use or establishing a so-called “cap and trade” system. Such legislation would almost certainly increase the cost of energy used in our manufacturing processes. See “Risk Factors—We are subject to environmental and safety laws and regulations and these laws and regulations may change. These laws and regulations could cause us to make modifications to how we manufacture and price our products. They could also require that we make significant capital investments or otherwise increase our costs or result in liabilities to us.”
Legal Proceedings
We have been from time to time, and may in the future become, party to litigation or other legal proceedings that we consider to be part of the ordinary course of our business. We are not currently involved in any legal proceedings that could be reasonably expected to have a material adverse effect on our business or our results of operations. We may become involved in material legal proceedings in the future. See Note 10 to the audited combined financial statements included elsewhere in this prospectus.
80
Table of Contents
The following table sets forth certain information regarding our director nominees and executive officers as of the date of this prospectus.
| Name |
Age | Position | ||||
| Isaac Preston |
54 | Chief Executive Officer and President, Director | ||||
| James Bachmann |
46 | Chief Financial Officer | ||||
| Dennis Romps |
46 | Senior Vice President, Corporate Controller | ||||
| Timothy Power |
54 | Senior Vice President, General Counsel and Secretary | ||||
| Muhammad Shahbaz “Boz” Malik |
47 | Senior Vice President, Sales, Marketing and Supply Chain | ||||
| David Obergefell |
60 | Senior Vice President of Manufacturing | ||||
| Isabelle Shiffrin |
41 | Vice President of Human Resources | ||||
| Bradley P. Boggess |
41 | Director | ||||
| Edward Bosowski |
60 | Director | ||||
| Samuel D. Loughlin |
42 | Chairman of the Board; Director | ||||
| Michael O. Moore |
64 | Director | ||||
| Chadwick S. Suss |
38 | Director | ||||
| Jack Sweeny |
67 | Director | ||||
| Kyle S. Volluz |
46 | Director | ||||
| Grant Wilbeck |
33 | Director | ||||
Executive Officers
Isaac Preston—Mr. Preston has served as our President and Chief Executive Officer since August 2013 and has been a member of our board of directors since February 2014. Prior to becoming our Chief Executive Officer in connection with the Acquisition, Mr. Preston served in senior management roles with Lafarge. From June 2002 through August 2013, Mr. Preston was President of the Lafarge North America gypsum division, and from December 2006 to August 2013 he also served as Co-President of Lafarge. Mr. Preston has over 25 years of experience in the building materials industry. Prior to joining Lafarge, he served as Vice President of Strategy for James Hardie Industries. Mr. Preston received a BA from the University of Washington and an MBA from Notre Dame University.
As our President and Chief Executive Officer, Mr. Preston brings a deep understanding of our business, industry, operations and strategic plan to the board of directors. Mr. Preston also has extensive institutional knowledge gained through his more than 16 years of experience with the Lafarge NA and Lafarge S.A. gypsum divisions, prior to the Acquisition. In addition, Mr. Preston’s other senior leadership and building materials experience enable him to provide valuable insight and guidance to the board on our industry as a whole. Mr. Preston’s board service also provides a direct and open channel of communication between the board and senior management.
James Bachmann—Mr. Bachmann became our Chief Financial Officer in January 2014 and previously served as Chief Financial Officer of Lafarge USA and co-Chief Financial Officer of Lafarge from November 2012 through December 31, 2013. He served as Senior Vice President Finance—Investor Relations of Lafarge S.A. from January 2008 through October 2012, Senior Vice President and Controller of Lafarge from November 2005 to June 2006, Vice President Finance—Aggregates, Concrete, and Asphalt Division of Lafarge from February 2004 to November 2005, Vice President Controller of the Gypsum Division of Lafarge from May 2002 to February 2004, and worked at Arthur Andersen from September 1990 to April 2002. Mr. Bachmann received a BSBA from Georgetown University.
Dennis Romps—Mr. Romps became our Senior Vice President, Corporate Controller in January 2014. He previously served as our Chief Financial Officer from August 2013 to December 2013, as Co-Chief Financial Officer of Lafarge from December 2006 through August 2013, as Vice President of Finance and IT of the
81
Table of Contents
gypsum division of Lafarge from January 2012 through August 2013, as Vice President of Finance and Supply Chain of the gypsum division of Lafarge from January 2011 through December 2011 and as Vice President of Finance of the gypsum division of Lafarge from 2005 through December 2010. Mr. Romps received a B.A. from Michigan State University and an M.B.A. from Kellogg – Northwestern University. He is a Certified Public Accountant.
Timothy Power—Mr. Power became our Senior Vice President, General Counsel and Secretary in August 2013. He previously served as Vice President and Associate General Counsel of Lafarge from April 2005 through August 2013, and as Assistant General Counsel of Lafarge from September 1999 through April 2005. He is a member of the New York and District of Columbia bars. Prior to his employment at Lafarge, he was an associate at Shearman & Sterling in New York and at White & Case in Moscow, Russia, among other positions. He received a B.A. and a J.D. from Vanderbilt University.
Muhammad Shahbaz “Boz” Malik—Mr. Malik became our Senior Vice President, Sales, Marketing and Supply Chain in September 2014. He previously served as the Vice President of Sales, Marketing and Commercial Excellence – Engineered Insulation Systems with Owens Corning from June 2010 until September 2014 and as Vice President & General Manager, Timberlake Cabinetry with American Woodmark from June 2007 to February 2010. Prior to that, Mr. Malik held several general management positions with Johns Manville and General Electric. Mr. Malik received a B.S. in Mechanical Engineering from Purdue University.
David Obergefell—Mr. Obergefell has served as our Senior Vice President of Manufacturing since June 2014. Previously he was a partner in Gypsum Process Solutions, a gypsum wallboard consulting business, from January 2013 to May 2014. Prior to joining Gypsum Process Solutions, Mr. Obergefell served in numerous roles for USG Corporation for 34 years, where, among other roles, he was V.P. Manufacturing–International from 2008 to 2011, and V.P. Manufacturing–West-USA and Mexico from 1998 to 2008. Mr. Obergefell received a B.S. in Mechanical Engineering from the University of Dayton.
Isabelle Shiffrin—Ms. Shiffrin became our Vice President of Human Resources in August 2013. She previously served as Vice President of Human Resources for the gypsum division of Lafarge from January 2012 through August 2013, as Vice President of Marketing and Strategy from November 2009 through December 2011 and as Director of National Accounts from July 2006 through 2009. She received a B.A. from the University of Provence, France, and an M.B.A. from Georgetown University.
Directors
Bradley P. Boggess—Mr. Boggess has been a member of our board of directors since August 2013. Mr. Boggess has been a Director of Hudson Americas, LLC, an affiliate of ours and Lone Star since June 2011. His responsibilities include identifying investment opportunities, managing acquisition processes, and driving portfolio company performance. Mr. Boggess’s asset management responsibilities include Lone Star’s operating companies that include grocery, restaurants, and building products. Prior to joining Hudson Americas, Mr. Boggess worked as a turnaround and restructuring advisor with AlixPartners, a leading management consulting and turnaround services firm, from May 2007 to June 2011. Mr. Boggess is a former Armor Officer in the United States Army. Mr. Boggess is also a member of the board of directors of Southeastern Grocers LLC, Caliber Home Loans, Inc., DFC Global Corp and Sterling Holdings Limited. Mr. Boggess also served as a member of the Board of Directors of Del Frisco’s Restaurant Group, Inc. from December 2012 to December 2013.
Mr. Boggess’s background as a management consultant, turnaround advisor and private equity executive in a wide range of industries allows him to assist the board in understanding and addressing the wide variety of issues it faces. His responsibilities for Lone Star’s companies, including our company, also provide Mr. Boggess with a deep working knowledge of our business and operations.
82
Table of Contents
Edward Bosowski—Mr. Bosowski has been a member of our board of directors since February 2014. Mr. Bosowski worked for USG Corporation (USG), the largest manufacturer and distributor of gypsum wallboard in the United States, for over 30 years. His final position at USG was Executive Vice President, Chief Strategy Officer, and President and CEO of USG’s international subsidiary, positions he held from 2006 to 2008. From 2001 to 2006, his responsibilities included being a member of the Office of the President for USG Corporation and several direct reporting relationships, including USG’s distribution subsidiary, its international subsidiary and various staff functions. From 1996 to 2001, he served as Executive Vice President of Sales and Marketing for the domestic gypsum business and became President and CEO of the North American Gypsum Business Unit. After joining USG in 1976, Mr. Bosowski held various positions and leadership roles in several operations and staff functions, including finance, marketing, supply chain, information technology, research and development, engineering, technical services, and business development.
Mr. Bosowski brings a significant level of industry experience to the board, developed during his more than 30 years in the gypsum industry. His extensive expertise and broad leadership roles in the North American gypsum industry provide valuable insight and guidance.
Samuel D. Loughlin—Mr. Loughlin has been Chairman of the Board and a member of our board of directors since February 2014. Mr. Loughlin currently serves as President—Americas Region of Lone Star U.S. Acquisitions, LLC, an affiliate of ours and Lone Star, where he is responsible for the management and oversight of all originations initiatives in North America. Previously, from 2011 to 2013, he served as Managing Director and Senior Managing Director of Lone Star U.S. Acquisitions, LLC. Mr. Loughlin joined Hudson Americas in 2008 and focused on directing the management of the corporate assets located in North America. From 2008 to 2011, he served in various capacities at Hudson Americas, LLC, an affiliate of ours and Lone Star, with responsibility for its retail and restaurant operating companies, in addition to leading teams in special originations initiatives. Mr. Loughlin has more than 16 years of finance and legal experience, including mergers and acquisitions, financing, private equity investment, originations and asset management transactions. Prior to joining Hudson Americas, Mr. Loughlin was a Partner of a Texas based private equity firm with real estate, operating company and securities holdings, where he was responsible for legal oversight, deal structuring, asset evaluation, acquisitions and sales. Prior to that, Mr. Loughlin served as an attorney at Vinson & Elkins LLP, where he was a member of the Business and Corporate Securities group, with experience in venture capital and mezzanine financing transactions, private and public securities offerings, mergers and acquisitions, management buyouts and debt financing transactions. Mr. Loughlin also served as chairman of the board of directors of Del Frisco’s Restaurant Group, Inc. from July 2012 through December 2013.
Mr. Loughlin has significant experience with the strategic, financial and operational requirements facing companies in the retail and related industries, allowing him to guide the board in analyzing, shaping, and overseeing our execution of important operational and policy issues. His responsibilities for Lone Star’s retail companies, including our company, and his service on our Advisory Board also provide Mr. Loughlin with a working knowledge of our business and operations that are important to the development of the board.
Michael O. Moore—Mr. Moore has been a member of our board of directors since February 2014. Until August 2014, Mr. Moore served as Executive Vice President, Chief Financial Officer and Assistant Secretary of Ruby Tuesday, Inc., a national owner, operator or franchisor of casual dining restaurants, a position he held since April 2012. Prior to joining Ruby Tuesday, Mr. Moore was employed with Sun Capital Partners as Executive Vice President and Chief Financial Officer of Pamida Stores from February 2009 to March 2012 and as Interim Chief Financial Officer of Kellwood, Inc. from November 2008 to February 2009. Prior to his tenure with Sun Capital Partners, Mr. Moore served as Executive Vice President and Chief Financial Officer of Advanced Auto Parts from December 2005 to February 2008. Additionally, prior to December 2005, among other positions, Mr. Moore served as Executive Vice President and Chief Financial Officer of The Cato Corporation and as Senior Vice President and Chief Financial Officer of Bloomingdales.
83
Table of Contents
Mr. Moore brings a significant level of financial and accounting expertise to the Board developed during his more than 30 year career. Mr. Moore’s wealth of public company experience provides valuable insight regarding public company reporting matters, as well as insight into management’s day-to-day duties and responsibilities.
Chadwick S. Suss—Mr. Suss has been a member of our board of directors since February 2014. Mr. Suss has been a Vice President of Hudson Americas, LLC, an affiliate of ours and Lone Star since August 2013. His responsibilities include identifying investment opportunities, managing acquisition processes, driving portfolio company performance and working on investment exits. Mr. Suss’s asset management responsibilities include the grocery and building products businesses of Lone Star’s operating companies. Prior to joining Hudson Americas, Mr. Suss worked as a turnaround and restructuring advisor with AlixPartners from March 2009 to July 2013. Prior to AlixPartners, Mr. Suss held investment banking roles at J.P. Morgan and A.G. Edwards as well as corporate finance positions at S.C. Johnson.
Mr. Suss brings broad financial and operational expertise to the board of directors developed through roles in management consulting, investment banking and corporate finance across a variety of industries. Mr. Suss’s background and expertise allow him to help the board identify, understand and address a wide variety of issues.
Jack Sweeny—Mr. Sweeny has been a member of our board of directors since February 2014. Mr. Sweeny worked for Temple-Inland, Inc., a leading building products company, for 40 years. His final position at Temple-Inland was Group Vice President of Temple-Inland, a position he held from 2002 to 2010. Prior to becoming Group Vice President, Mr. Sweeny served as Vice President of Forest Operations from 1995 to 2002 and as Vice President of Operations from 1984 to 1995. After joining Temple-Inland in 1970, Mr. Sweeny held various positions and leadership roles at the company, including managing its marketing department. Mr. Sweeny is a member of the board of directors of First Bank & Trust East Texas.
Mr. Sweeny brings broad industry expertise to the board of directors developed during his 40 years in the building products industry, including experience with all aspects of the gypsum wallboard manufacturing process. His experience provides valuable insight and guidance to the board on the building products industry as a whole.
Kyle S. Volluz —Mr. Volluz has been a member of our board of directors since February 2014. Mr. Volluz has been a Director with Hudson Americas, LLC, an affiliate of ours and Lone Star, since 2010, with responsibility for the management of the Legal Department. In such capacity, Mr. Volluz oversees all legal issues impacting operating companies that are affiliates of Lone Star within North America, as well as other corporate investments for which Hudson Americas provides asset management services in North America. In particular, Mr. Volluz has been actively involved in the negotiation and closing of several lending transactions, acquisitions, and asset sales for us and other Lone Star portfolio companies since joining Hudson Americas in 2009. Prior to joining Hudson Americas, Mr. Volluz was Senior Vice President and Director of Legal Services for Goldman Sachs Specialty Lending Group, an affiliate of Goldman, Sachs & Co., a position he held from 2005 to 2009. Previously, Mr. Volluz was an attorney with Baker Botts LLP and Thompson & Knight LLP, where he supported clients in various types of commercial banking transactions, mergers and acquisitions, private and public securities offerings, and debt financing transactions. Mr. Volluz is a member of the board of directors of Caliber Home Loans, Inc., DFC Global Corp and Sterling Holdings Limited.
Mr. Volluz’s knowledge of our company allows him to bring a well-informed perspective to the board of directors regarding our operations and the associated legal risks. His extensive experience with capital market transactions, both involving our company and other affiliates of Lone Star Fund, also allows him to make valuable contributions with respect to our capital structure and financing and investing activities. His legal background also provides valuable insight to the board regarding issues we may face.
Grant Wilbeck—Mr. Wilbeck has been a member of our board of directors since February 2014. Mr. Wilbeck has served as Managing Director of Lone Star U.S. Acquisitions, LLC, an affiliate of ours and Lone Star, since 2013, where he focuses on origination and underwriting activities related to corporate private equity
84
Table of Contents
and debt investments. Previously, from 2007 to 2013, he served in various capacities at Hudson Americas, LLC, an affiliate of ours and Lone Star, with asset management responsibility across all retail and restaurant operating companies focusing on operational performance, capital structure and acquisition opportunities. Prior to joining Hudson Americas, LLC, Mr. Wilbeck was at APS Financial Corp. where he was a research analyst focused on distressed debt and special situations. Mr. Wilbeck is a member of the board of directors of Caliber Home Loans, Inc.
Mr. Wilbeck brings broad expertise in financial management to the board of directors. His extensive experience in the financial markets also allows him to make valuable contributions with respect to our capital structure and financing and investing activities.
There are no family relationships among any of our directors or executive officers.
Director Compensation
In fiscal year 2013, we did not pay any compensation to our non-employee directors for their services as directors. However, following the completion of our initial public offering, we began paying compensation to independent directors. Each independent director receives an annual retainer of $50,000 per year, with an additional $2,500 annual fee for service as the chairman of the board or as chairperson of a committee of the board. In addition, we pay our independent directors a fee of $1,500 for each meeting attended in person or telephonically. Independent directors also receive an annual equity grant. Such cash fees are paid quarterly in arrears.
Board of Directors
Our certificate of incorporation provides that our board of directors is divided into three classes of directors, with the classes to be as nearly equal in number as possible. The members of each class serve for a three-year term. As a result, one-third of our board of directors will be elected each year. Messrs. Loughlin, Suss and Volluz are class I directors, up for election in 2015, Messrs. Boggess, Preston and Wilbeck are class II directors, up for election in 2016, and Messrs. Bosowski, Moore and Sweeny are class III directors, up for election in 2017. See “Description of our Capital Stock—Provisions of Our Certificate of Incorporation and Bylaws and Delaware Law That May Have an Anti-Takeover Effect—Classified Board of Directors.”
Prior to our initial public offering, our board of directors established an audit committee, a compensation and benefits committee and a nominating and corporate governance committee, each of which operates pursuant to a charter adopted by our board of directors. The composition and functioning of all of our committees complies with all applicable requirements of the Sarbanes-Oxley Act of 2002, the SEC rules and regulations and the rules of the NYSE.
Following this offering, Lone Star Fund will continue to control more than 50% of the voting power of our common stock in the election of directors. Accordingly, we intend to continue to avail ourselves of the “controlled company” exception available under NYSE rules which eliminates certain requirements, such as the requirements that a company have a majority of independent directors on its board of directors, that compensation of the executive officers be determined, or recommended to the board of directors for determination, by a majority of the independent directors or a compensation and benefits committee comprised solely of independent directors, and that director nominees be selected, or recommended for the board of directors’ selection, by a majority of the independent directors or a nominations committee comprised solely of independent directors. In the event that we cease to be a controlled company, we will be required to comply with these provisions within the transition periods specified in the NYSE rules. These exemptions do not modify the independence requirements for our audit committee, and we have complied with the applicable requirements of the SEC and the NYSE with respect to our audit committee within the applicable time frame.
85
Table of Contents
Committees of the Board of Directors
Audit Committee
The primary responsibilities of our audit committee is to oversee the accounting and financial reporting processes of our company as well as our subsidiary companies, and to oversee the internal and external audit processes. The audit committee also assists the board of directors in fulfilling its oversight responsibilities by reviewing the financial information provided to stockholders and others, and the system of internal controls established by management and the board of directors. The audit committee oversees the independent auditors, including their independence and objectivity. The audit committee is empowered to retain independent legal counsel and other advisors as it deems necessary or appropriate to assist it in fulfilling its responsibilities, and to approve the fees and other retention terms of the advisors.
The audit committee is comprised of three members, Messrs. Bosowski, Moore and Sweeny, with Mr. Moore serving as chair. Our board of directors has determined that each of Messrs. Bosowski, Moore and Sweeny is independent, as defined under and required by the federal securities laws and the NYSE rules. Our board of directors has determined that Mr. Moore qualifies as an audit committee financial expert under the federal securities laws and that each member of the audit committee has the financial sophistication required under NYSE rules.
Compensation and Benefits Committee
The primary responsibilities of our compensation and benefits committee is to periodically review and approve the compensation and other benefits for our employees, officers and independent directors. This includes reviewing and approving corporate goals and objectives relevant to the compensation of our executive officers in light of those goals and objectives, and setting compensation for these officers based on those evaluations. Our compensation and benefits committee also administers and has discretionary authority over the issuance of stock awards under our equity incentive plan.
The compensation and benefits committee may delegate authority to review and approve the compensation of our employees to certain of our executive officers, including with respect to awards made under our equity incentive plan. Even where the compensation and benefits committee does not delegate authority, our executive officers will typically make recommendations to the compensation and benefits committee regarding compensation to be paid to our employees and the size of grants of stock option, restricted stock and other forms of stock-based compensation.
The compensation and benefits committee is comprised of three members, Messrs. Boggess, Bosowski and Suss, with Mr. Boggess serving as chair. For so long as we are a controlled company, we are not required to have a compensation and benefits committee comprised of independent directors under NYSE rules. The board has nonetheless determined that Mr. Bosowski is independent under NYSE rules.
Nominating and Corporate Governance Committee
Our nominating and corporate governance committee oversees all aspects of our corporate governance functions. The committee makes recommendations to our board of directors regarding director candidates and assists our board of directors in determining the composition of our board of directors and its committees. The nominating and corporate governance committee is comprised of three members, Messrs. Boggess, Loughlin and Volluz, with Mr. Loughlin serving as chair. For so long as we are a controlled company, we are not required to have a nominating and governance committee comprised of independent directors under NYSE rules.
86
Table of Contents
Code of Ethics and Business Conduct, Principles of Corporate Governance and Committee Charters
Our board of directors has adopted a code of ethics and business conduct that establishes the standards of ethical conduct applicable to all directors, officers and employees of our company, including our principal executive, financial and accounting officers, or persons performing similar functions. The code addresses, among other things, conflicts of interest, compliance with disclosure controls and procedures and internal control over financial reporting, corporate opportunities and confidentiality requirements. The audit committee is responsible for applying and interpreting our code of conduct and ethics in situations where questions are presented to it.
Our Code of Ethics and Business Conduct, our Principles of Corporate Governance and the charters of the committees of our Board of Directors, including the Audit Committee, Nomination and Corporate Governance Committee, and Compensation and Benefits Committee, are available through the “Investor Relations” and “Corporate Governance” links on our Web site at www.continental-bp.com. In the event we make any amendment to, or grant any waiver from, a provision of the Code of Ethics and Business Conduct that applies to our principal executive officer, principal financial officer or principal accounting officer that requires disclosure under applicable SEC rules, we will disclose such amendment or waiver and the reasons therefor on our website. We will provide any person without charge a copy of any of the aforementioned codes of ethics upon receipt of a written request. Requests should be addressed to: Continental Building Products, Inc., 12950 Worldgate Drive, Suite 700, Herndon, Virginia 20170, Attention: General Counsel. Our website is not part of this prospectus.
Compensation and Benefits Committee Interlocks and Insider Participation
Our compensation and benefits committee is comprised of Messrs. Boggess, Bosowski and Suss. None of our executive officers currently serves or has served during the last completed fiscal year, as a member of the board of directors, or as a member of the compensation or similar committee, of any entity that has one or more executive officers who served on our board of directors. For a description of the transactions between us and members of the compensation and benefits committee, and entities affiliated with such members, see the transactions described under the section entitled “Certain Relationships and Related Party Transactions.”
87
Table of Contents
Introduction
The executive compensation disclosure that follows explains the compensation awarded to, earned by or paid to Isaac Preston, our chief executive officer, Dennis Romps and Timothy Power, our two most highly compensated executive officers other than our chief executive officer for fiscal year 2013, and Stephen DeMay, who would have been one of the two most highly compensated executive officers for fiscal year 2013 but for the fact that he was not serving as an executive officer at the end of the fiscal year. Mr. DeMay terminated employment with Lafarge effective August 30, 2013. We refer to these individuals in this section as our “named executive officers” or “NEOs.”
Prior to the Acquisition, we operated as the gypsum division of Lafarge. As such, prior to the Acquisition, all compensation programs in which our NEOs participate, and all decisions made with regard to the compensation of our NEOs, were programs of, or decisions made by, Lafarge or Lafarge S.A., which together with their consolidated subsidiaries, we refer to in this prospectus as the Lafarge Group. Following the Acquisition, we implemented our own compensation program, which was substantially similar to that in effect prior to the Acquisition, and all decisions regarding the compensation of our current NEOs are now made by our Board of Directors.
Compensation Tables
Certain of the amounts in the “Summary Compensation Table” and the awards set forth in the table of “Outstanding Equity Awards at Fiscal Year End” included below reflect amounts paid or payable or awards granted to our NEOs pursuant to the Lafarge Group’s compensation programs. As described previously, following the Acquisition, the current NEOs commenced receiving compensation and benefits pursuant to the Company’s compensation programs.
Summary Compensation Table
The following table summarizes information concerning the compensation awarded to, earned by or paid to our NEOs (i) during Lafarge’s fiscal year ended December 31, 2012 under the compensation plans and programs maintained by the Lafarge Group and (ii) during our fiscal year ended December 31, 2013 under compensation plans and programs maintained by the Lafarge Group or the Company, as applicable.
| Name and principal position |
Year | Salary ($) |
Bonus ($)(1) |
Stock Awards ($)(2) |
Option Awards ($)(3) |
Non-Equity Incentive Plan Compensation ($)(4) |
Change in Pension Value and Nonqualified Deferred Compensation Earnings ($)(5) |
All Other Compensation ($)(6) |
Total ($) | |||||||||||||||||||||||||||
| Isaac Preston |
2013 | $ | 362,153 | $ | 411,876 | $ | 74,029 | — | — | $ | 39,528 | $ | 887,587 | |||||||||||||||||||||||
| Chief Executive Officer |
2012 | $ | 333,230 | $ | 500,000 | $ | 21,628 | $ | 43,920 | $ | 349,892 | — | $ | 39,303 | $ | 1,287,974 | ||||||||||||||||||||
| Dennis Romps |
2013 | $ | 203,000 | $ | 196,656 | $ | 20,438 | — | $ | 27,087 | $ | 447,181 | ||||||||||||||||||||||||
| Former Chief Financial Officer |
2012 | $ | 200,000 | $ | 200,000 | $ | 14,865 | — | $ | 140,625 | — | $ | 26,862 | $ | 582,352 | |||||||||||||||||||||
| Timothy Power |
2013 | $ | 210,620 | $ | 192,905 | $ | 20,438 | — | — | $ | 24,675 | $ | 448,638 | |||||||||||||||||||||||
| SVP General Counsel |
||||||||||||||||||||||||||||||||||||
| Stephen DeMay |
2013 | $ | 127,435 | $ | 90,798 | $ | 13,257 | — | — | $ | 257,485 | $ | 488,976 | |||||||||||||||||||||||
| Former VP Sales |
2012 | $ | 191,153 | $ | 191,153 | $ | 13,316 | — | $ | 130,820 | — | $ | 32,804 | $ | 559,246 | |||||||||||||||||||||
| (1) | For fiscal year 2013, the amounts shown in this column for each NEO represent, as applicable, the one-time Acquisition-related bonuses (Mr. Preston—$171,615; Mr. Romps—$101,500; Mr. Power—$102,965) as |
88
Table of Contents
| well as the pro-rated annual incentive bonuses for January through August of 2013 (Mr. Preston—$240,261; Mr. Romps—$95,156; Mr. Power—$89,940; Mr. DeMay—$90,798). For fiscal year 2012, the amounts shown in this column for each of the NEOs represent the one-time retention bonuses paid by the Lafarge Group to each of the NEOs on April 15, 2012. |
| (2) | The amounts shown in this column represent the aggregate grant date fair value of the performance share awards made to the NEOs in 2012 and 2013. The aggregate grant date fair values of such awards were determined assuming the highest level of performance conditions, determined as of the grant date. The aggregate grant date fair values have been determined based on a fair value model using the market value of a share of Lafarge S.A. stock on the date of grant. |
| (3) | The amounts shown in this column represent the aggregate grant date fair value of the stock option award made to Mr. Preston in 2012. The aggregate grant date fair value of such award has been determined based on a fair value model using the market value of a share of Lafarge S.A. stock on the date of grant. |
| (4) | For fiscal year 2013, the NEOs received payments in respect of September through December of 2013 under the Stub Year Bonus Plan. For fiscal year 2012, the amounts shown in this column represent the annual cash incentive payments made to the NEOs under the Lafarge Group Bonus Plan. |
| (5) | The NEOs did not receive any “above market” interest on non-qualified deferred compensation. |
| (6) | The amounts in this column represent the sum of perquisites and personal benefits provided to, life insurance premiums paid on behalf of, and company contributions to defined contribution plans on behalf of, the NEOs during 2012 and 2013. For Mr. DeMay, for 2013, this amount also includes a severance payment of $231,641, comprised of $191,153 for continued salary and $40,488 for continued car allowance, cell phone services, health benefits, life insurance premiums and executive placement services. |
Narrative Disclosure to the Summary Compensation Table
Certain of the compensation plans and programs described below were maintained by the Lafarge Group and remained with the Lafarge Group and were not transferred to the Company in connection with the Acquisition. Following the Acquisition, we implemented our own compensation programs and policies, pursuant to which our current NEOs receive compensation and benefits. These programs and policies are substantially similar to those of Lafarge described below, except as explicitly noted below.
Base Salary
As of December 31, 2013, each of our NEOs was employed on an “at will” basis. Each NEO’s base salary is determined on an annual basis, taking into account the NEO’s position and responsibilities, the pay range for individuals in similar positions and having similar responsibilities within the Company, the compensation practices of similar companies in our sector and market and the NEO’s previous base salary.
Incentive Compensation
Annual Incentive. In connection with the Acquisition, for the portion of fiscal year 2013 leading up to the Acquisition, each of our NEOs received a guaranteed annual incentive payment equal to the bonus payment received in fiscal 2012 under the Lafarge Group Bonus Plan, pro-rated for the first eight months of the year (reflected in the “Bonus” column of the Summary Compensation Table). We maintained a plan substantially similar to the Lafarge Group Bonus Plan for the remaining four months of 2013, pursuant to which participants, including the NEOs (other than Mr. DeMay, who terminated employment with us), were eligible to earn a pro-rated portion of their target bonus amount (expressed as a percentage of their base salary) based upon the achievement of certain business and financial objectives, as well as their individual performance compared to pre-defined objectives (reflected in the “Non-Equity Incentive Plan Compensation” column of the Summary Compensation Table). We refer here to the bonus opportunity for September to December of 2013 as the Stub Year Bonus Plan. For 2013, the target award opportunities for our NEOs for the Stub Year Bonus Plan (prior to pro-ration), expressed as a percentage of their respective base salaries, were: Isaac Preston—100%; Dennis Romps—75%; and Timothy Power—75%.
89
Table of Contents
In 2013, 40% of each of our NEO’s award opportunity for the Stub Year Bonus Plan was tied to the achievement of a financial performance goal, or the Performance Goal, 25% to the achievement of a cost reduction and revenue enhancement goal and 35% to the NEO’s achievement of individual objectives, including health and safety objectives. In February of 2014, we reviewed performance against the pre-defined objectives and determined that each NEO earned 100% of their target award opportunity.
Long-Term Incentives. Prior to the Acquisition, each of our NEOs participated in the Lafarge S.A. Performance Share Plan, or the PSP, and the Lafarge S.A. Stock Option Plan, or the Option Plan. Under the PSP and the Option Plan, the NEOs were eligible to receive grants of stock options and/or performance shares of Lafarge S.A., based upon the achievement of Lafarge Group’s internal and external performance objectives.
Each of the NEOs received a performance share grant under the PSP in 2013 that can be earned subject to Lafarge Group’s 2014 and combined 2014-2015 EBITDA performance relative to enumerated targets. Subject to satisfaction of the performance metrics, the performance shares are eligible to vest four years following the date of grant.
2013 Acquisition-Related Bonuses. In connection with the closing of the Acquisition, each of our NEOs, other than Mr. DeMay, received a one-time bonus for their work done on the divestiture.
Post-Acquisition Long Term Incentive Plan. Following the Acquisition, Lone Star implemented a new cash-based long term incentive plan, the LSF8 Gypsum Holdings, L.P. Long Term Incentive Plan, or the LTIP. Under the LTIP, participants are granted pool units entitling them, subject to the terms of the LTIP, to a potential cash payout upon a monetization event (as defined below under “—Severance and Change in Control Arrangements”). The Company’s sole shareholder, LSF8 Gypsum Holdings, L.P., or LSF, maintains, and is obligated for all payments under the LTIP. The LTIP was effective August 30, 2013. As of December 31, 2013, Mr. Preston and Mr. Power were the only NEOs that participate in the LTIP (Four other executive officers that were not NEOs for 2013, including Mr. James Bachmann, our Chief Financial Officer, also participate in the LTIP).
During fiscal year 2013, Mr. Preston was awarded 400,000 pool units under the LTIP and Mr. Power was awarded 100,000 pool units under the LTIP. (Mr. Bachmann and the three other executive officer participants in the LTIP to date, were awarded 200,000 and an aggregate of 150,000 pool units, respectively, under the LTIP.) The total number of pool units authorized under the LTIP is 1,000,000. The LTIP remained outstanding following our initial public offering. While LSF does not expect to increase the total number of pool units authorized under the LTIP, LSF has made additional grants to other officers in 2014 and may make future limited grants out of the currently authorized but unallocated pool units under the LTIP.
Pool units granted under the LTIP generally only become vested upon the occurrence, prior to August 30, 2018, of a vesting monetization event (as defined below under “—Severance and Change in Control Arrangements”). The value of a participant’s pool units is determined as of the closing date of each monetization event relative to that participant’s interest in the incentive pool, calculated as the number of vested pool units held by the individual participant, divided by 1,000,000 (the total number of pool units under the LTIP). The amount of profits credited to the incentive pool under the LTIP in connection with a monetization event is based upon the internal rate of return realized upon a monetization event by the Company’s direct and indirect equity holders immediately prior to our initial public offering; provided, however, in no event will more than $35 million, in the aggregate, be credited to the incentive pool under the LTIP. In addition, the incentive pool will not be credited with any amounts and no payouts will be made unless (1) such internal rate of return is at least 15%, and (2) when combined with any prior monetization event, the monetization event results in a return of the beginning equity value (as defined in the LTIP) to the Company’s direct and indirect equity holders immediately prior to our initial public offering. Payments under the LTIP, if earned pursuant to the LTIP, are made in cash as soon as reasonably practicable after the closing of the applicable monetization event. Our initial public offering did not trigger any payouts under the LTIP.
90
Table of Contents
The amount of profits that are credited to the incentive pool upon a monetization event, subject to the $35 million cap, is summarized in the table and footnotes below:
| Aggregate Cash Distribution Cash Received(1) or Monetization Event Value(2), as Applicable, Required to Achieve Cumulative Internal Rate of Return of: |
Percentage of the Incremental Cash Distribution Profit Amount(1) or Monetization Event Profit Amount(2), as Applicable, to be Credited as Cash Distribution Participation Amount(1) or Monetization Event Participation Amount(2), as Applicable(3) | |
| 14.99% or less |
0.0% | |
| Over 15% up to 17.99% |
1.25% of excess over 0% | |
| Over 18% up to 20.99% |
2.75% of excess over 18% | |
| Over 21% up to 24.99% |
4.50% of excess over 21% | |
| Over 25% up to 29.99% |
6.75% of excess over 25% | |
| Over 30% up to 34.99% |
7.75% of excess over 30% | |
| Over 35% up to 39.99% |
9.00% of excess over 35% | |
| Over 40% up to 44.99% |
11.25% of excess over 40% | |
| Over 45% |
14.50% of excess over 45%** |
| (1) | Upon a monetization event that is a cash distribution (as defined under “—Severance and Change in Control Arrangements”) and that occurs prior to any of the other types of monetization events, the incentive pool will be credited with an amount equal to the Cash Distribution Participation Amount. The “Cash Distribution Participation Amount” is a portion of the excess of: |
| (i) | the sum of such cash distribution actually distributed to the Company’s current direct and indirect equity owners immediately prior to our initial public offering (the “Cash Distribution Cash Received”) plus all prior cash distributions (plus all prior Monetization Event Value Received (see footnote (2), below), if any), over |
| (ii) | a beginning equity value (as defined in the LTIP), as increased from time to time pursuant to the LTIP (such excess, the “Cash Distribution Profit Amount”). |
To determine such portion, LSF will calculate a cumulative internal rate of return (“Cumulative Internal Rate of Return”) with respect to the Cash Distribution Cash Received in such current cash distribution and all prior cash distributions (the “Aggregate Cash Distribution Cash Received”). However, the incentive pool will not be credited with any amounts unless and until the Cumulative Internal Rate of Return equals or exceeds 15%. Once the Cumulative Internal Rate of Return equals or exceeds 15%, the Cash Distribution Participation Amount or Monetization Event Participation Amount, as applicable, will be determined pursuant to the table above.
| (2) | Upon a monetization event other than a cash distribution, the incentive pool will be credited with the Monetization Event Participation Amount. The “Monetization Event Participation Amount” will mean a portion of the excess of: |
| (i) | the sum of the net cash proceeds (and the fair market value of other consideration received at the time of the monetization event as determined in LSF’s discretion) from the event causing the monetization event actually received by the Company’s direct and indirect equity holders immediately prior to our initial public offering (the “Monetization Event Value Received”) plus all prior Aggregate Cash Distribution Cash Received, over |
| (ii) | the beginning equity value (such excess, the “Monetization Event Profit Amount”). |
To determine such portion, LSF will calculate a Cumulative Internal Rate of Return with respect to the Monetization Event Value Received and the Aggregate Cash Distribution Cash Received (the “Aggregate Monetization Event Value”). However, the incentive pool will not be credited with any
91
Table of Contents
amounts unless and until the Cumulative Internal Rate of Return equals or exceeds 15%. Once the Cumulative Internal Rate of Return equals or exceeds 15% then, the Cash Distribution Participation Amount or Monetization Event Participation Amount, as applicable, will be determined pursuant to the table above.
In addition, in the event the Cumulative Internal Rate of Return is greater than or equal to 25%, the aggregate amount credited as Monetization Event Participation Amount will not be less than $85,000,000.
| (3) | The percentage in the right-hand column in any particular row of the table is applied only to the portion of the Cash Distribution Profit Amount or Monetization Event Profit Amount, as applicable, attributable to the incremental Cumulative Internal Rate of Return reflected in the left-hand column of such row. |
Retirement Plans
Prior to the Acquisition, our NEOs participated in retirement benefit plans sponsored by Lafarge. None of those plans were assigned to the Company in connection with the Acquisition and thus our NEOs no longer actively participate in those plans. Following the Acquisition, we implemented our own tax qualified 401(k) defined contribution plan, or 401(k) plan, for the benefit of our employees. Under the 401(k) plan, employees (including the current NEOs) are permitted to elect to reduce their current compensation by up to the statutorily prescribed annual limit and to have the amount of such reduction contributed to the 401(k) plan. We are also permitted to make contributions up to the legally prescribed limits on behalf of all eligible employees to the 401(k) plan.
The following is a brief description of the Lafarge plans providing retirement benefits that our NEOs participated in prior to the Acquisition, none of which were assigned to the Company in connection with the Acquisition.
Defined Benefit Plans. Lafarge maintains the Lafarge North America Inc. Retirement Plan, or the Lafarge Retirement Plan, a tax qualified defined benefit pension plan, for certain of its salaried and hourly employees, including each of the NEOs. Under the terms of the Lafarge Retirement Plan, participants are eligible to receive an annual retirement benefit equal to 1.33% of the participant’s final average pay for each year of credited service under the plan. A participant’s final average pay is the highest consecutive 60 month average out of the last 120 months, consisting of base pay plus Group-wide bonus and subject to benefit limitations under the Code. Normal retirement age under the Lafarge Retirement Plan is 65, but a participant may elect early retirement starting at age 55, subject to a 6% benefit reduction per year prior to age 63.
Lafarge maintains the Lafarge North America Inc. Supplemental Executive Retirement Plan, or the Lafarge SERP, a non-qualified defined benefit pension plan, for a select group of management or highly compensated employees, including each of the NEOs. Under the terms of the Lafarge Retirement Plan, participants are eligible to receive an annual retirement benefit equal to 1.75% of the participant’s final average pay for each year of credited service under the Retirement Plan and the SERP, in the aggregate. A participant’s final average pay is the highest consecutive 60 month average out of the last 120 months, consisting of base pay plus Group-wide bonus and subject to benefit limitations under the Code. Normal retirement age under the Lafarge Retirement Plan is 65, but a participant may elect early retirement starting at age 55, subject to a 6% benefit reduction per year prior to age 63.
Defined Contribution Plans. Lafarge also maintains various tax qualified defined contribution pension plans, including the Lafarge North America Inc. Thrift Savings Plan, or the Lafarge Thrift Plan, under which certain of our employees, including each of our NEOs, were eligible to contribute up to 25% of their eligible pay on a pre-tax or after-tax basis, up to prescribed limits under the Code. Under the terms of the Lafarge Thrift Plan, Lafarge matched 100% of a participant’s contributions up to 3% of the participant’s eligible pay, and matched 50% of a participant’s contributions on the next 3% of the participant’s eligible pay.
92
Table of Contents
Under the Lafarge North America Inc. Deferred Compensation and Thrift Savings Restoration Plan, or the Lafarge Deferred Compensation Plan, our employees, including each of our NEOs, were also eligible to defer receipt of a portion of their base salary and cash incentive compensation into a notional account that earns interest at the prime rate. Lafarge matched 75% of a participant’s contributions to his or her account under the Deferred Compensation Plan, up to 6% of the participant’s eligible pay.
Severance and Change in Control Arrangements
Under the Lafarge North America Inc. Severance Pay Plan, or the Severance Plan, each of our NEOs was eligible to receive severance benefits in the event that his employment is involuntarily terminated and such termination constitutes a “separation from service” under Code Section 409A, each of which we refer to as a Qualifying Termination. If an NEO experiences a Qualifying Termination, the NEO is entitled, subject to his execution of a general release and waiver of legal claims, to continue to receive an amount equal to six months’ base salary, paid in the same manner and amount as prior to his Qualifying Termination. The NEO would also be eligible to receive up to an additional 12 months of base salary, paid monthly, if he is unable to locate substantially equivalent employment within 18 months of the Qualifying Termination. The Severance Plan also provides for continued health benefits for so long as the participant is receiving base salary payments, pursuant to the terms of the Severance Plan. All benefits payable under the Severance Plan are subject, in time and manner of payment, to compliance with Code Section 409A. Following the Acquisition, the Company committed to providing the current NEOs with the same level of severance benefits.
Our NEOs have not entered into any agreements, and do not participate in any plans or programs, providing for the payment of additional compensation or benefits in the event of a change in control of the Company, except the LTIP. As discussed above under pursuant to the LTIP, pool units become vested only upon the occurrence of a vesting monetization event that occurs prior to August 30, 2018, subject to continued employment through the date of the event. All vested and unvested pool units will generally be forfeited upon any termination of employment; provided, however that a participant will retain the right to receive payment in respect of vested units, but only with respect to monetization events that occurred prior to the participant’s termination of employment. In addition, with respect to Mr. Preston’s and Mr. Power’s pool units, upon his termination of employment either by the Company without cause (as defined in the LTIP) or his resignation for good reason (as defined in the LTIP), in either case, within 12 months following a major transaction, Mr. Preston or Mr. Power, as applicable, will be deemed vested with respect to 50% of his pool units and shall be entitled to retain those vested pool units following such termination of employment.
Generally, for purposes of the LTIP, a monetization event occurs when:
| • | LSF or the Company is converted, merged, consolidated or reorganized into or with another corporation or other legal person and, immediately after such conversion, merger, consolidation, or reorganization, less than a majority of the combined voting power of the then-outstanding equity securities of such corporation or other legal person immediately after such transaction are held in the aggregate by the holders of voting securities of LSF immediately prior to such transaction; |
| • | (A) the equityholders of LSF sell, transfer or exchange more than 50% of the combined voting power of the then-outstanding equity securities of LSF or the Company to an unrelated third party, or (B) LSF or its subsidiaries sell, transfer or exchange more than 50% in value of their aggregate assets to any other entity or other legal person, and less than a majority of the combined voting power of the then outstanding equity securities of such entity or person immediately after such sale are held in the aggregate by the holders of voting securities of LSF immediately prior to such sale; |
| • | a firm commitment underwritten public offering occurs that is registered under the Securities Act of 1933, as amended, of the equity interests of LSF, the Company, another subsidiary of LSF or a respective successor entity where either (A) the members’ interest in the voting securities of LSF, a subsidiary or a respective successor entity, as applicable, is reduced to below 50% as a result of such public offering or (B) LSF determines, in its sole and absolute discretion, that such public offering constitutes a monetization event for purposes of the LTIP; or |
93
Table of Contents
| • | LSF pays dividends or distributions (whether pursuant to a regular dividend, extraordinary dividend, non-dividend distribution, redemption, recapitalization, or otherwise) (a “cash distribution”). |
In turn, a vesting monetization event is any of the events described in the subsections above (i) that is not a cash distribution, or (ii) that is a cash distribution, provided that at the time of such event, the Cumulative Internal Rate of Return of the Company’s direct and indirect equity holders as of immediately prior to our initial public offering is at least 15% and, when combined with any prior monetization event, results in a return to such direct and indirect equity holders of the Company of at least their beginning equity value.
For purposes of the LTIP, a major transaction is LSF or the Company acquires, merges or is reorganized into or with another unrelated corporation, which corporation at the time of such transaction has a fair market value (as determined by the administrator of the LTIP in its sole discretion) equal to or greater than the beginning equity value under the LTIP.
Post-Acquisition Employment Arrangements
The Company has entered into new employment agreements with certain of the Company’s executives. The Company has entered into such an agreement with Isaac N. Preston and James Bachmann, effective as of January 1, 2014.
Outstanding Equity Awards at Fiscal Year End
The following table provides information regarding outstanding equity awards made to the NEOs under the applicable Lafarge equity incentive plans as of the end of the fiscal year ended December 31, 2013.
| Name and Principal |
Date of Grant |
Option Awards | Stock Awards | |||||||||||||||||||||||||||||||||||||
| Number
of Securities Underlying Unexercised Exercisable Options/ SARs (#) |
Number of Securities Underlying Unexercisable and Unexercised Options (#) |
Equity Incentive Plan Awards: Number of Securities Underlying Unexercised Unearned Options (#) |
Option/ SAR Exercise Price ($)(1) |
Option/ SAR Expiration Date |
Number of Shares or Units of Stock that Have Not Vested (#) |
Market Value of Shares or Units of Stock That Have not Vested ($) |
Equity Incentive Plan Awards: Number of Unearned Shares, Units or Other Rights that have Not Vested (#) |
Equity Incentive Plan Awards: Market or Payout Value of Unearned Shares, Units or Other Rights that have Not Vested ($) |
||||||||||||||||||||||||||||||||
| Isaac Preston |
6/15/2007 | (2) | 5,800 | $ | 147.43 | 6/15/2017 | ||||||||||||||||||||||||||||||||||
| Chief Executive |
4/18/2008 | (2) | 5,220 | $ | 134.47 | 4/18/2018 | ||||||||||||||||||||||||||||||||||
| Officer |
5/24/2006 | (3) | 4,628 | $ | 115.66 | 5/24/2016 | ||||||||||||||||||||||||||||||||||
| 6/15/2007 | (3) | 2,893 | $ | 151.75 | 6/15/2017 | |||||||||||||||||||||||||||||||||||
| 3/26/2008 | (3) | 2,893 | $ | 131.77 | 3/26/2018 | |||||||||||||||||||||||||||||||||||
| 3/25/2009 | (3) | 8,100 | $ | 42.11 | 3/25/2019 | |||||||||||||||||||||||||||||||||||
| 3/24/2010 | (3) | 3,500 | $ | 70.28 | 3/24/2020 | |||||||||||||||||||||||||||||||||||
| 3/15/2011 | (3) | 2,450 | $ | 60.97 | 3/15/2021 | |||||||||||||||||||||||||||||||||||
| 3/15/2012 | (3) | 1,800 | $ | 49.32 | 3/15/2022 | |||||||||||||||||||||||||||||||||||
| 3/24/2010 | (4) | 3,500 | $ | 70.28 | 3/24/2020 | |||||||||||||||||||||||||||||||||||
| 3/15/2011 | (4) | 3,150 | $ | 60.97 | 3/15/2021 | |||||||||||||||||||||||||||||||||||
| 3/15/2012 | (4) | 2,700 | $ | 49.32 | 3/15/2022 | |||||||||||||||||||||||||||||||||||
| 3/15/2011 | (5) | 224 | $ | 16,838 | ||||||||||||||||||||||||||||||||||||
| 3/15/2012 | (5) | 180 | $ | 13,530 | ||||||||||||||||||||||||||||||||||||
| 3/15/2011 | (6) | 336 | $ | 25,257 | ||||||||||||||||||||||||||||||||||||
| 3/15/2012 | (6) | 570 | $ | 42,846 | ||||||||||||||||||||||||||||||||||||
| 3/13/2013 | (6) | 1,800 | 135,303 | |||||||||||||||||||||||||||||||||||||
94
Table of Contents
| Name and Principal |
Date of Grant |
Option Awards | Stock Awards | |||||||||||||||||||||||||||||||||||||
| Number
of Securities Underlying Unexercised Exercisable Options/ SARs (#) |
Number of Securities Underlying Unexercisable and Unexercised Options (#) |
Equity Incentive Plan Awards: Number of Securities Underlying Unexercised Unearned Options (#) |
Option/ SAR Exercise Price ($)(1) |
Option/ SAR Expiration Date |
Number of Shares or Units of Stock that Have Not Vested (#) |
Market Value of Shares or Units of Stock That Have not Vested ($) |
Equity Incentive Plan Awards: Number of Unearned Shares, Units or Other Rights that have Not Vested (#) |
Equity Incentive Plan Awards: Market or Payout Value of Unearned Shares, Units or Other Rights that have Not Vested ($) |
||||||||||||||||||||||||||||||||
| Dennis Romps |
6/15/2007 | (2) | 1,160 | $ | 147.43 | 6/15/2017 | ||||||||||||||||||||||||||||||||||
| Former Chief |
4/18/2008 | (2) | 1,972 | $ | 134.47 | 4/18/2018 | ||||||||||||||||||||||||||||||||||
| Financial |
3/24/2010 | (3) | 720 | $ | 70.28 | 3/24/2020 | ||||||||||||||||||||||||||||||||||
| Officer |
3/24/2010 | (4) | 180 | $ | 70.28 | 3/24/2020 | ||||||||||||||||||||||||||||||||||
| 3/24/2010 | (5) | 100 | $ | 7,517 | ||||||||||||||||||||||||||||||||||||
| 3/15/2011 | (5) | 281 | $ | 21,122 | ||||||||||||||||||||||||||||||||||||
| 3/15/2012 | (5) | 206 | $ | 15,485 | ||||||||||||||||||||||||||||||||||||
| 3/24/2010 | (6) | 25 | $ | 1,879 | ||||||||||||||||||||||||||||||||||||
| 3/15/2011 | (6) | 94 | $ | 7,066 | ||||||||||||||||||||||||||||||||||||
| 3/15/2012 | (6) | 125 | $ | 9,396 | ||||||||||||||||||||||||||||||||||||
| 3/13/2013 | (6) | 370 | 27,812 | |||||||||||||||||||||||||||||||||||||
| Timothy Power |
6/15/2007 | (2) | 1,500 | $ | 170.57 | 6/15/2017 | ||||||||||||||||||||||||||||||||||
| SVP General |
4/18/2008 | (2) | 1,700 | $ | 155.56 | 4/18/2018 | ||||||||||||||||||||||||||||||||||
| Counsel |
3/24/2010 | (2) | 400 | $ | 70.28 | 3/24/2020 | ||||||||||||||||||||||||||||||||||
| 3/24/2010 | (4) | 100 | $ | 70.28 | 3/24/2020 | |||||||||||||||||||||||||||||||||||
| 3/24/2010 | (5) | 100 | $ | 7,517 | ||||||||||||||||||||||||||||||||||||
| 3/15/2011 | (5) | 187 | $ | 14,057 | ||||||||||||||||||||||||||||||||||||
| 3/15/2012 | (5) | 180 | $ | 13,530 | ||||||||||||||||||||||||||||||||||||
| 3/24/2010 | (6) | 25 | $ | 1,879 | ||||||||||||||||||||||||||||||||||||
| 3/15/2011 | (6) | 63 | $ | 4,736 | ||||||||||||||||||||||||||||||||||||
| 3/15/2012 | (6) | 56 | $ | 4,209 | ||||||||||||||||||||||||||||||||||||
| 3/13/2013 | (6) | 370 | 27,812 | |||||||||||||||||||||||||||||||||||||
| Stephen DeMay |
6/15/2007 | (2) | 1,450 | $ | 147.43 | 6/15/2017 | ||||||||||||||||||||||||||||||||||
| Former Vice |
4/18/2008 | (2) | 1,972 | $ | 134.47 | 4/18/2018 | ||||||||||||||||||||||||||||||||||
| President Sales |
3/24/2010 | (3) | 1,200 | $ | 70.28 | 3/24/2020 | ||||||||||||||||||||||||||||||||||
| 3/24/2010 | (4) | 300 | $ | 70.28 | 3/24/2020 | |||||||||||||||||||||||||||||||||||
| 3/24/2010 | (5) | 100 | $ | 7,517 | ||||||||||||||||||||||||||||||||||||
| 3/15/2011 | (5) | 375 | $ | 28,188 | ||||||||||||||||||||||||||||||||||||
| 3/15/2012 | (5) | 169 | $ | 12,703 | ||||||||||||||||||||||||||||||||||||
| 3/24/2010 | (6) | 25 | $ | 1,879 | ||||||||||||||||||||||||||||||||||||
| 3/15/2011 | (6) | 125 | $ | 9,396 | ||||||||||||||||||||||||||||||||||||
| 3/15/2012 | (6) | 112 | $ | 8,419 | ||||||||||||||||||||||||||||||||||||
| 3/13/2013 | (6) | 240 | 18,040 | |||||||||||||||||||||||||||||||||||||
| (1) | The exercise prices for these grants are expressed in Euros. For purposes of the table, the December 31, 2013 exchange rate of 1.37 has been applied to reflect the exercise prices in U.S. dollars. |
| (2) | The grant of stock appreciation rights vested on the fourth anniversary of the date of grant. |
| (3) | Subject to accelerated vesting under certain conditions, the time-based stock options vest(ed) on the fourth anniversary of the date of grant. |
| (4) | Subject to accelerated vesting under certain conditions, the stock options vest(ed) on the fourth anniversary of the date of grant, subject to the achievement of applicable performance conditions. |
| (5) | The grant of time-based restricted shares vests on the fourth anniversary of the date of grant. |
| (6) | The grant of performance shares vests on the fourth anniversary of the date of grant, subject to the achievement of applicable performance conditions. |
95
Table of Contents
Long Term Incentive Plan
As discussed above, LSF maintains, and is obligated for all payments with respect to, the LTIP. Under the LTIP, participants are granted pool units entitling them, subject to the terms of the LTIP, to a potential cash payout upon a monetization event. The total number of pool units authorized under the LTIP is 1,000,000, and the total number of pool units outstanding as of December 31, 2013 was 700,000. The LTIP was developed to reward the creation of long-term value through a monetization event, as described under “—Severance and Change in Control Arrangements,” and to motivate certain executive employees of the Company and its subsidiaries to put forth maximum efforts toward the continued growth, profitability and success of our company by providing incentives to such individuals through cash bonus payments. LSF’s board of directors or a designated committee of the board administers the LTIP and has total and exclusive responsibility to control, operate, manage and administer the LTIP in accordance with its terms. The vesting of awards, valuation of awards upon a monetization event, treatment of awards upon a termination of employment and other material terms of the LTIP are described above.
2014 Stock Incentive Plan
As further described below, we have adopted the 2014 Stock Incentive Plan, or the 2014 Plan. The purpose of the 2014 Plan is to promote and closely align the interests of our employees and non-employee directors and our stockholders by providing stock-based compensation and other performance-based compensation. The objectives of the 2014 Plan are to attract and retain the best available personnel for positions of substantial responsibility, to provide additional incentive to participants and to optimize the profitability and growth of our company through incentives that are consistent with our goals and that link the personal interests of participants to those of our stockholders. The 2014 Plan allows for the grant of stock options, both incentive stock options and “non-qualified” stock options; stock appreciation rights, or SARs, alone or in conjunction with other awards; restricted stock and restricted stock units, or RSUs; and incentive bonuses, which may be paid in cash or stock or a combination thereof.
The following description of the 2014 Plan is not intended to be complete and is qualified in its entirety by the complete text of the 2014 Plan, which has been previously filed with the SEC. Stockholders are urged to read the 2014 Plan in its entirety. Any capitalized terms which are used in this summary description but not defined here or elsewhere in this prospectus have the meanings assigned to them in the 2014 Plan.
Administration
The 2014 Plan is administered by the compensation and benefits committee of the board of directors, or in the absence of the compensation and benefits committee, the board of directors itself. The compensation and benefits committee has broad authority, subject to the provisions of the 2014 Plan, to administer and interpret the 2014 Plan. All decisions and actions of the compensation and benefits committee are final.
Stock Subject to 2014 Plan
The maximum number of shares that may be issued under the 2014 Plan is One Million Six Hundred Fifteen Thousand Two Hundred (1,615,200), subject to certain adjustments in the event of a change in the Company’s capitalization. Shares of common stock issued under the 2014 Plan may be either authorized and unissued shares or previously issued shares acquired by the Company. On termination or expiration of an unexercised option, SAR or other stock-based award under the 2014 Plan, in whole or in part, the number of shares of common stock subject to such award will again become available for grant under the 2014 Plan.
Stock Options
All stock options granted under the 2014 Plan are evidenced by a written agreement with the participant, which provides, among other things, whether the option is intended to be an incentive stock option or a non-qualified stock option, the number of shares subject to the option, the exercise price, exercisability (or vesting),
96
Table of Contents
the term of the option, which may not generally exceed ten years, and other terms and conditions. Subject to the express provisions of the 2014 Plan, options generally may be exercised over such period, in installments or otherwise, as the compensation and benefits committee may determine. The exercise price for any stock option granted may not generally be less than the fair market value of the common stock subject to that option on the grant date. The exercise price may be paid in cash or such other method as determined by the compensation and benefits committee, including an irrevocable commitment by a broker to pay over such amount from a sale of the shares issuable under an option, the delivery of previously owned shares and withholding of shares deliverable upon exercise. Other than in connection with a change in the Company’s capitalization, we will not, without stockholder approval, reduce the exercise price of a previously awarded option, and, at any time when the exercise price of a previously awarded option is above the fair market value of a share of common stock, we will not, without stockholder approval, cancel and re-grant or exchange such option for cash or a new award with a lower (or no) exercise price.
Stock Appreciation Rights
SARs may be granted alone or in conjunction with all or part of a stock option. Upon exercising a SAR, the participant is entitled to receive the amount by which the fair market value of the common stock at the time of exercise exceeds the exercise price of the SAR. This amount is payable in common stock, cash, or a combination of common stock and cash, at the compensation and benefits committee’s discretion.
Restricted Stock and RSUs
The compensation and benefits committee may award restricted stock and RSUs. Awards of restricted stock consist of shares of stock that are transferred to the participant subject to restrictions that may result in forfeiture if specified conditions are not satisfied. RSUs result in the transfer of shares of cash or stock to the participant only after specified conditions are satisfied. The compensation and benefits committee will determine the restrictions and conditions applicable to each award of restricted stock or RSUs, which may include performance vesting conditions.
Incentive Bonuses
Each incentive bonus will confer upon the participant the opportunity to earn a future payment tied to the level of achievement with respect to one or more performance criteria established for a specified performance period. The compensation and benefits committee will establish the performance criteria and level of achievement versus these criteria that will determine the threshold, target and maximum amount payable under an incentive bonus, which criteria may be based on financial performance and/or personal performance evaluations. Payment of the amount due under an incentive bonus may be made in cash or shares, as determined by the compensation and benefits committee.
Performance Criteria
The compensation and benefits committee may specify certain performance criteria which must be satisfied before stock options, SARs, restricted stock, RSUs, and incentive bonuses will be granted or will vest. The performance goals may vary from participant to participant, group to group, and period to period.
Transferability
Awards generally may not be sold, transferred for value, pledged, assigned, or otherwise alienated or hypothecated by a participant other than by will or the laws of descent and distribution, and each option or SAR may be exercisable only by the participant during his or her lifetime.
97
Table of Contents
Amendment and Termination
The board of directors has the right to amend, alter, suspend or terminate the 2014 Plan at any time, provided certain enumerated material amendments may not be made without stockholder approval. No amendment or alteration to the 2014 Plan or an award or award agreement will be made that would impair the rights of the holder, without such holder’s consent, however, no consent will be required if the compensation and benefits committee determines in its sole discretion and prior to the date of any change in control that such amendment or alteration either is required or advisable in order for us, the 2014 Plan or the award to satisfy any law or regulation or to meet the requirements of or avoid adverse financial accounting consequences under any accounting standard, or is not reasonably likely to significantly diminish the benefits provided under such award, or that any such diminishment has been adequately compensated. The 2014 Plan will automatically terminate, unless earlier terminated by the board of directors, 10 years after approval by the board of directors.
98
Table of Contents
PRINCIPAL AND SELLING STOCKHOLDERS
The following table presents information concerning the beneficial ownership of the shares of our common stock as of October 31, 2014 by (1) each person known to us to beneficially own more than 5% of the outstanding shares of our common stock, (2) the selling stockholder, (3) each of our directors and named executive officers and (4) all of our directors and executive officers as a group. The table also contains information about beneficial ownership, as adjusted, to reflect the sale of common stock in this offering assuming:
| • | 44,069,000 shares outstanding as of October 31, 2014; and |
| • | no exercise of the underwriters’ option to purchase additional shares of common stock. |
Beneficial ownership is determined under the rules of the SEC and generally includes voting or investment power over securities. Except in cases where community property laws apply or as indicated in the footnotes to this table, we believe that each stockholder identified in the table possesses sole voting and investment power over all shares of common stock shown as beneficially owned by the stockholder. Shares of common stock subject to options and warrants that are exercisable or exercisable within 60 days of October 31, 2014 are considered outstanding and beneficially owned by the person holding the options for the purpose of computing the percentage ownership of that person but are not treated as outstanding for the purpose of computing the percentage ownership of any other person. Unless indicated below, the address of each individual listed below is c/o Continental Building Products, Inc., 12950 Worldgate Drive, Suite 700, Herndon, Virginia 20170.
The selling stockholder may be deemed an underwriter in connection with this offering.
| Name of Beneficial Owner |
Shares of common stock beneficially owned prior to this offering |
Shares of common stock beneficially owned after this offering assuming no exercise of underwriters’ option |
Shares of common stock beneficially owned after this offering assuming full exercise of underwriters’ option |
|||||||||||||||||||||||||
| Shares of common stock |
Percentage of Total Outstanding Common Stock (%) |
Number of Shares Being Sold in this Offering |
Shares of common stock |
Percentage of Total Outstanding Common Stock (%) |
Shares of common stock |
Percentage of Total Outstanding Common Stock (%) |
||||||||||||||||||||||
| 5% Stockholder and Selling Stockholder |
||||||||||||||||||||||||||||
| LSF8 Gypsum Holdings, L.P.(1) |
30,539,250 | 69.3 | % | 8,050,000 | 23,539,250 | 53.4 | % | 22,489,250 | 51.0 | % | ||||||||||||||||||
| Named Executive Officers |
||||||||||||||||||||||||||||
| Isaac Preston(2) |
20,000 | (3) | * | — | — | — | — | — | ||||||||||||||||||||
| Dennis Romps |
5,000 | (3) | * | — | — | — | — | — | ||||||||||||||||||||
| Timothy Power |
5,500 | (3) | * | — | — | — | — | — | ||||||||||||||||||||
| Directors |
||||||||||||||||||||||||||||
| Bradley P. Boggess(4) |
— | — | — | — | — | — | — | |||||||||||||||||||||
| Edward Bosowski |
833 | (3) | * | — | — | — | — | — | ||||||||||||||||||||
| Samuel D. Loughlin(5) |
— | — | — | — | — | — | — | |||||||||||||||||||||
| Michael O. Moore |
833 | (3) | * | — | — | — | — | — | ||||||||||||||||||||
| Chadwick S. Suss |
— | — | — | — | — | — | — | |||||||||||||||||||||
| Jack Sweeny |
833 | (3) | * | |||||||||||||||||||||||||
| Kyle S. Volluz(6) |
— | — | — | — | — | — | — | |||||||||||||||||||||
| Grant Wilbeck(7) |
— | — | — | — | — | — | — | |||||||||||||||||||||
| All current directors and executive officers as a group (15 persons) |
47,499 | (3) | * | — | — | — | — | — | ||||||||||||||||||||
| * | Represents less than 1.0% of total outstanding common stock. |
| (1) | LSF8 Gypsum Holdings, L.P. directly owns 100% of our outstanding equity interests prior to this offering. LSF8 Gypsum Holdings, L.P., a Delaware limited partnership is controlled by LSF VIII International Finance, L.P., a Bermuda |
99
Table of Contents
| limited partnership, which is controlled by its general partner, Lone Star Partners VIII, L.P., a Bermuda limited partnership, which is controlled by its general partner Lone Star Management Co. VIII, Ltd., a Bermuda exempted limited company, which is controlled by its sole owner (shareholder) John P. Grayken. The address for all of these persons, other than LSF VIII International Finance, L.P., Lone Star Partners VIII, L.P., Lone Star Management Co. VIII, Ltd. and Mr. Grayken, is 2711 North Haskell Avenue, Suite 1700, Dallas, Texas 75204. The address for LSF VIII International Finance, L.P., Lone Star Partners VIII, L.P. and Lone Star Management Co. VIII, Ltd. is Washington Mall, Suite 304, Third Floor, 7 Reid Street, Hamilton HM 11, Bermuda. The address for Mr. Grayken is Pyrford Court, Pyrford Common Road, Woking, Surrey, GU22 8UB, England, United Kingdom. |
| (2) | Mr. Preston is also a Director. |
| (3) | Shares of restricted stock granted in connection with our initial public offering. |
| (4) | Mr. Boggess owns interests in entities which own indirect non-controlling interests in LSF8 Gypsum Holdings, L.P.’s parent company and therefore expressly disclaims any beneficial ownership of interests in LSF8 Gypsum Holdings, L.P. or our common stock owned by LSF8 Gypsum Holdings, L.P. |
| (5) | Mr. Loughlin owns interests in entities which own indirect non-controlling interests in LSF8 Gypsum Holdings, L.P.’s parent company and therefore expressly disclaims any beneficial ownership of interests in LSF8 Gypsum Holdings, L.P. or our common stock owned by LSF8 Gypsum Holdings, L.P. |
| (6) | Mr. Volluz owns interests in entities which own indirect non-controlling interests in LSF8 Gypsum Holdings, L.P.’s parent company and therefore expressly disclaims any beneficial ownership of interests in LSF8 Gypsum Holdings, L.P. or our common stock owned by LSF8 Gypsum Holdings, L.P. |
| (7) | Mr. Wilbeck owns interests in entities which own indirect non-controlling interests in LSF8 Gypsum Holdings, L.P.’s parent company and therefore expressly disclaims any beneficial ownership of interests in LSF8 Gypsum Holdings, L.P. or our common stock owned by LSF8 Gypsum Holdings, L.P. |
100
Table of Contents
CERTAIN RELATIONSHIPS AND RELATED PARTY TRANSACTIONS
Relationships with Lone Star and Affiliates
Asset Advisory Fees
Effective August 30, 2013, we entered into an Asset Advisory Agreement with Hudson Americas LLC and Lone Star Fund VIII (U.S.), L.P., both affiliates of our sole equityholder. Pursuant to the Asset Advisory Agreement, Hudson Americas provides us with certain oversight functions in connection with the management of our business and assets, including: (i) communicating and coordinating with our personnel and service providers; (ii) assisting and advising us in the pursuit of our strategic plan and managing our assets in furtherance of our strategic plan; and (iii) obtaining and maintaining all required licenses, permits, certificates, consents and other approvals with respect to our assets. In addition, Hudson Americas may, but is not required to, provide us with certain ancillary services, such as financial accounting and reporting, tax accounting, preparation and reporting, treasury, risk management, legal and compliance, record keeping and operating company oversight. Pursuant to the Asset Advisory Agreement, we pay Hudson Americas an amount equal to 110% of the actual costs of the manager and ancillary services or 110% of the hourly billing rates of the individual billing rates of the individuals performing such services, as applicable. The Asset Advisory Agreement is terminable by any party thereto upon 30 days’ notice from one party to the others for any reason or no reason.
As of December 31, 2013, we owed a total of $0.2 million under the Asset Advisory Agreement.
Upon the consummation of our initial public offering, in February 2014, we terminated the Asset Advisory Agreement for a one-time termination payment of $2.0 million.
General
Lone Star currently owns 69.3% of our outstanding equity interests. Upon completion of this offering, Lone Star will own 53.4% of our outstanding common stock (or 51.0% if the underwriters fully exercise their option to purchase additional shares).
For as long as Lone Star and its affiliates continue to beneficially own shares of common stock representing more than a majority of the voting power of our common stock, they will be able to direct the election of all of the members of our board of directors and exercise a controlling influence over our business and affairs, including any determinations with respect to mergers or other business combinations, the acquisition or disposition of assets, the incurrence of indebtedness, the issuance of any additional common stock or other equity securities, the repurchase or redemption of common stock and the payment of dividends. Similarly, Lone Star has the power to determine matters submitted to a vote of our stockholders without the consent of our other stockholders, has the power to prevent a change in our control and could take other actions that might be favorable to them.
Lone Star is not subject to any contractual obligations to retain its controlling interest, except that it has agreed, subject to certain exceptions, not to sell or otherwise dispose of any shares of common stock for a period of 90 days after the date of this prospectus without the prior written consent of the representatives. Except for this period, there can be no assurance as to the period of time during which Lone Star will maintain its beneficial ownership of our common stock following this offering. Following this period, Lone Star will have rights to cause us to register its shares as described under “—Registration Rights Agreement” below.
On December 2, 2013, we paid a distribution of $130 million to Lone Star from the increase in our borrowings under our First Lien Credit Agreement and Second Lien Credit Agreement.
Registration Rights Agreement
We entered into a registration rights agreement with Lone Star in connection with the consummation of our initial public offering. The terms of the registration rights agreement include provisions for demand registration
101
Table of Contents
rights and piggyback registration rights in favor of Lone Star. The registration rights agreement will not provide for the payment of any consideration by us to Lone Star if a registration statement for the resale of shares of common stock held by Lone Star is not declared effective or if the effectiveness is not maintained. The registration statement of which this prospectus forms a part was filed in connection with a demand for registration by Lone Star Fund under the registration rights agreement. Currently, 30,539,250 shares of our common stock are entitled to these registration rights. Following the consummation of this offering, 23,539,250 shares of common stock will be entitled to these registration rights, assuming no exercise of the underwriters’ option to purchase additional shares of common stock. However, the underwriting agreement and lock-up agreements prohibit us from filing any registration statement for the resale of shares of common stock held by Lone Star for a period of 90 days after the date of this prospectus without the prior consent of the representatives. Shares registered with the SEC pursuant to these registrations rights will be eligible for sale in the public markets, subject to the lock-up agreements described in “Underwriting.” See “Shares Eligible for Future Sale—Registration Rights Agreement.”
Director Indemnification Agreements
Our bylaws permit us to indemnify our executive officers and directors to the fullest extent permitted by law, subject to limited exceptions. We entered into indemnification agreements with each of our executive officers and directors that provide, in general, that we will indemnify them to the fullest extent permitted by law in connection with their service to us or on our behalf.
Review and Approval of Related Party Transactions
We have implemented a written policy pursuant to which our board of directors or the audit committee will review and approve transactions with our directors, officers and holders of more than 5% of our voting securities and their affiliates. Prior to approving any transaction with a related party, our board of directors or audit committee (in each case, composed of disinterested directors), as applicable, will consider the material facts as to the related party’s relationship with us or interest in the transaction. Related party transactions will not be approved unless the board of directors or the audit committee (in each case, composed of disinterested directors), as applicable, has approved of the transaction. We did not have a formal review and approval policy for related party transactions at the time of any transaction described above.
102
Table of Contents
The following is a summary of the material provisions of our capital stock, as well as other material terms of our certificate of incorporation and bylaws. This summary does not purport to be complete and is subject to and qualified by our certificate of incorporation and bylaws, copies of which are incorporated by reference as exhibits to the registration statement of which this prospectus is a part.
General
Our authorized capital stock consists of 190,000,000 shares of common stock, par value $0.001 per share, and 10,000,000 shares of preferred stock, par value $0.001 per share.
Common Stock
Our certificate of incorporation authorizes the issuance of up to 190,000,000 shares of common stock. All outstanding shares of common stock are validly issued, fully paid and nonassessable.
The holders of our common stock are entitled to one vote per share on all matters submitted to a vote of stockholders and our certificate of incorporation does not provide for cumulative voting in the election of directors. Subject to preferences that may be applicable to any outstanding series of preferred stock, the holders of our common stock will receive ratably any dividends declared by our board of directors out of funds legally available for the payment of dividends. In the event of our liquidation, dissolution or winding-up, the holders of our common stock are entitled to share ratably in all assets remaining after payment of or provision for any liabilities, subject to prior distribution rights of preferred stock, if any, then outstanding.
Preferred Stock
Our certificate of incorporation provides that our board of directors has the authority, without further action by the stockholders, to issue up to 10,000,000 shares of preferred stock. Our board of directors may issue preferred stock in one or more series and determine the rights, preferences, privileges, qualifications and restrictions granted to or imposed upon our preferred stock, including dividend rights, conversion rights, voting rights, rights and terms of redemption, liquidation preferences and sinking fund terms, any or all of which may be greater than the rights of our common stock. Issuances of preferred stock could adversely affect the voting power of holders of our common stock and reduce the likelihood that holders of our common stock will receive dividend payments and payments upon liquidation. Any issuance of preferred stock also could have the effect of decreasing the market price of our common stock and could delay, deter or prevent a change in control of our company. Our board of directors does not presently have any plans to issue shares of preferred stock.
Limitations on Directors’ Liability
Our governing documents limit the liability of, and provide for us to indemnify, our directors to the fullest extent permitted by the DGCL. The DGCL permits a corporation to limit or eliminate a director’s personal liability to the corporation or the holders of its capital stock for breach of fiduciary duty. This limitation is generally unavailable for acts or omissions by a director which (i) were not in good faith, (ii) were the result of intentional misconduct or a knowing violation of law, (iii) the director derived an improper personal benefit from (such as a financial profit or other advantage to which the director was not legally entitled) or (iv) breached the director’s duty of loyalty. The DGCL also prohibits limitations on director liability under Section 174 of the DGCL, which relates to certain unlawful dividend declarations and stock repurchases. The limitation of liability and indemnification provisions in our certificate of incorporation and bylaws may discourage stockholders from bringing a lawsuit against directors for breach of their fiduciary duty. These provisions may also have the effect of reducing the likelihood of derivative litigation against directors and officers, even though such an action, if successful, might otherwise benefit us and our stockholders. In addition, your investment may be adversely affected to the extent we pay the costs of settlement and damage awards against directors and officers pursuant to these indemnification provisions.
103
Table of Contents
We maintain insurance that insures our directors and officers against certain losses and which insures us against our obligations to indemnify the directors and officers. We have also entered into indemnification agreements with our directors and executive officers.
Forum Selection Clause
Our certificate of incorporation provides that, unless we consent in writing to the selection of an alternative forum, to the fullest extent permitted by law, the sole and exclusive forum for any stockholder (including any beneficial owner) to bring (i) any derivative action or proceeding brought on our behalf, (ii) any action asserting a claim of breach of a fiduciary duty owed by any of our directors, officers, or employees to us or to our stockholders, (iii) any action asserting a claim arising pursuant to any provision of the DGCL or our certificate of incorporation or bylaws, or (iv) any action asserting a claim governed by the internal affairs doctrine, will be a state court located within the State of Delaware (or, if no state court located within the State of Delaware has jurisdiction, the federal district court for the District of Delaware); in all cases subject to the court’s having personal jurisdiction over the indispensable parties named as defendants. Any person or entity purchasing or otherwise acquiring any interest in shares of our capital stock is deemed to have notice of and consented to the foregoing provisions. See “Risk Factors—Our certificate of incorporation includes a forum selection clause, which could limit our stockholders’ ability to obtain a favorable judicial forum for disputes with us.”
Provisions of Our Certificate of Incorporation and Bylaws and Delaware Law That May Have an Anti-Takeover Effect
Provisions of the DGCL and our certificate of incorporation and bylaws could make it more difficult to acquire us by means of a tender offer, a proxy contest or otherwise, or to remove incumbent officers and directors. These provisions, summarized below, are expected to discourage types of coercive takeover practices and inadequate takeover bids and to encourage persons seeking to acquire control of us to first negotiate with us. We believe that the benefits of increased protection of our potential ability to negotiate with the proponent of an unfriendly or unsolicited proposal to acquire or restructure us outweigh the disadvantages of discouraging takeover or acquisition proposals because, among other things, negotiation of these proposals could result in an improvement of their terms.
Delaware Anti-Takeover Statute
We are subject to Section 203 of the DGCL, an anti-takeover statute. In general, Section 203 prohibits a publicly held Delaware corporation from engaging in a “business combination” with an “interested stockholder” for a period of three years following the time the person became an interested stockholder, unless (with certain exceptions) the business combination or the transaction in which the person became an interested stockholder is approved in a prescribed manner. Generally, a “business combination” includes a merger, asset or stock sale, or other transaction resulting in a financial benefit to the interested stockholder. Generally, an “interested stockholder” is a person who, together with affiliates and associates, owns (or within three years prior to the determination of interested stockholder status, did own) 15% or more of a corporation’s voting stock. The existence of this provision would be expected to have an anti-takeover effect with respect to transactions not approved in advance by the board of directors, including discouraging attempts that might result in a premium over the market price for the shares of common stock held by stockholders.
Requirements for Advance Notification of Stockholder Meetings, Nominations and Proposals
Our bylaws provide that special meetings of the stockholders may be called only by or at the direction of the board of directors, the chairman of our board or the chief executive officer with the concurrence of a majority of the board of directors. Our bylaws prohibit the conduct of any business at a special meeting other than as specified in the notice for such meeting. These provisions may have the effect of deferring, delaying or discouraging hostile takeovers, or changes in control or management of our company.
104
Table of Contents
Our bylaws establish advance notice procedures with respect to stockholder proposals and the nomination of candidates for election as directors. In order for any matter to be “properly brought” before a meeting, a stockholder must comply with advance notice requirements and provide us with certain information. Our bylaws allow the presiding officer at a meeting of the stockholders to adopt rules and regulations for the conduct of meetings which may have the effect of precluding the conduct of certain business at a meeting if the rules and regulations are not followed. These provisions may also defer, delay or discourage a potential acquirer from conducting a solicitation of proxies to elect the acquirer’s own slate of directors or otherwise attempting to obtain control of our company.
Any amendment to our certificate of incorporation requires the affirmative vote of at least 66 2/3% of the voting power of all shares of our common stock then outstanding. Our certificate of incorporation provides that the board of directors is expressly authorized to adopt, amend or repeal our bylaws and that our stockholders may only amend our bylaws with the approval of at least 66 2/3% of the voting power of all shares of our common stock then outstanding.
No Cumulative Voting
The DGCL provides that stockholders are denied the right to cumulate votes in the election of directors unless our certificate of incorporation provides otherwise. Our certificate of incorporation does not provide for cumulative voting.
Classified Board of Directors
Our certificate of incorporation provides that our board of directors is divided into three classes of directors, with the classes to be as nearly equal in number as possible. The members of each class serve for a three-year term. The classification of directors has the effect of making it more difficult for stockholders to change the composition of our board of directors. Our certificate of incorporation provides that the number of directors will be fixed from time to time pursuant to a resolution adopted by the board of directors, but must consist of not less than three or more than 15 directors.
Removal of Directors
Our certificate of incorporation and bylaws provide that (i) prior to the date on which Lone Star and its affiliates cease to beneficially own, in aggregate, at least a majority of the voting power of all outstanding shares entitled to vote generally in the election of directors, directors may be removed with or without cause upon the affirmative vote of holders of at least a majority of the voting power of all the then outstanding shares of stock entitled to vote generally in the election of directors, voting together as a single class and (ii) on and after the date Lone Star and its affiliates cease to beneficially own, in aggregate, at least a majority of the voting power of all outstanding shares entitled to vote generally in the election of directors, directors may be removed only for cause and only upon the affirmative vote of holders of at least 66 2/3% of the voting power of all the then outstanding shares of stock entitled to vote generally in the election of directors, voting together as a single class. In addition, our certificate of incorporation and bylaws also provide that any newly created directorships and any vacancies on our board of directors will be filled only by the affirmative vote of the majority of remaining directors; provided that so long as affiliates of Lone Star own at least 50% of the total voting power of our capital stock, the positions can only be filled by our stockholders.
Stockholder Action by Written Consent
The DGCL permits any action required to be taken at any annual or special meeting of the stockholders may be taken without a meeting, without prior notice and without a vote if a consent or consents in writing, setting forth the action so taken, is signed by the holders of outstanding stock having not less than the minimum number of votes that would be necessary to authorize or take such action at a meeting at which all shares of stock entitled
105
Table of Contents
to vote thereon were present and voted, unless the certificate of incorporation provides otherwise. Our certificate of incorporation and bylaws preclude stockholder action by written consent after the date on which Lone Star and its affiliates cease to beneficially own, in the aggregate, at least a majority of the voting power of all outstanding shares of our stock entitled to vote generally in the election of directors.
Limitations on Liability and Indemnification of Officers and Directors
The DGCL authorizes corporations to limit or eliminate the personal liability of directors to corporations and their stockholders for monetary damages for breaches of directors’ fiduciary duties as directors. Our organizational documents include provisions that eliminate, to the extent allowable under the DGCL, the personal liability of directors or officers for monetary damages for actions taken as a director or officer, as the case may be. Our organizational documents also provide that we must indemnify and advance reasonable expenses to our directors and officers to the fullest extent authorized by the DGCL. We are also expressly authorized to carry directors’ and officers’ insurance for our directors, officers and certain employees for some liabilities.
The limitation of liability and indemnification provisions in our certificate of incorporation and bylaws may discourage stockholders from bringing a lawsuit against directors for breach of their fiduciary duty. These provisions may also have the effect of reducing the likelihood of derivative litigation against directors and officers, even though such an action, if successful, might otherwise benefit us and our stockholders. In addition, your investment may be adversely affected to the extent that, in a class action or direct suit, we pay the costs of settlement and damage awards against directors and officers pursuant to these indemnification provisions.
There is currently no pending material litigation or proceeding involving any of our directors, officers or employees for which indemnification is sought.
Authorized but Unissued Shares
Our authorized but unissued shares of common stock and preferred stock are available for future issuance without stockholder approval. The DGCL does not require stockholder approval for any issuance of authorized shares. However, the NYSE listing requirements require stockholder approval of certain issuances equal to or exceeding 20% of the then-outstanding voting power or the then-outstanding number of shares of common stock. No assurances can be given that our shares will remain so listed. We may use additional shares for a variety of corporate purposes, including future public offerings to raise additional capital, corporate acquisitions and employee benefit plans. As discussed above, our board of directors has the ability to issue preferred stock with voting rights or other preferences, without stockholder approval. The existence of authorized but unissued shares of common stock and preferred stock could render more difficult or discourage an attempt to obtain control of us by means of a proxy contest, tender offer, merger or otherwise.
Corporate Opportunities and Transactions with Lone Star
In recognition that principals, members, directors, managers, partners, stockholders, officers, employees and other representatives of Lone Star and its affiliates (other than us) and affiliated investment funds, referred to as the Lone Star entities, may serve as our directors or officers, and that the Lone Star entities may engage in similar activities or lines of business that we do, our certificate of incorporation provides for the allocation of certain corporate opportunities between us and the Lone Star entities. Specifically, none of the Lone Star entities or any principal, member, director, manager, partner, stockholder, officer, employee or other representative of the Lone Star entities has any duty to refrain from engaging directly or indirectly in the same or similar business activities or lines of business that we do. In the event that any Lone Star entity acquires knowledge of a potential transaction or matter which may be a corporate opportunity for itself and us, we will not have any expectancy in the corporate opportunity, and the Lone Star entity will not have any duty to communicate or offer the corporate opportunity to us and may pursue or acquire such corporate opportunity for itself or direct such opportunity to
106
Table of Contents
another person. In addition, if a director or officer of our company who is also a principal, member, director, manager, partner, stockholder, officer, employee or other representative of any Lone Star entity acquires knowledge of a potential transaction or matter which may be a corporate opportunity for us and a Lone Star entity, we will not have any expectancy in the corporate opportunity unless the corporate opportunity is expressly offered to the person solely in his or her capacity as a director or officer of our company.
In recognition that we may engage in material business transactions with the Lone Star entities, from which we are expected to benefit, our certificate of incorporation provides that any of our directors or officers who are also principals, members, directors, managers, partners, stockholders, officers, employees and other representatives of any Lone Star entity will have fully satisfied and fulfilled his or her fiduciary duty to us and our stockholders with respect to such transaction, if:
| • | the transaction was approved, after being made aware of the material facts of the relationship between each of us or one of our subsidiaries and the Lone Star entity and the material terms and facts of the transaction, by (1) an affirmative vote of a majority of the members of our board of directors who do not have a material financial interest in the transaction, known as disinterested persons, or (2) an affirmative vote of a majority of the members of a committee of our board of directors consisting of members who are disinterested persons; or |
| • | the transaction was fair to us at the time we entered into the transaction; or |
| • | the transaction was approved by an affirmative vote of the holders of a majority of shares of our common stock entitled to vote, excluding the Lone Star entities and any holder who has a material financial interest in the transaction. |
By becoming a stockholder in our company, you will be deemed to have received notice of and consented to these provisions of our certificate of incorporation.
Transfer Agent and Registrar
The Transfer Agent and Registrar for our common stock is Broadridge Corporate Issuer Solutions, Inc.
Listing
Our common stock is listed on the NYSE under the symbol “CBPX.”
107
Table of Contents
SHARES ELIGIBLE FOR FUTURE SALE
Our common stock has been traded on the NYSE under the symbol “CBPX” since February 5, 2014. Prior to that date, there was no public market for our common stock. As of October 31, 2014, we had an aggregate of 44,069,000 shares of common stock outstanding. Of the outstanding shares, the 7,000,000 shares sold in this offering (or 8,050,000 shares if the underwriters exercise their option to purchase additional shares in full) will be freely tradable without restriction or further registration under the Securities Act, except that any shares held by our affiliates, as that term is defined in Rule 144 of the Securities Act, may generally be sold only in compliance with the limitations described below. Any remaining outstanding shares of our common stock held by affiliates are also deemed restricted securities, as defined in Rule 144. We expect that Lone Star will continue to be considered an affiliate after this offering based on its expected share ownership (consisting of 23,539,250 shares owned by Lone Star assuming no exercise of the underwriters’ option to purchase additional shares). Certain other of our stockholders may also be considered affiliates at that time.
Lock-Up Agreements
We, our officers and directors and the selling stockholder, Lone Star, that will beneficially own 53.4% (or 51.0% if the underwriters’ option to purchase additional shares of common stock is exercised in full) of our outstanding shares of common stock immediately after this offering have entered into lock-up agreements in connection with this offering with the underwriters that will restrict the sale of shares of our common stock held by them for 90 days after the date of this prospectus, subject to certain exceptions. See “Underwriting” for a description of the lock-up agreements entered into in connection with this offering.
Sales of Restricted Securities
Other than the shares sold in this offering and in our initial public offering, all of the remaining shares of our common stock will be available for sale, subject to the lock-up agreements described above, after the date of this prospectus in registered sales or pursuant to Rule 144 or another exemption from registration. For the purpose of the volume, manner of sale and other limitations under Rule 144 applicable to affiliates described below, we expect that Lone Star will be considered an affiliate after this offering based on its expected share ownership (consisting of 23,539,250 shares owned by Lone Star assuming no exercise of the underwriters’ option to purchase additional shares).
Restricted shares may be sold in the public market only if registered or if they qualify for an exemption from registration including under Rule 144 or 701 promulgated under the Securities Act, each of which is summarized below.
In general, under Rule 144, a person who is not our affiliate and has not been our affiliate at any time during the preceding three months will be entitled to sell any shares of our common stock that such person has beneficially owned for at least six months, including the holding period of any prior owner other than one of our affiliates, without regard to the volume limitations summarized below. Sales of our common stock by any such person would be subject to the availability of current public information about us if the shares to be sold were beneficially owned by such person for less than one year.
In addition, under Rule 144, a person may sell shares of our common stock acquired from us, without regard to volume limitations or the availability of public information about us, if: (i) the person is not our affiliate and has not been our affiliate at any time during the preceding three months; and (ii) the person has beneficially owned the shares to be sold for at least one year, including the holding period of any prior owner other than one of our affiliates.
Our affiliates who have beneficially owned shares of our common stock for at least six months, including the holding period of any prior owner other than one of our affiliates, are entitled to sell within any three-month
108
Table of Contents
period a number of shares that does not exceed the greater of: (i) 1% of the number of shares of our common stock then-outstanding, which will equal approximately 440,690 shares; and (ii) the average weekly trading volume in our common stock on the NYSE during the four calendar weeks preceding the date of filing of a Notice of Proposed Sale of Securities Pursuant to Rule 144 with respect to the sale.
Sales under Rule 144 by our affiliates are also subject to manner of sale provisions and notice requirements and to the availability of current public information about us.
Rule 701 provides that the shares of common stock acquired upon the exercise of currently outstanding options or pursuant to other rights granted under our equity incentive plan may be resold by persons, other than our affiliates, subject only to the manner of sale provisions of Rule 144, and by our affiliates under Rule 144, without compliance with its one-year minimum holding period.
As a result of the provisions of Rules 144 and 701, additional shares will be available for sale in the public market upon the expiration or, if earlier, the waiver of the lock-up period provided for in the lock-up agreements, subject, in some cases, to volume limitations.
Additional Registration Statements
In addition, 1,615,200 shares of common stock may be granted under our stock incentive plan. See “Executive Compensation—2014 Stock Incentive Plan.” We have filed a registration statement on Form S-8 under the Securities Act registering these shares of our common stock reserved for issuance under our equity incentive plans, which was effective upon filing. Shares covered by this registration statement will be eligible for sale in the public market, subject to any limitations on exercise under our equity incentive plan, the lock-up agreements described in “Underwriting” and Rule 144 limitations applicable to affiliates.
Registration Rights Agreement
We have entered into a registration rights agreement with Lone Star. The terms of the registration rights agreement include provisions for demand registration rights and piggyback registration rights in favor of Lone Star. The registration rights agreement does not provide for the payment of any consideration by us to Lone Star if a registration statement for the resale of shares of common stock held by Lone Star is not declared effective or if the effectiveness is not maintained. The registration statement of which this prospectus forms a part was filed in connection with a demand for registration by Lone Star under the registration rights agreement. Currently, 30,539,250 shares of our common stock are entitled to these registration rights. Following the consummation of this offering, 23,539,250 shares of our common stock will be entitled to these registration rights assuming no exercise of the underwriters’ option to purchase additional shares of common stock. Shares registered with the SEC pursuant to these registration rights will be eligible for sale in the public markets upon effectiveness of the registration statement covering those shares. However, the underwriting agreement and lock-up agreements prohibit us from filing any registration statement for the resale of shares of common stock held by Lone Star for a period of 90 days after the date of this prospectus without the prior consent of the representatives. By exercising its registration rights and causing a large number of shares to be registered and sold in the public market, Lone Star could cause the price of the common stock to fall. In addition, any demand to include these shares in our registration statements could have a material adverse effect on our ability to raise needed capital. See “Certain Relationships and Related Party Transactions—Registration Rights Agreement.” We must pay all expenses, except for underwriters’ discounts and commissions, incurred in connection with the exercise of these demand registration rights.
Lone Star also has piggyback registration rights under the terms of the registration rights agreement. The registration rights agreement provides that Lone Star has the right to include its shares in any registration that we effect under the Securities Act, other than a registration effected pursuant to an exercise of demand registration rights, subject to specified exceptions. We must pay all expenses, except for underwriters’ discounts and commissions, incurred in connection with these piggyback registration rights.
109
Table of Contents
Effects of Sales of Shares
No predictions can be made as to the effect, if any, that sales of shares of our common stock from time to time, or the availability of shares of our common stock for future sale, may have on the market price for shares of our common stock. Sales of substantial amounts of common stock, or the perception that such sales could occur, could adversely affect prevailing market prices for our common stock and could impair our future ability to obtain capital through an offering of equity securities.
110
Table of Contents
MATERIAL U.S. FEDERAL TAX CONSIDERATIONS FOR NON-U.S. HOLDERS
The following is a general discussion of material U.S. federal income and estate tax consequences of the acquisition, ownership, and disposition of our common stock purchased pursuant to this offering by a non-U.S. holder. As used in this prospectus, the term “non-U.S. holder” means a beneficial owner of 5% or less of our common stock that, for U.S. federal income tax purposes, is an individual, corporation, estate or trust and is none of the following:
| • | an individual who is a citizen or resident of the United States; |
| • | a corporation (including any entity treated as a corporation for U.S. federal income tax purposes) created or organized in the United States or under the laws of the United States or any state thereof (including the District of Columbia); |
| • | an estate the income of which is subject to U.S. federal income taxation regardless of its source; |
| • | a trust (i) whose administration is subject to the primary supervision of a U.S. court and which has one or more U.S. persons who have the authority to control all substantial decisions of the trust, or (ii) that has a valid election in effect under applicable U.S. Treasury regulations to be treated as a U.S. person; or |
| • | a partnership (or other entity or arrangement treated as a partnership for U.S. federal income tax purposes). |
An individual who is not a citizen of the United States may, subject to certain restrictions and limitations contained in any applicable income tax treaties, be deemed to be a resident of the United States by reason of being present in the United States for at least 31 days in the calendar year and an aggregate of at least 183 days during a three year period ending in the current calendar year (counting for such purposes all of the days present in the current year, one-third of the days present in the immediate preceding calendar year and one sixth of the days present in the second preceding calendar year). U.S. residents are generally taxed for U.S. federal income tax purposes in the same manner as U.S. citizens.
This discussion assumes that you will hold our common stock purchased pursuant to this offering as a capital asset within the meaning of the Internal Revenue Code of 1986, as amended, or the Code (i.e., generally, property held for investment). This discussion does not address all aspects of U.S. federal taxation that may be relevant to a particular non-U.S. holder in light of the holder’s individual investment or tax circumstances, or to non-U.S. holders that are subject to special tax rules. In addition, this description of U.S. tax consequences does not address:
| • | U.S. state and local or non-U.S. tax consequences; |
| • | U.S. federal gift tax consequences; |
| • | the U.S. net investment income tax that is imposed in addition to other U.S. income taxes (the Unearned Income Medicare Contribution); |
| • | specific facts and circumstances that may be relevant to a particular non-U.S. holder’s tax position; |
| • | the tax consequences for the stockholders, partners or beneficiaries of a non-U.S. holder; |
| • | special tax rules that may apply to some non-U.S. holders, including without limitation, banks, insurance companies, financial institutions, hybrid entities, broker-dealers, tax-exempt entities, controlled foreign corporations, passive foreign investment companies or U.S. expatriates; or |
| • | special tax rules that may apply to a non-U.S. holder that holds our common stock as part of a straddle, hedge or conversion transaction or other integrated investment. |
If a partnership (or other entity or arrangement treated as a partnership for U.S. federal income tax purposes) is a beneficial owner of our common stock, the treatment of a partner in the partnership generally will depend
111
Table of Contents
upon the status of the partner and the activities of the partnership. A beneficial owner of our common stock that is a partnership and partners in such a partnership should consult their tax advisors regarding the U.S. federal income tax consequences of acquiring, owning, and disposing of our common stock.
This discussion is based on current provisions of the Code, final, temporary and proposed U.S. Treasury regulations, judicial opinions, published positions of the U.S. Internal Revenue Service, or IRS, and other applicable authorities, all as in effect on the date hereof and all of which are subject to differing interpretations or change, possibly with retroactive effect. We have not sought, and will not seek, any ruling from the IRS or any opinion of counsel with respect to the tax consequences discussed herein, and there can be no assurance that the IRS will not take a position contrary to the tax consequences discussed below or that any position taken by the IRS would not be sustained.
We urge you to consult your tax advisor regarding the U.S. federal tax consequences of acquiring, owning and disposing of our common stock, as well as any tax consequences that may arise under the laws of any foreign, state, local or other taxing jurisdiction or under any applicable tax treaty.
Dividends
We have no present intention to pay dividends on our common stock. However, if distributions of cash or property (other than certain distributions of stock) are made to non-U.S. holders on shares of our common stock, such distributions generally will constitute dividends for U.S. federal income tax purposes to the extent paid from our current or accumulated earnings and profits, as determined under U.S. federal income tax principles. Distributions in excess of earnings and profits will constitute a return of capital that is applied against and reduces the non-U.S. holder’s adjusted tax basis in our common stock. Any remaining excess will be treated as gain realized on the sale or other disposition of the common stock and will be treated as described under “—Gain on Sale, Exchange or Other Taxable Disposition of Common Stock” below.
Dividends paid to a non-U.S. holder that are not effectively connected with the non-U.S. holder’s conduct of a trade or business in the United States generally will be subject to withholding of U.S. federal income tax at the rate of 30% or such lower rate as may be specified by an applicable income tax treaty. Non-U.S. holders should consult their tax advisors regarding their entitlement to benefits under an applicable income tax treaty and the requirements for and manner of claiming the benefits of such treaty (including, without limitation, the need to obtain a U.S. taxpayer identification number).
If (i) the non-U.S. holder is engaged in a trade or business in the United States, either directly or through an entity treated as a partnership for U.S. tax purposes, and (ii) the dividends are effectively connected with the conduct of such trade or business, and, if provided by an applicable income tax treaty, are dividends attributable to a permanent establishment or fixed base maintained by the non-U.S. holder in the United States, then the dividends are not subject to the U.S. withholding tax (provided the non-U.S. holder complies with certain certification and disclosure requirements), but instead are subject to U.S. federal income tax on a net income basis at applicable graduated U.S. federal income tax rates and in the manner applicable to U.S. persons. Any effectively connected dividends or dividends attributable to a permanent establishment received by a non-U.S. holder that is treated as a foreign corporation for U.S. tax purposes may be subject to an additional “branch profits tax” at a 30% rate, or such lower rate as may be specified by an applicable income tax treaty.
To claim the benefit of a tax treaty or an exemption from withholding because dividends are effectively connected with the conduct of a trade or business in the United States, a non-U.S. holder generally must provide to the withholding agent a properly executed IRS Form W-8BEN or W-8BEN-E, as applicable, (or successor form) for treaty benefits or IRS Form W-8ECI (or successor form) for effectively connected income, before the payment of dividends, and, if claiming the benefit of a tax treaty, generally must certify under penalties of perjury on the appropriate form that such non-U.S. holder is not a U.S. person and is eligible for treaty benefits.
112
Table of Contents
These forms may need to be periodically updated. Non-U.S. holders may obtain a refund of any excess amounts withheld by timely filing an appropriate claim for refund with the IRS, along with the required information. However,
| • | in the case of common stock held by a foreign partnership, the certification requirement generally will be applied to the partners of the partnership and the partnership will be required to provide certain information; |
| • | in the case of common stock held by a foreign trust, the certification requirement generally will be applied to the trust or the beneficial owners of the trust depending on whether the trust is a “foreign complex trust,” “foreign simple trust,” or “foreign grantor trust” as defined in the U.S. Treasury regulations; and |
| • | look-through rules will generally apply to tiered partnerships, foreign simple trusts and foreign grantor trusts. |
A non-U.S. holder that is a foreign partnership or a foreign trust is urged to consult its own tax advisor regarding its status under U.S. tax law and the certification requirements applicable to it.
Gain on Sale, Exchange or Other Taxable Disposition of Common Stock
A non-U.S. holder generally will not be subject to U.S. federal income tax or withholding tax on gain recognized on a sale, exchange or other taxable disposition of our common stock unless any one of the following applies:
| 1. | The non-U.S. holder is a nonresident alien individual who is present in the United States for 183 days or more in the taxable year of the sale, exchange or other taxable disposition and certain other requirements are met; |
| 2. | The gain is effectively connected with the non-U.S. holder’s conduct of a trade or business in the United States, directly or through an entity treated as a partnership for U.S. tax purposes and, if an applicable tax treaty requires, attributable to a U.S. permanent establishment or fixed base of such non-U.S. holder; or |
| 3. | We are or have been, at any time during the five-year period preceding such disposition (or the non-U.S. holder’s holding period, if shorter) a “United States real property holding corporation,” within the meaning of Section 897(c)(2) of the Code, unless our common stock is regularly traded on an established securities market and the non-U.S. holder holds no more than 5% of our outstanding common stock, directly or indirectly, during the relevant period. Generally, a United States corporation is treated as a United States real property holding corporation within the meaning of Section 897(c)(2) of the Code if the fair market value of its United States real property interests equals or exceeds 50% of the sum of the fair market value of its worldwide real property interests plus its other assets used or held for use in a trade or business. |
We believe that we have not been and are not currently a United States real property holding corporation, and we do not expect to become a United States real property holding corporation. However, no assurances can be made in this regard. Furthermore, no assurances can be provided that our stock will be considered to be regularly traded on an established securities market for this purpose.
Non-U.S. holders described in clause (1) above are taxed on their gains (including gains from sales of our common stock and net of applicable U.S. losses from sales or exchanges of other capital assets incurred during the year) at a flat rate of 30% or such lower rate as may be specified by an applicable income tax treaty. Non-U.S. holders described in clause (2) or (3) above will be subject to tax on the net gain derived from the sale at applicable graduated U.S. federal income tax rates and in the manner applicable to U.S. persons, unless an applicable income tax treaty provides otherwise. If a non-U.S. holder described in clause (2) is a corporation, it
113
Table of Contents
may be subject to the additional branch profits tax at a rate equal to 30% of its effectively connected earnings and profits or at such lower rate as may be specified by an applicable income tax treaty. In addition, if we are determined to be a United States real property holding corporation and our common stock is not regularly traded on an established securities market, then a purchaser may be required to withhold 10% of the proceeds payable to a non-U.S. holder from a sale or other taxable disposition of our common stock.
U.S. Federal Estate Taxes
Our common stock beneficially owned or treated as beneficially owned by an individual who at the time of death is not a citizen or resident of the United States (as specifically defined for U.S. federal estate tax purposes), and certain lifetime transfers of an interest in common stock made by such an individual, will be included in his or her gross estate for U.S. federal estate tax purposes and, therefore, may be subject to U.S. federal estate tax, unless an applicable estate tax treaty provides otherwise.
Additional Withholding Requirements With Respect to Common Stock Held by or Through Foreign Entities
Under Sections 1471 through 1474 of the Code and the Treasury regulations and administrative guidance issued thereunder (commonly referred to as “FATCA”), a 30% U.S. federal withholding tax is imposed on dividends on stock of U.S. corporations, and on the gross proceeds from the disposition of such stock (if such disposition occurs after December 31, 2016), paid to a “foreign financial institution” (as specially defined for this purpose), unless such institution enters into an agreement with the U.S. Treasury to withhold on certain payments and to collect and provide to the U.S. Treasury substantial information regarding its U.S. account holders and certain account holders that are foreign entities with U.S. owners or such institution otherwise qualifies for an exemption from these rules (including pursuant to an “intergovernmental agreement” between the United States and the applicable foreign country). A 30% U.S. federal withholding tax also applies to dividends on stock of U.S. corporations and the gross proceeds from the disposition of such stock (if such disposition occurs after December 31, 2016) paid to a “non-financial foreign entity” (as specially defined for this purpose), unless such entity provides the withholding agent with a certification that it does not have any “substantial United States owners” (as specially defined for this purpose) or a certification identifying the direct and indirect substantial United States owners of the entity, or such non-financial foreign entity otherwise qualifies for an exemption from these rules. Under certain circumstances, a non-U.S. holder may be eligible for refunds or credits of such withholding taxes. Investors are urged to consult with their own tax advisors regarding the application of these rules to their investment in our common stock.
Information Reporting and Backup Withholding
Under U.S. Treasury regulations, we must report annually to the IRS and to each non-U.S. holder the amount of dividends paid to such non-U.S. holder and the tax withheld with respect to those dividends. These information reporting requirements apply even if withholding was not required because the dividends were effectively connected to the conduct of the non-U.S. holder’s trade or business within the United States or withholding was reduced or eliminated by an applicable tax treaty. Copies of the information returns reporting those dividends and withholding may also be made available to the tax authorities in the country in which the non-U.S. holder is a resident under the provisions of an applicable income tax treaty or agreement.
The gross amount of dividends paid to a non-U.S. holder that fails to certify its non-U.S. holder status in accordance with applicable U.S. Treasury regulations and fails to otherwise establish an exemption generally will be reduced by backup withholding at the applicable rate (currently 28%).
A non-U.S. holder is generally required to certify its non-U.S. status under penalties of perjury or otherwise establish an exemption in order to avoid information reporting and backup withholding on disposition proceeds where the transaction is effected by or through a U.S. office of a broker.
114
Table of Contents
U.S. information reporting and backup withholding generally will not apply to a payment of proceeds from a disposition of common stock where the transaction is effected outside the United States through a non-U.S. office of a non-U.S. broker. However, information reporting requirements, but generally not backup withholding, generally will apply to such a payment if the broker is (i) a U.S. person; (ii) a foreign person that derives 50% or more of its gross income for certain periods from the conduct of a trade or business in the United States; (iii) a controlled foreign corporation as defined in the Code; (iv) a foreign partnership with certain U.S. connections; or (v) a U.S. branch of a foreign bank or foreign insurance company or a “territory financial institution” (as specially defined) in each case meeting certain requirements, unless the broker has documentary evidence in its records that the holder is a non-U.S. holder and certain conditions are met or the holder otherwise establishes an exemption.
Backup withholding is not an additional tax. Amounts withheld under the backup withholding rules may be credited against the non-U.S. holder’s U.S. federal income tax liability, if any, and may entitle such non-U.S. holder to a refund, provided that certain required information is furnished to the IRS in a timely manner. Non-U.S. holders should consult their own tax advisors regarding the application of backup withholding in their particular circumstance and the availability of and procedure for obtaining an exemption from backup withholding under current U.S. Treasury regulations.
The foregoing discussion is only a summary of certain material U.S. federal income and estate tax consequences of the acquisition, ownership and disposition of our common stock by non-U.S. holders. You are urged to consult your own tax advisor with respect to the particular tax consequences to you of the acquisition, ownership and disposition of our common stock, including the effect of any U.S., state, local, non-U.S. or other tax laws and any applicable income or estate tax treaty.
115
Table of Contents
Citigroup Global Markets Inc., Credit Suisse Securities (USA) LLC, RBC Capital Markets, LLC, Barclays Capital Inc. and Deutsche Bank Securities Inc. are acting as joint book-running managers of the offering. Subject to the terms and conditions stated in the underwriting agreement dated the date of this prospectus, each underwriter named below has severally agreed to purchase, and the selling stockholder has agreed to sell to that underwriter, the number of shares set forth opposite the underwriter’s name.
| Underwriter |
Number of Shares | |||
| Citigroup Global Markets Inc. |
||||
| Credit Suisse Securities (USA) LLC |
||||
| RBC Capital Markets, LLC |
||||
| Barclays Capital Inc. |
||||
| Deutsche Bank Securities Inc. |
||||
|
|
|
|||
| Total |
7,000,000 | |||
|
|
|
|||
The underwriting agreement provides that the obligations of the underwriters to purchase the shares included in this offering are subject to approval of legal matters by counsel and to other conditions. The underwriters are obligated to purchase all the shares (other than those covered by the underwriters’ option to purchase additional shares described below) if they purchase any of the shares.
Shares sold by the underwriters to the public will initially be offered at the public offering price set forth on the cover of this prospectus. Any shares sold by the underwriters to securities dealers may be sold at a discount from the public offering price not to exceed $ per share. If all the shares are not sold at the initial offering price, the underwriters may change the offering price and the other selling terms.
If the underwriters sell more shares than the total number set forth in the table above, the selling stockholder has granted to the underwriters an option, exerciseable 30 days from the date of this prospectus, to purchase up to 1,050,000 additional shares at the public offering price less the underwriting discount. To the extent the option is exercised, each underwriter must purchase a number of additional shares approximately proportionate to that underwriter’s initial purchase commitment. Any shares sold under the option will be sold on the same terms and conditions as the other shares that are the subject of this offering.
We, our officers and directors, certain of our employees and the selling stockholder have agreed that, for a period of 90 days from the date of this prospectus, we and they will not, without the prior written consent of Citigroup Global Markets Inc., Credit Suisse Securities (USA) LLC and RBC Capital Markets, LLC, dispose of or hedge any shares or any securities convertible into or exchangeable for our common stock. Citigroup Global Markets Inc., Credit Suisse Securities (USA) LLC and RBC Capital Markets, LLC, in their sole discretion, may release any of the securities subject to these lock-up agreements at any time without notice.
The shares are listed on the NYSE under the symbol “CBPX.”
We have agreed to pay expenses incurred by the selling stockholder in connection with the offering, other than the underwriting discounts and commissions. The following table shows the underwriting discounts and commissions the selling stockholder is to pay to the underwriters in connection with this offering. These amounts are shown assuming both no exercise and full exercise of the underwriters’ option to purchase additional shares.
| No Exercise | Full Exercise | |||||||
| Per share |
$ | $ | ||||||
| Total |
$ | $ | ||||||
116
Table of Contents
We have agreed to reimburse the underwriters for certain of their expenses in an amount up to $ .
In connection with the offering, the underwriters may purchase and sell shares in the open market. Purchases and sales in the open market may include short sales, purchases to cover short positions, which may include purchases pursuant to the underwriters’ option to purchase additional shares, and stabilizing purchases.
| • | Short sales involve secondary market sales by the underwriters of a greater number of shares than they are required to purchase in the offering. |
| • | “Covered” short sales are sales of shares in an amount up to the number of shares represented by the underwriters’ option to purchase additional shares. |
| • | “Naked” short sales are sales of shares in an amount in excess of the number of shares represented by the underwriters’ option to purchase additional shares. |
| • | Covering transactions involve purchases of shares either pursuant to the underwriters’ option to purchase additional shares or in the open market in order to cover short positions. |
| • | To close a naked short position, the underwriters must purchase shares in the open market. A naked short position is more likely to be created if the underwriters are concerned that there may be downward pressure on the price of the shares in the open market after pricing that could adversely affect investors who purchase in the offering. |
| • | To close a covered short position, the underwriters must purchase shares in the open market or must exercise the option to purchase additional shares. In determining the source of shares to close the covered short position, the underwriters will consider, among other things, the price of shares available for purchase in the open market as compared to the price at which they may purchase shares through the option to purchase additional shares. |
| • | Stabilizing transactions involve bids to purchase shares so long as the stabilizing bids do not exceed a specified maximum. |
Purchases to cover short positions and stabilizing purchases, as well as other purchases by the underwriters for their own accounts, may have the effect of preventing or retarding a decline in the market price of the shares. They may also cause the price of the shares to be higher than the price that would otherwise exist in the open market in the absence of these transactions. The underwriters may conduct these transactions on the NYSE, in the over-the-counter market or otherwise. If the underwriters commence any of these transactions, they may discontinue them at any time.
Conflicts of Interest
The underwriters are full service financial institutions engaged in various activities, which may include securities trading, commercial and investment banking, financial advisory, investment management, principal investment, hedging, financing and brokerage activities. The underwriters and their respective affiliates have in the past performed commercial banking, investment banking and advisory services for us from time to time for which they have received customary fees and reimbursement of expenses and may, from time to time, engage in transactions with and perform services for us in the ordinary course of their business for which they may receive customary fees and reimbursement of expenses. In the ordinary course of their various business activities, the underwriters and their respective affiliates may make or hold a broad array of investments and actively trade debt and equity securities (or related derivative securities) and financial instruments (which may include bank loans and/or credit default swaps) for their own account and for the accounts of their customers and may at any time hold long and short positions in such securities and instruments. Such investments and securities activities may involve our securities and/or instruments of ours or our affiliates.
In addition, certain of the underwriters or their affiliates are lenders under our First Lien Credit Agreement. Certain of the underwriters or their affiliates that have a lending relationship with us routinely hedge their credit
117
Table of Contents
exposure to us consistent with their customary risk management policies. A typical such hedging strategy would include these underwriters or their affiliates hedging such exposure by entering into transactions which consist of either the purchase of credit default swaps or the creation of short positions in our securities. The underwriters and their affiliates may also make investment recommendations and/or publish or express independent research views in respect of such securities or financial instruments and may hold, or recommend to clients that they acquire, long and/or short positions in such securities and instruments.
In addition, the selling stockholder may be deemed an underwriter in connection with this offering.
We and the selling stockholder have agreed to indemnify the underwriters against certain liabilities and expenses, including liabilities under the Securities Act, or to contribute to payments the underwriters may be required to make because of any of those liabilities.
Notice to Prospective Investors in the European Economic Area
In relation to each member state of the European Economic Area that has implemented the Prospectus Directive (each, a relevant member state), with effect from and including the date on which the Prospectus Directive is implemented in that relevant member state (the relevant implementation date), an offer of shares described in this prospectus may not be made to the public in that relevant member state other than:
| • | to any legal entity which is a qualified investor as defined in the Prospectus Directive; |
| • | to fewer than 100 or, if the relevant member state has implemented the relevant provision of the 2010 PD Amending Directive, 150 natural or legal persons (other than qualified investors as defined in the Prospectus Directive), as permitted under the Prospectus Directive, subject to obtaining the prior consent of the relevant Dealer or Dealers nominated by us for any such offer; or |
| • | in any other circumstances falling within Article 3(2) of the Prospectus Directive, |
provided that no such offer of shares shall require us or any underwriter to publish a prospectus pursuant to Article 3 of the Prospectus Directive.
For purposes of this provision, the expression an “offer of securities to the public” in any relevant member state means the communication in any form and by any means of sufficient information on the terms of the offer and the shares to be offered so as to enable an investor to decide to purchase or subscribe for the shares, as the expression may be varied in that member state by any measure implementing the Prospectus Directive in that member state, and the expression “Prospectus Directive” means Directive 2003/71/EC (and amendments thereto, including the 2010 PD Amending Directive, to the extent implemented in the relevant member state) and includes any relevant implementing measure in the relevant member state. The expression 2010 PD Amending Directive means Directive 2010/73/EU.
The sellers of the shares have not authorized and do not authorize the making of any offer of shares through any financial intermediary on their behalf, other than offers made by the underwriters with a view to the final placement of the shares as contemplated in this prospectus. Accordingly, no purchaser of the shares, other than the underwriters, is authorized to make any further offer of the shares on behalf of the sellers or the underwriters.
Notice to Prospective Investors in the United Kingdom
This prospectus is only being distributed to, and is only directed at, persons in the United Kingdom that are qualified investors within the meaning of Article 2(1)I of the Prospectus Directive that are also (i) investment professionals falling within Article 19(5) of the Financial Services and Markets Act 2000 (Financial Promotion) Order 2005 (the “Order”) or (ii) high net worth entities, and other persons to whom it may lawfully be communicated, falling within Article 49(2)(a) to (d) of the Order (each such person being referred to as a “relevant person”). This prospectus and its contents are confidential and should not be distributed, published or
118
Table of Contents
reproduced (in whole or in part) or disclosed by recipients to any other persons in the United Kingdom. Any person in the United Kingdom that is not a relevant person should not act or rely on this document or any of its contents.
Notice to Prospective Investors in France
Neither this prospectus nor any other offering material relating to the shares described in this prospectus has been submitted to the clearance procedures of the Autorité des Marchés Financiers or of the competent authority of another member state of the European Economic Area and notified to the Autorité des Marchés Financiers. The shares have not been offered or sold and will not be offered or sold, directly or indirectly, to the public in France. Neither this prospectus nor any other offering material relating to the shares has been or will be:
| • | released, issued, distributed or caused to be released, issued or distributed to the public in France; or |
| • | used in connection with any offer for subscription or sale of the shares to the public in France. |
Such offers, sales and distributions will be made in France only:
| • | to qualified investors (investisseurs qualifiés) and/or to a restricted circle of investors (cercle restreint d’investisseurs), in each case investing for their own account, all as defined in, and in accordance with articles L.411-2, D.411-1, D.411-2, D.734-1, D.744-1, D.754-1 and D.764-1 of the French Code monétaire et financier; |
| • | to investment services providers authorized to engage in portfolio management on behalf of third parties; or |
| • | in a transaction that, in accordance with article L.411-2-II-1°-or-2°-or 3° of the French Code monétaire et financier and article 211-2 of the General Regulations (Règlement Général) of the Autorité des Marchés Financiers, does not constitute a public offer (appel public à l’épargne). |
The shares may be resold directly or indirectly, only in compliance with articles L.411-1, L.411-2, L.412-1 and L.621-8 through L.621-8-3 of the French Code monétaire et financier.
Notice to Prospective Investors in Hong Kong
The shares may not be offered or sold in Hong Kong by means of any document other than (i) in circumstances which do not constitute an offer to the public within the meaning of the Companies Ordinance (Cap. 32, Laws of Hong Kong), or (ii) to “professional investors” within the meaning of the Securities and Futures Ordinance (Cap. 571, Laws of Hong Kong) and any rules made thereunder, or (iii) in other circumstances which do not result in the document being a “prospectus” within the meaning of the Companies Ordinance (Cap. 32, Laws of Hong Kong) and no advertisement, invitation or document relating to the shares may be issued or may be in the possession of any person for the purpose of issue (in each case whether in Hong Kong or elsewhere), which is directed at, or the contents of which are likely to be accessed or read by, the public in Hong Kong (except if permitted to do so under the laws of Hong Kong) other than with respect to shares which are or are intended to be disposed of only to persons outside Hong Kong or only to “professional investors” within the meaning of the Securities and Futures Ordinance (Cap. 571, Laws of Hong Kong) and any rules made thereunder.
Notice to Prospective Investors in Japan
The shares offered in this prospectus have not been and will not be registered under the Financial Instruments and Exchange Law of Japan. The shares have not been offered or sold and will not be offered or sold, directly or indirectly, in Japan or to or for the account of any resident of Japan (including any corporation or other entity organized under the laws of Japan), except (i) pursuant to an exemption from the registration requirements of the Financial Instruments and Exchange Law and (ii) in compliance with any other applicable requirements of Japanese law.
119
Table of Contents
Notice to Prospective Investors in Singapore
This prospectus has not been registered as a prospectus with the Monetary Authority of Singapore. Accordingly, this prospectus and any other document or material in connection with the offer or sale, or invitation for subscription or purchase, of the shares may not be circulated or distributed, nor may the shares be offered or sold, or be made the subject of an invitation for subscription or purchase, whether directly or indirectly, to persons in Singapore other than (i) to an institutional investor under Section 274 of the Securities and Futures Act, Chapter 289 of Singapore (the “SFA”), (ii) to a relevant person pursuant to Section 275(1), or any person pursuant to Section 275(1A), and in accordance with the conditions specified in Section 275 of the SFA or (iii) otherwise pursuant to, and in accordance with the conditions of, any other applicable provision of the SFA, in each case subject to compliance with conditions set forth in the SFA.
Where the shares are subscribed or purchased under Section 275 of the SFA by a relevant person which is:
| • | a corporation (which is not an accredited investor (as defined in Section 4A of the SFA)) the sole business of which is to hold investments and the entire share capital of which is owned by one or more individuals, each of whom is an accredited investor; or |
| • | a trust (where the trustee is not an accredited investor) whose sole purpose is to hold investments and each beneficiary of the trust is an individual who is an accredited investor, |
shares, debentures and units of shares and debentures of that corporation or the beneficiaries’ rights and interest (howsoever described) in that trust shall not be transferred within six months after that corporation or that trust has acquired the shares pursuant to an offer made under Section 275 of the SFA except:
| • | to an institutional investor (for corporations, under Section 274 of the SFA) or to a relevant person defined in Section 275(2) of the SFA, or to any person pursuant to an offer that is made on terms that such shares, debentures and units of shares and debentures of that corporation or such rights and interest in that trust are acquired at a consideration of not less than S$200,000 (or its equivalent in a foreign currency) for each transaction, whether such amount is to be paid for in cash or by exchange of securities or other assets, and further for corporations, in accordance with the conditions specified in Section 275 of the SFA; |
| • | where no consideration is or will be given for the transfer; or |
| • | where the transfer is by operation of law. |
Australia
No prospectus or other disclosure document (as defined in the Corporations Act 2001 (Cth) of Australia (“Corporations Act”)) in relation to the common stock has been or will be lodged with the Australian Securities & Investments Commission (“ASIC”). This document has not been lodged with ASIC and is only directed to certain categories of exempt persons. Accordingly, if you receive this document in Australia:
| (a) | you confirm and warrant that you are either: |
| (i) | a “sophisticated investor” under section 708(8)(a) or (b) of the Corporations Act; |
| (ii) | a “sophisticated investor” under section 708(8)I or (d) of the Corporations Act and that you have provided an accountant’s certificate to us which complies with the requirements of section 708(8)I(i) or (ii) of the Corporations Act and related regulations before the offer has been made; |
| (iii) | a person associated with the company under section 708(12) of the Corporations Act; or |
| (iv) | a “professional investor” within the meaning of section 708(11)(a) or (b) of the Corporations Act, and to the extent that you are unable to confirm or warrant that you are an exempt sophisticated investor, associated person or professional investor under the Corporations Act any offer made to you under this document is void and incapable of acceptance; and |
120
Table of Contents
| (b) | you warrant and agree that you will not offer any of the common stock for resale in Australia within 12 months of that common stock being issued unless any such resale offer is exempt from the requirement to issue a disclosure document under section 708 of the Corporations Act. |
121
Table of Contents
The validity of the shares of common stock offered hereby will be passed upon for us by Gibson, Dunn & Crutcher LLP. Certain legal matters in connection with the shares of common stock offered hereby will be passed upon for the underwriters by Baker Botts L.L.P.
The consolidated financial statements of Continental Building Products, Inc. at December 31, 2013 and for the period from July 26, 2013 to December 31, 2013 and the combined balance sheet of the gypsum division of Lafarge North America Inc. at December 31, 2012, and the related combined statements of operations, comprehensive income (loss), changes in net parent investment and cash flows for the period from January 1, 2013 to August 30, 2013 and for each of the two years in the period ended December 31, 2012, appearing in this Prospectus and Registration Statement have been audited by Ernst & Young LLP, independent registered public accounting firm, as set forth in their report thereon appearing elsewhere herein, and are included in reliance upon such report given on the authority of such firm as experts in accounting and auditing.
WHERE YOU CAN FIND ADDITIONAL INFORMATION
We have filed with the SEC a registration statement on Form S-1, including exhibits, of which this prospectus is a part, under the Securities Act with respect to the shares of common stock to be sold in this offering. This prospectus does not contain all of the information set forth in the registration statement and exhibits and schedules to the registration statement. For further information with respect to our company and the shares of common stock to be sold in this offering, reference is made to the registration statement, including the exhibits and schedules to the registration statement. Copies of the registration statement, including the exhibits and schedules to the registration statement, may be examined without charge at the public reference room of the SEC, 100 F Street, N.E., Washington, DC 20549. Information about the operation of the public reference room may be obtained by calling the SEC at 1-800-SEC-0330. Copies of all or a portion of the registration statement can be obtained from the public reference room of the SEC upon payment of prescribed fees. Our SEC filings, including our registration statement, are also available to you for free on the SEC’s website at www.sec.gov. We file annual, quarterly and current reports and other information with the SEC. You may inspect and copy these reports and other information at the public reference facilities maintained by the SEC at the address noted above. You may also obtain copies of these materials from the Public Reference Room of the SEC at the address noted above or inspect them without charge at the SEC’s website. We make available to our common stockholders annual reports containing consolidated financial statements audited by an independent registered public accounting firm.
122
Table of Contents
| Page # | ||||
| Audited Consolidated (Successor)/Combined (Predecessor) Financial Statements: |
||||
| F-2 | ||||
| Consolidated (Successor)/Combined (Predecessor) Statements of Operations |
F-3 | |||
| Consolidated (Successor)/Combined (Predecessor) Statements of Comprehensive Loss |
F-4 | |||
| Consolidated (Successor)/Combined (Predecessor) Balance Sheets |
F-5 | |||
| Consolidated (Successor)/Combined (Predecessor) Statements of Cash Flows |
F-6 | |||
| Consolidated (Successor)/Combined (Predecessor) Statements of Changes in Net Parent Investment |
F-7 | |||
| Notes to Consolidated (Successor)/Combined (Predecessor) Financial Statements |
F-8 | |||
| Unaudited Consolidated (Successor)/Combined (Predecessor) Financial Statements |
||||
| Consolidated (Successor)/Combined (Predecessor) Statements of Operations |
F-30 | |||
| Consolidated (Successor)/Combined (Predecessor) Statements of Comprehensive Income (Loss) |
F-31 | |||
| F-32 | ||||
| Consolidated (Successor)/Combined (Predecessor) Statements of Cash Flows |
F-33 | |||
| F-34 | ||||
F-1
Table of Contents
REPORT OF INDEPENDENT REGISTERED PUBLIC ACCOUNTING FIRM
The Board of Directors and Shareholders of Continental Building Products, Inc.
We have audited the accompanying consolidated balance sheet of Continental Building Products, Inc. (the Company) as of December 31, 2013, and the related consolidated statements of operations, comprehensive income (loss), changes in equity, and cash flows for the period from July 26, 2013 to December 31, 2013. We have also audited the accompanying combined balance sheet of the gypsum division of Lafarge North America Inc. (the “Predecessor”) as of December 31, 2012, and the related combined statements of operations, comprehensive income (loss), changes in net parent investment, and cash flows for the period from January 1, 2013 to August 30, 2013 and for each of the two years in the period ended December 31, 2012. These financial statements are the responsibility of the Company’s management. Our responsibility is to express an opinion on these financial statements based on our audits.
We conducted our audits in accordance with the standards of the Public Company Accounting Oversight Board (United States). Those standards require that we plan and perform the audit to obtain reasonable assurance about whether the financial statements are free of material misstatement. We were not engaged to perform an audit of the Company’s internal control over financial reporting. Our audits included consideration of internal control over financial reporting as a basis for designing audit procedures that are appropriate in the circumstances, but not for the purpose of expressing an opinion on the effectiveness of the Company’s internal control over financial reporting. Accordingly, we express no such opinion. An audit also includes examining, on a test basis, evidence supporting the amounts and disclosures in the financial statements, assessing the accounting principles used and significant estimates made by management, and evaluating the overall financial statement presentation. We believe that our audits provide a reasonable basis for our opinion.
In our opinion, the financial statements referred to above present fairly, in all material respects, the consolidated financial position of Continental Building Products, Inc. at December 31, 2013, and the consolidated results of its operations and its cash flows for the period from July 26, 2013 to December 31, 2013, in conformity with U.S. generally accepted accounting principles. Also, in our opinion, the Predecessor financial statements referred to above present fairly, in all material respects, the combined financial position of the Predecessor at December 31, 2012, and the combined results of their operations and cash flows for the period from January 1, 2013 to August 30, 2013 and the two years in the period ended December 31, 2012, in conformity with U.S. generally accepted accounting principles.
/s/ Ernst & Young LLP
McLean, VA
March 27, 2014
F-2
Table of Contents
CONTINENTAL BUILDING PRODUCTS, INC.
CONSOLIDATED (SUCCESSOR) / COMBINED (PREDECESSOR) STATEMENTS OF OPERATIONS
| Successor | Predecessor | |||||||||||||||||
| July 26
to December 31, 2013 |
January 1 to August 30, 2013 |
Year
Ended December 31, 2012 |
Year
Ended December 31, 2011 |
|||||||||||||||
| Net Sales |
150,066 | 252,248 | 311,410 | 252,111 | ||||||||||||||
| Costs, expenses and other income: |
||||||||||||||||||
| Cost of goods sold |
121,335 | 195,338 | 289,936 | 279,638 | ||||||||||||||
| Selling and administrative: |
||||||||||||||||||
| Direct |
14,953 | 19,338 | 27,194 | 23,844 | ||||||||||||||
| Allocated from Lafarge |
— | 4,945 | 7,037 | 9,745 | ||||||||||||||
|
|
|
|
|
|
|
|
|
|||||||||||
| Total selling and administrative |
14,953 | 24,283 | 34,231 | 33,589 | ||||||||||||||
|
|
|
|
|
|
|
|
|
|||||||||||
| Total costs and operating expenses |
136,288 | 219,621 | 324,167 | 313,227 | ||||||||||||||
| Operating income (loss) |
13,778 | 32,627 | (12,757 | ) | (61,116 | ) | ||||||||||||
| Other (expense) income, net |
(21 | ) | (191 | ) | (87 | ) | 303 | |||||||||||
| Interest expense, net |
(10,542 | ) | (91 | ) | (212 | ) | (273 | ) | ||||||||||
|
|
|
|
|
|
|
|
|
|||||||||||
| Income (loss) before earnings (losses) on equity method investment and income tax |
3,215 | 32,345 | (13,056 | ) | (61,086 | ) | ||||||||||||
| Earnings (losses) from equity method investment |
— | (30 | ) | (138 | ) | 228 | ||||||||||||
|
|
|
|
|
|
|
|
|
|||||||||||
| Income (loss) before income tax benefit |
3,215 | 32,315 | (13,194 | ) | (60,858 | ) | ||||||||||||
| Income tax (expense) benefit |
(1,110 | ) | (130 | ) | 352 | 316 | ||||||||||||
|
|
|
|
|
|
|
|
|
|||||||||||
| Net income (loss) |
2,105 | 32,185 | (12,842 | ) | (60,542 | ) | ||||||||||||
|
|
|
|
|
|
|
|
|
|||||||||||
| Net income per share, basic and diluted |
||||||||||||||||||
| Basic |
$ | 0.07 | ||||||||||||||||
| Diluted |
$ | 0.07 | ||||||||||||||||
| Weighted average shares outstanding |
||||||||||||||||||
| Basic |
32,304 | |||||||||||||||||
| Diluted |
32,304 | |||||||||||||||||
See accompanying notes to financial statements.
F-3
Table of Contents
CONTINENTAL BUILDING PRODUCTS, INC.
CONSOLIDATED (SUCCESSOR) / COMBINED (PREDECESSOR) STATEMENTS OF
COMPREHENSIVE INCOME (LOSS)
| Successor | Predecessor | |||||||||||||||||
| July 26, 2013 to December 31, 2013 |
January 1, 2013 to August 30, 2013 |
Year Ended |
Year Ended December 31, 2011 |
|||||||||||||||
| (in thousands) | ||||||||||||||||||
| Net (loss) income |
$ | 2,105 | $ | 32,185 | $ | (12,842 | ) | $ | (60,542 | ) | ||||||||
| Foreign currency translation adjustments |
(254 | ) | 2,707 | (1,197 | ) | 1,144 | ||||||||||||
|
|
|
|
|
|
|
|
|
|||||||||||
| Comprehensive income (loss) |
$ | 1,851 | $ | 34,892 | $ | (14,039 | ) | $ | (59,398 | ) | ||||||||
|
|
|
|
|
|
|
|
|
|||||||||||
See accompanying notes to financial statements.
F-4
Table of Contents
CONTINENTAL BUILDING PRODUCTS, INC.
CONSOLIDATED (SUCCESSOR) / COMBINED (PREDECESSOR) BALANCE SHEETS
| Successor | Predecessor | |||||||||
| December 31, 2013 |
December 31, 2012 |
|||||||||
| (in thousands) | ||||||||||
| Assets |
||||||||||
| Cash |
$ | 11,822 | $ | — | ||||||
| Receivables, net |
32,328 | 23,350 | ||||||||
| Inventories |
28,120 | 29,206 | ||||||||
| Prepaid expenses and other current assets |
4,523 | 1,026 | ||||||||
| Deferred taxes, current |
2,137 | — | ||||||||
|
|
|
|
|
|||||||
| Total current assets |
78,930 | 53,582 | ||||||||
| Property, plant and equipment, net |
383,625 | 386,270 | ||||||||
| Customer relationships and other intangibles, net |
126,126 | 3,829 | ||||||||
| Goodwill |
119,945 | 94,360 | ||||||||
| Equity Method Investment |
— | 18,276 | ||||||||
| Financial interest in Seven Hills |
13,000 | — | ||||||||
| Debt issuance costs |
17,800 | — | ||||||||
| Deferred taxes, non-current |
950 | — | ||||||||
| Other assets |
— | 429 | ||||||||
|
|
|
|
|
|||||||
| Total Assets |
$ | 740,376 | $ | 556,746 | ||||||
|
|
|
|
|
|||||||
| Liabilities and Equity |
||||||||||
| Accounts payable |
$ | 28,126 | $ | 30,168 | ||||||
| Accrued and other liabilities |
11,325 | 7,361 | ||||||||
| Notes payable, current portion |
4,150 | — | ||||||||
|
|
|
|
|
|||||||
| Total current liabilities |
43,601 | 37,529 | ||||||||
| Deferred taxes |
— | 6,145 | ||||||||
| Capital lease obligations |
— | 2,839 | ||||||||
| Notes payable, noncurrent portion |
559,924 | — | ||||||||
|
|
|
|
|
|||||||
| Total liabilities |
603,525 | 46,513 | ||||||||
|
|
|
|
|
|||||||
| Undesignated preferred stock, par value $0.001 per share; 10,000,000 shares authorized, no shares issued and outstanding at December 31, 2013 |
— | — | ||||||||
| Common stock, $0.001 par value per share; 190,000,000 shares authorized, 32,304,000 shares issued and outstanding at December 31, 2013 |
32 | — | ||||||||
| Additional paid-in capital |
134,968 | — | ||||||||
| Accumulated other comprehensive income (loss) |
(254 | ) | (5,560 | ) | ||||||
| Accumulated earnings |
2,105 | — | ||||||||
| Accumulated net contributions from parent |
— | 515,793 | ||||||||
|
|
|
|
|
|||||||
| Total equity (Successor) Total net parent investment (Predecessor) |
136,851 | 510,233 | ||||||||
|
|
|
|
|
|||||||
| Total Liabilities and Equity |
$ | 740,376 | $ | 556,746 | ||||||
|
|
|
|
|
|||||||
See accompanying notes to financial statements.
F-5
Table of Contents
CONTINENTAL BUILDING PRODUCTS, INC.
CONSOLIDATED (SUCCESSOR) / COMBINED (PREDECESSOR) STATEMENTS OF CASH FLOWS
| Successor | Predecessor | |||||||||||||||||
| July 26 to December 31, 2013 |
January 1 to August 30, 2013 |
Year
Ended December 31, 2012 |
Year
Ended December 31, 2011 |
|||||||||||||||
| Cash flows from operating activities: |
||||||||||||||||||
| Net income (loss) |
$ | 2,105 | $ | 32,185 | $ | (12,842 | ) | $ | (60,542 | ) | ||||||||
| Adjustments to reconcile net income (loss) to net cash provided by operating activities: |
||||||||||||||||||
| Depreciation and amortization |
18,529 | 16,886 | 36,331 | 28,054 | ||||||||||||||
| Amortization of debt issuance costs and debt discount |
808 | — | — | — | ||||||||||||||
| (Gain) loss on disposal of property, plant and equipment |
199 | 1,115 | 87 | (303 | ) | |||||||||||||
| (Gain) loss from equity method investment |
— | 30 | 138 | (228 | ) | |||||||||||||
| Deferred taxes |
(3,087 | ) | 182 | 190 | 416 | |||||||||||||
| Change in assets and liabilities: |
||||||||||||||||||
| Receivables |
(451 | ) | (8,655 | ) | (12,338 | ) | (5,038 | ) | ||||||||||
| Inventories |
8,268 | (5,827 | ) | (154 | ) | (675 | ) | |||||||||||
| Prepaid expenses and other current assets |
(2,509 | ) | (1,783 | ) | (133 | ) | 2,175 | |||||||||||
| Other long-term assets |
— | 429 | — | (4 | ) | |||||||||||||
| Accounts payable |
2,777 | (5,738 | ) | 5,396 | 1,459 | |||||||||||||
| Accrued and other liabilities |
10,718 | (3,996 | ) | (109 | ) | (2,096 | ) | |||||||||||
| Other long term liabilities |
— | (126 | ) | (168 | ) | (156 | ) | |||||||||||
|
|
|
|
|
|
|
|
|
|||||||||||
| Net cash provided by (used in) operating activities |
37,357 | 24,702 | 16,398 | (36,938 | ) | |||||||||||||
| Cash flows from investing activities: |
||||||||||||||||||
| Capital expenditures |
(2,798 | ) | (2,506 | ) | (5,205 | ) | (5,863 | ) | ||||||||||
| Acquisition of predecessor |
(703,141 | ) | — | — | — | |||||||||||||
| Software purchased or developed |
— | — | (27 | ) | (116 | ) | ||||||||||||
| Proceeds from the sale of property, plant, and equipment |
— | — | 21 | 1,202 | ||||||||||||||
| Capital contributions to equity method investment |
— | (66 | ) | (84 | ) | (49 | ) | |||||||||||
| Distributions from equity method investment |
— | 552 | 855 | 855 | ||||||||||||||
|
|
|
|
|
|
|
|
|
|||||||||||
| Net cash used in investing activities |
(705,939 | ) | (2,020 | ) | (4,440 | ) | (3,971 | ) | ||||||||||
| Cash flows from financing activities: |
||||||||||||||||||
| Capital contribution (distribution) from (to) Lafarge NA, net |
— | (22,682 | ) | (11,958 | ) | 40,909 | ||||||||||||
| Capital contribution from Lone Star Funds |
265,000 | — | — | — | ||||||||||||||
| Proceeds from issuance of long-term debt, net of original issue discount |
564,965 | — | — | — | ||||||||||||||
| Proceeds from revolving credit facility, net |
— | — | — | — | ||||||||||||||
| Return of capital to Lone Star Funds |
(130,000 | ) | ||||||||||||||||
| Principal payments on long-term debt |
(1,038 | ) | ||||||||||||||||
| Debt issuance costs |
(18,461 | ) | — | — | — | |||||||||||||
|
|
|
|
|
|
|
|
|
|||||||||||
| Net cash provided by (used in) financing activities |
680,466 | (22,682 | ) | (11,958 | ) | 40,909 | ||||||||||||
|
|
|
|
|
|
|
|
|
|||||||||||
| Effect of foreign exchange rates on cash and cash equivalents |
(62 | ) | — | — | — | |||||||||||||
| Net change in cash and cash equivalents |
11,822 | — | — | — | ||||||||||||||
| Cash, beginning of period |
— | — | — | — | ||||||||||||||
|
|
|
|
|
|
|
|
|
|||||||||||
| Cash, end of period |
$ | 11,822 | $ | — | $ | — | $ | — | ||||||||||
|
|
|
|
|
|
|
|
|
|||||||||||
See accompanying notes to financial statements.
F-6
Table of Contents
CONTINENTAL BUILDING PRODUCTS, INC.
CONSOLIDATED (SUCCESSOR)/ COMBINED (PREDECESSOR) STATEMENTS OF
CHANGES IN EQUITY/NET PARENT INVESTMENT
| Predecessor |
Accumulated Net Contributions from Parent |
Accumulated Other Comprehensive Income (Loss) |
Total Net Parent Investment |
|||||||||
| (in thousands) | ||||||||||||
| Balance at December 31, 2010 |
$ | 560,128 | $ | (5,507 | ) | $ | 554,621 | |||||
| Net loss |
(60,542 | ) | — | (60,542 | ) | |||||||
| Foreign currency translation adjustments |
— | 1,144 | 1,144 | |||||||||
| Net transfers from Parent |
39,702 | — | 39,702 | |||||||||
|
|
|
|
|
|
|
|||||||
| Balance at December 31, 2011 |
$ | 539,288 | $ | (4,363 | ) | $ | 534,925 | |||||
| Net loss |
(12,842 | ) | — | (12,842 | ) | |||||||
| Foreign currency translation adjustments |
— | (1,197 | ) | (1,197 | ) | |||||||
| Net transfers to Parent |
(10,653 | ) | — | (10,653 | ) | |||||||
|
|
|
|
|
|
|
|||||||
| Balance at December 31, 2012 |
$ | 515,793 | $ | (5,560 | ) | $ | 510,233 | |||||
| Net transfers to Lafarge NA (parent) |
(21,846 | ) | — | (21,846 | ) | |||||||
| Net income |
32,185 | — | 32,185 | |||||||||
| Foreign currency translation adjustments |
— | 2,707 | 2,707 | |||||||||
|
|
|
|
|
|
|
|||||||
| Balance at August 30, 2013 |
$ | 526,132 | $ | (2,853 | ) | $ | 523,279 | |||||
|
|
|
|
|
|
|
|||||||
| Successor |
Common Stock |
Additional Paid-in Capital |
Accumulated Other Comprehensive Income (Loss) |
Accumulated Earnings |
Total Equity |
|||||||||||||||
| Balance at July 26, 2013 |
$ | — | $ | — | $ | — | $ | — | $ | — | ||||||||||
| Capital contribution from Lone Star Funds |
32 | 264,968 | — | — | 265,000 | |||||||||||||||
| Return of capital to Lone Star Funds |
— | (130,000 | ) | — | — | (130,000 | ) | |||||||||||||
| Net income |
— | — | 2,105 | 2,105 | ||||||||||||||||
| Foreign currency translation adjustments |
— | — | (254 | ) | — | (254 | ) | |||||||||||||
|
|
|
|
|
|
|
|
|
|
|
|||||||||||
| Balance at December 31, 2013 |
$ | 32 | $ | 134,968 | $ | (254 | ) | $ | 2,105 | $ | 136,851 | |||||||||
|
|
|
|
|
|
|
|
|
|
|
|||||||||||
See accompanying notes to financial statements.
F-7
Table of Contents
CONTINENTAL BUILDING PRODUCTS, INC.
CONSOLIDATED (SUCCESSOR) / COMBINED (PREDECESSOR)
NOTES TO THE FINANCIAL STATEMENTS
FOR THE PERIODS JULY 26, 2013 TO DECEMBER 31, 2013 (SUCCESSOR), JANUARY 1, 2013
TO AUGUST 30, 2013 (PREDECESSOR) AND YEARS ENDED DECEMBER 31, 2012 AND 2011 (PREDECESSOR)
1. Background and Nature of Operations
Description of Business
Continental Building Products, Inc. (prior to December 3, 2013 known as LSF8 Gypsum Holdings Company, LLC), (“CBP”, the “Company”, or the “Successor”) is a Delaware corporation and is a direct, wholly-owned subsidiary of LSF8 Gypsum Holdings Company, L.P., an affiliate of Lone Star Funds (“Lone Star”) and was formed on July 26, 2013. Prior to the acquisition of the gypsum division of Lafarge North America Inc. on August 30, 2013, further described below, CBP had no operating activity. The accompanying consolidated financial statements of CBP as of December 31, 2013 (the Successor) contain four month’s activity of the acquired business. The combined financial statements for the period from January 1, 2013 to August 30, 2013 and years ended December 31, 2012 and 2011 include the historical accounts of the gypsum division of Lafarge North America Inc. (the “Predecessor”).
The Company manufactures gypsum wallboard related products for commercial and residential buildings and houses. The Company operates a network of three highly efficient wallboard facilities, all located in the eastern United States and produces joint compound at one plant in the United States and at another plant in Canada.
The Acquisition
On June 24 2013, Lone Star entered into a definitive agreement with Lafarge North America Inc. to purchase the assets of its North American gypsum division for an aggregate purchase price of approximately $700 million (the “Acquisition”) in cash. The closing of the Acquisition occurred on August 30, 2013. In the accompanying financial information, Successor refers to the Company and CBP and Predecessor refers to the gypsum division of Lafarge North America Inc. prior to the Acquisition.
2. Significant Accounting Policies
Basis of Presentation—Successor
The accompanying consolidated financial statements for CBP have been prepared in accordance with accounting principles generally accepted in the United States (U.S. GAAP). The consolidated financial statements include the accounts of the Company and its wholly-owned subsidiaries. All intercompany transactions have been eliminated.
The Company’s financial statements reflect the Acquisition of the Predecessor that occurred on August 30, 2013, which was accounted for as a business combination. In connection with the Acquisition, $3.3 million in acquisition related costs were incurred, which are reported as selling and administrative costs in the accompanying statement of operations of the Successor for the period from July 26, 2013 to December 31, 2013.
F-8
Table of Contents
The following table summarizes the fair values of the assets acquired and liabilities assumed at the acquisition date.
| (in thousands) | ||||
| Total current assets |
$ | 70,371 | ||
| Property, plant and equipment |
392,809 | |||
| Financial interest in Seven Hills JV |
13,000 | |||
| Trademarks |
15,000 | |||
| Customer Relationships |
118,000 | |||
| Goodwill |
119,945 | |||
| Total current liabilities |
(25,984 | ) | ||
|
|
|
|||
| Total purchase price |
$ | 703,141 | ||
|
|
|
|||
The fair value of accounts receivables acquired is $31.9 million (included in total current assets above), with the gross contractual amount being $33.3 million. The Company expects $1.4 million to be uncollectible. The total purchase price has been revised from the previously provided September 30, 2013 interim financial statements to reflect an additional $3.1 million of consideration for working capital as required by the purchase agreement. The Company is in the process of finalizing third-party valuations of certain assets with the assistance of a third-party valuation firm; thus, the measurements of property, plant and equipment, financial interest in Seven Hills, intangibles, and goodwill are subject to change.
There were no loss contingencies identified as part of this business combination.
The goodwill recognized is attributable primarily to expected synergies and the assembled workforce of the Company. These come from the synergies that are obtained in operating the plants as part of a network, versus individually, and from an experienced employee base skilled at managing a process driven manufacturing environment. We expect the goodwill will be deductible for income tax purposes.
The following represents the unaudited pro forma income statement as if the Acquisition had occurred on January 1, 2012 (in thousands)
| Year ended December 31, 2013 |
Year ended December 31, 2012 |
|||||||
| Revenues |
$ | 402,314 | $ | 311,410 | ||||
| Net income (loss) |
$ | 4,895 | $ | (68,651 | ) | |||
These amounts have been calculated by adjusting the results to reflect the additional depreciation and amortization that would have been charged assuming the fair value adjustments to property, plant and equipment and intangible assets had been applied on January 1, 2012, and to reflect the interest expense on the debt used to finance the acquisition (see Note 13) net of proceeds received from the initial public offering.
Basis of Presentation—Predecessor
The accompanying combined financial statements for the Predecessor have been prepared in accordance with accounting principles generally accepted in the United States (U.S. GAAP).
The Predecessor financial statements have been derived from the consolidated financial statements and accounting records of Lafarge North America Inc. (“Lafarge N.A.”) using the historical results of operations and historical cost basis of the assets and liabilities of Lafarge N.A. that comprise the business acquired. These Predecessor financial statements have been prepared to demonstrate the historical results of operations, financial position, and cash flows for the indicated periods under Lafarge N.A.’s management that were acquired by CBP. All intercompany balances and transactions have been eliminated. Transactions and balances between the Predecessor and Lafarge N.A. and its subsidiaries are reflected as related party transactions within these financial statements.
F-9
Table of Contents
The accompanying Predecessor combined financial statements include the assets, liabilities, revenues and expenses that are specifically identifiable to the acquired business and reflect all costs of doing business related to their operations, including expenses incurred by other entities on the Predecessor’s behalf. In addition, certain costs related to the Predecessor have been allocated from Lafarge N.A. Those allocations are derived from multiple levels of the organization including shared corporate expenses from Lafarge N.A. and fees from Lafarge N.A.’s parent company related to certain service and support functions. The costs associated with these services and support functions (indirect costs) have been allocated to the Predecessor using the most meaningful respective allocation methodologies which were primarily based on proportionate revenue, proportionate headcount, or proportionate direct labor costs compared to Lafarge N.A. and/or its subsidiaries. These allocated costs are primarily related to corporate administrative expenses, employee-related costs including pensions and other benefits for corporate and shared employees, and rental and usage fees for shared assets for the following functional groups: information technology, legal services, accounting and finance services, human resources, marketing and contract support, customer support, treasury, facility and other corporate and infrastructural services. Income taxes have been accounted for in the Predecessor financial statements on a separate return basis as described in Note 9.
The Predecessor utilized Lafarge N.A.’s centralized processes and systems for cash management, payroll, and purchasing. As a result, all cash received by the Predecessor was deposited in and commingled with Lafarge N.A.’s general corporate funds and was not specifically allocated to the Predecessor. The net results of these cash transactions between the Predecessor and Lafarge N.A. are reflected within “Net parent investment” in the accompanying Combined Balance Sheet. In addition, the net parent investment represents Lafarge N.A.’s interest in the recorded net assets of the Predecessor and represents the cumulative net investment by Lafarge N.A. in the Predecessor through the dates presented, inclusive of cumulative operating results.
Management believes the assumptions and allocations underlying the Predecessor combined financial statements are reasonable and appropriate under the circumstances. The expenses and cost allocations have been determined on a basis considered by Lafarge N.A. to be a reasonable reflection of the utilization of services provided to or the benefit received by the Predecessor during the periods presented relative to the total costs incurred by Lafarge N.A. However, the amounts recorded for these transactions and allocations are not necessarily representative of the amount that would have been reflected in the financial statements had the Predecessor been an entity that operated independently of Lafarge N.A. Consequently, future results of operations after the Predecessor’s separation from Lafarge N.A. will include costs and expenses incurred by the Company that may be materially different than the Predecessor’s historical results of operations. Accordingly, the financial statements for these periods under the Predecessor are not indicative of the Company’s future results of operations, financial position and cash flows.
Earnings Per Share
Earnings per share for the Successor period are calculated after taking into account the 32,304 for one stock split that occurred on February 3, 2014. There were no dilutive securities outstanding, and therefore basic and diluted earnings per share are the same.
| July 26, 2013 to December 31, 2013 |
||||
| Net income (in thousands) |
$ | 2,105 | ||
| Weighted average number of common shares |
32,304,000 | |||
|
|
|
|||
| Net income per share (basic and diluted) |
$ | 0.07 | ||
Cost of Goods Sold and Selling and Administrative Expenses
Cost of goods sold includes costs of production, inbound freight charges for raw materials, outbound freight to customers, purchasing and receiving costs, inspection costs, warehousing at plant facilities, and internal transfer costs. Costs associated with third-party warehouses are included in selling and administrative expenses.
F-10
Table of Contents
Selling and administrative costs also include expenses for sales, marketing, legal, accounting and finance services, human resources, customer support, treasury and other general corporate services.
Estimates
The preparation of financial statements in conformity with U.S. GAAP requires management to make estimates and assumptions that affect the reported amounts of assets and liabilities and the disclosure of contingent assets and liabilities at the date of the financial statements and the reported amounts of revenues and expenses. Actual results may differ from these estimates.
Foreign Currency Translation
The Company uses the U.S. dollar as its functional currency for operations in the United States and the Canadian dollar for our operations in Canada. The assets and liabilities of our Canadian operations are translated at the exchange rate prevailing at the balance sheet date. Related revenues and expense accounts for the Canadian operations are translated using the average exchange rate during the year. Cumulative foreign currency translation adjustment of $0.3 million, $5.6 million and $4.4 million at December 31, 2013 (Successor), December 31, 2012 and 2011 (Predecessor), respectively, comprise “Accumulated Other Comprehensive Loss” in the Balance Sheets and in the Consolidated (Successor) / Combined (Predecessor) Statements of Changes in Equity / Net Parent Investment.
Cash
Cash and cash equivalents include highly liquid investments with maturities of three months or less at the time of purchase. Prior to the Acquisition, treasury activities, including activities related to the Company, were centralized by Lafarge N.A. such that cash collections were automatically distributed to Lafarge N.A. and reflected as net parent investment. As a result of this automatic distribution to Lafarge N.A., the Company did not hold any cash at December 31, 2012.
Concentration of Credit Risk
Financial instruments that potentially subject the Company to concentrations of credit risk are primarily receivables. The Company performs ongoing credit evaluations of its customers’ financial condition and generally requires no collateral from its customers. The allowances for non-collection of receivables are based upon analysis of economic trends in the construction industry, detailed analysis of the expected collectability of accounts receivable that are past due and the expected collectability of overall receivables.
The Company’s significant customers, as measured by percentage of total revenues for the periods presented, were as follows:
| Successor | Predecessor | |||||||||||||||||
| July 26
to December 31, 2013 |
January 1 to August 30, 2013 |
December 31, |
||||||||||||||||
| 2012 | 2011 | |||||||||||||||||
| Customer A |
12 | % | 15 | % | 15 | % | 12 | % | ||||||||||
The Company’s significant customers, as measured by percentage of total accounts receivable, were as follows:
| Successor December 31, 2013 |
Predecessor December 31, 2012 |
|||||||||
| Customer A |
27 | % | 10 | % | ||||||
| Customer B |
* | 13 | % | |||||||
| * | Customer did not represent over 10% for the period or as of the date presented. |
F-11
Table of Contents
Receivables
Trade receivables are recorded at net realizable value, which includes allowances for cash discounts and doubtful accounts, and are reflected net of customer incentives. We review the collectability of trade receivables on an ongoing basis. We reserve for trade receivables determined to be uncollectible. This determination is based on the delinquency of the account, the financial condition of the customer and our collection experience.
Inventories
Inventories are valued at the lower of cost or market. Virtually all of our inventories are valued under the average cost method. Inventories include materials, labor and applicable factory overhead costs. The value of inventory is adjusted for damaged, obsolete, excess and slow-moving inventory. Market value of inventory is estimated based on the impact of market trends, an evaluation of economic conditions and the value of current orders relating to the future sales of this type of inventory.
Property, Plant and Equipment
Property, plant and equipment, which include amounts recorded under capital lease arrangements, is stated at cost less accumulated depreciation. Depreciation of property, plant and equipment is computed for financial reporting purposes using the straight-line method over the estimated useful lives of the assets. These lives range from 20 to 25 years for buildings, 5 to 25 years for plant machinery, and 5 to 8 years for mobile equipment. For plant machinery, the large majority of the existing assets are being amortized over an estimated remaining life of approximately 15 years. Repair and maintenance costs are expensed as incurred. Substantially all of the Company’s depreciation expenses are recorded in “Cost of goods sold” in the Statements of Operations.
We capitalize interest during the active construction of major projects. Capitalized interest is added to the cost of the underlying assets and is depreciated over the useful lives of those assets. There was no interest capitalized during the years ended December 31, 2013, 2012 or 2011.
Impairment or Disposal of Long-Lived Assets
The Company evaluates the recoverability of its long-lived assets in accordance with the provisions of ASC 360 Property, Plant and Equipment (“ASC 360”). ASC 360 requires that long-lived assets and certain identifiable intangibles be reviewed for impairment whenever events or changes in circumstances indicate that the carrying amount of an asset may not be recoverable. Recoverability of assets is measured by comparing the carrying amount of an asset to future undiscounted net cash flows expected to be generated by the asset. Such evaluations for impairment are significantly impacted by estimates of future prices for its products, capital needs, economic trends in the construction sector and other factors. If such assets are considered to be impaired, the impairment to be recognized is measured by the amount by which the carrying amount of the assets exceeds their fair value. Assets to be disposed of by sale are reflected at the lower of their carrying amount or fair value less cost to sell.
We assess impairment of our long-lived assets at the lowest level for which identifiable cash flows are largely independent of the cash flows of other assets and liabilities. At December 31, 2013, we grouped two wallboard plants and a warehouse facility as an asset group, as they were used together to generate cash flows. A third wallboard plant was not grouped with these locations as its cash flows were largely independent of the cash flows of other assets and liabilities. Our two joint compound plants were also grouped as an asset group, as they were used together to generate cash flows.
Goodwill and Intangible Assets
The goodwill and intangibles reflected in the successor financial statements relates solely to the Lone Star acquisition of the Company. The goodwill and intangibles in the predecessor statements reflect specific transactions executed by Lafarge N.A. to acquire the Company’s business. Additional goodwill was allocated to
F-12
Table of Contents
the Company based on the Lafarge S.A. buyout of the Lafarge N A minority interest in 2006, with the amount allocated based on the relative fair value of the Gypsum business as compared to Lafarge N.A. as a whole at that time.
Goodwill represents the excess of costs over the fair value of identifiable assets of businesses acquired. The Company evaluates goodwill and intangible assets in accordance with ASC 350, Goodwill and Other Intangible Assets (“ASC 350”). ASC 350 requires goodwill to be either qualitatively or quantitatively assessed for impairment annually (or more frequently if impairment indicators arise) for each reporting unit. The Company performs its annual impairment testing of goodwill as of October 1st of each year.
Intangible assets that have indefinite useful lives are not amortized but are tested at least annually for impairment or whenever events or circumstances indicate an impairment may have occurred. As of December 31, 2012, trademarks totaling $0.3 million were deemed as having indefinite lives. Intangible assets that are deemed to have definite lives are amortized over their useful lives. The cost of internal-use software purchased or developed internally, which was primarily allocated from the Parent, in the Predecessor financial statements, is accounted for in accordance with ASC 350-40, Internal-Use Software. The weighted average useful life for each category of intangible assets is as follows: capitalized software—5 years and customer lists—10 years. Amortization of customer relationships is done over a 15 year period using an accelerated method that reflects the expected future cash flows from the acquired customer-related intangible asset. Trademarks identified as having definite lives are amortized on a straight-line basis over the estimated useful life of 15 years.
Fair Value Measurements
U.S. GAAP provides a framework for measuring fair value, establishes a fair value hierarchy of the valuation techniques used to measure the fair value and requires certain disclosures relating to fair value measurements. Fair value is defined as the price that would be received to sell an asset or paid to transfer a liability in an orderly transaction between market participants in a market with sufficient activity.
The three-tier fair value hierarchy which prioritizes the inputs used in measuring fair value is as follows:
| • | Level 1—Observable inputs such as quoted prices (unadjusted) in active markets for identical assets or liabilities that a Company has the ability to access; |
| • | Level 2—Inputs, other than the quoted market prices included in Level 1, which are observable for the asset or liability, either directly or indirectly; and |
| • | Level 3—Unobservable inputs for the asset or liability which is typically based on an entity’s own assumptions when there is little, if any, related market data available. |
The Company evaluates assets and liabilities subject to fair value measurements on a recurring and non-recurring basis to determine the appropriate level to classify them for each reporting period. This determination requires significant judgments to be made by the Company. The fair values of receivables, accounts payable, accrued costs and other current liabilities approximate the carrying values as a result of the short-term nature of these instruments.
The Company estimates the fair value of its debt by discounting the future cash flows of each instrument using estimated market rates of debt instruments with similar maturities and credit profiles. These inputs are classified as Level 3 within the fair value hierarchy. As of December 31, 2013, the carrying value reported in the consolidated balance sheet for the Company’s notes payable approximated its fair value.
No derivative contracts were outstanding as of December 31, 2013 or 2012.
The only assets or liabilities we had at December 31, 2013 that was recorded at fair value on a recurring basis is our financial interest in Seven Hills. We determine the fair value of this financial asset using the discounted cash flow method using assumptions derived from significant unobservable inputs and accordingly
F-13
Table of Contents
this valuation falls into Level 3 in the fair value hierarchy. The fair value of this asset at December 31, 2013 is $13.0 million. The significant unobservable input used in the fair value measurement of our financial interest is a discount rate which was estimated to be 16%. There was no change in the fair value of the financial interest in Seven Hills from the date of Acquisition to year-end.
Assets and liabilities that are measured at fair value on a non-recurring basis include intangible assets and goodwill. These items are recognized at fair value when they are considered to be impaired.
There were no fair value adjustments for assets and liabilities measured on a non-recurring basis. The Company discloses fair value information about financial instruments, whether or not recognized in the balance sheet, for which it is practicable to estimate that value.
Environmental Remediation Liabilities
When the Company determines that it is probable that a liability for environmental matters has been incurred, an undiscounted estimate of the required remediation costs is recorded as a liability in the combined financial statements, without offset of potential insurance recoveries. Costs that extend the life, increase the capacity or improve the safety or efficiency of company-owned assets or are incurred to mitigate or prevent future environmental contamination are capitalized. Other environmental costs are expensed when incurred.
Income Taxes
For the predecessor financial statements, the provision for income taxes is calculated as if the Company completed a separate tax return apart from its Parent, although the Company was included in the Parent’s U.S. federal and state income tax returns and non-U.S. (Canada) jurisdiction tax returns. As of the date of Acquisition, the successor financial statements reflect a new tax basis of accounting and the Company is a tax filer independent of Lafarge. Deferred tax assets and liabilities are recognized principally for the expected tax consequences of temporary differences between the tax basis of assets and liabilities and their reported amounts, using currently enacted tax rates.
In the predecessor financial statements, net operating loss carry-forwards generated by the Company and not historically utilized by the Parent are reflected in the Company’s deferred tax assets notwithstanding the fact that such losses were retained by the Parent. Net operating losses that have already been utilized by the Parent are treated as equity transactions between the Company and the Parent. Valuation allowances are recorded to reduce deferred tax assets when it is more likely than not that a tax benefit will not be realized.
In the successor financial statements, no net operating losses were carried over from the predecessor as part of the acquisition. The successor did not make any income tax payments for the period July 26, 2013 to December 31, 2013.
Collective Bargaining Agreement
Approximately 15% of our employees are unionized and the current collective bargaining agreement with our unionized employees at our Buchanan plant is set to expire on November 30, 2014.
Defined Contribution Pension Plans—Successor
Subsequent to the acquisition by Lone Star, the Company’s employees can participate in a 401K defined contribution pension plan. The Company contributes funds into this plan depending on each employee’s years of service and subject to certain limits. For the period from July 26, 2013 to December 31, 2013, the Company recorded an expense of $0.5 million for these contributions.
F-14
Table of Contents
Defined Benefit Pension Plans and Other Post-Retirement Benefits—Predecessor
Prior to the acquisition by Lone Star, the Company’s salaried employees and union hourly employees participated in defined benefit pension plans sponsored by the Parent. These plans include other Parent employees that are not employees of the Company. The Parent also provides certain retiree health and life insurance benefits to eligible employees who have retired from the Company. Salaried participants generally become eligible for retiree health care benefits when they retire from active service at age 55 or later. Benefits, eligibility and cost-sharing provisions for hourly employees vary by location and/or bargaining unit. Generally, the health care plans pay a stated percentage of most medical and dental expenses reduced for any deductible, co-payment and payments made by government programs and other group coverage. The Company recorded approximately $11.9 million and $8.0 million for the years ended December 31, 2012 and 2011, respectively, in pension and other post-retirement benefits expense related its employees, which has been reflected within “Costs of goods sold” and “Selling and administrative” in the accompanying Combined Statements of Operations. The related pension and post-retirement benefit liability has not been allocated to the Company and has not been presented in the accompanying Combined Balance Sheets since the obligation remained a liability of Lafarge N.A after the acquisition of the Company by Lone Star.
Revenue Recognition
Revenue from the sale of gypsum products is recorded when title and ownership are transferred upon shipment of the products. Amounts billed to a customer in a sales transaction related to shipping and handling are included in “Net sales,” and costs incurred for shipping and handling are classified as “Cost of goods sold” in the Combined Statements of Operations. The revenues reported in these financial statements relate to specifically identifiable historical activities of the plants, warehouses, and other assets that comprise the Company. We record estimated reductions to revenue for customer programs and incentive offerings, including promotions and other volume-based incentives, in the period in which the sale occurs.
Derivative Instruments
We use derivative instruments to manage selected commodity price exposures. We do not use derivative instruments for speculative trading purposes, and we typically do not hedge beyond two years. We elected not to designate certain derivative instruments for hedge accounting under ASC 815-20, Derivatives—Hedging. All derivative instruments must be recorded on the Balance Sheet at fair value with changes in the fair value of the derivative reported in “Cost of goods sold” in the current period in the Statements of Operations. Gains related to changes in the fair value of derivatives were $0.7 million and $1.1 million for the years ended December 31, 2012 and 2011, respectively. There were no derivative contracts outstanding in 2013.
To the extent possible, we elect to apply the normal purchases or sales exception in accordance with ASC 815. Normal purchases or sales contracts are contracts that provide for the purchase or sale of something other than a financial instrument or derivative instrument that will be delivered in quantities expected to be used or sold by us over a reasonable period in the normal course of business. This election applies to the Company’s purchase commitments for natural gas commodities used in our production process that would otherwise be considered derivative instruments. Accordingly, the natural gas purchase contracts are not subject to ASC 815 nor recognized on the balance sheet at their fair value.
Recent Accounting Pronouncements
In May 2011, the FASB issued guidance in ASU No. 2011-04 Amendments to Achieve Common Fair Value Measurement and Disclosure Requirements in U.S. GAAP and IFRS which updates the definition of fair value and measurement criteria to bring them into agreement with IFRS’s (which are also changed to agree with U.S. GAAP). The guidance is effective for interim and annual periods beginning after December 15, 2011. Early adoption is not permitted. This guidance did not have a significant impact on our financial statements other than providing the required disclosures.
F-15
Table of Contents
In September 2011, the FASB issued guidance on ASU 2011-08, Testing Goodwill for Impairment which is intended to simplify goodwill impairment testing by adding an option to qualitatively assess goodwill for impairment. The guidance is effective for interim and annual periods beginning after December 15, 2011. Early adoption is permitted. We adopted this guidance for our testing of goodwill for impairment effective October 1, 2011.
In July 2012, the FASB issued ASU No. 2012-02, Intangibles-Goodwill and Other (Topic 350): Testing Indefinite-Lived Intangible Assets for Impairment. This ASU permits an entity to first assess qualitative factors to determine whether it is more likely than not that the fair value of an indefinite-lived intangible asset is less than its carrying amount as a basis for determining whether it is necessary to perform the quantitative impairment test. This ASU was effective for annual and interim impairment tests performed for fiscal years beginning after September 15, 2012, which for us is the year ending December 31, 2013. The adoption of this update did not have a material impact on our financial statements.
In February 2013, the FASB issued ASU No. 2013-02, Comprehensive income (Topic 220): Reporting of Amounts Reclassified Out of Accumulated Other Comprehensive Income. This ASU amends existing guidance by requiring companies to report the effect of significant reclassifications out of accumulated other comprehensive income on the respective line items in net income if the amount being reclassified is required to be reclassified in its entirety to net income in the same reporting period. For amounts which are not to be reclassified in their entirety to net income in the same reporting period, companies will be required to cross reference other disclosures that provide information about those amounts. The provisions of ASU 2013-02 are effective for annual periods beginning after December 15, 2012, which for us is the year ending December 31, 2013. The adoption of this update did not have a material impact on our financial statements.
3. Receivables
Receivables consist of the following (in thousands):
| Successor December 31, 2013 |
Predecessor December 31, 2012 |
|||||||||
| Trade receivables |
$ | 34,065 | $ | 24,880 | ||||||
| Allowances |
(1,737 | ) | (1,530 | ) | ||||||
|
|
|
|
|
|||||||
| Total receivables, net |
$ | 32,328 | $ | 23,350 | ||||||
|
|
|
|
|
|||||||
At December 31, 2012, under the Predecessor, Lafarge N.A. maintained accounts receivable securitization programs in both the U.S. and Canada to provide additional sources of working capital and long-term financing. Under the terms of the securitization agreement, Lafarge N.A. maintained effective control over the assets sold and therefore the accounts receivable securitization transactions have not been accounted for as sales. As a result, the related accounts receivable are included in Lafarge N.A. financial statements and those directly attributable to the Predecessor have been reflected in these financial statements. The related secured borrowing and interest costs have not been allocated to the Predecessor as the obligation was, and remained, a liability of Lafarge N.A. CBP does not maintain an accounts receivable securitization program.
Trade receivables are recorded net of credit memos issued during the normal course of business.
F-16
Table of Contents
The following reflects a rollforward of the receivable allowances for the years ended December 31, 2013, 2012 and 2011 (In thousands):
| Successor | Predecessor | |||||||||||||||||
| July 26 to December 31, 2013 |
January 1 to August 30, 2013 |
December 31, |
||||||||||||||||
| 2012 | 2011 | |||||||||||||||||
| Beginning |
$ | (1,768 | ) | $ | (1,530 | ) | $ | (1,357 | ) | $ | (1,953 | ) | ||||||
| Additions |
(1,466 | ) | (2,377 | ) | (3,097 | ) | (2,951 | ) | ||||||||||
| Write-offs |
1,497 | 2,139 | 2,924 | 3,547 | ||||||||||||||
|
|
|
|
|
|
|
|
|
|||||||||||
| Ending |
$ | (1,737 | ) | $ | (1,768 | ) | $ | (1,530 | ) | $ | (1,357 | ) | ||||||
|
|
|
|
|
|
|
|
|
|||||||||||
4. Inventories
Inventories consist of the following (In thousands):
| December 31, | ||||||||||
| 2013 | 2012 | |||||||||
| Finished products |
$ | 3,841 | $ | 5,856 | ||||||
| Work in process |
— | 12 | ||||||||
| Raw materials |
16,505 | 15,762 | ||||||||
| Supplies and other |
7,774 | 7,576 | ||||||||
|
|
|
|
|
|||||||
| Total inventories |
$ | 28,120 | $ | 29,206 | ||||||
|
|
|
|
|
|||||||
5. Property, Plant and Equipment
Property, plant and equipment consist of the following (In thousands):
| Successor December 31, 2013 |
Predecessor December 31, 2012 |
|||||||||
| Land |
$ | 12,933 | $ | 3,978 | ||||||
| Buildings |
108,737 | 143,776 | ||||||||
| Plant machinery |
267,146 | 441,195 | ||||||||
| Mobile equipment |
2,990 | 7,667 | ||||||||
| Construction in progress |
3,554 | 7,384 | ||||||||
|
|
|
|
|
|||||||
| Property, plant and equipment, at cost |
395,360 | 604,000 | ||||||||
| Accumulated depreciation |
(11,735 | ) | (217,730 | ) | ||||||
|
|
|
|
|
|||||||
| Total property, plant and equipment, net |
$ | 383,625 | $ | 386,270 | ||||||
|
|
|
|
|
|||||||
Depreciation expense was $11.7 million for July 26, 2013 to December 31, 2013 (Successor), $16.1 million for January 1, 2013 to August 30, 2013 (Predecessor) and $34.8 million and $25.9 million for the years ended December 31, 2012 and 2011 (Predecessor), respectively. Depreciation expense for the Predecessor includes depreciation of certain equipment obtained under a capital lease arrangement.
Property and equipment includes $4.4 million at December 31, 2012 of certain equipment obtained under a capital lease arrangement that is included in “Buildings, machinery and equipment.” Accumulated depreciation related to such equipment under this capital lease arrangement was $2.4 million at December 31, 2012. This capital lease arrangement was terminated with a payment of $4.2 million to the owner of the equipment. A loss on this termination of $2.1 million is included in the cost of sales for the period July 26, 2013 to September 30, 2013, and $1.2 million is included in the cost of sales for the period January 1, 2013 to August 30, 2013 (Predecessor).
F-17
Table of Contents
In September 2012, the Company closed its wallboard facility in Newark, New Jersey, and as a result, recorded an $11.3 million charge to accelerated depreciation of the facility and write-off of spare parts and other assets, which is reflected in costs of goods sold in the combined (Predecessor) statements of operations. The Company also recorded $0.2 million in 2012 related to severance benefits paid to employees affected by the closure which is reflected in “Cost of goods sold” in the predecessor statements of operations.
6. Goodwill
At December 31, 2013 and 2012, the Company had two reporting units, of which only one included goodwill. In accordance with ASC 350, the Company performed the first step of the goodwill impairment test, by comparing the fair value of the reporting unit with its carrying value. The Company completed assessments as of October 1, 2013 and 2012 and determined the fair value of the reporting unit exceeded its carrying value. As a result management concluded that there was no goodwill impairment. There were no changes in the carrying value of goodwill during the year ended 2012. During 2013, a new basis of accounting was established with the acquisition of the Company by Lone Star on August 30, 2013, and resulted in a new value of goodwill for the successor financial statements.
7. Software and Other Intangibles
Customer relationships and other intangibles consist of the following (In thousands):
| Successor December 31, 2013 |
Predecessor December 31, 2012 |
|||||||||
| Customer relationships |
$ | 117,919 | 7,224 | |||||||
| Purchased and internally developed software |
11 | $ | 20,618 | |||||||
| Trademarks |
14,990 | 317 | ||||||||
|
|
|
|
|
|||||||
| Customer relationships and other intangibles, at cost |
132,920 | 28,159 | ||||||||
| Accumulated amortization |
(6,794 | ) | (24,330 | ) | ||||||
|
|
|
|
|
|||||||
| Customer relationships and other intangibles, net |
$ | 126,126 | $ | 3,829 | ||||||
|
|
|
|
|
|||||||
Amortization expense is included in cost of sales and was $6.8 million for July 26, 2013 to December 31, 2013 (Successor), $0.8 million for January 1, 2013 to August 30, 2013 (Predecessor), and $1.6 million and $2.1 million the years ended December 31, 2012 (Predecessor) and 2011 (Predecessor), respectively.
Amortization of customer relationships is done over a 15 year period using an accelerated method that reflects the expected future cash flows from the acquired customer-related intangible asset. Trademarks are amortized on a straight-line basis over the estimated useful life of 15 years.
There were minimal capitalized software costs at December 31, 2013 (Successor) and $1.0 million at December 31, 2012 (Predecessor). Amortization expense related to capitalized software was $0.3 million for January 1, 2013 to August 30, 2013 (Predecessor) and $0.9 million and $1.4 million for the years ended December 31, 2012 (Predecessor) and December 31, 2011 (Predecessor), respectively. CBP did not acquire capitalized software as part of its acquisition of the Predecessor, and has incurred minimal costs related to internal-use software that are capitalizable.
Based on the intangible assets recorded as of December 31, 2013, amortization expense for the years ending December 31, 2014, 2015, 2016, 2017 and 2018 is expected to be approximately $18.9 million, $14.7 million, $12.2 million, $10.5 million, and $9.4 million, respectively. These amounts may vary as acquisitions and dispositions occur in the future.
F-18
Table of Contents
8. Accrued and Other Liabilities
Accrued and other liabilities consist of the following (In thousands):
| Successor December 31, 2013 |
Predecessor December 31, 2012 |
|||||||||
| Vacation and other employee-related costs |
$ | 2,948 | $ | 6,237 | ||||||
| VAT taxes |
942 | 729 | ||||||||
| Restructuring |
— | 163 | ||||||||
| Income taxes |
4,197 | — | ||||||||
| Other |
3,238 | 232 | ||||||||
|
|
|
|
|
|||||||
| Total accrued and other liabilities |
$ | 11,325 | $ | 7,361 | ||||||
|
|
|
|
|
|||||||
9. Income Taxes
The components of the income tax (expense) benefit are as follows (In thousands):
| Successor | Predecessor | |||||||||||||||||
| July 26 to December 31, 2013 |
January 1 to August 30, 2013 |
Year Ended December 31, 2012 |
Year Ended December 31, 2011 |
|||||||||||||||
| Current |
$ | (4,197 | ) | (884 | ) | $ | 542 | $ | 732 | |||||||||
| Deferred |
3,087 | 754 | (190 | ) | (416 | ) | ||||||||||||
|
|
|
|
|
|
|
|
|
|||||||||||
| $ | (1,110 | ) | $ | (130 | ) | $ | 352 | 316 | ||||||||||
|
|
|
|
|
|
|
|
|
|||||||||||
The components of income (loss) before income taxes by country are as follows (In thousands):
| Successor | Predecessor | |||||||||||||||||
| July 26 to December 31, 2013 |
January 1 to August 30, 2013 |
Year Ended December 31, 2012 |
Year Ended December 31, 2011 |
|||||||||||||||
| United States |
$ | 3,225 | 32,509 | $ | (10,858 | ) | $ | (58,810 | ) | |||||||||
| Canada |
(10 | ) | (194 | ) | (2,336 | ) | (2,048 | ) | ||||||||||
|
|
|
|
|
|
|
|
|
|||||||||||
| $ | 3,215 | $ | 32,315 | $ | (13,194 | ) | $ | (60,858 | ) | |||||||||
|
|
|
|
|
|
|
|
|
|||||||||||
The provision for income taxes differs from that which would have resulted from the use of the federal statutory income tax rates primarily as a result of the provision for various state income taxes and due to the valuation allowance recorded against deferred tax assets for the Predecessor.
F-19
Table of Contents
Taxes computed at the U.S. statutory federal income tax rate of 35% are reconciled to the Company’s effective rate as follows (In thousands):
| Successor | Predecessor | |||||||||||||||||
| July 26 to December 31, 2013 |
January 1 to August 30, 2013 |
Year Ended December 31, 2012 |
Year Ended December 31, 2011 |
|||||||||||||||
| Taxes at the U.S. federal income tax rate |
$ | 1,125 | $ | 11,310 | $ | (4,618 | ) | $ | (21,300 | ) | ||||||||
| U.S./Canadian tax rate differential |
2 | 19 | 234 | 175 | ||||||||||||||
| U.S. state and Canadian provincial income taxes, net of federal benefit |
74 | 1,314 | (494 | ) | (2,517 | ) | ||||||||||||
| Non-deductible expenses |
17 | 46 | 80 | 76 | ||||||||||||||
| Domestic production activities deduction |
(108 | ) | — | — | — | |||||||||||||
| Valuation allowance |
— | (12,559 | ) | 4,446 | 23,259 | |||||||||||||
| Other |
— | — | — | (9 | ) | |||||||||||||
|
|
|
|
|
|
|
|
|
|||||||||||
| Income tax expense (benefit) |
$ | 1,110 | $ | 130 | $ | (352 | ) | $ | (316 | ) | ||||||||
|
|
|
|
|
|
|
|
|
|||||||||||
| Effective rate |
34.53 | % | 0.40 | % | 2.67 | % | 0.52 | % | ||||||||||
|
|
|
|
|
|
|
|
|
|||||||||||
Deferred income taxes reflect the net effect of temporary differences between the carrying amount of assets and liabilities for financial reporting purposes and the amounts used for tax purposes. The significant components of deferred tax assets and deferred tax liabilities included on the Combined Balance Sheets are (In thousands):
| Successor | Predecessor | |||||||||
| December 31, 2013 |
December 31, 2012 |
|||||||||
| Deferred tax assets: |
||||||||||
| Reserves and other liabilities |
$ | 2,137 | $ | 392 | ||||||
| Tax loss carryforwards |
— | 111,007 | ||||||||
| Acquisition costs and intangibles |
1,533 | — | ||||||||
| Other |
136 | 2,181 | ||||||||
|
|
|
|
|
|||||||
| 3,806 | 113,580 | |||||||||
| Less valuation allowance |
— | (43,780 | ) | |||||||
|
|
|
|
|
|||||||
| Deferred tax assets, net of valuation allowance |
3,806 | 69,800 | ||||||||
| Deferred tax liabilities: |
||||||||||
| Depreciation, amortization and other |
(719 | ) | (75,945 | ) | ||||||
|
|
|
|
|
|||||||
| Deferred tax liabilities |
(719 | ) | (75,945 | ) | ||||||
|
|
|
|
|
|||||||
| Net deferred tax asset (liability) |
$ | 3,087 | $ | (6,145 | ) | |||||
|
|
|
|
|
|||||||
| Net deferred tax asset, current |
$ | 2,137 | $ | — | ||||||
| Net deferred tax asset, non-current |
$ | 950 | $ | — | ||||||
| Net deferred tax liability, non-current |
$ | — | $ | (6,145 | ) | |||||
F-20
Table of Contents
The following is a rollforward of the deferred tax valuation allowance for the years ended December 31, 2012 and 2011 (In thousands):
| Successor | Predecessor | |||||||||||||||||
| July 26 to December 31, 2013 |
January 1 to August 30, 2013 |
Year Ended December 31, 2012 |
Year Ended December 31, 2011 |
|||||||||||||||
| Balance at beginning of period |
$ | — | $ | 43,780 | $ | 38,865 | $ | 16,053 | ||||||||||
| Amounts charged to expense |
— | (12,559 | ) | 4,446 | 23,259 | |||||||||||||
| Amounts charged to other comprehensive income |
— | — | 469 | (447 | ) | |||||||||||||
|
|
|
|
|
|
|
|
|
|||||||||||
| Balance at end of period |
$ | — | $ | 31,221 | $ | 43,780 | $ | 38,865 | ||||||||||
|
|
|
|
|
|
|
|
|
|||||||||||
The Predecessor’s operating results have historically been included in Lafarge N.A.’s combined US Federal and state income tax returns. In addition, the Canadian Predecessor operations have historically been included in Lafarge N.A.’s Canadian Federal and provincial income tax returns. The provisions for income taxes in the Predecessor financial statements have been determined on a separate return basis as if the Company filed its own tax returns. In 2012 and 2011, the Company generated pre-tax operating losses of $13.2 million and $60.9 million respectively, resulting in federal and state tax benefits. For U.S. federal income tax purposes, the Company had unused net operating loss carry-forwards of $111.0 million expiring from 2028 through 2032. For Canadian federal income tax purposes, the Company had no loss carryforwards available. The income tax benefits related to net operating losses that have been utilized by Lafarge N.A. are reflected in the Predecessor financial statements as a distribution to Lafarge N.A.. Management considered and weighed the available evidence, both positive and negative, to determine whether it is more-likely-than-not that some portion, or all, of the Predecessor’s deferred tax assets will not be realized. Given the losses of the Company over the recent years, the Company has established a valuation allowance relating to a portion of the deferred tax assets in the Predecessor financial statements. None of the net operating loss carry-forward carried forward to CBP as of the acquisition date with Lone Star. The Company has not recorded a valuation allowance at December 31, 2013, as management concluded realization of the deferred tax assets was more likely than not.
The Company is subject to audit examinations at federal, state and local levels by tax authorities in those jurisdictions. In addition, the Canadian operations are subject to audit examinations at federal and provincial levels by tax authorities in those jurisdictions. The tax matters challenged by the tax authorities are typically complex; therefore, the ultimate outcome of these challenges is subject to uncertainty. The Company has not identified any issues that did not meet the recognition threshold or would be impacted by the measurement provisions of the uncertain tax position guidance.
10. Commitments and Contingencies
The Company leases certain buildings and equipment. The Company’s facility and equipment leases may provide for escalations of rent or rent abatements and payment of pro rata portions of building operating expenses. Minimum lease payments are recognized on a straight-line basis over the minimum lease term. The Predecessor terminated the leases at a facility at the Port of Newark prior to the acquisition by Lone Star. During January 1, 2013 to August 30, 2013 (Predecessor), total rent paid on this lease, including a termination fee, was $4.2 million. Total expenses under operating leases were $1.5 million for July 26, 2013 to December 31, 2013 (Successor). Including Newark, total expenses under operating leases were $7.8 million for January 1, 2013 to August 30, 2013 (Predecessor), and $7.0 million and $5.9 million for the years ended December 31, 2012 (Predecessor) and December 31, 2011 (Predecessor), respectively. The Company also has noncapital purchase commitments that primarily relate to gas, gypsum, paper and other raw materials. The total amounts purchased under such commitments were $23.0 million for July 26, 2013 to December 31, 2013 (Successor), $47.9 million for January 1, 2013 to August 30, 2013 (Predecessor), and $63.8 million and $65.3 million for the years ended December 31, 2012 (Predecessor) and December 31, 2011 (Predecessor), respectively.
F-21
Table of Contents
The table below shows the future minimum lease payments due under non-cancelable operating leases and purchase commitments at December 31, 2013 (In thousands):
| Total | 2014 | 2015 | 2016 | 2017 | 2018 | After 2018 |
||||||||||||||||||||||
| Operating Leases(1) |
$ | 5,486 | $ | 1,073 | $ | 1,066 | $ | 616 | $ | 621 | $ | 616 | $ | 1,494 | ||||||||||||||
| Purchase Commitments |
186,213 | 33,960 | 32,269 | 20,762 | 17,658 | 18,060 | 63,504 | |||||||||||||||||||||
|
|
|
|
|
|
|
|
|
|
|
|
|
|
|
|||||||||||||||
| Total Commitments |
$ | 191,699 | $ | 35,033 | $ | 33,335 | $ | 21,378 | $ | 18,279 | $ | 18,676 | $ | 64,998 | ||||||||||||||
|
|
|
|
|
|
|
|
|
|
|
|
|
|
|
|||||||||||||||
| (1) | The table reflects future minimum lease payments over the non-cancelable lease terms of its operating lease. |
Under certain circumstances, the Company provides letters of credit related to its natural gas and other supply purchases. At December 31, 2013 the Successor had outstanding letters of credit of approximately $2.4 million and at December 31, 2012 the Predecessor had outstanding letters of credit of approximately $1.4 million.
In the ordinary course of business, the Company executes contracts involving indemnifications standard in the industry and indemnifications specific to a transaction such as sale of a business. These indemnifications might include claims relating to any of the following: environmental and tax matters; intellectual property rights; governmental regulations and employment-related matters; customer, supplier, and other commercial contractual relationships; and financial matters. While the maximum amount to which the Company may be exposed under such agreements cannot be estimated, it is the opinion of management that these guarantees and indemnifications are not expected to have a materially adverse effect on the Company’s financial condition, results of operations or liquidity.
In the ordinary course of business, the Company is involved in certain legal actions and claims, including proceedings under laws and regulations relating to environmental and other matters. Because such matters are subject to many uncertainties and the outcomes are not predictable with assurance, the total liability for these legal actions and claims cannot be determined with certainty. When the Company determines that it is probable that a liability for environmental matters, legal actions or other contingencies has been incurred and the amount of the loss is reasonably estimable, an estimate of the costs to be incurred is recorded as a liability in the financial statements. As of December 31, 2013 and December 31, 2012, such liabilities are not material to the Company’s and the Predecessor’s financial statements, respectively. While management believes its accruals for such liabilities are adequate, the Company may incur costs in excess of the amounts provided. Although the ultimate amount of liability that may result from these matters or actions is not ascertainable, the Company believes that any amounts exceeding the recorded accruals will not materially affect its financial condition.
Following the acquisition, the Company’s sole membership interest holder, LSF8 Gypsum Holdings, L.P., implemented a cash-based long term incentive plan (the “LTIP”), in which participants have the potential to earn a cash payout upon a monetization event (as defined in the LTIP). Potential monetization events include the sale of the Company, an initial public offering where the sponsor reduces its interest to below 50% or at the sponsor’s discretion, or through certain cash distributions as defined in the LTIP. At December 31, 2013, no such monetization events had occurred, and therefore no amounts were accrued in the accompanying balance sheet as of December 31, 2013.
11. Related Party Transactions
Allocated Expenses
The Predecessor has been allocated selling and administrative expenses from Lafarge N.A. of $4.9 million for January 1, 2013 to August 30, 2013 and $7.0 million and $9.7 million for the years ended December 31, 2012 and 2011, respectively. These costs from Lafarge N.A. had been derived from multiple levels of the organization
F-22
Table of Contents
including shared corporate expenses and fees from the parent of Lafarge N.A. These allocated costs were primarily related to corporate administrative expenses and reorganization costs, employee-related costs including pensions and other benefits for corporate and shared employees, and rental and usage fees for shared assets for the following functional groups: information technology, legal services, accounting and finance services, human resources, marketing and contract support, customer support, treasury, facility and other corporate and infrastructural services. The costs associated with these services and support functions (indirect costs) have been allocated to the Predecessor using the most meaningful respective allocation methodologies which were primarily based on proportionate revenue, proportionate headcount or proportionate direct labor costs of the Predecessor compared to Lafarge N.A. and/or its subsidiaries.
In addition to the allocated selling and administrative expenses noted above, the Predecessor recorded approximately $7.6 million for January 1, 2013 to August 30, 2013 and $11.9 million and $8.0 million for the years ended December 31, 2012 and 2011, respectively, in pension and other post-retirement benefits expense related its employees, which has been reflected within “Costs of goods sold” and “Selling and administrative” in the accompanying Combined Statements of Operations of the Predecessor. The Predecessor’s salaried employees and union hourly employees participate in defined benefit pension plans sponsored by the Parent. These plans include other Lafarge N.A. employees that are not employees of the Predecessor. Lafarge N.A. also provides certain retiree health and life insurance benefits to eligible employees who have retired from the Predecessor. Salaried participants generally become eligible for retiree health care benefits when they retire from active service at age 55 or later. Benefits, eligibility and cost-sharing provisions for hourly employees vary by location and/or bargaining unit. Generally, the health care plans pay a stated percentage of most medical and dental expenses reduced for any deductible, copayment and payments made by government programs and other group coverage. The related pension and post-retirement benefit liability has not been allocated to the Predecessor and has not been presented in the accompanying Predecessor balance sheet since the obligation remained a liability of Lafarge N.A. The Successor does not have any pension or postretirement benefit plans in place.
Management believes the assumptions and allocations underlying the combined Predecessor financial statements are reasonable and appropriate under the circumstances. The expenses and cost allocations have been determined on a basis considered by Lafarge N.A. to be a reasonable reflection of the utilization of services provided to or the benefit received by the Predecessor during the periods presented relative to the total costs incurred by Lafarge N.A. However, the amounts recorded for these transactions and allocations are not necessarily representative of the amount that would have been reflected in the financial statements had the Predecessor been an entity that operated independently of Lafarge N.A. Consequently, future results of operations after the Predecessor’s separation from Lafarge N.A. will include costs and expenses that may be materially different than the Predecessor’s historical results of operations. Accordingly, the financial statements for these periods are not indicative of the future results of operations, financial position and cash flows.
Other
Since the Acquisition, the Company is no longer part of the Lafarge N.A. organization but does have a Transition Services Agreement to help with certain ongoing back-office functions. These functions include, among others, accounting, treasury, tax, and information technology services. The Company paid Lafarge N.A. a fee for these services of $119,000 per month during 2013, and pay $129,700 per month in 2014. These services are available through February 2015, but can be discontinued earlier by the Company.
On August 30, 2013, the Company entered into an advisory agreement with an affiliate of Lone Star to provide certain management oversight services to the Company, including assistance and advice on strategic plans, obtaining and maintaining certain legal documents, and communicating and coordinating with service providers. The Company pays 110% of actual costs for the services provided and as of December 31, 2013, we owed $0.2 million under this agreement. Subsequent to year-end, the agreement was terminated upon the closing of the public offering of the Company’s stock in February 2014, and upon which the Company paid a termination fee of $2 million.
F-23
Table of Contents
12. Investment in Seven Hills
The Predecessor was a party to a paperboard liner venture with an unaffiliated third-party named Seven Hills, LLC (“Seven Hills”). This venture provided the Predecessor with a continuous supply of high-quality recycled paperboard liner to meet its ongoing production requirements. For the Predecessor financial statements, management evaluated the characteristics of its investment in Seven Hills and concluded that Seven Hills would be deemed a VIE as there was not sufficient equity at risk in Seven Hills. Management also considered certain characteristics related to control and the power to direct the activities of Seven Hills that most significantly impact Seven Hills’ economic performance, including the significant decisions made by the Managing Board and the involvement of the other investor in managing the day-to-day activities. Management concluded the Company was not the primary beneficiary. Accordingly, the Predecessor accounted for its investment in Seven Hills under the equity method of accounting.
Since the acquisition by Lone Star, the venture equity ownership has remained with Lafarge N.A. up until March 13, 2014, although many of the rights and obligations and underlying economics were contractually transferred to the Company. Based on the allocation of the purchase price, $13.0 million, related to the financial interest in the Seven Hills venture has been recorded and represents the fair value of the rights retained by the Company after the acquisition. In the Successor financial statements, we elected the option to account for this financial interest at fair value with changes in fair value reflected in earnings during the period in which they occur. We elected to measure this financial interest at fair value, as permitted under ASC 825, Financial Instruments, to better reflect the expected future benefit of the acquired financial interest. As of December 31, 2013, the fair value of this financial interest remained at $13 million. On March 13, 2014, Lafarge assigned its interest in the joint venture and the joint venture agreement and the other operative agreements to the Company under the same terms and conditions as existed prior to the Acquisition.
The Company currently has the right to terminate the venture and put its interest to the other investor based on a formula-driven price effective on the anniversary of the commencement date by providing notice two years prior to any such anniversary. Proceeds from such termination would revert to CBP. As of December 31, 2013 and December 31, 2012, the estimated redemption value would be $13.8 and $14.1 million.
Paperboard purchased from Seven Hills was $17.6 million for July 26, 2013 to December 31, 2013 (Successor), $33.1 million for January 1, 2013 to August 30, 2013 (Predecessor), and was $43.6 million and $46.4 million for the years ended December 31, 2012 (Predecessor) and 2011 (Predecessor), respectively. The Company also has certain purchase commitments for paper totaling $29.2 million through 2015.
13. Debt
Debt consists of the following:
| Successor December 31, 2013 |
Predecessor December 31, 2012 |
|||||||||
| First Lien Credit Agreement with quarterly principal payments, maturing on August 28, 2020; interest rate of LIBOR (with a 1% floor) plus 3.75%; average annual interest rate of 4.75%, before original issue discount |
$ | 413,962 | — | |||||||
| Second Lien Credit Agreement maturing on February 26, 2021; interest rate of LIBOR (with a 1% floor) plus 7.75%; average annual interest rate of 8.75%, before original issue discount |
155,000 | — | ||||||||
| Borrowings under First Lien Credit Agreement Revolver |
— | — | ||||||||
| Less: Original issue discount (net of amortization) |
(4,888 | ) | — | |||||||
|
|
|
|||||||||
| Total debt |
$ | 564,074 | — | |||||||
| Less: Current portion of long-term debt |
(4,150 | ) | — | |||||||
|
|
|
|||||||||
| Long-term debt |
$ | 559,924 | — | |||||||
|
|
|
|||||||||
F-24
Table of Contents
In connection with the acquisition by Lone Star, CBP purchased all of the assets of the Predecessor with cash. In order to finance a portion of the consideration payable to Lafarge N.A., the Successor entered into a First Lien Credit Agreement for borrowings of $320 million, a Second Lien Credit Agreement for borrowings of $120 million, and drew $25 million under a $50 million revolving credit facility as part of the First Lien Credit Agreement. In conjunction with the initial issuance of this debt, the Company incurred $15.3 million of debt issuance costs which are recorded as an asset and are being amortized using the effective interest rate method or the straight-line method which approximates the effective interest rate method, over the estimated life of the related debt.
On December 2, 2013, we modified our First Lien Credit Agreement and Second Lien Credit Agreement and increased our borrowings by a total of $130 million with the proceeds distributed as a return of capital to our sponsor, Lone Star. The changes were considered a modification of the existing instruments in accordance with guidance provided by ASC 470-50.
The maturity dates for the First Lien Credit Agreement and Second Lien Credit Agreement remained the same. The First Lien was increased by $95 million from $320 million to a total $415 million with quarterly principal payments increased from $0.8 million to $1.0 million and the remaining amount due at maturity in 2020. The Second Lien was increased by $35 million from $120 million to $155 million and remains all due at maturity in 2021. Interest remained floating for both liens and the interest rate spread over LIBOR (with a 1% floor) was increased from plus 3.5% to plus 3.75% for the term loan under the First Lien Credit Agreement and from plus 7.5% to plus 7.75% for the term loan under the Second Lien Credit Agreement. The margin applicable to each borrowing may be reduced by 0.25% if the Company achieves certain credit ratings by Moody’s and S&P. The margin may be further reduced by 0.50% subsequent to our initial public offering if we achieve certain credit ratings by Moody’s and S&P or achieve a total leverage ratio less than four times net debt to adjusted earnings before interest, depreciation and amortization as defined in the agreement.
Total original issue discount and other fees associated with the amendment of approximately $5 million were paid at closing. Third party debt issuance costs were expensed.
The First Lien Credit Agreement is secured by the underlying property and equipment of the Company and has principal payments of $1,037,000 that are due quarterly with a final payment of $387.0 million due on August 28, 2020. The annual effective interest rate on the First Lien Credit Agreement including original issue discount and amortization of debt issuance costs is 5.2%.
The Second Lien Credit Agreement has a second lien on the underlying property and equipment of the Company. No principal payments are required until maturity on February 26, 2021. The annual effective interest rate on the Second Lien Credit Agreement including original issue discount and amortization of debt issuance costs is 9.4%.
The First Lien Credit Agreement also has a $50 million revolver (the “Revolver”), none of which was outstanding as of December 31, 2013. Interest is floating, based on LIBOR (with a floor of 1%), plus 300 basis points. In addition, CBP pays a facility fee of 50 basis points per annum on the total Revolver facility. Availability under the Revolver, based on draws and outstanding letters of credit and that there are no violations of covenants, was $47.6 million at December 31, 2013.
Total interest paid for the period July 26, 2013 to December 31, 2013 (Successor) was $9.5 million. No significant amounts of interest were paid by the Predecessor.
F-25
Table of Contents
The table below shows the future minimum principal payments due under the credit agreements.
| Amount Due | ||||
| in thousands | ||||
| 2014 |
$ | 4,150 | ||
| 2015 |
4,150 | |||
| 2016 |
4,150 | |||
| 2017 |
4,150 | |||
| 2018 |
4,150 | |||
| Thereafter |
548,212 | |||
Subsequent to year-end, on February 10, 2014, we closed on our initial public offering of common stock and used the net proceeds to repay the Second Lien Credit Agreement of $155 million. See Note 14 “Subsequent Events” for further information.
Under the terms of the credit agreements above, the Company is required to comply with certain covenants, including among others, the limitation of indebtedness, limitation on liens, and limitations on certain cash distributions. One single financial covenant governs all of the Company’s debt and only applies if the outstanding borrowings of the Revolver plus outstanding letters of credit are greater than $12.5 million as of the end of the quarter, beginning with the quarter ending December 31, 2013. The financial covenant is a total leverage ratio calculation, in which total debt less outstanding cash is divided by adjusted earnings before interest, depreciation and amortization. The covenant was not applicable at December 31, 2013. If applicable, the December 31, 2013, total leverage ratio financial covenant would have been 6.75.
14. Segment Reporting
Segment information is presented in accordance with ASC 280, Segment Reporting (“ASC 280”), which establishes standards for reporting information about operating segments. It also establishes standards for related disclosures about products and geographic areas. The Company’s and Predecessor’s primary reportable segment is wallboard which represents approximately 95% of the revenues of the Company and Predecessor. This segment produces wallboard for the commercial and residential construction sectors. We also operate other business activities, primarily finishing products, which complement the Company’s full range of wallboard products.
Revenues from the major products sold to external customers include gypsum wallboard and finishing products.
The Company’s and Predecessor’s two geographic areas consist of the United States and Canada for which it reports net sales, fixed assets and total assets.
The Company and Predecessor evaluate operating performance based on profit or loss from operations before certain adjustments as shown below. Revenues are attributed to geographic areas based on the location of the assets producing the revenues. We did not provide asset information by segment as our CODM does not use such information for purposes of allocating resources and assessing segment performance.
F-26
Table of Contents
Reportable segment information consists of the following (In thousands):
| Successor | Predecessor | |||||||||||||||||
| July 26, 2013 to December 31, 2013 |
January 1, 2013 to August 30, 2013 |
Year Ended December 31, 2012 |
Year Ended December 31, 2011 |
|||||||||||||||
| Net Sales: |
||||||||||||||||||
| Wallboard |
$ | 144,689 | $ | 240,225 | $ | 295,282 | $ | 236,096 | ||||||||||
| Other |
5,377 | 12,023 | 16,128 | 16,015 | ||||||||||||||
|
|
|
|
|
|
|
|
|
|||||||||||
| Total net sales |
$ | 150,066 | $ | 252,248 | $ | 311,410 | $ | 252,111 | ||||||||||
|
|
|
|
|
|
|
|
|
|||||||||||
| Operating income (loss): |
||||||||||||||||||
| Wallboard |
$ | 14,162 | $ | 32,699 | $ | (11,814 | ) | $ | (59,493 | ) | ||||||||
| Other |
(384 | ) | (72 | ) | (943 | ) | (1,623 | ) | ||||||||||
| Adjustments: |
||||||||||||||||||
| Interest Expense |
(10,542 | ) | (91 | ) | (212 | ) | (273 | ) | ||||||||||
| Loss from equity investment |
— | (30 | ) | (138 | ) | 228 | ||||||||||||
| Other expenses |
(21 | ) | (191 | ) | (87 | ) | 303 | |||||||||||
|
|
|
|
|
|
|
|
|
|||||||||||
| Income (loss) before income tax benefit |
$ | 3,215 | $ | 32,315 | $ | (13,194 | ) | $ | (60,858 | ) | ||||||||
|
|
|
|
|
|
|
|
|
|||||||||||
| Depreciation and Amortization |
||||||||||||||||||
| Wallboard |
$ | 17,943 | $ | 16,067 | $ | 35,091 | $ | 26,837 | ||||||||||
| Other |
586 | 819 | 1,240 | 1,217 | ||||||||||||||
|
|
|
|
|
|
|
|
|
|||||||||||
| Total depreciation and amortization |
$ | 18,529 | $ | 16,886 | $ | 36,331 | $ | 28,054 | ||||||||||
|
|
|
|
|
|
|
|
|
|||||||||||
Information concerning principal geographic areas is as follows (In thousands):
| Successor | Predecessor | Successor | ||||||||||||||||||
| July 26, 2013 to December 31, 2013 Net Sales |
January 1, 2013 to August 30, 2013 Net Sales |
December 31, 2013 Fixed Assets |
December 31, 2013 Total Assets |
|||||||||||||||||
| United States |
$ | 135,275 | $ | 221,995 | $ | 379,381 | $ | 714,495 | ||||||||||||
| Canada |
14,791 | 30,253 | 4,244 | 25,881 | ||||||||||||||||
| $ | 150,066 | $ | 252,248 | $ | 383,625 | $ | 740,376 | |||||||||||||
| As of and for the Years Ended December 31, | ||||||||||||||||||||||||
| 2012 (Predecessor) | 2011 (Predecessor) | |||||||||||||||||||||||
| Net Sales | Fixed Assets |
Total Assets |
Net Sales | Fixed Assets |
Total Assets |
|||||||||||||||||||
| United States |
$272,579 | $381,666 | $543,968 | $226,147 | $410,528 | $567,183 | ||||||||||||||||||
| Canada |
38,831 | 4,604 | 12,778 | 25,964 | 5,374 | 8,861 | ||||||||||||||||||
| $311,410 | $386,270 | $556,746 | $252,111 | $415,902 | $576,044 | |||||||||||||||||||
F-27
Table of Contents
15. Quarterly Data (unaudited)
The following table presents selected quarterly data for the Successor periods:
| Successor | ||||||||
| Period Ended July 26, 2013 to September 30, 2013 |
Three Months Ended December 31, 2013 |
|||||||
| (in thousands, except EPS and operating data) | ||||||||
| Net sales |
$ | 35,630 | $ | 114,436 | ||||
| Costs of goods sold |
31,537 | 89,798 | ||||||
| Selling and administrative |
6,200 | 8,753 | ||||||
| Operating income |
(2,107 | )(1) | 15,885 | |||||
| Net income (loss) |
(4,640 | ) | 6,745 | |||||
| Earnings per share—basic and diluted |
$ | (0.14 | ) | $ | 0.21 | |||
| Wallboard sales volume |
||||||||
| (million square feet) |
195 | 632 | ||||||
| Mill net sales price |
$ | 144 | $ | 143 | ||||
| Depreciation and amortization |
$ | 4,594 | $ | 13,935 | ||||
| (1) | Operating income for the period ended September 30, 2013 includes $2,075 of lease termination costs, $3,296 of acquisition closing costs, and inventory step-up impacting margin of $1,500. |
The following table presents selected quarterly data for the Predecessor periods:
| Predecessor | ||||||||||||
| Three Months Ended March 31, 2013 |
Three Months Ended June 30, 2013 |
July 1 2013 to August 30, 2013 |
||||||||||
| (in thousands, except operating data) | ||||||||||||
| Net sales |
$ | 83,450 | $ | 99,679 | $ | 69,119 | ||||||
| Costs of goods sold |
65,157 | 73,991 | 56,190 | |||||||||
| Selling and administrative |
8,340 | 8,486 | 7,457 | |||||||||
| Operating income |
9,953 | (1) | 17,202 | (2) | 5,472 | (3) | ||||||
| Net income |
9,797 | 16,676 | 5,712 | |||||||||
| Wallboard sales volume |
||||||||||||
| (million square feet) |
438 | 523 | 373 | |||||||||
| Mill net sales price |
$ | 147 | $ | 150 | $ | 145 | ||||||
| Depreciation and amortization |
$ | 6,242 | $ | 6,248 | $ | 4,396 | ||||||
| (1) | Operating income for the three months ended March 31, 2013 includes $2,858 of pension expense and $1,120 of expense related to the Master Brands Agreement with Lafarge S.A. |
| (2) | Operating income for the three months ended June 30, 2013 includes $2,817 for pension expense and $1,140 of expense related to the Master Brands Agreement with Lafarge S.A. |
| (3) | Operating income for the period July 1, 2013 to August 30, 2013 includes $1,961 for pension expense, $744 of expense related to the Master Brands Agreement with Lafarge S.A., lease termination costs of $2,556 for the Newark facility that was closed, and lease termination costs of $1,195 to discontinue the use of our co-generation power plant. |
F-28
Table of Contents
| Predecessor | ||||||||||||||||
| Three Months Ended March 31, 2012 |
Three Months Ended June 30, 2012 |
Three Months Ended September 30, 2012 |
Three Months Ended December 31, 2012 |
|||||||||||||
| (in thousands, except operating data) | ||||||||||||||||
| Net sales |
$ | 73,480 | $ | 68,729 | $ | 81,240 | $ | 87,961 | ||||||||
| Costs of goods sold |
66,902 | 76,769 | 69,804 | 76,461 | ||||||||||||
| Selling and administrative |
9,209 | 8,550 | 7,795 | 8,677 | ||||||||||||
| Operating income |
(2,631 | )(1) | (16,590 | )(2) | 3,641 | (3) | 2,823 | (4) | ||||||||
| Net income (loss) |
(2,819 | ) | (16,722 | ) | 3,705 | 2,994 | ||||||||||
| Wallboard sales volume |
||||||||||||||||
| (million square feet) |
451 | 415 | 500 | 537 | ||||||||||||
| Mill net sales price |
$ | 120 | $ | 125 | $ | 125 | $ | 126 | ||||||||
| Depreciation and amortization |
$ | 6,770 | $ | 16,715 | (5) | $ | 6,443 | $ | 6,403 | |||||||
| (1) | Operating income for the three months ended March 31, 2012 includes $2,647 of pension expense and $853 of expense related to the Master Brands Agreement with Lafarge S.A., and a special bonus of $460 |
| (2) | Operating income for the three months ended June 30, 2012 includes $2,647 for pension expense and $834 of expense related to the Master Brands Agreement with Lafarge S.A., a special bonus of $444, a spare parts write-off of $1,205, and accelerated depreciation for the closure of our Newark facility of $10,100. |
| (3) | Operating income for the three months ended September 30, 2012 includes $2,647 for pension expense, and $853 of expense related to the Master Brands Agreement with Lafarge S.A. |
| (4) | Operating income for the three months ended December 31, 2012 includes $3,985 for pension expense, and $1,062 of expense related to the Master Brands Agreement with Lafarge S.A. |
| (5) | Depreciation expense for the three months ended June 30, 2012 includes accelerated depreciation for the closure of our Newark facility of $10,100. |
16. Subsequent Events
On February 3, 2014, we effected a 32,304 for one stock split. This stock split has been retroactively applied to the Successor’s financial statements for the period July 26, 2013 to December 31, 2013.
On February 5, 2014, the Company completed its initial public offering of 11,765,000 shares at $14.00 per share and began trading on the New York Stock Exchange under the symbol CBPX. Net proceeds after underwriting discounts and commissions were approximately $154 million. Net proceeds were used to pay a $2 million one-time payment to Lone Star in consideration for the termination of our asset advisory agreement with affiliates of Lone Star as further described in Note 11 under “Related Party Transactions”. The remaining net proceeds and available cash on hand were used to fully repay the $155 million Second Lien Term Loan along with a prepayment premium of $3.1 million.
In conjunction with this offering, we granted approximately 142,000 stock options and 75,000 restricted shares to employees at the initial offering price of $14.00 per share.
On March 13, 2014, Lafarge assigned its interest in the Seven Hills joint venture and the joint venture agreement and the other operative agreements to the Company under the same terms and conditions as existed prior to the Acquisition. We currently purchase substantially all of our paperboard liner from the Seven Hills joint venture.
F-29
Table of Contents
CONTINENTAL BUILDING PRODUCTS, INC.
CONSOLIDATED (SUCCESSOR) / COMBINED (PREDECESSOR) STATEMENTS OF OPERATIONS
(dollars in thousands, except per share data)
(Unaudited)
| Successor | Successor | Predecessor | ||||||||||
| Nine Months Ended September 30, 2014 |
July 26 - September 30, 2013 |
January 1 - August 30, 2013 |
||||||||||
| Net Sales |
$ | 303,692 | $ | 35,630 | $ | 252,248 | ||||||
| Costs, expenses and other income: |
||||||||||||
| Cost of goods sold |
241,042 | 31,537 | 195,338 | |||||||||
| Selling and administrative: |
||||||||||||
| Direct |
23,358 | 6,200 | 19,338 | |||||||||
| Allocated from Lafarge |
— | — | 4,945 | |||||||||
|
|
|
|
|
|
|
|||||||
| Total selling and administrative |
23,358 | 6,200 | 24,283 | |||||||||
|
|
|
|
|
|
|
|||||||
| Total costs and operating expenses |
264,400 | 37,737 | 219,621 | |||||||||
|
|
|
|
|
|
|
|||||||
| Operating income (loss) |
39,292 | (2,107 | ) | 32,627 | ||||||||
| Other (expense) income, net |
(5,461 | ) | 85 | (191 | ) | |||||||
| Interest expense, net |
(24,518 | ) | (2,364 | ) | (91 | ) | ||||||
|
|
|
|
|
|
|
|||||||
| Income (loss) before earnings (losses) on equity method investment and income tax |
9,313 | (4,386 | ) | 32,345 | ||||||||
| Earnings (losses) from equity method investment |
(257 | ) | — | (30 | ) | |||||||
|
|
|
|
|
|
|
|||||||
| Income (loss) before income tax |
9,056 | (4,386 | ) | 32,315 | ||||||||
| Income tax (expense) benefit |
(3,526 | ) | (254 | ) | (130 | ) | ||||||
|
|
|
|
|
|
|
|||||||
| Net income (loss) |
$ | 5,530 | $ | (4,640 | ) | $ | 32,185 | |||||
|
|
|
|
|
|
|
|||||||
| Net income (loss) per share: |
||||||||||||
| Basic |
$ | 0.13 | $ | (0.14 | ) | |||||||
| Diluted |
$ | 0.13 | $ | (0.14 | ) | |||||||
| Weighted average shares outstanding: |
||||||||||||
| Basic |
42,560,667 | 32,304,000 | ||||||||||
| Diluted |
42,568,885 | 32,304,000 | ||||||||||
See accompanying notes to unaudited financial statements.
F-30
Table of Contents
CONTINENTAL BUILDING PRODUCTS, INC.
CONSOLIDATED (SUCCESSOR) / COMBINED (PREDECESSOR) STATEMENTS OF
COMPREHENSIVE INCOME (LOSS)
(dollars in thousands)
(Unaudited)
| Successor | Successor | Predecessor | ||||||||||
| Nine Months Ended September 30, 2014 |
July 26 - September 30, 2013 |
January 1 - August 30, 2013 |
||||||||||
| Net income (loss) |
$ | 5,530 | $ | (4,640 | ) | $ | 32,185 | |||||
| Foreign currency translation adjustment |
(1,079 | ) | 266 | 2,707 | ||||||||
| Gain (loss) on derivatives qualifying as cash flow hedges |
56 | — | — | |||||||||
| Less: Reclassification adjustment for gain (loss) on derivatives included in net income |
— | — | — | |||||||||
|
|
|
|
|
|
|
|||||||
| Comprehensive income (loss) |
$ | 4,507 | $ | (4,374 | ) | $ | 34,892 | |||||
|
|
|
|
|
|
|
|||||||
See accompanying notes to unaudited financial statements.
F-31
Table of Contents
CONTINENTAL BUILDING PRODUCTS, INC.
CONSOLIDATED BALANCE SHEETS
(dollars in thousands)
| As of September 30, 2014 (unaudited) |
As of December 31, 2013 |
|||||||
| Assets |
||||||||
| Cash |
$ | 12,156 | $ | 11,822 | ||||
| Receivables, net |
39,512 | 32,328 | ||||||
| Inventories |
34,737 | 28,120 | ||||||
| Prepaid and other current assets |
9,888 | 4,523 | ||||||
| Deferred taxes, current |
5,589 | 2,137 | ||||||
|
|
|
|
|
|||||
| Total current assets |
101,882 | 78,930 | ||||||
| Property, plant and equipment, net |
359,883 | 383,625 | ||||||
| Customer relationships and other intangibles, net |
114,480 | 126,126 | ||||||
| Goodwill |
119,945 | 119,945 | ||||||
| Equity method investment |
10,989 | — | ||||||
| Financial interest in Seven Hills |
— | 13,000 | ||||||
| Debt issuance costs |
9,330 | 17,800 | ||||||
| Deferred taxes, non-current |
83 | 950 | ||||||
|
|
|
|
|
|||||
| Total Assets |
$ | 716,592 | $ | 740,376 | ||||
|
|
|
|
|
|||||
| Liabilities and Equity |
||||||||
| Accounts payable |
29,865 | $ | 28,126 | |||||
| Accrued and other liabilities |
9,088 | 11,325 | ||||||
| Notes payable, current portion |
— | 4,150 | ||||||
|
|
|
|
|
|||||
| Total current liabilities |
38,953 | 43,601 | ||||||
| Other long-term liabilities |
9,589 | — | ||||||
| Notes payable, non-current portion |
373,967 | 559,924 | ||||||
|
|
|
|
|
|||||
| Total liabilities |
422,509 | 603,525 | ||||||
|
|
|
|
|
|||||
| Equity |
||||||||
| Common stock |
44 | 32 | ||||||
| Additional paid-in capital |
287,681 | 134,968 | ||||||
| Accumulated other comprehensive loss |
(1,277 | ) | (254 | ) | ||||
| Accumulated earnings |
7,635 | 2,105 | ||||||
|
|
|
|
|
|||||
| Total equity |
294,083 | 136,851 | ||||||
|
|
|
|
|
|||||
| Total liabilities and equity |
$ | 716,592 | $ | 740,376 | ||||
|
|
|
|
|
|||||
See accompanying notes to unaudited financial statements.
F-32
Table of Contents
CONTINENTAL BUILDING PRODUCTS, INC.
CONSOLIDATED (SUCCESSOR) / COMBINED (PREDECESSOR) STATEMENTS OF CASH FLOWS
(dollars in thousands)
(Unaudited)
| Successor | Successor | Predecessor | ||||||||||||
| Nine Months Ended September 30, 2014 |
July 26 - September 30, 2013 |
January 1 - August 30, 2013 |
||||||||||||
| Cash flows from operating activities: |
||||||||||||||
| Net income (loss) |
$ | 5,530 | $ | (4,640 | ) | $ | 32,185 | |||||||
| Adjustments to reconcile net income (loss) to net cash provided by operating activities: |
||||||||||||||
| Depreciation and amortization |
41,324 | 4,594 | 16,886 | |||||||||||
| Amortization of debt issuance costs and debt discount |
8,560 | 191 | — | |||||||||||
| Loss (gain) on disposal of property, plant and equipment |
— | — | 1,115 | |||||||||||
| Loss from equity method investment |
257 | — | 30 | |||||||||||
| Share based compensation |
344 | — | — | |||||||||||
| Deferred taxes |
6,619 | 254 | 182 | |||||||||||
| Change in assets and liabilities: |
||||||||||||||
| Receivables |
(7,202 | ) | (4,396 | ) | (8,655 | ) | ||||||||
| Inventories |
(6,731 | ) | 2,294 | (5,827 | ) | |||||||||
| Prepaid expenses and other current assets |
(3,616 | ) | (2,157 | ) | (1,783 | ) | ||||||||
| Other long-term assets |
— | — | 429 | |||||||||||
| Accounts payable |
1,394 | 1,042 | (5,738 | ) | ||||||||||
| Accrued and other current liabilities |
(1,154 | ) | 4,806 | (3,996 | ) | |||||||||
| Other long term liabilities |
383 | — | (126 | ) | ||||||||||
|
|
|
|
|
|
|
|||||||||
| Net cash provided by operating activities |
45,708 | 1,988 | 24,702 | |||||||||||
| Cash flows from investing activities: |
||||||||||||||
| Capital expenditures |
(6,090 | ) | (43 | ) | (2,506 | ) | ||||||||
| Acquisition of predecessor |
— | (700,082 | ) | — | ||||||||||
| Capital contributions to equity method investment |
— | — | (66 | ) | ||||||||||
| Distributions from equity method investment |
1,754 | — | 552 | |||||||||||
|
|
|
|
|
|
|
|||||||||
| Net cash used in investing activities |
(4,336 | ) | (700,125 | ) | (2,020 | ) | ||||||||
| Cash flows from financing activities: |
||||||||||||||
| Capital contribution (distribution) from (to) Lafarge NA, net |
— | — | (22,682 | ) | ||||||||||
| Capital contribution from Lone Star Funds |
— | 265,000 | — | |||||||||||
| Net proceeds from issuance of common stock |
151,354 | 436,700 | — | |||||||||||
| Principal payments for First Lien Credit Agreement |
(36,975 | ) | — | — | ||||||||||
| Repayment of Second Lien Credit Agreement |
(155,000 | ) | — | — | ||||||||||
| Proceeds from revolving credit facility, net |
— | 28,500 | — | |||||||||||
| Debt issuance costs |
— | (15,289 | ) | — | ||||||||||
|
|
|
|
|
|
|
|||||||||
| Net cash (used in) provided by financing activities |
(40,621 | ) | 714,911 | (22,682 | ) | |||||||||
|
|
|
|
|
|
|
|||||||||
| Effect of foreign exchange rates on cash and cash equivalents |
(417 | ) | (14 | ) | — | |||||||||
| Net change in cash and cash equivalents |
334 | 16,760 | — | |||||||||||
| Cash, beginning of period |
11,822 | — | — | |||||||||||
|
|
|
|
|
|
|
|||||||||
| Cash, end of period |
$ | 12,156 | $ | 16,760 | $ | — | ||||||||
|
|
|
|
|
|
|
|||||||||
See accompanying notes to unaudited financial statements.
F-33
Table of Contents
CONTINENTAL BUILDING PRODUCTS, INC.
CONSOLIDATED (SUCCESSOR) / COMBINED (PREDECESSOR)
NOTES TO THE UNAUDITED FINANCIAL STATEMENTS
FOR THE NINE MONTHS ENDED SEPTEMBER 30, 2014 (SUCCESSOR) AND
FOR THE PERIODS JULY 26, 2013 TO SEPTEMBER 30, 2013 (SUCCESSOR),
AND JANUARY 1, 2013 TO AUGUST 30, 2013 (PREDECESSOR)
1. Background and Nature of Operations
Description of Business
Continental Building Products, Inc. (“CBP”, the “Company”, or the “Successor”) is a Delaware corporation. Prior to the acquisition of the gypsum division of Lafarge North America Inc. (“Lafarge N.A.”) on August 30, 2013, further described below, CBP had no operating activity. The accompanying consolidated financial statements of CBP for the nine months ended September 30, 2014 and for the period July 26, 2013 to September 30, 2013 contain activity of the acquired business (the Successor) and the combined financial statements for the period January 1, 2013 to August 30, 2013 include the historical accounts of the gypsum division of Lafarge N.A. (the “Predecessor”).
The Company manufactures gypsum wallboard and related products for commercial and residential buildings and houses. The Company operates a network of three highly efficient wallboard facilities, all located in the eastern United States and produces joint compound at one plant in the United States and at another plant in Canada.
The Acquisition
On June 24, 2013, Lone Star Funds (“Lone Star”) entered into a definitive agreement with Lafarge N.A. to purchase the assets of its North American gypsum division for a total purchase price of approximately $703.1 million (the “Acquisition”) in cash. The closing of the Acquisition occurred on August 30, 2013.
Initial Public Offering
On February 10, 2014, the Company completed the initial public offering of 11,765,000 shares of its common stock at an offering price of $14.00 per share (the “Initial Public Offering). Net proceeds from the Initial Public Offering after underwriting discounts and commissions, but before other closing costs, were approximately $154 million. The net proceeds were used to pay a $2 million one-time payment to Lone Star in consideration for the termination of the Company’s asset advisory agreement with affiliates of Lone Star (See Note 10, Related Party Transactions). The remaining $152 million of net proceeds and cash on hand of $6.1 million were used to repay the $155 million Second Lien Term Loan in full along with a prepayment premium of $3.1 million (See Note 13, Debt). In expectation of the Initial Public Offering, on February 3, 2014, the Company effected a 32,304 for one stock split of its common stock. The Company’s common stock trades on the New York Stock Exchange under the symbol “CBPX”.
2. Significant Accounting Policies
Basis of Presentation—Successor
The accompanying consolidated financial statements for CBP have been prepared in accordance with accounting principles generally accepted in the United States (U.S. GAAP). The consolidated financial statements include the accounts of the Company and its wholly-owned subsidiaries. All intercompany transactions have been eliminated.
F-34
Table of Contents
The Company’s financial statements reflect the Acquisition which was accounted for as a business combination. The following table summarizes the finalized fair values of the assets acquired and liabilities assumed at the Acquisition date.
| (in thousands) | ||||
| Total current assets |
$ | 70,371 | ||
| Property, plant and equipment |
392,809 | |||
| Financial interest in Seven Hills JV |
13,000 | |||
| Trademarks |
15,000 | |||
| Customer Relationships |
118,000 | |||
| Goodwill |
119,945 | |||
| Total current liabilities |
(25,984 | ) | ||
|
|
|
|||
| Total purchase price |
$ | 703,141 | ||
|
|
|
|||
The fair value of accounts receivable acquired was $31.9 million (included in total current assets above), with the gross contractual amount being $33.3 million. The Company expects $1.4 million to be uncollectible. The total purchase price remained the same as the one previously provided for the year-ended December 31, 2013.
There were no loss contingencies identified as part of the Acquisition.
The goodwill recognized is attributable primarily to expected synergies and the assembled workforce of the Company. These come from the synergies that are obtained in operating the plants as part of a network, versus individually, and from an experienced employee base skilled at managing a process-driven manufacturing environment. The goodwill recognized is deductible for income tax purposes.
Basis of Presentation—Predecessor
The accompanying combined financial statements for the Predecessor have been prepared in accordance with U.S. GAAP.
The Predecessor financial statements have been derived from the consolidated financial statements and accounting records of Lafarge N.A. using the historical results of operations and historical cost basis of the assets and liabilities of Lafarge N.A. that comprise the business acquired. These Predecessor financial statements have been prepared to demonstrate the historical results of operations, financial position, and cash flows for the indicated periods under Lafarge N.A.’s management that were acquired by CBP. All intercompany balances and transactions have been eliminated. Transactions and balances between the Predecessor and Lafarge N.A. and its subsidiaries are reflected as related party transactions within these financial statements.
The accompanying Predecessor combined financial statements include the assets, liabilities, revenues and expenses that are specifically identifiable to the acquired business and reflect all costs of doing business related to their operations, including expenses incurred by other entities on the Predecessor’s behalf. In addition, certain costs related to the Predecessor have been allocated from Lafarge N.A. Those allocations are derived from multiple levels of the organization including shared corporate expenses from Lafarge N.A. and fees from Lafarge N.A.’s parent company related to certain service and support functions. The costs associated with these services and support functions (indirect costs) have been allocated to the Predecessor using the most meaningful respective allocation methodologies which were primarily based on proportionate revenue, proportionate headcount, or proportionate direct labor costs compared to Lafarge N.A. and/or its subsidiaries. These allocated costs are primarily related to corporate administrative expenses, employee-related costs including pensions and other benefits for corporate and shared employees, and rental and usage fees for shared assets for the following functional groups: information technology, legal services, accounting and finance services, human resources,
F-35
Table of Contents
marketing and contract support, customer support, treasury, facility and other corporate and infrastructural services. Income taxes have been accounted for in the Predecessor financial statements on a separate return basis as described in Note 8, Income Taxes.
The Predecessor utilized Lafarge N.A.’s centralized processes and systems for cash management, payroll, and purchasing. As a result, all cash received by the Predecessor was deposited in and commingled with Lafarge N.A.’s general corporate funds and was not specifically allocated to the Predecessor. The net results of these cash transactions between the Predecessor and Lafarge N.A. are reflected within “Net capital contributions to Lafarge N.A.” in the accompanying Combined Statements of Cash Flows.
Management believes the assumptions and allocations underlying the Predecessor combined financial statements are reasonable and appropriate under the circumstances. The expenses and cost allocations have been determined on a basis considered by Lafarge N.A. to be a reasonable reflection of the utilization of services provided to or the benefit received by the Predecessor during the periods presented relative to the total costs incurred by Lafarge N.A. However, the amounts recorded for these transactions and allocations are not necessarily representative of the amount that would have been reflected in the financial statements had the Predecessor been an entity that operated independently of Lafarge N.A. Consequently, future results of operations after the Predecessor’s separation from Lafarge N.A. have included and will include costs and expenses incurred by the Company that may be materially different than the Predecessor’s historical results of operations. Accordingly, the financial statements for these periods under the Predecessor are not indicative of the Company’s future results of operations, financial position and cash flows.
Basis of Presentation for Interim Periods
Certain information and footnote disclosures normally included for the annual financial statements prepared in accordance with U.S. GAAP have been condensed or omitted for the interim periods presented. Management believes that the unaudited interim financial statements include all adjustments (which are normal and recurring in nature) necessary to present fairly the financial position of CBP and the Predecessor and results of operations and cash flows for the periods presented.
The results of operations for the periods presented are not necessarily indicative of the results that may be expected for the year ending December 31, 2014. Seasonal changes and other conditions can affect the sales volumes of the Company’s products. Therefore, the financial results for any interim period do not necessarily indicate the expected results for the year.
The financial statements should be read in conjunction with CBP’s audited consolidated financial statements and the notes thereto for the year ended December 31, 2013 included in CBP’s Annual Report on Form 10-K for the fiscal year then-ended. The Company has continued to follow the accounting policies set forth in those financial statements.
F-36
Table of Contents
Earnings (Loss) Per Share
Basic earnings and loss per share are based on the weighted average number of shares of common stock outstanding assuming the 32,304 for one stock split occurred as of January 1, 2014 and the issuance of 11,765,000 new shares on February 10, 2014 in connection with the Initial Public Offering. Diluted earnings and loss per share are based on the weighted average number of shares outstanding plus the dilutive effect, if any, of outstanding restricted stock and stock options.
| Earnings (Loss) Per Share |
||||||||
| (in thousands, except per share data) | Nine Months Ended September 30, 2014 |
July 26 - September 30, 2013 |
||||||
| Net income (loss) |
$ | 5,530 | $ | (4,640 | ) | |||
| Average number of common shares |
42,561 | 32,304 | ||||||
| Dilutive restricted stock and stock options |
8 | — | ||||||
|
|
|
|
|
|||||
| Average diluted common shares |
42,569 | 32,304 | ||||||
| Basic earnings (loss) per average common share |
$ | 0.13 | $ | (0.14 | ) | |||
| Diluted earnings (loss) per average common share |
$ | 0.13 | $ | (0.14 | ) | |||
Recent Accounting Pronouncements
In May 2014, the Financial Accounting Standards Board (the “FASB”) issued Accounting Standards Update (“ASU”) 2014-09, which provides accounting guidance for all revenue arising from contracts with customers and affects all entities that enter into contracts to provide goods or services to their customers. ASU 2014-09 will be effective for the Company in the first quarter of 2017 and requires retroactive application on either a full or modified basis. Early application is not permitted. The Company is currently evaluating ASU 2014-09 to determine its impact on its consolidated financial statements and disclosures.
3. Receivables
Receivables consist of the following:
| (in thousands) | As of September 30, 2014 |
As of December 31, 2013 |
||||||
| Trade receivables |
$ | 41,393 | $ | 34,065 | ||||
| Total Allowances |
(1,881 | ) | (1,737 | ) | ||||
|
|
|
|
|
|||||
| Total receivables, net |
$ | 39,512 | $ | 32,328 | ||||
|
|
|
|
|
|||||
Trade receivables are recorded net of credit memos issued during the normal course of business.
4. Inventories
Inventories consist of the following:
| (in thousands) | As of September 30, 2014 |
As of December 31, 2013 |
||||||
| Finished Products |
$ | 8,128 | $ | 3,841 | ||||
| Raw Materials |
18,587 | 16,505 | ||||||
| Supplies and other |
8,022 | 7,774 | ||||||
|
|
|
|
|
|||||
| Total Inventories |
$ | 34,737 | $ | 28,120 | ||||
|
|
|
|
|
|||||
F-37
Table of Contents
5. Property, Plant and Equipment
Property, plant and equipment consist of the following:
| (in thousands) | As of September 30, 2014 |
As of December 31, 2013 |
||||||
| Land |
$ | 12,931 | $ | 12,933 | ||||
| Buildings |
109,755 | 108,737 | ||||||
| Plant machinery |
267,668 | 267,146 | ||||||
| Mobile equipment |
2,990 | 2,990 | ||||||
| Construction in progress |
4,705 | 3,554 | ||||||
|
|
|
|
|
|||||
| Property, plant and equipment, at cost |
398,049 | 395,360 | ||||||
| Accumulated depreciation |
(38,166 | ) | (11,735 | ) | ||||
|
|
|
|
|
|||||
| Total property, plant and equipment, net |
$ | 359,883 | $ | 383,625 | ||||
|
|
|
|
|
|||||
Depreciation expense was $26.4 million for the nine months ended September 30, 2014 (Successor), $2.8 million for the period July 26, 2013 to September 30, 2013 (Successor), and $16.1 million for the period January 1, 2013 to August 30, 2013 (Predecessor).
6. Software and Other Intangibles
Customer relationships and other intangibles consist of the following:
| (in thousands) | As of September 30, 2014 |
As of December 31, 2013 |
||||||
| Customer relationships |
$ | 117,540 | $ | 117,919 | ||||
| Purchased and internally developed Software |
3,618 | 11 | ||||||
| Trademarks |
14,943 | 14,990 | ||||||
|
|
|
|
|
|||||
| Customer relationships and other intangibles, at cost |
136,101 | 132,920 | ||||||
| Accumulated amortization |
(21,621 | ) | (6,794 | ) | ||||
|
|
|
|
|
|||||
| Customer relationshipes and other intangibles, net |
$ | 114,480 | $ | 126,126 | ||||
|
|
|
|
|
|||||
Amortization expense was $14.9 million for the nine months ended September 30, 2014 (Successor), $1.8 million for the period July 26, 2013 to September 30, 2013 (Successor), and $0.8 million for the period January 1, 2013 to August 30, 2013 (Predecessor).
Amortization of customer relationships is done over a 15-year period using an accelerated method that reflects the expected future cash flows from the acquired customer-related intangible asset. Trademarks are amortized on a straight-line basis over the estimated useful life of 15 years.
Amortization expense related to capitalized software was $0.01 million for the nine months ended September 30, 2014 (Successor), and $0.3 million for the period January 1, 2013 to August 30, 2013 (Predecessor). CBP did not acquire capitalized software as part of the Acquisition, and capitalized approximately $3.5 million for the nine months ended September 30, 2014 (Successor) related to internal-use software costs for a new enterprise resource planning (“ERP”) system. In addition, CBP capitalized $0.1 million for the development of a new website. Subsequent to the end of the quarter, in October 2014, the new ERP system was placed in service and amortization of the software development costs began over a three-year useful life with the expense to be recorded in selling and administrative expense.
F-38
Table of Contents
7. Accrued and Other Liabilities
Accrued and other liabilities consist of the following:
| (in thousands) | As of September 30, 2014 |
As of December 31, 2013 |
||||||
| Vacation and other employee-related costs |
5,877 | $ | 2,948 | |||||
| VAT taxes |
1,366 | 942 | ||||||
| Income taxes |
— | 4,197 | ||||||
| Other |
1,845 | 3,238 | ||||||
|
|
|
|
|
|||||
| Total accrued and other liabilities |
$ | 9,088 | $ | 11,325 | ||||
|
|
|
|
|
|||||
8. Income Taxes
The Predecessor’s operations were included in Lafarge N.A.’s combined U.S. Federal and state income tax returns. In addition, the Canadian Predecessor operations were included in Lafarge N.A.’s Canadian Federal and provincial income tax returns. The provisions for income taxes in the Predecessor financial statements have been determined on a separate return basis as if the Company filed its own tax returns. The income tax benefits related to net operating losses that have been utilized by Lafarge N.A. are reflected in the Predecessor financial statements as a distribution to Lafarge N.A. Management considered and weighed the available evidence, both positive and negative, to determine whether it is more-likely-than-not that some portion, or all, of the Predecessor’s deferred tax assets will not be realized. Given the losses of the Predecessor in the years prior to the Acquisition, the Predecessor established a valuation allowance relating to a portion of the deferred tax assets in the Predecessor financial statements. None of the net operating loss carry-forward carried forward to CBP as of the Acquisition date. The Company has not recorded a valuation allowance at September 30, 2014, as management concluded realization of the deferred tax assets was more likely than not. The Company’s projected estimated effective tax rate for the 2014 calendar year is approximately 38% and for the nine months ended September 30, 2014 the Company recognized in income tax expense approximately $0.1 million of unfavorable discrete tax items. In the third quarter of 2014, the Company recognized in additional paid-in capital approximately $1.0 million for a favorable discrete tax item associated with Initial Public Offering costs.
The Company is subject to audit examinations at federal, state and local levels by tax authorities in those jurisdictions. In addition, the Canadian operations are subject to audit examinations at federal and provincial levels by tax authorities in those jurisdictions. The tax matters challenged by the tax authorities are typically complex; therefore, the ultimate outcome of these challenges is subject to uncertainty. The Company has not identified any issues that did not meet the recognition threshold or would be impacted by the measurement provisions of the uncertain tax position guidance.
9. Commitments and Contingencies
The Company leases certain buildings and equipment. The Company’s facility and equipment leases may provide for escalations of rent or rent abatements and payment of pro rata portions of building operating expenses. Minimum lease payments are recognized on a straight-line basis over the minimum lease term. During the nine months ended September 30, 2014 (Successor), the period July 26, 2013 to September 30, 2013 (Successor) and the period January 1, 2013 to August 30, 2013 (Predecessor), total expenses under operating leases were $3.6 million, $0.4 million, and $7.8 million, respectively. The Company also has noncapital purchase commitments that primarily relate to gas, gypsum, paper and other raw materials.
F-39
Table of Contents
The table below shows the future minimum lease payments due under non-cancelable operating leases and purchase commitments at September 30, 2014 (in thousands):
| Total | Remaining 2014 |
2015 | 2016 | 2017 | 2018 | After 2018 |
||||||||||||||||||||||
| Operating Leases(1) |
$ | 5,668 | $ | 293 | $ | 1,425 | $ | 975 | $ | 865 | $ | 616 | $ | 1,494 | ||||||||||||||
| Purchase Commitments |
166,840 | 10,686 | 30,657 | 28,817 | 18,997 | 16,044 | 61,639 | |||||||||||||||||||||
|
|
|
|
|
|
|
|
|
|
|
|
|
|
|
|||||||||||||||
| Total Commitments |
$ | 172,508 | $ | 10,979 | $ | 32,082 | $ | 29,792 | $ | 19,862 | $ | 16,660 | $ | 63,133 | ||||||||||||||
|
|
|
|
|
|
|
|
|
|
|
|
|
|
|
|||||||||||||||
| (1) | Future minimum lease payments over the non-cancelable lease terms of the operating leases. |
Under certain circumstances, the Company provides letters of credit related to its natural gas and other supply purchases. At September 30, 2014 and December 31, 2013 the Company had outstanding letters of credit of approximately $3.9 million and $2.4 million, respectively.
In the ordinary course of business, the Company executes contracts involving indemnifications standard in the industry. These indemnifications might include claims relating to any of the following: environmental and tax matters; intellectual property rights; governmental regulations and employment-related matters; customer, supplier, and other commercial contractual relationships; and financial matters. While the maximum amount to which the Company may be exposed under such agreements cannot be estimated, it is the opinion of management that these guarantees and indemnifications are not expected to have a materially adverse effect on the Company’s financial condition, results of operations or liquidity.
In the ordinary course of business, the Company is involved in certain legal actions and claims, including proceedings under laws and regulations relating to environmental and other matters. Because such matters are subject to many uncertainties and the outcomes are not predictable with assurance, the total liability for these legal actions and claims cannot be determined with certainty. When the Company determines that it is probable that a liability for environmental matters, legal actions or other contingencies has been incurred and the amount of the loss is reasonably estimable, an estimate of the costs to be incurred is recorded as a liability in the financial statements. As of September 30, 2014 and December 31, 2013, such liabilities were not material to the Company’s financial statements. While management believes its accruals for such liabilities are adequate, the Company may incur costs in excess of the amounts provided. Although the ultimate amount of liability that may result from these matters or actions is not ascertainable, the Company believes that any amounts exceeding the recorded accruals will not materially affect its financial condition.
Following the Acquisition, the Company’s sole membership interest holder, LSF8 Gypsum Holdings, L.P., an affiliate of Lone Star and the Company’s current majority stockholder, implemented a cash-based long term incentive plan (the “LTIP”), in which participants have the potential to earn a cash payout upon a monetization event (as defined in the LTIP). Potential monetization events include the sale of the Company, a public offering where the sponsor reduces its interest to below 50% or at the sponsor’s discretion, or through certain cash distributions as defined in the LTIP. At September 30, 2014, no such monetization events had occurred, and therefore no amounts were accrued in the accompanying balance sheet as of September 30, 2014.
10. Related Party Transactions
Allocated Expenses
The Predecessor has been allocated selling and administrative expenses from Lafarge N.A. of $4.9 million for the period January 1, 2013 to August 30, 2013. These costs from Lafarge N.A. had been derived from multiple levels of the organization including shared corporate expenses and fees from the parent of Lafarge N.A. These allocated costs were primarily related to corporate administrative expenses and reorganization costs, employee-related costs including pensions and other benefits for corporate and shared employees, and rental and
F-40
Table of Contents
usage fees for shared assets for the following functional groups: information technology, legal services, accounting and finance services, human resources, marketing and contract support, customer support, treasury, facility and other corporate and infrastructural services. The costs associated with these services and support functions (indirect costs) have been allocated to the Predecessor using the most meaningful respective allocation methodologies which were primarily based on proportionate revenue, proportionate headcount or proportionate direct labor costs of the Predecessor compared to Lafarge N.A. and/or its subsidiaries.
In addition to the allocated selling and administrative expenses noted above, the Predecessor recorded approximately $7.6 million for the period January 1, 2013 to August 30, 2013, in pension and other post-retirement benefits expense related to its employees, which has been reflected within “Costs of goods sold” and “Selling and administrative” in the accompanying Combined Statements of Operations of the Predecessor. The Predecessor’s salaried employees and union hourly employees participated in defined benefit pension plans sponsored by Lafarge N.A. These plans include other Lafarge N.A. employees that are not employees of the Predecessor. Lafarge N.A. also provides certain retiree health and life insurance benefits to eligible employees who have retired from the Predecessor. Salaried participants generally become eligible for retiree health care benefits when they retire from active service at age 55 or later. Benefits, eligibility and cost-sharing provisions for hourly employees vary by location and/or bargaining unit. Generally, the health care plans pay a stated percentage of most medical and dental expenses reduced for any deductible, copayment and payments made by government programs and other group coverage. The related pension and post-retirement benefit liability has not been allocated to the Predecessor and has not been presented in the accompanying Predecessor balance sheet since the obligation remained a liability of Lafarge N.A. The Successor does not have any defined benefit pension or postretirement benefit plans in place.
Management believes the assumptions and allocations underlying the combined Predecessor financial statements are reasonable and appropriate under the circumstances. The expenses and cost allocations have been determined on a basis considered by Lafarge N.A. to be a reasonable reflection of the utilization of services provided to or the benefit received by the Predecessor during the periods presented relative to the total costs incurred by Lafarge N.A. However, the amounts recorded for these transactions and allocations are not necessarily representative of the amount that would have been reflected in the financial statements had the Predecessor been an entity that operated independently of Lafarge N.A. Consequently, results of operations after the Predecessor’s separation from Lafarge N.A. have included and will include costs and expenses that may be materially different than the Predecessor’s historical results of operations. Accordingly, the financial statements for these periods are not indicative of the future results of operations, financial position and cash flows.
Other
Since the Acquisition, the Company is no longer part of the Lafarge N.A. organization but does have a Transition Services Agreement to help with certain ongoing back-office functions. These functions include, among others, accounting, treasury, tax, and information technology services. Starting in September 2013, the Company paid Lafarge N.A. a fee for these services of $119,000 per month that escalated to $129,700 per month in 2014. Most of these services are available through February 2015, but can be discontinued early by the Company. By the end of November 2014, CBP will have terminated the remaining services with Lafarge N.A.
On August 30, 2013, the Company entered into an advisory agreement with an affiliate of Lone Star to provide certain management oversight services to the Company, including assistance and advice on strategic plans, obtaining and maintaining certain legal documents, and communicating and coordinating with service providers. The Company paid 110% of actual costs for the services provided and as of December 31, 2013, the Company owed $0.2 million under this agreement. The agreement was terminated upon the closing of the Initial Public Offering and in connection therewith, the Company paid a termination fee of $2.0 million that is included in non-operating expense.
F-41
Table of Contents
11. Investment in Seven Hills
The Predecessor was a party with an unaffiliated third-party to a paperboard liner venture named Seven Hills Paperboard, LLC (“Seven Hills”). This venture provided the Predecessor with a continuous supply of high-quality recycled paperboard liner to meet its ongoing production requirements. For the Predecessor financial statements, management evaluated the characteristics of its investment in Seven Hills and concluded that Seven Hills would be deemed a variable interest entity (“VIE”) as there was not sufficient equity at risk in Seven Hills. Management also considered certain characteristics related to control and the power to direct the activities of Seven Hills that most significantly impact Seven Hills’ economic performance, including the significant decisions made by the Managing Board and the involvement of the other investor in managing the day-to-day activities. Management concluded the Predecessor was not the primary beneficiary. Accordingly, the Predecessor accounted for its investment in Seven Hills under the equity method of accounting.
From the closing of the Acquisition through March 13, 2014, the venture equity ownership remained with Lafarge N.A., although many of the rights and obligations and underlying economics were contractually transferred to the Company in connection with the Acquisition. Based on the allocation of the purchase price paid in the Acquisition, $13.0 million related to the financial interest in the Seven Hills venture has been recorded and represents the fair value of the rights retained by the Company after the Acquisition. In the Successor financial statements, the Company elected the option to account for this financial interest at fair value with changes in fair value reflected in earnings during the period in which they occur. The Company elected to measure this financial interest at fair value, as permitted under FASB Accounting Standards Codification (“ASC”) 825, Financial Instruments, to better reflect the expected future benefit of the acquired financial interest.
On March 13, 2014, Lafarge N.A. assigned its interest in the joint venture and the joint venture agreement and the other operative agreements to the Company under the same terms and conditions as existed prior to the Acquisition. As such, at this date of transfer the Company measured the investment at fair value and began accounting for this investment in Seven Hills under the equity method of accounting.
Paperboard purchased from Seven Hills was $37.3 million, $4.4 million, and $33.1 million for the nine months ended September 30, 2014 (Successor), the period July 26, 2013 to September 30, 2013 (Successor), and the period January 1, 2013 to August 30, 2013 (Predecessor), respectively. The Company also has certain paper purchase commitments to Seven Hills totaling $33.0 million through 2017.
12. Fair Value Measurements
U.S. GAAP provides a framework for measuring fair value, establishes a fair value hierarchy of the valuation techniques used to measure the fair value and requires certain disclosures relating to fair value measurements. Fair value is defined as the price that would be received to sell an asset or paid to transfer a liability in an orderly transaction between market participants in a market with sufficient activity.
The three-tier fair value hierarchy which prioritizes the inputs used in measuring fair value is as follows:
| • | Level 1—Observable inputs such as quoted prices (unadjusted) in active markets for identical assets or liabilities that a Company has the ability to access; |
| • | Level 2—Inputs, other than the quoted market prices included in Level 1, which are observable for the asset or liability, either directly or indirectly; and |
| • | Level 3—Unobservable inputs for the asset or liability which is typically based on an entity’s own assumptions when there is little, if any, related market data available. |
The Company evaluates assets and liabilities subject to fair value measurements on a recurring and non-recurring basis to determine the appropriate level to classify them for each reporting period. This determination requires significant judgments to be made by the Company. The fair values of receivables, accounts payable, accrued costs and other current liabilities approximate the carrying values as a result of the short-term nature of these instruments.
F-42
Table of Contents
The Company estimates the fair value of its debt by discounting the future cash flows of each instrument using estimated market rates of debt instruments with similar maturities and credit profiles. These inputs are classified as Level 3 within the fair value hierarchy. As of December 31, 2013 and September 30, 2014, the carrying value reported in the consolidated balance sheet for the Company’s notes payable approximated its fair value.
The only assets or liabilities the Company had at September 30, 2014 that are recorded at fair value on a recurring basis is the interest rate cap that the Company entered into on March 31, 2014 that had a fair value of $0.1 million as of September 30, 2014 (see Note 13, Debt) and natural gas hedges that had a fair value of $0.1 million at September 30, 2014. Both the interest rate cap and the natural gas hedges are classified within Level 2 of the fair value hierarchy as they are valued using third party pricing models which contain inputs that are derived from observable market data.
Assets and liabilities that are measured at fair value on a non-recurring basis include intangible assets and goodwill. These items are recognized at fair value when they are considered to be impaired.
There were no fair value adjustments for assets and liabilities measured on a non-recurring basis. The Company discloses fair value information about financial instruments, whether or not recognized in the balance sheet, for which it is practicable to estimate that value.
13. Debt
Debt consists of the following:
| (in thousands) | As of September 30, 2014 |
As of December 31, 2013 |
||||||
| First Lien Credit Agreement |
$ | 376,988 | $ | 413,962 | ||||
| Second Lien Credit Agreement |
155,000 | |||||||
| Less: Original issue discount (net of amortization) |
(3,021 | ) | (4,888 | ) | ||||
|
|
|
|
|
|||||
| Total debt |
373,967 | 564,074 | ||||||
| Less: Current portion of long-term debt |
(4,150 | ) | ||||||
|
|
|
|
|
|||||
| Long-term debt |
$ | 373,967 | $ | 559,924 | ||||
|
|
|
|
|
|||||
On August 30, 2013, the Company and its subsidiary Continental Building Products Operating Company, LLC (“OpCo”) entered into a first lien credit agreement with Credit Suisse AG, as administrative agent, Credit Suisse Securities (USA) LLC and RBC Capital Markets, as joint lead arrangers and joint bookrunners, and Royal Bank of Canada, as syndication agent (as amended on December 2, 2013, the “First Lien Credit Agreement”). The First Lien Credit Agreement provided OpCo a term loan facility at an initial amount of $415.0 million and a U.S. dollar revolving loan facility of $40.0 million and a Canadian dollar and/or U.S. dollar revolving facility of $10.0 million (such aggregate $50.0 million revolving facilities together, the “Revolver”), which may be borrowed by OpCo or by its subsidiary, Continental Building Products Canada Inc. in Canadian dollars or U.S. dollars.
On August 30, 2013, the Company and OpCo entered into a second lien credit agreement with Credit Suisse AG, as administrative agent, Credit Suisse Securities (USA) LLC and RBC Capital Markets, as joint lead arrangers and joint bookrunners, and Royal Bank of Canada, as syndication agent (as amended on December 2, 2013, the “Second Lien Credit Agreement”). The Second Lien Credit Agreement provided OpCo a term loan facility of $155.0 million (the “Second Lien Term Loan”).
On February 10, 2014, the Company completed the Initial Public Offering and used $152 million of net proceeds from the Initial Public Offering and cash on hand of $6.1 million to repay the $155 million Second Lien Term Loan in full along with a prepayment premium of $3.1 million. The $3.1 million prepayment premium was
F-43
Table of Contents
recorded in other (expense) income. The prepayment of the Second Lien Term Loan also resulted in the write-off of $6.9 million in original issue discount and deferred financing fees that were recorded in interest expense.
Interest under the First Lien Credit Agreement is floating. The interest rate spread over LIBOR, which has a 1% floor, was reduced by 50 basis points in May 2014, from 3.75% to 3.25%, as a result of the Company achieving a total leverage ratio of less than four times net debt to the trailing twelve months adjusted earnings before interest, depreciation and amortization, as of March 31, 2014, as calculated pursuant to the First Lien Credit Agreement. This reduced interest rate for the First Lien Credit Agreement will be in effect for as long as the leverage ratio, as calculated pursuant to the First Lien Credit Agreement, remains below four. The margin applicable to the borrowing was further reduced in the third quarter 2014 by 25 basis points to 3.00% after the Company achieved a B2 rating with a stable outlook by Moody’s and will remain in effect as long as this rating and outlook are maintained or better.
The First Lien Credit Agreement is secured by the underlying property and equipment of the Company. During the nine months ended September 2014, CBP pre-paid $34.9 million of principal payments and no further quarterly mandatory principal payments are required until the final payment of $377.0 million due on August 28, 2020. The annual effective interest rate on the First Lien Credit Agreement including original issue discount and amortization of debt issuance costs was 4.64% at September 30, 2014.
There were no amounts outstanding under the Revolver as of September 30, 2014. The interest rate on amounts outstanding under the Revolver is floating, based on LIBOR (with a floor of 1%), plus 225 basis points. In addition, CBP pays a facility fee of 50 basis points per annum on the total Revolver. Availability under the Revolver, based on draws and outstanding letters of credit and that there are no violations of covenants, was $46.1 million at September 30, 2014.
Total cash interest paid for the nine months ended September 30, 2014 (Successor) was $15.6 million. No significant amounts of interest were paid by the Predecessor in the prior periods.
The table below shows the future minimum principal payments due under the First Lien Credit Agreement.
| (in thousands) | Amount Due | |||
| Remaining 2014 |
$ | — | ||
| 2015 |
— | |||
| 2016 |
— | |||
| 2017 |
— | |||
| 2018 |
— | |||
| Thereafter |
$ | 376,988 | ||
Under the terms of the First Lien Credit Agreement, the Company is required to comply with certain covenants, including among others, a limitation of indebtedness, limitation on liens, and limitations on certain cash distributions. One single financial covenant governs all of the Company’s debt and applies only if the outstanding borrowings of the Revolver plus outstanding letters of credit are greater than $12.5 million as of the end of the quarter. The financial covenant is a total leverage ratio calculation, in which total debt less outstanding cash is divided by adjusted earnings before interest, depreciation and amortization. It would require a leverage ratio below 6.75 as of September 30, 2014. As the sum of outstanding borrowings under the Revolver and outstanding letters of credit were less than $12.5 million at September 30, 2014, the financial covenant was not applicable for the quarter.
14. Derivative Instruments
The Company uses derivative instruments to manage selected commodity price and interest rate exposures. The Company does not use derivative instruments for speculative trading purposes, and typically does not hedge beyond two years. Cash flows from derivative instruments are included in net cash provided by operating activities in the consolidated statements of cash flows.
F-44
Table of Contents
Commodity Derivative Instruments
As of September 30, 2014, the Company had 875 thousand millions of British Thermal Units (“mmBTUs”) in aggregate notional amount outstanding natural gas swap contracts to manage commodity price exposures. All of these contracts mature by September 30, 2015. The Company elected to designate these derivative instruments as cash flow hedges in accordance with ASC 815-20, Derivatives—Hedging. For derivative contracts designated as cash flow hedges, the effective portion of changes in the fair value of the derivative is recorded to accumulated other comprehensive income, and is reclassified to earnings when the underlying forecasted transaction affects earnings. The ineffective portion of changes in the fair value of the derivative is recorded in cost of goods sold. The net unrealized gain that remained in accumulated other comprehensive income (loss), as of September 30, 2014 was $0.1 million. No ineffectiveness was recorded on these contracts during 2014. Gains and losses on these contracts that are designated as cash flow hedges are reclassified into earnings when the underlying forecasted transactions affect earnings. The Company reassesses the probability of the underlying forecasted transactions occurring on a quarterly basis.
On a pre-tax basis, for the nine months ended September 30, 2014, approximately $0.1 million of gains were recognized in other comprehensive income for the commodity contracts. For the same period, the amount of gain reclassified from accumulated other comprehensive income into income was nominal. As of September 30, 2014, $0.1 million was recorded in other current assets.
Interest Rate Derivative Instrument
At September 30, 2014, the Company had an interest rate cap on three month U.S. Dollar LIBOR of 2% for a notional amount of $205.4 million, representing 54% of the principal amount outstanding under the First Lien Credit Agreement as of September 30, 2014. The notional amount of the interest rate cap declines by $0.5 million each quarter through December 31, 2015. The objective of the hedge is to protect the cash flows from adverse extreme market interest rate changes for a portion of the First Lien Credit Agreement through March 31, 2016. Changes in the fair value of the interest rate cap are expected to be perfectly effective in offsetting the changes in cash flow of interest payments attributable to fluctuations for three month U.S. Dollar LIBOR interest rates above 2%. The hedge is being accounted for as a cash flow hedge.
Changes in the time value of the interest rate cap are reflected directly in earnings through “other income / expense” in non-operating income. CBP recorded a $0.2 million loss for the nine months ended September 30, 2014 (Successor). The fair value of the time value of the interest rate cap of $0.1 million is recorded in other current assets as of September 30, 2014.
Counterparty Risk
The Company is exposed to credit losses in the event of nonperformance by the counterparties to the Company’s derivative instruments. As of September 30, 2014, the Company’s derivatives were in a $0.1 million net asset position. All of the Company’s counterparties have investment grade credit ratings; accordingly, the Company anticipates that the counterparties will be able to fully satisfy their obligations under the contracts. The Company’s agreements outline the conditions upon which it or the counterparties are required to post collateral. As of September 30, 2014, the Company had no collateral posted with its counterparties related to the derivatives.
15. Segment Reporting
Segment information is presented in accordance with FASB ASC 280, Segment Reporting, which establishes standards for reporting information about operating segments. It also establishes standards for related disclosures about products and geographic areas. The Company’s and Predecessor’s primary reportable segment is wallboard which represented approximately 96% of the Company’s revenues in the nine months ended September 30, 2014. This segment produces wallboard for the commercial and residential construction sectors. The Company also operates other business activities, primarily finishing products, which complement the Company’s full range of wallboard products.
F-45
Table of Contents
Revenues from the major products sold to external customers include gypsum wallboard and finishing products.
The Company’s and Predecessor’s two geographic areas consist of the United States and Canada for which it reports net sales, fixed assets and total assets.
The Company and Predecessor evaluate operating performance based on profit or loss from operations before certain adjustments as shown below. Revenues are attributed to geographic areas based on the location of the assets producing the revenues. The Company did not provide asset information by segment as the Company’s chief operating decision maker does not use such information for purposes of allocating resources and assessing segment performance.
Reportable segment information consists of the following:
| Successor | Successor | Predecessor | ||||||||||||
| (in thousands) | Nine Months Ended September 30, 2014 |
July 26 - September 30, 2013 |
January 1 - August 30, 2013 |
|||||||||||
| Net Sales: |
||||||||||||||
| Wallboard |
292,212 | 34,291 | 240,225 | |||||||||||
| Other |
11,480 | 1,339 | 12,023 | |||||||||||
|
|
|
|
|
|
|
|||||||||
| Total net sales |
303,692 | 35,630 | 252,248 | |||||||||||
|
|
|
|
|
|
|
|||||||||
| Operating income (loss): |
||||||||||||||
| Wallboard |
39,819 | (2,045 | ) | 32,699 | ||||||||||
| Other |
(527 | ) | (62 | ) | (72 | ) | ||||||||
| Adjustments: |
||||||||||||||
| Interest Expense |
(24,518 | ) | (2,364 | ) | (91 | ) | ||||||||
| Gain (loss) from Equity Investment |
(257 | ) | — | (30 | ) | |||||||||
| Other non-operating expenses |
(5,461 | ) | 85 | (191 | ) | |||||||||
|
|
|
|
|
|
|
|||||||||
| Income (loss) before income tax benefit |
9,056 | (4,386 | ) | 32,315 | ||||||||||
|
|
|
|
|
|
|
|||||||||
| Depreciation and Amortization |
||||||||||||||
| Wallboard |
40,423 | 4,492 | 16,067 | |||||||||||
| Other |
901 | 102 | 819 | |||||||||||
|
|
|
|
|
|
|
|||||||||
| Total depreciation and amortization |
41,324 | 4,594 | 16,886 | |||||||||||
|
|
|
|
|
|
|
|||||||||
16. Share-Based Compensation
In conjunction with the Initial Public Offering, the Company granted employees 142,000 stock options and 75,000 shares of restricted stock that vest over four years. The fair value of stock options was determined using the Black Scholes option pricing model with the following assumptions: (a) a risk free interest rate assumption of 2.15%, based on the U.S. Treasury yield curve in effect at the time of the grant; (b) a dividend yield of 0% as the Company currently has no plans to pay a dividend; (c) a volatility assumption of 50.34%, based on historical volatilities of comparable publicly traded companies, and (d) an expected life of 6.25 years based on the assumption that the options will be exercised evenly from time of vesting to the expiration date. Compensation expense of $0.3 million was recorded for share-based awards for the nine months ended September 30, 2014.
F-46
Table of Contents
7,000,000 Shares
Continental Building Products, Inc.
Common Stock
PROSPECTUS
, 2014
Joint Book-Running Managers
| Citigroup | Credit Suisse | RBC Capital Markets |
| Barclays | Deutsche Bank Securities |
Table of Contents
PART II
INFORMATION NOT REQUIRED IN PROSPECTUS
Item 13. Other Expenses of Issuance and Distribution.
The following table shows the costs and expenses, other than underwriting discounts and commissions, payable in connection with the sale and distribution of the securities being registered. Except as otherwise noted, we will pay all of these amounts. All amounts except the SEC registration fee and the FINRA fee are estimated.
| SEC Registration Fee |
$ | 13,508 | ||
| FINRA Filing Fee |
||||
| Printing and Engraving Costs |
||||
| Legal Fees and Expenses |
||||
| Accounting Fees and Expenses |
||||
| Transfer Agent and Registrar Fees and Expenses |
||||
| Miscellaneous Expenses |
||||
|
|
|
|||
| Total |
$ | |||
|
|
|
Item 14. Indemnification of Directors and Officers.
Our bylaws provide that each person who was or is party or is threatened to be made a party to, or was or is otherwise involved in, any threatened, pending or completed proceeding by reason of the fact that he or she is or was a director or officer of our company or was serving at the request of our company as a director, officer, employee, agent or trustee of another entity shall be indemnified and held harmless by us to the full extent authorized by the Delaware General Corporation Law, or DGCL, against all expense, liability and loss actually and reasonably incurred in connection therewith, subject to certain limitations.
Section 145(a) of the DGCL authorizes a corporation to indemnify any person who was or is a party, or is threatened to be made a party, to a threatened, pending or completed action, suit or proceeding, whether civil, criminal, administrative or investigative (other than an action by or in the right of the corporation), by reason of the fact that the person is or was a director, officer, employee or agent of the corporation, or is or was serving at the request of the corporation as a director, officer, employee or agent of another corporation, partnership, joint venture, trust or other enterprise, against expenses (including attorneys’ fees), judgments, fines and amounts paid in settlement actually and reasonably incurred by the person in connection with such action, suit or proceeding, if the person acted in good faith and in a manner the person reasonably believed to be in, or not opposed to, the best interests of the corporation and, with respect to any criminal action or proceeding, had no reasonable cause to believe the person’s conduct was unlawful.
Section 145(b) of the DGCL provides in relevant part that a corporation may indemnify any person who was or is a party or is threatened to be made a party to any threatened, pending or completed action or suit by or in the right of the corporation to procure a judgment in its favor by reason of the fact that the person is or was a director, officer, employee or agent of the corporation, or is or was serving at the request of the corporation as a director, officer, employee or agent of another corporation, partnership, joint venture, trust or other enterprise against expenses (including attorneys’ fees) actually and reasonably incurred by the person in connection with the defense or settlement of such action or suit if the person acted in good faith and in a manner the person reasonably believed to be in or not opposed to the best interests of the corporation and except that no indemnification shall be made in respect of any claim, issue or matter as to which such person shall have been adjudged to be liable to the corporation unless and only to the extent that the Court of Chancery or the court in which such action or suit was brought shall determine upon application that, despite the adjudication of liability but in view of all the circumstances of the case, such person is fairly and reasonably entitled to indemnity for such expenses which the Court of Chancery or such other court shall deem proper.
II-1
Table of Contents
The DGCL also provides that indemnification under Sections 145(a) and (b) can only be made upon a determination that indemnification of the present or former director, officer or employee or agent is proper in the circumstances because such person has met the applicable standard of conduct set forth in Sections 145(a) and (b). Such determination shall be made, with respect to a person who is a director or officer at the time of such determination, (1) by a majority vote of directors who are not a party to the action at issue (even though less than a quorum), or (2) by a majority vote of a designated committee of these directors (even though less than a quorum), or (3) if there are no such directors, or these directors authorize, by the written opinion of independent legal counsel, or (4) by the stockholders.
Section 145(g) of the DGCL also empowers a corporation to purchase and maintain insurance on behalf of any person who is or was a director, officer, employee or agent of the corporation, or is or was serving at the request of the corporation as a director, officer, employee or agent of another corporation, partnership, joint venture, trust or other enterprise against any liability asserted against such person and incurred by such person in any such capacity, or arising out of such person’s status as such, whether or not the corporation would have the power to indemnify such person against such liability under Section 145 of the DGCL.
Section 102(b)(7) of the DGCL permits a corporation to provide for eliminating or limiting the personal liability of one of its directors for any monetary damages related to a breach of fiduciary duty as a director, as long as the corporation does not eliminate or limit the liability of a director for acts or omissions which (1) were in bad faith, (2) were the result of active and deliberate dishonesty and were material to the cause of action so adjudicated, (3) the director derived an improper personal benefit from (such as a financial profit or other advantage to which such director was not legally entitled) or (4) breached the director’s duty of loyalty.
We have entered into indemnification agreements with each of our officers and directors that provide, in general, that we will indemnify them to the fullest extent permitted by law in connection with their service to us or on our behalf.
The proposed form of Underwriting Agreement to be filed as Exhibit 1.1 to this Registration Statement provides for indemnification of our directors and officers by the underwriters against certain liabilities.
Item 15. Recent Sale of Unregistered Securities.
We have not sold any securities that were not registered under the Securities Act within the past three years, except for the following:
| • | The issuance of the membership interests in LSF8 Gypsum Holdings Company, LLC (the limited liability company that was converted into Continental Building Products, Inc. shortly prior to the consummation of the Company’s initial public offering) issued upon formation thereof on July 26, 2013 to our former sole stockholder, LSF8 Gypsum Holdings, L.P. The issuance of the membership interests was exempt from the registration requirements of the Securities Act pursuant to Section 4(2) thereof as a transaction by an issuer not involving any public offering. |
| • | The issuance of an aggregate of 75,000 shares of restricted stock on February 4, 2014 to a total of 20 employees and three directors at no cost to the employees under the Company’s 2014 Stock Incentive Plan. The issuances of these shares of restricted stock were exempt from registration requirements of the Securities Act in reliance on Rule 701 promulgated under Section 3(b) of the Securities Act, as transactions pursuant to compensatory benefit plans and contracts relating to compensation approved by the board of directors prior to the effectiveness of the Company’s registration statement on Form S-1 filed in connection with the Company’s initial public offering. |
II-2
Table of Contents
Item 16. Exhibits and Financial Data Schedules.
(a) Exhibit Index
See the Exhibit Index following the signature page.
(b) Financial Statement Schedule
None. Financial statement schedules have been omitted because the information is included in our consolidated financial statements included elsewhere in this Registration Statement.
Item 17. Undertakings.
(a) The undersigned registrant hereby undertakes to provide to the underwriter at the closing specified in the underwriting agreements, certificates in such denominations and registered in such names as required by the underwriter to permit prompt delivery to each purchaser.
(b) Insofar as indemnification for liabilities arising under the Securities Act of 1933 may be permitted to directors, officers and controlling persons of the registrant pursuant to the foregoing provisions, or otherwise, the registrant has been advised that in the opinion of the Securities and Exchange Commission such indemnification is against public policy as expressed in the Act and is, therefore, unenforceable. In the event that a claim for indemnification against such liabilities (other than the payment by the registrant of expenses incurred or paid by a director, officer or controlling person of the registrant in the successful defense of any action, suit or proceeding) is asserted by such director, officer or controlling person in connection with the securities being registered, the registrant will, unless in the opinion of its counsel the matter has been settled by controlling precedent, submit to a court of appropriate jurisdiction the question whether such indemnification by it is against public policy as expressed in the Act and will be governed by the final adjudication of such issue.
(c) The undersigned registrant hereby undertakes that:
(i) For purposes of determining any liability under the Securities Act of 1933, the information omitted from the form of prospectus filed as part of this registration statement in reliance upon Rule 430A and contained in a form of prospectus filed by the registrant pursuant to Rule 424(b)(1) or (4) or 497(h) under the Securities Act of 1933 shall be deemed to be part of this registration statement as of the time it was declared effective.
(ii) For the purpose of determining any liability under the Securities Act of 1933, each post-effective amendment that contains a form of prospectus shall be deemed to be a new registration statement relating to the securities offered therein, and the offering of such securities at that time shall be deemed to be the initial bona fide offering thereof.
II-3
Table of Contents
SIGNATURES
Pursuant to the requirements of the Securities Act of 1933, as amended, the registrant has duly caused this registration statement to be signed on its behalf by the undersigned, thereunto duly authorized, in the city of Herndon, state of Virginia, on November 6, 2014.
| Continental Building Products, Inc. | ||
| By: | /s/ Isaac Preston | |
| Name: Isaac Preston | ||
| Title: President and Chief Executive Officer | ||
POWER OF ATTORNEY
KNOW ALL MEN BY THESE PRESENTS, that each person whose signature appears below constitutes and appoints Isaac Preston and Timothy A. Power, and each of them, his or her true and lawful attorneys-in-fact and agents, each with full power of substitution and resubstitution, for him or her and in his or her name, place and stead, in any and all capacities, to sign any and all amendments, including post-effective amendments, to this Registration Statement, and any registration statement relating to the offering covered by this Registration Statement and filed pursuant to Rule 462 under the Securities Act of 1933, as amended, and to file the same, with exhibits thereto and other documents in connection therewith, with the Securities and Exchange Commission, granting unto said attorneys-in-fact and agents, and each of them, full power and authority to do and perform each and every act and thing requisite and necessary to be done, as fully to all intents and purposes as he or she might or could do in person, hereby ratifying and confirming all that each of said attorneys-in-fact and agents or their substitute or substitutes may lawfully so or cause to be done by virtue hereof.
Pursuant to the requirements of the Securities Act of 1933, as amended, the following persons have signed this Registration Statement in the capacities and on the date indicated.
| /s/ Isaac Preston Isaac Preston |
President and Chief Executive Officer (Principal Executive Officer), Director | November 6, 2014 | ||
| /s/ James Bachmann James Bachmann |
Chief Financial Officer (Principal Financial Officer, Principal Accounting Officer) |
November 6, 2014 | ||
| /s/ Bradley P. Boggess Bradley P. Boggess |
Director | November 6, 2014 | ||
| /s/ Edward Bosowski Edward Bosowski |
Director | November 6, 2014 | ||
| /s/ Samuel D. Loughlin Samuel D. Loughlin |
Chairman of the Board, Director | November 6, 2014 | ||
| /s/ Michael O. Moore Michael O. Moore |
Director | November 6, 2014 | ||
| /s/ Chadwick S. Suss Chadwick S. Suss |
Director | November 6, 2014 | ||
Table of Contents
| /s/ Jack Sweeny Jack Sweeny |
Director | November 6, 2014 | ||
| /s/ Kyle S. Volluz Kyle S. Volluz |
Director | November 6, 2014 | ||
| /s/ Grant Wilbeck Grant Wilbeck |
Director | November 6, 2014 | ||
Table of Contents
EXHIBIT INDEX
| Exhibit |
Description of Exhibit |
|||
| 1.1 | Form of Underwriting Agreement. | ** | ||
| 2.1+ | Asset Purchase Agreement, dated as of June 24, 2013, by and between Lafarge North America Inc. and Lone Star U.S. Acquisitions, LLC. | (b) | ||
| 2.2 | Amendment No. 1 to Asset Purchase Agreement, dated as of August 28, 2013, by and between Lafarge North America Inc., Lone Star U.S. Acquisitions, LLC, Continental Building Products, LLC, Continental Silver Grove, LLC, Continental Palatka, LLC and Continental Buchanan, LLC. | (b) | ||
| 2.3 | Amendment No. 2 to Asset Purchase Agreement, dated as of August 29, 2013, by and between Lafarge North America Inc., Lone Star U.S. Acquisitions, LLC, Continental Building Products, LLC, Continental Silver Grove, LLC, Continental Palatka, LLC and Continental Buchanan, LLC. | (b) | ||
| 3.1 | Certificate of Incorporation of the Registrant. | (d) | ||
| 3.2 | Bylaws of the Registrant. | (b) | ||
| 4.1 | Registration Rights Agreement, dated as of February 5, 2014, by and between Continental Building Products, Inc. and LSF8 Gypsum Holdings, L.P. | (b) | ||
| 4.2 | Form of Certificate of Common Stock of the Registrant. | (b) | ||
| 5.1 | Opinion of Gibson, Dunn & Crutcher LLP. | ** | ||
| 10.1 | Asset Advisory Agreement by and between Hudson Americas LLC, Continental Building Products, Inc. and Lone Star Fund VIII (U.S.), L.P., effective as of August 30, 2013. | (b) | ||
| 10.2^ | Synthetic Gypsum Supply Agreement dated as of December 11, 2007 between Synthetic Materials, LLC and Lafarge North America Inc. | (b) | ||
| 10.3^ | Amended and Restated Gypsum Contract dated as of June 8, 2005 between The Cincinnati Gas & Electric Company (an operating owner of the Miami Fort Generating Station) and Lafarge North America, Inc. | (b) | ||
| 10.4^ | Gypsum Contract dated as of December 29, 1998 among Duke Energy Ohio, Inc. (formerly The Cincinnati Gas & Electric Company), The Dayton Power and Light Company, Columbus Southern Power Company (each an owner of the Wm. H. Zimmer Generating Station) and Lafarge North America Inc. (formerly known as Lafarge Corporation). | (b) | ||
| 10.5^ | Synthetic Gypsum Supply Agreement dated as of December 11, 2007 between Synthetic Materials, LLC and Lafarge North America Inc. | (b) | ||
| 10.6^ | Gypsum Contract dated as of August 9, 1999 between Seminole Electric Cooperative, Inc. and Lafarge North America Inc. | (b) | ||
| 10.7^ | Paper Supply Agreement dated as of February 18, 2000 between Seven Hills Paperboard, LLC and Lafarge North America Inc. (formerly known as Lafarge Corporation). | (b) | ||
| 10.8# | Continental Building Products, Inc. 2014 Stock Incentive Plan. | (d) | ||
| 10.9# | Form of Grant Notice for 2014 Stock Incentive Plan Restricted Stock Unit Award. | (a) | ||
| 10.10# | Form of Grant Notice for 2014 Stock Incentive Plan Restricted Stock Award. | (a) | ||
| 10.11# | Form of Grant Notice for 2014 Stock Incentive Plan Nonqualified Stock Options. | (a) | ||
| 10.12# | Form of Grant Notice for 2014 Stock Incentive Plan Incentive Stock Options. | (a) | ||
Table of Contents
| 10.13 | Termination Agreement, dated as of December 20, 2013, by and between Hudson Americas LLC, Continental Building Products, Inc. and Lone Star Fund VIII (U.S.), L.P. | (b) | ||
| 10.14 | First Lien Credit Agreement, dated as of August 30, 2013, by and among LSF8 Gypsum Holdings Company, LLC, Continental Building Products LLC, Continental Building Products Canada Inc., the lenders party thereto, Credit Suisse AG, as Administrative Agent, Credit Suisse Securities (USA) LLC and RBC Capital Markets, as Joint Lead Arrangers and Joint Bookrunners and Royal Bank of Canada, as Syndication Agent. | (b) | ||
| 10.15 | Incremental Assumption Agreement and Amendment No. 1, dated as of December 2, 2013, to the First Lien Credit Agreement dated as of August 30, 2013, by and among LSF8 Gypsum Holdings Company, LLC, Continental Building Products LLC, Continental Building Products Canada Inc., the lenders party thereto, Credit Suisse AG, as Administrative Agent, Credit Suisse Securities (USA) LLC and RBC Capital Markets, as Joint Lead Arrangers and Joint Bookrunners and Royal Bank of Canada, as Syndication Agent. | (b) | ||
| 10.16 | Second Lien Credit Agreement, dated as of August 30, 2013, by and among LSF8 Gypsum Holdings Company, LLC, Continental Building Products LLC, the lenders party thereto, Credit Suisse AG, as Administrative Agent, Credit Suisse Securities (USA) LLC and RBC Capital Markets, as Joint Lead Arrangers and Joint Bookrunners and Royal Bank of Canada, as Syndication Agent, as amended on December 2, 2013 | (b) | ||
| 10.17 | Incremental Assumption Agreement and Amendment No. 1, dated as of December 2, 2013, to the Second Lien Credit Agreement dated as of August 30, 2013, by and among LSF8 Gypsum Holdings Company, LLC, Continental Building Products LLC, Continental Building Products Canada Inc., the lenders party thereto, Credit Suisse AG, as Administrative Agent, Credit Suisse Securities (USA) LLC and RBC Capital Markets, as Joint Lead Arrangers and Joint Bookrunners and Royal Bank of Canada, as Syndication Agent. | (b) | ||
| 10.18 | Form of Indemnification Agreement for officers and directors | (b) | ||
| 10.19^ | First Amendment to Synthetic Gypsum Supply Agreement, dated as of December 11, 2007, by and between Synthetic Materials, LLC and Lafarge North America Inc., effective as of February 16, 2009. | (b) | ||
| 10.20 | Assignment and Assumption Agreement, dated as of May 10, 2010, by and between Synthetic Materials, LLC and Mirant Mid-Atlantic, LLC, assigning the Synthetic Gypsum Supply Agreement, dated as of December 11, 2007, between Synthetic Materials, LLC and Lafarge North America Inc. | (b) | ||
| 10.21^ | Letter of Understanding, dated January 4, 2010, by and between Duke Energy Corporation and Lafarge North America, Inc. revising the Amended and Restated Gypsum Contract, dated as of June 8, 2005, by and between The Cincinnati Gas & Electric Company (operating owner of the Miami Fort Generating Station) and Lafarge North America Inc. | (b) | ||
| 10.22^ | December 2009 Amendment to Gypsum Contract, dated as of December 29, 1998, by and among Duke Energy Ohio, Inc. (formerly known as The Cincinnati Gas & Electric Company), The Dayton Power and Light Company and Columbus Southern Power Company (each an owner of the Wm. H. Zimmer Generating Station) and Lafarge North America, Inc. (formerly known as Lafarge Corporation), effective December 22, 2009. | (b) | ||
| 10.23^ | Process for Managing Surplus Gypsum, dated as of December 3, 2010, by and between Duke Energy Ohio and Lafarge North America, Inc. | (b) | ||
| 10.24^ | Amendment No. 1 to Supply Agreement, dated as of December 11, 2007, by and between Synthetic Materials, LLC and Lafarge North America, Inc., effective as of December 22, 2008. | (b) | ||
Table of Contents
| 10.25^ | Amendment One to Gypsum Contract, dated as of August 9, 1999, by and between Seminole Electric Cooperative, Inc. and Lafarge North America, Inc. (formerly known as Lafarge Corporation), effective December 11, 2008. | (b) | ||
| 10.26# | Employment Agreement, dated as of January 1, 2014, by and between Continental Building Products, Inc. and Isaac N. Preston (previously filed as Exhibit 10.17 to this Registration Statement). | (d) | ||
| 10.27# | Employment Agreement, dated as of January 1, 2014, by and between Continental Building Products, Inc. and James Bachmann. | (b) | ||
| 21.1 | List of Subsidiaries of the Registrant. | (e) | ||
| 23.1 | Consent of Ernst & Young LLP. | * | ||
| 23.2 | Consent of Gibson, Dunn & Crutcher LLP (included in Exhibit 5.1). | ** | ||
| 24.1 | Powers of Attorney (included on the signature page hereto). | * | ||
| 101.INS | XBRL Instance Document | *** | ||
| 101.SCH | XBRL Taxonomy Extension Schema Document | *** | ||
| 101.CAL | XBRL Taxonomy Extension Calculation Linkbase Document | *** | ||
| 101.DEF | XBRL Taxonomy Extension Definition Linkbase Document | *** | ||
| 101.LAB | XBRL Taxonomy Extension Labels Linkbase Document | *** | ||
| 101.PRE | XBRL Taxonomy Extension Presentation Linkbase Document | *** | ||
| * | Filed herewith. |
| ** | To be filed by amendment. |
| *** | To be filed by amendment once a price or price range for the shares of common stock to be registered pursuant hereto has been determined. |
| + | Certain schedules to this agreement have been omitted in accordance with Item 601(b)(2) of Regulation S-K. A copy of any omitted schedules will be furnished supplementally to the SEC upon request. |
| # | Denotes management compensatory plan or arrangement. |
| ^ | Certain portions of this exhibit have been redacted and separately filed with the Securities and Exchange Commission pursuant to a request for confidential treatment. |
| (a) | Previously filed on December 24, 2013 as an exhibit to the Company’s Registration Statement on Form S-1 (File No. 333-193078) and incorporated herein by reference. |
| (b) | Previously filed on January 10, 2014 as an exhibit to Amendment No. 1 to the Company’s Registration Statement on Form S-1 (File No. 333-193078) and incorporated herein by reference. |
| (c) | Previously filed on January 23, 2014 as an exhibit to Amendment No. 2 to the Company’s Registration Statement on Form S-1 (File No. 333-193078) and incorporated herein by reference. |
| (d) | Previously filed on January 31, 2014 as an exhibit to Amendment No. 3 to the Company’s Registration Statement on Form S-1 (File No. 333-193078) and incorporated herein by reference. |
| (e) | Previously filed on March 27, 2014 as an exhibit to the Company’s Annual Report on Form 10-K and incorporated herein by reference. |