Attached files
| file | filename |
|---|---|
| 8-K - FORM 8-K - Apollo Residential Mortgage, Inc. | d817837d8k.htm |
| EX-99.1 - EX-99.1 - Apollo Residential Mortgage, Inc. | d817837dex991.htm |
| EX-99.3 - EX-99.3 - Apollo Residential Mortgage, Inc. | d817837dex993.htm |
 November 4, 2014
Supplemental Financial Information Presentation
Information is as of September 30, 2014 except as otherwise noted.
It should not be assumed that investments made in the future will
be profitable or will equal the performance of investments in this document.
Exhibit 99.2
Q3 2014 |
 2
APOLLO RESIDENTIAL MORTGAGE, INC. (“AMTG”)
Apollo Residential Mortgage, Inc.
Third Quarter 2014 Earnings Call
November 4, 2014
Michael A. Commaroto
Chief Executive Officer
Teresa D. Covello
Chief Financial Officer
Keith Rosenbloom
Agency Portfolio Manager
Paul Mangione
Non-Agency Portfolio Manager
Hilary Ginsberg
Investor Relations Manager |
 3
APOLLO RESIDENTIAL MORTGAGE, INC. (“AMTG”)
Forward Looking Statements
This presentation may contain forward-looking statements within the
meaning of Section 27A of the Securities Act of 1933, as amended, and Section 21E of the Securities
Exchange Act of 1934, as amended, and such statements are intended to
be covered by the safe harbor provided by the same. Forward-looking statements are subject to
substantial risks and uncertainties, many of which are difficult
to predict and are generally beyond management’s control. These
forward-looking statements include information about
possible or assumed future results of Apollo Residential Mortgage, Inc.’s (“AMTG”
or the “Company”) business, financial condition, liquidity,
results of operations, plans and objectives, including
information about AMTG’s ability to generate attractive returns while attempting to mitigate risk. When used in this release, the
words "believe," "expect," "anticipate,"
"estimate," "plan," "continue," "intend," "should," "may" or similar expressions, are intended to identify forward-looking statements.
Statements regarding the following subjects, among others, may be
forward-looking: the return on equity; the yield on investments; the ability to borrow to finance assets;
and risks associated with investing in real estate assets, including
changes in business conditions and the general economy. The
forward-looking statements are based on management’s beliefs, assumptions and expectations of AMTG’s future performance, taking into account all information
currently available to management. Forward-looking statements are
not predictions of future events. These beliefs, assumptions and expectations can change as a result of
many possible events or factors, not all of which are known to AMTG.
Some of these factors are described in the Company's Annual
Report on Form 10-K for the year
ended December 31, 2013 and the Company’s other filings with the
Securities and Exchange Commission (“SEC”). If a change occurs, AMTG’s business, financial
condition, liquidity and results of operations may vary materially from
those expressed in AMTG’s forward-looking statements. Any forward-looking statement speaks only
as of the date on which it is made. New risks and uncertainties arise
over time, and it is not possible for management to predict those events or how they may affect AMTG.
Except as required by law, AMTG is not obligated to, and does not
intend to, update or revise any forward-looking statements, whether as a result of new information, future
events or otherwise.
This presentation contains information regarding the Company’s
financial results that is calculated and presented on the basis of methodologies other than in accordance with
accounting principles generally accepted in the United States
(“GAAP”), including Operating Earnings and Operating Earnings per share.
Please refer to page 4 for a
definition of “Operating Earnings”
and the reconciliation of “Operating Earnings”
to the applicable GAAP financial measure set forth on pages 17 and
18. This presentation may contain statistics and other data that
in some cases has been obtained from or compiled from information made available by third-party service
providers. AMTG makes no representation or warranty, expressed or
implied, with respect to the accuracy, reasonableness or completeness of such information.
Past performance is not indicative nor a guarantee of future
returns. Index performance and yield data are shown for
illustrative purposes only and have limitations when used for comparison or for other purposes due to, among other matters,
volatility, credit or other factors (such as number and types of
securities). Indices are unmanaged, do not charge any fees or
expenses, assume reinvestment of income and do not
employ
special
investment
techniques
such
as
leveraging
or
short
selling.
No
such
index
is
indicative
of
the
future
results
of
any
investment
by
AMTG. |
 4
APOLLO RESIDENTIAL MORTGAGE, INC. (“AMTG”)
Third Quarter 2014 Summary Highlights
Reported
Operating
Earnings
of
$16.4
million,
or
$0.51
per
share
of
common
stock
for
the
third
quarter
of
2014
(1)
Residential mortgage-backed securities (“RMBS”) portfolio
at September 30, 2014 consisted of Agency RMBS with an estimated
fair value of $2.1 billion and non-Agency RMBS with an estimated fair value of $1.5 billion
RMBS, securitized mortgage loans and other credit investment portfolio
had a 2.7% effective net interest spread and a 15.0%
effective
levered
asset
yield
at
September
30,
2014
(2)
Quarter-end leverage multiple of 3.9x at September 30, 2014
Estimated taxable income of $0.35 per share of common stock
Declared a $0.44 per share of common stock quarterly dividend for
stockholders of record as of September 30, 2014 Book value per
share of common stock of $19.27 at September 30, 2014 $23 million
outstanding on warehouse facility receivable associated with the Company’s Seller Financing Program to fund the
acquisition
and
rehabilitation
of
381
homes
and
earnest
money
deposits
for
45
homes
(3)
(1) Operating Earnings and Operating Earnings per share of common stock
are non-GAAP financial measures. Operating Earnings and Operating Earnings per share of common stock presented exclude, as applicable: (i) certain realized and unrealized gains and losses recognized through earnings;
(ii) non-cash equity compensation; (iii) one time events pursuant to
changes in GAAP; and (iv) certain other non-cash charges. Please see pages 17 and 18 for a reconciliation of Operating Earnings and Operating Earnings per common share to GAAP net income allocable to common stockholders
and GAAP net income allocable to common stockholders per share of common
stock. Operating Earnings represents the earnings, as adjusted, allocable to common stock.
(2) Effective net interest spread and effective levered asset yield are
non-GAAP financial measures, which include the cost of the Company’s Swaps as a component of its interest expense. Please see page 8.
(3) The “Seller Financing Program” refers to the
initiative whereby the Company provides funding through a warehouse line to a third-party to finance the acquisition and improvement of single-family homes. Once the homes are improved, they are marketed for sale, with the seller
providing financing to the buyer in the form of a mortgage loan
or a bond-for-title contract (“BFT Contract”). The Company may then purchase the mortgage loan or BFT Contract from the counterparty, at which time the associated balance on the warehouse line is repaid.
|
 5
APOLLO RESIDENTIAL MORTGAGE, INC. (“AMTG”)
Financial Summary
($ amounts in thousands except per share data)
September 30,
2014
June 30, 2014
September 30,
2013
September 30,
2014
September 30,
2013
Interest Income
$38,542
$38,141
$34,416
$114,863
$113,992
Interest Expense
(7,708)
(7,510)
(6,789)
(22,486)
(20,243)
Net Interest Income
$30,834
$30,631
$27,627
$92,377
$93,749
Operating
Earnings
(1)
$16,372
$16,521
$11,386
$50,012
$49,377
Weighted
Average
Common
Shares
Outstanding
-
Basic
32,035
32,020
32,000
32,024
29,916
Operating Earnings per Common Share
(1)
$0.51
$0.52
$0.36
$1.56
$1.65
Leverage Multiple (Debt / Equity)
3.9x
3.8x
3.8x
3.9x
3.8x
Annualized
Return
on
Average
Assets
(2)
2.2%
2.3%
1.7%
2.3%
1.9%
Annualized
Return
on
Average
Equity
(3)
9.9%
10.2%
7.7%
10.2%
10.0%
Three Months Ended
Nine Months Ended
(1)
Operating Earnings and Operating Earnings per share of common stock are
non-GAAP financial measures. Operating Earnings and Operating Earnings per share of common stock presented exclude, as applicable: (i) certain
realized and unrealized gains and losses recognized through earnings;
(ii) non-cash equity compensation; (iii) one-time events pursuant to changes in GAAP; and (iv) certain other non-cash charges. Please see pages 17 and 18 for
a reconciliation of Operating Earnings and Operating Earnings per share
of common stock to GAAP net income allocable to common stockholders and GAAP net income allocable to common stockholders per share. Operating
Earnings represents the earnings, as adjusted, allocable to common
stock.
(2)
Annualized Return on Average Assets is calculated as annualized
Operating Earning plus preferred dividend requirement for the period, as a percentage of average interest earning assets, excluding cash.
(3)
Annualized Return on Average Equity is calculated as annualized
Operating Earnings plus preferred dividend requirement for the period, as a percentage of average equity over the period.
|
 6
APOLLO RESIDENTIAL MORTGAGE, INC. (“AMTG”)
Financial Summary
Operating Earnings per Share of Common Stock
(1)
Book Value per Share of Common Stock
Dividends per Share of Common Stock
(1)
$0.36
$0.61
$0.53
$0.52
$0.51
$0.00
$0.15
$0.30
$0.45
$0.60
$0.75
Q3 2013
Q4 2013
Q1 2014
Q2 2014
Q3 2014
$18.50
$18.26
$18.64
$19.49
$19.27
$0.00
$5.00
$10.00
$15.00
$20.00
$25.00
Q3 2013
Q4 2013
Q1 2014
Q2 2014
Q3 2014
$0.40
$0.40
$0.40
$0.42
$0.44
$0.00
$0.10
$0.20
$0.30
$0.40
$0.50
$0.60
Q3 2013
Q4 2013
Q1 2014
Q2 2014
Q3 2014
Operating Earnings and Operating Earnings per share of common stock are
non-GAAP financial measures. Operating Earnings and Operating Earnings per share of common stock presented exclude, as applicable: (i) certain realized and unrealized gains and losses recognized through earnings; (ii) non-
cash equity compensation; (iii) one-time events pursuant to changes
in GAAP; and (iv) certain other non-cash charges. Please see pages 17 and 18 for a reconciliation of Operating Earnings and Operating Earnings per common share to GAAP net income allocable to common stockholders and GAAP net
income allocable to common stockholders per share of common stock.
Operating Earnings represents the earnings, as adjusted, allocable to common stock. |
 7
APOLLO RESIDENTIAL MORTGAGE, INC. (“AMTG”)
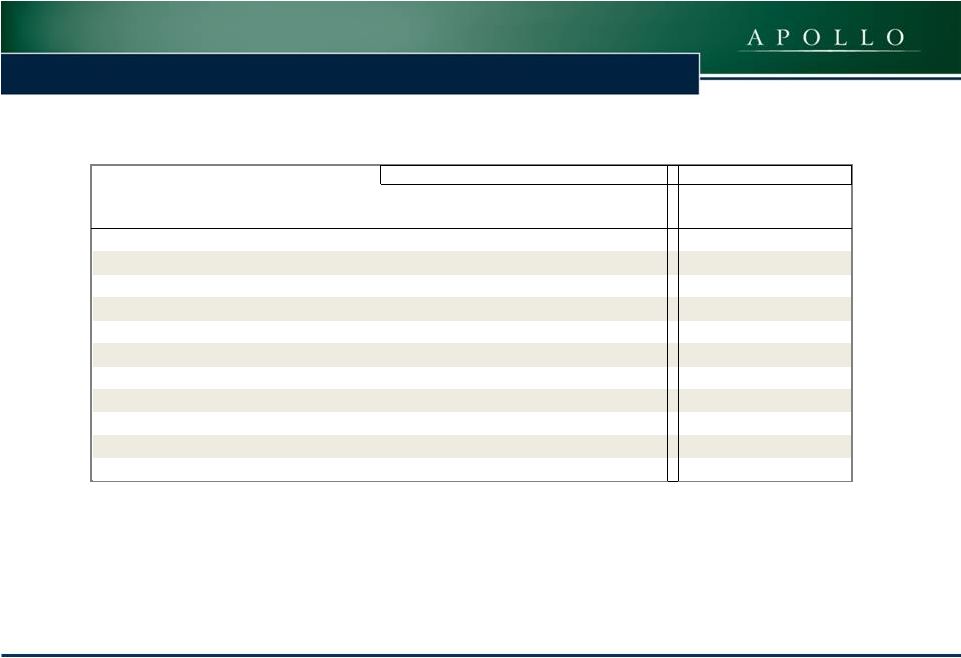
Book Value Roll-Forward
Book Value -
June 30, 2014 (unaudited)
19.49
$
Common stock dividend declared
(0.44)
Operating Earnings, net of preferred dividend
0.51
Non-Operating Items Impacting Net Income:
Unrealized loss on Agency RMBS, net
(0.29)
Unrealized loss on non-Agency RMBS, net
(0.24)
Unrealized loss on securitized mortgage loans, net
(0.02)
Unrealized gain on derivatives, net
0.39
Realized gain on sales of Agency RMBS, net
0.06
Realized gain on sales of non-Agency RMBS, net
0.02
Realized loss on expirations of Swaptions
(0.20)
Other, net
(0.01)
Book Value -
September 30, 2014 (unaudited)
19.27
$ |
 8
APOLLO RESIDENTIAL MORTGAGE, INC. (“AMTG”)
Portfolio Summary and Net Interest Spread
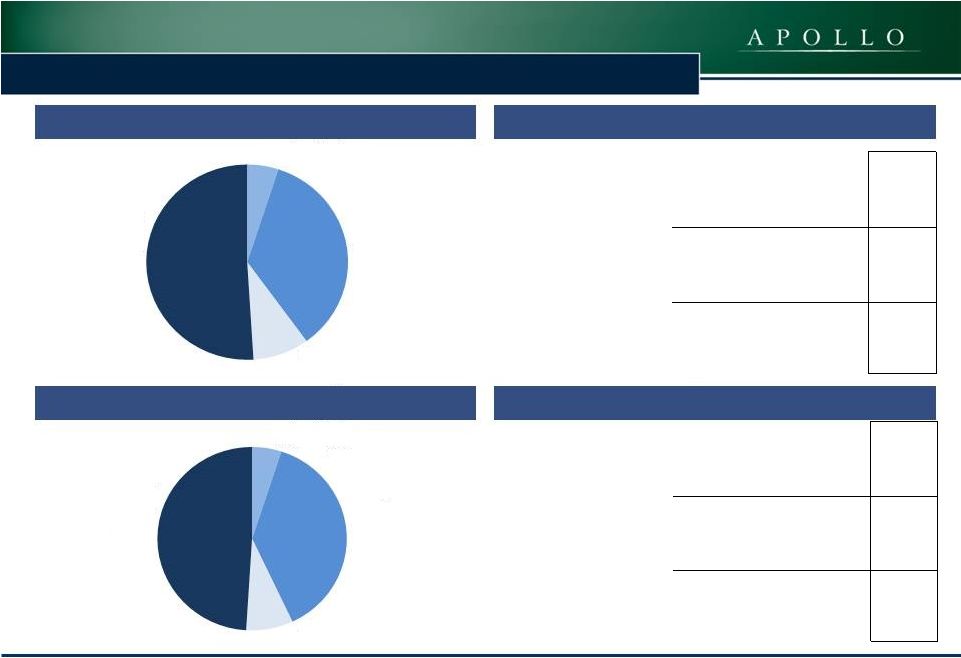
Allocation
of
Portfolio
Equity
at
September
30,
2014
(1)
Effective
Net
Interest
Spread
at
September
30,
2014
(2)
Allocation
of
Portfolio
Equity
at
June
30,
2014
(1)
Effective
Net
Interest
Spread
at
June
30,
2014
(2)
Securitized
Mortgage Loans
5%
Agency RMBS
35%
Cash and Other,
net
9%
Non
-Agency
RMBS and
Other Credit
Investments
51%
Securitized
Mortgage Loans
5%
Agency RMBS
38%
Cash and Other,
net
8%
Non-Agency
RMBS and
Other Credit
Investments
49%
Agency
RMBS
Non-Agency
RMBS and
Other
Credit
Investments
Securitized
Mortgage
Loans
Weighted
Average
Asset Yield
3.0%
6.1%
7.8%
4.3%
Interest Expense
0.3%
2.0%
3.0%
1.0%
Cost of Swaps
1.0%
-
1.9%
0.7%
Effective Net Interest Spread
1.7%
4.1%
2.9%
2.7%
Debt / Equity
(3)
7.1x
2.7x
1.5x
3.9x
Effective Levered Asset Yield
(2)
14.9%
17.4%
12.2%
15.0%
Agency
RMBS
Non-Agency
RMBS and
Other
Credit
Investments
Securitized
Mortgage
Loans
Weighted
Average
Asset Yield
2.9%
6.1%
7.8%
4.3%
Interest Expense
0.3%
2.0%
3.1%
1.0%
Cost of Swaps
1.0%
-
1.9%
0.7%
Effective Net Interest Spread
1.6%
4.1%
2.8%
2.6%
Debt / Equity
(3)
6.4x
2.7x
1.5x
3.8x
Effective Levered Asset Yield
(2)
12.9%
17.3%
12.2%
14.1%
(1)
Percentages reflect amount of equity allocated to Agency RMBS,
non-Agency RMBS and other credit investments and securitized mortgage loans, net of associated assets and liabilities, including the fair value of interest rate derivatives. Cash and
other net, represents cash and other assets and liabilities not
specifically allocable to Agency RMBS, non-Agency RMBS and other credit investments or securitized mortgage loans.
(2)
Effective net interest spread and effective levered asset yield are
non-GAAP financial measures, which include the cost of the Company’s Swaps as a component of its interest expense, as presented.
(3)
Debt/Equity multiples for each asset class are adjusted to reflect cash
held to meet margin calls and certain other assets and liabilities specifically allocable to Agency RMBS, non-Agency RMBS and other credit investments or securitized mortgage
loans.
|
 9
APOLLO RESIDENTIAL MORTGAGE, INC. (“AMTG”)
Agency RMBS Portfolio at September 30, 2014
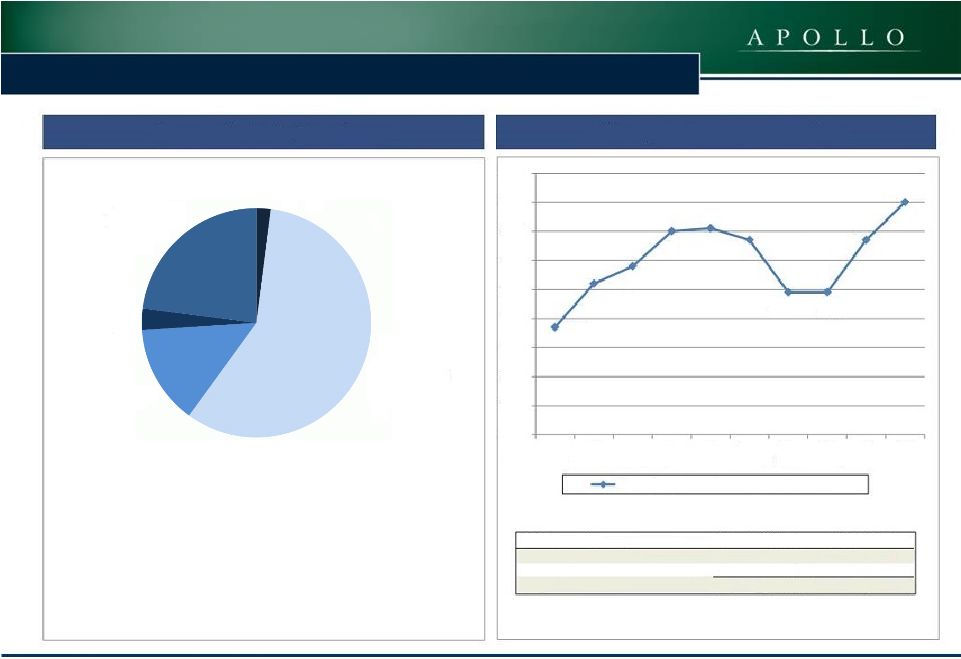
Agency Portfolio Overview
Constant Prepayment Rates
(1)
Other includes Interest Only and Inverse Interest Only Securities
and Inverse Floaters. 3.7%
5.2%
5.8%
7.0%
7.1%
6.7%
4.9%
4.9%
6.7%
8.0%
0.0%
1.0%
2.0%
3.0%
4.0%
5.0%
6.0%
7.0%
8.0%
9.0%
Q2
2012
Q3
2012
Q4
2012
Q1
2013
Q2
2013
Q3
2013
Q4
2013
Q1
2014
Q2
2014
Q3
2014
Total Agency Portfolio average one month CPR
Loan Balance 15
Year Pass-Throughs
2%
Loan Balance 30
Year Pass-Throughs
58%
Low Credit 30 Year
Pass-Throughs
14%
Other(1)
3%
HARP / MHA /
High LTV 30 Year
Pass-Throughs
23%
($ in thousands)
Estimated Fair Value
Q3 2014 CPR
Agency Pass-Throughs
2,084,678
$
7.9
%
Agency Inverse Floaters, IOs and IIOs
60,745
11.8
Total
2,145,423
$
8.0
% |
 10
APOLLO RESIDENTIAL MORTGAGE, INC. (“AMTG”)
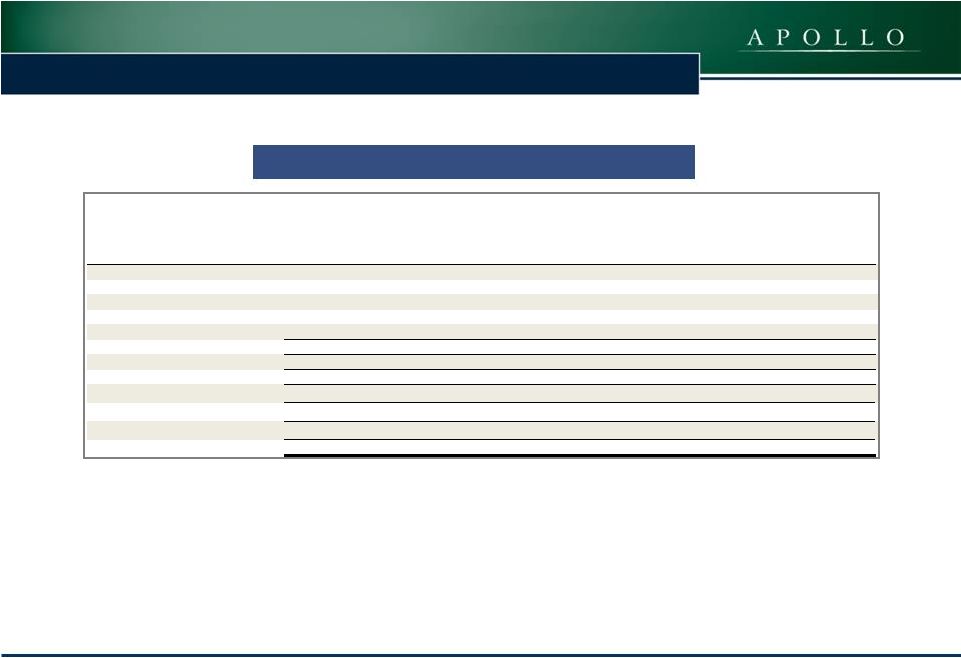
Agency RMBS Portfolio at September 30, 2014
Agency RMBS Portfolio Composition Summary
($ in thousands)
Principal Balance
Unamortized
Premium
Amortized Cost
(1)
Estimated Fair
Value
Weighted
Average
Coupon
Estimated
Weighted
Average
Yield
(2)
30-Year Mortgages
Fixed-rate coupons:
3.5%
149,142
$
6,878
156,020
152,392
3.50
%
2.80
4.0%
1,302,012
93,114
1,395,126
1,375,410
4.00
%
2.86
4.5%
466,745
35,394
502,139
506,427
4.50
%
3.05
1,917,899
135,386
2,053,285
2,034,229
4.08
%
2.90
15-Year Mortgages
3.0% Coupons
48,941
1,312
50,253
50,449
3.00
%
2.47
Agency Inverse Floaters
(3)
1,381
3,723
5,104
5,122
81.83
12.43
Agency IOs
(4)
-
-
24,471
25,255
4.02
%
0.41
Agency IIOs
(4)
-
-
30,445
30,368
6.22
%
12.81
Total Agency RMBS
1,968,221
$
140,421
$
2,163,558
$
2,145,423
$
4.23
%
3.02
(1)
Amortized cost is reduced by unrealized losses that are classified as
other-than-temporary impairments. (2)
Estimated weighted average yield at the date presented incorporates
prepayment assumptions and forward interest rate assumptions on Agency RMBS.
(3)
Agency inverse floaters are comprised of securities that have a floating
interest rate with coupons that reset periodically based on an index and which coupon varies inversely with changes in the index, which index is typically one-
month London Interbank Offer Rate, or LIBOR.
(4)
Agency IOs and Agency IIOs have no principal balance and bear interest
on a notional balance. The notional balance is used solely to determine interest distributions on interest-only classes of securities. At September 30, 2014,
Agency IOs had a notional balance of $293,345 and Agency Inverse IOs had
a notional balance of $143,983. |
 11
APOLLO RESIDENTIAL MORTGAGE, INC. (“AMTG”)
Non-Agency
RMBS
Portfolio
Overview
(1)
Non-Agency RMBS Portfolio at September 30, 2014
Non-Agency
RMBS
Portfolio
Vintage
(1)
Non-Agency
RMBS
Cash-Flow
Profile
(1)
(1)
Includes $19,610 of small balance commercial mortgage backed
securities. Subprime
76%
Pay-Option
ARM
11%
Small
-Balance
Commercial
1%
Alt-A
12%
1998-2002
4%
2003
7%
2004
30%
2005
32%
2006
17%
2007
8%
2014
2%
Current-Pay
58%
Locked-Out
42% |
 12
APOLLO RESIDENTIAL MORTGAGE, INC. (“AMTG”)
Non-Agency RMBS Portfolio at September 30, 2014
September 30, 2014
Portfolio Characteristics
Estimated Fair Value ($ in thousands)
$1,445,016
Amortized Cost to Par Value
81.5%
Net Weighted Average Security Coupon
1.2%
Collateral Attributes
Weighted Average Loan Age (months)
116
Weighted Average Original Loan-to-Value
79.8%
Weighted Average Original FICO Credit Score
642
Current Performance
60+ Day Delinquencies
29.2%
Average Credit Enhancement
(1)
33.3%
3 Month CRR
(2)
4.7%
(1) Credit enhancement is expressed as a percentage of all
outstanding mortgage loan collateral. The Company's non-Agency RMBS may incur losses if credit enhancement is reduced to zero.
(2) CRR represents conditional repayment rate. Information
is based on loans for individual groups owned by the Company. Amounts presented reflect the weighted average monthly performance for the three months ended
September 30, 2014.
|
 13
APOLLO RESIDENTIAL MORTGAGE, INC. (“AMTG”)
Financing and Derivative Instruments Overview
Borrowings at September 30, 2014
Derivative Instruments at September 30, 2014
Swaps Overview at September 30, 2014
Swaptions Overview at September 30, 2014
($ in
thousands)
Notional Amount
Estimated Fair
Value
Swaps -
assets
957,000
$
22,429
$
Swaptions -
assets
1,100,000
2,593
Swaps -
(liabilities)
730,000
(5,018)
Total Derivative Instruments
2,787,000
$
20,004
$
($ in thousands)
Term to Maturity
Notional Amount
Average Fixed Pay
Rate
Average
Maturity
(Years)
Greater than 1 year up to 3 years
920,000
$
1.07%
2.7
Greater than 3 years up to 5 years
189,000
1.02%
3.5
Greater than 5 years
578,000
2.13%
8.2
Total
1,687,000
$
1.43%
4.6
($ in thousands)
Weighted
Average
Weighted
Months Until
Average
Fixed Pay Rate for
Option
Notional
Swap Terms
Fixed-Pay
Underlying Swap
Fair Value
Expiration
Amount
(Years)
Rate
2.50 -
3.00%
768
$
8
160,000
$
5.0
2.77%
3.00 -
3.50%
183
11
15,000
10.0
3.42%
3.50 -
4.00%
1,642
6
925,000
10.0
3.76%
2,593
$
6
1,100,000
$
9.3
3.61%
Option
Underlying Swap
($ in thousands)
Balance
Weighted
Average
Borrowing
Rate
Weighted
Average
Remaining
Maturity
Repurchase agreement borrowings:
Agency RMBS
1,934,669
$
0.33%
16 days
Non-Agency RMBS
(1)
1,116,411
1.97%
167 days
Other investment securities
25,728
1.74%
77 days
Total repurchase agreements
3,076,808
$
0.94%
71 days
Securitized debt
34,947
$
4.00%
53 months
(2)
Total Borrowings
3,111,755
$
0.97%
(1)
Includes $29,177 of repurchase borrowings collateralized by
non-Agency RMBS of $48,036 that were eliminated from the Company’s consolidated balance sheet in consolidation with the variable interest entity associated with our securitization transaction.
(2)
Securitized debt, which represents non-recourse senior securities
sold to third parties in connection with a securitization transaction, has a final contractual maturity of May 2047. Weighted average remaining maturity represents the underwritten final maturity of the security
based on the projected final repayment of principal. The actual
maturity of the securitized debt may differ significantly given that actual interest collections, mortgage prepayments and/or losses on liquidation of mortgages may differ significantly from those expected.
|
 14
APOLLO RESIDENTIAL MORTGAGE, INC. (“AMTG”)
Financials |
 15
APOLLO RESIDENTIAL MORTGAGE, INC. (“AMTG”)
Balance Sheet
(in thousands—except share and per share data)
September 30, 2014
December 31, 2013
Assets:
(unaudited)
Cash
105,904
$
127,959
$
Restricted cash
66,399
67,458
RMBS, at fair value (of which $3,424,933 and $3,317,060 were pledged
as collateral, respectively) 3,590,439
3,503,326
Securitized mortgage loans (transferred to a consolidated VIE), at
fair value 106,947
110,984
30,688
11,515
Other investments
25,512
-
Investment related receivable (of which $0 and $21,959 were pledged as
collateral, respectively) 6,095
24,887
Interest receivable
10,020
10,396
Deferred financing costs, net
773
882
Derivative instruments, at fair value
25,022
53,315
Other assets
1,072
854
Total Assets
3,968,871
$
3,911,576
$
Liabilities and Stockholders' Equity
Liabilities:
Borrowings under repurchase agreements
3,076,808
$
3,034,058
$
Non-recourse securitized debt, at fair value
36,188
43,354
Investment related payable
11,505
-
Obligation to return cash held as collateral
14,656
38,654
Accrued interest payable
10,332
8,708
Derivative instruments, at fair value
5,018
4,610
Payable to related party
5,036
5,444
Dividends payable
17,558
16,812
Accounts payable and accrued expenses
1,336
2,335
Other liabilities
6
-
Total Liabilities
3,178,443
$
3,153,975
$
Stockholders' Equity:
Preferred stock, $0.01 par value, 50,000,000 shares authorized,
6,900,000 shares issued and outstanding ($172,500 aggregate
liquidation preference) 69
$
69
$
Common stock, $0.01 par value, 450,000,000 shares authorized,
32,063,141 and 32,038,970 shares issued and outstanding,
respectively 321
320
Additional paid-in-capital
793,021
792,010
Accumulated deficit
(2,983)
(34,798)
Total Stockholders' Equity
790,428
$
757,601
$
Total Liabilities and Stockholders'
Equity 3,968,871
$
3,911,576
$
Other investment securities, at fair value (of
which $30,688 and $11,515 were pledged as collateral, respectively) |
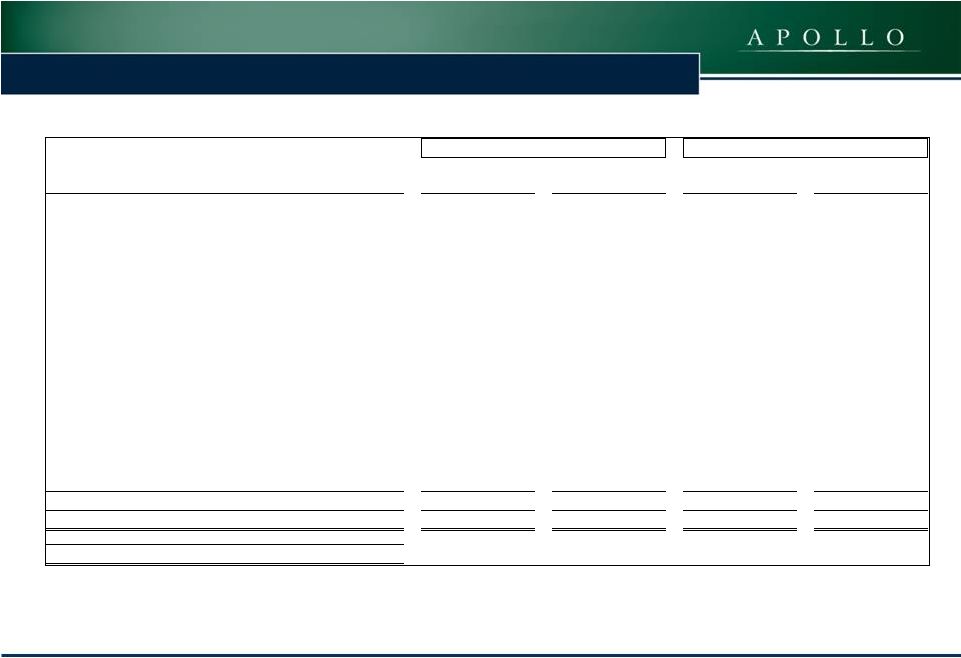
 16
APOLLO RESIDENTIAL MORTGAGE, INC. (“AMTG”)
Income Statement
(in thousands—except per share data)
2014
2013
2014
2013
Interest Income:
RMBS
36,277
$
32,013
$
108,093
$
107,959
$
Securitized mortgage loans
1,871
2,324
6,044
5,954
Other
394
79
726
79
Total Interest Income
38,542
34,416
114,863
113,992
Interest Expense:
Repurchase agreements
(7,310)
(6,299)
(21,214)
(18,935)
Securitized debt
(398)
(490)
(1,272)
(1,308)
Total Interest Expense
(7,708)
(6,789)
(22,486)
(20,243)
Net Interest Income
30,834
$
27,627
$
92,377
$
93,749
$
Other Income/(Loss):
Realized gain/(loss) on sale of RMBS, net
2,581
$
(16,596)
$
(16,301)
$
(48,309)
$
Gain/(loss) on derivative instruments, net (includes
$12,434, ($27,572), ($20,751) and $50,547 of unrealized
gains/(losses), net, respectively)
801
(21,687)
(63,522)
55,884
Unrealized gain/(loss) on RMBS, net
(16,971)
28,143
85,266
(139,727)
Unrealized gain/(loss) on securitized debt
67
(428)
(287)
(413)
Unrealized gain/(loss) on securitized mortgage loans, net
(650)
537
2,440
(88)
Unrealized gain/(loss) on other investment securities
(101)
116
75
116
Other, net
39
4
14
72
Other Income/(Loss), net
(14,234)
$
(9,911)
$
7,685
$
(132,465)
$
Operating Expenses:
General and administrative (includes ($144), ($207), ($1,011) and
($752) of non-cash stock based compensation,
respectively) (2,925)
$
(3,089)
$
(8,941)
$
(8,374)
$
Management
fee
-
related
party
(2,800)
(2,941)
(8,360)
(8,651)
Total Operating Expenses
(5,725)
$
(6,030)
$
(17,301)
$
(17,025)
$
Net Income/(Loss)
10,875
$
11,686
$
82,761
$
(55,741)
$
Preferred Stock Dividends Declared
(3,450)
(3,450)
(10,350)
(10,350)
Net Income/(Loss) Allocable to Common Stock and
Participating Securities
7,425
$
8,236
$
72,411
$
(66,091)
$
Earnings/(Loss)
per
Share
of
Common
Stock
-
Basic
and
Diluted
0.23
$
0.25
$
2.25
$
(2.22)
$
Dividends Declared per Share of Common
Stock 0.44
$
0.40
$
1.26
$
1.80
$
Three Months Ended
September 30,
NineMonths Ended
September 30,
(Unaudited)
(Unaudited) |
 17
APOLLO RESIDENTIAL MORTGAGE, INC. (“AMTG”)
Reconciliation
of
Operating
Earnings
(1)
(in thousands—except share and per share data)
September 30, 2014
Per Share
Amount
(2)
September 30, 2013
Per Share
Amount
(2)
Operating Earnings:
Net income/(loss) allocable to common stockholders
7,344
$
0.23
$
8,158
$
0.25
$
Adjustments:
Non-cash stock-based compensation expense
144
-
207
0.01
Unrealized (gain)/loss on RMBS, net
16,971
0.53
(28,143)
(0.88)
Unrealized (gain)/loss on derivatives, net
(12,434)
(0.39)
27,572
0.86
Unrealized (gain)/loss on securitized mortgage loans, net
650
0.02
(537)
(0.02)
Unrealized (gain)/loss on securitized debt
(67)
-
428
0.01
Unrealized (gain)/loss on other investment securities
101
-
(116)
-
Realized (gain)/loss on sale of RMBS, net
(2,581)
(0.08)
16,596
0.52
Realized (gain) on Short TBA Contracts
-
-
(281)
(0.01)
Realized (gain)/loss on Swaps/Swaption terminations and
expirations, net
6,505
0.20
(12,498)
(0.38)
Tax amortization of (loss) on Swaption terminations and
expirations, net
(250)
-
-
-
Other, net
(11)
-
-
-
Total adjustments to arrive at operating earnings:
9,028
0.28
3,228
0.11
Operating Earnings
16,372
$
0.51
$
11,386
$
0.36
$
Weighted average common shares
32,035,376
31,999,792
Three Months Ended
Three Months Ended
(1)
Operating Earnings and Operating Earnings per share of common stock are
non-GAAP financial measures. Operating Earnings and Operating Earnings per hare of common stock presented exclude, as applicable: (i) certain realized and unrealized gains and losses recognized
through earnings; (ii) non-cash equity compensation; (iii) one time
events pursuant to changes in GAAP; and (iv) certain other non-cash charges. Operating Earnings represents the earnings, as adjusted, allocable to common stock.
(2)
Reflects per share amount for each component presented.
|
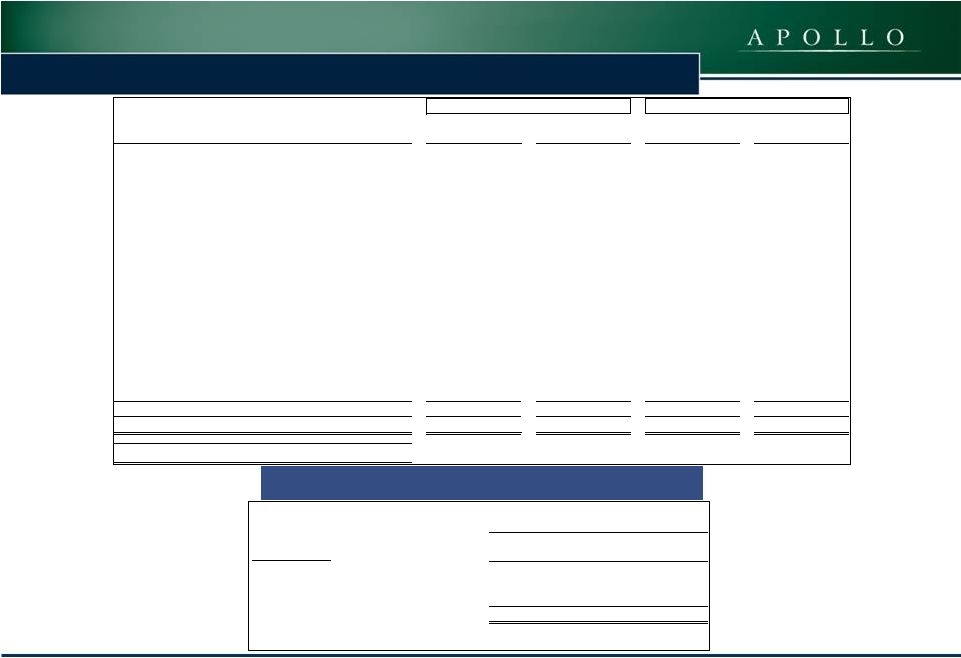 18
APOLLO RESIDENTIAL MORTGAGE, INC. (“AMTG”)
Reconciliation of Operating Earnings
(1)
and Effective Cost of Funds
(2)
Effective Cost of Funds
($ in thousands)
Reconciliation
Cost of Funds/Effective
Cost of Funds
Interest expense
7,708
$
0.99%
Adjustment:
Net-interest paid for Swaps
5,128
0.66%
Effective interest expense/effective cost of funds
12,836
$
1.65%
Weighted average balance of borrowings
3,304,970
$
September 30, 2014
Three Months Ended
(in thousands—except share and per share data)
September 30, 2014
Per Share
Amount
(3)
September 30, 2013
Per Share
Amount
(3)
Operating Earnings:
Net income/(loss) allocable to common stockholders
71,960
$
2.25
$
(66,442)
$
(2.22)
$
Adjustments:
Non-cash stock-based compensation expense
1,011
0.03
752
0.03
Unrealized (gain)/loss on RMBS, net
(85,266)
(2.66)
139,727
4.67
Unrealized (gain)/loss on derivatives, net
20,751
0.65
(50,547)
(1.69)
Unrealized (gain)/loss on securitized mortgage loans, net
(2,440)
(0.08)
88
-
Unrealized loss on securitized debt
287
0.01
413
0.01
Unrealized (gain) on other investment securities
(75)
-
(116)
-
Realized loss on sale of RMBS, net
16,301
0.51
48,309
1.61
Realized (gain)/ loss on Short TBA Contracts
7,156
0.22
(281)
(0.01)
Realized (gain)/loss on Swaps/Swaption terminations and
expirations, net
20,617
0.64
(22,526)
(0.75)
Tax amortization of gain/(loss) on Swaption terminations and
expirations, net
(342)
(0.01)
-
-
Other
52
-
-
-
Total adjustments to arrive at operating earnings:
(21,948)
(0.69)
115,819
3.87
Operating Earnings
50,012
$
1.56
$
49,377
$
1.65
$
Weighted average common shares
32,023,617
29,916,932
Nine Months Ended
Nine Months Ended
(1)
Operating Earnings and Operating Earnings per common share are
non-GAAP financial measures. Operating Earnings and Operating Earnings per common share presented exclude, as applicable: (i) certain realized and unrealized gains and losses recognized through
earnings; (ii) non-cash equity compensation; (iii) one time events
pursuant to changes in GAAP; and (iv) certain other non-cash charges. Operating Earnings represents the earnings, as adjusted, allocable to common stock.
(2)
Effective cost of funds reflects interest expense adjusted to include
the net interest component related to Swaps. (3) Reflects per share amount for
each component presented. |
 19
APOLLO RESIDENTIAL MORTGAGE, INC. (“AMTG”)
Contact Information
Hilary Ginsberg
Investor Relations Manager
212-822-0767 |