Attached files
| file | filename |
|---|---|
| EX-23.1 - EX-23.1 - Upland Software, Inc. | d710680dex231.htm |
| EX-23.2 - EX-23.2 - Upland Software, Inc. | d710680dex232.htm |
| EX-23.3 - EX-23.3 - Upland Software, Inc. | d710680dex233.htm |
Table of Contents
As filed with the Securities and Exchange Commission on November 5, 2014.
Registration No. 333-198574
UNITED STATES
SECURITIES AND EXCHANGE COMMISSION
Washington, D.C. 20549
AMENDMENT NO. 2
TO
FORM S-1
REGISTRATION STATEMENT
Under
The Securities Act of 1933
Upland Software, Inc.
(Exact name of registrant as specified in its charter)
| Delaware | 7372 | 27-2992077 | ||
| (State or other jurisdiction of incorporation or organization) |
(Primary Standard Industrial Classification Code Number) |
(I.R.S. Employer Identification Number) |
401 Congress Avenue, Suite 1850
Austin, Texas 78701
(512) 960-1010
(Address, including zip code, and telephone number, including area code, of registrant’s principal executive offices)
John T. McDonald
Upland Software, Inc.
401 Congress Avenue, Suite 1850
Austin, Texas 78701
(512) 960-1010
(Name, address, including zip code, and telephone number, including area code, of agent for service)
Copies to:
| Brian K. Beard Joseph M. Alcorta Wilson Sonsini Goodrich & Rosati, Professional Corporation 900 South Capital of Texas Highway Las Cimas, Fifth Floor Austin, Texas, 78746-5546 (512) 338-5400 |
Robert V. Housley General Counsel and Secretary Upland Software, Inc. 401 Congress Avenue, Suite 1850 Austin, Texas 78701 (512) 960-1010 |
Brian Schafer Winston & Strawn LLP (312) 558-5600 |
Approximate date of commencement of proposed sale to the public: As soon as practicable after the effective date of this Registration Statement.
If any of the securities being registered on this Form are to be offered on a delayed or continuous basis pursuant to Rule 415 under the Securities Act, check the following box. ¨
If this Form is filed to register additional securities for an offering pursuant to Rule 462(b) under the Securities Act, please check the following box and list the Securities Act registration statement number of the earlier effective registration statement for the same offering. ¨
If this Form is a post-effective amendment filed pursuant to Rule 462(c) under the Securities Act, check the following box and list the Securities Act registration statement number of the earlier effective registration statement for the same offering. ¨
If this Form is a post-effective amendment filed pursuant to Rule 462(d) under the Securities Act, check the following box and list the Securities Act registration statement number of the earlier effective registration statement for the same offering. ¨
Indicate by check mark whether the registrant is a large accelerated filer, an accelerated filer, a non-accelerated filer, or a smaller reporting company. See the definitions of “large accelerated filer,” “accelerated filer” and “smaller reporting company” in Rule 12b-2 of the Exchange Act.
| Large accelerated filer | ¨ | Accelerated filer | ¨ | |||
| Non-accelerated filer | x (Do not check if a smaller reporting company) | Smaller reporting company | ¨ | |||
CALCULATION OF REGISTRATION FEE
|
| ||||||||
| Title of Each Class of Securities to be Registered |
Amount to be registered |
Proposed Maximum Offering
Price |
Proposed Maximum Offering Price(1)(2) |
Amount of Registration Fee(3) | ||||
| Common Stock, $0.0001 par value per share |
4,423,077 | $14.00 | $61,923,078 | $7,825.46 | ||||
|
| ||||||||
|
| ||||||||
| (1) | Includes 576,923 shares that the underwriters have the option to purchase. |
| (2) | Estimated solely for the purpose of computing the amount of the registration fee pursuant to Rule 457(a) under the Securities Act of 1933, as amended. |
| (3) | Previously paid. |
The Registrant hereby amends this Registration Statement on such date or dates as may be necessary to delay its effective date until the Registrant shall file a further amendment which specifically states that this Registration Statement shall thereafter become effective in accordance with Section 8(a) of the Securities Act of 1933, as amended, or until the Registration Statement shall become effective on such date as the Securities and Exchange Commission, acting pursuant to said Section 8(a), may determine.
Table of Contents
The information in this prospectus is not complete and may be changed. These securities may not be sold until the registration statement filed with the Securities and Exchange Commission is effective. This preliminary prospectus is not an offer to sell these securities, nor does it seek an offer to buy these securities in any jurisdiction where the offer or sale is not permitted.
SUBJECT TO COMPLETION, DATED NOVEMBER 5, 2014
PROSPECTUS
3,846,154 Shares

Common Stock
This is the initial public offering of 3,846,154 shares of common stock of Upland Software, Inc. Prior to this offering, there has been no public market for our common stock. The initial public offering price of the common stock is expected to be between $12.00 and $14.00 per share.
We have been approved to list our common stock on the NASDAQ Global Market under the symbol “UPLD.”
We are an “emerging growth company” under the federal securities laws and, as such, may elect to comply with certain reduced public company reporting requirements.
Investing in our common stock involves a high degree of risk. See “Risk Factors” beginning on page 15.
| Per Share | Total | |||||||
| Initial public offering price |
$ | $ | ||||||
| Underwriting discounts and commissions(1) |
$ | $ | ||||||
| Proceeds, before expenses, to us |
$ | $ | ||||||
| (1) | See “Underwriting.” |
Certain of our existing stockholders, including John T. McDonald, our Chief Executive Officer and chairman of our board of directors, entities associated with Austin Ventures, each of which is an affiliate of a member of our board of directors, and ESW Capital, LLC or its affiliates, have indicated an interest in purchasing shares of common stock with an aggregate purchase price of up to $5.0 million, or up to 10% of the proposed offering size based on an assumed initial public offering price of $13.00 per share, the midpoint of the price range set forth on the cover page of this prospectus. However, because indications of interest are not binding agreements or commitments to purchase, the underwriters may determine to sell more, less or no shares in this offering to such stockholders, or such stockholders may determine to purchase more, less or no shares in this offering. The underwriters will receive the same discount from shares of our common stock purchased by such stockholders as they will from other shares of our common stock sold to the public in this offering.
Neither the Securities and Exchange Commission nor any state securities commission has approved or disapproved of these securities or determined if this prospectus is truthful or complete. Any representation to the contrary is a criminal offense.
We have granted the underwriters the option to purchase up to an additional 576,923 shares of common stock at the public offering price, less the underwriting discount, within 30 days of the date of this prospectus to cover over-allotments.
The underwriters expect to deliver the shares of common stock to purchasers on , 2014.
Joint Book-Running Managers
| William Blair | Raymond James |
| Canaccord Genuity | Needham & Company |
The date of this prospectus is , 2014
Table of Contents
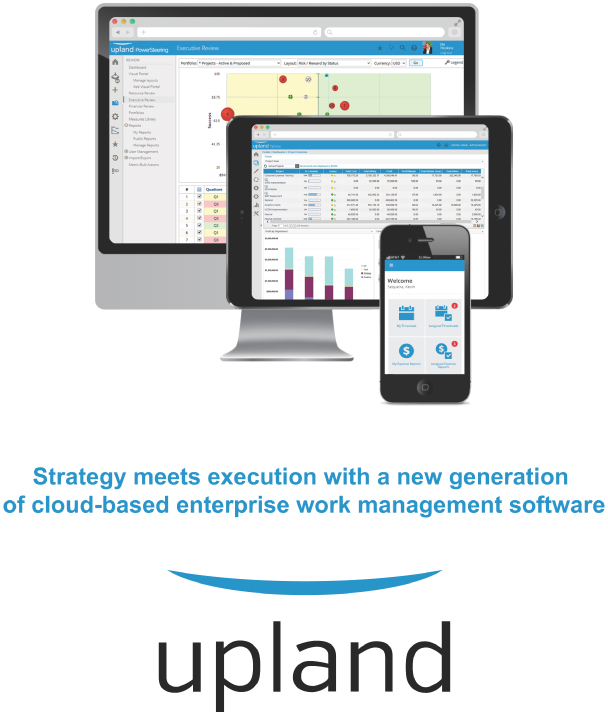
Table of Contents
| Page | ||||
| 1 | ||||
| 15 | ||||
| 40 | ||||
| 42 | ||||
| 43 | ||||
| 43 | ||||
| 44 | ||||
| 46 | ||||
| 48 | ||||
| Management’s Discussion and Analysis of Financial Condition and Results of Operations |
52 | |||
| 86 | ||||
| 99 | ||||
| 107 | ||||
| 115 | ||||
| 120 | ||||
| 123 | ||||
| 128 | ||||
| Material U.S. Federal Tax Considerations For Non-U.S. Holders |
131 | |||
| 135 | ||||
| 141 | ||||
| 141 | ||||
| 141 | ||||
| F-1 | ||||
Neither we nor the underwriters have authorized anyone to provide you with any additional information or information that is different from that contained in this prospectus or any related free writing prospectus. We take no responsibility for, and can provide no assurance as to the reliability of, any other information that others may give you. This prospectus is an offer to sell only the shares offered hereby, but only under circumstances and in jurisdictions where it is lawful to do so. The information contained in this prospectus is current only as of its date. Our business, financial condition, results of operations and prospects may have changed since that date.
No action is being taken in any jurisdiction outside the United States to permit a public offering of our common stock or possession or distribution of this prospectus in any such jurisdiction. Persons who come into possession of this prospectus in jurisdictions outside the United States are required to inform themselves about and to observe any restrictions as to this offering and the distribution of this prospectus applicable to those jurisdictions.
Unless otherwise indicated, information contained in this prospectus concerning our industry and the markets in which we operate, including our general expectations and market position, market opportunity and market size, is based on information from various sources, including independent data, research opinions and viewpoints published by International Data Corporation, or IDC, and McKinsey & Company, or McKinsey, on assumptions that we have made that are based on those and other similar sources and on our knowledge of the markets for our applications. See “Market, Industry and Other Data” for further information.
-i-
Table of Contents
The following summary highlights information contained elsewhere in this prospectus but may not contain all of the information that you consider important in making your investment decision. Before investing in our common stock, you should carefully read this entire prospectus, including our consolidated financial statements and the related notes included in this prospectus and the information set forth under the headings “Risk Factors” and “Management’s Discussion and Analysis of Financial Condition and Results of Operations.” Unless the context requires otherwise, the words “Upland,” “we,” “company,” “us” and “our” refer to Upland Software, Inc. and its subsidiaries.
UPLAND SOFTWARE, INC.
Company Overview
Upland is a leading provider of cloud-based enterprise work management software. We define enterprise work management software as software applications that enable organizations to plan, manage and execute projects and work. Our software applications help organizations better optimize the allocation and utilization of their people, time and money. We provide a family of cloud-based enterprise work management software applications for the information technology, marketing, finance, professional services and process excellence functions within organizations. Our software applications address a broad range of enterprise work management needs, from strategic planning to task execution.
We provide organizations and their knowledge workers with software applications that better align resources with business objectives and increase visibility, governance, collaboration and responsiveness to changes in the business environment. This results in increased work capacity, higher productivity and better execution. Our applications are easy-to-use, highly scalable and offer real-time collaboration for knowledge workers distributed on a local or global scale. Our applications address enterprise work challenges in the following categories:
| • | Program and Portfolio Management: Enables customers to gain high-level visibility across their organizations and improve top-down governance and management of programs, initiatives, investments and projects. |
| • | Project Management and Collaboration: Enables customers to improve collaboration and the execution of both projects and unstructured work. |
| • | Workflow Automation and Enterprise Content Management: Enables customers to automate document-based workflows and control access and distribution of their content to boost productivity, encourage collaboration, improve compliance and enhance and influence customer engagement. |
| • | Professional Services Automation: Enables customers to more effectively manage their knowledge workers to better track work, expenses and client billing while improving scheduling, utilization and alignment of human capital. |
| • | Financial Management: Enables customers to have visibility into the cost, quality and value of internal services delivered within their organizations, which helps improve alignment during planning and budgeting processes, and better assess and validate proposed investments and initiatives of a particular line of business. |
We sell our software applications primarily through a direct sales organization and employ a land-and-expand go-to-market strategy. After we demonstrate the value of an initial application to an organization, our sales and account management teams work to expand the use of that initial application across the organization, as
-1-
Table of Contents
well as cross-sell additional applications to address other enterprise work management needs of the organization. In addition to our direct sales organization, we have an indirect sales organization, which sells to distributors and value-added resellers. Our subscription agreements are typically sold either on a per-seat basis or on a minimum contracted volume basis with overage fees billed in arrears, depending on the application being sold. We service customers ranging from large global corporations and government agencies to small- and medium-sized businesses. As of December 31, 2013, we had more than 1,200 customers with over 200,000 users, excluding users under volume-based contracts, across a broad range of industries, including financial services, retail, technology, manufacturing, education, consumer goods, media, telecommunications, government, food and beverage, healthcare and life sciences.
We have achieved significant growth and scale in a relatively short period of time. Through a series of acquisitions, we have established a diverse family of software applications under the Upland brand, each of which addresses a specific enterprise work management need. Our revenue has grown from $22.8 million in fiscal 2012 to $41.2 million in fiscal 2013 and from $18.7 million in the first six months of 2013 to $31.8 million in the first six months of 2014, representing an 80% and 70% period-over-period growth rate, respectively. We recorded Adjusted EBITDA of $0.7 million, $2.7 million and $2.6 million in fiscal 2012 and 2013 and the first six months of 2014, respectively, and a net loss of $2.5 million, $9.2 million and $15.0 million in fiscal 2012 and 2013 and the first six months of 2014, respectively. See “—Summary Consolidated Financial Data” for the definition of Adjusted EBITDA and a reconciliation of Adjusted EBITDA to net loss, the most directly comparable GAAP measure.
Industry Background
A Rapidly Changing Business Environment
The continued growth of an information-based economy driven by technological innovation and globalization is causing a fundamental change in the business environment and the way work is done. To be successful, organizations must be able to quickly adapt to changes in this complex and rapidly evolving environment and optimize the utilization of their people, time and money. These changes have given rise to a large and growing group of knowledge workers who operate in dynamic work settings as part of geographically dispersed and virtual teams. To be successful, these knowledge workers must quickly synthesize, analyze and act on large amounts of information and collaborate effectively at any time, from anywhere and on any device.
Legacy Processes and Systems are Insufficient
Many organizations continue to utilize manual processes and traditional tools, such as paper-based techniques, spreadsheets and email, as well as legacy on-premise enterprise systems, to manage knowledge work. The limitations of these processes and systems include siloed and disparate information, limited visibility and transparency, poor collaboration among teams, lost productivity and misalignment of work efforts and overall business objectives. In addition, legacy on-premise enterprise systems can be expensive and time intensive to implement, inflexible and difficult to use, and costly to upgrade and maintain.
The Need for Cloud-Based Enterprise Work Management Software
Enterprise work management software is an emerging category of software applications that enable organizations to effectively plan, manage and execute projects and work in order to maximize work capacity, productivity and profitability. Recently, cloud computing and software-as-a-service, or SaaS, has begun to transform enterprise work management with rapid speed-to-value, low total cost of ownership and reduced financial risk. As a result of these benefits, the annual growth rate of the SaaS market is expected to be significantly greater than the worldwide application software market. IDC estimates that the worldwide SaaS applications market will grow at a compound annual growth rate of 19%, from $18 billion in 2012 to $42 billion
-2-
Table of Contents
in 2017, while the worldwide application software market will grow at a compound annual growth rate of 6%, from $168 billion to $225 billion in 2017.
We currently participate in various areas of enterprise work management, including the markets that IDC identifies as worldwide project and portfolio management, worldwide business process management software, worldwide financial performance and strategy management applications, worldwide collaborative applications and worldwide content management software. In aggregate, IDC estimates these markets will exceed $27 billion globally in 2014. While these markets today are largely served by legacy on-premise enterprise systems, we believe there will continue to be increased market adoption of cloud-based enterprise work management software applications.
The Upland Approach
Our award-winning cloud-based enterprise work management software applications improve visibility, collaboration and productivity and are disrupting and replacing legacy processes and systems. Unlike legacy solutions, our applications have been developed with the unique requirements of today’s knowledge worker in mind. We enable knowledge workers to interact, collaborate and make business decisions using real-time information from a wide variety of sources, at any time, from anywhere and on any device.
We believe our applications benefit customers in the following ways:
| • | Do the right work. Our applications enable our customers to more effectively align programs, initiatives, investments and projects with overall business objectives, helping ensure the right work is done at the right time. This alignment drives increased productivity and optimizes the allocation and utilization of people, time and money within organizations. |
| • | Do the work right. Our applications help customers to more effectively manage projects and tasks by enabling real-time visibility, collaboration, structured workflows and access to the right content and information. This provides teams of distributed workers with clarity into priorities and expectations as well as the tools to execute effectively, resulting in increased productivity, transparency and accountability and the ability to respond rapidly to change. |
| • | Single source of truth. Our applications collect real-time data regarding the planning, management and execution of projects and work processes across teams and business units from disparate sources and integrate such data into a single repository, which we call a “single source of truth.” This enables a more complete view of teams, projects and resources than the siloed information repositories legacy processes and systems typically provide. |
| • | Responsiveness to change. Our applications provide analytics and reporting capabilities that transform disparate data in real-time into actionable intelligence, enabling users to make better informed business decisions. Our applications enable organizations to conduct dynamic and sophisticated “what-if” and scenario analyses that can improve their ability to respond effectively to changing business conditions. |
| • | Easy to implement and use. Customers can easily access our cloud-based applications with an Internet browser. Our applications do not require large up-front software expenditures or significant ongoing infrastructure or information technology support. In addition, we provide a common user interface with a modern look and feel that ensures a consistent user experience across our applications. |
| • | Flexible, scalable and secure. Our applications are highly configurable, which provides us with flexibility to meet the unique business requirements of individual customers. Our applications are also scalable and are able to support large deployments while maintaining required performance levels. We provide tools to help our customers manage the critical elements of application security, including authentication, authorization and regulatory compliance. |
-3-
Table of Contents
Our Competitive Strengths
The following competitive strengths are keys to our success:
| • | Large, attractive customer base. As of December 31, 2013, we had over 1,200 customers in a wide variety of industries. We believe our applications provide our customers with significant benefits, which we believe provides us with a substantial opportunity to expand our footprint within our existing customer base and drive their further adoption of our applications. |
| • | Diversified family of software applications. We offer a family of software applications that addresses a broad range of enterprise work management needs, from strategic planning to task execution. We believe this benefits our customers as compared to many of our cloud-based competitors who offer only a single point solution for a more limited and discrete work management need. |
| • | Recurring revenue model with high visibility. We believe we have a highly attractive operating model due to the recurring nature of our subscription revenue, which results in greater visibility and predictability of future revenue and enhances our ability to effectively manage our business. In addition, the cloud-based nature of our model accommodates significant additional business volume with limited incremental costs, providing us with opportunities to improve our operating margins. |
| • | Proven M&A capability. We have a proven ability to successfully identify, acquire and integrate complementary businesses to grow our company, as evidenced by the six acquisitions we have completed since the beginning of 2012. We have a dedicated and experienced corporate development team that continually monitors hundreds of companies in order to maintain a robust pipeline of potential acquisition candidates. |
| • | Experienced, proven management team. Our management team has significant operating experience and previously occupied key leadership roles at both private and public companies. We believe our management’s experience in building businesses through both organic growth opportunities and strategic acquisitions has enabled us to quickly establish a leading position within the enterprise work management software market. |
| • | Cloud-based platform. We deliver our software applications and functionality primarily through the cloud, with no hardware or software installation required by our customers. This model allows us to provide reliable, cost-effective applications to our customers, add customers with minimal incremental expense and deploy new functionality and upgrades quickly and efficiently. |
| • | Commitment to customer success. We have a dedicated customer success organization whose mission is to drive adoption and value realization, retention and loyalty across our customer base. Our focus on enabling our customers’ success is a key reason our customer annual net dollar retention rate was 90% in fiscal 2013. See “—Summary Consolidated Financial Data” for the definition of annual net dollar retention rate. |
Our Growth Strategy
Our objective is to be the world’s leading provider of enterprise work management software. The key elements of our strategy for growth are as follows:
| • | Add new customers. We believe the market for cloud-based enterprise work management software is large, growing and underpenetrated. We are expanding our direct sales force and indirect sales channels, as well as our ability to provide a range of integrations between our software and third-party applications and platforms, to drive new customer acquisition. |
| • | Increase sales to existing customers. We believe there is a significant opportunity to expand the adoption of our applications within existing customers. We also intend to cross-sell applications to our |
-4-
Table of Contents
| existing customers and penetrate divisions or departments where our applications are not in use. Additionally, we intend to address more functions within the enterprise work management spectrum by adding new applications to drive increased adoption of multiple applications by our customers. |
| • | Acquire complementary software businesses. We intend to pursue acquisitions of complementary technologies, products and businesses to enhance the features and functionality of our applications, expand our customer base and provide access to new markets and increased benefits of scale. |
| • | Expand globally. In fiscal 2013 and the first six months of 2014, approximately 24% and 19%, respectively, of our revenue was derived from sales outside the United States. We believe there is a significant opportunity to grow sales of our applications globally. We intend to expand our business in Europe and evaluate future opportunities in Asia through the hiring of additional sales personnel, selective acquisitions and entering into strategic partnerships. |
| • | Improve and enhance applications. We will continue to invest in research and development and work closely with our customers to identify and improve new applications, features and functionalities that address customer requirements across the enterprise work management spectrum. We also intend to continue to expand the breadth of our applications with additional analytics, third-party integrations and social and mobile capabilities, and we will continue to implement our consistent user interface across all of our applications. |
Recent Developments
Preliminary Estimated Unaudited Financial Results for the Three and Nine Months Ended September 30, 2014
Although our unaudited financial results for the three and nine months ended September 30, 2014 are not yet final, the following information reflects certain of our preliminary estimated unaudited financial results based on currently available information:
| Three months ended September 30, 2014 |
Nine months ended September 30, 2014 |
|||||||||||||||
| Range | Range | |||||||||||||||
| Low | High | Low | High | |||||||||||||
| (estimated) (in millions) |
||||||||||||||||
| GAAP |
||||||||||||||||
| Revenue |
$ | 16.0 | $ | 16.5 | $ | 47.8 | $ | 48.3 | ||||||||
| Gross Profit |
10.2 | 11.0 | 30.7 | 31.5 | ||||||||||||
| Net loss |
(2.9 | ) | (1.9 | ) | (17.8 | ) | (16.9 | ) | ||||||||
| Non-GAAP |
||||||||||||||||
| Adjusted EBITDA |
$ | 0.2 | $ | 0.8 | $ | 2.8 | $ | 3.4 | ||||||||
The following table reconciles estimated Adjusted EBITDA to estimated net loss for the three months and nine months ended September 30, 2014:
| Three months ended September 30, 2014 |
Nine months ended September 30, 2014 |
|||||||||||||||
| Range | Range | |||||||||||||||
| Low | High | Low | High | |||||||||||||
| (estimated) (in millions) |
||||||||||||||||
| Net Loss |
$ | (2.9 | ) | $ | (1.9 | ) | $ | (17.8 | ) | $ | (16.9 | ) | ||||
| Discontinued operations |
— | — | — | — | ||||||||||||
| Depreciation and amortization expense |
1.9 | 1.8 | 5.5 | 5.4 | ||||||||||||
| Interest expense, net |
0.4 | 0.4 | 1.3 | 1.2 | ||||||||||||
| Other expense (income), net |
(0.0 | ) | (0.1 | ) | 0.3 | 0.2 | ||||||||||
| Provision for income taxes |
0.4 | 0.4 | 1.1 | 1.0 | ||||||||||||
| Stock-based compensation expense |
0.3 | 0.2 | 0.6 | 0.7 | ||||||||||||
| Acquisition-related expenses |
0.1 | 0.1 | 0.6 | 0.7 | ||||||||||||
| Stock-based compensation — related party vendor |
— | — | 11.2 | 11.2 | ||||||||||||
|
|
|
|
|
|
|
|
|
|||||||||
| Adjusted EBITDA |
$ | 0.2 | $ | 0.8 | $ | 2.8 | $ | 3.4 | ||||||||
|
|
|
|
|
|
|
|
|
|||||||||
-5-
Table of Contents
Revenue. For the three months ended September 30, 2014, revenue is estimated to be between $16.0 and $16.5 million, representing an increase of 54% to 59% over revenue of $10.4 million for the three months ended September 30, 2013. For the nine months ended September 30, 2014, revenue is estimated to be between $47.8 and $48.3 million, representing an increase of 64% to 66% over revenue of $29.1 million for the nine months ended September 30, 2013. The estimated increase in our revenue for the three months and nine months ended September 30, 2014 is primarily a result of our acquisitions of FileBound Solutions, Inc. and Marex Group Inc., ComSci, LLC, and Clickability Inc., as pre-acquisition revenue from these acquired businesses was not included in our operating results in the prior year periods.
Gross Profit. For the three months ended September 30, 2014, gross profit is estimated to be between $10.2 and $11.0 million, representing an increase of 48% to 59% over gross profit of $6.9 million for the three months ended September 30, 2013. For the nine months ended September 30, 2014, gross profit is estimated to be between $30.7 and $31.5 million, representing an increase of 58% to 62% over gross profit of $19.4 million for the nine months ended September 30, 2013. The estimated increase in our gross profit for the three months and nine months ended September 30, 2014 is primarily a result of our acquisitions of FileBound Solutions, Inc. and Marex Group Inc., ComSci, LLC, and Clickability Inc., as pre-acquisition revenue and cost of revenue from these acquired businesses were not included in our operating results in the prior year periods.
Net Loss. For the three months ended September 30, 2014, net loss is estimated to be between $2.9 and $1.9 million, representing an increase of 107% to 36% over net loss of $1.4 million for the three months ended September 30, 2013. For the nine months ended September 30, 2014, net loss is estimated to be between $17.8 and $16.9 million, representing an increase of 345% to 323% over net loss of $4.0 million for the nine months ended September 30, 2013. The estimated increase in our net loss for the three months ended September 30, 2014 is primarily a result of increases in non-cash amortization expense of acquired intangible assets and an increase in operating expenses as we have continued to invest in personnel, technology, infrastructure and other growth-related activities. The estimated increase in our net loss for the nine months ended September 30, 2014 is primarily a result of increases in non-cash amortization expense of acquired intangible assets and a one-time, non-cash stock-based compensation charge in January 2014 in connection with the amendment of a technology services agreement with a related party. See “Certain Relationships and Related Party Transactions—Technology Services Agreement.”
Adjusted EBITDA. For the three months ended September 30, 2014, Adjusted EBITDA is expected be between $0.2 and $0.8 million, representing a decrease of 60% to an increase of 60% over Adjusted EBITDA of $0.5 million for the three months ended September 30, 2013. For the nine months ended September 30, 2014, Adjusted EBITDA is expected to be between $2.8 and $3.4 million, representing an increase of 8% to 31% over Adjusted EBITDA of $2.6 million for the nine months ended September 30, 2013. The estimated change in Adjusted EBITDA for the three months ended September 30, 2014 is primarily a result of an increase in operating expenses as we have continued to invest in personnel, technology, infrastructure and other growth-related activities. The estimated increase in Adjusted EBITDA for the nine months ended September 30, 2014 is primarily a result of our acquisitions of FileBound Solutions, Inc. and Marex Group Inc., ComSci, LLC, and Clickability Inc., as pre-acquisition Adjusted EBITDA from these acquired businesses was not included in our operating results in the prior year periods. Adjusted EBITDA is a non-GAAP metric used by management to measure our operating performance. See the section titled “—Summary Consolidated Financial Data” for an additional description of Adjusted EBITDA and the table above for a reconciliation of Adjusted EBITDA to net loss for the ranges presented above for the three months and nine months ended September 30, 2014 (estimated) and the three months and nine months ended September 30, 2013 (actual).
The preliminary estimated unaudited financial results presented above reflects management’s estimates based solely upon information available to us as of the date of this prospectus, is not a comprehensive statement of our unaudited financial results for the three months and nine months ended September 30, 2014 and has not been audited, reviewed or compiled by our independent registered public accounting firm. The preliminary
-6-
Table of Contents
estimated unaudited financial results presented above are subject to the completion of our financial closing procedures, which have not yet been completed. Our complete unaudited third quarter results will not be available until after this offering is completed, may differ materially from these preliminary estimated unaudited financial results and are not necessarily indicative of the results to be expected for the entire fiscal year. Accordingly, you should not place undue reliance upon these preliminary estimated unaudited financial results. For example, during the course of the preparation of the respective financial statements and related notes, additional items that would require material adjustments to be made to the preliminary estimated unaudited financial results presented above may be identified. This summary is not meant to be a comprehensive statement of our unaudited financial results for this quarter and our actual results may differ from these estimates. There can be no assurance that these estimates will be realized, and estimates are subject to risks and uncertainties, many of which are not within our control. See the sections titled “Risk Factors” and “Special Note Regarding Forward-Looking Statements.”
Risks Associated with Our Business
Our business is subject to a number of risks and uncertainties, including those highlighted in the section titled “Risk Factors” immediately following this prospectus summary. Some of these risks are:
| • | we have a limited operating history and may be unable to achieve or sustain profitability or accurately predict our future results; |
| • | our growth is dependent on our ability to retain existing customers and secure additional subscriptions and cross-sell opportunities from existing customers, and nonrenewals or downgrades could harm our future operating results; |
| • | any failure to offer high-quality customer service may adversely affect our relationships with our customers and our financial results; |
| • | if the market for cloud-based enterprise work management applications develops more slowly than we expect, or declines, our business could be adversely affected; |
| • | if we fail to manage our growth effectively, we may be unable to execute our business plan and maintain high levels of customer satisfaction; |
| • | we have made and expect to continue to make acquisitions as a primary component of our growth strategy; we may not be able to identify suitable acquisition candidates or consummate acquisitions on acceptable terms, or we may be unable to successfully integrate acquisitions, which could disrupt our operations and adversely impact our business and operating results; |
| • | we recognize revenue from customers over the term of the related agreement; therefore, downturns or upturns may not be immediately reflected in our operating results; |
| • | our quarterly operating results may fluctuate in the future; as a result, we may fail to meet or exceed the expectations of research analysts or investors, which could cause our stock price to decline and you may lose part or all of your investment; and |
| • | upon completion of this offering, our directors, executive officers and holders of more than 5% of our common stock, together with their respective affiliates, will beneficially own, in the aggregate, approximately 55.7% of our outstanding common stock. |
If we are unable to adequately address these and other risks we face, our business, financial condition, operating results and prospects may be adversely affected.
In addition, we are an “emerging growth company” as defined in the Jumpstart Our Business Startups Act, or the JOBS Act, enacted in April 2012, and therefore we may take advantage of certain exemptions from various public company reporting requirements, including not being required to have our internal control over financial
-7-
Table of Contents
reporting audited by our independent registered public accounting firm pursuant to Section 404 of the Sarbanes-Oxley Act of 2002, or the Sarbanes-Oxley Act, reduced disclosure obligations regarding executive compensation, exemptions from the requirements of holding a nonbinding advisory vote on executive compensation and any golden parachute payments not previously approved. We may take advantage of these exemptions for up to five years or until we are no longer an “emerging growth company.”
Corporate Information
We were incorporated in Delaware in July 2010 under the name Silverback Acquisition Corporation, changed our name to Silverback Enterprise Group, Inc. in September 2011, and changed our name to Upland Software, Inc. in November 2013. Our principal executive offices are located at 401 Congress Avenue, Suite 1850, Austin, Texas 78701, and our telephone number is (512) 960-1010. Our website address is www.uplandsoftware.com. The information contained in, or that can be accessed through, our website is not a part of this prospectus. Investors should not rely on any such information in deciding whether to purchase our common stock. We have included our website address in this prospectus solely as an inactive textual reference.
UPLAND, the Upland Software logo and other trademarks or service marks of Upland appearing in this prospectus are the property of Upland. Trade names, trademarks and service marks of other companies appearing in this prospectus are the property of their respective holders.
-8-
Table of Contents
The Offering
| Common stock offered |
3,846,154 shares |
| Common stock to be outstanding after this offering |
14,335,673 shares |
| Option to purchase additional shares |
576,923 shares |
| Use of proceeds |
Although we do not have current specific plans for the net proceeds of this offering, we generally intend to use the net proceeds of this offering for working capital and other general corporate purposes, including to finance our growth by investing in or acquiring complementary companies, products or technologies, expanding our sales force, growing sales of our applications globally and improving and enhancing our applications. We do not have agreements or commitments for any investments or acquisitions at this time. See “Use of Proceeds.” |
| Risk factors |
You should read the section titled “Risk Factors” immediately following this prospectus summary and the other information included in this prospectus for a discussion of factors you should carefully consider before deciding to invest in our common stock. |
| NASDAQ Global Market symbol |
“UPLD” |
| Proposed purchase by certain current stockholders |
Certain of our existing stockholders, including John T. McDonald, our Chief Executive Officer and chairman of our board of directors, entities associated with Austin Ventures, each of which is an affiliate of a member of our board of directors, and ESW Capital, LLC or its affiliates, have indicated an interest in purchasing shares of common stock with an aggregate purchase price of up to $5.0 million, or up to 10% of the proposed offering size based on an assumed initial public offering price of $13.00 per share, the midpoint of the price range set forth on the cover page of this prospectus. However, because indications of interest are not binding agreements or commitments to purchase, the underwriters may determine to sell more, less or no shares in this offering to such stockholders, or such stockholders may determine to purchase more, less or no shares in this offering. The underwriters will receive the same discount from shares of our common stock purchased by such stockholders as they will from other shares of our common stock sold to the public in this offering. Any shares purchased by these potential investors will be subject to lock-up restrictions described in “Underwriting.” |
The number of shares of common stock to be outstanding after this offering is based on 10,489,519 shares of our common stock outstanding as of June 30, 2014, and excludes:
| • | 588,132 shares of common stock issuable upon exercise of stock options outstanding as of June 30, 2014, at a weighted-average exercise price of $3.49 per share; |
-9-
Table of Contents
| • | 2,459 shares of common stock issuable upon exercise of warrants to purchase shares of common stock outstanding as of June 30, 2014, at a weighted-average exercise price of $1.77 per share; |
| • | 76,514 shares of common stock issuable upon exercise of warrants to purchase shares of our preferred stock outstanding as of June 30, 2014, at a weighted-average exercise price of $6.10 per share; |
| • | 246,000 shares of common stock reserved for issuance under our Amended and Restated 2010 Stock Plan as of June 30, 2014, which will become available for grants under our 2014 Equity Incentive Plan, as well as any automatic increases in the number of shares of common stock reserved for future issuance under our 2014 Equity Incentive Plan, which will become effective upon the execution of the underwriting agreement related to this offering; |
| • | 294,010 shares of restricted stock issued pursuant to restricted stock grants subsequent to June 30, 2014, at a purchase price of $8.73 per share; |
| • | 123,785 shares of common stock issuable upon exercise of stock options issued subsequent to June 30, 2014, at a weighted-average exercise price of $8.73 per share; and |
| • | Restricted stock grants to be issued to each of our non-employee directors upon the effectiveness of the registration statement of which this prospectus forms a part, entitling such directors to receive the number of shares of our common stock equal to an aggregate of $0.5 million divided by the initial public offering price per share. |
Unless we specifically state otherwise, all information in this prospectus reflects or assumes:
| • | the 6.099-for-one reverse stock split of our capital stock that occured on October 24, 2014; |
| • | that our amended and restated certificate of incorporation, which we will file prior to the closing of this offering, and our amended and restated bylaws are effective; |
| • | the conversion of all outstanding shares of our preferred stock into an aggregate of 6,834,476 shares of common stock prior to the closing of this offering; and |
| • | no exercise of the underwriters’ option to purchase additional shares of common stock. |
-10-
Table of Contents
Summary Consolidated Financial Data
The following table summarizes our consolidated financial data. We have derived the summary consolidated statements of operations data for the fiscal years ended December 31, 2012 and 2013 and the summary consolidated balance sheet data as of December 31, 2013 from our audited consolidated financial statements included elsewhere in this prospectus. We have derived the summary consolidated statements of operations data for the six months ended June 30, 2013 and 2014 and the summary consolidated balance sheet data as of June 30, 2014 from our unaudited consolidated financial statements included elsewhere in this prospectus. Our historical results are not necessarily indicative of our future results. The following consolidated financial data set forth below should be read together with our consolidated financial statements and related notes and the section titled “Management’s Discussion and Analysis of Financial Condition and Results of Operations,” each contained elsewhere in this prospectus.
| Fiscal Year Ended December 31, |
Six Months Ended June 30, |
|||||||||||||||
| 2012 | 2013 | 2013 | 2014 | |||||||||||||
| (in thousands, except share and per share data) | ||||||||||||||||
| Consolidated Statements of Operations Data: |
||||||||||||||||
| Revenue: |
||||||||||||||||
| Subscription and support |
$ | 18,281 | $ | 30,887 | $ | 14,182 | $ | 23,542 | ||||||||
| Perpetual license |
641 | 2,003 | 488 | 1,097 | ||||||||||||
|
|
|
|
|
|
|
|
|
|||||||||
| Total product revenue |
18,922 | 32,890 | 14,670 | 24,639 | ||||||||||||
|
|
|
|
|
|
|
|
|
|||||||||
| Professional services |
3,841 | 8,303 | 3,997 | 7,185 | ||||||||||||
|
|
|
|
|
|
|
|
|
|||||||||
| Total revenue |
22,763 | 41,193 | 18,667 | 31,824 | ||||||||||||
|
|
|
|
|
|
|
|
|
|||||||||
| Cost of revenue: |
||||||||||||||||
| Subscription and support(1)(2) |
4,189 | 7,787 | 3,271 | 6,604 | ||||||||||||
| Professional services(1) |
3,121 | 5,680 | 2,855 | 4,737 | ||||||||||||
|
|
|
|
|
|
|
|
|
|||||||||
| Total cost of revenue |
7,310 | 13,467 | 6,126 | 11,341 | ||||||||||||
|
|
|
|
|
|
|
|
|
|||||||||
| Gross profit |
15,453 | 27,726 | 12,541 | 20,483 | ||||||||||||
|
|
|
|
|
|
|
|
|
|||||||||
| Operating expenses: |
||||||||||||||||
| Sales and marketing(1) |
6,331 | 10,625 | 4,403 | 7,151 | ||||||||||||
| Research and development(1) |
5,308 | 10,340 | 4,406 | 18,393 | ||||||||||||
| Refundable Canadian tax credits |
(728 | ) | (583 | ) | (296 | ) | (274 | ) | ||||||||
| General and administrative(1) |
4,574 | 6,832 | 2,920 | 5,676 | ||||||||||||
| Depreciation and amortization |
1,812 | 3,670 | 2,247 | 2,121 | ||||||||||||
| Acquisition-related expenses |
1,933 | 1,461 | 528 | 521 | ||||||||||||
|
|
|
|
|
|
|
|
|
|||||||||
| Total operating expenses |
19,230 | 32,345 | 14,208 | 33,588 | ||||||||||||
|
|
|
|
|
|
|
|
|
|||||||||
| Loss from operations |
(3,777 | ) | (4,619 | ) | (1,667 | ) | (13,105 | ) | ||||||||
| Other expense: |
||||||||||||||||
| Interest expense, net |
(528 | ) | (2,797 | ) | (547 | ) | (834 | ) | ||||||||
| Other expense, net |
(65 | ) | (431 | ) | 73 | (368 | ) | |||||||||
|
|
|
|
|
|
|
|
|
|||||||||
| Total other expense |
(593 | ) | (3,228 | ) | (474 | ) | (1,202 | ) | ||||||||
|
|
|
|
|
|
|
|
|
|||||||||
| Loss before provision for income taxes |
(4,370 | ) | (7,847 | ) | (2,141 | ) | (14,307 | ) | ||||||||
| Provision for income taxes |
72 | (708 | ) | (133 | ) | (690 | ) | |||||||||
|
|
|
|
|
|
|
|
|
|||||||||
| Loss from continuing operations |
(4,298 | ) | (8,555 | ) | (2,274 | ) | (14,997 | ) | ||||||||
| Income (loss) from discontinued operations |
1,791 | (642 | ) | (316 | ) | — | ||||||||||
|
|
|
|
|
|
|
|
|
|||||||||
| Net loss |
$ | (2,507 | ) | $ | (9,197 | ) | (2,590 | ) | $ | (14,997 | ) | |||||
|
|
|
|
|
|
|
|
|
|||||||||
| Preferred stock dividends and accretion |
(44 | ) | (98 | ) | (22 | ) | (875 | ) | ||||||||
|
|
|
|
|
|
|
|
|
|||||||||
| Net loss attributable to common shareholders |
$ | (2,551 | ) | $ | (9,295 | ) | $ | (2,612 | ) | $ | (15,872 | ) | ||||
|
|
|
|
|
|
|
|
|
|||||||||
| Net loss per common share(3): |
||||||||||||||||
| Loss from continuing operations per common share, basic and diluted |
$ | (5.78 | ) | $ | (7.23 | ) | $ | (2.16 | ) | $ | (4.92 | ) | ||||
| Income (loss) from discontinued operations per common share, basic and diluted |
$ | 2.39 | $ | (0.54 | ) | $ | (0.30 | ) | $ | — | ||||||
| Net loss per common share, basic and diluted |
$ | (3.39 | ) | $ | (7.77 | ) | $ | (2.46 | ) | $ | (4.92 | ) | ||||
| Weighted-average common shares outstanding, basic and diluted |
751,416 | 1,196,668 | 1,061,906 | 3,225,077 | ||||||||||||
| Pro forma net loss per common share (unaudited), basic and diluted(4) |
$ | (1.55 | ) | $ | (1.49 | ) | ||||||||||
| Pro forma weighted-average common shares outstanding (unaudited), basic and diluted(4) |
5,998,613 | 10,059,553 | ||||||||||||||
|
|
|
|
|
|||||||||||||
-11-
Table of Contents
| (1) | Includes stock-based compensation. |
| (2) | Includes depreciation and amortization of $660,000 and $1,640,000 in fiscal 2012 and 2013, respectively. Includes depreciation and amortization of $717,000 and $1,484,000 for the six months ended June 30, 2013 and 2014, respectively. |
| (3) | See Note 13 to our consolidated financial statements included elsewhere in this prospectus for a discussion and reconciliation of historical and pro forma net loss attributable to common stockholders and weighted-average shares outstanding for historical and pro forma basic and diluted net loss per share calculations. |
| (4) | Pro forma net loss per common share (unaudited) and pro forma weighted-average common shares outstanding (unaudited) gives effect to (i) a 6.099-for-one reverse stock split of our capital stock that occurred on October 24, 2014; (ii) the conversion of all of our outstanding shares of preferred stock into 6,834,476 shares of our common stock immediately prior to the closing of this offering; and (iii) the filing of our amended and restated certificate of incorporation. |
| As of June 30, 2014 | ||||||||||||
| Actual | Pro Forma(1) |
Pro Forma As Adjusted(2)(3) |
||||||||||
| (unaudited) | ||||||||||||
| (in thousands) | ||||||||||||
| Consolidated Balance Sheet Data: |
||||||||||||
| Cash and cash equivalents |
$ | 3,059 | $ | 3,059 | $ | 46,244 | ||||||
| Property and equipment, net |
3,365 | 3,365 | 3,365 | |||||||||
| Intangible assets, net |
32,210 | 32,210 | 32,210 | |||||||||
| Goodwill |
33,580 | 33,580 | 33,580 | |||||||||
| Total assets |
94,326 | 94,326 | 137,511 | |||||||||
| Deferred revenue |
20,060 | 20,060 | 20,060 | |||||||||
| Total liabilities |
64,337 | 64,337 | 64,337 | |||||||||
| Redeemable convertible preferred stock |
51,516 | — | — | |||||||||
| Total stockholders’ deficit |
(21,527 | ) | 29,989 | 73,174 | ||||||||
| (1) | The pro forma column gives effect to (i) a 6.099-for-one reverse stock split of our capital stock that occurred on October 24, 2014; (ii) the conversion of all of our outstanding shares of preferred stock into 6,834,476 shares of our common stock immediately prior to the closing of this offering; and (iii) the filing of our amended and restated certificate of incorporation. |
| (2) | The pro forma as adjusted column gives further effect to the sale by us of common stock in this offering at an assumed initial public offering price of $13.00 per share, which is the midpoint of the range reflected on the cover page of this prospectus, after deducting estimated underwriting discounts and commissions and estimated offering expenses payable by us. |
| (3) | Each $1.00 increase (decrease) in the assumed initial public offering price of $13.00 per share would increase (decrease) the amount of pro forma as adjusted cash and cash equivalents, total assets and total stockholders’ deficit by approximately $3.6 million, assuming the number of shares offered by us, as set forth on the cover page of this prospectus, remains the same and after deducting the estimated underwriting discounts and commissions and estimated offering expenses payable by us. Similarly, each increase (decrease) of one million shares in the number of shares of common stock offered by us would increase (decrease) cash and cash equivalents, total assets and total stockholders’ deficit by approximately $12.1 million, assuming the assumed initial public offering price remains the same and after deducting the estimated underwriting discounts and commissions and estimated offering expenses payable by us. |
-12-
Table of Contents
| As of December 31, | As of June 30, | |||||||||||||||
| 2012 | 2013 | 2013 | 2014 | |||||||||||||
| (in thousands, except %) | ||||||||||||||||
| Key Metrics: |
||||||||||||||||
| Annualized recurring revenue value at year-end(1) |
$ | 27,093 | $ | 49,061 | n/a | n/a | ||||||||||
| Annual net dollar retention rate(2) |
n/a | 90 | % | n/a | n/a | |||||||||||
| Adjusted EBITDA (fiscal year ended December 31 and six months ended June 30)(3) |
$ | 720 | $ | 2,650 | $ | 2,074 | $ | 2,608 | ||||||||
| (1) | Annualized recurring revenue value as of December 31 equals the monthly value of our recurring revenue contracts measured as of December 31 multiplied by 12. See “Management’s Discussion and Analysis of Financial Condition and Results of Operations—Key Metrics” for additional discussion of this key metric. |
| (2) | We define annual net dollar retention as of December 31 as the aggregate annualized recurring revenue value at December 31 from those customers that were also customers as of December 31 of the prior fiscal year, divided by the aggregate annualized recurring revenue value from all customers as of December 31 of the prior fiscal year. See “Management’s Discussion and Analysis of Financial Condition and Results of Operations—Key Metrics” for additional discussion of this key metric. |
| (3) | We monitor our Adjusted EBITDA to help us evaluate the effectiveness and efficiency of our operations. Adjusted EBITDA is a non-GAAP financial measure. We define Adjusted EBITDA as net loss, calculated in accordance with GAAP, plus discontinued operations, depreciation and amortization expense, interest expense, net, other income (expense), net, provision for income taxes, stock-based compensation expense and acquisition-related expenses. |
The following table provides a reconciliation of Adjusted EBITDA to net loss, the most directly comparable GAAP measure:
| Fiscal Year Ended December 31, |
Six Months Ended June 30, |
|||||||||||||||
| 2012 | 2013 | 2013 | 2014 | |||||||||||||
| (in thousands) | ||||||||||||||||
| Net loss |
$ | (2,507 | ) | $ | (9,197 | ) | $ | (2,590 | ) | $ | (14,997 | ) | ||||
| Discontinued operations |
(1,791 | ) | 642 | 316 | — | |||||||||||
| Depreciation and amortization expense |
2,472 | 5,310 | 2,964 | 3,605 | ||||||||||||
| Interest expense, net |
528 | 2,797 | 547 | 834 | ||||||||||||
| Other expense (income), net |
65 | 431 | (73 | ) | 368 | |||||||||||
| Provision for income taxes |
(72 | ) | 708 | 133 | 690 | |||||||||||
| Stock-based compensation expense |
92 | 498 | 249 | 367 | ||||||||||||
| Acquisition-related expenses |
1,933 | 1,461 | 528 | 521 | ||||||||||||
| Stock-based compensation—related party vendor |
— | — | — | 11,220 | ||||||||||||
|
|
|
|
|
|
|
|
|
|||||||||
| Adjusted EBITDA |
$ | 720 | $ | 2,650 | $ | 2,074 | $ | 2,608 | ||||||||
|
|
|
|
|
|
|
|
|
|||||||||
We believe that Adjusted EBITDA provides useful information to management, investors and others in understanding and evaluating our operating results for the following reasons:
| • | Adjusted EBITDA is widely used by investors and securities analysts to measure a company’s operating performance without regard to items that can vary substantially from company to company depending upon their financing, capital structures and the method by which assets were acquired; |
| • | our management uses Adjusted EBITDA in conjunction with GAAP financial measures for planning purposes, in the preparation of our annual operating budget, as a measure of our operating |
-13-
Table of Contents
| performance, to assess the effectiveness of our business strategies and to communicate with our board of directors concerning our financial performance because Adjusted EBITDA eliminates the impact of items that we do not consider indicative of our core operating performance; |
| • | Adjusted EBITDA provides more consistency and comparability with our past financial performance, facilitates period-to-period comparisons of our operations and also facilitates comparisons with other companies, many of which use similar non-GAAP financial measures to supplement their GAAP results; and |
| • | we anticipate that, after consummating this offering, our investor and analyst presentations will include Adjusted EBITDA as a supplemental measure of our overall operating performance. |
Adjusted EBITDA should not be considered as an alternative to net loss or any other measure of financial performance calculated and presented in accordance with GAAP. The use of Adjusted EBITDA as an analytical tool has limitations such as:
| • | depreciation and amortization are non-cash charges, and the assets being depreciated or amortized will often have to be replaced in the future and Adjusted EBITDA does not reflect cash requirements for such replacements; however, much of the depreciation and amortization currently reflected relates to amortization of acquired intangible assets as a result of business combination purchase accounting adjustments, which will not need to be replaced in the future; |
| • | Adjusted EBITDA may not reflect changes in, or cash requirements for, our working capital needs or contractual commitments; |
| • | Adjusted EBITDA does not reflect the potentially dilutive impact of stock-based compensation; |
| • | Adjusted EBITDA does not reflect interest or tax payments that could reduce cash available for use; and |
| • | other companies, including companies in our industry, might calculate Adjusted EBITDA or similarly titled measures differently, which reduces their usefulness as comparative measures. |
Because of these limitations, you should consider Adjusted EBITDA together with other financial performance measures, including various cash flow metrics, net loss and our other GAAP results.
-14-
Table of Contents
Investing in our common stock involves a high degree of risk. You should consider carefully the risks and uncertainties described below, together with all of the other information included in this prospectus, including our consolidated financial statements and the related notes appearing elsewhere in this prospectus, before deciding to invest in our common stock. If any of the following risks actually occurs, our business, financial condition, results of operations and future growth prospects could be harmed. In that case, the market price of our common stock could decline, and you may lose all or part of your investment. The risks discussed below include forward-looking statements, and our actual results may differ substantially from those discussed in such forward-looking statements.
Risks Related to Our Business and Our Industry
We have a limited operating history and may be unable to achieve or sustain profitability or accurately predict our future results.
We were formed in July 2010 and acquired our first business and commenced operations in September 2011. Prior to September 2011, our business activity was devoted to raising capital, building infrastructure and reviewing potential acquisitions. As such, we have a very limited operating history of selling our products and professional services to third parties. Our limited operating history makes it difficult to evaluate our current business and future prospects and may increase the risk of your investment. We incurred net losses of $2.5 million, $9.2 million and $15.0 million in fiscal 2012 and 2013 and the six months ended June 30, 2014, respectively. As of June 30, 2014, we had an accumulated deficit of $30.1 million. Our losses in prior periods and accumulated deficit reflect the investments we have made to date to grow our business. We expect to have significant operating expenses in the future to further support and grow our business, including expanding the range of integrations between our software and third-party applications and platform, expanding our direct and indirect sales capabilities, pursuing acquisitions of complementary businesses, investing in our data center infrastructure and research and development and increasing our international presence, and as a result we may be unable to achieve or sustain profitability or accurately predict our future results. You should not consider our recent growth in revenue as indicative of our future performance, and we cannot assure you that we will achieve profitability in the future, nor that if we do become profitable, we will sustain profitability.
Our growth is dependent on our ability to retain existing customers and secure additional subscriptions and cross-sell opportunities from existing customers, and nonrenewals and downgrades could harm our future operating results.
In order for us to improve our operating results, it is important that our customers renew or upgrade their agreements with us when the applicable contract term expires, which is typically one to three years for subscription agreements and one year for perpetual license agreements, and also purchase additional applications from us. Upon expiration, customers can renew their existing subscriptions, upgrade their subscriptions to add more seats or additional minimum contracted volume, downgrade their subscriptions to fewer seats or lower minimum contracted volume or not renew. A renewal constitutes renewing an existing contract for an application under the same terms and an upgrade includes purchasing additional seats or volume under an existing contract. We may also cross-sell additional applications to existing customers. Our ability to grow revenue and achieve profitability depends, in part, on customer renewals, upgrades and cross-sales to existing customers exceeding downgrades and nonrenewals. However, we may not be able to increase our penetration within our existing customer base as anticipated and we may not otherwise retain subscriptions from existing customers. Our customers may choose to not renew or upgrade their subscriptions, or may downgrade, because of several factors, including dissatisfaction with our prices, features or performance relative to competitive offerings, reductions in our customers’ spending levels, unused seats or volume or limited adoption or use of our applications. In addition, we may not be successful in cross-selling new applications to our existing customers. If our customers
-15-
Table of Contents
do not upgrade or renew their subscriptions or purchase additional applications from us, or if they downgrade their subscriptions, our revenue may grow more slowly than expected or may decline, and our financial performance may be adversely affected.
Any failure to offer high-quality customer service may adversely affect our relationships with our customers and our financial results.
Our customers depend on our customer success organization to manage the post-sale customer lifecycle, including to implement new applications for our customers, provide training and ongoing education services and resolve technical issues relating to our applications. We may be unable to respond quickly enough to accommodate short-term increases in demand for our customer success services. We also may be unable to modify the format of our customer success services to compete with changes in similar services provided by our competitors. Increased customer demand for these services, without corresponding revenue, could increase costs and adversely affect our operating results. In addition, our sales process is highly dependent on the reliable functional operation of our applications, our business reputation and positive recommendations from our existing customers. Any failure to maintain high-quality customer service, or a market perception that we do not maintain high-quality customer service, could adversely affect our reputation, our ability to sell our applications to existing and prospective customers and our business, operating results and financial position.
If the market for cloud-based enterprise work management applications develops more slowly than we expect, or declines, our business could be adversely affected.
The market for cloud-based enterprise work management applications is not as mature as the market for legacy on-premise enterprise systems, and it is uncertain whether cloud-based applications will achieve and sustain high levels of customer demand and market acceptance. Our success will depend to a substantial extent on increased adoption of cloud-based applications, and of our enterprise work management software applications in particular. Many large organizations have invested substantial personnel and financial resources to integrate legacy on-premise enterprise systems into their businesses, and therefore may be reluctant or unwilling to migrate to cloud-based applications or away from their traditional vendors or to new practices because of the organizational changes often required to successfully implement new enterprise work management systems. In addition, we do not know whether the adoption of enterprise work management software will continue to grow and displace manual processes and traditional tools, such as paper-based techniques, spreadsheets and email. It is difficult to predict customer adoption rates and demand for our applications, the future growth rate and size of the cloud-based software application market or the entry of competitive products. The expansion of the cloud-based software application market depends on a number of factors, including the cost, performance and perceived value associated with cloud-based applications, as well as the ability of cloud-based application companies to address security and privacy concerns. If other cloud-based software application providers experience security incidents, loss of customer data, disruptions in delivery or other problems, the market for cloud-based applications as a whole, including our enterprise work management applications, may be negatively affected. If cloud-based applications do not achieve widespread adoption, or there is a reduction in demand for cloud-based applications caused by a lack of customer acceptance, technological challenges, weakening economic conditions, security or privacy concerns, competing technologies and products, decreases in corporate spending or otherwise, our revenues may decrease and our business could be adversely affected.
If we fail to manage our growth effectively, we may be unable to execute our business plan and maintain high levels of customer satisfaction.
We have recently experienced a period of rapid growth in our personnel and operations. In particular, we increased our number of full-time employees from three as of December 31, 2011 to 277 as of December 31, 2013, and have also increased the size of our customer base. In addition, our revenue grew from $712,000 in fiscal 2011 to $41.2 million in fiscal 2013 and from $18.7 million in the first six months of 2013 to $31.8 million in the first six months of 2014. Acquisitions are a primary component of our growth strategy and, as a result, we
-16-
Table of Contents
anticipate that we will continue to experience further rapid growth in our personnel and operations in the future. Our growth has placed, and future growth will place, a significant strain on our managerial, administrative, operational, financial and other resources. To manage the expected growth of our personnel and operations, we will need to continue to improve our operational, financial and management controls and our reporting systems and procedures. Failure to effectively manage our growth could result in difficulty or delays in deploying our applications, declines in quality or customer satisfaction, increases in costs, difficulties in introducing new features or other operational difficulties, and any of these difficulties could adversely impact our business performance and results of operations.
We have made and expect to continue to make acquisitions as a primary component of our growth strategy. We may not be able to identify suitable acquisition candidates or consummate acquisitions on acceptable terms, or we may be unable to successfully integrate acquisitions, which could disrupt our operations and adversely impact our business and operating results.
A primary component of our growth strategy has been to acquire complementary businesses to grow our company. For example, we acquired the businesses of PowerSteering Software, Inc., Tenrox Inc. and LMR Solutions, LLC, dba EPM Live, in fiscal 2012 and the businesses of FileBound Solutions, Inc. and Marex Group Inc., ComSci, LLC, and Clickability Inc., in fiscal 2013. We intend to continue to pursue acquisitions of complementary technologies, products and businesses as a primary component of our growth strategy to enhance the features and functionality of our applications, expand our customer base and provide access to new markets and increase benefits of scale. Acquisitions involve certain known and unknown risks that could cause our actual growth or operating results to differ from our expectations. For example:
| • | we may not be able to identify suitable acquisition candidates or to consummate acquisitions on acceptable terms; |
| • | we may pursue international acquisitions, which inherently pose more risks than domestic acquisitions; |
| • | we compete with others to acquire complementary products, technologies and businesses, which may result in decreased availability of, or increased price for, suitable acquisition candidates; |
| • | we may not be able to obtain the necessary financing, on favorable terms or at all, to finance any or all of our potential acquisitions; |
| • | we may ultimately fail to consummate an acquisition even if we announce that we plan to acquire a technology, product or business; and |
| • | acquired technologies, products or businesses may not perform as we expect and we may fail to realize anticipated revenue and profits. |
In addition, our acquisition strategy may divert management’s attention away from our existing business, resulting in the loss of key customers or employees, and expose us to unanticipated problems or legal liabilities, including responsibility as a successor for undisclosed or contingent liabilities of acquired businesses or assets.
If we fail to conduct due diligence on our potential targets effectively, we may, for example, not identify problems at target companies or fail to recognize incompatibilities or other obstacles to successful integration. Our inability to successfully integrate future acquisitions could impede us from realizing all of the benefits of those acquisitions and could severely weaken our business operations. The integration process may disrupt our business and, if new technologies, products or businesses are not implemented effectively, may preclude the realization of the full benefits expected by us and could harm our results of operations. In addition, the overall integration of new technologies, products or businesses may result in unanticipated problems, expenses, liabilities and competitive responses. The difficulties integrating an acquisition include, among other things:
| • | issues in integrating the target company’s technologies, products or businesses with ours; |
| • | incompatibility of marketing and administration methods; |
-17-
Table of Contents
| • | maintaining employee morale and retaining key employees; |
| • | integrating the cultures of both companies; |
| • | preserving important strategic customer relationships; |
| • | consolidating corporate and administrative infrastructures and eliminating duplicative operations; and |
| • | coordinating and integrating geographically separate organizations. |
In addition, even if the operations of an acquisition are integrated successfully, we may not realize the full benefits of the acquisition, including the synergies, cost savings or growth opportunities that we expect. These benefits may not be achieved within the anticipated time frame, or at all.
Further, acquisitions may cause us to:
| • | issue common stock that would dilute our current stockholders’ ownership percentage; |
| • | use a substantial portion of our cash resources; |
| • | increase our interest expense, leverage and debt service requirements if we incur additional debt to pay for an acquisition; |
| • | assume liabilities for which we do not have indemnification from the former owners; further, indemnification obligations may be subject to dispute or concerns regarding the creditworthiness of the former owners; |
| • | record goodwill and non-amortizable intangible assets that are subject to impairment testing and potential impairment charges; |
| • | experience volatility in earnings due to changes in contingent consideration related to acquisition earn-out liability estimates; |
| • | incur amortization expenses related to certain intangible assets; |
| • | lose existing or potential contracts as a result of conflict of interest issues; |
| • | become subject to adverse tax consequences or deferred compensation charges; |
| • | incur large and immediate write-offs; or |
| • | become subject to litigation. |
We depend on our senior management team and the loss of one or more key personnel or an inability to attract and retain highly skilled personnel may impair our ability to grow our business.
Our success depends in part upon the continued services of our key executive officers, including John T. McDonald, Michael D. Hill, Ludwig Melik, Timothy W. Mattox and R. Brian Henley, as well as other key personnel. We do not have employment agreements with most of our executive officers or other key personnel that require them to continue to work for us for any specified period and, therefore, they may terminate employment with us at any time with no advance notice. The replacement of our senior management team or other key personnel likely would involve significant time and costs, and the loss of these employees may significantly delay or prevent the achievement of our business objectives.
We face intense competition for qualified individuals from numerous technology and software companies. If we fail to attract and retain suitably qualified individuals, including software engineers and sales personnel, our ability to implement our business plan and develop and maintain our applications could be adversely affected. As a result, our ability to compete would decrease, our operating results would suffer and our revenue would decrease.
-18-
Table of Contents
Failure to maintain and expand our sales organization may negatively impact our revenue growth.
We sell our applications primarily through a direct sales organization comprised of inside sales and field sales personnel. In addition, we have an indirect sales organization, which sells to distributors and value-added resellers. Growing sales to both new and existing customers is in part dependent on our ability to maintain and expand our sales force. Identifying, recruiting and training additional sales personnel requires significant time, expense and attention. It can take several quarters or longer before our sales representatives are fully-trained and productive. Our business may be adversely affected if our efforts to expand and train our sales organization do not generate a corresponding increase in revenue. In particular, if we are unable to hire, develop and retain sales personnel or if our new sales personnel are unable to achieve expected sales productivity levels in a reasonable period of time or at all, our revenue may grow more slowly than expected or decline and our business may be harmed.
Because we generally recognize revenue from our customers over the terms of their agreements but incur most costs associated with generating such agreements in advance, rapid growth in our customer base may increase our losses in the short-term.
Expenses associated with acquiring customers, such as the expenses related to our sales organizations and related commissions, are generally expensed as incurred while most of our revenue is recognized ratably over the life of the applicable agreements. Therefore, increased sales will result in our recognition of more costs than revenue during the early periods covered by such agreements, even in cases where the agreements are expected to be profitable for us over their full terms. As a result, even if we are successful in increasing our customer base, our short-term operating results may suffer.
We recognize revenue from customers over the term of the related agreement; therefore, downturns or upturns in our business may not be immediately reflected in our operating results.
We recognize revenue from customer agreements ratably over the terms of these agreements. As a result, a significant portion of the revenue we report in each quarter is generated from customer agreements entered into during previous periods, which is reflected as deferred revenue on our balance sheet. Consequently, a decline in new or renewed agreements, or a downgrade of renewed agreements to fewer seats or less minimum contracted volume, in any one quarter may not be fully reflected in our revenue in that quarter. Such a decline, however, will negatively affect our revenue in future quarters. Accordingly, the effect of significant downturns in sales and market acceptance of our applications, and potential changes in our pricing policies or rates of renewals, may not be fully reflected in our results of operations until future periods. Similarly, it would be difficult for us to rapidly increase our revenue through new sales, renewals and upgrades of existing customer agreements, or through additional cross-selling opportunities, in a given period due to the timing of revenue recognition inherent in our subscription model.
Perpetual license revenue is unpredictable and a material increase or decrease in perpetual license revenue from period to period can produce substantial variation in the total revenue and earnings we recognize in a given period.
Perpetual license revenue reflects the revenue recognized from sales of perpetual licenses relating to our workflow automation and enterprise content management applications to new customers and additional licenses for such applications to existing customers. We generally recognize the license fee portion of the arrangement in advance. Perpetual licenses of our workflow automation and enterprise content management applications are sold through third-party resellers and, as such, the timing of sales of perpetual licenses is difficult to predict with the timing of recognition of associated revenue unpredictable. A material increase or decrease in the sale of perpetual licenses from period to period could produce substantial variation in the revenue we recognize. Accordingly, comparing our perpetual license revenue on a period to period basis may not be a meaningful indicator of a trend or future results.
-19-
Table of Contents
Our quarterly operating results may fluctuate in the future. As a result, we may fail to meet or exceed the expectations of research analysts or investors, which could cause our stock price to decline and you may lose part or all of your investment.
Our quarterly operating results may fluctuate as a result of a variety of factors, many of which are outside of our control. Accordingly, the results of any one quarter may not fully reflect the underlying performance of our business and should not be relied upon as an indication of future performance. If our quarterly operating results or outlook fall below the expectations of research analysts or investors, the price of our common stock could decline substantially. Fluctuations in our quarterly operating results or outlook may be due to a number of factors, including, but not limited to:
| • | the extent to which our existing customers purchase additional seats or volume for our applications and the timing and terms of those purchases; |
| • | the extent to which our existing customers renew their customer agreements for our applications and the timing and terms of those renewals; |
| • | the extent to which we cross-sell additional applications to our existing customers and the timing and terms of such cross-selling; |
| • | the addition or loss of customers, including through acquisitions or consolidations; |
| • | the extent to which new customers are attracted to our applications to satisfy their enterprise work management needs; |
| • | the rate of adoption and market acceptance of enterprise work management applications; |
| • | the mix of our revenue, particularly between product and professional services revenue, for which the timing of revenue recognition is substantially different; |
| • | changes in the gross profit we realize on our applications and professional services due to our differing revenue recognition policies applicable to subscription and product and professional services revenue and other variables; |
| • | the extent to which we enter into multi-year contracts, in which the support fees are typically paid in advance; |
| • | the number and size of new customers and the number and size of renewals in a particular period; |
| • | changes in our pricing policies or those of our competitors; |
| • | the mix of applications sold during a period; |
| • | the timing and expenses related to the acquisition of technologies, products or businesses and potential future charges for impairment of goodwill from such acquisitions; |
| • | the amount and timing of operating expenses, including those related to the maintenance and expansion of our business, operations and infrastructure; |
| • | the amount and timing of expenses related to the development of new products and technologies, including enhancements to our applications; |
| • | the amount and timing of commissions earned by our sales personnel; |
| • | the timing and success of new applications introduced by us or new offerings offered by our competitors; |
| • | the length of our sales cycles; |
| • | changes in the competitive dynamics of our industry, including consolidation among competitors, customers or strategic collaborators; |
-20-
Table of Contents
| • | our ability to manage our existing business and future growth, including increases in the number of customers using our applications; |
| • | the seasonality of our business or cyclical fluctuations in our industry; |
| • | the timing and expenses related to any international expansion efforts we may undertake and the success of such efforts; |
| • | various factors related to disruptions in access and delivery of our cloud-based applications, errors or defects in our applications, privacy and data security and exchange rate fluctuations, each of which is described elsewhere in these risk factors; and |
| • | general economic, industry and market conditions. |
We may need financing in the future, and any additional financing may result in restrictions on our operations or substantial dilution to our stockholders. We may seek to renegotiate or refinance our loan and security agreements, and we may be unable to do so on acceptable terms or at all.
We have funded our operations since inception primarily through equity financings, cash from operations and cash available under our loan and security agreements. We may need to raise funds in the future, for example, to expand our business, acquire complementary businesses, develop new technologies, respond to competitive pressures or react to unanticipated situations. We may try to raise additional funds through public or private financings, strategic relationships or other arrangements. Our ability to obtain debt or equity funding will depend on a number of factors, including market conditions, our operating performance and investor interest. Additional funding may not be available to us on acceptable terms or at all. If adequate funds are not available, we may be required to reduce expenditures, including curtailing our growth strategies, reducing our product-development efforts or foregoing acquisitions. If we succeed in raising additional funds through the issuance of equity or convertible securities, it could result in substantial dilution to existing stockholders. If we raise additional funds through the issuance of debt securities or preferred stock, these new securities would have rights, preferences and privileges senior to those of the holders of our common stock. In addition, any debt financing obtained by us in the future or issuance of preferred stock could involve restrictive covenants relating to our capital raising activities and other financial and operational matters, which may make it more difficult for us to obtain additional capital and to pursue business opportunities, including potential acquisitions. Additionally, we may need to renegotiate the terms of our loan and security agreements, and our lender may be unwilling to do so, or may agree to such changes subject to additional restrictive covenants on our operations and ability to raise capital.
Our loan agreements contain operating and financial covenants that may restrict our business and financing activities.
On March 5, 2012, we entered into a loan and security agreement with Comerica Bank, as amended, the U.S. Loan Agreement. The U.S. Loan Agreement provides to us and certain of our subsidiaries, as co-borrowers, a secured accounts receivable revolving loan facility of up to $5.0 million and a secured term loan facility of up to $19.5 million, for a total loan facility of up to $24.5 million. On February 10, 2012, Tenrox Inc., a Canadian corporation and wholly-owned subsidiary entered into a loan and security agreement with Comerica Bank, as amended, the Canadian Loan Agreement. The Canadian Loan Agreement provides a secured accounts receivable revolving loan facility of up to $3.0 million and a secured term loan facility of up to $2.5 million, for a total loan facility of up to $5.5 million. As of June 30, 2014, we had $3.6 million outstanding as revolving loans and $17.9 million outstanding as term loans under the U.S. Loan Agreement. As of June 30, 2014, there was a zero balance on the revolving loans and $1.0 million outstanding as term loans under the Canadian Loan Agreement.
Our obligations and the obligations of the co-borrowers and any guarantors under the U.S. Loan Agreement are secured by a security interest in substantially all of our assets and assets of the co-borrowers’ and of any guarantors, including intellectual property. The obligations of Tenrox Inc., our obligations and the obligations of any other guarantors under the Canadian Loan Agreement are secured by a security interest in substantially all of
-21-
Table of Contents
Tenrox Inc.’s assets, our assets and assets of any other guarantors, including intellectual property. The loan and security agreements and related guaranties and security agreements limit, among other things, our ability to:
| • | sell, lease, license or otherwise dispose of assets; |
| • | undergo a change in control; |
| • | consolidate or merge with or into other entities; |
| • | make or own loans, investments and acquisitions; |
| • | create, incur or assume guarantees in respect of obligations of other persons; |
| • | create, incur or assume liens and other encumbrances; or |
| • | pay dividends or make distributions on, or purchase or redeem, our capital stock. |
Furthermore, the loan and security agreements require us and our subsidiaries to comply with certain financial covenants. The operating and other restrictions and covenants in the loan and security agreements and related guaranties and security agreements, and in any future financing arrangements that we may enter into, may restrict our ability to finance our operations, engage in certain business activities, or expand or fully pursue our business strategies, or otherwise limit our discretion to manage our business. Our ability to comply with these restrictions and covenants may be affected by events beyond our control, and we may not be able to meet those restrictions and covenants. A breach of any of the restrictions and covenants could result in a default under the loan and security agreements, related guarantees and security agreements or any future financing arrangements, which could cause any outstanding indebtedness under the loan and security agreements or under any future financing arrangements to become immediately due and payable, and result in the termination of commitments to extend further credit.
If we are unable to increase market awareness of our company and our applications, our revenue may not continue to grow, or may decline.
Market awareness of our company and our applications is essential to our ability to generate new leads for expanding our business and our continued growth. If we fail to sufficiently invest in our marketing programs or they are unsuccessful in creating market awareness of our company and our applications, our revenue may grow more slowly than expected or may decline and our financial performance may be adversely affected.
The markets in which we participate are intensely competitive, and if we do not compete effectively, our operating results could be adversely affected.
The overall market for enterprise work management software is rapidly evolving and subject to changing technology, shifting customer needs and frequent introductions of new applications. The intensity and nature of our competition varies significantly across our family of enterprise work management software applications. Many of our competitors and potential competitors are larger and have greater brand name recognition, longer operating histories, larger marketing budgets and significantly greater resources than we do. Some of our smaller competitors may offer applications on a stand-alone basis at a lower price than us due to lower overhead or other factors, while some of our larger competitors may offer applications at a lower price in an attempt to cross-sell additional products in the future or retain a customer using a different application.
We believe there are a limited number of direct competitors that provide a comprehensive enterprise work management software offering. However, we face competition both from point solution providers, including legacy on-premise enterprise systems, and other cloud-based work management software vendors that may address one or more of the functional elements of our applications, but are not designed to address a broad range of enterprise work management needs. In addition, we face competition from manual processes and traditional tools, such as paper-based techniques, spreadsheets and email.
-22-
Table of Contents
Our primary competitors for each of our enterprise work management applications currently include:
| • | Program and Portfolio Management: Clarity (a division of Computer Associates), Changepoint, Instantis and Planview; |
| • | Project Management and Collaboration: Microsoft Project, AtTask and Clarizen; |
| • | Workflow Automation and Enterprise Content Management: Hyland Software, Laserfiche, OpenText, Perceptive Software (a division of Lexmark), Adobe and Sitecore; |
| • | Professional Services Automation: Deltek, Infor, OpenAir (a product of NetSuite), and Replicon; and |
| • | Financial Management: Apptio, Hewlett Packard’s Information Technology Financial Management Solution and VMware’s Information Technology Business Management Suite. |
If our competitors’ products, services or technologies become more accepted than our enterprise work management applications, if they are successful in bringing their products or services to market earlier than ours, or if their products or services are more technologically capable than ours, our revenues could be adversely affected.
Mergers of, or other strategic transactions by, our competitors could weaken our competitive position or reduce our revenue.
If one or more of our competitors were to merge or partner with another of our competitors, the change in the competitive landscape could adversely affect our ability to compete effectively. In order to take advantage of customer demand for cloud-based software applications, vendors of legacy systems are expanding their cloud-based enterprise workplace management applications through acquisitions and organic development. A potential result of such expansion is that certain of our current or potential competitors may be acquired by third parties with greater available resources and the ability to further invest in product improvements and initiate or withstand substantial price competition. Our competitors also may establish or strengthen cooperative relationships with our current or future value-added resellers, third-party consulting firms or other parties with whom we have relationships, thereby limiting our ability to promote our applications. Disruptions in our business caused by these events could reduce our revenue.
Our growth and long-term success depends in part on our ability to expand our international sales and operations.
A core component of our growth strategy is international expansion. In fiscal 2013 and the first six months of 2014, we generated approximately 24% and 19%, respectively, of our revenue from sales outside the United States. We currently maintain international offices and have sales, marketing, support or research and development personnel in Canada and the United Kingdom. As we continue to expand our international footprint, we will be increasingly susceptible to the risks associated with international operations. We have a limited operating history outside of the United States and Canada and our ability to manage our international operations successfully requires significant resources and management attention and is subject to particular challenges of supporting a rapidly growing business in an environment of diverse cultures, languages, customs, legal systems, alternative dispute systems and economic, political and regulatory systems. In addition, we expect to incur significant costs associated with expanding our international operations, including hiring personnel internationally. The risks and challenges associated with doing business internationally and our international expansion include:
| • | uncertain political and economic climates; |
| • | lack of familiarity and burdens of complying with foreign laws, accounting and legal standards, regulatory requirements, tariffs and other barriers; |
| • | unexpected changes in regulatory requirements, taxes, trade laws, tariffs, export quotas, custom duties or other trade restrictions; |
-23-
Table of Contents
| • | lack of experience in connection with the localization of our applications, including translation into foreign languages and adaptation for local practices, and associated expenses and regulatory requirements; |
| • | difficulties in adapting to differing technology standards; |
| • | longer sales cycles and accounts receivable payment cycles and difficulties in collecting accounts receivable; |
| • | difficulties in managing and staffing international operations, including differing legal and cultural expectations for employee relationships and increased travel, infrastructure and legal compliance costs associated with international operations; |
| • | fluctuations in exchange rates that may increase the volatility of our foreign-based revenue and expenses; |
| • | potentially adverse tax consequences, including the complexities of foreign value-added tax, goods and services tax and other transactional taxes; |
| • | reduced or varied protection for intellectual property rights in some countries; |
| • | difficulties in managing and adapting to differing cultures and customs; |
| • | data privacy laws which require that customer data be stored and processed in a designated territory subject to laws different than the United States; |
| • | new and different sources of competition as well as laws and business practices favoring local competitors and local employees; |
| • | compliance with anti-bribery laws, including compliance with the Foreign Corrupt Practices Act; |
| • | increased financial accounting and reporting burdens and complexities; and |
| • | restrictions on the repatriation of earnings. |
Further, our international expansion efforts may be hindered by lower levels of cloud adoption and increased price sensitivity for our applications or other cloud-based offerings in international markets. As a result of these and other factors, international expansion may be more difficult, take longer and not generate the results we anticipate, which could negatively impact our growth and business.
Fluctuations in the exchange rate of foreign currencies could result in losses on currency transactions.
Our customers are generally invoiced in the currency of the country in which they are located. In addition, we incur a portion of our operating expenses in foreign currencies, including Canadian dollars, British pounds and Euros, and in the future, as we expand into other foreign countries, we expect to incur operating expenses in other foreign currencies. In addition, our customers are generally invoiced in the currency of the country in which they are located. We are exposed to foreign exchange rate fluctuations as the financial results of our international operations are translated from the local functional currency into U.S. dollars upon consolidation. A decline in the U.S. dollar relative to foreign functional currencies would increase our non-U.S. revenue and improve our operating results. Conversely, if the U.S. dollar strengthens relative to foreign functional currencies, our revenue and operating results would be adversely affected. We have not previously engaged in foreign currency hedging. If we decide to hedge our foreign currency exchange rate exposure, we may not be able to hedge effectively due to lack of experience, unreasonable costs or illiquid markets.
Our sales cycles can be lengthy and variable, which may cause changes in our operating results.
Our sales cycle can vary substantially from customer to customer. A number of factors influence the length and variability of our sales cycles, including, for example:
| • | the need to educate potential customers about the uses and benefits of our applications; |
-24-
Table of Contents
| • | the duration of the commitment customers make in their agreements with us, which are typically one to three years; |
| • | the discretionary nature of potential customers’ purchasing and budget cycles and decisions; |
| • | the competitive nature of potential customers’ evaluation and purchasing processes; |
| • | the functionality demands of potential customers; |
| • | fluctuations in the enterprise work management needs of potential customers; |
| • | the announcement or planned introduction of new products by us or our competitors; and |
| • | the purchasing approval processes of potential customers. |
Our sales cycles can make it difficult to predict the quarter in which revenue from a new customer may first be recognized. We may incur significant sales and marketing expenses and invest significant time and effort in anticipation of a sale that may never occur or only occur in a smaller amount or at a later date than anticipated. Delays inherent to our sales cycles could cause significant variability in our revenue and operating results for any particular period.
We have a limited history with our pricing models and, as a result, we may be forced to change the prices we charge for our applications or the pricing models upon which they are based.
We have limited experience with respect to determining the optimal prices and pricing models for certain of our applications and certain geographic markets. As the markets for our applications mature, or as competitors introduce products or services that compete with ours, including bundling competing offerings with additional products or services, we may be unable to attract new customers at the same price or based on the same pricing models as we have used historically. As a result, in the future we may be required to reduce our prices, which could adversely affect our financial performance. In addition, we may offer volume price discounts based on the number of seats purchased by a customer or the number of our applications purchased by a customer, which would effectively reduce the prices we charge for our applications. Also, we may be unable to renew existing customer agreements or enter into new customer agreements at the same prices or upon the same terms that we have historically, which could have a material adverse effect on our financial position.
Any disruption of service at the data centers that house our equipment and deliver our applications could harm our business.
While we procure and operate all infrastructure equipment delivering our applications, third parties operate the data centers that we use. While we control and have access to our servers and all of the other components of our network that are located in our external data centers, we do not control the operation of these data centers and we are therefore vulnerable to disruptions, power outages or other issues the data centers experience. We have experienced and expect that we will in the future experience interruptions, delays and outages in service and availability from time to time.
The owners of our data centers have no obligation to renew their agreements with us on commercially reasonable terms, or at all. If we are unable to renew these agreements on commercially reasonable terms, or if one of our data center operators is acquired, we may be required to transfer our servers and other infrastructure to new data centers, and we may incur significant costs and possible service interruption in connection with doing so.
Our data centers are vulnerable to damage or interruption from human error, malicious acts, earthquakes, hurricanes, tornados, floods, fires, war, terrorist attacks, power losses, hardware failures, systems failures, telecommunications failures and similar events. For example, certain of our data centers are located in an area known for seismic activity, increasing our susceptibility to the risk that an earthquake could significantly harm the operations of this facility. The occurrence of a natural disaster or an act of terrorism, vandalism or other misconduct, a decision to close the data centers without adequate notice or other unanticipated problems could result in lengthy interruptions in availability of our applications.
-25-
Table of Contents
Any changes in third-party service levels at our data centers or any errors, defects, disruptions or other performance problems with our applications could harm our reputation and may damage our customers’ businesses. Interruptions in availability of our applications might reduce our revenue, cause us to issue credits to customers, subject us to potential liability, and cause customers to terminate their subscriptions or decide not to renew their subscriptions with us.
If we fail to adequately manage our data center infrastructure capacity, our existing customers may experience service outages and our new customers may experience delays in the deployment of our applications.
We have experienced significant growth in the number of seats and volume of data that our hosting infrastructure supports. We seek to maintain sufficient excess capacity in our operations infrastructure to meet the needs of all of our customers. We also seek to maintain excess capacity to facilitate the rapid provision of new customer deployments and the expansion of existing customer deployments. However, obtaining new data center infrastructure requires lead time. If we do not accurately predict our infrastructure capacity requirements with sufficient lead time, our customers could experience service impairment that may subject us to financial penalties and liabilities and cause us to lose customers. If our data center infrastructure capacity fails to keep pace with increased subscriptions, customers may experience delays or reductions in the quality of our service as we seek to obtain additional capacity, which could harm our reputation and harm our business.
Security breaches may harm our business.
Our applications involve the storage and transmission of our customers’ proprietary and confidential information, including personal or identifying information regarding their employees and customers. Any security breaches, unauthorized access, unauthorized usage, virus or similar breach or disruption could result in loss of confidential information, damage to our reputation, early termination of our contracts, litigation, regulatory investigations, indemnity obligations or other liabilities. If our security measures or those of our third-party data centers are breached as a result of third-party action, employee error, malfeasance or otherwise and, as a result, someone obtains unauthorized access to customer data, our reputation will be damaged, our business may suffer and we could incur significant liability. Because the techniques used to obtain unauthorized access or sabotage systems change frequently and generally are not identified until they are launched against a target, we may be unable to anticipate these techniques or to implement adequate preventative measures. Any or all of these issues could negatively affect our ability to attract new customers, cause existing customers to elect not to renew or upgrade their subscriptions, result in reputational damage or subject us to third-party lawsuits, regulatory fines or other action or liability, which could adversely affect our operating results.
Our success depends on our ability to adapt to technological change and continue to innovate.
The overall market for enterprise work management software is rapidly evolving and subject to changing technology, shifting customer needs and frequent introductions of new applications. Our ability to attract new customers and increase revenue from existing customers will depend in large part on our ability to develop or acquire new applications and enhance and improve existing applications. To achieve market acceptance for our applications, we must effectively anticipate and offer applications that meet changing customer demands in a timely manner. Customers may require features and capabilities that our current applications do not have. We may experience difficulties that could delay or prevent our development, acquisition or implementation of new applications and enhancements.
If we are unable to successfully develop or acquire new enterprise work management capabilities and functionality, enhance our existing applications to anticipate and meet customer preferences, sell our applications into new markets or adapt to changing industry standards in enterprise work management, our revenue and results of operations would be adversely affected.
-26-
Table of Contents
Adverse economic conditions may reduce our customers’ ability to spend money on information technology or enterprise work management software, or our customers may otherwise choose to reduce their spending on information technology or enterprise work management software, which may adversely impact our business.
Our business depends on the overall demand for information technology and enterprise work management software spend and on the economic health of our current and prospective customers. If worldwide economic conditions become unstable, our existing customers and prospective customers may re-evaluate their decision to purchase our applications. Weak global economic conditions or a reduction in information technology or enterprise work management software spending by our customers, could harm our business in a number of ways, including longer sales cycles and lower prices for our applications.
We rely on third-party software that is required for the development and deployment of our applications, which may be difficult to obtain or which could cause errors or failures of our applications.
We rely on software licensed from or hosted by third parties to offer our applications. In addition, we may need to obtain licenses from third parties to use intellectual property associated with the development of our applications, which might not be available to us on acceptable terms, or at all. Any loss of the right to use any software required for the development, maintenance and delivery of our applications could result in delays in the provision of our applications until equivalent technology is either developed by us, or, if available, is identified, obtained and integrated, which could harm our business. Any errors or defects in third-party software could result in errors or a failure of our applications, which could harm our business.
If our applications contain serious errors or defects we may lose revenue and market acceptance and we may incur costs to defend or settle product liability claims.
Complex software applications such as ours often contain errors or defects, particularly when first introduced or when new versions or enhancements are released. Our current and future applications may contain serious defects.
Since our customers use our applications for critical business purposes, defects or other performance problems could negatively impact our customers and could result in:
| • | loss or delayed market acceptance and sales; |
| • | breach of warranty or product liability claims; |
| • | sales credits or refunds for prepaid amounts related to unused subscription services; |
| • | cancelled contracts and loss of customers; |
| • | diversion of development and customer service resources; and |
| • | injury to our reputation. |
The costs incurred in correcting any material errors or defects might be substantial and could adversely affect our operating results. Although our customer agreements typically contain provisions designed to limit our exposure to certain of the claims above, existing or future laws or unfavorable judicial decisions could negate these limitations. Even if not successful, a product liability claim brought against us would likely be a distraction to management, time-consuming and costly to resolve, and could seriously damage our reputation in the marketplace, making it harder for us to sell our applications. Additionally, our errors and omissions insurance may be inadequate or may not be available in the future on acceptable terms, or at all, and our policy may not cover all claims made against us and defending a suit, regardless of its merit, could be costly and divert management’s attention.
-27-
Table of Contents
If we fail to integrate our applications with other software applications and competitive or adjacent offerings that are developed by others, or fail to make our applications available on mobile and other handheld devices, our applications may become less marketable, less competitive or obsolete and our operating results could be harmed.
Our applications integrate with a variety of other software applications, and also with competing and adjacent third-party offerings, and we need to continuously modify and enhance our platform to adapt to changes in cloud-enabled hardware, software, networking, browser and database technologies. Any failure of our applications to integrate effectively with other software applications and product offerings could reduce the demand for our applications or result in customer dissatisfaction and harm to our business. If we are unable to respond to changes in the applications and tools with which our applications integrate in a cost-effective manner, our applications may become less marketable, less competitive or obsolete. Competitors may also impede our attempts to create integration between our applications and competitive offerings, which may decrease demand for our applications. In addition, an increasing number of individuals within organizations are utilizing devices other than personal computers, such as mobile phones, tablets and other handheld devices, to access the Internet and corporate resources and to conduct business. If we cannot effectively make our applications available on these devices, we may experience difficulty attracting and retaining customers.
If we fail to develop and maintain relationships with third parties, our business may be harmed.
Our business depends in part on the development and maintenance of technology integration, joint sales and reseller relationships. Maintaining relationships with third parties requires significant time and resources, as does integrating third-party content and technology. Further, third parties may not perform as expected under any relationships that we may enter into, and we may have disagreements or disputes with third parties that could negatively affect our brands and reputation. If we are unsuccessful in establishing or maintaining relationships with third parties, our ability to compete in the marketplace or to grow our revenue could be impaired and our operating results could suffer.
Our use of open source software could negatively affect our ability to sell our applications and subject us to possible litigation.
A portion of our applications incorporate open source software, and we expect to continue to incorporate open source software in the future. Few of the licenses applicable to open source software have been interpreted by courts, and their application to the open source software integrated into our proprietary software may be uncertain. Moreover, we cannot provide any assurance that we have not incorporated additional open source software in our applications in a manner that is inconsistent with the terms of the license or our current policies and procedures. If we fail to comply with these licenses, we may be subject to certain requirements, including requirements that we offer our applications that incorporate the open source software for no cost, that we make available source code for modifications or derivative works we create based upon, incorporating or using the open source software and that we license such modifications or derivative works under the terms of applicable open source licenses. If an author or other third party that distributes such open source software were to allege that we had not complied with the conditions of one or more of these licenses, we could be required to incur significant legal expenses defending against such allegations and could be subject to significant damages, enjoined from the sale of our applications that contained the open source software and required to comply with the foregoing conditions, which could disrupt the distribution and sale of some of our applications. In addition, there have been claims challenging the ownership of open source software against companies that incorporate open source software into their products. As a result, we could be subject to suits by parties claiming infringement due to the reliance by our applications on certain open source software. Litigation could be costly for us to defend, have a negative effect on our operating results and financial condition or require us to devote additional research and development resources to change our applications.
-28-
Table of Contents
Certain of our operating results and financial metrics are difficult to predict as a result of seasonality.
We have historically experienced seasonality in terms of when we enter into customer agreements. We sign a significantly higher percentage of agreements with new customers, and renew agreements with existing customers, in the fourth quarter of each calendar year as our customers tend to follow budgeting cycles at the end of the calendar year. Our cash flow from operations has historically been higher in the first quarter of each calendar year than in other quarters. This seasonality is reflected to a much lesser extent, and sometimes is not immediately apparent, in our revenue, due to the fact that we defer revenue recognition. In addition, seasonality may be difficult to observe in our financial results during periods in which we acquire businesses as such results typically are most significantly impacted by such acquisitions. We expect this seasonality to continue, or possibly increase in the future, which may cause fluctuations in our operating results and financial metrics. If our quarterly operating results or outlook fall below the expectations of research analysts or investors, the price of our common stock could decline substantially.
We could incur substantial costs as a result of any claim of infringement of another party’s intellectual property rights.
In recent years, there has been significant litigation involving patents and other intellectual property rights in our industry. Companies providing software are increasingly bringing and becoming subject to suits alleging infringement of proprietary rights, particularly patent rights, and to the extent we gain greater market visibility, we face a higher risk of being the subject of intellectual property infringement claims. We do not have a significant patent portfolio, which could prevent us from deterring patent infringement claims through our own patent portfolio, and our competitors and others may now and in the future have significantly larger and more mature patent portfolios than we have. The risk of patent litigation has been amplified by the increase in the number of a type of patent holder, which we refer to as a non-practicing entity, whose sole business is to assert such claims and against whom our own intellectual property portfolio may provide little deterrent value. We could incur substantial costs in prosecuting or defending any intellectual property litigation. If we sue to enforce our rights or are sued by a third-party that claims that our applications infringe its rights, the litigation could be expensive and could divert our management resources.
In addition, in most instances, we have agreed to indemnify our customers against claims that our applications infringe the intellectual property rights of third parties. Our business could be adversely affected by any significant disputes between us and our customers as to the applicability or scope of our indemnification obligations to them. Any intellectual property litigation to which we might become a party, or for which we are required to provide indemnification, may require us to do one or more of the following:
| • | cease selling or using applications that incorporate the intellectual property that we allegedly infringe; |
| • | make substantial payments for legal fees, settlement payments or other costs or damages; |
| • | obtain a license, which may not be available on reasonable terms or at all, to sell or use the relevant technology; or |
| • | redesign the allegedly infringing applications to avoid infringement, which could be costly, time-consuming or impossible. |
If we are required to make substantial payments or undertake any of the other actions noted above as a result of any intellectual property infringement claims against us or any obligation to indemnify our customers for such claims, such payments or actions could harm our business.
We could incur substantial costs in protecting our intellectual property from infringement, and any failure to protect our intellectual property could impair our business.
Our success and ability to compete depend in part upon our intellectual property. We seek to protect the source code for our proprietary software and other proprietary technology and information under a combination
-29-
Table of Contents
of copyright, trade secrets and patent law, and we seek to protect our brands through trademark law. Our policy is to enter into confidentiality agreements, or agreements with confidentiality provisions, with our employees, consultants, vendors and customers and to control access to our software, documentation and other proprietary information. Despite these precautions, it may be possible for unauthorized parties to copy our software or other proprietary technology or information, or to develop similar software independently.
Despite our efforts to protect our proprietary rights, unauthorized parties may attempt to copy aspects of our applications or to obtain and use information that we regard as proprietary. Policing unauthorized use of our applications is difficult, and we are unable to determine the extent to which piracy of our software exists or will occur in the future. Litigation may be necessary in the future to enforce our intellectual property rights, protect our trade secrets, determine the validity and scope of the proprietary rights of others or defend against claims of infringement or invalidity. Such litigation could be costly, time-consuming and distracting to management, result in a diversion of resources or the narrowing or invalidation of portions of our intellectual property and have a material adverse effect on our business, operating results and financial condition. Furthermore, our efforts to enforce our intellectual property rights may be met with defenses, counterclaims and countersuits attacking the validity and enforceability of our intellectual property rights or alleging that we infringe the counterclaimant’s own intellectual property. These steps may be inadequate to protect our intellectual property. Third parties may challenge the validity or ownership of our intellectual property, and these challenges could cause us to lose our rights, in whole or in part, to such intellectual property or narrow its scope such that it no longer provides meaningful protection. We will not be able to protect our intellectual property if we are unable to enforce our rights or if we do not detect unauthorized use of our intellectual property. Despite our precautions, it may be possible for unauthorized third parties to copy our products and use information that we regard as proprietary to create products and services that compete with ours. Some license provisions protecting against unauthorized use, copying, transfer and disclosure of our applications may be unenforceable under the laws of certain jurisdictions and foreign countries. Further, the laws of some countries do not protect proprietary rights to the same extent as the laws of the United States. To the extent we expand our international activities, our exposure to unauthorized copying, transfer and use of our applications and proprietary technology or information may increase.
There can be no assurance that our means of protecting our proprietary rights will be adequate or that our competitors will not independently develop similar technology. If we fail to meaningfully protect our intellectual property, our business, brands, operating results and financial condition could be materially harmed.
Unanticipated changes in our effective tax rate or challenges by tax authorities could harm our future results.
We are subject to income taxes in the United States and various non-U.S. jurisdictions. Our effective tax rate could be adversely affected by changes in the allocation of our pre-tax earnings and losses among countries with differing statutory tax rates, in certain non-deductible expenses as a result of acquisitions, in the valuation of our deferred tax assets and liabilities, or in federal, state, local or non-U.S. tax laws and accounting principles, including increased tax rates, new tax laws or revised interpretations of existing tax laws and precedents. In particular, the United States is currently considering various changes to the U.S. taxation of international business activities, which, if enacted, could impact the U.S. taxation of our non-U.S. earnings as well as our cash maintained outside the United States. Increases in our effective tax rate would adversely affect our operating results.
In addition, we may be subject to income tax audits by various tax jurisdictions throughout the world, many of which have not established clear guidance on the tax treatment of cloud-based companies. The application of tax laws in such jurisdictions may be subject to diverging and sometimes conflicting interpretations by tax authorities in these jurisdictions. Although we believe our income tax liabilities are reasonably estimated and accounted for in accordance with applicable laws and principles, an adverse resolution of one or more uncertain tax positions in any period could have a material impact on the results of operations for that period.
-30-
Table of Contents
Taxing authorities may successfully assert that we should have collected or in the future should collect additional sales and use taxes, and we could be subject to liability with respect to past or future sales, which could adversely affect our results of operations.
We have not historically filed sales and use tax returns or collected sales and use taxes in all jurisdictions in which we have sales, based on our belief that such taxes are not applicable. Taxing authorities may seek to impose such taxes on us, including for past sales, which could result in penalties and interest. Any such tax assessments may adversely affect the results of our operations.
Taxing authorities could reallocate our taxable income among our subsidiaries, which could increase our consolidated tax liability.
We conduct integrated operations internationally through subsidiaries in various tax jurisdictions pursuant to transfer pricing arrangements between our subsidiaries and between our subsidiaries and us. If two or more affiliated companies are located in different countries, the tax laws or regulations of each country generally require that transfer prices be the same as those between unrelated companies dealing at arms’ length and that contemporaneous documentation is maintained to support the transfer prices. While we believe that we operate in compliance with applicable transfer pricing laws and intend to continue to do so, our transfer pricing procedures are not binding on applicable tax authorities. If tax authorities in any of these countries were to successfully challenge our transfer prices as not reflecting arms’ length transactions, they could require us to adjust our transfer prices and thereby reallocate our income to reflect these revised transfer prices, which could result in a higher tax liability to us. Such reallocations may subject us to interest and penalties that would increase our consolidated tax liability and could adversely affect our financial condition, results of operations and cash flows.
Our ability to use our net operating loss carryforwards and certain other tax attributes may be limited.
As of December 31, 2013, we had federal net operating loss carryforwards of approximately $45.0 million and research and development credit carryforwards of approximately $0.8 million, which begin expiring in 2018. Under Sections 382 and 383 of the Internal Revenue Code of 1986, as amended, or the Code, if a corporation undergoes an “ownership change,” the corporation’s ability to use its pre-change net operating loss carryforwards and other pre-change tax attributes, such as research tax credits, to offset its post-change income and taxes may be limited. In general, an “ownership change” occurs if there is a cumulative change in our ownership by “5% shareholders” that exceeds 50 percentage points over a rolling three-year period. Similar rules apply under state tax laws. Based on analysis of acquired net operating losses, utilization of our net operating losses will be subject to annual limitations. The annual limitation will result in the expiration of $16.2 million of net operating losses and $0.8 million of credit carryforwards before utilization. In the event that it is determined that we have in the past experienced additional ownership changes, or if we experience one or more ownership changes as a result of this offering or future transactions in our stock, then we may be further limited in our ability to use our net operating loss carryforwards and other tax assets to reduce taxes owed on the net taxable income that we earn. Any such limitations on the ability to use our net operating loss carryforwards and other tax assets could adversely impact our business, financial condition and operating results.
Changes in laws or regulations related to the Internet may diminish the demand for our applications and any failure of the Internet infrastructure could have a negative impact on our business.
We deliver our cloud-based applications through the Internet. Federal, state or foreign government bodies or agencies have in the past adopted, and may in the future adopt, laws or regulations affecting data privacy and the use of the Internet. In addition, government agencies or private organizations may begin to impose taxes, fees or other charges for accessing the Internet or on commerce conducted via the Internet. Increased enforcement of existing laws and regulations, as well as any laws, regulations or changes that may be adopted or implemented in the future, could limit the growth of the use of cloud-based applications or communications generally, result in a decline in the use of the Internet and the viability of cloud-based applications such as ours and reduce the demand for our applications.
-31-
Table of Contents
The success of our enterprise work management software applications depends on the development and maintenance of the Internet infrastructure. This includes maintenance of a reliable network backbone with the necessary speed, data capacity and security, as well as the timely development of complementary products for providing reliable Internet access and services. The Internet has experienced, and is likely to continue to experience, significant growth in the amount of traffic and may be unable to support such demands. In addition, problems caused by viruses, worms, malware and similar programs may harm the performance of the Internet. Any outages and delays in the Internet could reduce the level of usage of our services, which could materially adversely affect our business, financial condition, results of operations and prospects.
Privacy concerns and laws or other domestic or foreign regulations may reduce the effectiveness of our applications and adversely affect our business.
Our customers can use our applications to collect, use and store personal or identifying information regarding their customers and employees. Federal, state and foreign government bodies and agencies have adopted, are considering adopting or may adopt laws and regulations regarding the collection, use, storage and disclosure of personal information obtained from individuals. The costs of compliance with, and other burdens imposed by, such laws and regulations that are applicable to the businesses of our customers may limit the use and adoption of our applications and reduce overall demand, or lead to significant fines, penalties or liabilities for any noncompliance with such privacy laws. For example, the European Union and many countries in Europe have stringent privacy laws and regulations that may impact our ability to profitably operate in certain European countries. Furthermore, privacy concerns may cause our customers to resist providing the personal data necessary to allow them to use our applications effectively. Even the perception of privacy concerns, whether or not valid, may inhibit market adoption of our applications in certain industries. All of these domestic and international legislative and regulatory initiatives may adversely affect our customers’ ability to process, handle, store, use and transmit demographic and personal information from their customers and employees, which could reduce demand for our applications.
In addition to government activity, privacy advocacy groups and the technology and other industries are considering various new, additional or different self-regulatory standards that may place additional burdens on us. If the processing of personal information were to be curtailed in this manner, our applications would be less effective, which may reduce demand for our applications and adversely affect our business.
We are subject to governmental export and import controls that could impair our ability to compete in international markets due to licensing requirements and subject us to liability if we are not in compliance with applicable laws.
Our applications are subject to export control and import laws and regulations, including the U.S. Export Administration Regulations, U.S. Customs regulations and various economic and trade sanctions regulations administered by the U.S. Treasury Department’s Office of Foreign Assets Controls. Exports of our applications must be made in compliance with these laws and regulations. If we fail to comply with these laws and regulations, we and certain of our employees could be subject to substantial civil or criminal penalties, including: the possible loss of export or import privileges; fines, which may be imposed on us and responsible employees or managers; and, in extreme cases, the incarceration of responsible employees or managers. Obtaining the necessary authorizations, including any required license, for a particular sale may be time-consuming, is not guaranteed and may result in the delay or loss of sales opportunities. In addition, changes in our applications or changes in applicable export or import regulations may create delays in the introduction and sale of our applications in international markets, prevent our customers with international operations from deploying our applications or, in some cases, prevent the export or import of our applications to certain countries, governments or persons altogether. Any change in export or import regulations, shift in the enforcement or scope of existing regulations, or change in the countries, governments, persons or technologies targeted by such regulations, could also result in decreased use of our applications, or in our decreased ability to export or sell our applications to existing or potential customers with international operations. Any decreased use of our applications or limitation on our ability to export or sell our applications would likely adversely affect our business.
-32-
Table of Contents
Furthermore, we incorporate encryption technology into certain of our applications. Various countries regulate the import of certain encryption technology, including through import permitting and licensing requirements, and have enacted laws that could limit our ability to distribute our applications or could limit our customers’ ability to implement our applications in those countries. Encrypted applications and the underlying technology may also be subject to export control restrictions. Governmental regulation of encryption technology and regulation of imports or exports of encryption products, or our failure to obtain required import or export approval for our applications, when applicable, could harm our international sales and adversely affect our revenue. Compliance with applicable regulatory requirements regarding the export of our applications, including with respect to new releases of our applications, may create delays in the introduction of our applications in international markets, prevent our customers with international operations from deploying our applications throughout their globally-distributed systems or, in some cases, prevent the export of our applications to some countries altogether.
Moreover, U.S. export control laws and economic sanctions programs prohibit the shipment of certain products and services to countries, governments and persons that are subject to U.S. economic embargoes and trade sanctions. Even though we take precautions to prevent our applications from being shipped or provided to U.S. sanctions targets, our applications and services could be shipped to those targets or provided by third parties despite such precautions. Any such shipment could have negative consequences, including government investigations, penalties and reputational harm.
If we are unable to implement and maintain effective internal controls over financial reporting in the future, investors may lose confidence in the accuracy and completeness of our financial reports and the market price of our common stock may be negatively affected.
As a public company, we will be required to maintain internal controls over financial reporting and to report any material weaknesses in such internal controls. Section 404 of the Sarbanes-Oxley Act, requires that we evaluate and determine the effectiveness of our internal controls over financial reporting. Our independent registered public accounting firm will not be required to formally attest to the effectiveness of our internal control over financial reporting until the later of our second annual report or the first annual report required to be filed with the SEC following the date we are no longer an “emerging growth company” as defined in the JOBS Act. If we have a material weakness in our internal controls over financial reporting, we may not detect errors on a timely basis and our financial statements may be materially misstated. We are in the process of designing and implementing the internal controls over financial reporting required to comply with this obligation, which process will be time consuming, costly and complicated. We may need additional finance and accounting personnel with certain skill sets to assist us with the reporting requirements we will encounter as a public company and to support our anticipated growth. In addition, implementing internal controls may distract our officers and employees, entail substantial costs to modify our existing processes and take significant time to complete.
In the future, if we identify material weaknesses in our internal controls over financial reporting, if we are unable to comply with the requirements of Section 404 of the Sarbanes-Oxley Act in a timely manner, if we are unable to assert that our internal controls over financial reporting are effective, or if our independent registered public accounting firm is not required to express an opinion due to the provisions of the JOBS Act or is unable to express an opinion as to the effectiveness of our internal controls over financial reporting, investors may lose confidence in the accuracy and completeness of our financial reports and the market price of our common stock could be negatively affected, and we could become subject to investigations by the stock exchange on which our securities are listed, the Securities and Exchange Commission, or the SEC, or other regulatory authorities, which could require additional financial and management resources.
-33-
Table of Contents
We will incur increased costs and demands upon management as a result of complying with the laws and regulations affecting public companies, which could harm our operating results.
As a public company, we will incur significant legal, accounting, investor relations and other expenses that we did not incur as a private company, including costs associated with public company reporting requirements. We also have incurred and will incur costs associated with current corporate governance requirements, including requirements under Section 404 and other provisions of the Sarbanes-Oxley Act, as well as rules implemented by the SEC and the exchange on which we list our common stock. We expect these rules and regulations to substantially increase our legal and financial compliance costs and to make some activities more time-consuming and costly. We are unable to currently estimate these costs with any degree of certainty. We also expect that, as a public company, it will be more difficult and more expensive for us to obtain director and officer liability insurance, and we may be required to incur substantially higher costs to obtain coverage or to accept reduced policy limits and coverage. As a result, it may be more difficult for us to attract and retain qualified individuals to serve on our board of directors or as our executive officers.
We are an “emerging growth company,” and any decision on our part to comply with certain reduced disclosure requirements applicable to emerging growth companies could make our common stock less attractive to investors.
We are an “emerging growth company,” as defined in the JOBS Act and, for as long as we continue to be an emerging growth company, we may choose to take advantage of certain exemptions from various reporting requirements applicable to other public companies including, but not limited to: not being required to have our internal control over financial reporting audited by our independent registered public accounting firm pursuant to Section 404 of the Sarbanes-Oxley Act; reduced disclosure obligations regarding executive compensation in our periodic reports and proxy statements; and exemptions from the requirements to hold a nonbinding advisory vote on executive compensation and to obtain stockholder approval of any golden parachute payments not previously approved. We may take advantage of these provisions for up to five years or such earlier time that we are no longer an “emerging growth company.” We will remain an “emerging growth company” for up to five years, although, we would cease to be an “emerging growth company” upon the earliest of the first fiscal year following the fifth anniversary of the consummation of this offering; the first fiscal year after our annual gross revenue is $1 billion or more; the date on which we have, during the previous three-year period, issued more than $1 billion in non-convertible debt securities; or the date on which we are deemed to be a “large accelerated filer” as defined in the Securities Exchange Act of 1934, or the Exchange Act. To the extent we take advantage of any of these reduced reporting burdens in this prospectus or in future filings, the information that we provide our security holders may be different than you might get from other public companies in which you hold equity interests. We cannot predict if investors will find our common stock less attractive because we may rely on these exemptions. If some investors find our common stock less attractive as a result, there may be a less active trading market for our common stock and our stock price may be more volatile.
Under Section 107(b) of the JOBS Act, emerging growth companies can delay adopting new or revised accounting standards until such time as those standards apply to private companies. We are choosing to “opt out” of such extended transition period, however, and, as a result, we will comply with new or revised accounting standards on the relevant dates on which adoption of such standards is required for non-emerging growth companies. Section 107 of the JOBS Act provides that our decision to opt out of the extended transition period for complying with new or revised accounting standards is irrevocable.
Risks Related to This Offering and Ownership of Our Common Stock
An active trading market for our common stock may not develop, and you may not be able to resell your shares of our common stock at or above our initial public offering price.
Before this offering, there was no public trading market for our common stock. If a market for our common stock does not develop or is not sustained, it may be difficult for you to sell your shares of common stock at an
-34-
Table of Contents
attractive price or at all. The initial public offering price of our common stock will be determined through negotiations between us and the underwriters. This initial public offering price may not be indicative of the market price of our common stock after the offering. In the absence of an active trading market for our common stock, investors may not be able to sell their common stock at or above the initial public offering price or at the time that they would like to sell. We cannot predict the prices at which our common stock will trade. It is possible that in one or more future periods our results of operations may be below the expectations of public market analysts and investors and, as a result of these and other factors, the price of our common stock may fall.
The market price of our common stock may be volatile, which could result in substantial losses for investors purchasing shares in this offering.
The market price of our common stock could be subject to significant fluctuations after this offering, and it may decline below the initial public offering price. Some of the factors that may cause the market price of our common stock to fluctuate include:
| • | actual or anticipated changes in the estimates of our operating results that we provide to the public, our failure to meet these projections or changes in recommendations by securities analysts that elect to follow our common stock; |
| • | price and volume fluctuations in the overall equity markets from time to time; |
| • | significant volatility in the market price and trading volume of comparable companies; |
| • | changes in the market perception of enterprise work management software generally or in the effectiveness of our applications in particular; |
| • | disruptions in our services due to computer hardware, software or network problems; |
| • | announcements of technological innovations, new products, strategic alliances or significant agreements by us or by our competitors; |
| • | announcements of new customer agreements or upgrades and customer downgrades or cancellations or delays in customer purchases; |
| • | litigation involving us; |
| • | our ability to successfully consummate and integrate acquisitions; |
| • | investors’ general perception of us; |
| • | recruitment or departure of key personnel; |
| • | the expiration of market standoff or contractual lock-up agreements; |
| • | sales of our common stock by us or our stockholders; |
| • | fluctuations in the trading volume of our shares or the size of our public float; and |
| • | general economic, legal, industry and market conditions and trends unrelated to our performance. |
In the past, following periods of volatility in the market price of a company’s securities, securities class action litigation has often been brought against that company. Because of the potential volatility of our stock price, we may become the target of securities litigation in the future. If we were to become involved in securities litigation, it could result in substantial costs, divert management’s attention and resources from our business and adversely affect our business.
If securities or industry analysts do not publish, or cease publishing, research or reports about us, our business or our market, if they publish negative evaluations of our stock, or if we fail to meet the expectations of analysts, the price of our stock and trading volume could decline.
The trading market for our common stock will be influenced by the research and reports that industry or securities analysts may publish about us, our business, our market or our competitors. We do not currently have,
-35-
Table of Contents
and may never obtain, research coverage by financial analysts. If no or few analysts commence coverage of us, the trading price of our stock would likely decrease. Even if we do obtain analyst coverage, if one or more of the analysts covering our business downgrade their evaluation of our stock, the price of our stock could decline. If one or more of these analysts cease to cover our stock, we could lose visibility in the market for our stock, which in turn could cause our stock price to decline. Furthermore, if our operating results fail to meet analysts’ expectations our stock price would likely decline.
Sales of a substantial number of shares of our common stock in the public market by our existing stockholders following this offering could cause our stock price to fall.
Sales of a substantial number of shares of our common stock in the public market could occur at any time after the expiration of the lock-up agreements described in the section titled “Underwriting.” These sales, or the market perception that the holders of a large number of shares intend to sell shares, could reduce the market price of our common stock. After the closing of this offering, we will have 14,335,673 shares of common stock outstanding based on 10,489,519 shares of common stock outstanding at June 30, 2014 (assuming the conversion of all outstanding shares of preferred stock into 6,834,476 shares of common stock), assuming no exercise of the underwriters’ option to purchase additional shares of our common stock in this offering. This includes the 3,846,154 shares that we are selling in this offering, which, except to the extent sold to our directors, executive officers or affiliates, may be resold in the public market immediately. The remaining 10,489,519 shares, or 73.2% of our outstanding shares after this offering, are currently, and, together with any shares sold in this offering to our directors, executive officers or affiliates, will be following the closing of this offering, restricted as a result of securities laws or lock-up agreements but will be able to be sold, subject to any applicable volume limitations under federal securities laws with respect to affiliate sales, in the near future.
In addition, as of June 30, 2014, there were an additional 588,132 shares reserved for issuance upon exercise of outstanding stock awards issued under our stock-based compensation plans that will become eligible for sale in the public market to the extent permitted by any applicable vesting requirements, lock-up agreements and Rules 144 and 701 under the Securities Act of 1933, as amended, or the Securities Act. Moreover, after this offering, holders of an aggregate of 6,834,476 shares of our common stock as of June 30, 2014, or certain of their transferees, and the holders of 76,514 shares of common stock issuable upon exercise of warrants to purchase shares of our preferred stock, will have rights, subject to some conditions, to require us to file registration statements covering their shares or to include their shares in registration statements that we may file for ourselves or other stockholders. We also intend to register all shares of common stock that we may issue under our stock-based compensation plans. Once we register these shares, they can be freely sold in the public market upon issuance, subject to the lock-up agreements and the restrictions imposed on our affiliates under Rule 144 under the Securities Act.
Additionally, William Blair & Company, L.L.C. and Raymond James & Associates, Inc., on behalf of the underwriters, may without our consent, at any time, release all or any portion of the shares subject to lock-up agreements to be entered into in connection with this offering, which would result in more shares being available for sale in the public market at earlier dates. Sales of common stock by existing stockholders in the public market, the availability of these shares for sale, our issuance of securities or the perception that any of these events might occur could materially and adversely affect the market price of our common stock. In addition, the sale of these securities could impair our ability to raise capital through the sale of additional stock.
Purchasers in this offering will incur immediate and substantial dilution in the book value of their investment as a result of this offering.
If you purchase common stock in this offering, you will incur immediate and substantial dilution of $12.48 per share, representing the difference between the assumed initial public offering price of $13.00 per share, which is the midpoint of the estimated offering price range set forth on the cover page of this prospectus, and our
-36-
Table of Contents
pro forma as adjusted net tangible book value per share after giving effect to this offering and the conversion of all outstanding shares of our preferred stock immediately prior to the closing of this offering. Moreover, we issued warrants and options in the past that allow their holders to acquire common stock at prices significantly below the assumed initial public offering price of $13.00 per share. As of June 30, 2014, there were 2,459 shares of common stock issuable upon exercise of warrants to purchase shares of our common stock at a weighted-average exercise price of $1.77 per share and there were 76,514 shares of common stock issuable upon exercise of warrants to purchase shares of our preferred stock at a weighted-average exercise price of $6.10 per share. In addition, as of June 30, 2014, there were 588,132 shares subject to outstanding options with a weighted-average exercise price of $3.49 per share. To the extent that these outstanding warrants or options are ultimately exercised, you will experience further dilution.
Our existing directors, executive officers and principal stockholders will continue to have substantial control over us after this offering, which could limit your ability to influence the outcome of key transactions, including a change of control.
After this offering and based on share ownership as of September 30, 2014, including shares issuable upon the exercise of outstanding options and warrants exercisable within 60 days of September 30, 2014, our directors, executive officers, principal stockholders and their affiliates will beneficially own or control, directly or indirectly, in the aggregate, approximately 55.7% of our outstanding common stock, assuming (i) no exercise of the underwriters’ option to purchase additional shares of our common stock in this offering, (ii) the issuance of an aggregate of $0.5 million of shares of restricted common stock to our non-employee directors in connection with grants made as of the effectiveness of this registration statement of which this prospectus forms a part, and (iii) the purchase by certain of our existing stockholders, including John T. McDonald, our Chief Executive Officer and chairman of our board of directors, entities associated with Austin Ventures and ESW Capital, LLC or its affiliates, of up to an aggregate of $5.0 million of shares of common stock in this offering. See “—Participation in this offering by certain of our existing stockholders would reduce the public float for our shares.” As a result, these stockholders, acting together, could have significant influence over the outcome of matters submitted to our stockholders for approval, including the election or removal of directors, any amendments to our certificate of incorporation or bylaws and any merger, consolidation or sale of all or substantially all of our assets, and over the management and affairs of our company. This concentration of ownership may also have the effect of delaying or preventing a change in control of our company or discouraging others from making tender offers for our shares and might affect the market price of our common stock.
Participation in this offering by certain of our existing stockholders would reduce the public float for our shares.
Certain of our existing stockholders, including John T. McDonald, our Chief Executive Officer and chairman of our board of directors, entities associated with Austin Ventures, each of which is an affiliate of a member of our board of directors, and ESW Capital, LLC or its affiliates, have indicated an interest in purchasing shares of common stock with an aggregate purchase price of up to $5.0 million in this offering, or up to 10% of the proposed offering size based on an assumed initial public offering price of $13.00 per share, the midpoint of the price range set forth on the cover page of this prospectus. However, because indications of interest are not binding agreements or commitments to purchase, the underwriters may determine to sell more, less or no shares in this offering to such stockholders, or such stockholders may determine to purchase more, less or no shares in this offering. Assuming an initial public offering price of $13.00 per share, which is the midpoint of the price range set forth on the front cover page of this prospectus, if such stockholders were to purchase the entire $5.0 million of our common stock, they would purchase an aggregate of 384,615 shares of our common stock in this offering. If such stockholders purchase all such shares, assuming no exercise by the underwriters of their option to purchase additional shares, but assuming the issuance of an aggregate of 38,460 shares of restricted common stock to our non-employee directors in connection with grants made as of the effectiveness of this registration statement, assuming an initial offering price of $13.00 per share, which is the midpoint of the price range set forth on the front cover page of this prospectus, our executive officers, principal stockholders and
-37-
Table of Contents
their affiliates will beneficially own or control, in the aggregate, approximately 55.7% of our outstanding shares of common stock upon completion of this offering.
If stockholders affiliated with members of our board of directors or other existing stockholders are allocated all or a portion of the shares in which they have indicated an interest in this offering and purchase any such shares, such purchase would reduce the available public float for our shares because such stockholders would be restricted from selling the shares by a lock-up agreement they have entered into with our underwriters and, in some cases, by restrictions under applicable securities laws. As a result, any purchase of shares by such stockholders in this offering may reduce the liquidity of our common stock relative to what it would have been had these shares been purchased by investors that were not existing stockholders.
Because we do not expect to pay any dividends on our common stock for the foreseeable future, investors in this offering may never receive a return on their investment.
We do not anticipate that we will pay any cash dividends to holders of our common stock in the foreseeable future. Instead, we plan to retain any earnings to maintain and expand our existing operations. In addition, our ability to pay cash dividends is currently limited by the terms of our existing loan and security agreements, which prohibits our payment of dividends on our capital stock without prior consent, and any future credit facility may contain terms prohibiting or limiting the amount of dividends that may be declared or paid on our common stock. Accordingly, investors must rely on sales of their common stock after price appreciation, which may never occur, as the only way to realize any return on their investment.
Our management will have broad discretion over the use of the proceeds we receive from this offering and might not apply the proceeds in ways that increase the value of your investment.
Our management will have broad discretion to use our net proceeds from this offering, and you will be relying on the judgment of our management regarding the application of these proceeds. Our management might not apply our net proceeds of this offering in ways that increase the value of your investment. We expect to use the net proceeds to us from this offering for working capital and other general corporate purposes, including to finance our growth by investing in or acquiring complementary companies, products or technologies, expanding our sales force, growing sales of our applications and improving and enhancing our applications. Our management might not be able to yield a significant return, if any, on any investment of these net proceeds. Pending their use, we may invest the net proceeds from this offering in a manner that does not produce income or that loses value. These investments may not yield a favorable return to our investors. You will not have the opportunity to influence our decisions on how to use our net proceeds from this offering.
Anti-takeover provisions in our amended and restated certificate of incorporation and our amended and restated bylaws, as well as provisions of Delaware law, might discourage, delay or prevent a change in control of our company or changes in our board of directors or management and, therefore, depress the trading price of our common stock.
Provisions in our certificate of incorporation and bylaws, as amended and restated prior to the closing of this offering, will contain provisions that may depress the market price of our common stock by acting to discourage, delay or prevent a merger, acquisition or other change in control that stockholders may consider favorable, including transactions in which you might otherwise receive a premium for your shares of our common stock. These provisions may also prevent or frustrate attempts by our stockholders to replace or remove members of our board of directors or our management. These provisions include the following:
| • | our certificate of incorporation provides for a classified board of directors with staggered three-year terms so that not all members of our board of directors are elected at one time; |
| • | directors may be removed by stockholders only for cause; |
-38-
Table of Contents
| • | our board of directors has the right to elect directors to fill a vacancy created by the expansion of the board of directors or the resignation, death or removal of a director, which prevents stockholders from being able to fill vacancies on our board of directors; |
| • | special meetings of our stockholders may be called only by our Chief Executive Officer, our board of directors or holders of not less than the majority of our issued and outstanding capital stock limiting the ability of minority stockholders to take certain actions without an annual meeting of stockholders; |
| • | our stockholders may not act by written consent unless the action to be effected and the taking of such action by written consent are approved in advance by our board of directors and, as a result, a holder, or holders, controlling a majority of our capital stock would generally not be able to take certain actions without holding a stockholders’ meeting; |
| • | our certificate of incorporation prohibits cumulative voting in the election of directors. This limits the ability of minority stockholders to elect director candidates; |
| • | stockholders must provide timely notice to nominate individuals for election to the board of directors or to propose matters that can be acted upon at an annual meeting of stockholders and, as a result, these provisions may discourage or deter a potential acquirer from conducting a solicitation of proxies to elect the acquirer’s own slate of directors or otherwise attempting to obtain control of us; and |
| • | our board of directors may issue, without stockholder approval, shares of undesignated preferred stock, making it possible for our board of directors to issue preferred stock with voting or other rights or preferences that could impede the success of any attempt to acquire us. |
As a Delaware corporation, we are also subject to provisions of Delaware law, including Section 203 of the Delaware General Corporation Law, which limits the ability of stockholders owning in excess of 15% of our outstanding voting stock from engaging in certain business combinations with us. For a description of our capital stock, see “Description of Capital Stock.”
Any provision of our certificate of incorporation and bylaws, as amended and restated prior to the closing of this offering, or Delaware law that has the effect of delaying or deterring a change in control could limit the opportunity for our stockholders to receive a premium for their shares of our common stock and could also affect the price that some investors are willing to pay for our common stock. The existence of the foregoing provisions and anti-takeover measures could limit the price that investors might be willing to pay in the future for shares of our common stock. They could also deter potential acquirers of our company, thereby reducing the likelihood that you could receive a premium for your common stock in an acquisition.
-39-
Table of Contents
SPECIAL NOTE REGARDING FORWARD-LOOKING STATEMENTS
This prospectus, including the sections titled “Prospectus Summary,” “Risk Factors,” “Management’s Discussion and Analysis of Financial Condition and Results of Operations” and “Business,” contains forward-looking statements. In some cases you can identify these statements by forward-looking words such as “anticipate,” “believe,” “continue,” “could,” “estimate,” “expect,” “intend,” “may,” “plan,” “project,” “will,” “would” or the negative or plural of these words or similar expressions. These forward-looking statements include, but are not limited to, statements concerning the following:
| • | our financial performance and our ability to achieve or sustain profitability or predict future results; |
| • | our ability to attract and retain customers; |
| • | our ability to deliver high-quality customer service; |
| • | the growth of demand for enterprise work management applications; |
| • | our ability to effectively manage our growth; |
| • | our ability to consummate and integrate acquisitions; |
| • | maintaining our senior management team and key personnel; |
| • | our ability to maintain and expand our direct sales organization; |
| • | our ability to obtain financing in the future on acceptable terms or at all; |
| • | our ability to adapt to changing market conditions and competition; |
| • | our ability to successfully enter new markets and manage our international expansion; |
| • | the operation and reliability of our third-party data centers; |
| • | our ability to adapt to technological change and continue to innovate; |
| • | economic and financial conditions; |
| • | our ability to integrate our applications with other software applications; |
| • | maintaining and expanding our relationships with third parties; |
| • | costs associated with defending intellectual property infringement and other claims; |
| • | our ability to maintain, protect and enhance our brand and intellectual property; |
| • | our ability to comply with privacy laws and regulations; and |
| • | other factors discussed in this prospectus in the sections titled “Prospectus Summary,” “Risk Factors,” “Management’s Discussion and Analysis of Financial Condition and Results of Operations” and “Business.” |
These forward-looking statements are subject to a number of risks, uncertainties and assumptions, including those described in the section titled “Risk Factors.” Moreover, we operate in a very competitive and rapidly-changing environment. New risks emerge from time to time. It is not possible for our management to predict all risks, nor can we assess the impact of all factors on our business or the extent to which any factor, or combination of factors, may cause actual results to differ materially from those contained in any forward-looking statements we may make. In light of these risks, uncertainties and assumptions, the forward-looking events and circumstances discussed in this prospectus may not occur and actual results could differ materially and adversely from those anticipated or implied in the forward-looking statements.
You should not rely upon forward-looking statements as predictions of future events. Although we believe that the expectations reflected in the forward-looking statements are reasonable, we cannot guarantee that the
-40-
Table of Contents
future results, levels of activity, performance or events and circumstances reflected in the forward-looking statements will be achieved or occur. Moreover, except as required by law, neither we nor any other person assumes responsibility for the accuracy and completeness of the forward-looking statements. We undertake no obligation to update publicly any forward-looking statements for any reason after the date of this prospectus to conform these statements to actual results or to changes in our expectations.
-41-
Table of Contents
MARKET, INDUSTRY AND OTHER DATA
Unless otherwise indicated, information contained in this prospectus concerning our industry and the market in which we operate, including our general expectations and market position, market opportunity and market size, is based on information from various sources, including independent data, research opinions and viewpoints published by IDC and McKinsey, on assumptions that we have made that are based on those and other similar sources and on our knowledge of the markets for our solutions. This information involves a number of assumptions and limitations, and you are cautioned not to give undue weight to such estimates. While we believe the market position, market opportunity and market size information included in this prospectus is generally reliable, such information is inherently imprecise. In addition, projections, assumptions and estimates of our future performance and the future performance of the markets in which we operate are necessarily subject to a high degree of uncertainty and risk due to a variety of factors, including those described in the section titled “Risk Factors” and elsewhere in this prospectus. These and other factors could cause results to differ materially from those expressed in the estimates made by the independent parties and by us.
-42-
Table of Contents
We estimate that the net proceeds to us from the sale of our common stock in this offering will be approximately $43.2 million, based on an assumed initial public offering price of $13.00 per share, which is the midpoint of the range set forth on the cover page of this prospectus, after deducting underwriting discounts and commissions and estimated offering expenses payable by us. If the underwriters exercise their option to purchase additional shares in full, we estimate that our net proceeds would be approximately $50.2 million, after deducting underwriting discounts and commissions and estimated offering expenses payable by us. Each $1.00 increase (decrease) in the assumed initial public offering price of $13.00 per share, the midpoint of the range set forth on the cover page of this prospectus, would increase (decrease) the net proceeds to us from this offering by approximately $3.6 million, assuming the number of shares offered by us, as set forth on the cover page of this prospectus, remains the same and after deducting underwriting discounts and commissions and estimated offering expenses payable by us. Similarly, each increase (decrease) of one million shares in the number of shares of common stock offered by us would increase (decrease) the net proceeds that we receive from this offering by approximately $12.1 million, assuming the assumed initial public offering price remains the same and after deducting underwriting discounts and commissions and estimated offering expenses payable by us.
We intend to use approximately $11.5 million of the net proceeds of this offering to repay outstanding and accrued interest under our loan and security agreements with Comerica Bank. As of June 30, 2014, we had $3.6 million outstanding as revolving loans and $18.9 million as term loans under our loan and security agreements. The revolving loans and term loans bear interest at a floating rate equal to Comerica Bank’s prime rate plus 1.75%. All outstanding revolving loan amounts must be repaid on April 11, 2015. All outstanding principal and interest under the term loan must be repaid on April 11, 2018.
The principal purposes of this offering are to increase our financial flexibility, improve our visibility in the marketplace and create a public market for our common stock. Although we do not have current specific plans for the net proceeds of this offering, we generally intend to use the net proceeds of this offering for working capital and other general corporate purposes, including to finance our growth by investing in or acquiring complementary companies, products or technologies, expanding our sales force, growing sales of our applications and improving and enhancing our applications. We do not have agreements or commitments for any investments or acquisitions at this time. Our management will have broad discretion in the application of the net proceeds from this offering, and investors will be relying on the judgment of our management regarding the application of the proceeds.
Pending the use of the proceeds from this offering as described above, we plan to invest the net proceeds in short-term, investment-grade interest-bearing securities, such as money market accounts, certificates of deposit, commercial paper or obligations issued or guaranteed by the U.S. government.
We intend to retain future earnings, if any, to finance the operation and expansion of our business and do not anticipate paying any cash dividends in the foreseeable future. Any future determination to declare dividends will be subject to the discretion of our board of directors and will be dependent on a number of factors, including our operating results, capital requirements and overall financial condition and any other factors deemed relevant by our board of directors. In addition, the terms of our loan and security agreements limit our ability to pay dividends.
-43-
Table of Contents
The following table sets forth our cash and cash equivalents and capitalization as of June 30, 2014, as follows:
| • | on an actual basis; |
| • | on a pro forma basis, giving effect to (i) a 6.099-for-one reverse stock split of our capital stock that occured on October 24, 2014; (ii) the conversion of all outstanding shares of our preferred stock into 6,834,476 shares of common stock immediately prior to the consummation of this offering; and (iii) the filing of our amended and restated certificate of incorporation; and |
| • | on a pro forma as adjusted basis to further reflect the sale by us of 3,846,154 shares of common stock in this offering based on an assumed initial public offering price of $13.00 per share, which is the midpoint of the range set forth on the cover page of this prospectus, after deducting underwriting discounts and commissions and estimated offering expenses payable by us. |
The pro forma as adjusted information set forth in the table below is for illustrative purposes only and will adjust based on the actual initial public offering price and other terms of this offering determined at pricing.
You should read the information in this table together with our consolidated financial statements and related notes and the section titled “Management’s Discussion and Analysis of Financial Condition and Results of Operations” contained elsewhere in this prospectus.
| As of June 30, 2014 | ||||||||||||
| Actual | Pro Forma | Pro Forma As Adjusted |
||||||||||
| (unaudited) (in thousands) |
||||||||||||
| Cash and cash equivalents |
$ | 3,059 | $ | 3,059 | $ | 46,244 | ||||||
|
|
|
|
|
|
|
|||||||
| Total debt (including current portion) |
$ | 27,384 | $ | 27,384 | $ | 27,384 | ||||||
| Redeemable Convertible Preferred Stock: |
||||||||||||
| Series A redeemable convertible preferred stock, $0.0001 par value; 2,990,703 shares authorized, 2,821,181 shares issued and outstanding, actual, no shares issued and outstanding, pro forma and pro forma as adjusted |
17,138 | — | — | |||||||||
| Series B redeemable convertible preferred stock, $0.0001 par value; 1,767,912 shares authorized, 1,701,909 shares issued and outstanding, actual, no shares issued and outstanding, pro forma and pro forma as adjusted |
10,369 | — | — | |||||||||
| Series B-1 convertible preferred stock, $0.0001 par value; 983,767 shares authorized, 237,740 shares issued and outstanding, actual, no shares issued and outstanding, pro forma and pro forma as adjusted |
1,276 | — | — | |||||||||
| Series B-2 redeemable convertible preferred stock, $0.0001 par value; 1,639,613 shares authorized, 155,598 shares issued and outstanding, actual, no shares issued and outstanding, pro forma and pro forma as adjusted |
949 | — | — | |||||||||
| Series C redeemable convertible preferred stock, $0.0001 par value; 1,918,347 shares authorized, 1,918,048 shares issued and outstanding, actual, no shares issued and outstanding, pro forma and pro forma as adjusted |
21,784 | — | — | |||||||||
| Stockholders’ Equity (Deficit): |
||||||||||||
| Preferred stock, $0.0001 par value; no shares authorized, issued and outstanding, actual and pro forma, 9,300,342 shares authorized, no shares issued and outstanding, pro forma as adjusted |
— | — | — | |||||||||
-44-
Table of Contents
| As of June 30, 2014 | ||||||||||||
| Actual | Pro Forma | Pro Forma As Adjusted |
||||||||||
| (unaudited) (in thousands) |
||||||||||||
| Common stock, $0.0001 par value; 13,989,998 shares authorized, 3,655,043 shares issued and outstanding, actual, 10,489,519 shares issued and outstanding, pro forma, and 14,335,673 shares issued and outstanding, pro forma as adjusted |
— | 1 | 1 | |||||||||
| Additional paid-in capital |
9,276 | 60,791 | 103,976 | |||||||||
| Accumulated deficit |
(30,106 | ) | (30,106 | ) | (30,106 | ) | ||||||
| Accumulated other comprehensive loss |
(697 | ) | (697 | ) | (697 | ) | ||||||
|
|
|
|
|
|
|
|||||||
| Total stockholders’ (deficit) equity |
(21,527 | ) | 29,989 | 73,174 | ||||||||
|
|
|
|
|
|
|
|||||||
| Total capitalization |
$ | 57,373 | $ | 57,373 | $ | 100,558 | ||||||
|
|
|
|
|
|
|
|||||||
Each $1.00 increase (decrease) in the assumed initial public offering price of $13.00 per share, the midpoint of the range set forth on the cover page of this prospectus, would increase (decrease) the pro forma as adjusted amount of each of additional paid-in capital, total stockholders’ equity and total capitalization by approximately $3.6 million, assuming that the number of shares offered by us, as set forth on the cover page of this prospectus, remains the same and after deducting the underwriting discounts and commissions and estimated offering expenses payable by us.
The table above excludes the following shares:
| • | 588,132 shares of common stock issuable upon exercise of stock options outstanding as of June 30, 2014, at a weighted-average exercise price of $3.49 per share; |
| • | 2,459 shares of common stock issuable upon exercise of warrants to purchase shares of common stock outstanding as of June 30, 2014, at a weighted-average exercise price of $1.77 per share; |
| • | 76,514 shares of common stock issuable upon exercise of warrants to purchase shares of our preferred stock outstanding as of June 30, 2014, at a weighted-average exercise price of $6.10 per share; |
| • | 246,000 shares of common stock reserved for issuance under our Amended and Restated 2010 Stock Plan as of June 30, 2014, which will become available for grants under our 2014 Equity Incentive Plan, as well as any automatic increases in the number of shares of common stock reserved for future issuance under our 2014 Equity Incentive Plan, which will become effective upon the execution of the underwriting agreement related to this offering; |
| • | 294,010 shares of restricted stock issued pursuant to restricted stock grants subsequent to June 30, 2014, at a purchase price of $8.73 per share; |
| • | 123,785 shares of common stock issuable upon exercise of stock options issued subsequent to June 30, 2014, at a weighted-average exercise price of $8.73 per share; and |
| • | Restricted stock grants to be issued to each of our non-employee directors upon the effectiveness of the registration statement of which this prospectus forms a part, entitling such directors to receive the number of shares of our common stock equal to an aggregate of $0.5 million divided by the initial public offering price per share. |
-45-
Table of Contents
If you invest in our common stock, your interest will be diluted to the extent of the difference between the initial public offering price per share of our common stock and the as adjusted net tangible book value per share of our common stock immediately after the closing of this offering.
As of June 30, 2014, we had a net tangible book value of $(35.8) million, or $(3.41) per share. Net tangible book value per share represents our total tangible assets (total assets less intangible assets) less our total liabilities, divided by the number of shares of outstanding common stock, after giving effect to the conversion of all outstanding shares of our preferred stock into shares of common stock upon the completion of this offering.
After giving effect to the receipt of the net proceeds from our sale of 3,846,154 shares of common stock in this offering at an assumed initial public offering price of $13.00 per share, the midpoint of the range set forth on the cover page of this prospectus, after deducting underwriting discounts and commissions and estimated offering expenses payable by us, our as adjusted net tangible book value as of June 30, 2014 would have been $7.4 million, or $0.52 per share. This represents an immediate increase in as adjusted net tangible book value of $3.93 per share to our existing stockholders and an immediate dilution of $12.48 per share to investors purchasing common stock in this offering.
The following table illustrates this dilution on a per share basis to new investors:
| Assumed initial public offering price per share |
$ | 13.00 | ||||||
| Net tangible book value per share as of June 30, 2014 |
$ | (3.41 | ) | |||||
| Increase in net tangible book value per share attributed to new investors purchasing shares from us in this offering |
$ | 3.93 | ||||||
| As adjusted net tangible book value per share after giving effect to this offering |
$ | 0.52 | ||||||
|
|
|
|||||||
| Dilution in as adjusted net tangible book value per share to new investors in this offering |
$ | 12.48 | ||||||
|
|
|
Each $1.00 increase (decrease) in the assumed initial public offering price of $13.00 per share would increase (decrease) the net tangible book value, as adjusted to give effect to this offering, by $(0.25) per share and the dilution to new investors by $(0.25) per share, assuming that the number of shares offered by us, as set forth on the cover page of this prospectus, remains the same, and after deducting underwriting discounts and commissions and estimated offering expenses payable by us.
If the underwriters exercise their option to purchase additional shares in full, the as adjusted net tangible book value per share of our common stock after this offering would be $0.96 per share, and the dilution in as adjusted net tangible book value per share to investors in this offering would be $12.04 per share.
-46-
Table of Contents
The following table summarizes, as of June 30, 2014 and after giving effect to this offering, a 6.099-for-one reverse stock split of our capital stock that occured on October 24, 2014, and the conversion of all outstanding shares of our preferred stock into shares of common stock upon the completion of this offering, the number of shares of our common stock, the total consideration and the average price per share (i) paid to us by our existing stockholders and (ii) to be paid by new investors purchasing our common stock in this offering at an assumed initial public offering price of $13.00 per share, the midpoint of the range set forth on the cover page of this prospectus, before deducting underwriting discounts and commissions and estimated offering expenses payable by us.
| Shares Purchased | Total Consideration | Average Price Per Share |
||||||||||||||||||
| Number | Percent | Amount | Percent | |||||||||||||||||
| Existing stockholders |
10,489,519 | 73.2 | % | 50,093,252 | 50 | % | $ | 4.78 | ||||||||||||
| New investors |
3,846,154 | 26.8 | 50,000,000 | 50 | 13.00 | |||||||||||||||
|
|
|
|
|
|
|
|
|
|||||||||||||
| Total |
14,335,673 | 100.0 | % | 100,093,252 | 100.0 | % | ||||||||||||||
|
|
|
|
|
|
|
|
|
|||||||||||||
The foregoing discussion and tables are based on 10,489,519 shares of our common stock outstanding as of June 30, 2014, and excludes:
| • | 588,132 shares of common stock issuable upon exercise of stock options outstanding as of June 30, 2014, at a weighted-average exercise price of $3.49 per share; |
| • | 2,459 shares of common stock issuable upon exercise of warrants to purchase shares of common stock outstanding as of June 30, 2014, at a weighted-average exercise price of $1.77 per share; |
| • | 76,514 shares of common stock issuable upon exercise of warrants to purchase shares of our preferred stock outstanding as of June 30, 2014, at a weighted-average exercise price of $6.10 per share; |
| • | 246,000 shares of common stock reserved for issuance under our Amended and Restated 2010 Stock Plan as of June 30, 2014, which will become available for grants under our 2014 Equity Incentive Plan, as well as any automatic increases in the number of shares of common stock reserved for future issuance under our 2014 Equity Incentive Plan, which will become effective upon the execution of the underwriting agreement related to this offering; |
| • | 294,010 shares of restricted stock issued pursuant to restricted stock grants subsequent to June 30, 2014, at a purchase price of $8.73 per share; |
| • | 123,785 shares of common stock issuable upon exercise of stock options issued subsequent to June 30, 2014, at a weighted-average exercise price of $8.73 per share; and |
| • | Restricted stock grants to be issued to each of our non-employee directors upon the effectiveness of the registration statement of which this prospectus forms a part, entitling such directors to receive the number of shares of our common stock equal to an aggregate of $0.5 million divided by the initial public offering price per share. |
The foregoing discussion and tables do not reflect potential purchases by certain of our existing stockholders, including John T. McDonald, our Chief Executive Officer and chairman of our board of directors, or entities affiliated with Austin Ventures and ESW Capital, LLC, that have indicated an interest in purchasing common stock with an aggregate purchase price of up to $5.0 million, or up to 10% of the proposed offering size based on an assumed initial public offering price of $13.00 per share, the midpoint of the price range set forth on the cover page of this prospectus, as described in “Related Party Transactions” and “Underwriting.”
-47-
Table of Contents
SELECTED CONSOLIDATED FINANCIAL DATA
The following table summarizes our selected consolidated financial data. We have derived the selected consolidated statements of operations data for the fiscal years ended December 31, 2012 and 2013 and the selected consolidated balance sheet data as of December 31, 2013 from our audited consolidated financial statements included elsewhere in this prospectus. We have derived the summary consolidated statements of operations data for the six months ended June 30, 2013 and 2014 and the summary consolidated balance sheet data as of June 30, 2014 from our unaudited consolidated financial statements included elsewhere in this prospectus. Our historical results are not necessarily indicative of our future results. The following consolidated financial data set forth below should be read together with our consolidated financial statements and related notes and the section titled “Management’s Discussion and Analysis of Financial Condition and Results of Operations,” each contained elsewhere in this prospectus.
| Fiscal Year Ended December 31, |
Six Months Ended June 30, |
|||||||||||||||
| 2012 | 2013 | 2013 | 2014 | |||||||||||||
| (in thousands, except share and per share data) | ||||||||||||||||
| Consolidated Statements of Operations Data: |
||||||||||||||||
| Revenue: |
||||||||||||||||
| Subscription and support |
$ | 18,281 | $ | 30,887 | $ | 14,182 | $ | 23,542 | ||||||||
| Perpetual license |
641 | 2,003 | 488 | 1,097 | ||||||||||||
|
|
|
|
|
|
|
|
|
|||||||||
| Total product revenue |
18,922 | 32,890 | 14,670 | 24,639 | ||||||||||||
|
|
|
|
|
|
|
|
|
|||||||||
| Professional services |
3,841 | 8,303 | 3,997 | 7,185 | ||||||||||||
|
|
|
|
|
|
|
|
|
|||||||||
| Total revenue |
22,763 | 41,193 | 18,667 | 31,824 | ||||||||||||
|
|
|
|
|
|
|
|
|
|||||||||
| Cost of revenue: |
||||||||||||||||
| Subscription and support(1)(2) |
4,189 | 7,787 | 3,271 | 6,604 | ||||||||||||
| Professional services(1) |
3,121 | 5,680 | 2,855 | 4,737 | ||||||||||||
|
|
|
|
|
|
|
|
|
|||||||||
| Total cost of revenue |
7,310 | 13,467 | 6,126 | 11,341 | ||||||||||||
|
|
|
|
|
|
|
|
|
|||||||||
| Gross profit |
15,453 | 27,726 | 12,541 | 20,483 | ||||||||||||
|
|
|
|
|
|
|
|
|
|||||||||
| Operating expenses: |
||||||||||||||||
| Sales and marketing(1) |
6,331 | 10,625 | 4,403 | 7,151 | ||||||||||||
| Research and development(1) |
5,308 | 10,340 | 4,406 | 18,393 | ||||||||||||
| Refundable Canadian tax credits |
(728 | ) | (583 | ) | (296 | ) | (274 | ) | ||||||||
| General and administrative(1) |
4,574 | 6,832 | 2,920 | 5,676 | ||||||||||||
| Depreciation and amortization |
1,812 | 3,670 | 2,247 | 2,121 | ||||||||||||
| Acquisition-related expenses |
1,933 | 1,461 | 528 | 521 | ||||||||||||
|
|
|
|
|
|
|
|
|
|||||||||
| Total operating expenses |
19,230 | 32,345 | 14,208 | 33,588 | ||||||||||||
|
|
|
|
|
|
|
|
|
|||||||||
| Loss from operations |
(3,777 | ) | (4,619 | ) | (1,667 | ) | (13,105 | ) | ||||||||
| Other expense: |
||||||||||||||||
| Interest expense, net |
(528 | ) | (2,797 | ) | (547 | ) | (834 | ) | ||||||||
| Other expense, net |
(65 | ) | (431 | ) | 73 | (368 | ) | |||||||||
|
|
|
|
|
|
|
|
|
|||||||||
| Total other expense |
(593 | ) | (3,228 | ) | (474 | ) | (1,202 | ) | ||||||||
|
|
|
|
|
|
|
|
|
|||||||||
| Loss before provision for income taxes |
(4,370 | ) | (7,847 | ) | (2,141 | ) | (14,307 | ) | ||||||||
| Provision for income taxes |
72 | (708 | ) | (133 | ) | (690 | ) | |||||||||
|
|
|
|
|
|
|
|
|
|||||||||
| Loss from continuing operations |
(4,298 | ) | (8,555 | ) | (2,274 | ) | (14,997 | ) | ||||||||
| Income (loss) from discontinued operations |
1,791 | (642 | ) | (316 | ) | — | ||||||||||
|
|
|
|
|
|
|
|
|
|||||||||
| Net loss |
$ | (2,507 | ) | $ | (9,197 | ) | $ | (2,590 | ) | $ | (14,997 | ) | ||||
|
|
|
|
|
|
|
|
|
|||||||||
| Preferred stock dividends and accretion |
(44 | ) | (98 | ) | (22 | ) | (875 | ) | ||||||||
|
|
|
|
|
|
|
|
|
|||||||||
| Net loss attributable to common shareholders |
$ | (2,551 | ) | $ | (9,295 | ) | $ | (2,612 | ) | $ | (15,872 | ) | ||||
|
|
|
|
|
|
|
|
|
|||||||||
| Net loss per common share(3): |
||||||||||||||||
| Loss from continuing operations per common share, basic and diluted |
$ | (5.78 | ) | $ | (7.23 | ) | $ | (2.16 | ) | $ | (4.92 | ) | ||||
| Income (loss) from discontinued operations per common share, basic and diluted |
$ | 2.39 | $ | (0.54 | ) | $ | (0.30 | ) | $ | — | ||||||
| Net loss per common share, basic and diluted |
$ | (3.39 | ) | $ | (7.77 | ) | $ | (2.46 | ) | $ | (4.92 | ) | ||||
| Weighted-average common shares outstanding, basic and diluted |
751,416 | 1,196,668 | 1,061,906 | 3,225,077 | ||||||||||||
| Pro forma net loss per common share (unaudited), basic and diluted(4) |
$ | (1.55 | ) | $ | (1.49 | ) | ||||||||||
| Pro forma weighted-average common shares outstanding (unaudited), basic and diluted(4) |
5,998,613 | 10,059,553 | ||||||||||||||
|
|
|
|
|
|||||||||||||
-48-
Table of Contents
| (1) | Includes stock-based compensation. |
| (2) | Includes depreciation and amortization of $660,000 and $1,640,000 in fiscal 2012 and 2013, respectively. Includes depreciation and amortization of $717,000 and $1,484,000 for the six months ended June 30, 2013 and 2014, respectively. |
| (3) | See Note 13 to our consolidated financial statements included elsewhere in this prospectus for a discussion and reconciliation of historical and pro forma net loss attributable to common stockholders and weighted- average shares outstanding for historical and pro forma basic and diluted net loss per share calculations. |
| (4) | Pro forma net loss per common share (unaudited) and pro forma weighted-average common shares outstanding (unaudited) gives effect to (i) a 6.099-for-one reverse stock split of our capital stock that occured on October 24, 2014; (ii) the conversion of all of our outstanding shares of preferred stock into 6,834,476 shares of our common stock immediately prior to the closing of this offering; and (iii) the filing of our amended and restated certificate of incorporation. |
| As of June 30, 2014 | ||||||||||||
| Actual | Pro Forma(1) | Pro forma As Adjusted(2)(3) |
||||||||||
| (unaudited) | ||||||||||||
| (in thousands) | ||||||||||||
| Consolidated Balance Sheet Data: |
||||||||||||
| Cash and cash equivalents |
$ | 3,059 | $ | 3,059 | $ | 46,244 | ||||||
| Property and equipment, net |
3,365 | 3,365 | 3,365 | |||||||||
| Intangible assets, net |
32,210 | 32,210 | 32,210 | |||||||||
| Goodwill |
33,580 | 33,580 | 33,580 | |||||||||
| Total assets |
94,326 | 94,326 | 137,511 | |||||||||
| Deferred revenue |
20,060 | 20,060 | 20,060 | |||||||||
| Total liabilities |
64,337 | 64,337 | 64,337 | |||||||||
| Redeemable convertible preferred stock |
51,516 | — | — | |||||||||
| Total stockholders’ deficit |
(21,527 | ) | 29,989 | 73,174 | ||||||||
| (1) | The pro forma column gives effect to (i) a 6.099-for-one reverse stock split of our capital stock that occured on October 24, 2014; (ii) the conversion of all of our outstanding shares of preferred stock into 6,834,476 shares of our common stock immediately prior to the closing of this offering; and (iii) the filing of our amended and restated certificate of incorporation. |
| (2) | The pro forma as adjusted column gives further effect to the sale by us of common stock in this offering at an assumed initial public offering price of $13.00 per share, which is the midpoint of the range reflected on the cover page of this prospectus, after deducting estimated underwriting discounts and commissions and estimated offering expenses payable by us. |
| (3) | Each $1.00 increase (decrease) in the assumed initial public offering price of $13.00 per share would increase (decrease) the amount of pro forma as adjusted cash and cash equivalents, total assets and total stockholders’ deficit by approximately $3.6 million, assuming the number of shares offered by us, as set forth on the cover page of this prospectus, remains the same and after deducting the estimated underwriting discounts and commissions and estimated offering expenses payable by us. Similarly, each increase (decrease) of one million shares in the number of shares of common stock offered by us would increase (decrease) cash and cash equivalents, total assets and total stockholders’ deficit by approximately $12.1 million, assuming the assumed initial public offering price remains the same and after deducting the estimated underwriting discounts and commissions and estimated offering expenses payable by us. |
-49-
Table of Contents
| As of December 31, | As of June 30, | |||||||||||||||
| 2012 | 2013 | 2013 | 2014 | |||||||||||||
| (in thousands, except %) | ||||||||||||||||
| Key Metrics: |
||||||||||||||||
| Annualized recurring revenue value at year-end(1) |
$ | 27,093 | $ | 49,061 | n/a | n/a | ||||||||||
| Annual net dollar retention rate(2) |
n/a | 90 | % | n/a | n/a | |||||||||||
| Adjusted EBITDA (fiscal year ended December 31 and six months ended June 30)(3) |
$ | 720 | $ | 2,650 | $ | 2,074 | $ | 2,608 | ||||||||
| (1) | Annualized recurring revenue value as of December 31 equals the monthly value of our recurring revenue contracts measured as of December 31 multiplied by 12. See “Management’s Discussion and Analysis of Financial Condition and Results of Operations—Key Metrics” for additional discussion of this key metric. |
| (2) | We define annual net dollar retention rate as of December 31 as the aggregate annualized recurring revenue value at December 31 from those customers that were also customers as of December 31 of the prior fiscal year, divided by the aggregate annualized recurring revenue value from all customers as of December 31 of the prior fiscal year. See “Management’s Discussion and Analysis of Financial Condition and Results of Operations—Key Metrics” for additional discussion of this key metric. |
| (3) | We monitor our Adjusted EBITDA to help us evaluate the effectiveness and efficiency of our operations. Adjusted EBITDA is a non-GAAP financial measure. We define Adjusted EBITDA as net loss, calculated in accordance with GAAP, plus discontinued operations, depreciation and amortization expense, interest expense, net, other income (expense), net, provision for income taxes, stock-based compensation expense, and acquisition-related expenses. |
The following table provides a reconciliation of Adjusted EBITDA to net loss, which is the most directly comparable GAAP measure:
| Fiscal Year Ended December 31, |
Six Months Ended June 30, |
|||||||||||||||
| 2012 | 2013 | 2013 | 2014 | |||||||||||||
| (in thousands) | ||||||||||||||||
| Net loss |
$ | (2,507 | ) | $ | (9,197 | ) | $ | (2,590 | ) | $ | (14,997 | ) | ||||
| Discontinued operations |
(1,791 | ) | 642 | 316 | |
— |
| |||||||||
| Depreciation and amortization expense |
2,472 | 5,310 | 2,964 | 3,605 | ||||||||||||
| Interest expense, net |
528 | 2,797 | 547 | 834 | ||||||||||||
| Other expense (income), net |
65 | 431 | (73 | ) | 368 | |||||||||||
| Provision for income taxes |
(72 | ) | 708 | 133 | 690 | |||||||||||
| Stock-based compensation expense |
92 | 498 | 249 | 367 | ||||||||||||
| Acquisition-related expenses |
1,933 | 1,461 | 528 | 521 | ||||||||||||
| Stock-based compensation—related party vendor |
— | — | — | 11,220 | ||||||||||||
|
|
|
|
|
|
|
|
|
|||||||||
| Adjusted EBITDA |
$ | 720 | $ | 2,650 | $ | 2,074 | $ | 2,608 | ||||||||
|
|
|
|
|
|
|
|
|
|||||||||
We believe that Adjusted EBITDA provides useful information to management, investors and others in understanding and evaluating our operating results for the following reasons:
| • | Adjusted EBITDA is widely used by investors and securities analysts to measure a company’s operating performance without regard to items that can vary substantially from company to company depending upon their financing, capital structures and the method by which assets were acquired; |
| • | our management uses Adjusted EBITDA in conjunction with GAAP financial measures for planning purposes, in the preparation of our annual operating budget, as a measure of our operating performance, to assess the effectiveness of our business strategies and to communicate with our board of directors concerning our financial performance because Adjusted EBITDA eliminates the impact of items that we do not consider indicative of our core operating performance; |
-50-
Table of Contents
| • | Adjusted EBITDA provides more consistency and comparability with our past financial performance, facilitates period-to-period comparisons of our operations and also facilitates comparisons with other companies, many of which use similar non-GAAP financial measures to supplement their GAAP results; and |
| • | we anticipate that, after consummating this offering, our investor and analyst presentations will include Adjusted EBITDA as a supplemental measure of our overall operating performance. |
Adjusted EBITDA should not be considered as an alternative to net loss or any other measure of financial performance calculated and presented in accordance with GAAP. The use of Adjusted EBITDA as an analytical tool has limitations such as:
| • | depreciation and amortization are non-cash charges, and the assets being depreciated or amortized will often have to be replaced in the future and Adjusted EBITDA does not reflect cash requirements for such replacements; however, much of the depreciation and amortization currently reflected relates to amortization of acquired intangible assets as a result of business combination purchase accounting adjustments, which will not need to be replaced in the future; |
| • | Adjusted EBITDA may not reflect changes in, or cash requirements for, our working capital needs or contractual commitments; |
| • | Adjusted EBITDA does not reflect the potentially dilutive impact of stock-based compensation; |
| • | Adjusted EBITDA does not reflect interest or tax payments that could reduce cash available for use; and |
| • | other companies, including companies in our industry, might calculate Adjusted EBITDA or similarly titled measures differently, which reduces their usefulness as comparative measures. |
Because of these limitations, you should consider Adjusted EBITDA together with other financial performance measures, including various cash flow metrics, net loss and our other GAAP results.
-51-
Table of Contents
MANAGEMENT’S DISCUSSION AND ANALYSIS OF FINANCIAL CONDITION AND RESULTS OF OPERATIONS
You should read the following discussion and analysis of our financial condition and results of operations together with the consolidated financial statements, the related notes and other financial information included elsewhere in this prospectus. This discussion contains information with respect to our plans and strategy as well as forward-looking statements based upon current expectations that involve risks and uncertainties. You should review the “Risk Factors” section of this prospectus for a discussion of important factors that could cause actual results to differ materially from the results described in or implied by the forward-looking statements contained in the following discussion and analysis. Throughout this management’s discussion and analysis of financial condition and results of operations we may from time to time refer to fiscal years and the reference relates to the fiscal year-end; for example, fiscal 2013 would represent the fiscal year that ended on December 31, 2013. All references herein to the first, second, third and fourth fiscal quarters refer to the three months ended March 31, June 30, September 30 and December 31, respectively.
Upland is a leading provider of cloud-based enterprise work management software. We define enterprise work management software as software applications that enable organizations to plan, manage and execute projects and work. Our software applications help organizations better optimize the allocation and utilization of their people, time and money. We provide a family of cloud-based enterprise work management software applications for the information technology, marketing, finance, professional services and process excellence functions within organizations. Our software applications address a broad range of enterprise work management needs, from strategic planning to task execution.
We provide organizations and their knowledge workers with software applications that better align resources with business objectives and increase visibility, governance, collaboration and responsiveness to changes in the business environment. This results in increased work capacity, higher productivity and better execution. Our applications are easy-to-use, highly scalable and offer real-time collaboration for knowledge workers distributed on a local or global scale. Our applications address enterprise work management challenges in the following categories:
| • | Program and Portfolio Management; |
| • | Project Management and Collaboration; |
| • | Workflow Automation and Enterprise Content Management; |
| • | Professional Services Automation; and |
| • | Financial Management. |
We were founded in 2010 to deliver cloud-based enterprise work management applications to organizations of all sizes. Acquisitions are a primary component of our growth strategy, and we have a proven ability to successfully identify, acquire and integrate complementary businesses to grow our company. We have a dedicated and experienced corporate development team that continually monitors hundreds of companies in order to maintain a robust pipeline of potential acquisition candidates, many of which are smaller scale or address only limited enterprise work management challenges, which often operate outside the scope of some of our larger competitors. We believe that our acquisition experience and strategy gives us a competitive advantage in identifying additional opportunities to expand our family of cloud-based applications to better serve our customers. This strategy also has enabled us to develop a family of applications that addresses a broad range of enterprise work management needs. In addition, we believe our ongoing investment in new applications and the enhancement of our existing applications will allow us to expand our customer base and generate additional revenue from existing customers.
We have achieved significant growth since our inception, substantially all of which has been as a result of our acquisition strategy. For the first six months of 2013 compared to the first six months of 2014, our
-52-
Table of Contents
subscription and support revenue grew from $14.2 million to $23.5 million, representing a 66% period-over-period growth rate, and our total revenue grew from $18.7 million to $31.8 million, representing an 70% period-over-period growth rate. For the first six months of 2014 and 2013, we recorded Adjusted EBITDA of $2.6 million and $2.1 million, respectively. See “Selected Consolidated Financial Data” for additional discussion of Adjusted EBITDA and the reconciliation of Adjusted EBITDA to net loss, the most directly comparable GAAP measure. From fiscal 2012 to fiscal 2013, our subscription and support revenue grew from $18.3 million to $30.9 million, representing a 69% year-over-year growth rate, and our total revenue grew from $22.8 million to $41.2 million, representing an 81% year-over-year growth rate. We recorded Adjusted EBITDA of $0.7 million and $2.7 million in fiscal 2012 and 2013, respectively. For the first six months of 2014 and 2013 and fiscal 2013 and 2012 we recorded net losses of $15.0 million, $2.6 million, $9.2 million and $2.5 million, respectively. We expect to have significant operating expenses in the future to support and grow our business, including expanding the range of integrations between our software and third-party applications and platforms, expanding our direct and indirect sales capabilities, pursuing acquisitions of complementary businesses, investing in our data center infrastructure, research and development and increasing our global presence. Furthermore, we will incur significant expenses as a public company and may encounter unforeseen expenses, complications and other difficulties in growing our business. As a result, we may not be able to achieve or sustain profitability.
Our operating results in a given period can fluctuate based on the mix of subscription and support, perpetual license and professional services revenue. For the first six months of 2014 and in fiscal 2013, our subscription and support revenue accounted for 74% and 76% of our total revenue, respectively. Our customer agreements for program and portfolio management, project management and collaboration, and professional services automation typically are sold on a per-seat basis with terms varying from one to three years, paid in advance. Our customer agreements for workflow automation and enterprise content management and financial management historically have been sold on a volume basis with a one-year term, paid in advance. We generally seek to enter into multi-year contracts with our customers when possible. In each case, our customer agreements provide us with revenue visibility over a number of quarters. We typically negotiate the total number of seats or total minimum contracted volume a customer is entitled to use as part of its subscription, but these seats or minimum contracted volume may not be fully utilized over the term of the agreement. In addition, where customers exceed the minimum contracted volume, additional overage fees are billed in arrears.
Historically, we have sold certain of our applications under perpetual licenses, which also are paid in advance. For the first six months of 2014 and in fiscal 2013, our perpetual license revenue accounted for 3% and 3% of our total revenue, respectively. We expect perpetual license revenue to decrease as a percentage of revenue in the future. The support agreements related to our perpetual licenses are one-year in duration and entitle the customer to support and unspecified upgrades. The revenue related to such support agreements is included as part of our subscription and support revenue.
Professional services revenue consists of fees related to implementation, data extraction, integration and configuration and training on our applications. For the first six months of 2014 and in fiscal 2013, our professional services revenue accounted for 23% and 21%, respectively, of our total revenue. We expect the proportional revenue contribution of product and professional services revenue to remain relatively constant in future periods.
We sell our software applications primarily through a direct sales organization comprised of inside sales and field sales personnel. In addition to our direct sales organization, we have an indirect sales organization, which sells to distributors and value-added resellers. We employ a land-and-expand go-to-market strategy. After we demonstrate the value of an initial application to an organization, our sales and account management teams work to expand the adoption of that initial application across the organization, as well as cross-sell additional applications to address other enterprise work management needs of the organization. Our customer success organization supports our direct sales efforts and our professional services organization by managing the post-sale customer lifecycle.
-53-
Table of Contents
To support continued growth, we intend to pursue acquisitions of complementary technologies, products and businesses to enhance the features and functionalities of our applications, expand our customer base and provide access to new markets and increased benefits of scale. We will prioritize acquisitions within the enterprise functions we currently serve, including information technology, marketing, finance, professional services and process excellence, as well as pursue acquisitions that serve other enterprise functions. Consistent with our growth strategy, we have made six acquisitions since the beginning of 2012.
2012 Acquisitions
PowerSteering. In February 2012, we acquired the business of PowerSteering Software, Inc., or PowerSteering, a provider of cloud-based program and portfolio management software, for $13.0 million. The acquisition of PowerSteering enabled our customers to gain high-level visibility across their organizations and improve top-down governance in management of programs, initiatives, investments and projects.
Tenrox. In February 2012, we acquired the business of Tenrox Inc., or Tenrox, a provider of cloud-based professional services automation software, for $15.3 million. The acquisition of Tenrox provided us with additional access to the professional services market and provided our customers with the ability to more effectively manage their knowledge workers to better track work, expenses and client billing while improving scheduling, utilization and alignment of human capital. In addition, following the Tenrox acquisition, we began selling Timesheet.com, a Tenrox product for professional services automation, as a separate application.
EPM Live. In November 2012, we acquired the business of LMR Solutions, LLC, dba EPM Live, or EPM Live, a provider of cloud-based and perpetual license-based project management and collaboration software, with a combination of cash, seller notes and equity, for total consideration of $7.7 million. The acquisition of EPM Live added a software application focused on improving collaboration and the execution of both projects and unstructured work.
2013 Acquisitions
FileBound. In May 2013, we acquired the businesses of FileBound Solutions, Inc. and Marex Group, Inc., together FileBound, a provider of cloud-based and perpetual license-based workflow automation and enterprise content management software, with a combination of cash, seller notes and equity, for total consideration of $14.7 million. The acquisition of FileBound provided our customers the ability to automate document-based workflows and control access and distribution of their content to boost productivity, encourage collaboration and improve compliance.
ComSci. In November 2013, we acquired the business of ComSci LLC, or ComSci, a provider of cloud-based financial management software, with a combination of cash and equity, for total consideration of $7.6 million, with additional contingent consideration payable if certain performance targets are achieved. The acquisition of ComSci enabled our customers to have visibility into the cost, quality and value of internal services delivered within their organizations.
Clickability. In December 2013, we acquired the business of Clickability, Inc., or Clickability, a cloud-based platform for web content management, for $12.3 million. The acquisition of Clickability provided an enterprise content management software application that is used by enterprise marketers and media companies to create, maintain and deliver websites that shape visitor experiences and empower non-technical staff to create, management, publish, analyze and refine content and social media assets without information technology intervention. For accounting purposes, the acquisition of Clickability was recorded as of December 31, 2013 and, accordingly, the operations of Clickability had no impact on our statement of operations.
Our acquisitions may have a material adverse impact on our results of operations, including a potential material adverse impact on our cost of revenue in the short term, as we seek to integrate our acquired businesses
-54-
Table of Contents
over the following six to 12 months in order to achieve additional operating efficiencies. In addition, as we grow our business, we continue to face many challenges and risks. We might encounter difficulties identifying, acquiring and integrating complementary products, technologies and businesses. Over time, as competition increases we may experience pricing pressure. We also may experience seat downgrades or a reduction in minimum contracted volume that could negatively impact our business. Seat downgrades or reductions in minimum contracted volume could occur for several reasons, including dissatisfaction with our prices or features relative to competitive offerings, reductions in our customers’ spending levels, unused seats or minimum contracted volume or limited adoption by our customers of our applications. Our strategic initiatives will require expenditure of capital and the attention of management, and we may not succeed in executing on our growth plan.
Additionally, while cloud computing and SaaS have begun to transform enterprise work management for many organizations, other organizations, particularly those with legacy on-premise systems, have been slower to adopt cloud-based enterprise work management software applications such as ours. Until such organizations are ready to transition to cloud-based systems, we may face challenges in convincing such organizations to adopt our cloud-based enterprise work management applications or be required to make on-premise systems available instead of our cloud-based systems.
Key Metrics
In addition to the GAAP financial measures described below in “—Components of Operating Results,” we regularly review the following key metrics to evaluate and identify trends in our business, measure our performance, prepare financial projections and make strategic decisions:
| As of December 31, | As of June 30, | |||||||||||||||
| 2012 | 2013 | 2013 | 2014 | |||||||||||||
| (in thousands, except %) | ||||||||||||||||
| Annualized recurring revenue value |
$ | 27,093 | $ | 49,061 | n/a | n/a | ||||||||||
| Annual net dollar retention rate |
n/a | 90 | % | n/a | n/a | |||||||||||
| Adjusted EBITDA (fiscal year ended December 31 and six months ended June 30) |
$ | 720 | $ | 2,650 | $ | 2,074 | $ | 2,608 | ||||||||
Annualized recurring revenue value. Annualized recurring revenue value as of December 31 equals the monthly value of our recurring revenue contracts, determined from our internal customer tracking systems and measured as of December 31, multiplied by 12. For example, the monthly value of our recurring revenue contracts on December 31, 2013 was $4.1 million. As such, our annualized recurring revenue value for fiscal 2013 was $49.1 million. Because our growth strategy involves acquisitions, the timing of which may vary, we believe the presentation of this metric annually at year-end provides the most useful indicator of the growth trend of our business.
Annual net dollar retention rate. We define annual net dollar retention rate as of December 31 as the aggregate annualized recurring revenue value at December 31 from those customers that were also customers as of December 31 of the prior fiscal year, divided by the aggregate annualized recurring revenue value from all customers as of December 31 of the prior fiscal year. We believe that our ability to retain our customers and expand their recurring revenue growth over time will be an indicator of the stability of our revenue base and the long-term value of our customer relationships. We track the annual net dollar retention rate for contracts corresponding to applications that have been part of the Upland family for five quarters or more. Therefore, we do not report an annual net dollar retention rate for fiscal 2012. Our annual net dollar retention rate for fiscal 2013 was 90% and includes contracts corresponding to our program and portfolio management and professional services automation applications, which have been part of the Upland family for five quarters or more.
Adjusted EBITDA. We monitor our Adjusted EBITDA to help us evaluate the effectiveness and efficiency of our operations. Adjusted EBITDA is a non-GAAP financial measure. We define Adjusted EBITDA as net
-55-
Table of Contents
loss, calculated in accordance with GAAP, plus discontinued operations, depreciation and amortization expense, interest expense, net, other income (expense), net, provision for income taxes, stock-based compensation expense, and acquisition-related expenses. See “Selected Consolidated Financial Data” for additional discussion of Adjusted EBITDA and the reconciliation of Adjusted EBITDA to net loss, the most directly comparable GAAP measure.
Components of Operating Results
Revenue
Subscription and support revenue. We derive our subscription revenue from fees paid to us by our customers for use of our cloud-based applications. We recognize the revenue associated with subscription agreements ratably over the term of the agreement, provided all criteria required for revenue recognition have been met. Our subscription agreements are typically one to three years.
Our support revenue consists of maintenance fees associated with our perpetual licenses and hosting fees paid to us by our customers. Typically, when purchasing a perpetual license, a customer also purchases maintenance for which we charge a fee, priced as a percentage of the perpetual license fee. Maintenance agreements include the right to support and unspecified upgrades. We recognize the revenue associated with maintenance ratably over the term of the contract. In limited instances, at the customer’s option, we may host the software purchased by a customer under a perpetual license on systems at our third-party data centers. For hosting, we charge a fee, priced as a percentage of the perpetual license fee, and we recognize the revenue associated with hosting ratably over the associated hosting period. These hosting arrangements are typically for a period of one to three years.
Perpetual license revenue. Perpetual license revenue reflects the revenue recognized from sales of perpetual licenses to new customers and additional perpetual licenses to existing customers. We generally recognize the license fee portion of the arrangement in advance, provided all revenue recognition criteria are satisfied. Our perpetual license agreements are typically one year.
Professional services revenue. Professional services revenue consists of fees related to implementation, data extraction, integration and configuration and training on our applications. We generally recognize the revenue associated with these professional services on a time and materials basis as we deliver the services or provide training to our customers.
Cost of Revenue
Cost of product revenue. Cost of product revenue consists primarily of personnel and related costs of our customer success and operations teams, including salaries, benefits, bonuses, payroll taxes, stock-based compensation and allocated overhead, as well as software license fees, hosting costs, Internet connectivity and depreciation expenses directly related to delivering our applications. We expect that cost of revenues may increase in the future depending on the growth rate of our new customers and billings and our need to support the implementation, hosting and support of those new customers. We intend to continue to invest additional resources in expanding the delivery capability of our applications. As we add data center capacity and support personnel in advance of anticipated growth, our cost of product revenue will increase and if such anticipated revenue growth does not occur, our product gross profit will be adversely affected both in terms of absolute dollars and as a percentage of total revenues in any particular quarterly or annual period. Our cost of product revenue is generally expensed as the costs are incurred.
Cost of professional services revenue. Cost of professional services revenue consists primarily of personnel and related costs, including salaries, benefits, bonuses, payroll taxes, stock-based compensation and allocated overhead, as well as the costs of contracted third-party vendors and reimbursable expenses. As most of our personnel are employed on a full-time basis, our cost of professional services revenue is largely fixed in the
-56-
Table of Contents
short-term, while our professional services revenue may fluctuate, leading to fluctuations in professional services gross profit. We expect that cost of professional services as a percentage of total revenues could fluctuate from period to period depending on the growth of our professional services business, the timing of sales of applications, and any associated costs relating to the delivery of services. Our cost of professional services revenue is generally expensed as costs are incurred.
Operating Expenses
Our operating expenses are classified into six categories: sales and marketing, research and development, refundable Canadian tax credits, general and administrative, depreciation and amortization and acquisition-related expenses. For each category, other than refundable Canadian tax credits and depreciation and amortization, the largest expense component is personnel and related costs, which includes salaries, employee benefit costs, bonuses, commissions, stock-based compensation and payroll taxes. Operating expenses also include allocated overhead costs for facilities, which are allocated to each department based on relative department headcount. Operating expenses are generally recognized as incurred.
Sales and marketing. Sales and marketing expenses primarily consist of personnel and related costs for our sales and marketing staff, including salaries, benefits, commissions, bonuses, payroll taxes, stock-based compensation and allocated overhead, as well as costs of promotional events, corporate communications, online marketing, product marketing and other brand-building activities. We expense sales commissions when the initial customer contract is signed and upon any renewal as our obligation to pay a sales commission arises at these times. We expect that sales and marketing expenses will continue to increase in absolute dollars as a result of our expected growth, and sales and marketing expenses may fluctuate as a percentage of total revenues due to the timing of such expenses, in any particular quarterly or annual period.
Research and development. Research and development expenses primarily consist of personnel and related costs of our research and development staff, including salaries, benefits, bonuses, payroll taxes, stock-based compensation, allocated overhead and costs of certain third-party contractors. Research and development costs related to the development of our software applications are generally recognized as incurred. For example, we are parties to a technology services agreement pursuant to which we generally recognize expenses for services as they are received. See Note 17 of the Notes to Consolidated Financial Statements included elsewhere in this prospectus for more information regarding how expenses under such agreement are recognized. We have devoted our product development efforts primarily to enhancing the functionality, and expanding the capabilities, of our applications. We expect that our research and development expenses will continue to increase in absolute dollars as we increase our research and development headcount to further strengthen and enhance our applications.
Refundable Canadian tax credits. Investment tax credits are accounted for as a reduction of research and development costs. Credits are accrued in the year in which the research and development costs of the capital expenditures are incurred, provided that we are reasonably certain that the credits will be received. The investment tax credit must be examined and approved by the tax authorities, and it is possible that the amounts granted will differ from the amounts recorded.
General and administrative. General and administrative expenses primarily consist of personnel and related costs for our executive, administrative, finance, information technology, legal, accounting and human resource staff, including salaries, benefits, bonuses, payroll taxes, stock-based compensation, allocated overhead, professional fees and other corporate expenses. We have recently incurred, and expect to continue to incur, additional expenses as we grow our operations and prepare to operate as a public company, including higher legal, corporate insurance, accounting and auditing expenses, and the additional costs of enhancing and maintaining our internal control environment through the adoption of new corporate policies. General and administrative expenses may fluctuate as a percentage of revenue, and we expect that general and administrative expenses will continue to increase in absolute dollars as we expand our operations and operate as a public company.
-57-
Table of Contents
Depreciation and amortization. Depreciation and amortization expenses primarily consist of depreciation and amortization of acquired intangible assets as a result of business combination purchase accounting adjustments. The valuation of identifiable intangible assets reflects management’s estimates based on, among other factors, use of established valuation methods. Customer relationships are valued using an income approach, which estimates fair value based on the earnings and cash flow capacity of the subject asset and are amortized over a 10-year period. The value of the trade name intangibles are determined using a relief from royalty method, which estimates fair value based on the value the owner of the asset receives from not having to pay a royalty to use the asset and are amortized over mostly a three-year period. Developed technology is valued using a cost-to-recreate approach and is amortized over a four- to seven-year period.
Acquisition-related expenses. Acquisition-related expenses consist of one-time costs in connection with each of our acquisitions, including legal fees, accounting fees, financing fees, restructuring costs, integration costs and other transactional fees and bonuses. We intend to continue executing our focused strategy of acquisitions to enhance the features and functionality of our applications, expand our customer base and provide access to new markets and increased benefits of scale. We expect acquisition-related expenses to be relatively constant as a percentage of revenue in the near team.
Total Other Expense
Total other expense consists primarily of changes in the estimated fair value of our preferred stock warrant liabilities, amortization of deferred financing costs over the term of the related loan and security agreement and interest expense on outstanding debt, including amortization of debt discount and effect of beneficial conversion features in our convertible promissory notes payable.
Provision for Income Taxes
Because we have not generated domestic net income in any period to date, we have recorded a full valuation allowance against our domestic net deferred tax assets, exclusive of tax deductible goodwill. We have historically not recorded any material provision for federal or state income taxes, other than deferred taxes related to tax deductible goodwill. The balance of the tax provision for fiscal 2012 and 2013, outside of tax deductible goodwill, is related to foreign income taxes, primarily operations of our Canadian subsidiary. Realization of any of our domestic deferred tax assets depends upon future earnings, the timing and amount of which are uncertain. Based on analysis of acquired net operating losses, utilization of our net operating losses will be subject to annual limitations due to the ownership change rules under the Code and similar state provisions. In the event we have subsequent changes in ownership, including as a result of this offering, the availability of net operating losses and research and development credit carryovers could be further limited.
-58-
Table of Contents
Results of Operations
Consolidated Statements of Operations Data
The following tables set forth our results of operations for the periods presented and as a percentage of our total revenue for those periods. The period-to-period comparison of financial results is not necessarily indicative of financial results to be achieved in future periods.
| Fiscal Year Ended December 31, |
Six Months Ended June 30, |
|||||||||||||||
| 2012 | 2013 | 2013 | 2014 | |||||||||||||
| (in thousands, except share and per share data) | ||||||||||||||||
| Consolidated Statements of Operations Data: |
||||||||||||||||
| Revenue: |
||||||||||||||||
| Subscription and support |
$ | 18,281 | $ | 30,887 | $ | 14,182 | 23,542 | |||||||||
| Perpetual license |
641 | 2,003 | 488 | 1,097 | ||||||||||||
|
|
|
|
|
|
|
|
|
|||||||||
| Total product revenue |
18,922 | 32,890 | 14,670 | 24,639 | ||||||||||||
|
|
|
|
|
|
|
|
|
|||||||||
| Professional services |
3,841 | 8,303 | 3,997 | 7,185 | ||||||||||||
|
|
|
|
|
|
|
|
|
|||||||||
| Total revenue |
22,763 | 41,193 | 18,667 | 31,824 | ||||||||||||
|
|
|
|
|
|
|
|
|
|||||||||
| Cost of revenue: |
||||||||||||||||
| Subscription and support(1)(2) |
4,189 | 7,787 | 3,271 | 6,604 | ||||||||||||
| Professional services(1) |
3,121 | 5,680 | 2,855 | 4,737 | ||||||||||||
|
|
|
|
|
|
|
|
|
|||||||||
| Total cost of revenue |
7,310 | 13,467 | 6,126 | 11,341 | ||||||||||||
|
|
|
|
|
|
|
|
|
|||||||||
| Gross profit |
15,453 | 27,726 | 12,541 | 20,483 | ||||||||||||
|
|
|
|
|
|
|
|
|
|||||||||
| Operating expenses: |
||||||||||||||||
| Sales and marketing(1) |
6,331 | 10,625 | 4,403 | 7,151 | ||||||||||||
| Research and development(1) |
5,308 | 10,340 | 4,406 | 18,393 | ||||||||||||
| Refundable Canadian tax credits |
(728 | ) | (583 | ) | (296 | ) | (274 | ) | ||||||||
| General and administrative(1) |
4,574 | 6,832 | 2,920 | 5,676 | ||||||||||||
| Depreciation and amortization |
1,812 | 3,670 | 2,247 | 2,121 | ||||||||||||
| Acquisition-related expenses |
1,933 | 1,461 | 528 | 521 | ||||||||||||
|
|
|
|
|
|
|
|
|
|||||||||
| Total operating expenses |
19,230 | 32,345 | 14,208 | 33,588 | ||||||||||||
|
|
|
|
|
|
|
|
|
|||||||||
| Loss from operations |
(3,777 | ) | (4,619 | ) | (1,667 | ) | (13,105 | ) | ||||||||
| Other expense: |
||||||||||||||||
| Interest expense, net |
(528 | ) | (2,797 | ) | (547 | ) | (834 | ) | ||||||||
| Other income (expense), net |
(65 | ) | (431 | ) | 73 | (368 | ) | |||||||||
|
|
|
|
|
|
|
|
|
|||||||||
| Total other expense |
(593 | ) | (3,228 | ) | (474 | ) | (1,202 | ) | ||||||||
|
|
|
|
|
|
|
|
|
|||||||||
| Loss before provision for income taxes |
(4,370 | ) | (7,847 | ) | (2,141 | ) | (14,307 | ) | ||||||||
| Provision for income taxes |
72 | (708 | ) | (133 | ) | (690 | ) | |||||||||
|
|
|
|
|
|
|
|
|
|||||||||
| Loss from continuing operations |
(4,298 | ) | (8,555 | ) | (2,274 | ) | (14,997 | ) | ||||||||
| Income (loss) from discontinued operations |
1,791 | (642 | ) | (316 | ) | — | ||||||||||
|
|
|
|
|
|
|
|
|
|||||||||
| Net loss |
$ | (2,507 | ) | $ | (9,197 | ) | $ | (2,590 | ) | $ | (14,997 | ) | ||||
|
|
|
|
|
|
|
|
|
|||||||||
| Preferred stock dividends and accretion |
(44 | ) | (98 | ) | (22 | ) | (875 | ) | ||||||||
|
|
|
|
|
|
|
|
|
|||||||||
| Net loss attributable to common shareholders |
$ | (2,551 | ) | $ | (9,295 | ) | $ | (2,612 | ) | $ | (15,872 | ) | ||||
|
|
|
|
|
|
|
|
|
|||||||||
| Net loss per common share(3): |
||||||||||||||||
| Loss from continuing operations per common share, basic and diluted |
$ | (5.78 | ) | $ | (7.23 | ) | $ | (2.16 | ) | $ | (4.92 | ) | ||||
| Income (loss) from discontinued operations per common share, basic and diluted |
$ | 2.39 | $ | (0.54 | ) | $ | (0.30 | ) | $ | — | ||||||
| Net loss per common share, basic and diluted |
$ | (3.39 | ) | $ | (7.77 | ) | $ | (2.46 | ) | $ | (4.92 | ) | ||||
| Weighted-average common shares outstanding, basic and diluted |
751,416 | 1,196,668 | 1,061,906 | 3,225,077 | ||||||||||||
| Pro forma net loss per common share (unaudited), basic and diluted(4) |
$ | (1.55 | ) | $ | (1.49 | ) | ||||||||||
| Pro forma weighted-average common shares outstanding (unaudited), basic and diluted(4) |
5,998,613 | 10,059,553 | ||||||||||||||
|
|
|
|
|
|||||||||||||
| (1) | Includes stock-based compensation. |
| (2) | Includes depreciation and amortization of $660,000 and $1,640,000 in 2012 and 2013, respectively. Includes depreciation and amortization of $717,000 and $1,484,000 for the six months ended June 30, 2013 and 2014, respectively. |
| (3) | See Note 13 to our consolidated financial statements included elsewhere in this prospectus for a discussion and reconciliation of historical and pro forma net loss attributable to common stockholders and weighted average shares outstanding for historical and pro forma basic and diluted net loss per share calculations. |
| (4) | Pro forma net loss per common share (unaudited) and pro forma weighted-average common shares outstanding (unaudited) gives effect to (i) a 6.099-for-one reverse stock split of our capital stock that occured on October 24, 2014; (ii) the conversion of all of our outstanding shares of preferred stock into 6,834,476 shares of our common stock immediately prior to the closing of this offering; and (iii) the filing of our amended and restated certificate of incorporation. |
-59-
Table of Contents
| Fiscal Year Ended December 31, |
Six Months Ended June 30, |
|||||||||||||||
| 2012 | 2013 | 2013 | 2014 | |||||||||||||
| Consolidated Statements of Operations Data: |
||||||||||||||||
| Revenue: |
||||||||||||||||
| Subscription and support |
80 | % | 75 | % | 76 | % | 74 | % | ||||||||
| Perpetual license |
3 | % | 5 | % | 3 | % | 3 | % | ||||||||
|
|
|
|
|
|
|
|
|
|||||||||
| Total product revenue |
83 | % | 80 | % | 79 | % | 77 | % | ||||||||
|
|
|
|
|
|
|
|
|
|||||||||
| Professional services |
17 | % | 20 | % | 21 | % | 23 | % | ||||||||
|
|
|
|
|
|
|
|
|
|||||||||
| Total revenue |
100 | % | 100 | % | 100 | % | 100 | % | ||||||||
|
|
|
|
|
|
|
|
|
|||||||||
| Cost of revenue: |
||||||||||||||||
| Subscription and support(1)(2) |
18 | % | 19 | % | 18 | % | 21 | % | ||||||||
| Professional services(1) |
14 | % | 14 | % | 15 | % | 15 | % | ||||||||
|
|
|
|
|
|
|
|
|
|||||||||
| Total cost of revenue |
32 | % | 33 | % | 33 | % | 36 | % | ||||||||
|
|
|
|
|
|
|
|
|
|||||||||
| Gross profit |
68 | % | 67 | % | 67 | % | 64 | % | ||||||||
|
|
|
|
|
|
|
|
|
|||||||||
| Operating expenses: |
||||||||||||||||
| Sales and marketing(1) |
28 | % | 26 | % | 24 | % | 22 | % | ||||||||
| Research and development(1) |
23 | % | 25 | % | 24 | % | 58 | % | ||||||||
| Refundable Canadian tax credits |
(3 | )% | (1 | )% | (2 | )% | (1 | )% | ||||||||
| General and administrative(1) |
20 | % | 16 | % | 16 | % | 18 | % | ||||||||
| Depreciation and amortization |
9 | % | 9 | % | 12 | % | 7 | % | ||||||||
| Acquisition-related expenses |
8 | % | 3 | % | 3 | % | 2 | % | ||||||||
|
|
|
|
|
|
|
|
|
|||||||||
| Total operating expenses |
85 | % | 78 | % | 77 | % | 106 | % | ||||||||
|
|
|
|
|
|
|
|
|
|||||||||
| Loss from operations |
(17 | )% | (11 | )% | (10 | )% | (42 | )% | ||||||||
| Other expense: |
||||||||||||||||
| Interest expense, net |
(2 | )% | (7 | )% | (3 | )% | (3 | )% | ||||||||
| Other income (expense), net |
— | (1 | )% | — | (1 | )% | ||||||||||
|
|
|
|
|
|
|
|
|
|||||||||
| Total other expense |
(2 | )% | (8 | )% | (3 | )% | (4 | )% | ||||||||
|
|
|
|
|
|
|
|
|
|||||||||
| Loss before provision for income taxes |
(19 | )% | (19 | )% | (13 | )% | (46 | )% | ||||||||
| Provision for income taxes |
— | (2 | )% | (1 | )% | (2 | )% | |||||||||
|
|
|
|
|
|
|
|
|
|||||||||
| Loss from continuing operations |
(19 | )% | (21 | )% | (14 | )% | (48 | )% | ||||||||
| Income (loss) from discontinued operations |
8 | % | (1 | )% | (2 | )% | — | |||||||||
|
|
|
|
|
|
|
|
|
|||||||||
| Net loss |
(11 | )% | (22 | )% | (16 | )% | (48 | )% | ||||||||
|
|
|
|
|
|
|
|
|
|||||||||
| (1) | Includes stock-based compensation. |
| (2) | Includes depreciation and amortization of 3% and 4% in fiscal 2012 and 2013, respectively. Includes depreciation and amortization of 4% and 5% for the six months ended June 30, 2013 and 2014, respectively. |
-60-
Table of Contents
Comparison of Six Months Ended June 30, 2013 and 2014
Revenue
| Six Months Ended June 30, |
% Change | |||||||||||
| 2013 | 2014 | |||||||||||
| (dollars in thousands) | ||||||||||||
| (unaudited) | ||||||||||||
| Revenue: |
||||||||||||
| Subscription and support |
$ | 14,182 | $ | 23,542 | 66 | % | ||||||
| Perpetual license |
488 | 1,097 | 125 | % | ||||||||
|
|
|
|
|
|
|
|||||||
| Total product revenue |
14,670 | 24,639 | 68 | % | ||||||||
| Professional services |
3,997 | 7,185 | 80 | % | ||||||||
|
|
|
|
|
|
|
|||||||
| Total revenue |
$ | 18,667 | $ | 31,824 | 70 | % | ||||||
|
|
|
|
|
|||||||||
| Percentage of revenue: |
||||||||||||
| Subscription and support |
76 | % | 74 | % | ||||||||
| Perpetual license |
3 | % | 3 | % | ||||||||
|
|
|
|
|
|||||||||
| Total product revenue |
79 | % | 77 | % | ||||||||
| Professional services |
21 | % | 23 | % | ||||||||
|
|
|
|
|
|||||||||
| Total revenue |
100 | % | 100 | % | ||||||||
|
|
|
|
|
|||||||||
Total revenue increased by $13.2 million, or 70%, for the six months ended June 30, 2014 compared to the six months ended June 30, 2013. Of the increase in total revenue, $12.5 million was due to total revenues from FileBound, ComSci, and Clickability, over the total revenue for FileBound recognized for the six months ended June 30, 2013. Additionally, subscription and support revenues from our Canada operations were $0.5 million lower during the six months ended June 30, 2014 compared to the six months ended June 30, 2013 due to the change in the foreign currency exchange rate between the Canadian dollar versus the U.S. dollar for those periods.
Subscription and support revenue increased $9.4 million, or 66%, for the six months ended June 30, 2014 compared to the six months ended June 30, 2013. Of the increase in subscription and support revenues, $10.1 million was due to subscription and support revenues from our 2013 acquisitions of FileBound, ComSci, and Clickability, over the subscription and support revenues for FileBound recognized for the six months ended June 30, 2013. Additionally, as noted above, subscription and support revenues from our Canada operations were $0.5 million lower during the six months ended June 30, 2014 compared to the six months ended June 30, 2013 due to the change in the foreign currency exchange rate between the Canadian dollar versus the U.S. dollar for those periods.
Perpetual license revenue increased $0.6 million, or 125%, for the six months ended June 30, 2014 compared to the six months ended June 30, 2013. This increase is primarily attributable to the acquisition of FileBound in May 2013, which contributed $0.3 million in perpetual license revenue for the six months ended June 30, 2014, over the perpetual license revenue for FileBound recognized for the six months ended June 30, 2013.
Professional services revenue increased $3.2 million, or 80%, for the six months ended June 30, 2014 compared to the six months ended June 30, 2013. This increase is primarily attributable to the acquisition of Clickability in December 2013, which contributed $1.8 million in professional services revenue for the six months ended June 30, 2014.
-61-
Table of Contents
Cost of Revenue
| Six Months Ended June 30, |
% Change | |||||||||||
| 2013 | 2014 | |||||||||||
| (dollars in thousands) | ||||||||||||
| (unaudited) | ||||||||||||
| Cost of revenue: |
||||||||||||
| Product(1) |
$ | 3,271 | $ | 6,604 | 102 | % | ||||||
| Professional services |
2,855 | 4,737 | 66 | % | ||||||||
|
|
|
|
|
|||||||||
| Total cost of revenue |
$ | 6,126 | $ | 11,341 | 85 | % | ||||||
|
|
|
|
|
|||||||||
| Gross profit: |
||||||||||||
| Product |
18 | % | 21 | % | ||||||||
| Professional services |
15 | % | 15 | % | ||||||||
| Total gross profit |
67 | % | 64 | % | ||||||||
| (1) | Includes depreciation and amortization expense as follows: |
| Depreciation |
$ | 202 | $ | 576 | ||||
| Amortization |
$ | 515 | $ | 908 |
For the six months ended June 30, 2014, cost of product revenues increased by $3.3 million, or 102%, compared to the six months ended June 30, 2013. This increase was primarily attributable to our 2013 acquisitions of FileBound, ComSci, and Clickability, which contributed $1.2 million in personnel and related costs, and $0.6 million in data center hosting costs, over the same costs recognized for FileBound in the six months ended June 30, 2013.
For the six months ended June 30, 2014, cost of professional services revenues increased by $1.9 million, or 66%, compared to the six months ended June 30, 2013. This increase was primarily attributable to our 2013 acquisitions of FileBound and Clickability, which contributed $1.1 million in personnel and related costs, over the same costs recognized for FileBound in the six months ended June 30, 2013.
Operating Expenses
Sales and Marketing
| Six Months Ended June 30, |
% Change | |||||||||||
| 2013 | 2014 | |||||||||||
| (dollars in thousands) | ||||||||||||
| (unaudited) | ||||||||||||
| Sales and marketing |
$ | 4,403 | $ | 7,151 | 62 | % | ||||||
| Percentage of total revenue |
24 | % | 22 | % | ||||||||
For the six months ended June 30, 2014, sales and marketing expense increased by $2.7 million, or 62%, compared to the six months ended June 30, 2013. This increase was primarily attributable to our 2013 acquisitions of FileBound, ComSci, and Clickability, which contributed $1.0 million in personnel and related costs, and $0.6 million primarily related to trade show and public relations costs, over the same costs recognized for FileBound in the six months ended June 30, 2013.
Research and Development
| Six Months Ended June 30, |
% Change | |||||||||||
| 2013 | 2014 | |||||||||||
| (dollars in thousands) | ||||||||||||
| (unaudited) | ||||||||||||
| Research and development |
$ | 4,406 | $ | 18,393 | 317 | % | ||||||
| Percentage of total revenue |
24 | % | 58 | % | ||||||||
-62-
Table of Contents
For the six months ended June 30, 2014, research and development expense increased by $14.0 million, or 317%, compared to the six months ended June 30, 2013. In January 2014, we issued 1,803,574 shares of common stock in connection with an amendment of a technology services agreement with a related party and took a noncash charge of $11.2 million. Our agreement with the related party is viewed as a fixed purchase commitment contract that obligates us to annual purchase commitments even if we do not take delivery of the contracted services. Since the amended agreement still requires payments for future services that we believe are not discounted from amounts charged to other customers, we believe the fair value of the common stock consideration provided to the related party to amend the agreement does not represent an asset and, accordingly, was expensed immediately. The 2013 acquisitions of FileBound, ComSci, and Clickability contributed $1.7 million in personnel and related costs, and $0.3 million in outsourced product development services, over the same costs recognized for FileBound in the six months ended June 30, 2013.
Refundable Canadian tax credits
| Six Months Ended June 30, |
% Change | |||||||||||
| 2013 | 2014 | |||||||||||
| (dollars in thousands) | ||||||||||||
| (unaudited) | ||||||||||||
| Refundable Canadian tax credits |
$ | (296 | ) | $ | (274 | ) | (7 | )% | ||||
| Percentage of total revenue |
(2 | )% | (1 | )% | ||||||||
For the six months ended June 30, 2014, refundable Canadian tax credits decreased by $0.02 million, or 7%, compared to the six months ended June 30, 2013. The decrease was due to fewer costs incurred by our Canadian subsidiary in 2014 that were eligible for reimbursement pursuant to local Canadian government programs.
General and Administrative
| Six Months Ended June 30, |
% Change | |||||||||||
| 2013 | 2014 | |||||||||||
| (dollars in thousands) | ||||||||||||
| (unaudited) | ||||||||||||
| General and administrative |
$ | 2,920 | $ | 5,676 | 94 | % | ||||||
| Percentage of total revenue |
16 | % | 18 | % | ||||||||
For the six months ended June 30, 2014, general and administrative expense increased by $2.8 million, or 94%, compared to the six months ended June 30, 2013. This increase was primarily attributable to our 2013 acquisitions of FileBound, ComSci, and Clickability. These acquisitions contributed an increase of $0.9 million in personnel and related costs, $0.5 million in rent and office expenses, and $0.07 million in professional services fees, over the same costs recognized for FileBound in the six months ended June 30, 2013. Our organic businesses increased $0.7 million during the same period due to increased legal and other professional services as a result of business complexity and in preparation for operating as a public company, $0.3 million due to increased personnel and related expenses as a result of growth, and $0.2 million due to increases in rent and office related expenses as a result of growth.
Depreciation and Amortization
| Six Months Ended June 30, |
% Change | |||||||||||
| 2013 | 2014 | |||||||||||
| (dollars in thousands) | ||||||||||||
| (unaudited) | ||||||||||||
| Depreciation and amortization |
$ | 2,247 | $ | 2,121 | (6 | )% | ||||||
| Percentage of total revenue |
12 | % | 7 | % | ||||||||
-63-
Table of Contents
For the six months ended June 30, 2014, depreciation and amortization expense decreased by $0.1 million, or 6%, compared to the six months ended June 30, 2013. Depreciation increased $0.3 million primarily due to the increase in equipment used for corporate operations. Amortization expense increased by $0.6 million, primarily due to the acquisitions of FileBound, ComSci, and Clickability, over the same costs recognized for FileBound in the six months ended June 30, 2013. This increase in amortization was offset by the $1.1 million impairment of the PowerSteering trade name, which occurred in the first six months ended June 30, 2013. See Note 4 of the Notes to Consolidated Financial Statements included elsewhere in this prospectus for more information regarding Goodwill and Other Intangible Assets.
Acquisition-related Expenses
| Six Months Ended June 30, |
% Change | |||||||||||
| 2013 | 2014 | |||||||||||
| (dollars in thousands) | ||||||||||||
| (unaudited) | ||||||||||||
| Acquisition-related expenses |
$ | 528 | $ | 521 | (1 | )% | ||||||
| Percentage of total revenue |
3 | % | 2 | % | ||||||||
For the six months ended June 30, 2014, one-time acquisition related expense decreased by $0.01 million, compared to the six months ended June 30, 2013. This increase was primarily attributable to legal fees, accounting fees, financing fees, restructuring costs, integration costs, and other transactional fees and bonuses related to our 2013 acquisitions.
Total Other Expense
| Six Months Ended June 30, |
% Change | |||||||||||
| 2013 | 2014 | |||||||||||
| (dollars in thousands) | ||||||||||||
| (unaudited) | ||||||||||||
| Other expense: |
||||||||||||
| Interest expense |
$ | (547 | ) | $ | (834 | ) | 52 | % | ||||
| Other expense |
73 | (368 | ) | 604 | % | |||||||
|
|
|
|
|
|||||||||
| Total other expense |
(474 | ) | (1,202 | ) | 154 | % | ||||||
| Percentage of total revenue |
(3 | )% | (4 | )% | ||||||||
For the six months ended June 30, 2014, total other expense increased by $0.7 million, compared to the six months ended June 30, 2013. The $0.3 million increase in interest expense for the six months ended June 30, 2014 is primarily the result of an increase in our long-term note balance that was used to finance our 2013 acquisitions. The increase in other expense is primarily the result of an increase of $0.3 million in the fair value of our preferred stock warrant liabilities.
-64-
Table of Contents
Comparison of Fiscal Years Ended December 31, 2012 and 2013
Revenue
| Fiscal Year Ended December 31, | % Change | |||||||||||
| 2012 | 2013 | |||||||||||
| (dollars in thousands) | ||||||||||||
| Revenue: |
||||||||||||
| Subscription and support |
$ | 18,281 | $ | 30,887 | 69 | % | ||||||
| Perpetual license |
641 | 2,003 | 212 | % | ||||||||
|
|
|
|
|
|
|
|||||||
| Total product revenue |
18,922 | 32,890 | 74 | % | ||||||||
| Professional services |
3,841 | 8,303 | 116 | % | ||||||||
|
|
|
|
|
|
|
|||||||
| Total revenue |
$ | 22,763 | $ | 41,193 | 81 | % | ||||||
|
|
|
|
|
|||||||||
| Percentage of revenue: |
||||||||||||
| Subscription and support |
80 | % | 75 | % | ||||||||
| Perpetual license |
3 | % | 5 | % | ||||||||
|
|
|
|
|
|||||||||
| Total product revenue |
83 | % | 80 | % | ||||||||
| Professional services |
17 | % | 20 | % | ||||||||
|
|
|
|
|
|||||||||
| Total revenue |
100 | % | 100 | % | ||||||||
|
|
|
|
|
|||||||||
Subscription and support revenue increased $12.6 million, or 69%, from fiscal 2012 to fiscal 2013. Substantially all of the increase in subscription and support revenue during fiscal 2013 resulted from the acquisitions of FileBound and ComSci in fiscal 2013, as well as the inclusion of the full year of ownership of our 2012 acquisitions.
Perpetual license revenue increased $1.4 million, or 212%, from fiscal 2012 to fiscal 2013. Substantially all of increase in perpetual license revenue resulted from our acquisition of FileBound during fiscal 2013, as well as the inclusion of the full year of ownership of EPM Live, both of which offer perpetual license software products.
Professional services revenue increased $4.5 million, or 116%, from fiscal 2012 to fiscal 2013. Substantially all of the increase resulted from the acquisitions of FileBound and ComSci in fiscal 2013, as well as the inclusion of the full year of ownership of our 2012 acquisitions, all of which provide professional services revenue.
Cost of Revenue
| Fiscal Year Ended December 31, | % Change | |||||||||||
| 2012 | 2013 | |||||||||||
| (dollars in thousands) | ||||||||||||
| Cost of revenue: |
||||||||||||
| Product(1) |
$ | 4,189 | $ | 7,787 | 86 | % | ||||||
| Professional services |
3,121 | 5,680 | 82 | % | ||||||||
|
|
|
|
|
|||||||||
| Total cost of revenue |
$ | 7,310 | $ | 13,467 | 84 | % | ||||||
|
|
|
|
|
|||||||||
| Gross profit: |
||||||||||||
| Product |
18 | % | 19 | % | ||||||||
| Professional services |
14 | % | 14 | % | ||||||||
| Total gross profit |
68 | % | 67 | % | ||||||||
|
(1) Includes depreciation and amortization expense as follows: |
||||||||||||
| Depreciation |
$ | — | $ | 455 | ||||||||
| Amortization |
$ | 660 | $ | 1,185 | ||||||||
-65-
Table of Contents
Cost of product revenue increased $3.6 million, or 86%, from fiscal 2012 to fiscal 2013. This increase was primarily a result of $1.6 million of increased personnel and related costs associated with acquisitions from fiscal 2012 to fiscal 2013.
Cost of professional services revenue increased $2.6 million, or 82%, from fiscal 2012 to fiscal 2013. This increase was primarily a result of $2.5 million of increased personnel and related costs associated with acquisitions from fiscal 2012 to fiscal 2013. This increase resulted primarily from our acquisitions of the 2013 Acquisitions.
Operating Expenses
Sales and Marketing
| Fiscal Year Ended December 31, | % Change | |||||||||||
| 2012 | 2013 | |||||||||||
| (dollars in thousands) | ||||||||||||
| Sales and marketing |
$ | 6,331 | $ | 10,625 | 68 | % | ||||||
| Percentage of total revenue |
28 | % | 26 | % | ||||||||
Sales and marketing expenses increased $4.3 million, or 68%, from fiscal 2012 to fiscal 2013. The increase was primarily due to an increase of $2.6 million in personnel and related costs associated with acquisitions. We also incurred $1.3 million of increased marketing expenses mainly in the form of a new company-branding campaign and marketing events, including our first user conference in the fourth quarter of 2013.
Research and Development
| Fiscal Year Ended December 31, | % Change | |||||||||||
| 2012 | 2013 | |||||||||||
| (dollars in thousands) | ||||||||||||
| Research and development |
$ | 5,308 | $ | 10,340 | 95 | % | ||||||
| Percentage of total revenue |
23 | % | 25 | % | ||||||||
Research and development expenses increased $5.0 million, or 95%, from fiscal 2012 to fiscal 2013. The increase was primarily due to an increase of $1.9 million in personnel and related costs and an increase of $1.0 million in outsourced contractor fees each associated with acquisitions, as well as an increase of $1.1 million in fees pursuant to a third-party technology services agreement. Each of these costs related to enhancing existing applications and adding new functionality to our applications.
Refundable Canadian tax credits
| Fiscal Year Ended December 31, | % Change | |||||||||||
| 2012 | 2013 | |||||||||||
| (dollars in thousands) | ||||||||||||
| Refundable Canadian tax credits |
$ | (728 | ) | $ | (583 | ) | (20 | )% | ||||
| Percentage of total revenue |
(3 | )% | (1 | )% | ||||||||
Refundable Canadian tax credits decreased $0.1 million, or 20%, from fiscal 2012 to fiscal 2013. The decrease was due to fewer costs incurred by our Canadian subsidiary in 2013 that were eligible for reimbursement pursuant to local Canadian government programs.
-66-
Table of Contents
General and Administrative
| Fiscal Year Ended December 31, | % Change | |||||||||||
| 2012 | 2013 | |||||||||||
| (dollars in thousands) | ||||||||||||
| General and administrative |
$ | 4,574 | $ | 6,832 | 49 | % | ||||||
| Percentage of total revenue |
20 | % | 16 | % | ||||||||
General and administrative expenses increased $2.3 million, or 49%, from fiscal 2012 to fiscal 2013. The increase was primarily due to an increase of $2.3 million in personnel and related costs associated with acquisitions.
Depreciation and Amortization
| Fiscal Year Ended December 31, | % Change | |||||||||||
| 2012 | 2013 | |||||||||||
| (dollars in thousands) | ||||||||||||
| Depreciation and amortization |
$ | 1,812 | $ | 3,670 | 103 | % | ||||||
| Percentage of total revenue |
9 | % | 9 | % | ||||||||
Depreciation and amortization expenses increased $1.9 million, or 103%, from fiscal 2012 to fiscal 2013. Substantially all of the increase relates to amortization of acquired intangible assets as a result of business combination purchase accounting adjustments, which includes an impairment charge of $1.1 million relating to a change in useful life from indefinite to definite for a trade name. These assets will not need to be replaced in the future.
Acquisition-related Expenses
| Fiscal Year Ended December 31, | % Change | |||||||||||
| 2012 | 2013 | |||||||||||
| (dollars in thousands) | ||||||||||||
| Acquisition-related expenses |
$ | 1,933 | $ | 1,461 | (24 | %) | ||||||
| Percentage of total revenue |
8 | % | 3 | % | ||||||||
Acquisition-related expenses decreased $0.5 million, or 24%, from fiscal 2012 to fiscal 2013. The decrease was a result of lower legal fees, accounting fees, financing fees, restructuring costs, integration costs, and other transactional fees and bonuses related to our 2013 acquisitions as compared to similar fees and costs for our 2012 acquisitions.
Total Other Expense
| Fiscal Year Ended December 31, | % Change | |||||||||||
| 2012 | 2013 | |||||||||||
| (dollars in thousands) | ||||||||||||
| Other expense: |
||||||||||||
| Interest expense |
$ | (528 | ) | $ | (2,797 | ) | (430 | )% | ||||
| Other expense |
(65 | ) | (431 | ) | (563 | )% | ||||||
|
|
|
|
|
|||||||||
| Total Other expense |
(593 | ) | (3,228 | ) | (444 | )% | ||||||
| Percentage of total revenue |
(2 | )% | (8 | )% | ||||||||
Total other expense increased $2.6 million, or 444%, from fiscal 2012 to fiscal 2013. The increase was due to the fact that fiscal 2013 included changes in the estimated fair value of our preferred stock warrant liabilities, higher amortization of deferred financing costs and debt discount over the term of the related loan and security agreement, higher interest expense on outstanding debt and the effect of a beneficial conversion feature on convertible promissory notes payable.
-67-
Table of Contents
Quarterly Results of Operations
The following table sets forth our unaudited quarterly condensed consolidated statements of operations data for each of the last ten quarters through June 30, 2014. The data has been prepared on the same basis as the unaudited consolidated financial statements and related notes included in this prospectus and you should read the following tables together with such financial statements. The quarterly results of operations include all normal recurring adjustments necessary for a fair presentation of this data. Results of interim periods are not necessarily indicative of results for the entire year and are not necessarily indicative of future results.
| Quarter Ended | ||||||||||||||||||||||||||||||||||||||||
| March 31, 2012 |
June 30, 2012 |
September 30, 2012 |
December 31, 2012 |
March 31, 2013 |
June 30, 2013 |
September 30, 2013 |
December 31, 2013 |
March 31, 2014 |
June 30, 2014 |
|||||||||||||||||||||||||||||||
| (in thousands, unaudited) | ||||||||||||||||||||||||||||||||||||||||
| Consolidated Statements of Operations Data: |
||||||||||||||||||||||||||||||||||||||||
| Revenue: |
||||||||||||||||||||||||||||||||||||||||
| Subscription and support |
$ | 2,418 | $ | 4,434 | $ | 5,372 | $ | 6,057 | $ | 6,810 | $ | 7,372 | $ | 7,731 | $ | 8,974 | $ | 11,737 | $ |
11,805 |
| |||||||||||||||||||
| Perpetual license |
41 | 96 | 43 | 461 | 35 | 453 | 647 | 868 | 440 | 657 | ||||||||||||||||||||||||||||||
|
|
|
|
|
|
|
|
|
|
|
|
|
|
|
|
|
|
|
|
|
|||||||||||||||||||||
| Total product revenue |
2,459 | 4,530 | 5,415 | 6,518 | 6,845 | 7,825 | 8,378 | 9,842 | 12,177 | 12,462 | ||||||||||||||||||||||||||||||
|
|
|
|
|
|
|
|
|
|
|
|
|
|
|
|
|
|
|
|
|
|||||||||||||||||||||
| Professional services |
704 | 833 | 809 | 1,495 | 1,805 | 2,192 | 2,014 | 2,292 | 3,436 | 3,749 | ||||||||||||||||||||||||||||||
|
|
|
|
|
|
|
|
|
|
|
|
|
|
|
|
|
|
|
|
|
|||||||||||||||||||||
| Total revenue |
3,163 | 5,363 | 6,224 | 8,013 | 8,650 | 10,017 | 10,392 | 12,134 | 15,613 | 16,211 | ||||||||||||||||||||||||||||||
|
|
|
|
|
|
|
|
|
|
|
|
|
|
|
|
|
|
|
|
|
|||||||||||||||||||||
| Cost of revenue: |
||||||||||||||||||||||||||||||||||||||||
| Subscription and support(1)(2) |
643 | 1,153 | 1,231 | 1,162 | 1,484 | 1,787 | 2,087 | 2,429 | 3,258 | 3,346 | ||||||||||||||||||||||||||||||
| Professional services(1) |
463 | 851 | 816 | 991 | 1,350 | 1,505 | 1,400 | 1,425 | 2,397 | 2,340 | ||||||||||||||||||||||||||||||
|
|
|
|
|
|
|
|
|
|
|
|
|
|
|
|
|
|
|
|
|
|||||||||||||||||||||
| Total cost of revenue |
1,106 | 2,004 | 2,047 | 2,153 | 2,834 | 3,292 | 3,487 | 3,854 | 5,655 | 5,686 | ||||||||||||||||||||||||||||||
|
|
|
|
|
|
|
|
|
|
|
|
|
|
|
|
|
|
|
|
|
|||||||||||||||||||||
| Gross profit |
2,057 | 3,359 | 4,177 | 5,860 | 5,816 | 6,725 | 6,905 | 8,280 | 9,958 | 10,525 | ||||||||||||||||||||||||||||||
|
|
|
|
|
|
|
|
|
|
|
|
|
|
|
|
|
|
|
|
|
|||||||||||||||||||||
| Operating expenses: |
||||||||||||||||||||||||||||||||||||||||
| Sales and marketing(1) |
1,112 | 1,773 | 1,788 | 1,658 | 1,931 | 2,472 | 2,726 | 3,496 | 3,136 | 4,015 | ||||||||||||||||||||||||||||||
| Research and development(1) |
880 | 1,395 | 1,524 | 1,509 | 2,087 | 2,319 | 2,730 | 3,204 | 14,899 | 3,494 | ||||||||||||||||||||||||||||||
| Refundable Canadian tax credits |
(111 | ) | (204 | ) | (206 | ) | (207 | ) | (149 | ) | (147 | ) | (144 | ) | (143 | ) | (136 | ) | (138 | ) | ||||||||||||||||||||
| General and administrative(1) |
675 | 930 | 972 | 1,997 | 1,315 | 1,605 | 1,662 | 2,250 | 2,623 | 3,053 | ||||||||||||||||||||||||||||||
| Depreciation and amortization |
286 | 481 | 544 | 501 | 562 | 1,685 | 688 | 735 | 1,055 | 1,066 | ||||||||||||||||||||||||||||||
| Acquisition-related expenses |
1,724 | (26 | ) | (5 | ) | 240 | 9 | 519 | 22 | 911 | 290 | 231 | ||||||||||||||||||||||||||||
|
|
|
|
|
|
|
|
|
|
|
|
|
|
|
|
|
|
|
|
|
|||||||||||||||||||||
| Total operating expenses |
4,566 | 4,349 | 4,617 | 5,698 | 5,755 | 8,453 | 7,684 | 10,453 | 21,867 | 11,721 | ||||||||||||||||||||||||||||||
|
|
|
|
|
|
|
|
|
|
|
|
|
|
|
|
|
|
|
|
|
|||||||||||||||||||||
| Income (loss) from operations |
(2,509 | ) | (990 | ) | (440 | ) | 162 | 61 | (1,728 | ) | (779 | ) | (2,173 | ) | (11,909 | ) |
|
(1,196 |
) | |||||||||||||||||||||
| Other expense: |
||||||||||||||||||||||||||||||||||||||||
| Interest expense, net |
(50 | ) | (99 | ) | (118 | ) | (261 | ) | (223 | ) | (324 | ) | (434 | ) | (1,816 | ) | (415 | ) | (419 | ) | ||||||||||||||||||||
| Other expense, net |
104 | (177 | ) | 70 | (62 | ) | (46 | ) | 119 | 49 | (553 | ) | 114 | (482 | ) | |||||||||||||||||||||||||
|
|
|
|
|
|
|
|
|
|
|
|
|
|
|
|
|
|
|
|
|
|||||||||||||||||||||
| Total other expense |
54 | (276 | ) | (48 | ) | (323 | ) | (269 | ) | (205 | ) | (385 | ) | (2,369 | ) | (301 | ) | (901 | ) | |||||||||||||||||||||
|
|
|
|
|
|
|
|
|
|
|
|
|
|
|
|
|
|
|
|
|
|||||||||||||||||||||
-68-
Table of Contents
| Quarter Ended | ||||||||||||||||||||||||||||||||||||||||
| March 31, 2012 |
June 30, 2012 |
September 30, 2012 |
December 31, 2012 |
March 31, 2013 |
June 30, 2013 |
September 30, 2013 |
December 31, 2013 |
March 31, 2014 |
June 30, 2014 |
|||||||||||||||||||||||||||||||
| (in thousands, unaudited) | ||||||||||||||||||||||||||||||||||||||||
| Loss before provision for income taxes |
(2,455 | ) | (1,266 | ) | (488 | ) | (161 | ) | (208 | ) | (1,933 | ) | (1,164 | ) | (4,542 | ) | (12,210 | ) | (2,097 | ) | ||||||||||||||||||||
| Provision for income taxes |
201 | 21 | (222 | ) | 72 | (243 | ) | 110 | (69 | ) | (506 | ) | (410 | ) | (280 | ) | ||||||||||||||||||||||||
|
|
|
|
|
|
|
|
|
|
|
|
|
|
|
|
|
|
|
|
|
|||||||||||||||||||||
| Loss from continuing operations |
(2,254 | ) | (1,245 | ) | (710 | ) | (89 | ) | (451 | ) | (1,823 | ) | (1,233 | ) | (5,048 | ) | (12,620 | ) | |
(2,377 |
) | |||||||||||||||||||
| Income (loss) from discontinued operations |
586 | 187 | 785 | 233 | (139 | ) | (177 | ) | (195 | ) | (131 | ) | — | — | ||||||||||||||||||||||||||
| Net income (loss) |
$ | (1,668 | ) | $ | (1,058 | ) | $ | 75 | $ | 144 | $ | (590 | ) | $ | (2,000 | ) | $ | (1,428 | ) | $ | (5,179 | ) | $ | (12,620 | ) | $ | (2,377 | ) | ||||||||||||
|
|
|
|
|
|
|
|
|
|
|
|
|
|
|
|
|
|
|
|
|
|||||||||||||||||||||
| Preferred stock dividends and accretion |
(11 | ) | (11 | ) | (11 | ) | (11 | ) | (11 | ) | (11 | ) | (11 | ) | (65 | ) | (435 | ) |
|
(440 |
) | |||||||||||||||||||
|
|
|
|
|
|
|
|
|
|
|
|
|
|
|
|
|
|
|
|
|
|||||||||||||||||||||
| Net loss attributable to common shareholders |
$ | (1,679 | ) | $ | (1,069 | ) | $ | 64 | $ | 133 | $ | (601 | ) | $ | (2,011 | ) | $ | (1,439 | ) | $ | (5,244 | ) | $ | (13,055 | ) | $ |
(2,817 |
) | ||||||||||||
|
|
|
|
|
|
|
|
|
|
|
|
|
|
|
|
|
|
|
|
|
|||||||||||||||||||||
| (1) | Includes stock-based compensation. |
| (2) | Includes depreciation and amortization. |
| Quarter Ended | ||||||||||||||||||||||||||||||||||||||||
| Percentage of revenue: |
March 31, 2012 |
June 30, 2012 |
September 30, 2012 |
December 31, 2012 |
March 31, 2013 |
June 30, 2013 |
September 30, 2013 |
December 31, 2013 |
March 31, 2014 |
June 30, 2014 |
||||||||||||||||||||||||||||||
| (in thousands, unaudited) | ||||||||||||||||||||||||||||||||||||||||
| Consolidated Statements of Operations Data: |
||||||||||||||||||||||||||||||||||||||||
| Revenue: |
||||||||||||||||||||||||||||||||||||||||
| Subscription and support |
76 | % | 83 | % | 86 | % | 76 | % | 79 | % | 74 | % | 74 | % | 74 | % | 75 | % | 73 | % | ||||||||||||||||||||
| Perpetual license |
1 | % | 2 | % | 1 | % | 6 | % | — | 5 | % | 6 | % | 7 | % | 3 | % | 4 | % | |||||||||||||||||||||
|
|
|
|
|
|
|
|
|
|
|
|
|
|
|
|
|
|
|
|
|
|||||||||||||||||||||
| Total product revenue |
77 | % | 85 | % | 87 | % | 82 | % | 79 | % | 79 | % | 80 | % | 81 | % | 78 | % | 77 | % | ||||||||||||||||||||
|
|
|
|
|
|
|
|
|
|
|
|
|
|
|
|
|
|
|
|
|
|||||||||||||||||||||
| Professional services |
23 | % | 15 | % | 13 | % | 18 | % | 21 | % | 21 | % | 20 | % | 19 | % | 22 | % | 23 | % | ||||||||||||||||||||
|
|
|
|
|
|
|
|
|
|
|
|
|
|
|
|
|
|
|
|
|
|||||||||||||||||||||
| Total revenue |
100 | % | 100 | % | 100 | % | 100 | % | 100 | % | 100 | % | 100 | % | 100 | % | 100 | % | 100 | % | ||||||||||||||||||||
|
|
|
|
|
|
|
|
|
|
|
|
|
|
|
|
|
|
|
|
|
|||||||||||||||||||||
| Cost of revenue: |
||||||||||||||||||||||||||||||||||||||||
| Subscription and support(1)(2) |
20 | % | 21 | % | 20 | % | 15 | % | 17 | % | 18 | % | 20 | % | 20 | % | 21 | % |
|
21 |
% | |||||||||||||||||||
| Professional services(1) |
15 | % | 16 | % | 13 | % | 12 | % | 16 | % | 15 | % | 13 | % | 12 | % | 15 | % | 14 | % | ||||||||||||||||||||
|
|
|
|
|
|
|
|
|
|
|
|
|
|
|
|
|
|
|
|
|
|||||||||||||||||||||
| Total cost of revenue |
35 | % | 37 | % | 33 | % | 27 | % | 33 | % | 33 | % | 33 | % | 32 | % | 36 | % | 35 | % | ||||||||||||||||||||
|
|
|
|
|
|
|
|
|
|
|
|
|
|
|
|
|
|
|
|
|
|||||||||||||||||||||
| Gross profit |
65 | % | 63 | % | 67 | % | 73 | % | 67 | % | 67 | % | 67 | % | 68 | % | 64 | % | 65 | % | ||||||||||||||||||||
|
|
|
|
|
|
|
|
|
|
|
|
|
|
|
|
|
|
|
|
|
|||||||||||||||||||||
-69-
Table of Contents
| Quarter Ended | ||||||||||||||||||||||||||||||||||||||||
| Percentage of revenue: |
March 31, 2012 |
June 30, 2012 |
September 30, 2012 |
December 31, 2012 |
March 31, 2013 |
June 30, 2013 |
September 30, 2013 |
December 31, 2013 |
March 31, 2014 |
June 30, 2014 |
||||||||||||||||||||||||||||||
| (in thousands, unaudited) | ||||||||||||||||||||||||||||||||||||||||
| Operating expenses: |
||||||||||||||||||||||||||||||||||||||||
| Sales and marketing(1) |
35 | % | 33 | % | 29 | % | 21 | % | 22 | % | 25 | % | 26 | % | 29 | % | 20 | % |
|
25 |
% | |||||||||||||||||||
| Research and development(1) |
28 | % | 26 | % | 24 | % | 19 | % | 24 | % | 23 | % | 26 | % | 26 | % | 95 | % | 22 | % | ||||||||||||||||||||
| Refundable Canadian tax credits |
(4 | )% | (4 | )% | (3 | )% | (3 | )% | (2 | )% | (1 | )% | (1 | )% | (1 | )% | (1 | )% | (1 | )% | ||||||||||||||||||||
| General and administrative(1) |
21 | % | 17 | % | 16 | % | 25 | % | 15 | % | 16 | % | 16 | % | 19 | % | 17 | % | 19 | % | ||||||||||||||||||||
| Depreciation and amortization |
9 | % | 9 | % | 9 | % | 6 | % | 6 | % | 17 | % | 7 | % | 6 | % | 7 | % | 7 | % | ||||||||||||||||||||
| Acquisition-related expenses |
55 | % | — | — | 3 | % | — | 5 | % | — | 8 | % | 2 | % | 1 | % | ||||||||||||||||||||||||
|
|
|
|
|
|
|
|
|
|
|
|
|
|
|
|
|
|
|
|
|
|||||||||||||||||||||
| Total operating expenses |
144 | % | 81 | % | 75 | % | 71 | % | 65 | % | 85 | % | 74 | % | 87 | % | 140 | % | 73 | % | ||||||||||||||||||||
|
|
|
|
|
|
|
|
|
|
|
|
|
|
|
|
|
|
|
|
|
|||||||||||||||||||||
| Loss from operations |
(79 | )% | (18 | )% | (8 | )% | 2 | % | 2 | % | (18 | )% | (7 | )% | (19 | )% | (76 | )% | (8 | )% | ||||||||||||||||||||
| Other expense: |
||||||||||||||||||||||||||||||||||||||||
| Interest expense, net |
(2 | )% | (2 | )% | (2 | )% | (3 | )% | (3 | )% | (3 | )% | (4 | )% | (15 | )% | (3 | )% | (3 | )% | ||||||||||||||||||||
| Other expense, net |
3 | % | (3 | )% | 1 | % | (1 | )% | (1 | )% | 1 | % | — | (5 | )% | 1 | % | (3 | )% | |||||||||||||||||||||
|
|
|
|
|
|
|
|
|
|
|
|
|
|
|
|
|
|
|
|
|
|||||||||||||||||||||
| Total other expense |
1 | % | (5 | )% | (1 | )% | (4 | )% | (4 | )% | (2 | )% | (4 | )% | (20 | )% | (2 | )% | (6 | )% | ||||||||||||||||||||
| Loss before provision for income taxes |
(78 | )% | (23 | )% | (9 | )% | (2 | )% | (2 | )% | (20 | )% | (11 | )% | (39 | )% | (78 | )% | (14 | )% | ||||||||||||||||||||
| Provision for income taxes |
6 | % | — | (4 | )% | 1 | % | (3 | )% | 1 | % | (1 | )% | (4 | )% | (3 | )% | (2 | )% | |||||||||||||||||||||
|
|
|
|
|
|
|
|
|
|
|
|
|
|
|
|
|
|
|
|
|
|||||||||||||||||||||
| Loss from continuing operations |
(72 | )% | (23 | )% | (13 | )% | (1 | )% | (5 | )% | (19 | )% | (12 | )% | (43 | )% | (81 | )% | (16 | )% | ||||||||||||||||||||
| Income (loss) from discontinued operations |
19 | % | 3 | % | 13 | % | 3 | % | (2 | )% | (2 | )% | (2 | )% | (1 | )% | — |
|
— |
| ||||||||||||||||||||
| Net loss |
(53 | )% | (20 | )% | — | 2 | % | (7 | )% | (21 | )% | (14 | )% | (44 | )% | (81 | )% | (16 | )% | |||||||||||||||||||||
|
|
|
|
|
|
|
|
|
|
|
|
|
|
|
|
|
|
|
|
|
|||||||||||||||||||||
| Preferred stock dividends and accretion |
— | — | — | — | — | — | — | (1 | )% | (3 | )% |
|
(3 |
)% | ||||||||||||||||||||||||||
|
|
|
|
|
|
|
|
|
|
|
|
|
|
|
|
|
|
|
|
|
|||||||||||||||||||||
| Net loss attributable to common shareholders |
(53 | )% | (20 | )% | — | 2 | % | (7 | )% | (21 | )% | (14 | )% | (45 | )% | (84 | )% |
|
(19 |
)% | ||||||||||||||||||||
|
|
|
|
|
|
|
|
|
|
|
|
|
|
|
|
|
|
|
|
|
|||||||||||||||||||||
| (1) | Includes stock-based compensation. |
| (2) | Includes depreciation and amortization. |
-70-
Table of Contents
Our revenue increased in each of the quarters presented above as a result of growth in the number of customers using our applications. This growth is due to our acquisitions of PowerSteering and Tenrox in the first fiscal quarter of 2012, EPM Live in the fourth fiscal quarter of 2012, FileBound in the second fiscal quarter of 2013, ComSci and Clickability in the fourth fiscal quarter of 2013.
Cost of product revenue and cost of professional services revenue increased primarily due to increased personnel and related costs associated with acquisitions from fiscal 2012 and fiscal 2013.
Sales and marketing expense increased primarily due to acquisitions from fiscal 2012 to fiscal 2013 as well as increased marketing expenses mainly in the form of a new company-branding campaign and marketing events, including our first user conference in the fourth fiscal quarter of 2013.
Research and development expenses increased primarily due to increased personnel and related costs and outsourced contractor fees each associated with acquisitions from fiscal 2012 to fiscal 2013. In January 2014, we issued 1,803,574 shares of common stock in connection with an amendment of a technology service agreement with a related party and took a noncash charge of $11.2 million. Our agreement with the related party is viewed as a fixed purchase commitment contract that obligates us to annual purchase commitments even if we do not take delivery of the contracted services. Since the amended agreement still requires payments for future services that we believe are not discounted from amounts charged to other customers, we believe the fair value of the common stock consideration provided to the related party to amend the agreement does not represent an asset and, accordingly, was expensed immediately. Each of these costs related to enhancing existing applications and adding new functionality to our applications.
General and administrative expenses increased primarily due to increased personnel and related costs associated with acquisitions from fiscal 2012 to fiscal 2013 as well as additional professional fees in preparation for operating as a public company.
Seasonality
We have historically experienced seasonality in terms of when we enter into customer agreements. We sign a significantly higher percentage of agreements with new customers, and renewal agreements with existing customers, in the fourth quarter of each calendar year as our customers tend to follow budgeting cycles at the end of the calendar year. Our cash flow from operations has historically been higher in the first quarter of each calendar year than in other quarters. This seasonality is reflected to a much lesser extent, and sometimes is not immediately apparent, in our revenue, due to the fact that we defer revenue recognition. In addition, seasonality may be difficult to observe in our financial results during periods in which we acquire businesses as such results typically are most significantly impacted by such acquisitions.
Liquidity and Capital Resources
To date, we have financed our operations primarily through private placements of preferred stock and common stock and cash from operating activities, and to a lesser extent, borrowing under our loan and security agreements and the issuance of seller notes. As of December 31, 2013 and June 30, 2014, we had cash and cash equivalents of $4.7 million and $3.1 million, respectively, and $4.9 million and $8.0 million, respectively, of available borrowings under our loan and security agreements. As of December 31, 2013 and June 30, 2014, we had $23.9 million and $18.9 million, respectively, of borrowings outstanding under our loan and security agreements. As of December 31, 2013 and June 30, 2014, we had a working capital deficit of $11.3 million and $21.8 million, respectively, which included $16.6 million and $18.4 million, respectively, of deferred revenue recorded as a current liability as of December 31, 2013 and June 30, 2014, for succeeding periods. This deferred revenue will be recognized as revenue in accordance with our revenue recognition policy.
-71-
Table of Contents
Cash Flows
The following table summarizes our cash flows for the periods indicated:
| Fiscal Year Ended December 31, | Six Months Ended June 30, | |||||||||||||||
| 2012 | 2013 | 2013 | 2014 | |||||||||||||
| (in thousands) | ||||||||||||||||
| (unaudited) | ||||||||||||||||
| Net cash provided by (used in) operating activities |
$ | 1,604 | $ | (239 | ) | $ | 214 | $ | 297 | |||||||
| Net cash used in investing activities |
(33,312 | ) | (28,565 | ) | (10,402 | ) | (324 | ) | ||||||||
| Net cash provided by (used in) financing activities |
24,255 | 29,564 | 11,424 | (1,623 | ) | |||||||||||
|
|
|
|
|
|
|
|
|
|||||||||
| Effect of exchange rate fluctuations on cash |
— | 51 | $ | (163 | ) | $ | 6 | |||||||||
|
|
|
|
|
|
|
|
|
|||||||||
| Net (decrease) increase in cash and cash equivalents |
$ | (7,453 | ) | $ | 811 | $ | 1,073 | $ | (1,644 | ) | ||||||
|
|
|
|
|
|
|
|
|
|||||||||
| Fiscal Year Ended December 31, | Six Months Ended June 30, |
|||||||||||||||
| 2012 | 2013 | 2013 | 2014 | |||||||||||||
| (in thousands) | ||||||||||||||||
| (unaudited) | ||||||||||||||||
| Cash and cash equivalents |
$ | 3,892 | $ | 4,703 | $ | 4,965 | $ | 3,059 | ||||||||
|
|
|
|
|
|
|
|
|
|||||||||
Cash Flows from Operating Activities
Cash used in operating activities is significantly influenced by the amount of cash we invest in personnel and infrastructure to support the anticipated growth of our business. Our operating assets and liabilities consist primarily of receivables from clients and unbilled professional services, accounts payable and accrued expenses and deferred revenues. The volume of professional services rendered and the related timing of collections on those bookings, as well as payments of our accounts payable and accrued payroll and related benefits affect these account balances.
Our cash provided in operating activities for the first six months of 2014 primarily reflects our net loss of $15.0 million, offset by non-cash expenses that included a $11.2 million charge for the 1,803,574 shares of common stock issued to DevFactory, $3.6 million of depreciation and amortization, $0.5 million of non-cash interest expense, and $0.4 million of non-cash stock compensation expense. Working capital sources of cash included a $3.0 million increase in deferred revenue, a $0.7 million increase in accrued expenses and other liabilities and a $0.4 million increase in accounts payable. These sources of cash were offset by a $3.0 million increase in accounts receivable and a $1.6 million increase in prepaids and other assets.
Our cash used in operating activities for fiscal 2013 primarily reflects our net loss of $9.2 million, offset by non-cash expenses that included $5.6 million of depreciation and amortization, $1.6 million of non-cash interest expense, and $0.5 million of non-cash stock compensation expense. Working capital sources of cash included $2.9 million in collections on accounts receivable and $2.2 million of increases in accrued expenses and other liabilities. These sources of cash were offset by $1.6 million from an increase in prepaids and other, $1.1 million from a decrease in accounts payable, and $1.0 million resulting from a decrease in deferred revenue.
Our cash provided by operating activities for fiscal 2012 primarily reflects our net loss of $2.5 million, offset by $2.8 million of depreciation and amortization. Working capital sources of cash included $5.9 million in deferred revenue and $0.9 million from an increase in accounts payable. These sources of cash were partially offset by a use of $3.5 million from an increase in accounts receivable, $0.8 million from an increase in prepaids and other, and $0.4 million from a decrease in accrued expenses and other liabilities.
-72-
Table of Contents
A substantial source of cash is provided as a result of booking for subscriptions in advance, which is recorded as deferred revenue, and is included on our consolidated balance sheet as a liability. Deferred revenue consists of the unearned portion of booked fees for our software subscriptions and support, which is amortized into revenue in accordance with our revenue recognition policy. We assess our liquidity, in part, through an analysis of new subscriptions booked, expected cash receipts on new and existing subscriptions, and our ongoing operating expense requirements.
Cash Flows from Financing Activities
Our primary financing activities have consisted of capital raised to fund our operations as well as proceeds from debt obligations entered into to finance our operations. For the six months ended June 30, 2014, we used $2.8 million of cash for repayment of debt. For fiscal 2013, cash provided by financing activities consisted primarily of $19.7 million in proceeds from the issuance of preferred stock and $28.0 million in proceeds from debt, offset by $17.5 million for repayment of debt. For fiscal 2012, cash provided by financing activities consisted primarily of $11.3 million in proceeds from the issuance of preferred stock and $17.0 million in proceeds from debt, offset by $3.6 million for repayment of debt.
Cash Flows from Investing Activities
Our primary investing activities have consisted of acquisitions of complementary technologies, products and businesses. As our business grows, we expect our primary investing activities to continue to further expand our family of software applications and infrastructure and support additional personnel. For the six months ended June 30, 2014, we used $0.3 million for the purchases of property and equipment. For fiscal 2013 and 2012, cash used in investing activities consisted of $28.6 million and $33.3 million, respectively, for business combinations, net of cash acquired and $0.3 million and $3 million, respectively, of additional consideration paid to sellers of acquired businesses. In addition, for fiscal 2013 and 2012, we used $0.3 million and $0.3 million, respectively, for the purchases of property and equipment.
We believe that our cash and cash equivalents remaining after this offering and the amount available pursuant to our loan and security agreements will be sufficient to meet our anticipated cash needs for at least the next 12 months. Our future capital requirements will depend on many factors, including our growth rate, the timing and extent of spending to support research and development efforts, the expansion of sales and marketing activities, the introduction of new and enhanced applications and professional service offerings and acquisitions of complementary technologies, products and businesses. In the event that additional financing is required from outside sources, we may be unable to raise the funds on acceptable terms, if at all. If we are unable to raise additional capital when desired, our business, operating results and financial condition could be adversely affected.
Loan and Security Agreements
U.S. Loan Agreement
On March 5, 2012, we entered into a loan and security agreement with Comerica Bank, as amended, the U.S. Loan Agreement. The U.S. Loan Agreement provides to us and certain of our subsidiaries, as co-borrowers, a secured accounts receivable revolving loan facility of up to $5.0 million and a secured term loan facility of up to $19.5 million, for a total loan facility of up to $24.5 million. As of December 31, 2012, we had $7.6 million outstanding as term loans under the U.S. loan agreement. As of December 31, 2013, we had $2.1 million outstanding as revolving loans and $19.1 million as term loans under the U.S. Loan Agreement. As of June 30, 2014, we had $3.6 million outstanding as revolving loans and $17.9 million as term loans under the U.S. Loan Agreement. Loans drawn under the U.S. Loan Agreement may be used for working capital, to finance acquisitions and for general corporate purposes.
Revolving loans and term loans bear interest at a floating rate equal to Comerica Bank’s prime rate plus 1.75%. Interest on the revolving loans and the term loans is due and payable monthly. Revolving loans may be borrowed, repaid and reborrowed until April 11, 2015, when all outstanding revolving loan amounts must be
-73-
Table of Contents
repaid. Term loan advances may be requested until April 11, 2014. From November 1, 2013 to March 1, 2014, an amount equal to 5% of the principal outstanding on all term loan advances on October 2, 2013 is payable in monthly installments during such period. Between April 1, 2014 and March 1, 2015 an amount equal to 15% of the principal outstanding on all term loan advances on April 11, 2014 is payable in monthly installments during such period. From April 1, 2015 to March 1, 2016 an amount equal to 25% of the principal outstanding on all term loan advances on April 11, 2014 is payable in monthly installments during such period. From April 1, 2016 to March 1, 2017, an amount equal to 25% of the principal outstanding on all term loan advances on April 11, 2014 is payable in monthly installments on the first day of each month during such period. From April 1, 2017 to March 1, 2018, an amount equal to 30% of principal outstanding on all term loan advances on April 11, 2014 is payable in monthly installments during such period. All outstanding principal and interest under the term loan facility must be repaid on April 11, 2018. The revolving loan facility and the term loan facility may be prepaid prior to their respective termination dates without penalty or premium. Starting June 1, 2015, we and the other borrowers may be required to begin prepaying certain term loan advances with a percentage of our excess cash flow, if any.
Our obligations and the obligations of the other borrowers under the loan facility are secured by a security interest in substantially all of our assets and the other borrowers’ assets, including intellectual property. Our other and future subsidiaries may also be required to become co-borrowers or guarantors under the loan facility and grant a security interest in their assets in connection therewith.
The U.S. Loan Agreement contains customary affirmative covenants and customary negative covenants limiting our ability and the ability of our subsidiaries to, among other things, dispose of assets, undergo a change in control, merge or consolidate, make acquisitions, incur debt, incur liens, pay dividends, repurchase stock and make investments, in each case subject to certain exceptions. We and the other borrowers must also comply with a minimum cash financial covenant, minimum fixed charge ratio financial covenant, maximum indebtedness to adjusted EBITDA financial covenant, and minimum EBITDA financial covenant.
The U.S. Loan Agreement also contains customary events of default including, among others, payment defaults, breaches of covenants defaults, material adverse change defaults, bankruptcy and insolvency event defaults, cross defaults with certain material indebtedness, judgment defaults, and breaches of representations and warranties defaults. Upon an event of default, Comerica Bank may declare all or a portion of the outstanding obligations payable to be immediately due and payable and exercise other rights and remedies provided for under the loan facility and any related guaranty, including a requirement that any guarantor pay all of the outstanding obligations under its guaranty and a right by Comerica Bank to exercise remedies under any security agreement related to such guaranty. During the existence of an event of default, interest on the obligations could be increased by 5.0%.
Canadian Loan Agreement
On February 10, 2012, Tenrox Inc., a Canadian corporation and our wholly-owned subsidiary or, the Canadian Subsidiary, entered into a loan and security agreement with Comerica Bank, as amended, the Canadian Loan Agreement. The Canadian Loan Agreement provides a secured accounts receivable revolving loan facility of up to $3.0 million and a secured term loan facility of up to $2.5 million, for a total loan facility of up to $5.5 million. As of December 31, 2012, the Canadian Subsidiary had $5.4 million outstanding as term loans under the Canadian Loan Agreement. As of December 31, 2013, the Canadian Subsidiary had $1.0 million outstanding as revolving loans and $1.7 million outstanding as term loans under the Canadian Loan Agreement. As of June 30, 2014, the Canadian Subsidiary had a zero balance on their revolving loans and $1.0 million outstanding as term loans under the Canadian Loan Agreement. Loans drawn under the Canadian Loan Agreement may be used for working capital and for general corporate purposes.
Revolving loans and term loans bear interest at a floating rate equal to Comerica Bank’s prime rate plus 1.75%. Interest on the revolving loans and the term loans is due and payable monthly. Revolving loans may be borrowed, repaid and reborrowed until April 11, 2015, when all outstanding revolving loan amounts must be
-74-
Table of Contents
repaid. Principal on the term loan advance is payable in 24 equal monthly installments beginning on May 1, 2013 and continuing each month until paid in full. All outstanding principal and interest under the term loan facility must be repaid on April 11, 2015. The revolving loan facility and the term loan facility may be prepaid prior to their respective termination dates without penalty or premium.
The Canadian Subsidiary’s obligations under the loan facility are secured by a security interest in substantially all of its assets, including its intellectual property. Additionally, we and certain of our domestic subsidiaries provided guarantees of the loan facility secured by substantially all of our and such subsidiaries’ assets, including intellectual property. Furthermore, our other and future subsidiaries may be required to become co-borrowers or guarantors under the loan facility and grant a security interest in their assets in connection therewith.
The Canadian Loan Agreement and the security agreements contain customary affirmative covenants and customary negative covenants limiting our ability, the Canadian Subsidiary’s ability and the ability of our subsidiaries to, among other things, dispose of assets, undergo a change in control, merge or consolidate, make acquisitions, incur debt, incur liens, pay dividends, repurchase stock and make investments, in each case subject to certain exceptions. The Canadian Subsidiary must also comply with a minimum cash financial covenant, minimum fixed charge ratio financial covenant, maximum indebtedness to adjusted EBITDA financial covenant and minimum EBITDA financial covenant.
The Canadian Loan Agreement and the security agreements also contain customary events of default including, among others, payment defaults, breaches of covenants defaults, material adverse change defaults, bankruptcy and insolvency event defaults, cross defaults with certain material indebtedness, judgment defaults, and breaches of representations and warranties defaults. Upon an event of default, Comerica Bank may declare all or a portion of the Canadian Subsidiary’s outstanding obligations payable to be immediately due and payable and exercise other rights and remedies provided for under the loan facility, including a requirement that any guarantor pay all of the outstanding obligations under its guaranty and a right by Comerica Bank to exercise remedies under any security agreement related to such guaranty. During the existence of an event of default, interest on the obligations could be increased by 5.0%.
Contractual Payment Obligations
The following summarizes our contractual commitments and obligations as of December 31, 2013:
| Payment Due by Period | ||||||||||||||||||||
| Total | Less than 1 Year |
1–3 Years |
3–5 Years |
More than 5 Years |
||||||||||||||||
| (in thousands) | ||||||||||||||||||||
| Operating lease obligations |
$ | 3,046 | $ | 1,095 | $ | 1,612 | $ | 339 | $ | — | ||||||||||
| Capital lease obligations |
1,134 | 446 | 547 | 141 | — | |||||||||||||||
| Loan and security agreements |
28,868 | 5,529 | 16,246 | 7,093 | — | |||||||||||||||
|
|
|
|
|
|
|
|
|
|
|
|||||||||||
| Total |
$ | 33,048 | $ | 7,070 | $ | 18,405 | $ | 7,573 | $ | — | ||||||||||
|
|
|
|
|
|
|
|
|
|
|
|||||||||||
In addition, we have an outstanding purchase commitment in 2014 for software development services pursuant to a technology services agreement in the amount of $2.1 million. For years after 2014, the purchase commitment amount for software development services will be equal to the prior year purchase commitment increased (decreased) by the percentage change in total revenue for the prior year as compared to the preceding year. For example, if 2014 total revenues increase by 10% as compared to 2013 total revenues, then the 2015 purchase commitment would increase by approximately $213,175 from the 2014 purchase commitment amount to $2,344,925. A similar 10% increase in 2015 total revenues as compared to 2014 total revenues would increase the 2016 purchase commitment amount from the 2015 purchase commitment amount of $2,344,925 by approximately $234,493 to $2,579,418. The purchase commitment for 2015 and later years have not been included in the above table as such amounts cannot be reasonably estimated.
-75-
Table of Contents
Off-Balance Sheet Arrangements
During fiscal 2012 and 2013 and the first fiscal quarter of 2014, we did not have any relationships with unconsolidated organizations or financial partnerships, such as structured finance or special-purpose entities, that would have been established for the purpose of facilitating off-balance sheet arrangements or other contractually narrow or limited purposes.
Quantitative and Qualitative Disclosures about Market Risk
We have operations both within the United States and internationally, and we are exposed to market risks in the ordinary course of our business. These risks primarily include interest rate, foreign exchange and inflation risks, as well as risks relating to changes in the general economic conditions in the countries where we conduct business. The statement of operations impact is mitigated by having an offsetting liability in deferred revenue to partially or completely offset against the outstanding receivable if an account should become uncollectible. Our cash balances are kept in customary operating accounts, a portion of which are insured by the Federal Deposit Insurance Corporation, and uninsured money market accounts. The majority of our cash balances in money market accounts are with Comerica Bank, our lender under our loan and security agreements. To date, we have not used derivative instruments to mitigate the impact of our market risk exposures. We also have not used, nor do we intend to use, derivatives for trading or speculative purposes.
Interest Rate Risk
Our exposure to market risk for changes in interest rates primarily relates to our cash equivalents and any variable rate indebtedness.
The primary objective of our investment activities is to preserve principal while maximizing yields without significantly increasing risk. This objective is accomplished currently by making diversified investments, consisting only of money market mutual funds and certificates of deposit.
Any draws under our loan and security agreements bear interest at a variable rate tied to the prime rate. As of December 31, 2013, we had a principal balance of $21.2 million under our U.S. Loan Agreement and $2.7 million under our Canadian Loan Agreement. As of June 30, 2014, we had a principal balance of $21.5 million under our U.S. Loan Agreement and $1.0 million under our Canadian Loan Agreement.
Foreign Currency Exchange Risk
Our results of operations and cash flows are subject to fluctuations due to changes in foreign currency exchange rates. In addition, we incur a portion of our operating expenses in foreign currencies, including Canadian dollars, British pounds and Euros, and in the future as we expand into other foreign countries, we expect to incur operating expenses in other foreign currencies. In addition, our customers are generally invoiced in the currency of the country in which they are located. We are exposed to foreign exchange rate fluctuations as the financial results of our international operations are translated from the local functional currency into U.S. dollars upon consolidation. A decline in the U.S. dollar relative to foreign functional currencies would increase our non-U.S. revenue and improve our operating results. Conversely, if the U.S. dollar strengthens relative to foreign functional currencies, our revenue and operating results would be adversely affected. The effect of a hypothetical 10% change in foreign currency exchange rates applicable to our business would have resulted in a change in revenue of $1.5 million in fiscal 2013. To date, we have not engaged in any hedging strategies. As our international operations grow, we will continue to reassess our approach to manage our risk relating to fluctuations in foreign currency exchange rates.
Inflation
We do not believe that inflation had a material effect on our business, financial condition or results of operations in the last three fiscal years. If our costs were to become subject to significant inflationary pressures,
-76-
Table of Contents
we may not be able to fully offset such higher costs through price increases. Our inability or failure to do so could harm our business, financial condition and results of operations.
Critical Accounting Policies and Estimates
We prepare our consolidated financial statements in accordance with generally accepted accounting principles in the United States. The preparation of consolidated financial statements also requires us to make estimates and assumptions that affect the reported amounts of assets, liabilities, revenue, costs and expenses and related disclosures. We base our estimates on historical experience and on various other assumptions that we believe to be reasonable under the circumstances. Actual results could differ significantly from the estimates made by our management. To the extent that there are differences between our estimates and actual results, our future financial statement presentation, financial condition, results of operations and cash flows will be affected. We believe that the accounting policies discussed below are critical to understanding our historical and future performance, as these policies relate to the more significant areas involving management’s judgments and estimates.
The following critical accounting policies reflect significant judgments and estimates used in the preparation of our consolidated financial statements:
| • | revenue recognition and deferred revenue; |
| • | stock-based compensation; |
| • | income taxes; and |
| • | business combinations and the recoverability of goodwill and long-lived assets. |
Revenue Recognition
We derive revenue from product revenue, consisting of subscription, support, perpetual licenses and professional services revenues. We recognize revenue when all of the following criteria are met: persuasive evidence of an arrangement exists, delivery of the product or services has occurred, no obligations with regard to implementation considered essential to the functionality remain, the fee is fixed or determinable and collectability is probable.
Subscription and Support Revenue
We derive subscription revenue by providing our software-as-a-service solution to customers in which the customer does not have the right to take possession of the software, but can use the software for the contracted term. We account for these arrangements as service contracts. Subscription and support revenue are recognized ratably over the term of the contractual arrangement, typically one to three years. Amounts that have been invoiced and that are due are recorded in deferred revenue or revenue, depending on when the criteria for revenue recognition are met.
We may provide hosting services to customers who purchased a perpetual license. Such hosting services are recognized ratably over the applicable term of the arrangement. These hosting arrangements are typically for a period of one to three years.
Software maintenance agreements provide technical support and the right to unspecified upgrades on an if-and-when-available basis. Revenue from maintenance agreements is recognized ratably over the life of the related agreement, which is typically one year.
Perpetual License Revenue
We also record revenue from the sales of proprietary software products under perpetual licenses. For license agreements in which customer acceptance is a condition to earning the license fees, revenue is not recognized until acceptance occurs. Our products do not require significant customization. Revenue on arrangements with customers who are not the ultimate users (primarily resellers) is not recognized until the product is delivered to
-77-
Table of Contents
the end user. Perpetual licenses are sold along with software maintenance and, sometimes, hosting agreements. When vendor specific objective evidence, or VSOE, of fair value exists for the software maintenance and hosting agreement, the perpetual license is recognized under the residual method whereby the fair value of the undelivered software maintenance and hosting agreement is deferred and the remaining contract value is recognized immediately for the delivered perpetual license. When VSOE of fair value does not exist for either the software maintenance or hosting agreement, the entire contract value is recognized ratably over the underlying software maintenance and/or hosting period.
Professional Services Revenue
Professional services provided with perpetual licenses consist of implementation fees, data extraction, configuration, and training. Our implementation and configuration services do not involve significant customization of the software and are not considered essential to the functionality. Revenues from professional services are recognized as such services are provided when VSOE of fair value exists for such services and all undelivered elements such as software maintenance and/or hosting agreements. VSOE of fair value for services is based upon the price charged when these services are sold separately, and is typically an hourly rate. When VSOE of fair value does not exist for software maintenance and/or hosting agreements, revenues from professional services are recognized ratably over the underlying software maintenance and/or hosting period.
Professional services, when sold with the subscription arrangements, are accounted for separately when these services have value to the customer on a standalone basis and there is objective and reliable evidence of fair value for each deliverable. When accounted for separately, revenues are recognized as the services are rendered for time and material contracts. For those arrangements where the elements do not qualify as a separate unit of accounting, we recognize professional services ratably over the contractual life of the related application subscription arrangement.
Multiple-Element Arrangements
We enter into arrangements with multiple-elements that generally include subscriptions and implementation and other professional services.
For multiple-element arrangements, arrangement consideration is allocated to deliverables based on their relative selling price. In order to treat deliverables in a multiple-element arrangement as separate units of accounting, the elements must have standalone value upon delivery. If the elements have standalone value upon delivery, each element must be accounted for separately. Our subscription services have standalone value as such services are often sold separately. In determining whether implementation and other professional services have standalone value apart from the subscription services, we consider various factors including the availability of the services from other vendors. We have concluded that the implementation services included in multiple-element arrangements have standalone value. As a result, when implementation and other professional services are sold in a multiple-element arrangement, the arrangement consideration is allocated to the identified separate units based on a relative selling price hierarchy. The selling price for a deliverable is based on its VSOE of selling price, if available, third-party evidence of selling price, or TPE, if VSOE is not available or best estimate of selling price, or BESP, if neither VSOE nor TPE is available. We have not established VSOE for our subscription services due to lack of pricing consistency, the introduction of new services and other factors. We have determined that TPE is not a practical alternative due to differences in its service offerings compared to other parties and the availability of relevant third-party pricing information. Accordingly, we use BESP to determine the relative selling price.
We determined BESP by considering its overall pricing objectives and market conditions. Significant pricing practices taken into consideration include our discounting practices, the size and volume of our transactions, customer characteristics, price lists, go-to-market strategy, historical standalone sales and agreement prices. As our go-to-market strategies evolve, we may modify our pricing practices in the future, which could result in changes in relative selling prices, and include both VSOE and BESP.
-78-
Table of Contents
Deferred Revenue
Deferred revenue represents either customer advance payments or billings for which the aforementioned revenue recognition criteria have not yet been met.
Stock-Based Compensation
Stock-based awards are measured at fair value at each grant date. We recognize stock-based compensation expenses ratably over the requisite service period of the option award.
Determination of the Fair Value of Stock-Based Compensation Grants
During the periods presented, we had multiple third-party valuations of our common stock performed in accordance with the guidelines outlined in the American Institute of Certified Public Accountants Practice Aid, Valuation of Privately-Held-Company Equity Securities Issued as Compensation, utilizing estimates and judgments provided by management. The determination of the fair value of stock-based compensation arrangements is affected by a number of variables, including estimates of the fair value of our common stock, expected stock price volatility, risk-free interest rate and the expected life of the award. We value stock options using the Black-Scholes option-pricing model, which was developed for use in estimating the fair value of traded options that are fully transferable and have no vesting restrictions. Black-Scholes and other option valuation models require the input of highly subjective assumptions, including the expected stock price volatility. If we made different assumptions, our stock-based compensation expenses, net loss, and net loss per common share could be significantly different.
The following summarizes the assumptions used for estimating the fair value of stock options granted during the periods indicated:
| Fiscal Year Ended December 31, |
Six Months Ended June 30, |
|||||||||||
| 2012 | 2013 | 2014 | ||||||||||
| (unaudited) | ||||||||||||
| Weighted-average grant date fair value per share |
$ | 0.79 | $ | 0.91 | $ | 3.35 | ||||||
| Expected volatility |
72.5 | % | 53.3 | % | 55.2 | % | ||||||
| Risk-free interest rate |
0.9 | % | 1.6 | % | 1.6 | % | ||||||
| Expected life (in years) |
6.29 | 6.29 | 6.29 | |||||||||
| Dividend yield |
— | — | — | |||||||||
We have assumed no dividend yield because we do not expect to pay dividends in the foreseeable future, which is consistent with our past practice. The risk-free interest rate assumption is based on observed interest rates for U.S. Treasury securities with maturities consistent with the expected life of our stock options. The expected life represents the period of time the stock options are expected to be outstanding and is based on the simplified method. Under the simplified method, the expected life of an option is presumed to be the midpoint between the vesting date and the end of the agreement term. We used the simplified method due to the lack of sufficient historical exercise data to provide a reasonable basis upon which to otherwise estimate the expected life of the stock options. Expected volatility is based on historical volatilities for publicly traded stock of comparable companies over the estimated expected life of the stock options. The list of comparable companies we used to determine expected volatility was consistent with those used to determine the corresponding fair value of our common stock at each grant date.
We based our estimate of pre-vesting forfeitures, or forfeiture rate, on historical forfeiture rates. We apply the estimated forfeiture rate to the total estimated fair value of the awards, as derived from the Black-Scholes model, to compute the stock-based compensation expenses, net of pre-vesting forfeitures, to be recognized in our consolidated statements of operations.
-79-
Table of Contents
Determination of the Fair Value of Common Stock on Grant Dates
Prior to this offering, we have been a private company with no active public market for our common stock. Our board of directors periodically determined for financial reporting purposes the estimated per share fair value of our common stock at various dates using independent third-party valuations.
In conducting the valuations, our board of directors considered all objective and subjective factors that they believed to be relevant for each valuation conducted, including management’s estimate of our business condition, prospects and operating performance at each valuation date. Within the valuations performed by our management, a range of factors, assumptions and methodologies were used. Significant factors considered were:
| • | independent third-party valuations performed contemporaneously or shortly before the grant date, as applicable; |
| • | the fact that we are a privately held technology company and our common stock is illiquid; |
| • | the nature and history of our business; |
| • | our discounted future cash flows, based on our projections of future operating results at the time; |
| • | valuations of comparable public companies; |
| • | the potential impact on common stock of preferential liquidation and redemption rights of our redeemable convertible preferred stock under different valuation scenarios; |
| • | current and forecasted economic conditions, both generally and specific to our industry; |
| • | the estimated likelihood of achieving a liquidity event for shares of our common stock such as an initial public offering, or IPO, or a sale of our company, given prevailing market conditions, or remaining a private company; and |
| • | the state of the initial public offering market for similarly situated privately held technology companies. |
There are significant judgments and estimates inherent in these contemporaneous valuations. These judgments and estimates include assumptions regarding our future operating performance, the timing of an IPO or other liquidity event and the determinations of the appropriate valuation methods. If we made different assumptions, our stock-based compensation expenses, net loss and net loss per common share could be significantly different.
Common Stock Valuation Methodology
We utilize the Probability Weighted Expected Return Method, or PWERM, approach to allocate our equity value to our common shares. The PWERM approach employs various market, income or cost approach calculations depending on the likelihood of an initial public offering, sale or merger. For each of the various scenarios, an equity value is estimated and the rights and preferences of each class and series of stock are considered to allocate the equity value to common shares. The value of our common stock is then multiplied by a discount factor reflecting the calculated discount rate and timing of the event. Lastly, the value of our common stock is multiplied by an estimated probability for each scenario. The probability and timing of each scenario are determined by our board of directors based on discussions with management. We began using PWERM during the quarter ended December 31, 2013 and assessed the probability to each of the initial public offering, sale or merger or stay private scenario at each valuation date.
Prior to the quarter ended December 31, 2013, we used the option-pricing method to allocate our equity value to our common shares. Pursuant to the AICPA Guidelines, the option-pricing method values the common stock by creating a series of call options with exercise prices based on the liquidation preference of the preferred stock. The common stock is modeled as a call option that gives its owner the right but not the obligation to buy the enterprise value at a predetermined exercise price. In the model, the exercise price is based on a comparison
-80-
Table of Contents
with the enterprise value rather than, as in the case of a “regular” call option, a comparison with a per-share stock price. Thus, the common stock is considered to be a call option with a claim in the enterprise at an exercise price equal to the remaining value immediately after the preferred stock is liquidated. The option-pricing method has commonly used the Black-Scholes model to price the call option. The option-pricing method, as applied under the Black-Scholes model, is appropriate to use when the range of possible future outcomes is so difficult to predict that forecasts would be highly speculative. That is, the use of the method under Black-Scholes is generally appropriate in situations in which the enterprise has many choices and options available, and the enterprises value depends on how well it follows an uncharted path through the various possible opportunities and challenges.
The following table summarizes by grant date the number of shares of our common stock subject to issuance under stock options granted from January 1, 2012 through the date of this prospectus, as well as the associated per share exercise price and the final estimated fair value per share of our common stock at the date of grant:
| Grant Dates |
Number of Shares Underlying Options Granted |
Exercise Price per Share |
Estimated Fair Value per Share |
Aggregate Grant Date Fair Value of Options |
Total Exercise Cost |
|||||||||||||||
| October 10, 2012 |
173,844 | $ | 1.22 | $ | 1.22 | $ | 137,916 | $ | 212,090 | |||||||||||
| October 25, 2013 |
191,045 | 1.77 | 1.77 | 174,930 | 338,150 | |||||||||||||||
| March 31, 2014 |
262,196 | 6.23 | 6.23 | 857,725 | 1,633,481 | |||||||||||||||
| April 12, 2014 |
819 | 6.23 | 6.23 | 2,750 | 5,102 | |||||||||||||||
| September 2, 2014 |
123,785 | 8.73 | 8.73 | 573,800 | 1,080,643 | |||||||||||||||
|
|
|
|
|
|||||||||||||||||
| $ | 1,747,121 | $ | 3,269,466 | |||||||||||||||||
|
|
|
|
|
|||||||||||||||||
Our board of directors grants options from time to time. We obtain independent valuation reports to assist our board of directors in determining the exercise price for our stock options. Our board of directors reviews and considers the most current valuation report when determining the exercise price for our stock options. As a result of a lag between the date of grant and the date of a valuation report, our board of directors also considers any intervening changes that may cause an increase or decrease in the per share valuation of our common stock when determining the fair value of our common stock on the date of grant. A discussion of the determination of the fair value of our common stock on our option grant dates from January 1, 2012 through the date of this prospectus is provided below.
On October 10, 2012, the board of directors granted options to purchase 173,844 shares of common stock with an exercise price of $1.22 per share. In estimating the fair value of the common stock to set the exercise price of such options, the board of directors reviewed and considered the aforementioned independent valuation report for the common stock as of February 29, 2012. The report reflected a fair value for the common stock of $1.22 per share. On the date of grant, our board considered this valuation together with a variety of other factors and determined there had not been any intervening changes that would cause an increase or decrease in the fair value of our common stock compared to the fair value reflected in such report.
On October 25, 2013, the board of directors granted options to purchase 191,045 shares of common stock with an exercise price of $1.77 per share. In estimating the fair value of the common stock to set the exercise price of such options, the board of directors reviewed and considered an independent valuation report for the common stock as of May 31, 2013. The report reflected a fair value for the common stock of $1.77 per share. On the date of grant, our board considered this valuation together with a variety of other factors and determined there had not been any intervening changes that would cause an increase or decrease in the fair value of our common stock compared to the fair value reflected in such report.
On March 31, 2014, the board of directors granted options to purchase 262,196 shares of common stock with an exercise price of $6.23 per share. In estimating the fair value of the common stock to set the exercise price of such options, the board of directors reviewed and considered an independent valuation report for the
-81-
Table of Contents
common stock as of December 31, 2013. The report reflected a fair value for the common stock of $6.23 per share. On the date of grant, our board considered this valuation together with a variety of other factors and determined there had not been any intervening changes that would cause an increase or decrease in the fair value of our common stock compared to the fair value reflected in such report.
On April 12, 2014, the board of directors granted an option to purchase 819 shares of common stock with an exercise price of $6.23 per share. In estimating the fair value of the common stock to set the exercise price of such options, the board of directors reviewed and considered an independent valuation report for the common stock as of December 31, 2013. The report reflected a fair value for the common stock of $6.23 per share. On the date of grant, our board considered this valuation together with a variety of other factors and determined there had not been any intervening changes that would cause an increase or decrease in the fair value of our common stock compared to the fair value reflected in such report.
On September 2, 2014, the board of directors granted options to purchase 123,785 shares of common stock with an exercise price of $8.73 per share. In estimating the fair value of the common stock to set the exercise price of such options, the board of directors reviewed and considered an independent valuation report for the common stock as of June 30, 2014. The report reflected a fair value of the common stock of $8.73 per share. On the date of grant, our board considered this valuation together with a variety of other factors and determined there had not been any intervening changes that would cause an increase or decrease in the fair value of our common stock compared to the fair value reflected in such report.
Increase in Value of Common Stock from September 2014 to October 2014
The increase in valuation from our determination of the fair value of our common stock on September 2, 2014 of $8.73 and $13.00, the midpoint of the price range set forth on the cover of this prospectus, is primarily the result of the following factors:
| • | The estimated preliminary IPO price range represents a future price for shares of common stock that, if issued in the IPO, will be immediately freely tradable in a public market, whereas the estimated fair value of the common stock as of the September 2, 2014 grant date represents a contemporaneous estimate of the fair value of shares that were then illiquid, might never become liquid and, even if an IPO were successfully completed, would remain illiquid at least until the expiration of the 180-day lockup period following the IPO. This illiquidity accounts for a substantial difference between the estimated fair value of the common stock as of the September 2, 2014 grant date and the estimated preliminary IPO price range. |
| • | The estimated preliminary IPO price range is based on a single outcome that is not probability weighted – a successful IPO in the near-term – and does not take into account the probability of alternative outcomes that could yield lower valuations, such as an acquisition at differing valuations or that the Company may continue as a private, stand-alone entity. |
| • | The holders of the Company’s preferred stock currently enjoy substantial economic rights and preferences over the holders of its common stock, including (i) liquidation payments in preference to the holders of common stock and (ii) the right to receive dividends prior to any dividends declared or paid on any shares of the common stock. |
| • | The successful completion of an IPO would strengthen the Company’s balance sheet, provide access to public debt and equity markets and provide enhanced operational flexibility. |
| • | The performance of the financial markets in general, and the performance of publicly-traded software-as-a-service companies in particular, have been strong recently. Major market indices are at or near their all-time highs and several technology companies successfully completed initial public offerings since September 2, 2014. Strong markets, and a favorable IPO market, contributed to an increase in the value of the Company’s common stock during the relevant period. |
-82-
Table of Contents
| • | The Company’s consideration of various objective and subjective factors in the previous fair value determination that are applicable to valuations based on private company valuation methodologies, and which were not taken into account in the analysis performed by the lead underwriters in considering the estimated preliminary price range for the Company’s initial public offering. |
Income Taxes
We account for income taxes under the asset and liability method. We record deferred tax assets and liabilities for the future tax consequences attributable to differences between the financial statement carrying amounts of existing assets and liabilities and their respective tax bases, as well as for operating loss and tax credit carryforwards. We measure deferred tax assets and liabilities using enacted tax rates expected to apply to taxable income in the years in which we expect to recover or settle those temporary differences. We recognize the effect of a change in tax rates on deferred tax assets and liabilities in the results of operations in the period that includes the enactment date. We assess the likelihood that deferred tax assets will be realized, and we recognize a valuation allowance if it is more likely than not that some portion of the deferred tax assets will not be realized. This assessment requires judgment as to the likelihood and amounts of future taxable income by tax jurisdiction. To date, we have provided a valuation allowance against our deferred tax assets as we believe the objective and verifiable evidence of our historical pretax net losses outweighs any positive evidence of our forecasted future results. Although we believe that our tax estimates are reasonable, the ultimate tax determination involves significant judgment. We will continue to monitor the positive and negative evidence and will adjust the valuation allowance as sufficient objective positive evidence becomes available. At December 31, 2013, our valuation allowance was $5.5 million.
We account for uncertain tax positions by recognizing the financial statement effects of a tax position only when, based upon technical merits, it is more likely than not that the position will be sustained upon examination. We recognize potential accrued interest and penalties associated with unrecognized tax positions within our global operations in income tax expense.
Business Combinations and the Recoverability of Goodwill and Long-lived Intangible Assets
A significant component of our growth strategy has been to acquire and integrate businesses that complement our existing operations. We account for business combinations using the purchase method of accounting and allocate the purchase price of each acquired business to the tangible and intangible assets acquired and liabilities assumed based upon their estimated fair value at the purchase date. The difference between the purchase price and the fair value of the net assets acquired is recorded as goodwill.
In determining the fair value of assets acquired and liabilities assumed in a business combination, we use recognized valuation methods, including the income approach, market approach and cost approach, and apply present value modeling. Our significant estimates in the income, market or cost approach include identifying business factors such as size, growth, profitability, risk and return on investment and assessing comparable total revenue and operating income multiples in estimating the fair value. We also make certain assumptions specific to the present value modeling valuation techniques which include risk-adjusted discount rates, future commission rates, rates of increase in operating expenses, weighted-average cost of capital, long-term growth rate assumptions and the future effective income tax rates.
Most of the businesses we have acquired did not have a significant amount of tangible assets. As a result, our acquisitions have resulted in the majority of the purchase price being allocated to identifiable intangible assets and goodwill. The long-lived intangible assets we have identified in each acquisition include customer relationships, trade name, and technology-based intangible assets. All of our long-lived intangible assets have a definite life that ranges from three to ten years, which we have determined reflects our best estimate of the pattern in which the economic benefit of the related intangible asset will be utilized. As of December 31, 2013, we had $34.7 million in intangible assets (net of accumulated amortization) and $33.6 million of goodwill.
-83-
Table of Contents
The valuations of our acquired businesses have been performed by valuation specialists under our management’s supervision. We believe that the estimated fair value assigned to the assets acquired and liabilities assumed are based on reasonable assumptions and estimates that marketplace participants would use. However, such assumptions are inherently uncertain and actual results could differ from those estimates. Future changes in our assumptions or the interrelationship of those assumptions may negatively impact future valuations. In future measurements of fair value, adverse changes in discounted cash flow assumptions could result in an impairment of goodwill or intangible assets that would require a non-cash charge to the consolidated statements of operations and may have a material effect on our financial condition and operating results.
We perform our annual impairment testing of goodwill as of October 1 of each year, and whenever events or circumstances indicate that impairment may have occurred. Events or circumstances that could trigger an impairment review include, but are not limited to, a significant adverse change in legal factors or in the business climate, an adverse action or assessment by a regulator, unanticipated competition, a loss of key personnel, significant changes in our use of the acquired assets or the strategy for our overall business, significant negative industry or economic trends, or significant underperformance relative to expected historical or projected future results of operations. For purposes of performing the required impairment test, we derive enterprise fair value utilizing the income approach, whereby current and future estimated discounted cash flows are utilized to calculate an operating value of our company on a controlling interest basis. We then compare the derived fair value with the balance of goodwill. We have determined that we have one reporting unit, and we have made assumptions about total revenue, expenses, and growth rates, based on our forecasts, business plans, economic projections, anticipated future cash flows and marketplace data. The fair value of our single reporting unit exceeded its carrying value, including goodwill, as of the impairment test date of October 1, 2013. As a result, we passed Step 1 of the goodwill impairment analysis and no further evaluation was required. The assumptions used in our evaluation of goodwill as of the valuation date of October 1, 2013 are consistent with the assumptions used in our evaluation of our common stock, as described elsewhere in this prospectus.
Due to the excess of the fair value of our single reporting unit over its carrying value, a 10% decrease to the estimated fair value of the reporting unit would not have had an impact on the conclusion of our goodwill impairment testing for the reporting unit. The income approach, and specifically the discounted cash flow method, requires the use of projections and estimates of revenue, gross profit, expenses, growth rates, income tax rates, cost of capital and other inputs. If our actual results fall significantly below our projections or if our view of future operations were to adversely change, this could negatively impact our key assumptions and possibly result in indicators of or actual impairment of goodwill.
Long-lived assets, including intangible assets, are reviewed for impairment whenever events or changes in circumstances indicate that the carrying amount of the asset may not be recoverable. When such events occur, we compare the carrying amounts of the assets to their undiscounted expected future cash flows. If this comparison indicates that there is impairment, the amount of the impairment is calculated as the difference between the carrying value and fair value. In fiscal 2013, we determined that we would not use the PowerSteering trade name for the name of the consolidated company as originally intended and, accordingly, we changed the useful life of such trade name from indefinite to definite. As a result, we also determined that an impairment of such trade name had occurred in the amount of $1.1 million.
Recent Accounting Pronouncements
In May 2014, the FASB issued FASB ASU No. 2014-09, Revenue from Contracts with Customers (Topic 606), which supersedes the revenue recognition requirements in ASC 605, Revenue Recognition. The core principle of ASU 2014-09 is that an entity should recognize revenue to depict the transfer of promised goods or services to customers in an amount that reflects the consideration to which the entity expects to be entitled in exchange for those goods or services. The guidance provides a five-step process to achieve that core principle. ASU 2014-09 requires disclosures enabling users of financial statements to understand the nature, amount, timing and uncertainty of revenue and cash flows arising from contracts with customers. Additionally, qualitative
-84-
Table of Contents
and quantitative disclosures are required about contracts with customers, significant judgments and changes in judgments, and assets recognized from the costs to obtain or fulfill a contract. ASU 2014-09 is effective for annual reporting periods beginning after December 15, 2016, including interim periods within that reporting period, using one of two retrospective application methods. Early application is not permitted. The Company is currently evaluating the impact of the provisions of ASC 606.
-85-
Table of Contents
Company Overview
Upland is a leading provider of cloud-based enterprise work management software. We define enterprise work management software as software applications that enable organizations to plan, manage and execute projects and work. Our software applications help organizations better optimize the allocation and utilization of their people, time and money. We provide a family of cloud-based enterprise work management software applications for the information technology, marketing, finance, professional services and process excellence functions within organizations. Our software applications address a broad range of enterprise work management needs, from strategic planning to task execution.
The continued growth of an information-based economy driven by technological innovation and globalization is causing a fundamental shift in the way work is done. These changes have given rise to a large and growing group of knowledge workers who operate in dynamic work environments as part of geographically dispersed and virtual teams. McKinsey estimates that, as of May 2013, there were more than 200 million knowledge workers globally. We believe that manual processes and legacy on-premise enterprise systems are insufficient to address the needs of the modern work environment. In order for knowledge workers to be successful, they need to interact with intuitive enterprise work systems in a collaborative way, including real-time access at any time, from anywhere and on any device. Today, legacy processes and systems are being disrupted and replaced by cloud-based enterprise work management software that improves visibility, collaboration and productivity.
In response to these changes, we are helping transform how work gets done by providing organizations and their knowledge workers with software applications that better align resources with business objectives and increase visibility, governance, collaboration and responsiveness to changes in the business environment. This results in increased work capacity, higher productivity and better execution. Our applications are easy-to-use, highly scalable and offer real-time collaboration for knowledge workers distributed on a local or global scale. Our applications address enterprise work challenges in the following categories:
| • | Program and Portfolio Management: Enables customers to gain high-level visibility across their organizations and improve top-down governance and management of programs, initiatives, investments and projects. |
| • | Project Management and Collaboration: Enables customers to improve collaboration and the execution of both projects and unstructured work. |
| • | Workflow Automation and Enterprise Content Management: Enables customers to automate document-based workflows and control access and distribution of their content to boost productivity, encourage collaboration, improve compliance and enhance and influence customer engagement. |
| • | Professional Services Automation: Enables customers to more effectively manage their knowledge workers to better track work, expenses and client billing while improving scheduling, utilization and alignment of human capital. |
| • | Financial Management. Enables customers to have visibility into the cost, quality and value of internal services delivered within their organizations, which helps improve alignment during planning and budgeting processes, and better assess and validate proposed investments and initiatives of a particular line of business. |
We sell our software applications primarily through a direct sales organization comprised of inside sales and field sales personnel. In addition to our direct sales organization, we have an indirect sales organization, which sells to distributors and value-added resellers. We employ a land-and-expand go-to-market strategy. After we demonstrate the value of an initial application to an organization, our sales and account management teams work to expand the adoption of that initial application across the organization, as well as cross-sell additional
-86-
Table of Contents
applications to address other enterprise work management needs of the organization. Our customer success organization supports our direct sales efforts by managing the post-sale customer lifecycle.
Our subscription agreements are typically sold either on a per-seat basis or on a minimum contracted volume basis with overage fees billed in arrears, depending on the application being sold. We service customers ranging from large global corporations and government agencies to small- and medium-sized businesses. As of December 31, 2013, we had more than 1,200 customers with over 200,000 users, excluding users under volume-based contracts, across a broad range of industries, including financial services, retail, technology, manufacturing, education, consumer goods, media, telecommunications, government, food and beverage, healthcare and life sciences.
We have achieved significant growth and scale in a relatively short period of time. Through a series of acquisitions, we have established a diverse family of software applications under the Upland brand, each of which addresses a specific enterprise work management need. Our revenue has grown from $22.8 million in fiscal 2012 to $41.2 million in fiscal 2013 and from $18.7 million in the first six months of 2013 to $31.8 million in the first six months of 2014, representing an 80% and 70% period-over-period growth rate, respectively. See Note 16 of the Notes to Consolidated Financial Statements included elsewhere in this prospectus for more information regarding our revenue as it relates to domestic and foreign operations. We recorded Adjusted EBITDA of $0.7 million, $2.7 million and $2.6 million in fiscal 2012 and 2013 and the first six months of 2014, respectively, and a net loss of $2.5 million, $9.2 million and $15.0 million in fiscal 2012 and 2013 and the first six months of 2014, respectively. See “Selected Consolidated Financial Data” for the definition of Adjusted EBITDA and a reconciliation of Adjusted EBITDA to net loss, the most directly comparable GAAP measure.
Industry Background
A Rapidly Changing Business Environment
The continued growth of an information-based economy driven by technological innovation and globalization is causing a fundamental change in the business environment and the way work is done. To be successful, organizations must be able to quickly adapt to changes in this complex and rapidly evolving environment and optimize the utilization of their people, time and money. These changes have given rise to a large and growing group of knowledge workers who operate in dynamic work settings as part of geographically dispersed and virtual teams. To be successful, these knowledge workers must quickly synthesize, analyze and act on large amounts of information and collaborate effectively at any time, from anywhere and on any device.
Legacy Processes and Systems are Insufficient
Many organizations continue to utilize manual processes and traditional tools, such as paper-based techniques, spreadsheets and email, as well as legacy on-premise enterprise systems, to manage knowledge work. The limitations of these processes and systems include siloed and disparate information, limited visibility and transparency, poor collaboration among teams, lost productivity and misalignment of work efforts and overall business objectives. In addition, legacy on-premise enterprise systems can be expensive and time intensive to implement, inflexible and difficult to use, and costly to upgrade and maintain. Today, legacy processes and systems are being disrupted and replaced by cloud-based enterprise work management software that improves visibility, collaboration and productivity.
The Need for Cloud-Based Enterprise Work Management Software
Enterprise work management software is an emerging category of software applications that enable organizations to effectively plan, manage and execute projects and work in order to maximize work capacity, productivity and profitability. Recently, cloud computing and SaaS have begun to transform enterprise work management with rapid speed-to-value, low total cost of ownership and reduced financial risk. As a result of these benefits, the annual growth rate of the SaaS market is expected to be significantly greater than the
-87-
Table of Contents
worldwide application software market. IDC estimates that the worldwide SaaS applications market will grow at a compound annual growth rate of 19%, from $18 billion in 2012 to $42 billion in 2017, while the worldwide application software market will grow at a compound annual growth rate of 6%, from $168 billion to $225 billion in 2017. We believe the ability of cloud-based software to deliver a flexible, scalable, cost-efficient, easy-to-use and collaborative platform to knowledge workers distributed on a local or global scale will significantly accelerate the adoption of cloud-based enterprise work management software applications.
Cloud-based enterprise work management software applications can increase work capacity, productivity and profitability by reducing manual processes and isolated silos of information, and by enhancing collaboration across organizations. While cloud-based enterprise work management software applications may be adopted on an individual basis, we believe they deliver the greatest value when multiple applications are deployed, as an end-to-end management process for prioritizing, allocating, managing and monitoring resources and work throughout the enterprise. We provide a diverse offering of software applications that address a broad range of enterprise work management needs.
We currently participate in various areas of enterprise work management, including the markets that IDC identifies as worldwide project and portfolio management, worldwide business process management software, worldwide financial performance and strategy management applications, worldwide collaborative applications and worldwide content management software. In aggregate, IDC estimates these markets will exceed $27 billion globally in 2014. Within these markets our family of cloud-based software applications address enterprise work functions in program and portfolio management, project management and collaboration, workflow automation and enterprise content management, professional services automation and financial management. While these markets today are largely served by legacy on-premise enterprise systems, we believe there will continue to be increased market adoption of cloud-based enterprise work management software applications.
The Upland Approach
Our software applications are designed for the way people work today. Unlike legacy solutions, our applications have been developed with the unique requirements of today’s knowledge worker in mind. We enable knowledge workers to interact, collaborate and make business decisions using real-time information from a wide variety of sources, at any time, from anywhere and on any device.
Our award-winning family of cloud-based software applications deliver the functionality required to effectively plan, manage and execute projects and work. Our innovative applications allow our customers to more effectively manage the rapid pace of change and complexity in today’s work environment. Our applications are highly scalable, flexible and secure and provide our customers with a modern and intuitive user experience. Organizations currently use our applications in the following functional areas:
| • | Information Technology. Information technology departments use our applications to manage a variety of information technology activities and resources, such as projects and application portfolios. Our applications help information technology departments ensure they are delivering against the objectives of the business by helping to select and prioritize the right investments, gain greater control of resource demand and allocation, and track and report benefit realization. Our applications enable executives to gain better insight into information technology spending to help prevent cost overruns and understand the nature of consumption. By enabling information technology teams to make more informed decisions with real-time visibility across the complete information technology portfolio, our applications empower information technology departments to shift from a cost center to a more strategic enterprise function. |
| • | Marketing. Marketing teams employ our applications to enhance their overall marketing effectiveness. We offer applications that help customers execute lead generation programs, build their online brand presence, collaborate on the creation and publication of content, and gain increased control over marketing workflows, activities and budgets. Our applications empower marketing organizations to |
-88-
Table of Contents
| more effectively manage the influx of projects, information, processes and systems necessary to meet today’s modern marketing requirements. |
| • | Finance. Finance departments use our applications as a cost allocation tool to assess and validate proposed investments and initiatives of a particular line of business, as well as increase the visibility and governance of capital expenditures and cost-cutting projects and deepen the understanding of actual resource utilization and costs. Our applications help improve collaboration between finance departments and particular lines of business, in addition to streamlining compliance and accounting workflows. |
| • | Professional Services. Professional services organizations, such as consulting or software development firms, employ our applications to streamline service delivery and optimize utilization of billable resources. In addition, service-oriented departments within organizations, such as customer service and support teams, utilize our applications to more effectively budget, plan and track provision of services and improve capacity planning and forecasting. |
| • | Process Excellence. Process excellence, Lean Six Sigma and similar functional groups within organizations use our applications to facilitate critical process improvement efforts. Our applications help provide high-level visibility and tracking of process excellence programs, automate processes and streamline workflows while improving process governance. Process improvement and similar business transformation initiatives continue to be a key driver of corporate performance, especially among large global corporations. |
We believe our applications benefit customers in the following ways:
| • | Do the right work. Our applications enable our customers to more effectively align programs, initiatives, investments and projects with overall business objectives, helping ensure the right work is done at the right time. This alignment drives increased productivity and optimizes the allocation and utilization of people, time and money within organizations. |
| • | Do the work right. Our applications help customers to more effectively manage projects and tasks by enabling real-time visibility, collaboration, structured workflows and access to the right content and information. This provides teams of distributed workers with clarity into priorities and expectations as well as the tools to execute effectively, resulting in increased productivity, transparency, accountability, and the ability to respond rapidly to change. |
| • | Single source of truth. Our applications collect real-time data regarding the planning, management and execution of projects and work processes across teams and business units from disparate sources and integrate such data into a single repository, which we call a “single source of truth.” This enables a more complete view of teams, projects and resources than the siloed information repositories legacy processes and systems typically provide. |
| • | Responsiveness to change. Our applications provide analytics and reporting capabilities that transform disparate data in real-time into actionable intelligence, enabling users to make better informed business decisions. Our applications enable organizations to conduct dynamic and sophisticated “what-if” and scenario analyses that can improve their ability to respond effectively to changing business conditions. |
| • | Easy to implement and use. Customers can easily access our cloud-based applications with an Internet browser. Our applications do not require large up-front software expenditures or significant ongoing infrastructure or information technology support. In addition, we provide a common user interface with a modern look and feel that ensures a consistent user experience across our applications. |
| • | Flexible, scalable and secure. Our applications are highly configurable, which provides us with flexibility to meet the unique business requirements of individual customers. Our applications are also scalable and are able to support large deployments while maintaining required performance levels. We provide tools to help our customers manage the critical elements of application security, including authentication, authorization and regulatory compliance. |
-89-
Table of Contents
Our Competitive Strengths
The following competitive strengths are keys to our success:
| • | Large, attractive customer base. Our customer base is highly diverse and spans a broad array of industries, including financial services, retail, technology, manufacturing, education, consumer goods, media, telecommunications, government, food and beverage, healthcare and life sciences. We service customers of varying size, ranging from large global corporations and government agencies to small- and medium-sized businesses. We have a highly referenceable customer base that we leverage to help us acquire new customers. As of December 31, 2013, we had over 1,200 customers, with no customer accounting for more than 2% of our revenue. |
| • | Diversified family of software applications. We offer a family of software applications that addresses a broad range of enterprise work management needs, from strategic planning to task execution. We believe this benefits our customers as compared to many of our cloud-based competitors who offer only a single point solution for a more limited and discrete work management need. Our applications address the information technology, marketing, finance, professional services and process excellence functions within organizations. |
| • | Recurring revenue model with high visibility. We believe we have a highly attractive operating model due to the recurring nature of our subscription revenue, which results in greater visibility and predictability of future revenue and enhances our ability to effectively manage our business. In addition, the cloud-based nature of our model accommodates significant additional business volume with limited incremental costs, providing us with opportunities to improve our operating margins. |
| • | Proven M&A capability. We have a proven ability to successfully identify, acquire and integrate complementary businesses to grow our company, as evidenced by the six acquisitions we have completed since the beginning of 2012. We have a dedicated and experienced corporate development team that continually monitors hundreds of companies in order to maintain a robust pipeline of potential acquisition candidates. We believe that our acquisition experience and strategy gives us a competitive advantage in identifying additional opportunities to expand our family of software applications to better serve our customers. |
| • | Experienced, proven management team. Our management team has significant operating experience and previously occupied key leadership roles at both private and public companies. In addition, our management’s extensive knowledge of the industry and experience in building businesses organically and through strategic acquisitions has enabled us to quickly establish a leading position within the enterprise work management software market. |
| • | Cloud-based platform. We deliver our software applications and functionality primarily through the cloud, with no hardware or software installation required by our customers. This delivery model allows us to provide reliable, cost-effective applications to our customers, add subscribers with minimal incremental expense and deploy new functionality and upgrades quickly and efficiently. We believe our cloud-based delivery model provides us with a competitive advantage over legacy processes and on-premise systems. |
| • | Commitment to customer success. We have a dedicated customer success organization whose mission is to drive adoption, value realization, retention and loyalty across our customer base. Our focus on enabling our customers’ success is a key reason our annual net dollar retention rate was 90% in fiscal 2013. Our commitment to customer success has enabled us to expand our footprint within organizations and facilitate the ongoing adoption of our enterprise work management software applications. |
-90-
Table of Contents
Our Strategy for Growth
Our objective is to be the world’s leading provider of enterprise work management software. The key elements of our strategy for growth are as follows:
| • | Add new customers. We are expanding our direct sales and marketing capabilities in order to further grow our customer base. We also intend to expand our indirect sales channels through alliances with strategic partners that can leverage our applications with complementary services and technologies they provide. In addition, we continue to expand the range of integrations between our software and third-party applications and platforms, which we believe make our applications more attractive to a broader audience of potential customers. |
| • | Increase sales to existing customers. We believe there is a significant opportunity to expand the adoption of our applications within existing customers, particularly within divisions or departments that have not previously used our applications. We also intend to cross-sell additional applications to our existing customers, as very few of our customers currently use more than one of our applications. In addition, we intend to add new applications to our family of applications that will address additional functions within the enterprise work management spectrum. We believe these initiatives will significantly increase the value of our platform to our customers, further strengthen our competitive position and drive increased adoption of multiple applications by our customers. |
| • | Acquire complementary software businesses. We intend to pursue acquisitions of complementary technologies, products and businesses to enhance the features and functionality of our applications, expand our customer base and provide access to new markets and increased benefits of scale. Our dedicated and experienced corporate development team continually monitors hundreds of companies in order to maintain a robust pipeline of potential acquisition candidates, many of which are smaller scale or address only limited enterprise work management challenges, which often operate outside the scope of some of our larger competitors. We believe that our acquisition experience and strategy gives us a competitive advantage in identifying additional opportunities to expand our family of cloud-based applications to better serve our customers. We will prioritize acquisitions within the enterprise functions we currently serve, including information technology, marketing, finance, professional services and process excellence, as well as pursue acquisitions that serve other enterprise functions. |
| • | Expand globally. We believe there is a significant opportunity to grow sales of our applications globally. In fiscal 2013 and the first six months of 2014, approximately 24% and 19%, respectively, of our revenue was derived from sales outside the United States. We intend to expand our business in Europe and evaluate future opportunities in Asia through the hiring of additional sales personnel, selective acquisitions and entering into strategic partnerships. |
| • | Improve and enhance applications. We will continue to invest in research and development and work closely with our customers to identify and improve new applications, features and functionalities that address customer requirements across the enterprise work management spectrum. We also intend to continue to expand the breadth of our applications with additional analytics, third-party integrations and social and mobile capabilities to meet the evolving needs of today’s knowledge workers. In addition, we will continue to implement our consistent user interface, with its modern look and feel and single sign-on capability, across all of our applications. |
Our Products
We provide a family of cloud-based enterprise work management software applications under the Upland brand. Our applications are easy-to-deploy, highly configurable, scalable, flexible and secure. We provide applications for the information technology, marketing, finance, professional services and process excellence functions within organizations, as described below. These applications are delivered through a cloud infrastructure, with a consistent, modern, and intuitive user interface across all of our applications. We refer to this as the “Upland Experience.” Our cloud infrastructure has been designed to give us the ability to provide for
-91-
Table of Contents
single sign-on capability, responsive capabilities, analytics, and a shared application programming interface for integrating our family of software applications with each other and third-party applications.
Program and Portfolio Management. Our program and portfolio management application is used by our customers to gain high-level visibility across their organizations and improve their top-down governance of programs, initiatives, investments and projects without necessitating the detailed task and resource tracking required by legacy project management systems. Our customers use these capabilities to:
| • | gather, develop and assess ideas and proposed investments; |
| • | prioritize and select projects and investments according to business value and strategic fit; |
| • | more effectively allocate resources in alignment with business objectives; |
| • | respond quickly to change with real-time visibility into status and the ability to evaluate the impact of potential changes; and |
| • | gauge performance against strategic objectives, execution-level indicators and financial metrics. |
Our program and portfolio management application currently is used within the information technology, finance and process excellence functions of organizations.
Project Management and Collaboration. Our project management and collaboration application is used by our customers to improve collaboration and the execution of projects, unstructured work and unscheduled tasks. Our customers use these capabilities to:
| • | plan and schedule projects and work in order to improve resource utilization; |
| • | gain real-time visibility into work status, issues and risks; |
| • | track costs associated with projects and work; |
| • | increase the quality and speed of execution with customizable templates and workflows; and |
| • | empower collaboration by providing shared online workspaces in which team members can collaborate in a social manner. |
Our project management and collaboration application currently is used within the information technology, marketing and professional services functions of organizations.
Workflow Automation and Enterprise Content Management. Our workflow automation and enterprise content management applications are used by our customers to automate document-based workflows by capturing, storing and routing content, assigning work tasks and creating audit trails for operations such as healthcare records, loan processing, human resource processes and accounts receivable and payable processing. Additionally, our workflow automation and enterprise content management applications are used by enterprise marketers and media companies to create, maintain and deliver websites that enhance and influence customer engagement. These applications empower non-technical staff to create, manage, publish, analyze and refine content and social media assets without information technology intervention. Our customers use these capabilities to:
| • | empower collaboration by providing a way for employees to access, share and update content from anywhere; |
| • | streamline workflows by creating custom rules to process and route content for approval; |
| • | automatically capture, index, classify and organize enterprise content in a secure, central repository with document retention policies to meet business and compliance requirements; |
| • | apply and enforce document retention policies to meet business and compliance requirements; |
-92-
Table of Contents
| • | streamline the process for creating and managing website content; |
| • | integrate user-generated content, such as polls, surveys, blogs, ratings and comments, into their websites; and |
| • | deliver more relevant, personalized content to website visitors based on the tracking of individual visitor behavior. |
Our workflow automation and enterprise content management applications are currently used within the information technology, finance, marketing and process excellence functions of organizations.
Professional Services Automation. Our professional services automation applications are used by customers to more effectively manage their project and service-based knowledge workers to better manage employee-related expenses and client billing while improving scheduling, utilization and alignment of human capital. Our customers use these capabilities to:
| • | create resource capacity plans; |
| • | align available skills, expertise and capacity with project requirements; |
| • | more efficiently plan and schedule projects; |
| • | track resource and expense allocation for specific projects, activity types or budget categories; |
| • | analyze workforce performance; |
| • | streamline timesheet review, approval and reporting processes; |
| • | manage time, travel and entertainment expenses; and |
| • | streamline project cost reporting, billing and revenue recognition processes. |
Our professional services automation applications currently are used within the information technology, marketing, finance, and professional services functions of organizations.
Financial Management. Our financial management application is used by our customers to gain visibility into the cost, quality and value of services the information technology and finance functions deliver to organizations. This increased transparency helps our customers improve alignment during planning and budgeting processes, and validate proposed investments and initiatives of a particular line of business. Our customers use these capabilities to:
| • | quantify and understand the total cost of ownership of information technology applications and services; |
| • | establish product and unit-costing metrics for benchmarking and/or chargeback; |
| • | provide information technology and finance departments with the ability to chargeback business units for applications and services, including cloud services, based on metered consumption; |
| • | provide business managers with insights into their consumption of information technology services to better utilize information technology services with business goals and objectives; |
| • | leverage utilization and capacity metrics for “what-if” analysis and modeling; |
| • | analyze fixed versus variable information technology-related costs to identify opportunities for savings; and |
| • | support demand-based budgeting and forecasting processes. |
Our financial management application currently is used within the information technology and finance functions of organizations.
-93-
Table of Contents
Customers
As of December 31, 2013, we had more than 1,200 customers with over 200,000 users, excluding users under volume-based contracts. Our customers operate in a wide variety of industries, including financial services, retail, technology, manufacturing, education, consumer goods, media, and telecommunications, government, food and beverage, healthcare and life sciences, chemicals and travel and hospitality. No customer represented more than 3% of our revenue as of June 30, 2014. Our customers include:
| Air Products and Chemicals, Inc. | Datacom Investments Pty Ltd |
Memorial Sloan Kettering | ||
| Allstream Inc. | Eaton Corporation |
Cancer Center | ||
| Autodesk Inc. | Gray Television Group, Inc. |
NYSE Group, Inc. | ||
| HJ Baker & Bro, Inc. | Havi Global Solutions, LLC |
PC Connection, Inc. | ||
| Bazaarvoice Inc. | JDA Inc. |
ProQuest LLC | ||
| Broadridge Financial Solutions, Inc. | Johnson Controls, Inc. |
Riverbed Technology, Inc. | ||
| CEVA Logistics Head Office BV | Lloyd’s Register Group Limited |
RSA Security LLC | ||
| Coca-Cola Hellenic |
Mariah Media, Network LLC |
Save the Children UK | ||
| Columbus McKinnon Corporation | McGraw Hill Financial, Inc. |
Swiss Reinsurance Company Ltd. |
Sales and Marketing
Sales
We sell our software applications primarily through a direct sales organization comprised of inside sales and field sales personnel. We employ a land-and-expand go-to-market strategy. After we demonstrate the value of an initial application to an organization, our sales and account management teams work to expand the adoption of that initial application across the organization, as well as cross-sell additional applications to address other enterprise work management needs of the organization. Our direct sales team is organized by geography, customer size, application type and functional area within an organization. All of our direct sales personnel sell our applications and professional services across multiple industries.
Marketing
Our marketing activities are designed to build awareness of the Upland brand and the individual product brands, generate thought leadership and create demand, resulting in leads and opportunities for our sales organizations. Our marketing programs target decision makers and influencers participating in a buying cycle, including the chief information officer, the chief marketing officer, the chief financial officer, the director of process excellence and other key technology and business managers. Our principal marketing programs include:
| • | use of our website to provide information about us and our software applications, as well as educational opportunities for potential customers; |
| • | field marketing events for customers and prospective customers; |
| • | participation in, and sponsorship of, executive events, trade shows and industry events; |
| • | our user conferences; |
| • | integrated digital marketing campaigns, including email, online advertising, blogs and webinars; |
| • | public relations, analyst relations and social media initiatives; and |
| • | sales representatives who respond to incoming leads to convert them into new sales opportunities. |
-94-
Table of Contents
Customer Success
Our customer success organization is structured to manage all aspects of our post-sale customer lifecycle. This organization consists of dedicated teams with a mission to drive adoption of our applications, value realization, retention and loyalty across our customer base. Our customer success organization has four core functional areas with strategic focus on customer relationship management:
| • | Customer Care. Our customer care team assists customers throughout their lifecycle with the Upland family of applications by making service offerings available to all customers as part of their standard customer agreements, including webinars, user group meetings and conferences. In particular, we hold a user conference featuring a variety of keynote and customer speakers, panelists and presentations. Conference attendees also gain insight into our recent application enhancements and participate in interactive sessions that give them the opportunity to express opinions on new features and functionality. |
| • | Professional Services. Our professional services team is responsible for coordinating all activities relating to the implementation, transition and on-boarding of new customers and assisting new customers with the addition of new applications to their accounts. Typical professional services engagements vary in length from a few weeks to several months depending on the size and scope of the engagement and are in addition to services provided under our standard customer agreement and are fee-based. In addition, our project managers and consultants work closely with our customers to provide services that help customers maximize the utility of our applications. Our continuing education services, known as Upland University, provide our clients with access to product tutorials and information on new applications and platform features, as well as offer tailored training programs to meet specific client needs. |
| • | Account Management. We assign each customer a regionally aligned account team with a relationship manager who functions as the customer’s single point of contact and advocate within Upland. Our account management teams are trained on all of our applications and work closely with the relationship manager to ensure that our customers receive high-quality consultative service. |
| • | Customer Support. We offer support from all of our office locations, as well as our offshore Center of Excellence in Egypt and India, to help our customers maximize the return on their investment in our applications. We provide 24/7 customer support around the world through our online customer support portal. In addition, our customer support team manages and administers the Upland customer community forum and knowledge base repository. |
Our customer success organization manages programs to reinforce the ongoing business value of our applications and promote the Upland “customer for life” program. These service offerings include:
| • | Health Checks and Program Reviews: Engages core users and business buyer sponsors to deliver a detailed scorecard and recommendation report. |
| • | Advisory and Retained Services: Provides access to a specific customer success contact with priority scheduling and periodic checkpoints. |
| • | System Deployment and Adoption Analysis: Analyzes system configuration and usage patterns, resulting in best practice recommendations on improving user adoption and compliance. |
| • | Consumption Review and Recommendations: Delivers best practice recommendations for implementation strategy and a roadmap proposal for aligning the system with customers’ evolving process maturity to increase application usage. |
| • | Success Services Program: Provides three service-level options tailored to maximize customers’ value relative to their specific needs. |
-95-
Table of Contents
Technology and Operations
Our cloud-based family of applications utilizes a multi-tenant architecture and our customers access our applications through a consistent user interface using a secure Internet connection through a standard web browser. We rely on generally available off-the-shelf software licensed from third parties. Our applications are easy to deploy, highly configurable, scalable, flexible and secure and provide our customers with a modern and intuitive user experience.
Our cloud-based infrastructure is designed to achieve better than 99.9% uptime, excluding planned downtime. We achieved 99.9% uptime for the twelve months ended June 30, 2014. We use storage area network hardware at our data center locations that have been designed for high performance and data-loss prevention. We believe these systems have the capability and scalability to enable us to meet our anticipated growth for the foreseeable future.
We employ a modular application architecture to balance customer workloads across multiple servers and to provide a flexible method for scaling customers without impacting other parts of the server environment. This architecture is designed to allow us to provide the high levels of uptime required by our customers. We employ capacity planning techniques to ensure we have required capacity for our forecasted growth.
We offer high levels of security by segregating each customer’s data from the data of other customers and by limiting access to our platform to only those individuals authorized by our customers. We maintain a formal and comprehensive security program designed to ensure the security and integrity of customer data, protect against security threats or data breaches, and prevent unauthorized access to the data of our customers. We strictly regulate and limit all access to on-demand servers and networks at our production and remote backup facilities. Periodic security audits are conducted by an external third-party and include firewall penetration testing and vulnerability scans. In addition, sensitive customer data is encrypted. Encrypted backup files are transmitted over secure connections to a redundant server storage device in a secondary data center. Our data center facilities employ advanced measures to ensure physical integrity, including redundant power and cooling systems, and advanced fire and flood prevention.
All users are authenticated, authorized and validated before they can access our system. Users must have a valid user ID and associated password to log onto our user interface. Our configurable security model allows different groups of users to have different levels of access to our applications. Security groups and policies are delivered or can be created based on a customer’s unique access requirements.
We currently serve our customers from seven secure, third-party, American National Standards Institute Tier 3 data center facilities, located in San Diego, California; Los Angeles, California; Phoenix, Arizona; St. Louis, Missouri; Chicago, Illinois; Dulles, Virginia; and Montreal, Quebec. Our data centers are designed to host computer systems with fully redundant subsystems and compartmentalized security zones. While we procure and operate all infrastructure equipment delivering our applications, third parties operate the data centers that we use. These facilities provide 24/7 security, biometric access controls, systems security, redundant power and environmental controls. Our contracts with these third party data center providers are typically for a term of three years. While we believe that these data centers have sufficient capacity to meet our anticipated growth for the foreseeable future, we have instituted a new initiative to consolidate our data centers for higher efficiency.
We voluntarily obtain third-party security examinations relating to security and data privacy in accordance with the Statement on Standards for Attestation Engagements (SSAE) No. 16, Reporting on Controls at a Service Organization. Our SSAE examination is conducted every year by an independent third-party auditor and addresses, among other areas, our physical and environmental safeguards for production data centers, data availability and integrity procedures, change management procedures and logical security procedures.
-96-
Table of Contents
Research and Development
Our ability to compete depends in large part on our continuous commitment to research and development, our ability to rapidly introduce new features and functionality and our ability to improve proven applications for established markets in which we have competitive advantages. We work closely with our customers to continuously enhance the performance, functionality, usability, reliability and flexibility of our applications.
Our research and development organization is responsible for the design enhancements, development, testing and certification of our applications. In addition, we utilize contractors and offshore resources for our automated testing, managed upgrades, software development and other technology services. Our research and development expenses were $5.3 million in fiscal 2012, $10.3 million in fiscal 2013 and $18.4 million in the first six months of 2014.
Competition
The overall market for enterprise work management software is rapidly evolving and subject to changing technology, shifting customer needs and frequent introductions of new applications. The intensity and nature of our competition varies significantly across our range of enterprise work management applications. We believe there are a limited number of direct competitors that provide a comprehensive cloud-based enterprise work management software offering. However, we face competition both from point solution providers, including legacy on-premise enterprise systems, and other cloud-based work management software vendors that may address one or more of the functional elements of our applications, but are not designed to address a broad range of enterprise work management needs. In addition, we face competition from manual processes and traditional tools, such as paper-based techniques, spreadsheets and email.
Our primary competitors for each of our enterprise work management applications currently include:
| • | Program and Portfolio Management: Clarity (a division of Computer Associates), Changepoint, Instantis and Planview; |
| • | Project Management and Collaboration: Microsoft Project, AtTask and Clarizen; |
| • | Workflow Automation and Enterprise Content Management: Hyland Software, Laserfiche, OpenText, Perceptive Software (a division of Lexmark), Adobe and Sitecore; |
| • | Professional Services Automation: Deltek, Infor, OpenAir (a product of NetSuite) and Replicon; and |
| • | Financial Management: Apptio, Hewlett Packard’s Information Technology Financial Management Solution and VMware’s Information Technology Business Management Suite. |
We believe the principal competitive factors in our market include the following:
| • | breadth and depth of application functionality; |
| • | ease of deployment and use of applications; |
| • | total cost of ownership; |
| • | levels of customer support satisfaction; |
| • | brand awareness and reputation; |
| • | capability for configurability, integration, scalability and reliability of applications; |
| • | ability to innovate and respond to customer needs rapidly; and |
| • | level of integration among applications and with other enterprise systems. |
We believe that we compete favorably on the basis of these factors. Our ability to remain competitive will largely depend on the strength of our applications, the effectiveness of our sales and marketing efforts, the quality of our customer success organization and our ability to acquire complementary technologies, products and businesses to enhance the features and functionality of our applications.
-97-
Table of Contents
Intellectual Property and Proprietary Rights
We primarily rely on a combination of copyright, trade secret, trademark and other rights in the United States and other jurisdictions, as well as confidentiality procedures and contractual provisions, to protect our intellectual property and proprietary rights. We filed applications to register some of our trademarks, including UPLAND, “DO THE RIGHT WORK. DO THE WORK RIGHT” and our Upland Software logo, in the United States and certain other jurisdictions. In addition, as of June 30, 2014, we owned four issued U.S. patents and had four pending applications for U.S. patents.
Though we rely in part on our registered intellectual property, we believe that the most important factor in protecting our technology, and the competitive advantage we believe it provides, is the skill and know-how embodied in the functionality and frequent enhancements we make to our applications. Accordingly, in order to help prevent misuse and misappropriation of our technology, we include confidentiality and other protective provisions in our customer agreements and in our other agreements with employees, contractors, customers and other third parties, which limit access to, use of and disclosure of our proprietary information and technology.
Employees
As of June 30, 2014, we had 296 employees, including 61 in sales and marketing, 103 in customer success and 80 in product development. None of our employees are covered by a collective bargaining agreement. We have never experienced a strike or similar work stoppage, and we consider our relations with our employees to be good.
Properties
Our principal offices are located in Austin, Texas where we occupy approximately 6,255 square feet of space under a sublease that expires in May 2017. We occupy additional leased facilities of approximately 8,930 square feet in Cambridge, Massachusetts; approximately 16,987 square feet in Montreal, Quebec; approximately 22,950 square feet in Lincoln, Nebraska; approximately 9,645 square feet in Carlsbad, California; and approximately 10,112 square feet in San Francisco, California. We also occupy additional leased facilities of less than 5,000 square feet each in Iselin, New Jersey and London, England. We believe that our facilities are adequate for our current needs and that suitable additional or substitute space will be available as needed to accommodate planned expansion of our operations.
Legal Proceedings
From time to time, we may become involved in legal proceedings arising in the ordinary course of our business. We are not presently a party to any legal proceedings that we believe would, individually or taken together, have a material adverse effect on our business, operating results, financial condition or cash flows.
-98-
Table of Contents
The following table sets forth the name, age and position of each of our executive officers and directors as of September 30, 2014.
| Name |
Age |
Position | ||
| Executive Officers |
||||
| John T. McDonald |
51 | Chief Executive Officer and Chairman of the Board | ||
| Michael D. Hill |
45 | Chief Financial Officer, Treasurer and Assistant Secretary | ||
| Ludwig Melik |
44 | President | ||
| Timothy W. Mattox |
48 | Chief Operating Officer | ||
| R. Brian Henley |
50 | Executive Vice President of Corporate Development and M&A | ||
| Joseph Larscheid |
39 | Executive Vice President of Strategy | ||
| Mounir Hilal |
37 | Senior Vice President of Customer Success and Global Services | ||
| Sean Nathaniel |
37 | Senior Vice President of Technology | ||
| Brian Wilson |
37 | Senior Vice President of Sales | ||
| Maysoon Al-Hasso |
44 | Senior Vice President of Marketing | ||
| Angie McDermott |
54 | Senior Vice President of Human Resources | ||
| Robert V. Housley |
42 | General Counsel and Secretary | ||
| Non-Employee Directors |
||||
| John D. Thornton |
49 | Director | ||
| Steven Sarracino |
38 |
Director | ||
| Stephen E. Courter |
59 |
Director | ||
| Rodney C. Favaron |
50 |
Director |
Executive Officers
John T. (Jack) McDonald has served as our Chief Executive Officer and Chairman of our board of directors since our founding in July 2010. Prior to founding Upland in 2010, Mr. McDonald was Chief Executive Officer of Perficient, Inc. (NASDAQ: PRFT), an information technology consulting firm, from 1999 to 2009, and chairman from 2001 to 2010. Mr. McDonald started his career as an attorney with Skadden, Arps, Slate, Meagher & Flom LLP in New York, focusing on mergers and acquisitions and corporate finance, from 1987 to 1993. Mr. McDonald currently serves as chairman of the Greater Austin Chamber of Commerce and is a member of the board of directors of a number of privately held companies and non-profit organizations. Mr. McDonald received a B.A. in Economics from Fordham University and a J.D. from Fordham Law School.
We believe that Mr. McDonald is qualified to serve as a member of our board of directors because of his experience as our Chief Executive Officer and his background in the technology industry, including serving as chairman of a public technology company.
Michael D. Hill has served as our Chief Financial Officer, Treasurer and Assistant Secretary since our founding in July 2010. Prior to joining Upland, Mr. Hill served as Chief Financial Officer of Perficient, Inc. (NASDAQ: PRFT), from February 2004 to August 2006 and then as its Vice President, Strategic Finance from August 2006 to May 2007. Mr. Hill worked as a consulting Chief Financial Officer for Whitecap Capital I, LLC, a private equity investment fund, from November 2008 to December 2011 and served as a consultant to multiple small businesses from June 2007 to October 2008. Previously, Mr. Hill served in executive management roles for several technology start-up companies and spent more than seven years with Ernst & Young LLP in the Assurance and Advisory Business Services practice in Austin, Texas. Mr. Hill received a B.B.A. in Accounting from The University of Texas at Austin and is a licensed certified public accountant in the State of Texas.
-99-
Table of Contents
Ludwig Melik has acted as our President since September 2012. Mr. Melik joined Upland through our acquisition of Tenrox in February 2012. He first served as Vice President of Sales from February 2012 to September 2012 and has served as President since September 2012. Prior to our acquisition of Tenrox, Mr. Melik served as Vice President of Sales and a partner of Tenrox from August 1997 to February 2012. Mr. Melik holds a Bachelor of Commerce degree from Concordia University.
Timothy W. Mattox has served as our Chief Operating Officer since July 2014. Prior to joining Upland, Mr. Mattox held various executive positions at Dell, which he joined in 1998. During his time at Dell, Mr. Mattox was responsible for worldwide enterprise product management from January 2009 to January 2013. In addition, while at Dell, Mr. Mattox led Dell’s corporate strategy group, reporting to the Chief Executive Officer, from January 2007 to January 2009. Prior to Dell, Mr. Mattox was a manager at Bain & Company. Mr. Mattox holds a B.S. and M.S. in electrical engineering from the Massachusetts Institute of Technology and an M.B.A. from the Stanford Graduate School of Business. Mr. Mattox currently sits on the board of the National Center for Arts and Technology, an innovative educational non-profit organization.
R. Brian Henley has served as our Executive Vice President of Corporate Development and M&A since January 2013. Prior to joining Upland, Mr. Henley was a Partner, Analyst and Portfolio Manager for Rogge Capital Management, an international hedge fund that invests in high-growth companies across Asia and Europe, from February 2007 to June 2012. Mr. Henley started his career at International Business Machines Corporation in 1986, holding various roles in sales and corporate development over a seven-year period. Subsequently, Mr. Henley was a technology entrepreneur, building two Internet-based businesses that were acquired by public companies. Mr. Henley holds a B.S. in Industrial Engineering from the University of Arkansas and an M.B.A. from Harvard Business School.
Joseph Larscheid has served as our Executive Vice President of Strategy since November 2012. Mr. Larscheid joined Upland through our acquisition of EPM Live, where he served as founder and Chief Executive Officer from 1999 to November 2012. Mr. Larscheid attended Grossmont College and San Diego State University.
Mounir Hilal has served as our Senior Vice President of Customer Success and Global Services since February 2012. Prior to joining Upland, Mr. Hilal served as Vice President of Client Services of Tenrox from December 2008 to April 2012, where he oversaw the global professional services organization. Mr. Hilal holds a B.S. in Software Engineering from McGill University and an M.B.A. from Queen’s University. Mr. Hilal is also a certified Project Management Professional.
Sean Nathaniel has served as our Senior Vice President of Technology since May 2013. Mr. Nathaniel joined Upland through our acquisition of FileBound, where Mr. Nathaniel served as Chief Information Officer from February 2007 to May 2013. Prior to that, Mr. Nathaniel served in various positions, most recently as Director of Technology for GiftCertificates.com, an e-commerce company, from February 2000 to February 2007. Mr. Nathaniel holds a B.A. in Business Administration from Northwestern College and an M.B.A. from the University of Nebraska.
Brian Wilson has served as our Senior Vice President of Sales since May 2013. Before joining Upland, Mr. Wilson was Vice President of Sales at Innotas, a software company providing cloud solutions for project portfolio management, application portfolio management and capacity and demand planning from December 2011 to May 2013. Mr. Wilson also served as a Regional Sales Manager at Innotas from August 2009 to December 2011. From January 2009 to July 2009, Mr. Wilson worked as an independent consultant in the technology industry. Prior to that, Mr. Wilson held various sales and management positions at Seagate Technology PLC and Fujitsu Consumer Products of America, Inc., including leadership roles spanning Distribution Sales, Fortune 100 OEM engagements and Field Sales. Mr. Wilson holds a B.A. in Communication with a minor in Managerial Economics from the University of California, Davis.
-100-
Table of Contents
Maysoon Al-Hasso has served as our Senior Vice President of Marketing since June 2014. Prior to joining Upland she worked as an independent consultant between 2010 to 2014 with Austin-based software companies and non-profits including uStudio Inc., Adlucent LLC and The Miracle Foundation. Ms. Al-Hasso has held marketing leadership roles at software companies, including North America Marketing for OutSystems from 2009 to 2010, Vice President of Marketing at Apptix, Inc. from 2007 to 2008, and Vice President of Marketing at CA Technologies, Inc. (NASDAQ: CA) from 2000 to 2005. She holds a B.Sc. in Management Sciences from the University of Manchester, England.
Angie McDermott has served as our Senior Vice President of Human Resources since June 2014. Prior to joining Upland, Ms. McDermott was Vice President, Human Resources for Calxeda from May 2013 to December 2013. Previously, Ms. McDermott worked at Convio, Inc. as its Vice President of Human Resources from February 2006 to April 2013. Prior to Convio, Inc., Ms. McDermott served in various human resources roles within Dell, McDermott Consulting, and Procter and Gamble. She holds a B.S. in Psychology and a B.S. and Ph.D. in Industrial/Organizational Psychology from the University of Houston.
Robert V. Housley has served as our General Counsel and Secretary since February 2014. Prior to joining Upland, Mr. Housley practiced law at Wilson Sonsini Goodrich & Rosati, Professional Corporation, since January 2000 and at Testa Hurwitz & Thibeault, L.L.P. from October 1998 to January 2000. Mr. Housley represented enterprises and investors in the areas of corporate and securities law, finance, mergers and acquisitions and corporate governance. Mr. Housley holds a B.S. in Economics from the University of Texas at Austin and a J.D. from Southern Methodist University Dedman School of Law.
Our executive officers are appointed by and serve at the discretion of our board of directors. There are no family relationships between our non-employee directors and executive officers.
Non-Employee Directors
John D. Thornton has served as a member of our board of directors since July 2010. Mr. Thornton is a general partner of Austin Ventures, a venture capital firm, which he joined in 1991. Mr. Thornton has previously served on the board of directors of a number of public companies. Mr. Thornton holds a B.A. from Trinity University and an M.B.A. from the Stanford Graduate School of Business. We believe that Mr. Thornton is qualified to serve as a member of our board of directors as a result of his experience as a director of publicly traded technology companies and his background in the venture capital industry.
Steven Sarracino has served as a member of our board of directors since December 2013. Mr. Sarracino is a partner of Activant Capital, which he founded in 2012. From 2010 to 2012, Mr. Sarracino provided consulting and advisory services to private equity and venture capital firms, with a focus on investing in software and technology companies. Prior to that, Mr. Sarracino was a Vice President at Serent Capital, a growth buyout firm, from 2008 to 2010. Previously, Mr. Sarracino was a Vice President in the technology investing office at American Capital, Ltd. in Palo Alto from 2006 to 2008. Mr. Sarracino holds a B.B.A. from Southern Methodist University and an M.B.A. from The Wharton School at the University of Pennsylvania. We believe that Mr. Sarracino possesses specific attributes that qualify him to serve as a member of our board of directors, including his background in the venture capital industry.
Stephen E. Courter has served as a member of our board of directors since September 2014. Mr. Courter is on the faculty of the McCombs School of Business, University of Texas at Austin, which he joined in August 2007, teaching courses in the Masters in Business Administration program and leads study abroad programs in Thailand, Vietnam, India and Indonesia. Prior to joining the University of Texas at Austin, Mr. Courter served as Chief Executive Officer and board member of Broadwing Communications from 2006 to 2007. Previously, Mr. Courter served as Chairman and Chief Executive Officer of Neon Communications from 2000 to 2006 and Chief Executive Officer of Enertel, a Dutch telecommunications company based in Rotterdam from 1998 to 2000. Mr. Courter currently serves on the board of directors of Cadiz Inc. (NASDAQ: CDZI), which he joined in
-101-
Table of Contents
2008, and iMobi Corp., which he joined in 2007. Mr. Courter holds a B.S. in Finance from The Pennsylvania State University and an M.B.A. from The George Washington University. Mr. Courter holds the rank of Major in the U.S. Army Reserves.
We believe Mr. Courter is qualified to serve as a member of our board of directors as a result of his experience in executive-level management positions at technology companies and the knowledge he gained from service on the boards of public and private companies.
Rodney C. Favaron has served as a member of our board of directors since September 2014. Mr. Favaron is President and Chief Executive Officer of Spredfast, Inc., which he joined in February 2011. Prior to Spredfast, Mr. Favaron served as the Chairman and Chief Executive Officer of Lombardi Software from June 2002 to January 2010. Prior to that, Mr. Favaron served as Chief Executive Officer of Mediaprise, Inc. from October 2000 to March 2002, Senior Vice President of Sales and Marketing at pcOrder.com from April 1998 to May 2000, and as the General Manager at Mentor Graphics Corporation from 1994 to 1998. Mr. Favaron holds a B.S. in Industrial Engineering from Louisiana State University, and an M.B.A. from the University of Dallas Graduate School of Management.
We believe that Mr. Favaron’s extensive experience in executive-level management positions at technology companies, including those in the software industry, qualify him to serve as a member of our board of directors.
Structure of the Board of Directors
Our business and affairs are managed under the direction of our board of directors. Our board of directors currently consists of five members. Pursuant to an Amended and Restated Voting Agreement, or the Voting Agreement, among us and certain holders of our common and preferred stock, Messrs. McDonald, Thornton, Sarracino, Courter and Favaron were appointed to our board of directors by certain of our stockholders. Mr. Thornton was designated by Austin Ventures IX, L.P. or its affiliates, Mr. McDonald was designated by our founders and Mr. Sarracino was designated by Messrs. McDonald and Thornton. Messrs. Courter and Favaron were designated by Messrs. McDonald, Thornton and Sarracino. The Voting Agreement will terminate upon the closing of this offering, and there will be no further contractual obligations regarding the election of our directors. Our directors hold office until their successors have been elected and qualified or until their earlier resignation or removal.
Upon completion of this offering, the number of directors will be fixed by our board of directors, subject to the terms of our amended and restated certificate of incorporation and amended and restated bylaws that will be adopted prior to the closing of this offering. Upon completion of this offering, our board of directors will consist of five directors, four of whom will qualify as “independent” under the applicable NASDAQ Global Market listing standards.
In accordance with the term of our amended and restated certificate of incorporation and our amended and restated bylaws that will be adopted prior to the closing of this offering, our board of directors will be divided into three classes, the members of each of which will serve for staggered three-year terms. Only one class of directors will be elected at each annual meeting of our stockholders, with the other classes continuing for the remainder of their respective three-year terms. Our directors will be divided among the three classes as follows:
| • | the class I directors will be Messrs. Courter and Favaron, and their terms will expire at the first annual meeting of stockholders held after the closing of this offering; |
| • | the class II directors will be Messrs. Thornton and Sarracino, and their terms will expire at the second annual meeting of stockholders held after the closing of this offering; and |
| • | the class III director will be Mr. McDonald, and his term will expire at the third annual meeting of stockholders held after the closing of this offering. |
-102-
Table of Contents
We expect that any additional directorships resulting from an increase in the authorized number of directors will be distributed among the three classes so that, as nearly as possible, each class will consist of one-third of the directors. This classification of our board of directors may have the effect of delaying or preventing changes in our control or management.
Our amended and restated certificate of incorporation and amended and restated bylaws, each of which will be adopted prior to the closing of this offering, provide that our directors may be removed only for cause by the affirmative vote of the holders of at least a majority of the voting power of all of our then-outstanding shares of capital stock entitled to vote generally at an election of directors. Our directors will be elected by a plurality of the voting power of the shares present in person or represented by proxy and entitled to vote on the election of directors.
Director Independence
Upon the completion of this offering, we expect that our common stock will be listed on the NASDAQ Global Market. Under the rules of the NASDAQ Global Market, independent directors must comprise a majority of our board of directors within a specified period of time following the completion of this offering. Under the listing rules of the NASDAQ Global Market, a director will only qualify as an ‘‘independent director’’ if that company’s board of directors affirmatively determines that such director does not have a relationship that would interfere with the exercise of independent judgment in carrying out the responsibilities of a director.
In addition, following the effectiveness of this registration statement, the members of our audit committee must satisfy the independence criteria set forth in Rule 10A-3 promulgated under Section 10A(m) of the Exchange Act, or Rule 10A-3. In order to be considered independent for purposes of Rule 10A-3, no member of the audit committee may, other than in his capacity as a member of the audit committee, the board of directors or any other Board committee: (1) accept, directly or indirectly, any consulting, advisory or other compensatory fee from the company or any of its subsidiaries; or (2) be an affiliated person of the company or any of its subsidiaries.
Prior to the completion of this offering, our board of directors will undertake a review of the independence of each director and consider whether any director has a material relationship with us that could compromise his ability to exercise independent judgment in carrying out his responsibilities.
Lead Independent Director
In connection with this offering, we have adopted corporate governance guidelines, to be effective immediately following this offering, that provide that one of our independent directors should serve as a lead independent director at any time when our Chief Executive Officer serves as the Chairman of our board of directors, or if the Chairman is not otherwise independent. Because Mr. McDonald is our Chairman and Chief Executive Officer, our board of directors has appointed Mr. Thornton to serve as lead independent director to preside over periodic meetings of our independent directors, serve as a liaison between our Chairman and the independent directors and perform additional duties as our board of directors may otherwise determine or delegate from time to time.
Committees of the Board of Directors
We expect that, immediately following this offering, the standing committees of our board of directors will consist of an Audit Committee, a Compensation Committee and a Nominating and Corporate Governance Committee. Each committee will operate, upon the closing of this offering, under a charter that has been approved by our board of directors. The composition and primary responsibilities of each committee are described below. The composition of each committee will be effective upon the closing of this offering. Members will serve on these committees until their resignation, their otherwise ceasing to be a director or until otherwise determined by our board of directors. In addition, our board of directors may establish other committees to facilitate the management of our business from time to time.
-103-
Table of Contents
Audit Committee
Immediately following this offering, our Audit Committee will consist of Messrs. Courter, Sarracino and Favaron, with Mr. Courter serving as chairman. Our board of directors has determined that each of Messrs. Courter, Sarracino and Favaron meets the independence requirements of Rule 10A-3 of the Exchange Act and the NASDAQ Global Market listing standards. Our board of directors has also determined that Mr. Courter qualifies as an “audit committee financial expert” within the meaning of SEC regulations.
The primary purpose of the Audit Committee is to discharge the responsibilities of our board of directors with respect to our accounting, financial and other reporting and internal control practices and to oversee our independent registered public accounting firm. Specific responsibilities of our Audit Committee include:
| • | evaluating the performance of our independent registered public accounting firm and determining whether to retain or terminate its services; |
| • | determining and pre-approving the engagement of our independent registered public accounting firm to perform audit services and any permissible non-audit services; |
| • | reviewing and discussing with management and our independent registered public accounting firm the results of the annual audit and the independent registered public accounting firm’s assessment of our annual and quarterly financial statements and reports; |
| • | reviewing with management and our independent registered public accounting firm significant issues that arise regarding accounting principles and financial statement presentation; |
| • | conferring with management and our independent registered public accounting firm regarding the scope, adequacy and effectiveness of our internal control over financial reporting; |
| • | establishing procedures for the receipt, retention and treatment of any complaints we receive regarding accounting, internal accounting controls or auditing matters; and |
| • | overseeing compliance with the requirements of the SEC and the Foreign Corrupt Practices Act. |
Compensation Committee
Immediately following this offering, our Compensation Committee will consist of Messrs. Sarracino, Courter and Thornton, with Mr. Sarracino serving as chairman. Our board of directors has determined that each of Messrs. Sarracino, Courter and Thornton is “independent” within the meaning of applicable NASDAQ Global Market listing standards, is a “non-employee director” as defined in Rule 16b-3 under the Exchange Act and is an “outside director” as that term is defined in Section 162(m) of the Code. The primary purpose of our Compensation Committee is to discharge the responsibilities of our board of directors to oversee our compensation policies, plans and programs and to review and determine the compensation to be paid to our executive officers, directors and other senior management, as appropriate. Specific responsibilities of our Compensation Committee include:
| • | determining the compensation and other terms of employment of our executive officers and reviewing and approving corporate performance goals and objectives relevant to such compensation; |
| • | evaluating and approving the compensation plans and programs advisable for us and evaluating and approving the modification or termination of existing plans and programs; |
| • | reviewing and approving the terms of any employment agreements, severance arrangements, change-of-control protections and any other compensatory arrangements for our executive officers and other senior management, as appropriate; and |
| • | reviewing and recommending to our board of directors the compensation of our directors. |
Nominating and Corporate Governance Committee
Immediately following this offering, our Nominating and Corporate Governance Committee will consist of Messrs. Sarracino and Favaron, with Mr. Sarracino serving as chairman. Our board of directors has
-104-
Table of Contents
determined that each of Messrs. Sarracino and Favaron is independent within the meaning of applicable NASDAQ Global Market listing standards. The specific responsibilities of our Nominating and Corporate Governance Committee include:
| • | reviewing proposed changes to our certificate of incorporation and bylaws and making recommendations to the board; |
| • | overseeing compliance by the board with applicable laws and regulations; |
| • | identifying, reviewing, evaluating and recommending for selection candidates for membership to our board of directors; |
| • | reviewing, evaluating and considering the recommendation for nomination of incumbent members of our board of directors for reelection to our board of directors and monitoring the size of our board of directors; |
| • | considering the recommendation for nomination of candidates for election to our board of directors and proposals submitted by our stockholders; and |
| • | reviewing the performance of our board of directors, recommending areas of improvement to our board of directors and assessing the independence of members of our board of directors. |
Compensation Committee Interlocks and Insider Participation
None of the members of our Compensation Committee is currently, or has ever been at any time since our formation, an executive officer or employee of our company. None of our executive officers currently serves, nor in the past year has served, as a member of the board of directors or compensation committee of any entity that has one or more executive officers serving on our board of directors or Compensation Committee.
Code of Business Conduct and Ethics
Our board of directors has adopted a written code of business conduct and ethics that applies to our directors, officers and employees, including our principal executive officer, principal financial officer, principal accounting officer and controller, or persons performing similar functions. We intend to post the code of business conduct and ethics, any amendments that may be adopted from time to time and any waivers of the requirements of the code of business conduct and ethics on the “Investor Relations” page of our website, www.uplandsoftware.com. The information on our website is not part of this prospectus.
Director Compensation
Cash Compensation
No cash compensation was paid to our directors for the fiscal year ended December 31, 2013 for their service as directors. We reimburse and expect to continue to reimburse our directors for their reasonable expenses incurred in attending meetings of our board of directors.
Equity Incentive Compensation
No equity incentive compensation was paid to our directors for the fiscal year ended December 31, 2013 for their service as directors. We have not issued stock options or other equity awards to any of our directors in consideration for service on our board of directors.
Future Director Compensation
Effective upon the completion of the offering, our non-employee directors will be entitled to receive a $25,000 retainer fee. In addition, the audit committee chairperson will receive an annual fee of $15,000 and members of the audit committee will receive an annual fee of $10,000; the compensation committee chairperson
-105-
Table of Contents
will receive an annual fee of $10,000 and members of the compensation committee will receive an annual fee of $5,000; the nominating and corporate governance committee chairperson will receive an annual fee of $5,000 and the members of the nominating and corporate governance committee will receive an annual fee of $2,500; and our lead independent director will receive an annual fee of $15,000. Our non-employee directors will become eligible to receive these annual fees upon the completion of the offering.
At the time of the effectiveness of the registration statement of which this prospectus forms a part, each non-employee director will receive a restricted stock grant entitling the director to receive that number of shares of our common stock equal to $125,000 divided by the initial public offering price per share. These grants will vest on the first anniversary of the date of grant, provided that the non-employee director continues to serve as a director through such vesting date. As described in the section “Executive Compensation—Employee Benefit Plans,” our 2014 Equity Incentive Plan will provide for nonstatutory stock options to be granted to non-employee directors.
-106-
Table of Contents
Summary Compensation Table For Fiscal Year Ended December 31, 2013
The following table sets forth information regarding the compensation awarded to, earned by, or paid to our principal executive officer, the two most highly compensated executive officers other than our principal executive officer and up to two additional individuals whose disclosure would have been provided but for the fact that the individual was not serving as an executive officer of our company at the end of the fiscal year ended December 31, 2013. These officers are referred to as our “named executive officers” throughout this prospectus.
| Name and Principal Position |
Year | Salary | Bonus | Option Awards(1) |
All Other Compensation(2) |
Total | ||||||||||||||||||
| John T. McDonald |
2013 | $ | 240,000 | $ | 114,496 | (3) | — | $ | 1,309 | $ | 355,805 | |||||||||||||
| Chief Executive Officer and Chairman |
||||||||||||||||||||||||
| R. Brian Henley |
2013 | $ | 120,000 | $ | 261,250 | (4) | $ | 45,000 | $ | 1,155 | $ | 427,405 | ||||||||||||
| Executive Vice President of Corporate Development and M&A |
||||||||||||||||||||||||
| Ludwig Melik |
2013 | $ | 199,060 | $ | 86,556 | (4) | $ | 18,750 | $ | 5,436 | $ | 309,802 | (5) | |||||||||||
| President |
||||||||||||||||||||||||
| (1) | The amounts in this column represent the aggregate grant date fair value of option awards granted to the named executive officer in the applicable fiscal year computed in accordance with FASB ASC Topic 718. Assumptions used in calculating these amounts are described in Note 2 to our consolidated financial statements included elsewhere in this prospectus. |
| (2) | The amounts reported in this column represent short-term disability, long-term disability, and life insurance premiums we paid for the benefit of the named executive officers. |
| (3) | The amount reflects a bonus payment made in 2014 for services performed in 2013. |
| (4) | Includes a bonus payment made in 2013 and a bonus payment made in 2014 for services performed in 2013. |
| (5) | All elements of compensation other than option awards are paid in Canadian dollars and amounts are presented in the table above as converted to U.S. dollars using a blended conversion rate for 2013 of 0.97. |
Executive Employment and Other Arrangements
We entered into offer letter agreements with each of our named executive officers in connection with their employment. The offer letter agreements have no specific term of employment and the relationships created thereby constitute at-will employment. A summary of our current employment arrangements with our named executive officers is set forth below.
John T. McDonald. Mr. McDonald is party to an employment agreement with us dated May 9, 2014. This employment agreement has no specific term and constitutes at-will employment. Mr. McDonald’s current base salary is $240,000. Mr. McDonald is also eligible to receive benefits that are substantially similar to those of our other employees. His employment agreement sets forth his target bonus, which is set at 100% of Mr. McDonald’s then current base salary. Payment of any bonus to Mr. McDonald is subject to approval by our board of directors. In addition, on September 2, 2014, we granted Mr. McDonald 171,040 shares of restricted common stock, pursuant to a restricted stock agreement, which provides for a repurchase right by the Company that will lapse over time. Pursuant to this agreement, in the event Mr. McDonald is terminated for any reason (other than for cause (as such term is defined in his employment agreement)) or resigns of his own volition for good reason (as such term is defined in his employment agreement), (i) we will be obligated to pay him any earned but unpaid compensation, any earned but unpaid bonus, any accrued but unpaid vacation pay and any expense reimbursement, (ii) we will be obligated to pay him 100% of his then current monthly base salary for 12 months,
-107-
Table of Contents
(iii) we will be obligated to pay him 12 months of monthly premiums for his then current health benefits in a single lump sum. Each of the severance benefits described above is contingent on Mr. McDonald executing a mutual release of claims and continuing to protect our confidential and proprietary information.
Mr. McDonald’s outstanding common stock is subject to a repurchase right by the Company that lapses over time. In the event Mr. McDonald is terminated without “cause” or terminates with “good reason” (as such terms are defined in his restricted stock agreements), he is entitled to receive 12 months’ accelerated vesting of shares subject to the repurchase rights of the Company. In the event Mr. McDonald is terminated without “cause” or terminates with “good reason” after a “change-of-control” transaction (as such terms are defined in his restricted stock agreements), he is entitled to receive accelerated vesting of all outstanding shares subject to the repurchase rights of the Company.
R. Brian Henley. Mr. Henley’s current annual base salary is $125,000. As described further below under “—Employee Benefit Plans—Amended and Restated 2010 Stock Option Plan,” upon a specified corporate transaction where the acquiring entity does not assume or substitute for Mr. Henley’s outstanding stock awards or options, the vesting of his outstanding and unvested stock options fully accelerates subject to Mr. Henley’s continuous employment through the closing of the applicable transaction.
Mr. Henley is also eligible to receive benefits that are substantially similar to those of our other employees. His employment agreement sets forth his target bonus based upon our acquisitions, which is set at 1.33% of the annualized run rate revenue of the acquired business (as defined in his employment agreement). In addition, on September 2, 2014, we granted Mr. Henley 40,990 shares of restricted common stock, pursuant to a restricted stock agreement, which provides for a repurchase right by the Company that will lapse over time. Pursuant to his employment agreement, in the event Mr. Henley is terminated for any reason (other than for cause (as such term is defined in his employment agreement)) or resigns of his own volition for good reason (as such term is defined in his employment agreement), (i) we will be obligated to pay him any earned but unpaid compensation, any earned but unpaid bonus, any accrued but unpaid vacation pay and any expense reimbursement, (ii) we will be obligated to pay him 100% of his then current monthly base salary for a period determined by multiplying four weeks by the number of years of service to the Company, up to a maximum of 52 weeks, (iii) all outstanding shares of restricted stock and the underlying shares of all outstanding options issued to Mr. Henley shall vest an additional 12 months and (iv) we will be obligated to pay him premiums for his then current health benefits in a single lump sum for a period determined by multiplying four weeks by the number of years of service to the Company, up to a maximum of 52 weeks. Each of the severance benefits described above is contingent on Mr. Henley executing a mutual release of claims and continuing to protect our confidential and proprietary information.
Ludwig Melik. Mr. Melik is a party to an employment agreement with us dated February 10, 2012. Mr. Melik’s current annual base salary is $199,060. Pursuant to his employment agreement, if Mr. Melik is terminated without “serious reason” (as defined in the agreement), he is entitled to receive payments in lieu of notice equal to his base salary and incentive compensation during the six month period following his termination. In addition, Mr. Melik is entitled to receive his then current health benefits during such six month period. These severance benefits are contigent on Mr. Melik executing a release of claims and agreeing not to make any negative or disparaging comments regarding the Company. As described further below under “—Employee Benefit Plans—Amended and Restated 2010 Stock Option Plan,” upon a specified corporate transaction where the acquiring entity does not assume or substitute for Mr. Melik’s outstanding stock options, the vesting of his outstanding and unvested stock options fully accelerate subject to Mr. Melik’s continuous employment through the closing of the applicable transaction.
-108-
Table of Contents
Outstanding Equity Awards At Fiscal Year-End
The following table provides information about outstanding equity awards held by each of our named executive officers at December 31, 2013.
| Option Awards | Stock Awards | |||||||||||||||||||||||
| Number of Shares Underlying Unexercised Options |
Option Exercise Price |
Option Expiration Date |
Number of Unvested Shares of Stock |
Market Value of Unvested Shares of Stock |
||||||||||||||||||||
| Name |
Exercisable | Unexercisable | ||||||||||||||||||||||
| John T. McDonald |
— | — | $ | — | — | 166,391 | (2) | $ | 1,035,115 | |||||||||||||||
| R. Brian Henley |
— | 49,188 | 1.77 | 10/25/2023 | (1) | — | — | |||||||||||||||||
| Ludwig Melik |
4,778 | 15,700 | 1.22 | 10/10/2022 | (1) | — | — | |||||||||||||||||
| — | 20,495 | 1.77 | 10/25/2023 | (1) | — | — | ||||||||||||||||||
| (1) | These options have a 10-year term. 10% of the shares subject to the option vest on the one year anniversary of the vesting commencement date, 20% of the shares subject to the option vest in 12 equal monthly installments beginning on the one year anniversary of the vesting commencement date, 30% of the shares subject to the option vest in 12 equal monthly installments beginning on the second year anniversary of the vesting commencement date, and 40% of the shares subject to the option vest in 12 equal monthly installments beginning on the third year anniversary of the vesting commencement date, in each case subject to the recipient’s continued employment through such vesting dates. |
| (2) | These shares are subject to a repurchase option in favor of the Company. On July 23, 2011, the repurchase option lapsed with respect to 25% of the total number of shares issued, with the repurchase option lapsing on the remaining shares in 36 equal monthly installments thereafter, subject to the recipient’s continued employment through such dates. In the event that such executive ceases to be a service provider to the Company prior to the date on which the repurchase option fully lapses, the Company shall have 90 days to exercise its option to repurchase any unvested shares at the price per share paid by the executive. |
Employee Benefit Plans
We believe that our ability to grant equity-based awards is a valuable and necessary compensation tool that aligns the long-term financial interests of our employees, consultants and directors with the financial interests of our stockholders. In addition, we believe that our ability to grant options and other equity-based awards helps us to attract, retain and motivate employees, consultants and directors, and encourages them to devote their best efforts to our business and financial success. The material terms of our equity incentive plans and certain of our other employee benefit plans are described below.
2014 Equity Incentive Plan
Prior to the completion of this offering, our board of directors intends to adopt, and we expect our stockholders to approve, our 2014 Equity Incentive Plan, or the 2014 Plan. Subject to stockholder approval, the 2014 Plan will be effective one business day prior to the effective date of the registration statement of which this prospectus forms a part. Our 2014 Plan will provide for the grant of incentive stock options, within the meaning of Section 422 of the Code, to our employees and any parent and subsidiary corporations’ employees, and for the grant of nonstatutory stock options, restricted stock, restricted stock units, stock appreciation rights, performance units and performance shares to our employees, directors and consultants and our parent and subsidiary corporations’ employees and consultants.
Authorized Shares. The shares to be reserved for issuance under our 2014 Plan will include (i) the shares reserved but unissued under our Amended and Restated 2010 Stock Option Plan, or the 2010 Plan (246,000 shares as of June 30, 2014), and (ii) shares returned to our 2010 Plan as the result of expiration or termination of
-109-
Table of Contents
awards. The number of shares available for issuance under the 2014 Plan will also include an annual increase on the first day of each fiscal year beginning in 2014, equal to the least of:
| • | 4% of the outstanding shares of common stock as of the last day of our immediately preceding fiscal year; or |
| • | such other amount as our board of directors may determine. |
Plan Administration. Our board of directors or one or more committees appointed by our board of directors, will administer the 2014 Plan. We anticipate that the compensation committee of our board of directors will administer our 2014 Plan. In the case of awards intended to qualify as “performance-based compensation” within the meaning of Section 162(m) of the Code, the committee will consist of two or more “outside directors” within the meaning of Section 162(m) of the Code. In addition, if we determine it is desirable to qualify transactions under the 2014 Plan as exempt under Rule 16b-3 of the Exchange Act, or Rule 16b-3, such transactions will be structured to satisfy the requirements for exemption under Rule 16b-3. Subject to the provisions of our 2014 Plan, the administrator will have the power to administer the plan, including but not limited to, the power to interpret the terms of the 2014 Plan and awards granted thereunder, to create, amend and revoke rules relating to the 2014 Plan, including creating sub-plans, and to determine the terms of the awards, including the exercise price, the number of shares subject to each such award, the exercisability of the awards, and the form of consideration, if any, payable upon exercise. The administrator will also have the authority to amend existing awards to reduce or increase their exercise price, to allow participants the opportunity to transfer outstanding awards to a financial institution or other person or entity selected by the administrator, and to institute an exchange program by which outstanding awards may be surrendered in exchange for awards of the same type, which may have a higher or lower exercise price or different terms, awards of a different type and/or cash.
Stock Options. Stock options may be granted under the 2014 Plan. The exercise price of options granted under our 2014 Plan must at least be equal to the fair market value of our common stock on the date of grant. The term of an incentive stock option may not exceed 10 years, except that with respect to any participant who owns more than 10% of the voting power of all classes of our outstanding stock, the term must not exceed five years and the exercise price must equal at least 110% of the fair market value on the grant date. The administrator will determine the methods of payment of the exercise price of an option, which may include cash, shares or other property acceptable to the administrator, as well as other types of consideration permitted by applicable law. After the termination of service of an employee, director or consultant, he or she may exercise his or her option for the period of time stated in his or her option agreement. Generally, if termination is due to death or disability, the option will remain exercisable for 12 months. In all other cases, the option will generally remain exercisable for three months following the termination of service. However, in no event may an option be exercised after the expiration of its term. Subject to the provisions of our 2014 Plan, the administrator determines the other terms of options.
Stock Appreciation Rights. Stock appreciation rights may be granted under our 2014 Plan. Stock appreciation rights allow the recipient to receive the appreciation in the fair market value of our common stock between the exercise date and the date of grant. Stock appreciation rights may not have a term exceeding 10 years. After the termination of service of an employee, director or consultant, he or she may exercise his or her stock appreciation right for the period of time stated in his or her stock appreciation right agreement. However, in no event may a stock appreciation right be exercised after the expiration of its term. Subject to the provisions of our 2014 Plan, the administrator determines the other terms of stock appreciation rights, including when such rights become exercisable and whether to pay any increased appreciation in cash or with shares of our common stock, or a combination thereof, except that the per share exercise price for the shares to be issued pursuant to the exercise of a stock appreciation right will be no less than 100% of the fair market value per share on the date of grant.
Restricted Stock. Restricted stock may be granted under our 2014 Plan. Restricted stock awards are grants of shares of our common stock that vest in accordance with terms and conditions established by the administrator.
-110-
Table of Contents
The administrator will determine the number of shares of restricted stock granted to any employee, director or consultant and, subject to the provisions of our 2014 Plan, will determine the terms and conditions of such awards. The administrator may impose whatever conditions to vesting it determines to be appropriate. For example, the administrator may set restrictions based on the achievement of specific performance goals or continued service to us; provided, however, that the administrator, in its sole discretion, may accelerate the time at which any restrictions will lapse or be removed. Recipients of restricted stock awards generally will have voting and dividend rights with respect to such shares upon grant without regard to vesting, unless the administrator provides otherwise. Shares of restricted stock that do not vest are subject to our right of repurchase or forfeiture.
Restricted Stock Units. Restricted stock units may be granted under our 2014 Plan. Restricted stock units are bookkeeping entries representing an amount equal to the fair market value of one share of our common stock. Subject to the provisions of our 2014 Plan, the administrator will determine the terms and conditions of restricted stock units, including the vesting criteria, which may include accomplishing specified performance criteria or continued service to us, and the form and timing of payment. Notwithstanding the foregoing, the administrator, in its sole discretion, may accelerate the time at which any restrictions will lapse or be removed.
Performance Units and Performance Shares. Performance units and performance shares may be granted under our 2014 Plan. Performance units and performance shares are awards that will result in a payment to a participant only if performance goals established by the administrator are achieved or the awards otherwise vest. The administrator will establish organizational or individual performance goals or other vesting criteria in its discretion, which, depending on the extent to which they are met, will determine the number and the value of performance units and performance shares to be paid out to participants. After the grant of a performance unit or performance share, the administrator, in its sole discretion, may reduce or waive any performance criteria or other vesting provisions for such performance unit or performance share. Performance units shall have an initial dollar value established by the administrator prior to the grant date. Performance shares shall have an initial value equal to the fair market value of our common stock on the grant date. The administrator, in its sole discretion, may pay earned performance units or performance shares in the form of cash, in shares or in some combination thereof.
Outside Directors. Our 2014 Plan will provide that all non-employee directors will be eligible to receive all types of awards, except for incentive stock options, under the 2014 Plan. Each person who first becomes a non-employee director following the completion of this offering will be automatically granted an initial award in the form of a nonstatutory stock option to purchase that number of shares determined by dividing (A) $125,000 by (B) value of an option on one share, determined using the Black-Scholes or other valuation method selected by the administrator, with the number of shares rounded up to the nearest whole share, on or about the date such person becomes a non-employee director. The initial award will vest as to one-twelfth of the shares subject to the initial award on the monthly anniversary of the vesting commencement date, provided that the participant continues to serve as a director through such dates. Each non-employee director will be automatically granted an annual award in the form of a nonstatutory stock option to purchase that number of shares determined by dividing (A) $50,000 by (B) value of an option on one share, determined using the Black-Scholes or other valuation method selected by the administrator, with the number of shares rounded up to the nearest whole share, on a date shortly following the annual meeting of our stockholders beginning in 2015 if, as of such date, the non-employee director will have served on our board of directors for at least the preceding six months. The annual award will vest as to one-twelfth of the shares subject to the annual award on the monthly anniversary of the vesting commencement date, provided the participant continues as a director through such dates. The term of these automatic option grants to non-employee directors will be 10 years or such earlier expiration date specified in the applicable award agreement.
Non-Transferability of Awards. Unless the administrator provides otherwise, our 2014 Plan generally will not allow for the transfer of awards and only the recipient of an award may exercise an award during his or her lifetime.
-111-
Table of Contents
Certain Adjustments. In the event of certain changes in our capitalization, to prevent diminution or enlargement of the benefits or potential benefits available under the 2014 Plan, the administrator will adjust the number and class of shares that may be delivered under the 2014 Plan and the number, class and price of shares covered by each outstanding award, and the numerical share limits set forth in the 2014 Plan. In the event of our proposed liquidation or dissolution, the administrator will notify participants as soon as practicable, and all awards will terminate immediately prior to the consummation of such proposed transaction.
Merger or Change in Control. Our 2014 Plan will provide that in the event of a “merger” or “change in control,” as defined under the 2014 Plan, each outstanding award will be treated as the administrator determines, except that if a successor corporation or its parent or subsidiary does not assume or substitute an equivalent award for any outstanding award, then such award will fully vest, all restrictions on such award will lapse, all performance goals or other vesting criteria applicable to such award will be deemed achieved at 100% of target levels, and such award will become fully exercisable, if applicable, for a specified period prior to the transaction. The award will then terminate upon the expiration of the specified period of time. If the service of an outside director is terminated on or following a change in control, other than pursuant to a voluntary resignation, his or her options, restricted stock units and stock appreciation rights, if any, will vest fully and become immediately exercisable, all restrictions on his or her restricted stock will lapse, and all performance goals or other vesting requirements for his or her performance shares and units will be deemed achieved at 100% of target levels, and all other terms and conditions met.
Amendment, Termination. The administrator will have the authority to amend, suspend or terminate the 2014 Plan, provided such action does not impair the existing rights of any participant. Our 2014 Plan will automatically terminate in 2024, unless we terminate it sooner.
Amended and Restated 2010 Stock Option Plan
Our board of directors adopted, and our stockholders approved, our 2010 Plan, in July 2010. Our 2010 Plan was most recently amended by our board of directors in December 2013 and approved by our stockholders in December 2013. Our 2010 Plan provides for the grant of incentive stock options to our employees and to the employees of any parent or subsidiary corporation, and for the grant of nonstatutory stock options and restricted stock awards to our employees, directors and consultants and to the employees and consultants of any parent or subsidiary corporation. Following the completion of this offering, no additional awards will be granted under the 2010 Plan. However, the 2010 Plan will continue to govern the terms and conditions of the outstanding stock options and restricted stock previously granted under the 2010 Plan.
Authorized Shares. As of June 30, 2014, there are 947,367 shares of our common stock reserved for issuance under our 2010 Plan. As of June 30, 2014, 113,085 shares of our common stock have been issued at a purchase price of $1.22 per share, 150 shares of our common stock have been issued at a purchase price of $1.77 per share, and options to purchase 588,132 shares of our common stock were outstanding at a weighted-average exercise price of $3.49 per share.
Administration. Our board of directors, or a committee thereof appointed by our board of directors, administers our 2010 Plan and the awards granted under it. Subject to the provisions of our 2010 Plan, the administrator has the power to determine the terms of awards, including the recipients, the exercise price, the number of shares subject to each award, the fair market value of a share of our common stock, the vesting schedule applicable to the awards, and any vesting acceleration. The administrator also has the authority, subject to the terms of the 2010 Plan, to prescribe rules and to construe and interpret the 2010 Plan and awards granted thereunder, to institute an exchange program by which outstanding awards may be surrendered in exchange for awards that may have different exercise prices and terms, and to amend existing awards.
Options. The maximum permitted term of options granted under the 2010 Plan is 10 years. However, the maximum permitted term of options granted to 10% shareholders under the 2010 Plan is five years. The standard
-112-
Table of Contents
vesting schedule of the options under the 2010 Plan provides that 10% of the shares subject to the option vest on the one year anniversary of the vesting commencement date, 20% of the shares subject to the option vest in 12 equal monthly installments beginning on the one-year anniversary of the vesting commencement date, 30% of the shares subject to the option vest in 12 equal monthly installments beginning on the second-year anniversary of the vesting commencement date, and 40% of the shares subject to the option vest in 12 equal monthly installments beginning on the third-year anniversary of the vesting commencement date, in each case subject to the recipient’s continued employment through such vesting dates. After the termination of service of an employee, director or consultant, he or she may exercise his or her option for the period of time stated in his or her award agreement. Generally, if termination is due to death or disability, the option will remain exercisable for 12 months. In all other cases, the option will generally remain exercisable for three months following the termination of service. However, in no event may an option be exercised later than the expiration of its term. Unless the administrator provides otherwise, our 2010 Plan generally does not allow for the transfer of options, and only the recipient of an option may exercise an option during his or her lifetime.
Restricted Stock. Restricted stock was granted under our 2010 Plan. Restricted stock awards were grants of shares of our common stock that vest in accordance with terms and conditions established by the administrator. The administrator determined the number of shares of restricted stock granted to any employee, director or consultant and, subject to the provisions of our 2010 Plan, determined the terms and conditions of such awards. The administrator may have imposed whatever conditions to vesting it determined to be appropriate (for example, the administrator may have set restrictions based on the achievement of specific performance goals or continued service to us); provided, however, that the administrator, in its sole discretion, may accelerate the time at which any restrictions will lapse or be removed. The standard vesting schedule imposed by the administrator for the restricted stock awards under the 2010 Plan provides that 25% of the shares of restricted stock shall be released from the repurchase option on the one year anniversary of the vesting commencement date, and the remaining 75% of the shares of restricted stock shall be released from the repurchase option in 36 equal monthly installments thereafter on the corresponding day of each month, in each case subject to the recipient’s continued employment through such vesting dates. Recipients of restricted stock awards generally have voting and dividend rights with respect to such shares upon grant without regard to vesting, unless the administrator provided otherwise. Shares of restricted stock that do not vest are subject to our right of repurchase or forfeiture.
Certain Adjustments. In the event of certain changes in our capitalization, to prevent diminution or enlargement of the benefits or potential benefits available under the 2010 Plan, the administrator will make proportionate adjustments to the exercise price or the number or type of shares covered by each option.
Change in Control. Our 2010 Plan provides that, in the event of a “merger” or “change in control” (as defined under the 2010 Plan), each outstanding award will be treated as the administrator determines, except that, if a successor corporation does not assume or substitute for any outstanding award, then such award will fully vest and such award will become fully exercisable, if applicable, for a specified period prior to the transaction. The award will then terminate upon the expiration of the specified period of time.
Our board of directors has the authority to amend the 2010 Plan, provided such action does not impair the existing rights of any participant.
401(k) Plan
We maintain a tax-qualified retirement plan that provides eligible employees with an opportunity to save for retirement on a tax advantaged basis. All participants’ interests in their deferrals are 100% vested when contributed. In fiscal 2013, we made no matching contributions into the 401(k) plan. Pre-tax contributions are allocated to each participant’s individual account and are then invested in selected investment alternatives according to the participant’s directions. The 401(k) plan is intended to qualify under Section 401(a) of the Code. As a tax-qualified retirement plan, contributions to the 401(k) plan and earnings on those contributions are not taxable to the employees until distributed from the 401(k) plan, and all contributions are deductible by us when made.
-113-
Table of Contents
Limitation of Liability and Indemnification
Our amended and restated certificate of incorporation, which we will adopt prior to the closing of this offering, contains provisions that limit the liability of our directors for monetary damages to the fullest extent permitted by Delaware law. Consequently, our directors will not be personally liable to us or our stockholders for monetary damages for any breach of fiduciary duties as directors, except liability for:
| • | any breach of the director’s duty of loyalty to us or our stockholders; |
| • | any act or omission not in good faith or that involves intentional misconduct or a knowing violation of law; |
| • | unlawful payments of dividends or unlawful stock repurchases or redemptions as provided in Section 174 of the Delaware General Corporation Law; or |
| • | any transaction from which the director derived an improper personal benefit. |
Our amended and restated bylaws, to be effective upon the completion of this offering, provide that we are required to indemnify our directors and officers to the fullest extent permitted by Delaware law. Our amended and restated bylaws, to be effective upon the completion of this offering, also provide that we are obligated to advance expenses incurred by a director or officer in advance of the final disposition of any action or proceeding and permit us to secure insurance on behalf of any officer, director, employee or other agent for any liability arising out of his or her actions in that capacity, regardless of whether we would otherwise be permitted to indemnify him or her under the provisions of Delaware law. We have entered into, and expect to continue to enter into, agreements to indemnify our directors, executive officers and other employees as determined by our board of directors. With specified exceptions, these agreements provide for indemnification for related expenses including, among other things, attorneys’ fees, judgments, fines and settlement amounts incurred by any of these individuals in any action or proceeding. We believe that these bylaw provisions and indemnification agreements are necessary to attract and retain qualified persons as members of our board of directors and officers and potentially in other roles with our company. We also maintain directors’ and officers’ liability insurance.
The limitation of liability and indemnification provisions in our amended and restated certificate of incorporation and amended and restated bylaws, which we will adopt prior to the closing of this offering, may discourage stockholders from bringing a lawsuit against our directors and officers for breach of their fiduciary duty. They may also reduce the likelihood of derivative litigation against our directors and officers, even though an action, if successful, might benefit us and other stockholders. Further, a stockholder’s investment may be adversely affected to the extent that we pay the costs of settlement and damage awards against directors and officers as required by these indemnification provisions. At present, there is no pending litigation or proceeding involving any of our directors, officers or employees for which indemnification is sought, and we are not aware of any threatened litigation that may result in claims for indemnification.
-114-
Table of Contents
CERTAIN RELATIONSHIPS AND RELATED PARTY TRANSACTIONS
The following is a description of transactions since January 1, 2011 to which we have been a party, in which the amount involved in the transaction exceeds $120,000, and in which any of our directors, executive officers, beneficial owners of more than 5% of our capital stock, or any immediate family member of or person sharing the household with any of these individuals, had or will have a direct or indirect material interest, other than compensation, termination and change of control arrangements that are described under the section titled “Executive Compensation” in this prospectus or that were approved by our Compensation Committee. We believe the terms obtained or consideration that we paid or received, as applicable, in connection with the transactions described below were comparable to terms available or the amounts that would be paid or received, as applicable, in arm’s-length transactions. All share numbers included below give effect to the 6.099-for-one reverse stock split of our capital stock on October 24, 2014.
Sales of Securities
Series A Preferred Stock
In October 2010 and in subsequent closings in November 2010, we issued 115,997 shares of our Series A preferred stock at a purchase price of $6.10 per share. In a subsequent closing in September 2011, we issued 1,779,343 shares of our Series A preferred stock at a purchase price of $6.10 per share upon the conversion of convertible promissory notes with an aggregate principal amount and accrued interest of $10,852,249. In addition, in December 2011 and in subsequent closings in January 2012 and February 2012, we issued an aggregate of 925,841 shares of Series A preferred stock at a purchase price of $6.10 per share. The aggregate consideration we received in connection with the issuance of shares of our Series A preferred stock was $17,206,508. Upon the consummation of this offering, each share of preferred stock will convert into one share of our common stock. The following table sets forth the names of our directors, executive officers and holders of more than 5% of our capital stock who participated in the Series A preferred stock financing.
| Name of Stockholder |
Shares of Series A Preferred Stock |
Aggregate Purchase Price |
||||||
| Entities affiliated with Austin Ventures(1) |
1,246,370 | $ | 7,601,628 | |||||
| John T. McDonald |
373,911 | 2,280,488 | ||||||
| ESW Capital LLC |
328,199 | 2,001,690 | ||||||
| (1) | Includes 747,822 shares of Series A preferred stock issued to Austin Ventures X, L.P. and 498,548 shares of Series A preferred stock issued to Austin Ventures IX, L.P. |
Series B Preferred Stock
In January 2012 and in subsequent closings in February 2012, we issued an aggregate of 1,701,909 shares of our Series B preferred stock at a purchase price of $6.10 per share for aggregate consideration of $10,380,000. Upon the consummation of this offering, each share of preferred stock will convert into one share of our common stock. The following table sets forth the names of our directors, executive officers and holders of more than 5% of our capital stock who participated in the Series B preferred stock financing.
| Name of Stockholder |
Shares of Series B Preferred Stock |
Aggregate Purchase Price |
||||||
| Entities affiliated with Austin Ventures(1) |
638,810 | $ | 3,896,105 | |||||
| Entities affiliated with John T. McDonald(2) |
175,161 | 1,068,311 | ||||||
| ESW Capital LLC |
245,941 | 1,500,000 | ||||||
| (1) | Includes 383,286 shares of Series B preferred stock issued to Austin Ventures X, L.P. and 255,524 shares of Series B preferred stock issued to Austin Ventures IX, L.P. |
-115-
Table of Contents
| (2) | Includes 163,961 shares of Series B preferred stock issued to MLPF&S as Cust. FBO John T. McDonald IRRA and 11,200 shares of Series B preferred stock issued to John T. McDonald. |
Promissory Notes
In February 2012, we issued a promissory note in the aggregate principal amount of $1,500,000 to John T. McDonald. This promissory note had a maturity date in August 2012 and accrued interest at a rate of 6% per annum. All unpaid principal and interest were paid in August 2012.
In November 2012, we issued a promissory note in the aggregate principal amount of $1,500,000 to John T. McDonald. This promissory note had a maturity date in May 2013 and accrued interest at 6% per annum. We prepaid $1,200,000 of this note in December 2012, then borrowed $1,000,000 in January 2013 and paid the note and all accrued interest in full and cancelled it in April 2013.
In addition, in November 2012, we issued a subordinated promissory note in the aggregate principal amount of $600,000 to Joseph Larscheid in connection with our acquisition of EPM Live. This promissory note matures in November 2014. No interest accrues on this promissory note.
Convertible Debt Financing
In September 2013 and in subsequent closings in November and December 2013, we issued an aggregate principal amount of $4,887,099 in convertible promissory notes. These promissory notes accrued interest at a rate of 5% per annum. All of the convertible promissory notes issued in such financing were converted into shares of Series C preferred stock in December 2013 in connection with the Series C preferred stock financing described below. The aggregate principal amount of the convertible promissory notes and aggregate accrued interest of $47,542 converted into shares of Series C preferred stock at a 20% discount to the purchase price paid for the Series C preferred stock by other investors in the Series C preferred stock financing. The following table sets forth the names of our directors, executive officers and holders of more than 5% of our capital stock who participated in the convertible debt financing.
| Name |
Principal Amount |
|||
| Entities affiliated with Activant Holdings(1) |
$ | 1,000,000 | ||
| Entities affiliated with Austin Ventures(2) |
1,750,000 | |||
| Entities affiliated with John T. McDonald(3) |
365,000 | |||
| ESW Capital LLC |
507,740 | |||
| (1) | Includes a convertible promissory note in the principal amount of $1,000,000 issued to Activant Investment II, LLC. |
| (2) | Includes a convertible promissory note in the principal amount of $1,050,000 issued to Austin Ventures X, L.P. and a convertible promissory note in the principal amount of $700,000 issued to Austin Ventures IX, L.P. |
| (3) | Includes a convertible promissory note in the principal amount of $365,000 issued to MLPF&S as Cust. FBO John T. McDonald IRRA. |
Series C Preferred Stock
In December 2013, we issued an aggregate of 1,356,189 shares of our Series C preferred stock at a purchase price of $10.98 per share. In addition, convertible promissory notes with an aggregate principal amount of $4,887,099 and accrued interest of $47,542 converted into 561,859 shares of our Series C preferred stock at a price of $8.78 per share. The aggregate purchase price we received in connection with the financing was $19,823,207. Upon the consummation of this offering, each share of preferred stock will convert into one share
-116-
Table of Contents
of our common stock. The following table sets forth the names of our directors, executive officers or holders of more than 5% of our capital stock who participated in the Series C preferred stock financing.
| Name of Stockholder |
Shares of Series C Preferred Stock |
Aggregate Purchase Price |
||||||
| Entities affiliated with Activant Holdings(1) |
729,854 | $ | 7,759,997 | |||||
| Entities affiliated with Austin Ventures(2) |
201,250 | $ | 1,767,499 | |||||
| Entities affiliated with John T. McDonald(3) |
79,777 | $ | 783,648 | |||||
| ESW Capital LLC(4) |
195,024 | $ | 2,012,817 | |||||
| (1) | Includes 337,031 and 277,823 shares of Series C preferred stock issued in exchange for cash to Activant Holdings I, LP and Activant Holdings II, LP, respectively, and 115,000 shares of Series C preferred stock to Activant Investment II, LLC in connection with the conversion of a convertible promissory note. |
| (2) | Includes 120,750 and 80,500 shares of Series C preferred stock issued to Austin Ventures X, L.P. and Austin Ventures IX, L.P., respectively, in connection with the conversion of convertible promissory notes. |
| (3) | Includes 37,802 shares of Series C preferred stock issued in exchange for cash and 41,975 shares of Series C preferred stock issued in connection with the conversion of a convertible promissory note, in each case to MLPF&S as Cust. FBO John T. McDonald IRRA. |
| (4) | Includes 136,634 shares of Series C preferred stock issued in exchange for cash and 58,390 shares of Series C preferred stock issued in connection with the conversion of a convertible promissory note. |
Stockholder Agreements
In December 2013, in connection with our Series C preferred stock financing, we entered into an Amended and Restated Investors’ Rights Agreement, or the Rights Agreement, an Amended and Restated Right of First Refusal and Co-Sale Agreement, or the ROFR Agreement, and an Amended and Restated Voting Agreement, or the Voting Agreement, with certain holders of our preferred stock and certain holders of our common stock to collectively provide for, among other things, voting rights and obligations, information rights, rights of first refusal and registration rights. The following directors, executive officers and holders of more than 5% of our capital stock and their affiliates are parties to these agreements:
| • | Entities affiliated with Austin Ventures; |
| • | Entities affiliated with Activant Holdings; |
| • | John T. McDonald and affiliated entities; and |
| • | ESW Capital LLC. |
The ROFR Agreement, the Voting Agreement and portions of the Rights Agreement will terminate upon the closing of this offering. See “Management—Structure of the Board of Directors” for information regarding the provisions related to the election of our directors that will terminate in connection with this offering. The registration rights granted to the holders of our outstanding preferred stock, including certain of our directors, executive officers, beneficial owners of more than 5% of our capital stock and immediate family members of these individuals under the terms of the Rights Agreement will continue following the closing of this offering. As of June 30, 2014, the holders of 6,834,476 shares of our common stock that are issuable upon the conversion of our preferred stock are entitled to rights with respect to the registration of these shares following the closing of this offering. For a more detailed description of these registration rights, see “Description of Capital Stock—Registration Rights.”
-117-
Table of Contents
Technology Services Agreement
We receive outsourced software development, automated testing and technology services from DevFactory FZ-LLC, or DevFactory, under an Amended & Restated Technology Services Agreement dated as of January 1, 2014. DevFactory is an affiliate of ESW Capital LLC, which holds more than 5% of our capital stock. We paid approximately $2.1 million and $1.0 million to DevFactory for such services pursuant to the terms of the contract in 2013 and 2012, respectively. In January 2014, in connection with the Amended & Restated Technology Services Agreement, we issued 1,803,574 shares of common stock to DevFactory at a purchase price of $0.0001 per share for an aggregate purchase price of $1,100 and recorded a one-time non-cash accounting charge of $11.2 million. We have an outstanding purchase commitment for additional software development services from DevFactory in 2014 in the amount of $2.1 million. For years after 2014, the purchase commitment amount for software development services will be equal to the prior year purchase commitment increased (decreased) by the percentage change in total revenue for the prior year as compared to the preceding year. For example, if 2014 total revenues increase by 10% as compared to 2013 total revenues, then the 2015 purchase commitment would increase by approximately $213,175 from the 2014 purchase commitment amount to $2,344,925. A similar 10% increase in 2015 total revenues as compared to 2014 total revenues would increase the 2016 purchase commitment amount from the 2015 purchase commitment amount of $2,344,925 by approximately $234,493 to $2,579,418.
Participation in this Offering
Certain of our existing stockholders, including John T. McDonald, our Chief Executive Officer and chairman of our board of directors, entities associated with Austin Ventures, each of which is an affiliate of a member of our board of directors, and ESW Capital, LLC or its affiliates, have indicated an interest in purchasing shares of common stock with an aggregate purchase price of up to $5.0 million, or up to 10% of the proposed offering size based on an assumed initial public offering price of $13.00 per share, the midpoint of the price range set forth on the cover page of this prospectus. However, because indications of interest are not binding agreements or commitments to purchase, the underwriters may determine to sell more, less or no shares in this offering to such stockholders, or such stockholders may determine to purchase more, less or no shares in this offering. The underwriters will receive the same discount from shares of our common stock purchased by such stockholders as they will from other shares of our common stock sold to the public in this offering. Any shares purchased by these potential investors will be subject to the lock-up restrictions described in “Underwriting.”
Other
For a description of other relationships we have with our directors and executive officers, see sections titled “Management” and “Executive Compensation” in this prospectus.
Equity Awards
We granted the following equity awards to certain executive officers since January 1, 2011:
| • | In October 2012, we issued and sold to Michael D. Hill 113,085 shares of our common stock subject to vesting restrictions at a purchase price of $1.22. In September 2014, we amended the restricted stock and option agreements with Mr. Hill to provide for accelerated vesting in the event of Mr. Hill’s termination upon a change of control of our company. |
| • | In March 2014, we granted Ludwig Melik an option to purchase 24,594 shares of our common stock at an exercise price of $6.23 per share. In September 2014, we amended the option agreements with Mr. Melik to provide for accelerated vesting in the event of Mr. Melik’s termination upon a change of control of our company. |
| • | In March 2014, we granted Robert V. Housley an option to purchase 32,792 shares of our common stock at an exercise price of $6.23 per share. In September 2014, we amended the option agreement |
-118-
Table of Contents
| with Mr. Housley to provide for accelerated vesting in the event of Mr. Housley’s termination upon a change of control of our company. |
| • | In September 2014, we granted Maysoon Al-Hasso an option to purchase 20,495 shares of our common stock at an exercise price of $8.73 per share. |
| • | In September 2014, we granted Angie McDermott an option to purchase 20,495 shares of our common stock at an exercise price of $8.73 per share. |
| • | In September 2014, we granted Timothy W. Mattox an option to purchase 65,584 shares of our common stock at an exercise price of $8.73 per share. |
| • | In September 2014, we granted to John T. McDonald 171,040 shares of our common stock subject to vesting restrictions at a price of $8.73. |
| • | In September 2014, we granted to R. Brian Henley 40,990 shares of our common stock subject to vesting restrictions at a price of $8.73. In September 2014, we amended the option agreements with Mr. Henley to provide for accelerated vesting in the event of Mr. Henley’s termination upon a change of control of our company. |
| • | In September 2014, we granted to Timothy W. Mattox 81,980 shares of our common stock subject to vesting restrictions at a price of $8.73. |
In addition, upon the effectiveness of this registration statement, each non-employee director will receive a restricted stock grant entitling the director to receive that number of shares of our common stock equal to $125,000, or $0.5 million in aggregate, divided by the initial public offering price per share.
Policies and Procedures for Related Party Transactions
In connection with this offering, our board of directors will adopt a written related party transaction policy setting forth the policies and procedures for the review and approval of related party transactions. The policy will cover transactions between us and related persons in which the aggregate amount involved exceeds or may be expected to exceed $120,000 and in which a related person has or will have a direct or indirect material interest. For purposes of this policy, a related person will be defined as a director, executive officer, nominee for director, or a greater than 5% beneficial owner of our common stock, in each case since the beginning of the most recently completed fiscal year, and any immediate family member of or person sharing a household with any of these individuals. All related party transactions must be presented to the Audit Committee for review, consideration and approval. In approving or rejecting any such proposed transaction, the Audit Committee is to consider the material facts of the transaction, including whether the transaction is on terms no less favorable than terms generally available to an unaffiliated third party under the same or similar circumstances and the extent of the related party’s interest in the transaction.
All related party transactions described in this section were not subject to the approval and review procedures set forth in the policy.
-119-
Table of Contents
The following table sets forth the beneficial ownership of our common stock as of September 30, 2014 by:
| • | each person, or group of affiliated persons, who is known by us to beneficially own more than 5% of our common stock, on an as-converted basis; |
| • | each of our named executive officers; |
| • | each of our directors; and |
| • | all of our executive officers and directors as a group. |
We have determined beneficial ownership in accordance with the rules of the SEC. These rules generally attribute beneficial ownership of securities to persons who possess sole or shared voting power or investment power with respect to those securities. In addition, the rules include shares of common stock issuable pursuant to the exercise of stock options that are either immediately exercisable or exercisable within 60 days of September 30, 2014. These shares are deemed to be outstanding and beneficially owned by the person holding the applicable options for the purpose of computing the percentage ownership of that person, but they are not treated as outstanding for the purpose of computing the percentage ownership of any other person. Unless otherwise indicated, the persons or entities identified in this table have sole voting and investment power with respect to all shares shown as beneficially owned by them, subject to applicable community property laws.
Certain of our existing stockholders, including John T. McDonald, our Chief Executive Officer and chairman of our board of directors, entities associated with Austin Ventures, each of which is an affiliate of a member of our board of directors, and ESW Capital, LLC or its affiliates, have indicated an interest in purchasing shares of common stock with an aggregate purchase price of up to $5.0 million, or up to 10% of the proposed offering size based on an assumed initial public offering price of $13.00 per share, the midpoint of the price range set forth on the cover page of this prospectus. However, because indications of interest are not binding agreements or commitments to purchase, the underwriters may determine to sell more, less or no shares in this offering to such stockholders, or such stockholders may determine to purchase more, less or no shares in this offering. The underwriters will receive the same discount from shares of our common stock purchased by such stockholders as they will from other shares of our common stock sold to the public in this offering. Any shares purchased by these potential investors will be subject to the lock-up restrictions described in “Underwriting.”
The percentage of shares beneficially owned before the offering shown in the table is based upon 10,783,692 shares of common stock outstanding as of September 30, 2014, after giving effect to a 6.099-for-one reverse stock split of our capital stock that occurred on October 24, 2014 and the conversion of all of our outstanding preferred stock into 6,834,476 shares of common stock, which will occur upon the closing of this offering. The information relating to numbers and percentages of shares beneficially owned after the offering assumes no exercise of the underwriters’ option to purchase additional shares.
-120-
Table of Contents
Except as otherwise noted below, the address for persons listed in the table is c/o Upland Software, Inc., 401 Congress Avenue, Suite 1850, Austin, Texas 78701.
| Shares Beneficially Owned |
Percentage of Shares Beneficially Owned |
|||||||||||
| Name of Beneficial Owner |
Before Offering |
After Offering |
||||||||||
| 5% Stockholders: |
||||||||||||
| Entities affiliates with Austin Ventures(1)(8) |
2,086,430 | 19.3 | % | 14.3 | % | |||||||
| Entities affiliated with Activant Holdings(2) |
729,854 | 6.8 | % | 5.0 | % | |||||||
| Entities affiliated with ESW Capital LLC(3)(8) |
2,572,738 | 23.9 | % | 17.6 | % | |||||||
| Named Executive Officers and Directors: |
||||||||||||
| John T. McDonald(4)(8) |
1,940,854 | 18.0 | % | 13.3 | % | |||||||
| R. Brian Henley(5) |
54,106 | * | * | % | ||||||||
| Ludwig Melik(6) |
14,167 | * | * | % | ||||||||
| John D. Thornton(1)(8)(9) |
2,086,430 | 19.3 | % | 14.3 | % | |||||||
| Steven Sarracino(2)(9) |
729,854 | 6.8 | % | 5.0 | % | |||||||
| Rodney C. Favaron(9) |
— | * | * | |||||||||
| Stephen E. Courter(9) |
— | * | * | |||||||||
| All executive officers and directors as a group (16 persons)(7)(8)(9) |
5,175,711 | 48.0 | % | 35.4 | % | |||||||
| * | Represents beneficial ownership of less than 1% of the outstanding common stock. |
| (1) | Includes 834,572 shares held by Austin Ventures IX, L.P., or AV IX, and 1,251,858 shares held by Austin Ventures X, L.P., or AV X. AV Partners IX, L.P., or AVP IX LP, the general partner of AV IX, and AV Partners IX, LLC, or AVP IX LLC, the general partner AVP IX LP, may be deemed to share voting and dispositive powers over the shares held by AV IX. AV Partners X, L.P., or AVP X LP, the general partner of AV X, and AV Partners X, LLC, or AVP X LLC, the general partner of AVP X LP, may be deemed to share voting and dispositive powers over shares held by AV X. Joseph C. Aragona, Kenneth P. DeAngelis, John D. Thornton, Christopher A. Pacitti and Philip S. Siegel are members of or are associated with AVP IX LLC and AVP X LLC and may be deemed to share voting and dispositive power over the shares held by AV IX and AV X. Such persons and entities disclaim beneficial ownership of shares held by AV IX and AV X, except to the extent of any pecuniary interest therein. Mr. Thornton is a member of our board of directors. The address of each of AV IX and AV X is 300 West 6th Street, Suite 2300, Austin, Texas 78701. |
| (2) | Includes 337,031 shares held by Activant Holdings I, LP, 277,823 shares held by Activant Holdings II, LP, and 115,000 shares held by Activant Investment II, LLC. The general partner of Activant Holdings I, L.P. is Activant Capital Group, LLC. The general partner of Activant Holdings II, LP is Activant Capital Group, LLC. The manager of Activant Capital Group, LLC is Steven Sarracino. The address for Activant Investment II, LLC, Activant Holdings I, LP and Activant Holdings II, LP is 115 E. Putnam Ave., 3rd Floor, Greenwich, Connecticut 06830. |
| (3) | Includes 769,164 shares held by ESW Capital LLC and 1,803,574 shares held by DevFactory FZ-LLC. ESW Capital LLC may be deemed to indirectly beneficially own the shares held by DevFactory FZ-LLC. DevFactory FZ-LLC has proposed to transfer all such shares held by it to Acorn Performance Group, Inc., an affiliate of both DevFactory FZ-LLC and ESW Capital LLC, effective immediately prior to the effectiveness of the registration statement, of which this prospectus forms a part. The address for ESW Capital LLC is 401 Congress Ave., Suite 2650, Austin, TX 78701. The address for DevFactory FZ-LLC is 705-706 Al Thuraya Tower No. 1, Seventh Floor, Dubai Media City, P.O. Box 502091, Dubai, 43659 United Arab Emirates. |
| (4) | Includes 243,738 shares held by MLPF&S as Cust. FBO John McDonald IRRA. John T. McDonald may be deemed to indirectly beneficially own the shares held by MLPF&S as Cust. FBO John McDonald IRRA. The address for MLPF&S as Cust. FBO John McDonald IRRA is Merrill Lynch Private Banking & Investment Group, 2 World Financial Center, 35th Floor, New York, New York 10281. |
-121-
Table of Contents
| (5) | Includes 13,116 shares issuable upon the exercise of options by Mr. Henley that are exercisable within 60 days of September 30, 2014. |
| (6) | Includes 14,167 shares issuable upon the exercise of options by Mr. Melik that are exercisable within 60 days of September 30, 2014. |
| (7) | Includes 72,510 shares in aggregate issuable upon the exercise of options that are exercisable within 60 days of September 30, 2014. |
| (8) | Certain of our existing stockholders, including John T. McDonald, our Chief Executive Officer and chairman of our board of directors, entities associated with Austin Ventures, each of which is an affiliate of a member of our board of directors, and ESW Capital, LLC or its affiliates, have indicated an interest in purchasing shares of common stock with an aggregate purchase price of up to $5.0 million in this offering, or up to 10% of the proposed offering size based on an assumed initial public offering price of $13.00 per share, the midpoint of the price range set forth on the cover page of this prospectus. However, because indications of interest are not binding agreements or commitments to purchase, the underwriters may determine to sell more, less or no shares in this offering to such stockholders, or such stockholders may determine to purchase more, less or no shares in this offering. Assuming an initial public offering price of $13.00, which is the midpoint of the price range set forth on the front cover page of this prospectus, if such stockholders were to purchase the entire $5.0 million of our common stock, they would purchase an aggregate of 384,615 shares of our common stock in this offering. Assuming the purchase of all of these shares by such stockholders and no exercise by the underwriters of their option to purchase additional shares, the percentage of common stock beneficially owned or controlled by our executive officers, principal stockholders and their affiliates would increase by 2.6%. If such stockholders were to purchase all of these shares and assuming the issuance of an aggregate of 38,460 shares of restricted common stock to our non-employee directors in connection with grants made as of the effectiveness of this registration statement, assuming an initial offering price of $13.00 per share, which is the midpoint of the price range set forth on the front cover page of this prospectus, and assuming no exercise by the underwriters of their option to purchase additional shares, our executive officers, principal stockholders and their affiliates will beneficially own or control, in the aggregate, approximately 55.7% our outstanding shares of common stock upon completion of this offering. |
| (9) | Does not include the number of shares of our common stock to which such non-employee director will be entitled upon the effective date of the registration statement of which this prospectus forms a part, pursuant to a restricted stock grant entitling each such director to receive number of shares of our common stock equal to $125,000, or $0.5 million in aggregate, divided by the initial public offering price per share. |
-122-
Table of Contents
General
The following descriptions of our capital stock and certain provisions of our amended and restated certificate of incorporation and amended and restated bylaws are summaries of such documents. Copies of these documents have been filed with the SEC as exhibits to our registration statement, of which this prospectus forms a part. The descriptions of our common stock and preferred stock reflect changes to our capital structure that we expect to occur prior to the closing of this offering.
Our amended and restated certificate of incorporation, to be effective prior to the closing of this offering, will authorize us to issue up to 50,000,000 shares of common stock, $0.0001 par value per share, and up to 5,000,000 shares of preferred stock, $0.0001 par value per share.
Common Stock
As of June 30, 2014, we had 10,489,519 shares of common stock outstanding that were held of record by approximately 53 stockholders after giving effect to a 6.099-for-one reverse stock split of our capital stock that occurred on October 24, 2014 and the conversion of our preferred stock into 6,834,476 shares of common stock. After giving effect to a 6.099-for-one reverse stock split of our capital stock that occurred on October 24, 2014, and assuming the filing of our amended and restated certificate of incorporation and the conversion of our preferred stock into an aggregate of 6,834,476 shares of common stock prior to the closing of this offering, there will be 14,335,673 shares of our common stock outstanding immediately following the closing of this offering.
The holders of common stock are entitled to one vote per share on all matters to be voted upon by the stockholders. Subject to preferences that may be applicable to any outstanding preferred stock, the holders of common stock are entitled to receive ratably any dividends that may be declared from time to time by the board of directors out of funds legally available for that purpose. In the event of our liquidation, dissolution or winding up, the holders of common stock are entitled to share ratably in all assets remaining after payment of liabilities, subject to prior distribution rights of preferred stock then outstanding. The common stock has no preemptive or conversion rights or other subscription rights. There are no redemption or sinking fund provisions applicable to the common stock. The rights, preferences and privileges of holders of common stock are subject to and may be adversely affected by the rights of the holders of shares of any series of preferred stock that we may designate and issue in the future.
Preferred Stock
Under the terms of our certificate of incorporation that will become effective prior to the closing of this offering, our board of directors will have the authority, without action by our stockholders, to designate and issue up to 5,000,000 shares of preferred stock in one or more series. The board of directors may also designate the rights, preferences and privileges of each series of preferred stock, any or all of which may be greater than the rights of the common stock. It is not possible to state the actual effect of the issuance of any shares of preferred stock upon the rights of holders of the common stock until the board of directors determines the specific rights of the holders of the preferred stock. However, these effects might include:
| • | restricting dividends on the common stock; |
| • | diluting the voting power of the common stock; |
| • | impairing the liquidation rights of the common stock; and |
| • | delaying or preventing a change in control of our company without further action by our stockholders. |
We have no present plans to issue any shares of preferred stock.
-123-
Table of Contents
Options and Warrants
As of June 30, 2014, we had outstanding options to purchase an aggregate of 588,132 shares of common stock at a weighted-average exercise price of $3.49 per share.
In connection with this offering, our outstanding warrants to purchase shares of Series A and Series B preferred stock will be converted into warrants to purchase common stock and will remain outstanding. Following this offering, we will have outstanding warrants to purchase:
| • | 2,459 shares of our common stock at an exercise price of $1.77 per share, which warrant expires on November 6, 2015; |
| • | 19,675 shares of our common stock at an exercise price of $6.10 per share, which warrant expires on February 10, 2019; |
| • | 19,675 shares of our common stock at an exercise price of $6.10 per share, which warrant expires on March 5, 2019; and |
| • | 37,164 shares of our common stock at an exercise price of $6.10 per share, which warrant expires on April 11, 2020. |
Registration Rights
Pursuant to the terms of the Amended and Restated Investors’ Rights Agreement, or the Rights Agreement, between us and certain of our stockholders, including certain of our directors, officers and holders of 5% or more of our outstanding capital stock, who we refer to as “holders of registrable securities,” such holders of registrable securities are entitled to certain registration rights. The stockholders who are party to the Rights Agreement will hold an aggregate of approximately 6,834,476 shares, or approximately 47.7% of our common stock, outstanding upon completion of this offering. The registration rights described below will terminate upon the earlier of (i) three years following the closing of this offering and (ii) such date, on or after the closing of this offering, on which all registrable securities held by a particular stockholder may be immediately sold under Rule 144 during any 90-day period.
Demand Registration Rights. Holders of at least a majority of outstanding registrable securities may, on not more than two occasions, request that we register all or a portion of their shares of capital stock. Such request for registration must cover that number of shares with an aggregate offering price to the public of at least $25 million. We will not be required to effect a demand registration during the period beginning on the date of the filing of the registration statement of which this prospectus forms a part and ending on the date 180 days after the effective date of the registration statement. Depending on certain conditions, we may defer a demand registration for up to 90 days.
Piggyback Registration Rights. In connection with this offering, the holders of registrable securities were entitled to notice of this offering and to include their registrable securities in this offering. In the event that we propose to register any of our securities under the Securities Act, either for our account or for the account of our other security holders, the holders of registrable securities will be entitled to certain “piggyback” registration rights allowing the holder to include their shares in such registration, subject to certain marketing and other limitations. As a result, whenever we propose to file a registration statement under the Securities Act, other than with respect to a registration statement on Form S-4 or Form S-8, the holders of these shares are entitled to notice of the registration and have the right, subject to limitations that the underwriters may impose on the number of shares included in the registration, to include their shares in the registration.
Form S-3 Registration Rights. Any holder of registrable securities with demand registration rights may make a request that we register their shares on Form S-3 if we are qualified to file a registration statement on Form S-3 and if the aggregate price to the public is equal to or would exceed $1 million. We would not be required to effect more than two registrations on Form S-3 within any 12-month period.
-124-
Table of Contents
Registration Expenses. With specified exceptions, we are required to pay all expenses of registration (including fees and disbursements of one special counsel for holders of registrable securities), excluding underwriters’ discounts, commissions and stock transfer taxes.
Anti-takeover Effects of Delaware Law and Our Certificate of Incorporation and Bylaws
Our amended and restated certificate of incorporation and our amended and restated bylaws, each to be effective prior to the consummation of this offering, contain certain provisions that could have the effect of delaying, deferring or discouraging another party from acquiring control of us. These provisions and certain provisions of Delaware law, which are summarized below, are expected to discourage coercive takeover practices and inadequate takeover bids. These provisions are also designed, in part, to encourage persons seeking to acquire control of us to negotiate first with our board of directors. We believe that the benefits of increased protection of our potential ability to negotiate more favorable terms with an unfriendly or unsolicited acquirer outweigh the disadvantages of discouraging a proposal to acquire us.
Undesignated Preferred Stock
As discussed above, our board of directors has the ability to issue preferred stock with voting or other rights or preferences that could impede the success of any attempt to change control of us. These and other provisions may have the effect of deterring hostile takeovers or delaying changes in control or management of our company.
Limits on Ability of Stockholders to Act by Written Consent or Call a Special Meeting
Our amended and restated certificate of incorporation and amended and restated bylaws, each to be effective prior to the consummation of this offering, provide that our stockholders may not act by written consent, which may lengthen the amount of time required to take stockholder actions. As a result, a holder controlling a majority of our capital stock would not be able to amend our amended and restated bylaws or remove directors without holding a meeting of our stockholders called in accordance with our amended and restated bylaws.
In addition, our amended and restated bylaws, to be effective prior to the consummation of this offering, provide that special meetings of the stockholders may be called only by the chairperson of the board, our board of directors, the chief executive officer or, in the absence of a chief executive officer, our president. Stockholders may not call special meetings, which may delay the ability of our stockholders to force consideration of a proposal or for holders controlling a majority of our capital stock to take any action, including the removal of directors.
Requirements for Advance Notification of Stockholder Nominations and Proposals
Our amended and restated bylaws, to be effective prior to the consummation of this offering, establish advance notice procedures with respect to stockholder proposals and the nomination of candidates for election as directors, other than nominations made by or at the direction of our board of directors. These provisions may have the effect of precluding the conduct of certain business at a meeting if the proper procedures are not followed. These provisions may also discourage or deter a potential acquirer from conducting a solicitation of proxies to elect the acquirer’s own slate of directors or otherwise attempting to obtain control of our company.
Board Classification
Effective upon the consummation of this offering, our board of directors will be divided into three classes, one class of which is elected each year by our stockholders. The directors in each class will serve for a three-year term. For more information on the classified board, see “Management—Structure of the Board of Directors.” Our classified board may tend to discourage a third-party from making a tender offer or otherwise attempting to obtain control of us, because it generally makes it more difficult for stockholders to replace a majority of the directors.
-125-
Table of Contents
Election and Removal of Directors
Our amended and restated certificate of incorporation and amended and restated bylaws, each to be effective prior to the consummation of this offering, contain provisions that establish specific procedures for appointing and removing members of the board of directors. Under our amended and restated certificate of incorporation and amended and restated bylaws, vacancies and newly created directorships on the board of directors may be filled only by a majority of the directors then serving on the board if such directors constitute a majority of the whole board of directors. Under our amended and restated certificate of incorporation and amended and restated bylaws, directors may be removed by the stockholders only for cause.
No Cumulative Voting
Our amended and restated certificate of incorporation and amended and restated bylaws, each to be effective prior to the consummation of this offering, do not permit cumulative voting in the election of directors. Cumulative voting allows a stockholder to vote a portion or all of its shares for one or more candidates for seats on the board of directors. Without cumulative voting, a minority stockholder may not be able to affect the election of as many seats on our board of directors as the stockholder would be able to affect if cumulative voting were permitted. The absence of cumulative voting makes it more difficult for a minority stockholder to affect the election of a seat on our board of directors to influence our board’s decision regarding a takeover.
Amendment of Charter and Bylaw Provisions
The amendment of the above provisions of our amended and restated certificate of incorporation and amended and restated bylaws, to be effective prior to the consummation of this offering, requires approval by holders of at least two-thirds of our outstanding capital stock entitled to vote generally in the election of directors.
Delaware Anti-takeover Statute
We are subject to the provisions of Section 203 of the Delaware General Corporation Law regulating corporate takeovers. In general, Section 203 prohibits a publicly held Delaware corporation from engaging, under certain circumstances, in a business combination with an interested stockholder for a period of three years following the date the person became an interested stockholder unless:
| • | prior to the date of the transaction, our board of directors approved either the business combination or the transaction that resulted in the stockholder becoming an interested stockholder; |
| • | upon completion of the transaction that resulted in the stockholder becoming an interested stockholder, the interested stockholder owned at least 85% of the voting stock of the corporation outstanding at the time the transaction commenced, calculated as provided under Section 203; or |
| • | at or subsequent to the date of the transaction, the business combination is approved by our board of directors and authorized at an annual or special meeting of stockholders, and not by written consent, by the affirmative vote of at least two-thirds of the outstanding voting stock that is not owned by the interested stockholder. |
Generally, a business combination includes a merger, asset or stock sale or other transaction resulting in a financial benefit to the interested stockholder. An interested stockholder is a person who, together with affiliates and associates, owns or, within three years prior to the determination of interested stockholder status, did own 15% or more of a corporation’s outstanding voting stock. We expect the existence of this provision to have an anti-takeover effect with respect to transactions our board of directors does not approve in advance. We also anticipate that Section 203 may discourage attempts that might result in a premium over the market price for the shares of common stock held by stockholders.
-126-
Table of Contents
The provisions of Delaware law and the provisions of our amended and restated certificate of incorporation and amended and restated bylaws, each to be effective prior to the consummation of this offering, could have the effect of discouraging others from attempting hostile takeovers, and, as a consequence, they might also inhibit temporary fluctuations in the market price of our common stock that often result from actual or rumored hostile takeover attempts. These provisions might also have the effect of preventing changes in our management. It is possible that these provisions could make it more difficult to accomplish transactions that stockholders might otherwise deem to be in their best interests.
Transfer Agent and Registrar
Our transfer agent and registrar for our common stock is Computershare Trust Company, N.A. The transfer agent’s address is 250 Royall Street, Canton, MA 02021, and its telephone number is (800) 884-4225.
Listing
We have been approved to list our common stock on the NASDAQ Global Market under the trading symbol “UPLD.”
-127-
Table of Contents
SHARES ELIGIBLE FOR FUTURE SALE
Prior to this offering, no public market has existed for our common stock. Market sales of shares of our common stock after this offering and from time to time, and the availability of shares for future sale, may reduce the market price of our common stock. Sales of substantial amounts of our common stock, or the perception that these sales could occur, could adversely affect prevailing market prices for our common stock and could impair our future ability to obtain capital, especially through an offering of equity securities. As described below, only a limited number of shares of our common stock will be available for sale in the public market for a period of several months after closing of this offering due to contractual and legal restrictions on resale described below. Nevertheless, sales of a substantial number of shares of our common stock in the public market after such restrictions lapse, or the perception that those sales may occur, could adversely affect the prevailing market price of our common stock and impair our ability to raise equity capital.
Upon the closing of this offering, we will have outstanding an aggregate of 14,335,673 shares of common stock, assuming no exercise of the underwriters’ option to purchase additional shares and no exercise of outstanding options or warrants as of June 30, 2014. All of the shares sold in this offering will be freely tradable without restrictions or further registration under the Securities Act, unless held by our affiliates, as that term is defined under Rule 144 under the Securities Act, or subject to lock-up agreements as discussed below. The remaining shares of common stock outstanding upon the closing of this offering are restricted securities as defined in Rule 144. Restricted securities may be sold in the U.S. public market only if registered or if they qualify for an exemption from registration, including by reason of Rule 144 or Rule 701 under the Securities Act, which rules are summarized below. These remaining shares will generally become available for sale in the public market as follows:
| • | approximately 10,461,247 shares will be eligible for sale in the public market upon expiration of lock-up agreements 181 days after the date of this prospectus, subject in certain circumstances to the volume, manner of sale and other limitations of Rule 144 and Rule 701; and |
| • | approximately 10,489,519 shares will be eligible for sale from time to time thereafter upon expiration of their respective one-year holding periods. |
In addition, of the 588,132 shares of common stock that were subject to stock options outstanding as of June 30, 2014, options to purchase approximately 105,511 shares were vested as of June 30, 2014. In addition, 2,459 shares of common stock were issuable upon the exercise of warrants outstanding as of June 30, 2014. Shares issued upon the exercise of such warrants and vested options will be eligible for sale 181 days after the date of this prospectus.
Lock-Up Agreements
We, our directors, executive officers and the holders of approximately 96.3% of our outstanding capital stock immediately prior to this offering have entered into lock-up agreements with the underwriters prior to the commencement of this offering pursuant to which these persons or entities, with limited exceptions, for a period of 180 days after the date of this prospectus, may not, without the prior written consent of the representatives (i) offer, sell, contract to sell, pledge, grant any option to purchase, make any short sale or otherwise transfer or dispose of, directly or indirectly, or file or cause to be filed with the SEC a registration statement under the Securities Act relating to, any shares of our common stock or securities convertible into or exchangeable or exercisable for any shares of our common stock, or publicly disclose the intention to make any such offer, sale, pledge, disposition or filing, or (ii) enter into any swap or other agreement that transfers, in whole or in part, any of the economic consequences of ownership of our common stock or such other securities, whether any such transaction described in clause (i) or (ii) above is to be settled by delivery of common stock or such other securities, in cash or otherwise. This lock-up provision applies to common stock or other securities convertible into or exchangeable or exercisable for any shares of our common stock owned now or acquired later by the person or entity executing the agreement or for which the person or entity executing the agreement later acquires the power of disposition. See “Underwriting.”
-128-
Table of Contents
Rule 144
In general, under Rule 144 under the Securities Act, as currently in effect, beginning 90 days after the date of this prospectus, a person who is not one of our affiliates at any time during the three months preceding a sale, and who has beneficially owned shares of our common stock to be sold for at least six months, would be entitled to sell an unlimited number of shares of our common stock, provided current public information about us is available. In addition, under Rule 144, a person who is not one of our affiliates at any time during the three months preceding a sale, and who has beneficially owned the shares of our common stock to be sold for at least one year, would be entitled to sell an unlimited number of shares immediately upon the closing of this offering without regard to whether current public information about us is available. Beginning 90 days after the date of this prospectus, our affiliates who have beneficially owned shares of our common stock for at least six months are entitled to sell within any three-month period a number of shares that does not exceed the greater of:
| • | 1% of the number of shares of our common stock then outstanding, which will equal approximately 143,357 shares, based upon shares outstanding as of June 30, 2014, upon closing of this offering, assuming no exercise of the underwriters’ option to purchase additional shares; and |
| • | the average weekly trading volume of our common stock on the NASDAQ Global Market during the four calendar weeks preceding the filing of a notice on Form 144 with respect to the sale. |
Sales of restricted shares under Rule 144 by our affiliates are also subject to requirements regarding the manner of sale, notice and the availability of current public information about us. Rule 144 also provides that affiliates relying on Rule 144 to sell shares of our common stock that are not restricted shares must nonetheless comply with the same restrictions applicable to restricted shares, other than the holding period requirement.
Rule 701
In general, under Rule 701 under the Securities Act, as currently in effect, any of our employees, directors, officers, consultants or advisors who acquired common stock from us in connection with a written compensatory stock or option plan or other written agreement in compliance with Rule 701 before the effective date of the registration statement of which this prospectus is a part (to the extent such common stock is not subject to a lock-up agreement) are entitled to rely on Rule 701 to resell such shares beginning 90 days after we become subject to the public company reporting requirements of the Exchange Act, in reliance on Rule 144, but without compliance with the holding period requirements contained in Rule 144. Accordingly, subject to any applicable lock-up agreements, beginning 90 days after we become subject to the public company reporting requirements of the Exchange Act, under Rule 701 persons who are not our “affiliates,” as defined in Rule 144, may resell those shares without complying with the minimum holding period or public information requirements of Rule 144, and persons who are our “affiliates” may resell those shares without compliance with Rule 144’s minimum holding period requirements (subject to the terms of the lock-up agreement referred to below, if applicable).
Registration Rights
Upon the closing of this offering, the holders of 6,910,990 shares of our common stock, including the common stock issuable upon conversion of our preferred stock and the exercise of outstanding warrants to purchase our preferred stock, will have the right to require us to register their shares for resale under the Securities Act, beginning 180 days after the date of this prospectus. These registration rights are described in more detail under the section titled “Description of Capital Stock—Registration Rights.”
Registration of these shares for resale under the Securities Act would result in the shares becoming freely tradable without restriction under the Securities Act immediately upon the effectiveness of such registration. Any sales of securities by these stockholders could adversely affect the trading price of our common stock.
-129-
Table of Contents
Form S-8 Registration Statements
Following the closing of this offering, we intend to file one or more registration statements on Form S-8 under the Securities Act to register the shares of common stock issued or reserved for issuance under our equity incentive plans, including any equity incentive plans adopted in connection with this offering. Accordingly, shares registered under such registration statements will be available for sale in the open market, subject to vesting restrictions with us and the lock-up restrictions described above.
-130-
Table of Contents
MATERIAL U.S. FEDERAL TAX CONSIDERATIONS FOR NON-U.S. HOLDERS
The following is a summary of the material U.S. federal income and estate tax considerations relating to the ownership and disposition of our common stock acquired in this offering by a “non-U.S. holder” (as defined below), but does not purport to be a complete analysis of all the potential tax considerations relating thereto. For purposes of this discussion, the term “non-U.S. holder” means a beneficial owner of our common stock that is not, for U.S. federal income tax purposes, a partnership or:
| • | an individual who is a citizen or resident of the United States; |
| • | a corporation, or other entity treated as a corporation for U.S. federal income tax purposes, created or organized in or under the laws of the United States or of any political subdivision of the United States or otherwise treated as such for U.S. federal income tax purposes; |
| • | an estate the income of which is subject to U.S. federal income taxation regardless of its source; or |
| • | a trust, (i) if a court within the United States is able to exercise primary supervision over the administration of the trust and one or more U.S. persons (within the meaning of the Code (as defined below)) have authority to control all substantial decisions of the trust or (ii) the trust has a valid election in effect to be treated as a U.S. person under applicable U.S. Treasury Regulations. |
An individual may be deemed to be a resident alien for U.S. federal income tax purposes in any calendar year if the individual was present in the United States for at least 31 days in that calendar year and for an aggregate of at least 183 days during the three-year period ending with the current calendar year (and no relevant exception applies). For purposes of this calculation, all of the days present in the current year, one-third of the days present in the immediately preceding year and one-sixth of the days present in the second preceding year are counted.
This discussion is based on current provisions of the Code existing and proposed U.S. Treasury Regulations promulgated thereunder, current administrative rulings and judicial decisions, all as in effect as of the date of this prospectus and all of which are subject to change or to differing interpretation, possibly with retroactive effect. Any change could alter the tax consequences to non-U.S. holders described in this prospectus. We have not sought any ruling from the Internal Revenue Service (IRS) with respect to the statements made and the conclusions reached in the following summary, and there can be no assurance that the IRS or a court will agree with such statements and conclusions.
We assume in this discussion that each non-U.S. holder holds shares of our common stock as a “capital asset” within the meaning of Section 1221 of the Code (generally, property held for investment). This discussion does not address all aspects of U.S. federal income taxation that may be relevant to a particular non-U.S. holder in light of that non-U.S. holder’s individual circumstances, the potential application of the tax on net investment income, any aspects of state, local or non-U.S. taxes, or U.S. federal taxes other than income taxes (except to the limited extent set forth below). This discussion also does not consider any tax rules applicable in light of a non-U.S. holder’s specific facts or circumstances and does not address the special tax rules applicable to particular non-U.S. holders, such as:
| • | insurance companies; |
| • | tax-exempt organizations; |
| • | banks or other financial institutions; |
| • | brokers or dealers in securities or currencies; |
| • | traders in securities that elect to use a mark-to-market method of accounting for their securities holdings; |
| • | government agencies or instrumentalities; |
-131-
Table of Contents
| • | grantor trusts or other entities or arrangements treated as flow-through entities for U.S. federal income tax purposes; |
| • | pension plans; |
| • | controlled foreign corporations; |
| • | passive foreign investment companies; |
| • | corporations that accumulate earnings to avoid U.S. federal income tax; |
| • | persons subject to the alternative minimum tax; |
| • | persons deemed to sell our common stock under the constructive sale provisions of the Code; |
| • | persons that own, or are deemed to own, more than 5% of our capital stock (except to the extent specifically set forth below); |
| • | owners that hold our common stock as part of a straddle, hedge, conversion transaction, synthetic security or other integrated investment; and |
| • | U.S. expatriates and certain former citizens or long-term residents of the United States. |
In addition, this discussion does not address the tax treatment of partnerships or other entities or arrangements treated as partnerships for U.S. federal income tax purposes or persons who hold their common stock through partnerships or other such entities or arrangements. A partner in a partnership or other such entity that will hold our common stock should consult his, her or its own tax advisor regarding the tax consequences of the ownership and disposition of our common stock through a partnership or other such entity, as applicable.
Prospective investors should consult their tax advisors regarding the U.S. federal, state, local and non-U.S. income and other tax considerations of acquiring, holding and disposing of our common stock.
Dividends
If we pay distributions on our common stock, those distributions generally will constitute dividends for U.S. federal income tax purposes to the extent paid from our current or accumulated earnings and profits, as determined under U.S. federal income tax principles. If a distribution exceeds our current and accumulated earnings and profits, the excess will be treated as a tax-free return of the non-U.S. holder’s investment, up to such holder’s tax basis in the common stock. Any remaining excess will be treated as capital gain, subject to the tax treatment described below under the heading “—Gain on Disposition of Common Stock.”
Dividends paid to a non-U.S. holder generally will be subject to withholding of U.S. federal tax at a 30% rate or such lower rate as may be specified by an applicable income tax treaty between the United States and such holder’s country of residence. A non-U.S. holder of our common stock who claims the benefit of an applicable income tax treaty between the United States and such holder’s country of residence generally will be required to timely provide us with a properly executed IRS Form W-8BEN or IRS Form W-8BEN-E, as applicable (or an applicable successor form), and satisfy applicable certification and other requirements. Non-U.S. holders are urged to consult their tax advisors regarding their entitlement to benefits under a relevant income tax treaty. A non-U.S. holder that is eligible for a reduced rate of U.S. withholding tax under an income tax treaty may obtain a refund or credit of any excess amounts withheld from the IRS by timely filing an appropriate claim with the IRS. If the non-U.S. holder holds the stock through a financial institution or other agent acting on the non-U.S. holder’s behalf, the non-U.S. holder will be required to timely provide appropriate documentation to the agent, which then will be required to provide certification to us or our paying agent, either directly or through other intermediaries.
Dividends that are treated as effectively connected with a trade or business conducted by a non-U.S. holder within the United States, and, if an applicable income tax treaty so provides, that are attributable to a permanent
-132-
Table of Contents
establishment or a fixed base maintained by the non-U.S. holder within the United States, are generally exempt from the 30% withholding tax if the non-U.S. holder satisfies applicable certification requirements. To obtain this exemption, a non-U.S. holder must timely provide us with a properly executed original IRS Form W-8ECI (or an applicable successor form) properly certifying such exemption. However, such effectively connected income, or if an income tax treaty applies, such income that is attributable to a permanent establishment, net of specified deductions and credits, is taxed at the same graduated U.S. federal income tax rates applicable to U.S. persons (as defined in the Code). In addition, any effectively connected income or income that is attributable to a permanent establishment that is received by a non-U.S. holder that is a corporation may also, under certain circumstances, be subject to an additional “branch profits tax” at a 30% rate or such lower rate as may be specified by an applicable income tax treaty between the United States and such holder’s country of residence.
Gain on Disposition of Common Stock
Subject to the discussion below regarding FATCA, a non-U.S. holder generally will not be subject to U.S. federal income tax on gain recognized on a disposition of our common stock unless:
| • | the gain is effectively connected with the non-U.S. holder’s conduct of a trade or business in the United States, and, if an applicable income tax treaty so provides, the gain is attributable to a permanent establishment maintained by the non-U.S. holder in the United States (and the non-U.S. holder timely complies with applicable certification and other requirements to claim treaty benefits); in these cases, the non-U.S. holder will be taxed on a net income basis at graduated rates and in the manner applicable to U.S. persons, and, if the non-U.S. holder is a foreign corporation, an additional branch profits tax at a rate of 30%, or a lower rate as may be specified by an applicable income tax treaty, may also apply; |
| • | the non-U.S. holder is an individual present in the United States for 183 days or more in the taxable year of the disposition and certain other conditions are met, in which case the non-U.S. holder will be subject to a 30% tax (or such lower rate as may be specified by an applicable income tax treaty) on the net gain derived from the disposition; or |
| • | we are or have been, at any time during the five-year period preceding such disposition (or the non-U.S. holder’s holding period, if shorter) a “U.S. real property holding corporation,” unless our common stock is regularly traded on an established securities market and the non-U.S. holder held no more than five percent of our outstanding common stock, directly, indirectly or constructively, during the shorter of the five-year period ending on the date of the disposition or the period that the non-U.S. holder held our common stock. Generally, a corporation is a “U.S. real property holding corporation” if the fair market value of its “U.S. real property interests” equals or exceeds 50% of the sum of the fair market value of its worldwide real property interests plus its other assets used or held for use in a trade or business. We believe that we are not currently, and we do not anticipate becoming, a “U.S. real property holding corporation” for U.S. federal income tax purposes. |
Information Reporting and Backup Withholding Tax
We must report annually to the IRS and to each non-U.S. holder the gross amount of the distributions on our common stock paid to such holder and the tax withheld, if any, with respect to such distributions. Non-U.S. holders may have to comply with specific certification procedures to establish that the holder is not a U.S. person (as defined in the Code) in order to avoid backup withholding at the applicable rate, currently 28%, with respect to dividends on our common stock. Generally, a holder will comply with such procedures if it provides a properly executed IRS Form W-8BEN or IRS Form W-8BEN-E, as applicable (or an applicable successor form), or otherwise meets documentary evidence requirements for establishing that it is not a U.S. person (within the meaning of the Code), or otherwise establishes an exemption.
Information reporting and backup withholding generally will apply to the proceeds of a disposition of our common stock by a non-U.S. person effected by or through the U.S. office of any broker, U.S. or foreign, unless the holder certifies its status as a non-U.S. holder and satisfies certain other requirements, or otherwise
-133-
Table of Contents
establishes an exemption. Generally, information reporting and backup withholding will not apply to a payment of disposition proceeds to a non-U.S. holder where the transaction is effected outside the United States through a non-U.S. office of a broker. However, for information reporting purposes, dispositions effected through a non-U.S. office of a broker with substantial U.S. ownership or operations generally will be treated in a manner similar to dispositions effected through a U.S. office of a broker. Non-U.S. holders should consult their tax advisors regarding the application of the information reporting and backup withholding rules to them.
Copies of information returns may be made available to the tax authorities of the country in which the non-U.S. holder resides or is incorporated under the provisions of a specific treaty or agreement.
Backup withholding is not an additional tax. Any amounts withheld under the backup withholding rules from a payment to a non-U.S. holder can generally be refunded or credited against the non-U.S. holder’s U.S. federal income tax liability, if any, provided that an appropriate claim is timely filed with the IRS.
Foreign Account Tax Compliance Act
Sections 1471-1474 of the Code, U.S. Treasury Regulations promulgated thereunder and official IRS guidance, or FATCA, will impose a 30% withholding tax on any “withholdable payment” (as defined under FATCA) to (i) a “foreign financial institution” (as defined under FATCA), unless such institution enters into an agreement with the U.S. government to collect and provide to the U.S. tax authorities substantial information regarding U.S. account holders of such institution (which would include certain equity and debt holders of such institution, as well as certain account holders that are foreign entities with U.S. owners) or (ii) a foreign entity that is not a financial institution, unless such entity provides the withholding agent with a certification identifying the “substantial U.S. owners” (as defined under FATCA) of the entity, which generally includes any U.S. person who directly or indirectly owns more than 10% of the entity. The withholding tax described above will not apply if the foreign financial institution or non-financial foreign entity otherwise qualifies for an exemption from the rules and properly certifies its exempt status to a withholding agent. Under certain limited circumstances, a non-U.S. holder might be eligible for refunds or credits of such taxes.
“Withholdable payments” will include dividends on our common stock and the entire gross proceeds from the sale of our common stock. The withholding tax will apply regardless of whether the payment would otherwise be exempt from either U.S. nonresident or backup withholding tax, including under the other exemptions described above. This withholding will apply to dividends on our common stock made on or after July 1, 2014 and to the payment of gross proceeds from the sale or other disposition of our common stock made on or after January 1, 2017. An intergovernmental agreement between the United States and an applicable foreign country may modify the requirements described in this paragraph. Prospective investors are encouraged to consult with their tax advisors regarding the possible implications of this legislation on their investment in our common stock.
Federal Estate Tax
Common stock owned or treated as owned by an individual who is a non-U.S. holder (as specially defined for U.S. federal estate tax purposes) at the time of death will be included in the individual’s gross estate for U.S. federal estate tax purposes and, therefore, may be subject to U.S. federal estate tax, unless an applicable estate tax or other treaty provides otherwise.
Prospective investors should consult their tax advisors regarding the particular U.S. federal, state, local and non-U.S. tax consequences of purchasing, holding and disposing of our common stock, including the consequences of any proposed changes in applicable laws.
-134-
Table of Contents
The underwriters named below, for which William Blair & Company, L.L.C. and Raymond James & Associates, Inc. are acting as representatives, have severally agreed, subject to the terms and conditions set forth in the underwriting agreement by and among the underwriters and us, to purchase from us, the respective number of shares of common stock set forth opposite each underwriter’s name in the table below.
| Underwriter |
Number of Shares |
|||
| William Blair & Company, L.L.C. |
||||
| Raymond James & Associates, Inc. |
||||
| Canaccord Genuity Inc. |
||||
| Needham & Company, LLC |
||||
|
|
|
|||
| Total |
3,846,154 | |||
|
|
|
|||
The underwriting agreement provides that the underwriters are obligated to purchase all the shares of common stock in the offering if any are purchased, other than those shares covered by the option to purchase additional shares described below. The underwriting agreement also provides that if any underwriter defaults, the purchase commitments of non-defaulting underwriters may be increased or the offering may be terminated.
We have granted the underwriters a 30-day option to purchase up to 576,923 additional shares from us at the initial public offering price less the underwriting discounts and commissions for the sole purpose of covering sales of shares in excess of the shares sold in the initial public offering.
Certain of our existing stockholders, including John T. McDonald, our Chief Executive Officer and chairman of our board of directors, entities associated with Austin Ventures, each of which is an affiliate of a member of our board of directors, and ESW Capital, LLC or its affiliates, have indicated an interest in purchasing shares of common stock with an aggregate purchase price of up to $5.0 million, or up to 10% of the proposed offering size based on an assumed initial public offering price of $ 13.00 per share, the midpoint of the price range set forth on the cover page of this prospectus. However, because indications of interest are not binding agreements or commitments to purchase, the underwriters may determine to sell more, less or no shares in this offering to such stockholders, or such stockholders may determine to purchase more, less or no shares in this offering. The underwriters will receive the same discount from shares of our common stock purchased by such stockholders as they will from other shares of our common stock sold to the public in this offering. Any shares purchased by these potential investors will be subject to the lock-up restrictions described below.
The underwriters propose to offer the shares of common stock initially at the public offering price on the cover page of this prospectus and to dealers at that price less a selling concession of $ per share. After the initial public offering, the representatives may change the public offering price and the concession.
The following table summarizes the public offering price, underwriting discounts and commissions and proceeds, before expenses, to us. This information assumes both no exercise and full exercise of the underwriters’ option to purchase additional shares.
| Per Share | Total | |||||||||||||||
| Without Option |
With Option |
Without Option |
With Option |
|||||||||||||
| Initial public offering price |
$ | $ | $ | $ | ||||||||||||
| Underwriting discounts and commissions |
$ | $ | $ | $ | ||||||||||||
| Proceeds, before expenses, to us |
$ | $ | $ | $ | ||||||||||||
-135-
Table of Contents
The expenses of the offering that are payable by us are estimated to be $3.3 million (excluding underwriting discounts and commissions). We have agreed to reimburse the underwriters for Blue Sky fees and related expenses of the underwriters’ legal counsel, not to exceed $5,000 in the aggregate.
The representatives have informed us that they do not expect sales to accounts over which the underwriters have discretionary authority to exceed 5% of the shares of common stock being offered. The underwriters will not confirm sales to any accounts over which they exercise discretionary authority without first receiving a written consent from those accounts.
We have agreed that we will not (i) offer, sell, contract to sell, pledge, grant any option to purchase, make any short sale or otherwise transfer or dispose of, directly or indirectly, or file with the SEC a registration statement under the Securities Act relating to, any shares of our common stock or securities convertible into or exchangeable or exercisable for any shares of our common stock, or publicly disclose the intention to make any such offer, sale, pledge, disposition or filing, or (ii) enter into any swap or other agreement that transfers, in whole or in part, any of the economic consequences of ownership of our common stock or such other securities, whether any such transaction described in (i) or (ii) above is to be settled by delivery of common stock or such other securities, in cash or otherwise, without the prior written consent of the representatives for a period of 180 days after the date of this prospectus.
The restrictions described in the preceding paragraph do not apply to:
| • | the shares of our common stock sold to the underwriters pursuant to the underwriting agreement; |
| • | the issuance of options, restricted stock units, restricted stock or other equity awards to acquire shares of our common stock granted pursuant to our equity incentive plans described in this prospectus, as such may be amended; |
| • | the issuance of shares of our common stock upon the exercise of any such options, warrants or other equity awards to acquire shares of our common stock or in connection with the vesting of restricted stock units or the conversion of a security; |
| • | the filing by us of registration statements on Form S-8 with respect to our benefit plans that are described in this prospectus; |
| • | the issuance of shares of our common stock in an amount up to 10% of the outstanding shares of our common stock as of the date of this prospectus in connection with a merger, acquisition, strategic commercial arrangement or other similar transaction; |
| • | transfers to us of shares of our common stock or any security convertible into our common stock in connection with (i) the termination of services of an employee or other service provider pursuant to agreements that provide us with an option to repurchase such shares; or (ii) agreements that provide us with a right of first refusal with respect to the transfers of such shares; and |
| • | transfers of shares of our common stock or any security convertible into our common stock to us in connection with the exercise of options or warrants, including on a “cashless” basis, or for the purpose of satisfying any tax or other governmental withholding obligation solely in connection with a transaction exempt from Section 16(b) of the Exchange Act, |
provided that with respect to any such transfer described above, the holders of shares of our common stock, option or warrants referenced in the second, third and fifth bullets above agree to execute a lock-up agreement described below.
Our directors, executive officers and the holders of approximately 96.3% of our outstanding capital stock immediately prior to this offering have entered into lock-up agreements with the underwriters prior to
-136-
Table of Contents
the commencement of this offering pursuant to which each of these persons or entities, with limited exceptions, for a period of 180 days after the date of this prospectus, may not, without the prior written consent of the representatives:
| • | offer, sell, contract to sell, pledge, grant any option to purchase, make any short sale or otherwise transfer or dispose of, directly or indirectly, or file or cause to be filed with the SEC a registration statement under the Securities Act relating to, any shares of our common stock or securities convertible into or exchangeable or exercisable for any shares of our common stock, or publicly disclose the intention to make any such offer, sale, pledge, disposition or filing; or |
| • | enter into any swap or other agreement that transfers, in whole or in part, any of the economic consequences of ownership of our common stock or such other securities; |
whether any such transaction described above is to be settled by delivery of common stock or such other securities, in cash or otherwise. This lock-up provision applies to common stock or other securities convertible into or exchangeable or exercisable for any shares of our common stock owned now or acquired later by the person or entity executing the agreement or for which the person or entity executing the agreement later acquires the power of disposition.
The restrictions described in the preceding paragraph do not apply to:
| • | bona fide gifts; |
| • | transfers (i) to an immediate family member, (ii) by will, other testamentary document or intestate succession, (iii) to any trust or partnership for the direct or indirect benefit of such person or entity, (iv) to a trustor or beneficiary of a trust or (v) not involving a change in beneficial ownership; |
| • | a distribution to limited partners or stockholders of such person or entity; |
| • | transfers to such person’s or entity’s, affiliates, including current partners, members, managers, stockholders or other principals (or to the estates of any such person), or to any investment fund or other entity controlled or managed by such person or entity; |
| • | transfers to us in connection with (i) the termination of service of an employee or other service provider pursuant to agreements that provide us with an option to repurchase such shares or (ii) agreements that provide us with a right of first refusal with respect to transfers of such shares; or |
| • | transfers to us in connection with the exercise of options or warrants, including on a “cashless” basis, or for the purpose of satisfying any tax or other governmental withholding obligation solely in connection with a transaction exempt from Section 16(b) of the Exchange Act; |
provided that with respect to any such transfer described above, the recipient agrees to be subject to the restrictions set forth in the immediately preceding paragraph, such transfer does not involve a disposition of value, such transfers are not required to be reported with the SEC on Form 4 in accordance with Section 16 of the Exchange Act and such person or entity does not voluntarily effect any public filing during the 180-day period regarding such transfers. In addition, the restrictions in the immediately preceding paragraph do not apply to the exercise of options or warrants outstanding before the beginning of the 180-day period or granted under any stock incentive plan or stock purchase plan or the establishment of a trading plan pursuant to Rule 10b5-1 under the Exchange Act for the transfer of shares of common stock; provided that such plan does not provide for transfers during the 180-day period and no public announcement or filing under the Exchange Act regarding the establishment of such plan will be required or voluntarily made by such person or entity.
The representatives, in their sole discretion, may release the common stock or other securities convertible into or exercisable or exchangeable for common stock subject to the lock-up agreements described above in whole or in part at any time; provided that in the event that the underwriters release or waive any lock-up, they will provide us with notice at least three business days prior to the effective date and we will issue a press release
-137-
Table of Contents
at least two business days prior to the effective date. When determining whether or not to release common stock and other securities from lock-up agreements, the representatives will consider, among other factors, the holder’s reasons for requesting the release, the number of shares of common stock and other securities for which the release is being requested and market conditions at the time. In addition, in the event that any holder of our common stock or securities convertible into or exercisable for common stock are granted an early release from the lock-up restrictions having a fair market value in excess of $1.0 million in the aggregate (whether in one or multiple releases), then each officer, director and record or beneficial owner of more than 1% of the outstanding shares of our capital stock (aggregating ownership of affiliates) outstanding as of April 7, 2014 will be granted an equivalent early release from its obligations under the lock-up agreement on a pro-rata basis. Such pro-rata release shall not be triggered by any release to a person or entity to participate as a selling stockholder in a follow-on public offering of securities in the event the person or entity released is required to sign a new lock-up agreement in connection with such offering.
We have agreed to indemnify the underwriters against liabilities under the Securities Act, or contribute to payments that the underwriters may be required to make in that respect.
We have been approved to list our common stock on the NASDAQ Global Market under the symbol “UPLD.”
The underwriters and their respective affiliates are full service financial institutions engaged in various activities, which may include securities trading, commercial and investment banking, financial advisory, investment management, investment research, principal investment, hedging, financing and brokerage activities. Certain of the underwriters and their respective affiliates have, from time to time, performed, and may in the future perform, various financial advisory, lending and investment banking services for us and our affiliates, for which they received or will receive customary fees and expenses. In the ordinary course of their various business activities, the underwriters and their respective affiliates may make or hold a broad array of investments and actively trade debt and equity securities (or related derivative securities) and financial instruments (including bank loans) for their own account and for the accounts of their customers, and such investment and securities activities may involve securities and/or instruments of the issuer. The underwriters and their respective affiliates may also make investment recommendations and/or publish or express independent research views in respect of such securities or instruments and may at any time hold, or recommend to clients that they acquire, long and/or short positions in such securities and instruments.
The initial public offering price for the common stock was determined by negotiations between the underwriters and us and may not be indicative of the market price following this offering. Among the factors considered in determining the initial public offering price for the common stock, in addition to prevailing market conditions, were our historical and projected business, results of operations, liquidity and financial condition, an assessment of our management and the consideration of the various other matters referenced in this prospectus in relation to the market valuation of other comparable companies.
To facilitate this offering, the underwriters may engage in transactions that stabilize, maintain or otherwise affect the price of the common stock. Specifically, the underwriters may sell more shares than they are obligated to purchase under the underwriting agreement, creating a short position. A short position is covered if the short position is no greater than the number of shares available for purchase by the underwriters under their option to purchase additional shares. The underwriters can close out a covered short position by exercising their option to purchase additional shares or by purchasing shares in the open market. In determining the source of shares to close out a covered short position, the underwriters will consider, among other things, the open market price of shares compared to the price available under their option to purchase additional shares. The underwriters may also sell shares in excess of their option to purchase additional shares, creating a naked short position. The underwriters must close out any naked short position by purchasing shares in the open market. A naked short position is more likely to be created if the underwriters are concerned that there may be downward pressure on the price of the common stock in the open market after pricing that could adversely affect investors who purchase
-138-
Table of Contents
in this offering. As an additional means of facilitating this offering, the underwriters may bid for, and purchase, shares of common stock in the open market to stabilize the price of the common stock. The underwriters may also impose a penalty bid. Penalty bids permit the underwriters to reclaim a selling concession from a syndicate member when the underwriters repurchase shares originally sold by that syndicate member in order to cover short positions or make stabilizing purchases. These activities may raise or maintain the market price of the common stock above independent market levels or prevent or retard a decline in the market price of the common stock. The underwriters are not required to engage in these activities and may end any of these activities at any time.
A prospectus in electronic format may be made available on the web sites maintained by one or more of the underwriters, or selling group members, if any, participating in this offering and one or more of the underwriters participating in this offering may distribute prospectuses electronically. The representatives may agree to allocate a number of shares to underwriters and selling group members for sale to their online brokerage account holders. Internet distributions will be allocated by the representatives to underwriters and selling group members that may make Internet distributions on the same basis as other allocations.
The common stock is being offered for sale in those jurisdictions in the United States and elsewhere where it is lawful to make such offers.
Each of the underwriters has represented and agreed that it has not offered, sold or delivered and will not offer, sell or deliver any of the shares of common stock directly or indirectly, or distribute this prospectus or any other offering material relating to the shares of common stock, in or from any jurisdiction except under circumstances that will result in compliance with the applicable laws and regulations thereof and that will not impose any obligations on us except as set forth in the underwriting agreement.
Notice to Prospective Investors in the European Economic Area
In relation to each Member State of the European Economic Area (each, a “Relevant Member State”), no offer of shares may be made to the public in that Relevant Member State other than:
| A. | to any legal entity which is a qualified investor as defined in the Prospectus Directive; |
| B. | to fewer than 100 or, if the Relevant Member State has implemented the relevant provision of the 2010 PD Amending Directive, 150, natural or legal persons (other than qualified investors as defined in the Prospectus Directive), as permitted under the Prospectus Directive, subject to obtaining the prior consent of the representatives; or |
| C. | in any other circumstances falling within Article 3(2) of the Prospectus Directive, |
provided that no such offer of shares shall require us or the representatives to publish a prospectus pursuant to Article 3 of the Prospectus Directive or supplement a prospectus pursuant to Article 16 of the Prospectus Directive.
Each person in a Relevant Member State who initially acquires any shares or to whom any offer is made will be deemed to have represented, acknowledged and agreed that it is a “qualified investor” within the meaning of the law in that Relevant Member State implementing Article 2(1)(e) of the Prospectus Directive. In the case of any shares being offered to a financial intermediary as that term is used in Article 3(2) of the Prospectus Directive, each such financial intermediary will be deemed to have represented, acknowledged and agreed that the shares acquired by it in the offer have not been acquired on a non-discretionary basis on behalf of, nor have they been acquired with a view to their offer or resale to, persons in circumstances which may give rise to an offer of any shares to the public other than their offer or resale in a Relevant Member State to qualified investors as so defined or in circumstances in which the prior consent of the representatives has been obtained to each such proposed offer or resale.
-139-
Table of Contents
We, the representatives and their affiliates will rely upon the truth and accuracy of the foregoing representation, acknowledgment and agreement.
This prospectus has been prepared on the basis that any offer of shares in any Relevant Member State will be made pursuant to an exemption under the Prospectus Directive from the requirement to publish a prospectus for offers of shares. Accordingly any person making or intending to make an offer in that Relevant Member State of shares which are the subject of the offering contemplated in this prospectus may only do so in circumstances in which no obligation arises for us or any of the underwriters to publish a prospectus pursuant to Article 3 of the Prospectus Directive in relation to such offer. Neither we nor the underwriters have authorized, nor do we or the underwriters authorize, the making of any offer of shares in circumstances in which an obligation arises for us or the underwriters to publish a prospectus for such offer.
For the purpose of the above provisions, the expression “an offer to the public” in relation to any shares in any Relevant Member State means the communication in any form and by any means of sufficient information on the terms of the offer and the shares to be offered so as to enable an investor to decide to purchase or subscribe for the shares, as the same may be varied in the Relevant Member State by any measure implementing the Prospectus Directive in the Relevant Member State and the expression “Prospectus Directive” means Directive 2003/71/EC (including the 2010 PD Amending Directive, to the extent implemented in the Relevant Member States) and includes any relevant implementing measure in the Relevant Member State and the expression “2010 PD Amending Directive” means Directive 2010/73/EU.
Notice to Prospective Investors in the United Kingdom
In addition, in the United Kingdom, this prospectus is being distributed only to, and is directed only at, and any offer subsequently made may only be directed at persons who are “qualified investors” (as defined in the Prospectus Directive) (i) who have professional experience in matters relating to investments falling within Article 19(5) of the Financial Services and Markets Act 2000 (Financial Promotion) Order 2005, as amended (the “Order”) and/or (ii) who are high net worth companies (or persons to whom it may otherwise be lawfully communicated) falling within Article 49(2)(a) to (d) of the Order (all such persons together being referred to as “relevant persons”). This prospectus must not be acted on or relied on in the United Kingdom by persons who are not relevant persons. In the United Kingdom, any investment or investment activity to which this prospectus relates is only available to, and will be engaged in with, relevant persons.
Notice to Prospective Investors in Switzerland
The shares may not be publicly offered in Switzerland and will not be listed on the SIX Swiss Exchange (“SIX”) or on any other stock exchange or regulated trading facility in Switzerland. This prospectus has been prepared without regard to the disclosure standards for issuance prospectuses under art. 652a or art. 1156 of the Swiss Code of Obligations or the disclosure standards for listing prospectuses under art. 27 ff. of the SIX Listing Rules or the listing rules of any other stock exchange or regulated trading facility in Switzerland. Neither this prospectus nor any other offering or marketing material relating to the shares or this offering may be publicly distributed or otherwise made publicly available in Switzerland.
Neither this prospectus nor any other offering or marketing material relating to this offering, us or the shares have been or will be filed with or approved by any Swiss regulatory authority. In particular, this prospectus will not be filed with, and the offer of shares will not be supervised by, the Swiss Financial Market Supervisory Authority FINMA (FINMA), and the offer of shares has not been and will not be authorized under the Swiss Federal Act on Collective Investment Schemes (“CISA”). The investor protection afforded to acquirers of interests in collective investment schemes under the CISA does not extend to acquirers of shares.
-140-
Table of Contents
The validity of the shares of common stock being offered by this prospectus will be passed upon for us by Wilson Sonsini Goodrich & Rosati, Professional Corporation, Austin, Texas. As of the date of this prospectus, WS Investment Company, LLC (2010A), an entity that includes current and former partners and associates of Wilson Sonsini Goodrich & Rosati, Professional Corporation, beneficially owns 37,702 shares of our preferred stock, which will be converted into 37,702 shares of our common stock prior to the closing of this offering. Certain legal matters in connection with this offering will be passed upon for the underwriters by Winston & Strawn LLP, Chicago, Illinois.
The consolidated financial statements of Upland Software, Inc. at December 31, 2013 and 2012, and for each of the two years in the period ended December 31, 2013, appearing in this prospectus and registration statement have been audited by Ernst & Young, LLP, an independent registered public accounting firm, as set forth in their report thereon appearing elsewhere herein, and are included in reliance upon such report given on the authority of such firm as experts in accounting and auditing.
The consolidated financial statements of ComSci, LLC for the ten-month period ended October 31, 2013 and the year ended December 31, 2012 appearing in this registration statement have been audited by Holtzman Partners, LLP, independent auditors, as set forth in their report thereon appearing elsewhere herein, and upon the authority of said firm as experts in accounting and auditing.
The consolidated financial statements of LMR Solutions, LLC for the period from January 1, 2012 to November 13, 2012 appearing in this registration statement have been audited by Holtzman Partners, LLP, independent auditors, as set forth in their report thereon appearing elsewhere herein, and upon the authority of said firm as experts in accounting and auditing.
The combined financial statements of Marex Group, Inc. and FileBound Solutions, Inc. for the years ended December 31, 2011 and 2012 appearing in this registration statement have been audited by Blackman & Associates, P.C., independent auditors, as set forth in their report appearing elsewhere herein, and upon authority of said firm as experts in accounting and auditing. The combined financial statements of Marex Group, Inc. and FileBound Solutions, Inc. for the period January 1, 2013 to May 16, 2013 appearing in this registration statement have been audited by Holtzman Partners, LLP, independent auditors, as set forth in their report thereon appearing elsewhere herein, and upon the authority of said firm as experts in accounting and auditing.
WHERE YOU CAN FIND ADDITIONAL INFORMATION
We have filed with the SEC a registration statement on Form S-1 under the Securities Act with respect to the shares of common stock being offered by this prospectus. This prospectus does not contain all of the information in the registration statement and its exhibits. For further information about us and the common stock offered by this prospectus, we refer you to the registration statement and its exhibits. Statements contained in this prospectus as to the contents of any contract or any other document referred to are not necessarily complete, and in each instance, we refer you to the copy of the contract or other document filed as an exhibit to the registration statement. Each of these statements is qualified in all respects by this reference.
You can read our SEC filings, including the registration statement, over the Internet at the SEC’s website at http://www.sec.gov. You may also read and copy any document we file with the SEC at its public reference facilities at 100 F Street, NE, Washington, D.C. 20549. You may also obtain copies of these documents at prescribed rates by writing to the Public Reference Section of the SEC at 100 F Street, NE, Washington, D.C. 20549. Please call the SEC at 1-800-SEC-0330 for further information on the operation of the public reference facilities.
-141-
Table of Contents
Upon the closing of this offering, we will be subject to the information reporting requirements of the Exchange Act, and we will file reports, proxy statements and other information with the SEC. These reports, proxy statements and other information will be available for inspection and copying at the public reference room and website of the SEC referred to above. We also maintain a website at www.uplandsoftware.com, at which you may access these materials free of charge as soon as reasonably practicable after they are electronically filed with, or furnished to, the SEC. The information contained on, or that can be accessed through, our website is not a part of this prospectus. Investors should not rely on any such information in deciding whether to purchase our common stock. We have included our website address in this prospectus solely as an inactive textual reference.
-142-
Table of Contents
| Upland Software, Inc. |
||||
| As of and for the Years Ended December 31, 2013 and 2012 and as of June 30, 2014 and for the Six Months Ended June 30, 2014 and 2013 |
||||
| F-2 | ||||
| F-3 | ||||
| F-5 | ||||
| F-6 | ||||
| F-7 | ||||
| F-8 | ||||
| F-9 | ||||
| LMR Solutions, LLC (dba EPM Live) |
||||
| As of and for the Period Ended November 13, 2012 |
||||
| F-41 | ||||
| F-42 | ||||
| F-43 | ||||
| F-44 | ||||
| F-45 | ||||
| F-46 | ||||
| FileBound Solutions, Inc. and Marex Group, Inc. |
||||
| As of and for the Period January 1, 2013 to May 16, 2013 |
||||
| F-53 | ||||
| F-54 | ||||
| F-55 | ||||
| F-56 | ||||
| F-57 | ||||
| F-58 | ||||
| As of and for the Year Ended December 31, 2012 |
||||
| F-64 | ||||
| F-65 | ||||
| F-67 | ||||
| F-68 | ||||
| F-69 | ||||
| F-70 | ||||
| As of and for the Year Ended December 31, 2011 |
||||
| F-77 | ||||
| F-78 | ||||
| F-80 | ||||
| F-81 | ||||
| F-82 | ||||
| F-83 | ||||
| ComSci, LLC |
||||
| As of and for the Periods Ended October 31, 2013 and December 31, 2012 |
||||
| F-90 | ||||
| F-91 | ||||
| F-92 | ||||
| F-93 | ||||
| F-94 | ||||
| F-95 | ||||
| Upland Software, Inc. |
||||
| For the Year Ended December 31, 2013 |
||||
| F-100 | ||||
| Notes to Pro Forma Consolidated Statement of Operations (Unaudited) |
F-102 | |||
F-1
Table of Contents
Report of Independent Registered Public Accounting Firm
The Board of Directors and Stockholders of
Upland Software, Inc.
We have audited the accompanying consolidated balance sheets of Upland Software, Inc. (the “Company”) as of December 31, 2013 and 2012, and the related consolidated statements of operations, comprehensive loss, stockholders’ deficit, and cash flows for the years then ended. These financial statements are the responsibility of the Company’s management. Our responsibility is to express an opinion on these financial statements based on our audits.
We conducted our audits in accordance with the standards of the Public Company Accounting Oversight Board (United States). Those standards require that we plan and perform the audit to obtain reasonable assurance about whether the financial statements are free of material misstatement. We were not engaged to perform an audit of the Company’s internal control over financial reporting. Our audits included consideration of internal control over financial reporting as a basis for designing audit procedures that are appropriate in the circumstances, but not for the purpose of expressing an opinion on the effectiveness of the Company’s internal control over financial reporting. Accordingly, we express no such opinion. An audit also includes examining, on a test basis, evidence supporting the amounts and disclosures in the financial statements, assessing the accounting principles used and significant estimates made by management, and evaluating the overall financial statement presentation. We believe that our audits provide a reasonable basis for our opinion.
In our opinion, the financial statements referred to above present fairly, in all material respects, the consolidated financial position of Upland Software, Inc. at December 31, 2013 and 2012, and the results of its operations and its cash flows for the years then ended in conformity with U.S. generally accepted accounting principles.
/s/ Ernst & Young LLP
Austin, Texas
May 12, 2014, except as to Note 18, which is as of October 24, 2014
F-2
Table of Contents
Consolidated Balance Sheets
(in thousands, except share and per share data)
| December 31, 2012 |
December 31, 2013 |
June 30, 2014 |
Pro Forma Stockholders’ Equity at June 30, 2014 |
|||||||||||||
| (unaudited) | (unaudited) | |||||||||||||||
| Assets |
||||||||||||||||
| Current assets: |
||||||||||||||||
| Cash and cash equivalents |
$ | 3,892 | $ | 4,703 | $ | 3,059 | ||||||||||
| Accounts receivable, net of allowance of $321 and $454 for 2012 and 2013, respectively |
9,489 | 11,026 | 14,179 | |||||||||||||
| Prepaid and other |
901 | 2,562 | 2,399 | |||||||||||||
|
|
|
|
|
|
|
|||||||||||
| Total current assets |
14,282 | 18,291 | 19,637 | |||||||||||||
| Canadian tax credits receivable |
4,395 | 3,583 | 3,172 | |||||||||||||
| Property and equipment, net |
1,407 | 3,942 | 3,365 | |||||||||||||
| Intangible assets, net |
26,388 | 34,747 | 32,210 | |||||||||||||
| Goodwill |
21,093 | 33,630 | 33,580 | |||||||||||||
| Other assets |
243 | 654 | 2,362 | |||||||||||||
|
|
|
|
|
|
|
|||||||||||
| Total assets |
$ | 67,808 | $ | 94,847 | $ | 94,326 | ||||||||||
|
|
|
|
|
|
|
|||||||||||
| Liabilities, redeemable convertible preferred stock and stockholders’ deficit |
||||||||||||||||
| Current liabilities: |
||||||||||||||||
| Accounts payable |
$ | 1,843 | $ | 1,280 | $ | 2,140 | ||||||||||
| Accrued expenses and other |
3,297 | 5,379 | 7,551 | |||||||||||||
| Deferred revenue |
15,688 | 16,620 | 18,439 | |||||||||||||
| Due to seller |
600 | 1,033 | 1,033 | |||||||||||||
| Current maturities of notes payable |
3,800 | 5,245 | 12,238 | |||||||||||||
|
|
|
|
|
|
|
|||||||||||
| Total current liabilities |
25,228 | 29,557 | 41,401 | |||||||||||||
| Commitments and contingencies (Note 7) |
||||||||||||||||
| Canadian tax credit liability to sellers |
2,780 | 2,595 | 2,047 | |||||||||||||
| Notes payable, less current maturities |
10,920 | 23,438 | 15,146 | |||||||||||||
| Deferred revenue |
814 | 416 | 1,621 | |||||||||||||
| Noncurrent deferred tax liability, net |
4,292 | 3,084 | 2,738 | |||||||||||||
| Other long-term liabilities |
461 | 1,101 | 1,384 | |||||||||||||
|
|
|
|
|
|
|
|||||||||||
| Total liabilities |
44,495 | 60,191 | 64,337 | |||||||||||||
| Redeemable convertible preferred stock, $0.0001 par value; 9,300,342 shares authorized: |
||||||||||||||||
| Series A: 2,990,703 shares designated; 2,821,181 shares issued and outstanding at December 31, 2012 and 2013 and June 30, 2014 (unaudited); no shares issued and outstanding pro forma as of June 30, 2014 (unaudited); aggregate liquidation preference of $17.2 million at December 31, 2013 |
|
17,082 |
|
|
17,118 |
|
|
17,138 |
|
$ |
— |
| ||||
| Series B: 1,767,912 shares designated; 1,701,909 shares issued and outstanding at December 31, 2012 and 2013 and June 30, 2014 (unaudited); no shares issued and outstanding pro forma as of June 30, 2014 (unaudited); aggregate liquidation preference of $10.4 million at December 31, 2013 |
|
10,358 |
|
|
10,367 |
|
|
10,369 |
|
|
— |
| ||||
F-3
Table of Contents
| December 31, 2012 |
December 31, 2013 |
June 30, 2014 |
Pro Forma Stockholders’ Equity at June 30, 2014 |
|||||||||||||
| (unaudited) | (unaudited) | |||||||||||||||
| Series B-1: 983,767 shares designated; 131,168, 237,740 and 237,740 shares issued and outstanding at December 31, 2012 and 2013 and June 30, 2014 (unaudited), respectively; no shares issued and outstanding pro forma as of June 30, 2014 (unaudited); aggregate liquidation preference of $1.5 million at December 31, 2013 |
52 | 1,076 | 1,276 | — | ||||||||||||
| Series B-2: 1,639,613 shares designated; 155,598 shares issued and outstanding at December 31, 2013 and June 30, 2014 (unaudited); no shares issued and outstanding pro forma as of June 30, 2014 (unaudited); aggregate liquidation preference of $0.9 million at December 31, 2013 |
— | 949 | 949 | — | ||||||||||||
| Series C: 1,918,347 shares designated; 1,918,048 shares issued and outstanding at December 31, 2013 and June 30, 2014 (unaudited); no shares issued and outstanding pro forma as of June 30, 2014 (unaudited); aggregate liquidation preference of $21.1 million at December 31, 2013 |
— | 21,028 | 21,784 | — | ||||||||||||
|
|
|
|
|
|
|
|
|
|||||||||
| Total redeemable convertible preferred stock |
27,492 | 50,538 | 51,516 | — | ||||||||||||
| Stockholders’ deficit: |
||||||||||||||||
| Common stock, $0.0001 par value; 13,989,998 shares authorized: 1,695,720, 1,851,319 and 3,655,043 shares issued and outstanding at December 31, 2012 and 2013 and June 30, 2014 (unaudited), respectively; 10,489,519 shares issued and outstanding pro forma as of June 30, 2014 (unaudited) |
— | — | — | 1 | ||||||||||||
| Additional paid-in capital |
— | — | 9,276 | 60,791 | ||||||||||||
| Accumulated other comprehensive loss |
(104 | ) | (773 | ) | (697 | ) | (697 | ) | ||||||||
| Accumulated deficit |
(4,075 | ) | (15,109 | ) | (30,106 | ) | (30,106 | ) | ||||||||
|
|
|
|
|
|
|
|
|
|||||||||
| Total stockholders’ (deficit) equity |
(4,179 | ) | (15,882 | ) | (21,527 | ) | $ | 29,989 | ||||||||
|
|
|
|
|
|
|
|
|
|||||||||
| Total liabilities and stockholders’ deficit |
$ | 67,808 | $ | 94,847 | $ | 94,326 | ||||||||||
|
|
|
|
|
|
|
|||||||||||
See accompanying notes.
F-4
Table of Contents
Consolidated Statements of Operations
(in thousands, except share and per share data)
| Year Ended December 31, | Six Months Ended June 30, | |||||||||||||||
| 2012 | 2013 | 2013 | 2014 | |||||||||||||
| (unaudited) | (unaudited) | |||||||||||||||
| Revenue: |
||||||||||||||||
| Subscription and support |
$ | 18,281 | $ | 30,887 | $ | 14,182 | $ | 23,542 | ||||||||
| Perpetual license |
641 | 2,003 | 488 | 1,097 | ||||||||||||
|
|
|
|
|
|
|
|
|
|||||||||
| Total product revenue |
18,922 | 32,890 | 14,670 | 24,639 | ||||||||||||
| Professional services |
3,841 | 8,303 | 3,997 | 7,185 | ||||||||||||
|
|
|
|
|
|
|
|
|
|||||||||
| Total revenue |
22,763 | 41,193 | 18,667 | 31,824 | ||||||||||||
| Cost of revenue: |
||||||||||||||||
| Subscription and support |
4,189 | 7,787 | |
3,271 |
|
6,604 | ||||||||||
| Professional services |
3,121 | 5,680 | 2,855 | 4,737 | ||||||||||||
|
|
|
|
|
|
|
|
|
|||||||||
| Total cost of revenue |
7,310 | 13,467 | 6,126 | 11,341 | ||||||||||||
|
|
|
|
|
|
|
|
|
|||||||||
| Gross profit |
15,453 | 27,726 | 12,541 | 20,483 | ||||||||||||
| Operating expenses: |
||||||||||||||||
| Sales and marketing |
6,331 | 10,625 | 4,403 | 7,151 | ||||||||||||
| Research and development |
5,308 | 10,340 | 4,406 | 18,393 | ||||||||||||
| Refundable Canadian tax credits |
(728 | ) | (583 | ) | (296 | ) | (274 | ) | ||||||||
| General and administrative |
4,574 | 6,832 | 2,920 | 5,676 | ||||||||||||
| Depreciation and amortization |
1,812 | 3,670 | 2,247 | 2,121 | ||||||||||||
| Acquisition-related expenses |
1,933 | 1,461 | 528 | 521 | ||||||||||||
|
|
|
|
|
|
|
|
|
|||||||||
| Total operating expenses |
19,230 | 32,345 | 14,208 | 33,588 | ||||||||||||
|
|
|
|
|
|
|
|
|
|||||||||
| Income (loss) from operations |
(3,777 | ) | (4,619 | ) | (1,667 | ) | (13,105 | ) | ||||||||
| Other expense: |
||||||||||||||||
| Interest expense, net |
(528 | ) | (2,797 | ) | (547 | ) | (834 | ) | ||||||||
| Other income (expense), net |
(65 | ) | (431 | ) | 73 | (368 | ) | |||||||||
|
|
|
|
|
|
|
|
|
|||||||||
| Total other expense |
(593 | ) | (3,228 | ) | (474 | ) | (1,202 | ) | ||||||||
|
|
|
|
|
|
|
|
|
|||||||||
| Loss before provision for income taxes |
(4,370 | ) | (7,847 | ) | (2,141 | ) | (14,307 | ) | ||||||||
| Provision for income taxes |
72 | (708 | ) | (133 | ) | (690 | ) | |||||||||
|
|
|
|
|
|
|
|
|
|||||||||
| Loss from continuing operations |
(4,298 | ) | (8,555 | ) | (2,274 | ) | (14,997 | ) | ||||||||
| Income (loss) from discontinued operations, net of tax of $50 and $342, in 2012 and 2013, respectively |
1,791 | (642 | ) | (316 | ) | — | ||||||||||
|
|
|
|
|
|
|
|
|
|||||||||
| Net loss |
$ | (2,507 | ) | $ | (9,197 | ) | $ | (2,590 | ) | $ | (14,997 | ) | ||||
|
|
|
|
|
|
|
|
|
|||||||||
| Preferred stock dividends and accretion |
(44 | ) | (98 | ) | (22 | ) | (875 | ) | ||||||||
|
|
|
|
|
|
|
|
|
|||||||||
| Net loss attributable to common shareholders |
$ | (2,551 | ) | $ | (9,295 | ) | $ | (2,612 | ) | $ | (15,872 | ) | ||||
|
|
|
|
|
|
|
|
|
|||||||||
| Net loss per common share: |
||||||||||||||||
| Loss from continuing operations per common share, basic and diluted |
$ | (5.78 | ) | $ | (7.23 | ) | $ | (2.16 | ) | $ | (4.92 | ) | ||||
| Income (loss) from discontinued operations per common share, basic and diluted |
$ | 2.39 | $ | (0.54 | ) | $ | (0.30 | ) | $ | — | ||||||
| Net loss per common share, basic and diluted |
$ | (3.39 | ) | $ | (7.77 | ) | $ | (2.46 | ) | $ | (4.92 | ) | ||||
| Weighted-average common shares outstanding, basic and diluted |
751,416 | 1,196,668 | 1,061,906 | 3,225,077 | ||||||||||||
| Pro forma net loss per common share (unaudited), basic and diluted |
$ | (1.55 | ) | $ | (1.49 | ) | ||||||||||
| Pro forma weighted-average common shares outstanding (unaudited), basic and diluted |
5,998,613 | 10,059,553 | ||||||||||||||
See accompanying notes.
F-5
Table of Contents
Consolidated Statements of Comprehensive Loss
(in thousands)
| Year Ended December 31, | Six Months Ended June 30, | |||||||||||||||
| 2012 | 2013 | 2013 | 2014 | |||||||||||||
| (unaudited) | (unaudited) | |||||||||||||||
| Net loss |
$ | (2,507 | ) | $ | (9,197 | ) | $ | (2,590 | ) | $ | (14,997 | ) | ||||
| Foreign currency translation adjustment |
(78 | ) | (669 | ) | (528 | ) | 76 | |||||||||
|
|
|
|
|
|
|
|
|
|||||||||
| Comprehensive loss |
$ | (2,585 | ) | $ | (9,866 | ) | $ | (3,118 | ) | $ | (14,921 | ) | ||||
|
|
|
|
|
|
|
|
|
|||||||||
See accompanying notes.
F-6
Table of Contents
Consolidated Statements of Stockholders’ Deficit
(in thousands, except share amounts)
| Common Stock | Additional Paid-In Capital |
Accumulated Other Comprehensive Loss |
Accumulated Deficit |
Total Stockholders’ Deficit |
||||||||||||||||||||
| Shares | Amount | |||||||||||||||||||||||
| Balance at January 1, 2012 |
1,582,635 | $ | — | $ | — | $ | (26 | ) | $ | (1,564 | ) | $ | (1,590 | ) | ||||||||||
| Accretion of preferred stock |
— | — | (40 | ) | — | (4 | ) | (44 | ) | |||||||||||||||
| Issuance of restricted stock |
113,085 | — | — | — | — | — | ||||||||||||||||||
| Stock-based compensation |
— | — | 40 | — | — | 40 | ||||||||||||||||||
| Foreign currency translation adjustment |
— | — | — | (78 | ) | — | (78 | ) | ||||||||||||||||
| Net loss |
— | — | — | — | (2,507 | ) | (2,507 | ) | ||||||||||||||||
|
|
|
|
|
|
|
|
|
|
|
|
|
|||||||||||||
| Balance at December 31, 2012 |
1,695,720 | — | — | (104 | ) | (4,075 | ) | (4,179 | ) | |||||||||||||||
| Issuance of common stock in business combination |
155,599 | — | 275 | — | — | 275 | ||||||||||||||||||
| Accretion of preferred stock |
— | — | (47 | ) | — | — | (47 | ) | ||||||||||||||||
| Preferred stock dividends |
— | — | (51 | ) | — | — | (51 | ) | ||||||||||||||||
| Stock-based compensation |
— | — | 98 | — | — | 98 | ||||||||||||||||||
| Distribution associated with spin-off |
— | — | (275 | ) | — | (1,837 | ) | (2,112 | ) | |||||||||||||||
| Foreign currency translation adjustment |
— | — | — | (669 | ) | — | (669 | ) | ||||||||||||||||
| Net loss |
— | — | — | — | (9,197 | ) | (9,197 | ) | ||||||||||||||||
|
|
|
|
|
|
|
|
|
|
|
|
|
|||||||||||||
| Balance at December 31, 2013 |
1,851,319 | — | — | (773 | ) | |
(15,109 |
) |
(15,882 | ) | ||||||||||||||
| Issuance of common stock (unaudited) |
1,803,574 | — | 9,984 | — | — | 9,984 | ||||||||||||||||||
| Exercise of stock options (unaudited) |
150 | — | — | — | — | — | ||||||||||||||||||
| Accretion of preferred stock (unaudited) |
— | — | (40 | ) | — | — | (40 | ) | ||||||||||||||||
| Preferred stock dividends (unaudited) |
— | — | (835 | ) | — | — | (835 | ) | ||||||||||||||||
| Stock-based compensation (unaudited) |
— | — | 167 | — | — | 167 | ||||||||||||||||||
| Foreign currency translation adjustment (unaudited) |
— | — | — | 76 | — | 76 | ||||||||||||||||||
| Net loss (unaudited) |
— | — | — | — | (14,997 | ) | (14,997 | ) | ||||||||||||||||
|
|
|
|
|
|
|
|
|
|
|
|
|
|||||||||||||
| Balance at June 30, 2014 (unaudited) |
3,655,043 | $ | — | $ | 9,276 | $ | (697 | ) | $ | (30,106 | ) | $ | (21,527 | ) | ||||||||||
|
|
|
|
|
|
|
|
|
|
|
|
|
|||||||||||||
See accompanying notes.
F-7
Table of Contents
Consolidated Statements of Cash Flows
(in thousands)
| Year Ended December 31, | Six Months Ended June 30, | |||||||||||||||
| 2012 | 2013 | 2013 | 2014 | |||||||||||||
| (unaudited) | (unaudited) | |||||||||||||||
| Operating activities |
||||||||||||||||
| Net loss |
$ | (2,507 | ) | $ | (9,197 | ) | $ | (2,590 | ) | $ | (14,997 | ) | ||||
| Adjustments to reconcile net loss to net cash (used in) provided by operating activities: |
||||||||||||||||
| Depreciation and amortization |
2,817 | 5,595 | 3,142 | 3,605 | ||||||||||||
| Change in fair value of liabilities to sellers of businesses |
(771 | ) | — | — | — | |||||||||||
| Deferred income taxes |
(85 | ) | (104 | ) | (495 | ) | 286 | |||||||||
| Non-cash interest and other expense |
— | 1,585 | 106 | 462 | ||||||||||||
| Non-cash stock compensation expense |
92 | 498 | 249 | 367 | ||||||||||||
| Stock-based compensation—related party vendor |
— | 11,220 | ||||||||||||||
| Changes in operating assets and liabilities, net of purchase business combinations: |
||||||||||||||||
| Accounts receivable |
(3,547 | ) | 2,941 | 4,440 | (3,036 | ) | ||||||||||
| Prepaids and other |
(773 | ) | (1,617 | ) | (670 | ) | (1,646 | ) | ||||||||
| Accounts payable |
875 | (1,113 | ) | (770 | ) | 375 | ||||||||||
| Accrued expenses and other liabilities |
(403 | ) | 2,176 | 21 | 676 | |||||||||||
| Deferred revenue |
5,906 | (1,003 | ) | (3,219 | ) | 2,985 | ||||||||||
|
|
|
|
|
|
|
|
|
|||||||||
| Net cash provided by (used in) operating activities |
1,604 | (239 | ) | 214 | 297 | |||||||||||
| Investing activities |
||||||||||||||||
| Purchase of property and equipment |
(274 | ) | (263 | ) | (58 | ) | (324 | ) | ||||||||
| Purchase business combinations, net of cash acquired of $3,333 and $286 for 2012 and 2013, respectively |
(33,038 | ) | (28,175 | ) | (10,344 | ) | — | |||||||||
| Cash included in distribution of spin-off |
— | (127 | ) | — | — | |||||||||||
|
|
|
|
|
|
|
|
|
|||||||||
| Net cash used in investing activities |
(33,312 | ) | (28,565 | ) | (10,402 | ) | (324 | ) | ||||||||
| Financing activities |
||||||||||||||||
| Payments on capital leases |
(486 | ) | (351 | ) | (189 | ) | (231 | ) | ||||||||
| Proceeds from notes payable |
17,000 | 28,036 | 25,838 | 1,500 | ||||||||||||
| Payments on notes payable |
(3,646 | ) | (17,516 | ) | (14,225 | ) | (2,795 | ) | ||||||||
| Issuance of Series A redeemable preferred stock, net of issuance costs |
1,029 | — | — | — | ||||||||||||
| Issuance of Series B redeemable preferred stock, net of issuance costs |
10,358 | — | — | (97 | ) | |||||||||||
| Issuance of Series C redeemable preferred stock, net of issuance costs |
— | 19,716 | — | — | ||||||||||||
| Additional consideration paid to sellers of businesses |
— | (321 | ) | — | — | |||||||||||
|
|
|
|
|
|
|
|
|
|||||||||
| Net cash provided by (used in) financing activities |
24,255 | 29,564 | 11,424 | (1,623 | ) | |||||||||||
| Effect of exchange rate fluctuations on cash |
— | 51 | (163 | ) | 6 | |||||||||||
| Change in cash and cash equivalents |
(7,453 | ) | 811 | 1,073 | (1,644 | ) | ||||||||||
| Cash and cash equivalents, beginning of year |
11,345 | 3,892 | 3,892 | 4,703 | ||||||||||||
|
|
|
|
|
|
|
|
|
|||||||||
| Cash and cash equivalents, end of year |
$ | 3,892 | $ | 4,703 | $ | 4,965 | $ | 3,059 | ||||||||
|
|
|
|
|
|
|
|
|
|||||||||
| Supplemental disclosures of cash flow information |
||||||||||||||||
| Cash paid for interest |
$ | 446 | $ | 1,221 | $ | 407 | $ | 701 | ||||||||
|
|
|
|
|
|
|
|
|
|||||||||
| Cash paid for taxes |
$ | 152 | $ | 287 | $ | 2 | $ | 33 | ||||||||
|
|
|
|
|
|
|
|
|
|||||||||
| Noncash investing and financing activities |
||||||||||||||||
| Notes payable issued to sellers in business combination |
$ | 1,328 | $ | 3,500 | $ | 3,500 | $ | — | ||||||||
|
|
|
|
|
|
|
|
|
|||||||||
See accompanying notes.
F-8
Table of Contents
Notes to Consolidated Financial Statements
1. Organization
Upland Software, Inc. (the Company) was formed on July 7, 2010, as Silverback Acquisition Corporation in the state of Delaware for the purpose of acquiring, optimizing, and building industry-leading software businesses that provide mission-critical software to enterprise customers. The Company acquired its first business on September 13, 2011. On September 19, 2011, the Company changed its name to Silverback Enterprise Group, Inc. On November 13, 2013, the Company changed its name to Upland Software, Inc.
The Company’s headquarters are located in Austin, Texas.
2. Significant Accounting Policies
Basis of Presentation and Principles of Accounting
These consolidated financial statements have been prepared in conformity with accounting principles generally accepted in the United States, or GAAP. The consolidated financial statements include the accounts of the Company and its wholly owned subsidiaries. All intercompany accounts and transactions have been eliminated in consolidation.
Unaudited Interim Financial Information
The accompanying interim consolidated balance sheet at June 30, 2014, the consolidated statements of operations, comprehensive loss and cash flows for the six months ended June 30, 2013 and 2014, and the consolidated statement of stockholders’ deficit for the six months ended June 30, 2014 are unaudited. These unaudited interim consolidated financial statements have been prepared in accordance with U.S. GAAP. In the opinion of management of the Company, the unaudited interim consolidated financial statements have been prepared on the same basis as the audited consolidated financial statements and include all adjustments necessary for a fair presentation. The results of operations for the six months ended June 30, 2014 are not necessarily indicative of the results to be expected for the year ending December 31, 2014 or for any other period.
Unaudited Pro Forma Presentation
The Company has confidentially submitted a Registration Statement on Form S-1 with the Securities and Exchange Commission, or SEC, for the proposed initial public offering, or IPO, of shares of its common stock. If the Company’s IPO is consummated, all outstanding shares of the Company’s preferred stock will convert into 6,834,476 shares of common stock.
The unaudited pro forma stockholders’ equity as of June 30, 2014 was prepared assuming the conversion of all outstanding shares of preferred stock into 6,834,476 shares of common stock as of June 30, 2014. The unaudited pro forma net loss per common share and unaudited pro forma weighted-average shares outstanding for the year ended December 31, 2013 and the six months ended June 30, 2014 were computed assuming the conversion of all outstanding shares of preferred stock, on an as-if-converted basis, at the later of January 1, 2013 or the date of issuance of the preferred stock.
Use of Estimates
The preparation of the accompanying consolidated financial statements in conformity with GAAP requires management to make estimates and assumptions that affect the reported amounts of assets and liabilities, disclosure of contingent assets and liabilities at the date of the consolidated financial statements, and the reported
F-9
Table of Contents
Upland Software, Inc.
Notes to Consolidated Financial Statements (continued)
amounts of revenues and expenses. Significant items subject to such estimates include allowance for doubtful accounts, stock-based compensation, warrant liabilities, acquired intangible assets, the useful lives of intangible assets and property and equipment, and income taxes. In accordance with GAAP, management bases its estimates on historical experience and on various other assumptions that management believes are reasonable under the circumstances. Management regularly evaluates its estimates and assumptions using historical experience and other factors; however, actual results could differ from those estimates.
Cash and Cash Equivalents
Cash and cash equivalents consist of cash deposits and liquid investments with original maturities of three months or less when purchased. Cash equivalents are stated at cost, which approximates market value, because of the short maturity of these instruments.
Accounts Receivable and Allowance for Doubtful Accounts
The Company extends credit to the majority of its customers. Issuance of credit is based on ongoing credit evaluations by the Company of customers’ financial condition and generally requires no collateral. Trade accounts receivable are recorded at the invoiced amount and do not bear interest. Invoices generally require payment within 30 days from the invoice date. The Company generally does not charge interest on past due payments, although the Company’s contracts with its customers usually allow it to do so.
The Company maintains an allowance for doubtful accounts to reserve for potential uncollectible receivables. The allowance is based upon the creditworthiness of the Company’s customers, the customers’ historical payment experience, the age of the receivables, and current market conditions. Provisions for potentially uncollectible accounts are recorded in sales and marketing expenses. The Company writes off accounts receivable balances to the allowance for doubtful accounts when it becomes likely that they will not be collected.
The following table presents the changes in the allowance for doubtful accounts (in thousands):
| Year Ended December 31, | ||||||||
| 2012 | 2013 | |||||||
| Balance at beginning of year |
$ | 10 | $ | 321 | ||||
| Provision |
300 | 725 | ||||||
| Acquisitions |
143 | 295 | ||||||
| Writeoffs, net of recoveries |
(132 | ) | (887 | ) | ||||
|
|
|
|
|
|||||
| Balance at end of year |
$ | 321 | $ | 454 | ||||
|
|
|
|
|
|||||
Concentration of Credit Risk
Financial instruments that potentially subject the Company to credit risk consist of cash and cash equivalents and accounts receivable. The Company’s cash and cash equivalents are placed with high-quality financial institutions, which, at times, may exceed federally insured limits. The Company has not experienced any losses in these accounts, and the Company does not believe it is exposed to any significant credit risk related to cash and cash equivalents. The Company provides credit, in the normal course of business, to a number of its customers. The Company performs periodic credit evaluations of its customers and generally does not require collateral. No individual customer represented more than 10% of total revenues in 2012, 2013 or the six months ended June 30, 2014 (unaudited), or more than 10% of accounts receivable as of December 31, 2012 or 2013 or June 30, 2014 (unaudited).
F-10
Table of Contents
Upland Software, Inc.
Notes to Consolidated Financial Statements (continued)
Property and Equipment
Property and equipment are carried at cost, less accumulated depreciation and amortization. Depreciation of property and equipment is computed using the straight-line method over each asset’s useful life. Leasehold improvements are amortized over the shorter of the lease term of the estimated useful lives of the related assets. Upon retirement or disposal, the cost of each asset and the related accumulated depreciation are removed from the accounts and any resulting gain or loss is credited or charged to income. Repairs, maintenance, and minor replacements are expensed as incurred.
The estimated useful lives of property and equipment are as follows:
| Computer hardware and equipment | 3 – 5 years | |
| Purchased software and licenses | 3 – 5 years | |
| Furniture and fixtures | 7 years | |
| Leasehold improvements | Lesser of estimated useful life or lease term |
Goodwill and Other Intangible Assets
Goodwill arises from business combinations and is measured as the excess of the cost of the business acquired over the sum of the acquisition-date fair value of tangible and identifiable intangible assets acquired, less any liabilities assumed.
Goodwill is evaluated for impairment annually or more frequently when an event occurs or circumstances change that indicate the carrying value may not be recoverable. The events and circumstances considered by the Company include the business climate, legal factors, operating performance indicators and competition.
The Company evaluates the recoverability of goodwill using a two-step impairment process tested at the reporting unit level. The Company has one reporting unit for goodwill impairment purposes. In the first step, the fair value of the reporting unit is compared to the book value, including goodwill. In the case that the fair value is less than the book value, a second step is performed that compares the implied fair value of goodwill to the book value of goodwill. The fair value for the implied goodwill is determined based on the difference between the fair value of the reporting unit and the net fair value of the identifiable assets and liabilities, excluding goodwill. If the implied fair value of the goodwill is less than the book value, the difference is recognized as an impairment charge in the consolidated statement of operations. No goodwill impairment charges were recorded during the years ended December 31, 2012 and 2013 and the six months ended June 30, 2014 (unaudited).
Identifiable intangible assets consist of customer relationships, marketing-related intangible assets and developed technology. Intangible assets with definite lives are amortized over their estimated useful lives on a straight-line basis. The straight-line method of amortization represents the Company’s best estimate of the distribution of the economic value of the identifiable intangible assets.
Intangible assets are reviewed for impairment whenever events or changes in circumstances indicate the carrying amount of intangible assets may not be recoverable. Conditions that would necessitate an impairment assessment include a significant decline in the observable market value of an asset, a significant change in the extent or manner in which an asset is used or any other significant adverse change that would indicate that the carrying amount of an asset or group of assets may not be recoverable. The Company evaluates the recoverability of intangible assets by comparing their carrying amounts to the future net undiscounted cash flows expected to be generated by the intangible assets. If such intangible assets are considered to be impaired, the impairment to be recognized is measured as the amount by which the carrying amount of the intangible assets exceeds the fair value of the assets.
F-11
Table of Contents
Upland Software, Inc.
Notes to Consolidated Financial Statements (continued)
The Company determines fair value based on discounted cash flows using a discount rate commensurate with the risk inherent in the Company’s current business model for the specific intangible asset being valued. The Company determined there was an impairment of the PowerSteering trade name of $1.1 million during 2013.
Long-Lived Assets
Long-lived assets are reviewed for impairment whenever events or circumstances indicate their carrying value may not be recoverable. When such events or circumstances arise, an estimate of future undiscounted cash flows produced by the asset, or the appropriate grouping of assets, is compared to the asset’s carrying value to determine whether impairment exists. If the asset is determined to be impaired, the impairment loss is measured based on the excess of its carrying value over its fair value. Assets to be disposed of are reported at the lower of the carrying value or net realizable value. No indicators of impairment were identified during the years ended December 31, 2012 and 2013 and the six months ended June 30, 2014 (unaudited).
Software Development Costs
Software development costs are expensed as incurred until the point the Company establishes technological feasibility. Technological feasibility is established upon the completion of a working model. Costs incurred by the Company between establishment of technological feasibility and the point at which the product is ready for general release or capitalized, subject to their recoverability, are amortized over the economic life of the related product. Because the Company believes its current process for developing its software products essentially results in the completion of a working product concurrent with the establishment of technological feasibility, no software development costs have been capitalized to date.
Canadian Tax Credits
Canadian tax credits related to current expenses are accounted for as a reduction of the research and development costs. Such credits relate to the Company’s operations in Canada are not dependent upon taxable income. Credits are accrued in the year in which the research and development costs or the capital expenditures are incurred, provided the Company is reasonably certain that the credits will be received. The government credit must be examined and approved by the tax authorities, and it is possible that the amounts granted will differ from the amounts recorded.
Deferred Financing Costs
The Company capitalizes underwriting, legal and other direct costs incurred related to the issuance of debt, which are recorded as deferred charges and amortized to interest expense over the term of the related debt using the effective-interest-rate method. Upon the extinguishment of the related debt, any unamortized, capitalized deferred financing costs are recorded to interest expense. In 2013, the Company wrote off approximately $164,000 of deferred financing costs in connection with the refinancing of its debt facility.
Fair Value of Financial Instruments
The Company accounts for financial instruments in accordance with the authoritative guidance on fair value measurements and disclosures for financial assets and liabilities. This guidance defines fair value, establishes a framework for measuring fair value in accordance with GAAP, and expands disclosures about fair value measurements. The guidance also establishes a three-tier fair value hierarchy, which prioritizes the inputs used in measuring fair value.
F-12
Table of Contents
Upland Software, Inc.
Notes to Consolidated Financial Statements (continued)
These tiers include Level 1, defined as observable inputs, such as quoted prices in active markets; Level 2, defined as inputs other than quoted prices in active markets that are either directly or indirectly observable; and Level 3, defined as unobservable inputs in which little or no market data exists, therefore, requiring an entity to develop its own assumptions.
The Company’s financial instruments consist principally of cash and cash equivalents, accounts receivable, and accounts payable, long –term debt and warrant liabilities. The carrying value of cash and cash equivalents, accounts receivable, and accounts payable approximate fair value, primarily due to short maturities. The carrying values of the Company’s debt instruments approximated their fair value based on rates currently available to the Company. The carrying values of warrant liabilities marked to the market at each reporting period.
Revenue Recognition
The Company derives revenue from product revenue, consisting of subscription, support and perpetual licenses, and professional services revenues. The Company recognizes revenue when all of the following criteria are met: persuasive evidence of an arrangement exists, delivery of the product or services has occurred, no Company obligations with regard to implementation considered essential to the functionality remain, the fee is fixed or determinable and collectability is probable.
Subscription and Support Revenue
The Company derives subscription revenues by providing its software-as-a-service solution to customers in which the customer does not have the right to take possession of the software, but can use the software for the contracted term. The Company accounts for these arrangements as service contracts. Subscription and support revenues are recognized on a straight-line basis over the term of the contractual arrangement, typically one to three years. Amounts that have been invoiced and that are due are recorded in deferred revenue or revenue, depending on when the criteria for revenue recognition are met.
The Company may provide hosting services to customers who purchased a perpetual license. Such hosting services are recognized ratably over the applicable term of the arrangement. These hosting arrangements are typically for a period of one to three years.
Software maintenance agreements provide technical support and the right to unspecified upgrades on an if-and-when-available basis. Revenue from maintenance agreements is recognized ratably over the life of the related agreement, which is typically one year.
Perpetual License Revenue
The Company also records revenue from the sales of proprietary software products under perpetual licenses. For license agreements in which customer acceptance is a condition to earning the license fees, revenue is not recognized until acceptance occurs. The Company’s products do not require significant customization. Revenue on arrangements with customers who are not the ultimate users (primarily resellers) is not recognized until the product is delivered to the end user. Perpetual licenses are sold along with software maintenance and, sometimes, hosting agreements. When vendor specific objective evidence (VSOE) of fair value exists for the software maintenance and hosting agreement, the perpetual license is recognized under the residual method whereby the fair value of the undelivered software maintenance and hosting agreement is deferred and the remaining contract value is recognized immediately for the delivered perpetual license. When VSOE of fair value does not exist for the either the software maintenance or hosting agreement, the entire contract value is recognized ratably over the underlying software maintenance and/or hosting period.
F-13
Table of Contents
Upland Software, Inc.
Notes to Consolidated Financial Statements (continued)
Professional Services Revenue
Professional services provided with perpetual licenses consist of implementation fees, data extraction, configuration, and training. The Company’s implementation and configuration services do not involve significant customization of the software and are not considered essential to the functionality. Revenues from professional services are recognized as such services are provided when VSOE of fair value exists for such services and all undelivered elements such as software maintenance and/or hosting agreements. VSOE of fair value for services is based upon the price charged when these services are sold separately, and is typically an hourly rate. When VSOE of fair value does not exist for software maintenance and/or hosting agreements, revenues from professional services are recognized ratably over the underlying software maintenance and/or hosting period.
Professional services, when sold with the subscription arrangements, are accounted for separately when these services have value to the customer on a standalone basis and there is objective and reliable evidence of fair value for each deliverable. When accounted for separately, revenues are recognized as the services are rendered for time and material contracts. For those arrangements where the elements do not qualify as a separate unit of accounting, the Company recognizes professional services ratably over the contractual life of the related application subscription arrangement.
Multiple Element Arrangements
The Company enters into arrangements with multiple-element that generally include subscriptions and implementation and other professional services.
For multiple-element arrangements, arrangement consideration is allocated to deliverables based on their relative selling price. In order to treat deliverables in a multiple-element arrangement as separate units of accounting, the elements must have standalone value upon delivery. If the elements have standalone value upon delivery, each element must be accounted for separately. The Company’s subscription services have standalone value as such services are often sold separately. In determining whether implementation and other professional services have standalone value apart from the subscription services, the Company considers various factors including the availability of the services from other vendors. The Company has concluded that the implementation services included in multiple-element arrangements have standalone value. As a result, when implementation and other professional services are sold in a multiple-element arrangement, the arrangement consideration is allocated to the identified separate units based on a relative selling price hierarchy. The selling price for a element is based on its VSOE of selling price, if available, third-party evidence of selling price, or TPE, if VSOE is not available or best estimate of selling price, or BESP, if neither VSOE nor TPE is available. The Company has not established VSOE for its subscription services due to lack of pricing consistency, the introduction of new services and other factors. The Company has determined that TPE is not a practical alternative due to differences in its service offerings compared to other parties and the availability of relevant third-party pricing information. Accordingly, the Company uses BESP to determine the relative selling price.
The Company determined BESP by considering its overall pricing objectives and market conditions. Significant pricing practices taken into consideration include the Company’s discounting practices, the size and volume of its transactions, customer characteristics, price lists, go-to-market strategy, historical standalone sales and agreement prices. As the Company’s go-to-market strategies evolve, it may modify its pricing practices in the future, which could result in changes in relative selling prices, and include both VSOE and BESP.
Deferred Revenue
Deferred revenue represents either customer advance payments or billings for which the aforementioned revenue recognition criteria have not yet been met.
F-14
Table of Contents
Upland Software, Inc.
Notes to Consolidated Financial Statements (continued)
Cost of Revenue
Cost of revenue primarily consists of salaries and related expenses (e.g., bonuses, employee benefits, and payroll taxes) for personnel directly involved in the delivery of services and products directly to customers. Cost of revenue also includes the amortization of acquired technology.
Redeemable Preferred Stock Warrant Liability
Warrants to purchase the Company’s redeemable preferred stock are classified as liabilities in the accompanying balance sheet and are recorded at fair value. The warrants are marked to market each reporting period, with the change in fair value recorded as a gain (loss) in the accompanying consolidated statement of operations.
Advertising Costs
Advertising costs are expensed in the period incurred. Advertising costs were not significant for the year ended December 31, 2012 and 2013 and the six months ended June 30, 2014 (unaudited). Advertising costs are recorded in sales and marketing expense in the accompanying consolidated statement of operations for the year ended December 31, 2013 and the six months ended June 30, 2014 (unaudited).
Income Taxes
The Company uses the asset and liability method of accounting for income taxes. Under this method, deferred tax assets and liabilities are recognized for the expected future tax consequences of temporary differences between the carrying amounts and the tax bases of assets and liabilities. Deferred tax assets and liabilities are measured using the enacted tax rates expected to apply to taxable income in the years in which those temporary differences are expected to be recovered or settled. The effect of a change in tax rates on deferred tax assets and liabilities will be recognized in the period that includes the enactment date. A valuation allowance is established against the deferred tax assets to reduce their carrying value to an amount that is more likely than not to be realized.
The Company accounts for uncertainty of income taxes based on a “more-likely-than-not” threshold for the recognition and derecognition of tax positions, which includes the accounting for interest and penalties.
Stock-Based Compensation
Stock options awarded to employees and directors are measured at fair value at each grant date. The Company accounts for stock-based compensation in accordance with authoritative accounting principles that require all share-based compensation to employees, including grants of employee stock options, be recognized in the financial statements based on their estimated fair value. Compensation expense is determined under the fair value method using the Black-Scholes option- pricing model and recognized ratably over the period the awards vest.
The Black-Scholes option-pricing model used to compute share-based compensation expense requires extensive use of accounting judgment and financial estimates. Items requiring estimation include the expected term option holders will retain their vested stock options before exercising them, the estimated volatility of the Company’s common stock price over the expected term of each stock option and the number of stock options that will be forfeited prior to the completion of their vesting requirements. Application of alternative assumptions could result in significantly different share-based compensation amounts being recorded in the financial statements.
F-15
Table of Contents
Upland Software, Inc.
Notes to Consolidated Financial Statements (continued)
The following table summarizes the weighted-average grant-date fair value of options and restricted stock and the assumptions used to develop their fair values:
| Year Ended December 31, |
Six Months Ended June 30, 2014 |
|||||||||||
| 2012 | 2013 | |||||||||||
| (unaudited) | ||||||||||||
| Weighted-average grant-date fair value of options |
$ | 0.79 | $ | 0.91 | $ | 3.35 | ||||||
| Expected volatility |
72.5 | % | 53.3 | % | 55.2 | % | ||||||
| Risk-free interest rate |
0.9 | % | 1.6 | % | 1.6 | % | ||||||
| Expected life in years |
6.29 | 6.29 | 6.29 | |||||||||
| Dividend yield |
— | — | ||||||||||
The Company estimates the fair value of options granted using the Black–Scholes option pricing model. As there was no public market for its common stock, the Company estimates the volatility of its common stock based on the volatility of publicly traded shares of comparable companies’ common stock. The Company’s decision to use the volatility of comparable stock was based upon the Company’s assessment that this information is more representative of future stock price trends than the Company’s historical volatility. The Company estimates the expected term using the simplified method, which calculates the expected term as the midpoint between the vesting date and contractual termination date of each award. The dividend yield assumption is based on historical and expected future dividend payouts. The risk–free interest rate is based on observed market interest rates appropriate for the term of each option.
Comprehensive Loss
The Company utilizes the guidance in Accounting Standards Codification (ASC) Topic 220, Comprehensive Income, for the reporting and display of comprehensive loss and its components in the consolidated financial statements. Comprehensive loss comprises net loss and cumulative foreign currency translation adjustments. The difference between the Company’s net loss and comprehensive loss for the years ended December 31, 2012 and 2013 and the six months ended June 30, 2014 (unaudited) was due to foreign currency translation adjustments.
Foreign Currency Transactions
Certain transactions are denominated in a currency other than the Company’s functional currency, and the Company generates certain assets and liabilities that are fixed in terms of the amount of foreign currency that will be received or paid. At each balance sheet date, the Company adjusts the assets and liabilities to reflect the current exchange rate, resulting in a translation gain or loss. Transaction gains and losses are also realized upon a settlement of a foreign currency transaction in determining net loss for the period in which the transaction is settled. Foreign currency transaction gains and losses were not material for the years ended December 31, 2012 and 2013 and the six months ended June 30, 2014 (unaudited).
Basic and Diluted Net Loss per Common Share
The Company uses the two-class method to compute net loss per common share because the Company has issued securities, other than common stock, that contractually entitle the holders to participate in dividends and earnings of the Company. The two-class method requires earnings for the period to be allocated between common stock and participating securities based upon their respective rights to receive distributed and undistributed earnings. Holders of the Company’s Series A, B, B-1, B-2 and C redeemable convertible preferred stock are entitled, on a pari passu basis, to receive dividends when, as, and if declared by the Board of Directors, prior and in preference
F-16
Table of Contents
Upland Software, Inc.
Notes to Consolidated Financial Statements (continued)
to any declaration or payment of any dividend on the common stock until such time as the total dividends paid on each share of Series A, B, B-1, B-2 and C redeemable convertible preferred stock are equal to the original issue price of the shares. As a result, all series of the Company’s preferred stock are considered participating securities.
Under the two-class method, for periods with net income, basic net income per common share is computed by dividing the net income attributable to common stockholders by the weighted-average number shares of common stock outstanding during the period. Net income attributable to common stockholders is computed by subtracting from net income the portion of the current year earnings that the participating securities would have been entitled to receive pursuant to their dividend rights had all of the year’s earnings been distributed. No such adjustment to earnings is made during periods with a net loss, as the holders of the participating securities have no obligation to fund losses. Diluted net loss per common share is computed under the two-class method by using the weighted-average number of shares of common stock outstanding, plus, for periods with net income attributable to common stockholders, the potential dilutive effects of stock options and warrants. In addition, the Company analyzes the potential dilutive effect of the outstanding participating securities under the if-converted method when calculating diluted earnings per share, in which it is assumed that the outstanding participating securities convert into common stock at the beginning of the period. The Company reports the more dilutive of the approaches as its diluted net income per share during the period. Due to net losses for the years ended December 31, 2012 and 2013 and the six months ended June 30, 2014 and 2013 (unaudited), basic and diluted net loss per share were the same, as the effect of all potentially dilutive securities would have been anti-dilutive.
Recent Accounting Pronouncements
In May 2014, the FASB issued FASB ASU No. 2014-09, Revenue from Contracts with Customers (Topic 606), which supersedes the revenue recognition requirements in ASC 605, Revenue Recognition. The core principle of ASU 2014-09 is that an entity should recognize revenue to depict the transfer of promised goods or services to customers in an amount that reflects the consideration to which the entity expects to be entitled in exchange for those goods or services. The guidance provides a five-step process to achieve that core principle. ASU 2014-09 requires disclosures enabling users of financial statements to understand the nature, amount, timing and uncertainty of revenue and cash flows arising from contracts with customers. Additionally, qualitative and quantitative disclosures are required about contracts with customers, significant judgments and changes in judgments, and assets recognized from the costs to obtain or fulfill a contract. ASU 2014-09 is effective for annual reporting periods beginning after December 15, 2016, including interim periods within that reporting period, using one of two retrospective application methods. Early application is not permitted. The Company is currently evaluating the impact of the provisions of ASC 606.
3. Acquisitions
2011 Acquisition
On September 13, 2011, the Company acquired 100% of the outstanding capital of Visionael Corporation (Visionael) for total purchase consideration of $4,873,000. The Company agreed to pay additional consideration of up to $2,400,000 to the selling shareholders of Visionael based on the successful execution of signed contracts within a 12-month period from the date of acquisition of certain prospective customers identified at closing. The acquisition-date fair value of the contingent payment was measured based on the probability-adjusted present value of the consideration expected to be transferred, which amounted to $873,000. In 2012, approximately $100,000 of additional consideration was paid and the Company recorded income of $771,000 for the decrease in the contingent purchase consideration liability. This reduction in the contingent purchase consideration liability effectively reduces the total purchase consideration down to $4,102,000. In November 2013, Visionael was spun out of the Company (see Note 13). No remaining obligation for additional consideration remains as of December 31, 2013.
F-17
Table of Contents
Upland Software, Inc.
Notes to Consolidated Financial Statements (continued)
2012 Acquisitions
On February 3, 2012, the Company acquired 100% of the outstanding capital of PowerSteering Software, Inc. (PowerSteering) for total purchase consideration of $13,000,000. PowerSteering provides cloud-based program and portfolio management software products that enable customers to gain high-level visibility across their organizations and improve top-down governance and management of programs, initiatives, investments, and projects. Revenues recorded since the acquisition date for the year ended December 31, 2012 were approximately $8,946,000.
On February 10, 2012, the Company acquired 100% of the outstanding capital of Tenrox, Inc. (Tenrox) for total purchase consideration of $15,328,000, plus the value realized from the utilization of research and development credits and plus/minus any resulting changes to income taxes owed for periods prior to the acquisition. The Company recorded a liability of approximately $3,900,000 at the date of acquisition, for the estimated additional tax-related payments to the seller, of which approximately $1,500,000 was paid during 2012. Tenrox provides cloud-based project workforce management software products that enable organizations to more effectively manage their knowledge workers to better track work, expenses and client billing while improving scheduling, utilization, and alignment of human capital. Revenues recorded since the acquisition date for the year ended December 31, 2012 were approximately $13,300,000.
On November 13, 2012, the Company acquired 100% of the outstanding units of LMR Solutions LLC, dba EPM Live (EPM Live) for total purchase consideration of $7,732,000, which includes a cash payment of $5,775,000 at closing, $600,000 paid in cash in November 2013, notes payable to the seller of $1,328,000 (at present value), and 131,168 shares of the Company’s Series B-1 redeemable convertible preferred stock with a fair value of $800,000. The shares of the Company’s B-1 preferred stock are restricted, and vesting is contingent upon continued employment. The Company is accounting for such shares as compensation as vesting occurs. EPM Live provides cloud-based project management and collaboration software products that enable customers to improve collaboration and the execution of both projects and unstructured work. Revenues recorded since the acquisition date for the year ended December 31, 2012 were approximately $727,000.
2013 Acquisitions
On May 16, 2013, the Company acquired 100% of the outstanding capital of FileBound Solutions, Inc. and Marex Group, Inc. (together FileBound) for total purchase consideration of $14,650,000, which includes cash at closing of $182,000, notes payable to the seller of $3,500,000 (at present rate) and 106,572 shares of the Company’s series B-1 preferred stock with a fair value of $624,000. FileBound provides cloud-based enterprise content management software products that enable customers to automate document-based workflows and control access and distribution of their content to boost productivity, encourage collaboration and improve compliance. Revenues recorded since the acquisition date for the year ended December 31, 2013 were approximately $4,959,000.
On November 7, 2013, the Company acquired 100% of the outstanding interest of ComSci, LLC. (ComSci) for total purchase consideration of $7,568,000, which includes cash at closing of $104,000, 155,599 shares of the Company’s common stock, 155,598 shares of the company’s B-2 preferred stock with a fair value of $949,000, and $750,000 to be paid in November 2014. ComSci provides cloud-based financial management software products that enable organizations to have visibility into the cost, quality, and value of internal services delivered within their organizations. Revenues recorded since the acquisition date for the year ended December 31, 2013 were approximately $937,000.
On December 23, 2013, the Company acquired 100% of the outstanding capital of Clickability, Inc. (Clickability) for total purchase consideration of $12,281,000. Clickability provides cloud-based enterprise
F-18
Table of Contents
Upland Software, Inc.
Notes to Consolidated Financial Statements (continued)
content management software products that are used by enterprise marketers and media companies to create, maintain and deliver web sites that shape visitor experiences and empower nontechnical staff to create, manage, publish, analyze and refine content and social media assets without IT intervention. For accounting purposes, the acquisition of Clickability was recorded on December 31, 2013 and, accordingly, the operations of Clickability had no impact on the Company’s statement of operations. The operations of Clickability from December 23, 2013 to December 31, 2013 were not material.
The Company recorded the purchase of the 2012 and 2013 acquisitions described above using the acquisition method of accounting and, accordingly, recognized the assets acquired and liabilities assumed at their fair values as of the date of the acquisition. The results of operations of the 2012 and 2013 acquisitions are included in the Company’s consolidated results of operations beginning with the date of the acquisition.
The following condensed table presents the acquisition-date fair value of the assets acquired and liabilities assumed for the 2012 and 2013 acquisitions (in thousands):
| PowerSteering | Tenrox | EPM Live | FileBound | ComSci | Clickability | |||||||||||||||||||
| Cash |
$ | 1,424 | $ | 1,521 | $ | 388 | $ | 182 | $ | 104 | $ | — | ||||||||||||
| Accounts receivable |
2,160 | 2,385 | 1,369 | 1,940 | 951 | 1,773 | ||||||||||||||||||
| Other current assets |
187 | 312 | 19 | 153 | 47 | 297 | ||||||||||||||||||
| Canadian tax credit receivable |
— | 4,561 | — | — | — | — | ||||||||||||||||||
| Property and equipment |
203 | 575 | 242 | 927 | 61 | 1,519 | ||||||||||||||||||
| Customer relationships |
7,200 | 7,400 | 2,680 | 3,600 | 2,000 | 4,400 | ||||||||||||||||||
| Trade name |
1,210 | 190 | 460 | 320 | 180 | 250 | ||||||||||||||||||
| Technology |
2,200 | 2,680 | 1,770 | 2,040 | 810 | 2,500 | ||||||||||||||||||
| Goodwill |
5,671 | 10,612 | 2,419 | 7,188 | 3,851 | 3,401 | ||||||||||||||||||
| Other assets |
— | — | 24 | 21 | 8 | — | ||||||||||||||||||
|
|
|
|
|
|
|
|
|
|
|
|
|
|||||||||||||
| Total assets acquired |
20,255 | 30,236 | 9,371 | 16,371 | 8,012 | 14,140 | ||||||||||||||||||
| Accounts payable |
542 | 243 | 115 | 113 | 260 | 154 | ||||||||||||||||||
| Accrued expense and other |
2,310 | 2,694 | 684 | 266 | 106 | 100 | ||||||||||||||||||
| Deferred tax liabilities |
— | 3,207 | — | — | — | — | ||||||||||||||||||
| Deferred revenue |
4,403 | 4,870 | 840 | 1,342 | 78 | 1,605 | ||||||||||||||||||
| Canadian tax credit liability to seller |
— | 3,894 | — | — | — | — | ||||||||||||||||||
|
|
|
|
|
|
|
|
|
|
|
|
|
|||||||||||||
| Total liabilities assumed |
7,255 | 14,908 | 1,639 | 1,721 | 444 | 1,859 | ||||||||||||||||||
|
|
|
|
|
|
|
|
|
|
|
|
|
|||||||||||||
| Total consideration |
$ | 13,000 | $ | 15,328 | $ | 7,732 | $ | 14,650 | $ | 7,568 | $ | 12,281 | ||||||||||||
|
|
|
|
|
|
|
|
|
|
|
|
|
|||||||||||||
Tangible assets were valued at their respective carrying amounts, which approximates their estimated fair value. The valuation of identifiable intangible assets reflects management’s estimates based on, among other factors, use of established valuation methods. Customer relationships were valued using an income approach, which estimates fair value based on the earnings and cash flow capacity of the subject asset. The value of the marketing-related intangibles was determined using a relief-from-royalty method, which estimates fair value based on the value the owner of the asset receives from not having to pay a royalty to use the asset. Developed technology was valued using a cost-to-recreate approach.
Goodwill for PowerSteering, EPM Live, FileBound and ComSci is deductible for tax purposes.
F-19
Table of Contents
Upland Software, Inc.
Notes to Consolidated Financial Statements (continued)
Pro forma Results (Unaudited)
The following unaudited pro forma supplemental information presents an aggregated summary of the Company’s results of operations for the years ended December 31, 2012 and 2013, assuming the completion of the 2012 acquisitions of PowerSteering, Tenrox, and EPM Live and the completion of the 2013 acquisitions of FileBound and ComSci, had occurred on January 1, 2012.
The unaudited pro forma supplemental information presented below is based on estimates and assumptions that we believe are reasonable. The unaudited pro forma supplemental information that we have prepared is not necessarily indicative of the results of income in future periods or the results that actually would have been realized had the acquired businesses been combined with our operations during the specified periods.
| Year Ended December 31, | ||||||||
| 2012 | 2013 | |||||||
| (in thousands) | ||||||||
| Revenues |
$ | 45,947 | $ | 49,223 | ||||
| Operating income (loss) |
$ | (1,769 | ) | $ | (5,402 | ) | ||
4. Goodwill and Other Intangible Assets, Net
Changes in the Company’s goodwill balance for the years ended December 31, 2012 and 2013 are summarized in the table below (in thousands):
| Balance at January 1, 2012 |
$ | 2,245 | ||
| Acquired in business combinations |
18,702 | |||
| Finalization of 2012 business combination |
112 | |||
| Foreign currency translation adjustment |
34 | |||
|
|
|
|||
| Balance at December 31, 2012 |
21,093 | |||
| Acquired in business combinations |
14,440 | |||
| Goodwill allocated to Visionael spin-out |
(1,201 | ) | ||
| Foreign currency translation adjustment |
(702 | ) | ||
|
|
|
|||
| Balance at December 31, 2013 |
33,630 | |||
| Finalization of 2013 business combination (unaudited) |
(82 | ) | ||
| Foreign currency translation adjustment (unaudited) |
32 | |||
|
|
|
|||
| Balance at June 30, 2014 (unaudited) |
$ | 33,580 | ||
|
|
|
Intangible assets, net, include the estimated acquisition-date fair values of customer relationships, marketing-related assets, and developed technology that the Company recorded as part of its business acquisitions in 2012 and 2013. The following is a summary of the Company’s intangible assets, net (in thousands):
| Estimated Useful Life (Years) |
Gross Carrying Amount |
Accumulated Amortization |
Net Carrying Amount |
|||||||||||
| December 31, 2012 |
||||||||||||||
| Customer relationships |
10 | $ | 19,460 | $ | 1,632 | $ | 17,828 | |||||||
| Trade name |
3–10 | 886 | 100 | 786 | ||||||||||
| Trade name |
Indefinite | 1,210 | — | 1,210 | ||||||||||
| Developed technology |
7 | 7,354 | 790 | 6,564 | ||||||||||
|
|
|
|
|
|
|
|||||||||
| Total intangible assets |
$ | 28,910 | $ | 2,522 | $ | 26,388 | ||||||||
|
|
|
|
|
|
|
|||||||||
F-20
Table of Contents
Upland Software, Inc.
Notes to Consolidated Financial Statements (continued)
| Estimated Useful Life (Years) |
Gross Carrying Amount |
Accumulated Amortization |
Net Carrying Amount |
|||||||||||
| December 31, 2013 |
||||||||||||||
| Customer relationships |
10 | $ | 26,799 | $ | 3,244 | $ | 23,555 | |||||||
| Trade name |
3 | 2,598 | 1,422 | 1,176 | ||||||||||
| Developed technology |
4-7 | 11,825 | 1,809 | 10,016 | ||||||||||
|
|
|
|
|
|
|
|||||||||
| Total intangible assets |
$ | 41,222 | $ | 6,475 | $ | 34,747 | ||||||||
|
|
|
|
|
|
|
|||||||||
| Estimated Useful Life (Years) |
Gross Carrying Amount |
Accumulated Amortization |
Net Carrying Amount |
|||||||||||
| June 30, 2014 (unaudited) |
||||||||||||||
| Customer relationships |
10 | $ | 26,821 | $ | 4,591 | $ | 22,230 | |||||||
| Trade name |
3 | 2,598 | 1,728 | 870 | ||||||||||
| Developed technology |
4-7 | 11,834 | 2,724 | 9,110 | ||||||||||
|
|
|
|
|
|
|
|||||||||
| Total intangible assets |
$ | 41,253 | $ | 9,043 | $ | 32,210 | ||||||||
|
|
|
|
|
|
|
|||||||||
The following table summarizes the Company’s weighted-average amortization period, in total and by major finite-lived intangible asset class, by acquisition during the year ended December 31 (in years):
| 2012 | 2013 | |||||||
| Customer relationships |
10 | 10 | ||||||
| Trade name |
5 | 3 | ||||||
| Developed technology |
7 | 6.6 | ||||||
|
|
|
|
|
|||||
| Total weighted-average amortization period |
9 | 8.7 | ||||||
|
|
|
|
|
|||||
The Company periodically reviews the estimated useful lives of its identifiable intangible assets, taking into consideration any events or circumstances that might result in either a diminished fair value or revised useful life. In 2013, management changed its intention to use the PowerSteering trade name on a Company-wide basis and, accordingly, changed the useful life of such trade name from indefinite to a definite life of three years. As a result, the Company recorded an amortization charge of $1,060,000 in 2013 related to the PowerSteering trade name. Management has determined there have been no other indicators of impairment or change in the useful life during the years ended December 31, 2012 and 2013 and the six months ended June 30, 2014 (unaudited). Total amortization expense was $2,428,000, $4,805,000 and $2,545,000 during the years ended December 31, 2012 and 2013 and the six months ended June 30, 2014 (unaudited), respectively.
Estimated annual amortization expense for the next five years and thereafter is as follows (in thousands):
| Amortization Expense |
||||
| Year ending December 31: |
||||
| 2014 |
$ | 5,117 | ||
| 2015 |
4,895 | |||
| 2016 |
4,678 | |||
| 2017 |
4,471 | |||
| 2018 and thereafter |
15,586 | |||
|
|
|
|||
| $ | 34,747 | |||
|
|
|
|||
F-21
Table of Contents
Upland Software, Inc.
Notes to Consolidated Financial Statements (continued)
5. Property and Equipment, Net
Property and equipment at December 31 consisted of the following (in thousands):
| 2012 | 2013 | |||||||
| Equipment (including equipment under capital lease of $90 and $1,640 for 2012 and 2013, respectively) |
$ | 1,812 | $ | 3,498 | ||||
| Furniture and fixtures |
— | 607 | ||||||
| Leasehold improvements |
— | 2,297 | ||||||
| Accumulated depreciation |
(405 | ) | (2,460 | ) | ||||
|
|
|
|
|
|||||
| Property and equipment, net |
$ | 1,407 | $ | 3,942 | ||||
|
|
|
|
|
|||||
Amortization of assets recorded under capital leases is included with depreciation expense. Depreciation and amortization expense on property and equipment was $390,000 and $791,000 for the years ended December 31, 2012 and 2013, respectively. The Company recorded no impairment of property and equipment and recorded no gains or losses on the disposal of property and equipment during the years ended December 31, 2012 and 2013.
6. Long-Term Debt
Long-term debt consisted of the following at December 31 (in thousands):
| 2012 | 2013 | |||||||
| Senior secured notes (less discount of $123 at December 31, 2013) |
$ | 13,054 | $ | 20,678 | ||||
| Revolving credit facility |
— | 3,067 | ||||||
| Seller notes due 2014 (less discount of $134 and $62 at December 31, 2012 and 2013, respectively) |
1,366 | 1,438 | ||||||
| Seller notes due 2015 |
— | 3,000 | ||||||
| Seller notes due 2016 |
— | 500 | ||||||
| Related party note due 2014 |
300 | — | ||||||
|
|
|
|
|
|||||
| 14,720 | 28,683 | |||||||
| Less current maturities |
(3,800 | ) | (5,245 | ) | ||||
|
|
|
|
|
|||||
| Total long-term debt |
$ | 10,920 | $ | 23,438 | ||||
|
|
|
|
|
|||||
Loan and Security Agreements
U.S. Loan Agreement
On March 5, 2012, the Company entered into a loan and security agreement with Comerica Bank (as amended, the U.S. Loan Agreement). The U.S. Loan Agreement provides the Company and certain of its subsidiaries, as co-borrowers, a secured accounts receivable revolving loan facility of up to $5.0 million and a secured term loan facility of up to $19.5 million, for a total loan facility of up to $24.5 million. As of December 31, 2012, the Company had $7.6 million outstanding as term loans under the U.S. Loan Agreement. As of December 31, 2013, the Company had $2.1 million outstanding as revolving loans and $19.1 million as term loans under the U.S. Loan Agreement. As of June 30, 2014, the Company had $3.6 million (unaudited) outstanding as revolving loans and $17.9 million (unaudited) as term loans under the U.S. Loan Agreement.
Revolving loans and term loans bear interest at a floating rate equal to Comerica Bank’s prime rate plus 1.75% (5% at December 31, 2012 and 2013). Interest on the revolving loans and the term loans is due and payable monthly. Revolving loans may be borrowed, repaid and reborrowed until April 11, 2015, when all outstanding
F-22
Table of Contents
Upland Software, Inc.
Notes to Consolidated Financial Statements (continued)
revolving loan amounts must be repaid. Term loan advances may be requested until April 11, 2014. From November 1, 2013 to March 1, 2014, an amount equal to 5% of the principal outstanding on all term loan advances on October 2, 2013 is payable in monthly installments during such period. Between April 1, 2014 and March 1, 2015 an amount equal to 15% of the principal outstanding on all term loan advances on April 11, 2014 is payable in monthly installments during such period. From April 1, 2015 to March 1, 2016 an amount equal to 25% of the principal outstanding on all term loan advances on April 11, 2014 is payable in monthly installments during such period. From April 1, 2016 to March 1, 2017, an amount equal to 25% of the principal outstanding on all term loan advances on April 11, 2014 is payable in monthly installments on the first day of each month during such period. From April 1, 2017 to March 1, 2018, an amount equal to 30% of principal outstanding on all term loan advances on April 11, 2014 is payable in monthly installments during such period. All outstanding principal and interest under the term loan facility must be repaid on April 11, 2018. The revolving loan facility and the term loan facility may be prepaid prior to their respective termination dates without penalty or premium. Starting June 1, 2015, the Company and the other borrowers may be required to begin prepaying certain term loan advances with a percentage of our excess cash flow, if any.
The Company’s obligations and the obligations of the other borrowers under the loan facility are secured by a security interest on substantially all of the Company’s assets and the other borrowers’ assets, including intellectual property. The Company’s other and future subsidiaries may also be required to become co-borrowers or guarantors under the loan facility and grant a security interest on their assets in connection therewith.
The U.S. Loan Agreement contains customary affirmative covenants and customary negative covenants limiting the Company’s ability and the ability of the Company’s subsidiaries to, among other things, dispose of assets, undergo a change in control, merge or consolidate, make acquisitions, incur debt, incur liens, pay dividends, repurchase stock and make investments, in each case subject to certain exceptions. The Company and the other borrowers must also comply with a minimum cash financial covenant, minimum fixed charge ratio financial covenant, maximum indebtedness to adjusted EBITDA financial covenant, and minimum EBITDA financial covenant. The Company was in compliance with all financial covenants as of December 31, 2013 and June 30, 2014 (unaudited).
The U.S. Loan Agreement also contains customary events of default including, among others, payment defaults, breaches of covenants defaults, material adverse change defaults, bankruptcy and insolvency event defaults, cross defaults with certain material indebtedness, judgment defaults, and breaches of representations and warranties defaults. Upon an event of default, Comerica Bank may declare all or a portion of the outstanding obligations payable to be immediately due and payable and exercise other rights and remedies provided for under the loan facility and any related guaranty, including a requirement that any guarantor pay all of the outstanding obligations under its guaranty and a right by Comerica Bank to exercise remedies under any security agreement related to such guaranty. During the existence of an event of default, interest on the obligations could be increased by 5.0%.
In connection with the entry into the U.S. Loan Agreement in March 2012, the Company granted a warrant to purchase 19,675 shares of the Company’s Series B preferred stock at $1.00 per share. The warrant is exercisable for 10 years. The fair value of the warrant was not significant as of the date of issuance or as of December 31, 2012. In connection with the amendment of U.S. Loan Agreement in December 2012, the Company granted a warrant to purchase 6,558 shares of the Company’s Series B preferred stock at $1.00 per share. The warrant is exercisable for 10 years. The fair value of the warrant was not significant as of the date of issuance or as of December 31, 2012. In connection with the amendment of the U.S. Loan Agreement in April 2013, the Company granted a warrant to purchase 37,164 shares of the Company’s Series B preferred stock at $1.00 per share which replaced the aforementioned warrant to purchase 6,558 shares of the Company’s Series B Preferred Stock. The
F-23
Table of Contents
Upland Software, Inc.
Notes to Consolidated Financial Statements (continued)
warrant is exercisable for 10 years. The fair value of the warrant at the time of issuance was determined to be $158,000. The Company recorded a debt discount in the amount of $158,000 which is being accreted as interest expense over the term of the underlying note using the interest method.
Canadian Loan Agreement
On February 10, 2012, Tenrox Inc., a Canadian corporation and the Company’s wholly-owned subsidiary (the Canadian Subsidiary), entered into a loan and security agreement with Comerica Bank (as amended, the Canadian Loan Agreement). The Canadian Loan Agreement provides a secured accounts receivable revolving loan facility of up to $3.0 million and a secured term loan facility of up to $2.5 million, for a total loan facility of up to $5.5 million. As of December 31, 2012, the Canadian Subsidiary had $5.4 million outstanding as term loans under the Canadian Loan Agreement. As of December 31, 2013, the Canadian Subsidiary had $1.0 million outstanding as revolving loans and $1.7 million as term loans under the Canadian Loan Agreement. As of June 30, 2014, the Company had no outstanding revolving loans (unaudited) and $1.0 million (unaudited) as term loans the Canadian Loan Agreement.
Revolving loans and term loans bear interest at a floating rate equal to Comerica Bank’s prime rate plus 1.75%. Interest on the revolving loans and the term loans is due and payable monthly. Revolving loans may be borrowed, repaid and reborrowed until April 11, 2015, when all outstanding revolving loan amounts must be repaid. Principal on the term loan advance is payable in 24 equal monthly installments beginning on May 1, 2013 and continuing each month until paid in full. All outstanding principal and interest under the term loan facility must be repaid on April 11, 2015. The revolving loan facility and the term loan facility may be prepaid prior to their respective termination dates without penalty or premium.
The Canadian Subsidiary’s obligations under the loan facility are secured by a security interest on substantially all of its assets, including its intellectual property. Additionally, we and certain of our domestic subsidiaries provided guarantees of the loan facility secured by substantially all of our and such subsidiaries’ assets, including intellectual property. Furthermore, our other and future subsidiaries may be required to become co-borrowers or guarantors under the loan facility and grant a security interest on its assets in connection therewith.
The Canadian Loan Agreement and the security agreements contain customary affirmative covenants and customary negative covenants limiting our ability, the Canadian Subsidiary’s ability and the ability of our subsidiaries to, among other things, dispose of assets, undergo a change in control, merge or consolidate, make acquisitions, incur debt, incur liens, pay dividends, repurchase stock and make investments, in each case subject to certain exceptions. The Canadian Subsidiary must also comply with a minimum cash financial covenant, minimum fixed charge ratio financial covenant, maximum indebtedness to adjusted EBITDA financial covenant and minimum EBITDA financial covenant. The Company was in compliance with all financial covenants as of December 31, 2013 and June 30, 2014 (unaudited).
The Canadian Loan Agreement and the security agreements also contain customary events of default including, among others, payment defaults, breaches of covenants defaults, material adverse change defaults, bankruptcy and insolvency event defaults, cross defaults with certain material indebtedness, judgment defaults, and breaches of representations and warranties defaults. Upon an event of default, Comerica Bank may declare all or a portion of the Canadian Subsidiary’s outstanding obligations payable to be immediately due and payable and exercise other rights and remedies provided for under the loan facility, including a requirement that any guarantor pay all of the outstanding obligations under their respective guaranty and a right by Comerica Bank to exercise remedies under any security agreement related to such guaranty. During the existence of an event of default, interest on the obligations could be increased by 5.0%.
F-24
Table of Contents
Upland Software, Inc.
Notes to Consolidated Financial Statements (continued)
In connection with the entry into the Canadian Loan Agreement in February 2012, the Company granted Comerica Bank a warrant to purchase 19,675 shares of the Company’s Series A preferred stock at $6.10 per share. The warrant is exercisable for 10 years. The fair value of the warrant was not significant as of the date of issuance.
Seller Notes
In November 2012, the Company issued seller notes payable in connection with the acquisition of EPM Live. The notes have an aggregate principal amount of $1,500,000 with no stated interest rate. The notes were recorded at their estimated fair value of $1,400,000 at the acquisition date, and imputed interest will be accreted to noncash interest expense to the maturity date using a 5% interest rate. The notes are due in November 2014.
In May 2013, the Company issued seller notes payable in connection with the acquisition of FileBound. The notes have an aggregate principal amount of $3.5 million with 5% stated interest. $3.0 million of the notes are due in May 2015 and $500,000 million of the notes are due in May 2016.
Related Party Notes Payable
In February 2012, the Company issued a promissory note to a related party for an aggregate principal amount of $1,500,000. The unpaid principal amount of this note bears interest at a rate of 6.0% per year. All unpaid principal and interest become due and were paid in August 2012.
In November 2012, the Company issued a promissory note to the related party for an aggregate principal amount of $1,500,000. The unpaid principal amount of this note bears interest at a rate of 6.0% per year. All unpaid principal and interest became due on May 9, 2013. The Company repaid $1,200,000 of this note in December 2012, then borrowed $1,000,000 in January 2013 and paid the note in full in April 2013. At December 31, 2012, the outstanding borrowing under this agreement was $300,000.
Debt Maturities
The Company believes the carrying value of its long-term debt at December 31, 2013 approximates its fair value based on the variable interest rate feature or based upon interest rates currently available to the Company.
Future debt maturities of long-term debt are as follows (in thousands):
| Year ending December 31: |
||||
| 2014 |
$ | 5,529 | ||
| 2015 |
10,871 | |||
| 2016 |
5,375 | |||
| 2017 |
5,606 | |||
| 2018 |
1,487 | |||
| Thereafter |
— | |||
|
|
|
|||
| $ | 28,868 | |||
|
|
|
Debt Issuance Costs
The Company incurred aggregate debt issuance costs of $283,000 in 2012 and $136,000 in 2013 in connection with its U.S. Loan Agreement and Canadian Loan Agreement. These costs are being amortized to noncash interest expense over the terms of the related indebtedness using the effective-interest method. Noncash interest expense, including the write-off of the unamortized balance of previously existing deferred financing costs of
F-25
Table of Contents
Upland Software, Inc.
Notes to Consolidated Financial Statements (continued)
$164,000 in 2013, related to these costs was $86,000 and $236,000 for the years ended December 31, 2012 and 2013, respectively.
The estimated amortization of these debt issuance costs through the maturity of the related borrowings is as follows (in thousands):
| Year ending December 31: |
||||
| 2014 |
$ | 54 | ||
| 2015 |
28 | |||
| 2016 |
11 | |||
| 2017 |
5 | |||
|
|
|
|||
| $ | 98 | |||
|
|
|
Convertible Promissory Notes
In October 2013, the Company issued $4.9 million of promissory notes to investors bearing interest at 5% per annum with a maturity date of October 2014. Such promissory notes are automatically converted into shares of preferred stock upon the occurrence of a qualified financing. The conversion price for the shares of preferred stock is 80% of the price paid by other investors in the qualified financing. Such conversion price represents a beneficial conversion feature in the amount of $1.2 million which was recorded as interest expense. In December 2013, all of the promissory notes were converted into shares of Series C preferred stock.
7. Commitments and Contingencies
Operating Leases
The Company leases office space under operating leases that expire between 2014 and 2016.
Future minimum lease payments under operating and capital lease obligations are as follows (in thousands):
| Capital Leases |
Operating Leases |
|||||||
| 2014 |
$ | 446 | $ | 1,095 | ||||
| 2015 |
332 | 976 | ||||||
| 2016 |
215 | 636 | ||||||
| 2017 |
121 | 289 | ||||||
| 2018 |
20 | 50 | ||||||
|
|
|
|
|
|||||
| Total minimum lease payments |
1,134 | $ | 3,046 | |||||
|
|
|
|||||||
| Less amount representing interest |
(135 | ) | ||||||
|
|
|
|||||||
| Present value of capital lease obligations |
999 | |||||||
| Less current portion of capital lease obligations |
(398 | ) | ||||||
|
|
|
|||||||
| Long-term capital lease obligations |
$ | 601 | ||||||
|
|
|
|||||||
In addition, the Company has an outstanding purchase commitment for software development services pursuant to a technology services agreement in the amount of $2.1 million in 2014. For years after 2014, the purchase commitment amount for software development services will be equal to the prior year purchase commitment increased (decreased) by the percentage change in total revenue for the prior year as compared to the preceding year. For example, if 2014 total revenues increase by 10% as compared to 2013 total revenues, then the 2015 purchase commitment would increase by approximately $213,175 from the 2014 purchase commitment amount
F-26
Table of Contents
Upland Software, Inc.
Notes to Consolidated Financial Statements (continued)
to $2,344,925. A similar 10% increase in 2015 total revenues as compared to 2014 total revenues would increase the 2016 purchase commitment amount from the 2015 purchase commitment amount of $2,344,925 by approximately $234,493 to $2,579,418.
Total rent expense for the years ended December 31, 2012 and 2013 was approximately $382,000 and $832,000, respectively. The current and long-term portion of capital lease obligations are recorded in the accrued expenses and other and other long-term liabilities line items on the balance sheet, respectively.
The Company has a letter of credit for an office lease with a bank in the amount of $150,000.
Litigation
In the normal course of business, the Company may become involved in various lawsuits and legal proceedings. While the ultimate results of these matters cannot be predicted with certainty, management does not expect them to have a material adverse effect on the consolidated financial position or results of operations of the Company.
8. Income Taxes
The Company’s loss from continuing operations before income taxes for the years ended December 31 was as follows (in thousands):
| 2012 | 2013 | |||||||
| Income (loss) before provision for income taxes: |
||||||||
| United States |
$ | (3,971 | ) | $ | (9,267 | ) | ||
| Foreign |
(399 | ) | 1,420 | |||||
|
|
|
|
|
|||||
| $ | (4,370 | ) | $ | (7,847 | ) | |||
|
|
|
|
|
|||||
The components of the provision (benefit) for income taxes attributable to continuing operations for the year ended December 31 are as follows (in thousands):
| 2012 | 2013 | |||||||
| Current |
||||||||
| Federal |
$ | — | $ | — | ||||
| State |
6 | 18 | ||||||
| Foreign |
57 | 1,136 | ||||||
|
|
|
|
|
|||||
| Total Current |
63 | 1,154 | ||||||
| Deferred |
||||||||
| Federal |
58 | (417 | ) | |||||
| State |
8 | (67 | ) | |||||
| Foreign |
(201 | ) | 38 | |||||
|
|
|
|
|
|||||
| Total Deferred |
(135 | ) | (446 | ) | ||||
|
|
|
|
|
|||||
| $ | (72 | ) | $ | 708 | ||||
|
|
|
|
|
|||||
As of December 31, 2013, the Company had federal net operating loss carryforwards of approximately $45 million and research and development credit carryforwards of approximately $0.8 million. The net operating loss and credit carryforwards will expire beginning in 2018, if not utilized. Utilization of the net operating losses and tax credits will be subject to substantial annual limitation due to the “change of ownership” provisions of the Internal Revenue Code of 1986. The annual limitation will result in the expiration of $16.2 million of net operating losses and $0.8 million of credit carryforwards before utilization.
F-27
Table of Contents
Upland Software, Inc.
Notes to Consolidated Financial Statements (continued)
Deferred income taxes reflect the net tax effects of temporary differences between the carrying amounts of assets and liabilities for financial reporting purposes and the amounts used for income tax purposes. Significant components of the Company’s deferred taxes as of December 31 are as follows (in thousands):
| 2012 | 2013 | |||||||
| Deferred tax assets: |
||||||||
| Current deferred tax assets: |
||||||||
| Accrued expenses and allowances |
$ | 342 | $ | 448 | ||||
| Deferred revenue |
495 | 164 | ||||||
| Other |
68 | 39 | ||||||
| Valuation allowance for current deferred tax assets |
(408 | ) | (641 | ) | ||||
|
|
|
|
|
|||||
| Net current deferred tax assets |
497 | 10 | ||||||
|
|
|
|
|
|||||
| Noncurrent deferred tax assets: |
||||||||
| Intangible assets |
— | — | ||||||
| Stock compensation |
— | 136 | ||||||
| Net operating loss and tax credit carryforwards |
5,933 | 9,138 | ||||||
| Other |
5 | 102 | ||||||
| Valuation allowance for noncurrent deferred tax assets |
(2,443 | ) | (4,872 | ) | ||||
|
|
|
|
|
|||||
| Net noncurrent deferred tax assets |
$ | 3,495 | $ | 4,504 | ||||
|
|
|
|
|
|||||
| Deferred tax liabilities: |
||||||||
| Current deferred tax liabilities: |
||||||||
| Prepaid expenses |
$ | (7 | ) | $ | (10 | ) | ||
|
|
|
|
|
|||||
| Total current deferred tax liabilities |
(7 | ) | (10 | ) | ||||
|
|
|
|
|
|||||
| Noncurrent deferred tax liabilities: |
||||||||
| Stock compensation |
(43 | ) | — | |||||
| Capital expenses |
(33 | ) | (529 | ) | ||||
| Intangible assets |
(7,579 | ) | (7,059 | ) | ||||
| Goodwill |
(132 | ) | — | |||||
|
|
|
|
|
|||||
| Total noncurrent deferred tax liabilities |
$ | (7,787 | ) | $ | (7,588 | ) | ||
|
|
|
|
|
|||||
| Net current deferred tax asset |
$ | 490 | $ | — | ||||
|
|
|
|
|
|||||
| Net noncurrent deferred tax liability |
$ | (4,292 | ) | $ | (3,084 | ) | ||
|
|
|
|
|
|||||
| Net deferred taxes |
$ | (3,802 | ) | $ | (3,084 | ) | ||
|
|
|
|
|
|||||
Due to the uncertainty surrounding the timing of realizing the benefits of its domestic favorable tax attributes in future tax returns, the Company has placed a valuation allowance against its domestic net deferred tax asset, exclusive of goodwill. During the years ended December 31, 2012 and 2013, the valuation allowance increased by approximately $811,000 and $4,048,000, respectively, due primarily to operations and acquisitions, and decreased by approximately $0 and $1,386,000, respectively, due to the distribution of Visionael.
Undistributed earnings of the Company’s foreign subsidiaries are considered permanently reinvested and, accordingly, no provision for U.S. federal or state income taxes has been provided thereon. The Company had no undistributed earnings from its foreign subsidiaries at December 31, 2012 and 2013.
F-28
Table of Contents
Upland Software, Inc.
Notes to Consolidated Financial Statements (continued)
The Company’s provision for income taxes differs from the expected tax (expense) benefit amount computed by applying the statutory federal income tax rate of 34% to income before taxes due to the following for the year ended December 31:
| Year Ended December 31, | ||||||||
| 2012 | 2013 | |||||||
| Federal statutory rate |
34.0 | % | 34.0 | % | ||||
| State taxes, net of federal benefit |
26.5 | 4.3 | ||||||
| Tax credits |
5.0 | (5.3 | ) | |||||
| Effect of foreign operations |
(0.8 | ) | 2.0 | |||||
| Permanent items and other |
7.5 | (13.7 | ) | |||||
| Tax carryforwards not benefited |
(70.7 | ) | (30.3 | ) | ||||
|
|
|
|
|
|||||
| 1.5 | % | (9.0 | )% | |||||
|
|
|
|
|
|||||
Under ASC 740–10, Income Taxes – Overall, the Company periodically reviews the uncertainties and judgments related to the application of complex income tax regulations to determine income tax liabilities in several jurisdictions. The Company uses a “more-likely-than-not” criterion for recognizing an asset for unrecognized income tax benefits or a liability for uncertain tax positions. The Company has determined it has the following unrecognized assets or liabilities related to uncertain tax positions as of December 31, 2013. The Company does not anticipate any significant changes in such uncertainties and judgments during the next 12 months. To the extent the Company is required to recognize interest and penalties related to unrecognized tax liabilities, this amount will be recorded as an accrued liability.
| Balance at January 1, 2012 |
$ | — | ||
| Additional based on tax positions related to the current year |
— | |||
| Additions for tax positions of prior years |
70 | |||
| Reductions for tax positions of prior years |
— | |||
| Settlements |
— | |||
|
|
|
|||
| Balance at December 31, 2012 |
70 | |||
| Additional based on tax positions related to the current year |
— | |||
| Additions for tax positions of prior years |
(7 | ) | ||
| Reductions for tax positions of prior years |
— | |||
| Settlements |
— | |||
|
|
|
|||
| Balance at December 31, 2013 |
$ | 63 | ||
|
|
|
Due to the existence of the valuation allowance, future changes in the unrecognized tax benefits will not materially impact the Company’s effective tax rate. The Company’s assessment of its unrecognized tax benefits is subject to change as a function of the Company’s financial statement audit.
The Company recognizes interest and penalties related to uncertain tax positions in income tax expense. As of December 31, 2013, the Company had no accrued interest or penalties related to uncertain tax positions.
The Company and its subsidiaries file tax returns in the U.S. federal jurisdiction and in several state and foreign jurisdictions. The Company is no longer subject to U.S. federal income tax examinations for years ended before December 31, 2010, and is no longer subject to state and local or foreign income tax examinations by tax authorities for years ended before December 31, 2009. The Company is not currently under audit for federal, state, or any foreign jurisdictions.
F-29
Table of Contents
Upland Software, Inc.
Notes to Consolidated Financial Statements (continued)
9. Stockholders’ Deficit
Common Stock
In July and October 2010, the Company issued 1,582,635 shares of restricted stock to three stockholders of the Company at $0.0001 per share for aggregate proceeds of $965. In October 2012, the Company issued 113,085 shares of restricted stock to an employee of the Company at $1.22 per share for aggregate proceeds of $137,942. These shares are subject to a repurchase option. If the holder’s status as an employee or service provider to the Company terminates, then the Company shall have the option to repurchase any shares that have not yet been released from the repurchase option at a price per share equal to the original purchase price. Based on the contractual vesting schedules, 626,460 and 240,280 shares remain unvested as of December 31, 2012 and 2013, respectively.
In November 2013, the Company issued 155,599 shares of common stock valued at $275,000 in connection with the acquisition of ComSci.
Stock Options
During 2010, the Company adopted the Upland Software, Inc. 2010 Stock Plan (the Plan). The Plan provides, in part, that incentive and nonstatutory stock options, as defined by the Internal Revenue Code of 1986, to purchase shares of the Company’s common stock and restricted stock may be granted to employees, directors, and consultants.
As of December 31, 2013, the Company has 947,367 shares of common stock reserved for issuance under the Plan. Accordingly, the Company has reserved 357,991 shares of common stock to permit exercise of options outstanding in accordance with the terms of the Plan.
Under the Plan, stock options will be issued at an exercise price equal to at least 100% of the fair market value of the Company’s common stock at the option grant date as determined by the Company’s Board of Directors or appointed administrator. The maximum term of these options is ten years, measured from the date of grant. Options under the Plan generally vest over four years. Under certain conditions, vesting is accelerated upon a change in control (as defined in the Plan).
F-30
Table of Contents
Upland Software, Inc.
Notes to Consolidated Financial Statements (continued)
A summary of the changes in common stock options is as follows:
| Number of Options Outstanding |
Weighted– Average Exercise Price |
Weighted– Average Remaining Contractual Life (In Years) |
Weighted- Average Fair Value per Share |
|||||||||||||
| Outstanding at January 1, 2012 |
37,383 | $ | 0.30 | 9.25 | $ | 0.18 | ||||||||||
| Options granted |
173,844 | $ | 1.22 | $ | 0.79 | |||||||||||
| Options forfeited |
(23,605 | ) | $ | 1.22 | $ | 0.79 | ||||||||||
|
|
|
|||||||||||||||
| Outstanding at December 31, 2012 |
187,622 | $ | 1.04 | 9.65 | $ | 0.67 | ||||||||||
| Options granted |
191,045 | $ | 1.77 | $ | 0.91 | |||||||||||
| Options forfeited |
(20,676 | ) | $ | 1.28 | $ | 0.79 | ||||||||||
|
|
|
|||||||||||||||
| Outstanding at December 31, 2013 |
357,991 | $ | 1.40 | 9.16 | $ | 0.79 | ||||||||||
| Options granted (unaudited) |
263,015 | $ | 6.22 | $ | 3.35 | |||||||||||
| Options forfeited (unaudited) |
|
(32,724 |
) |
$ |
2.87 |
|
$ | 1.59 | ||||||||
| Options exercised (unaudited) |
|
(150 |
) |
$ | 1.77 | $ | 0.91 | |||||||||
|
|
|
|||||||||||||||
| Outstanding at June 30, 2014 (unaudited) |
588,132 | $ | 3.49 | 9.11 | $ | 1.89 | ||||||||||
|
|
|
|||||||||||||||
| Options vested and expected to vest at December 31, 2013 |
59,106 | $ | 0.79 | 8.04 | ||||||||||||
|
|
|
|||||||||||||||
| Options vested and exercisable at December 31, 2013 |
56,675 | $ | 0.79 | 8.04 | ||||||||||||
|
|
|
|||||||||||||||
| Options vested and expected to vest at June 30, 2014 (unaudited) |
108,992 | $ | 1.40 | 8.16 | ||||||||||||
|
|
|
|||||||||||||||
| Options vested and exercisable at June 30, 2014 (unaudited) |
105,511 | $ | 1.40 | 8.16 | ||||||||||||
|
|
|
|||||||||||||||
The aggregate intrinsic value of options vested during the years ended December 31, 2012 and 2013, was approximately $3,000 and $206,000, respectively. The aggregate intrinsic value of options outstanding at December 31, 2012 and 2013, was approximately $34,000 and $1,726,000, respectively. The aggregate intrinsic value of options vested and expected to vest at December 31, 2013, was approximately $321,000. The aggregate intrinsic value for options exercisable at December 31, 2013 was $308,000. The total fair value of employee options vested during the years ended December 31, 2012, and 2013 was approximately $3,000 and $34,000, respectively. Unvested shares as of December 31, 2012 and December 31, 2013 have a weighted-average grant date fair value of $0.67 per share and $0.79 per share, respectively.
Total stock–based compensation was approximately $92,000 and $498,000 for the years ended December 31, 2012 and 2013, respectively. As of December 31, 2013 and June 30, 2014, $299,000 and $823,000 (unaudited) of unrecognized compensation cost related to stock options is expected to be recognized over a weighted–average period of 2.47 and 2.57 years, respectively.
10. Redeemable Convertible Preferred Stock
In 2011, the Company issued 2,652,110 shares of Series A redeemable convertible preferred stock for aggregate proceeds of $16.0 million, net of issuance costs of $199,000.
In January 2012, the Company issued 169,054 shares of Series A redeemable convertible preferred stock for aggregate proceeds of $1.0 million, net of issuance costs of $23,784.
F-31
Table of Contents
Upland Software, Inc.
Notes to Consolidated Financial Statements (continued)
In January 2012, the Company issued 1,701,909 shares of Series B redeemable convertible preferred stock for aggregate proceeds of $10.4 million, net of issuance costs of $22,000.
In November 2012, the Company issued 131,168 shares of Series B–1 redeemable convertible preferred stock valued at $800,000 in connection with the acquisition of EPM Live. Such shares are subject to forfeiture obligations based upon continued employment over a 24-month period. The Company is accounting for such shares as compensation as the shares vest. At December 31, 2013, 131,168 shares remain subject to forfeiture and $348,000 of stock compensation remains unamortized and is expected to be recognized over the next year.
In May 2013, the Company issued 106,572 shares of B–1 redeemable convertible preferred stock valued at $624,000 in connection with the acquisition of FileBound.
In November 2013, the Company issued 155,598 shares of Series B–2 redeemable convertible preferred stock valued at $949,000 in connection with the acquisition of ComSci.
In December 2013, the Company issued 1,918,048 shares of Series C redeemable convertible preferred stock for aggregate proceeds of $19,700,000, net of issuance costs of $82,000. The proceeds from the issuance of Series C preferred stock included the conversion of $4,900,000 of convertible promissory bridge notes and accrued interest payable.
Significant terms of the Series A, B, B–1, B–2 and C redeemable convertible preferred stock (Preferred Stock) are as follows:
Voting
Each holder of Preferred Stock, except for holders of Series B–2 redeemable convertible preferred stock, shall be entitled to the number of votes equal to the number of shares of common stock into which the shares of Preferred Stock held by such holder could be converted. The holders of Preferred Stock and the holders of common stock shall vote together and not as separate classes. Except as otherwise specifically required by applicable law, the holders of Series B–2 redeemable convertible preferred stock shall have no right to vote on any matters to be voted on by the stockholders of the Company.
Dividends
Dividends on shares of Series C redeemable convertible preferred stock shall begin to accrue on a daily basis at a rate of 8% per annum, shall be cumulative, and shall compound on an annual basis. Series C redeemable convertible preferred stock dividends shall be due and payable upon the earliest of (i) any liquidation, dissolution, or winding up of the Company; (ii) the redemption of the Series C redeemable convertible preferred stock; or (iii) the payment of any dividends with respect to common stock or Series A, B, B–1 redeemable convertible Preferred Stock. Cumulative dividends on shares of Series C redeemable convertible preferred stock shall cease to accrue and all accrued and unpaid cumulative dividends shall be canceled and any rights to such dividends shall terminate at the time such share of Series C redeemable convertible preferred stock is converted to common stock.
The holders of outstanding shares of Series A, B, B–1, and B–2 redeemable convertible preferred stock shall be entitled to receive dividends, when, as, and if declared by the Board of Directors, out of any assets legally available at the annual rate of $0.49 per share payable in preference and priority to any declaration or payment of any distribution on common stock. No dividends shall be made with respect to the common stock unless dividends on the Preferred Stock have been declared and paid or set aside for payment to the preferred stockholders. The right to receive dividends on shares of Series A, B, B–1 and B–2 redeemable convertible
F-32
Table of Contents
Upland Software, Inc.
Notes to Consolidated Financial Statements (continued)
preferred stock shall not be cumulative, and no right to dividends shall accrue to holders of Series A, B, B–1 and B–2 redeemable convertible preferred stock by reason of the fact that dividends on said shares are not declared or paid. Payment of any dividends to the holders of Series A, B, B–1, and B–2 redeemable convertible preferred stock shall be on a pro rata basis.
Liquidation Preference
Upon any liquidation, dissolution, or winding up of the Company and its subsidiaries, whether voluntary or involuntary, the holders of Series C redeemable convertible preferred stock shall be entitled to receive, prior and in preference to any distribution of any of the assets of the Company to the holders of Series A, B, B–1 and B–2 redeemable convertible preferred stock and holders of common stock by reason of their ownership of such stock, an amount per share for each share of Series C redeemable convertible preferred stock held by them equal to the sum of (i) $10.98 per share and (ii) all declared but unpaid dividends (if any) on such share of Series C redeemable convertible preferred stock, or such lesser amount as may be approved by the holders of the majority of the outstanding shares of Series C redeemable convertible preferred stock. If, upon the liquidation, dissolution, or winding up of the Company, the assets of the Company legally available for distribution to the holders of the Series C redeemable convertible preferred stock are insufficient to permit the payment to such holders of the full amounts, then the entire assets of the Company legally available for distribution shall be distributed with equal priority and pro rata among the holders of the Series C redeemable convertible preferred stock in proportion to the full amounts they would otherwise be entitled to receive.
Upon any liquidation, dissolution, or winding up of the Company and its subsidiaries, whether voluntary or involuntary, and after payment in full of the amounts to which holders of Series C redeemable convertible preferred stock shall be entitled to receive, the holders of Series A, B, B–1 and B–2 redeemable convertible preferred stock shall be entitled to receive, prior and in preference to any distribution of any of the assets of the Company to the holders of the common stock by reason of their ownership of such stock, an amount per share for each share of Series A, B, B–1 and B–2 redeemable convertible preferred stock held by them equal to the sum of (i) $6.10 per share and (ii) all declared but unpaid dividends (if any) on such share of preferred stock, or such lesser amount as may be approved by the holders of the majority of the outstanding shares of Series A, B, B–1 and B–2 redeemable convertible preferred stock. If, upon the liquidation, dissolution, or winding up of the Company, the assets of the Company legally available for distribution to the holders of the Series A, B, B–1 and B–2 redeemable convertible preferred stock are insufficient to permit the payment to such holders of the full amounts, then the entire assets of the Company legally available for distribution shall be distributed with equal priority and pro rata among the holders of Series A, B, B–1 and B–2 redeemable convertible preferred stock in proportion to the full amounts they would otherwise be entitled to receive.
Redemption
At any time after December 20, 2018, and at the election of the holders of at least two–thirds of the then–outstanding shares of Series A, B, and C redeemable convertible preferred stock, the Company shall redeem, out of funds legally available, all (but not less than all) outstanding shares of Series A, B, B–2 and C redeemable convertible preferred stock that have not been converted into common stock, in three equal annual installments. The Company shall redeem the shares of Series A, B and B–2 redeemable convertible preferred stock by paying in cash $6.10 per share, plus an amount equal to all declared and unpaid dividends, whether or not earned. The Company shall redeem the shares of Series C redeemable convertible preferred stock by paying in cash $10.98 per share, plus all accrued but unpaid cumulative dividends and any other declared but unpaid dividends thereon.
If the funds legally available for redemption of the Series A, B, B–2 and C redeemable convertible preferred stock are insufficient to permit the payment to such holders of the full respective redemption prices, the
F-33
Table of Contents
Upland Software, Inc.
Notes to Consolidated Financial Statements (continued)
Company shall first redeem all share of Series C redeemable convertible preferred stock and shall then use the remaining proceeds to effect such redemption pro rata among the holders of the Series A, B and B–2 redeemable convertible preferred stock so that each holder of Series A, B and B–2 redeemable convertible preferred stock shall receive a redemption payment equal to a fraction of the aggregate amount available for redemption.
At any time after December 20, 2019 and at the election of a least a majority of the then–outstanding shares of Series C redeemable convertible preferred stock, the Company shall redeem in three equal annual installments all outstanding shares of Series C redeemable convertible preferred stock.
The Series B–1 redeemable convertible preferred stock is not entitled to any redemption rights. However, because a majority of the Company’s outstanding stock is in the control of the convertible preferred stockholders who also control the Company’s Board of Directors, a hostile takeover or other sale could occur outside the Company’s control and thereby trigger a “deemed liquidation” and payment of liquidation preferences. Accordingly, the Company has classified convertible preferred stock outside of stockholders’ deficit for all periods presented.
The Company adjusts the carrying value of the convertible preferred stock to the liquidation preferences of such shares at each reporting period-end. The change in the carrying value of the convertible preferred stock is recorded as a charge to additional paid–in capital, if any, and then to accumulated deficit.
The Company has evaluated each of its series of convertible preferred stock and determined that each series should be considered an “equity host” and not a “debt host” as defined by ASC 815, Derivatives and Hedging. This evaluation is necessary in order to determine if any embedded features require bifurcation and, therefore, separate accounting as a derivative liability. The Company’s analysis followed the “whole instrument approach,” which compares an individual feature against the entire convertible preferred stock instrument that includes that feature. The Company’s analysis was based on a consideration of the convertible preferred stock’s economic characteristics and risks and, more specifically, evaluated all the stated and implied substantive features, including (i) whether the convertible preferred stock included redemption features, (ii) how and when any redemption features could be exercised, (iii) whether the holders of convertible preferred stock, were entitled to dividends, (iv) the voting rights of the convertible preferred stock and (v) the existence and nature of any conversion rights. As a result of the Company’s conclusion that the convertible preferred stock represents an equity host, the conversion feature of all series of convertible preferred stock is considered to be clearly and closely related to the associated convertible preferred stock host instrument. Accordingly, the conversion feature of all series of convertible preferred stock is not considered an embedded derivative that requires bifurcation.
The Company accounts for potentially beneficial conversion features under ASC 740–20, Debt with Conversion and Other Options. At the time of each of the issuances of convertible preferred stock, the Company’s common stock into which each series of the Company’s convertible preferred stock is convertible had an estimated fair value less than the effective conversion prices of the convertible preferred stock. Therefore, there was no intrinsic value on the respective commitment dates.
Conversion
Each share of Preferred Stock shall be convertible, at the option of the holder, at any time after the date of issuance of such share, into that number of fully paid, nonassessable shares of common stock determined by dividing the original issue price for the relevant series (Series A redeemable convertible – $6.10, Series B redeemable convertible – $6.10, Series B–1 redeemable convertible – $6.10, Series B–2 redeemable convertible – $6.10, and Series C redeemable convertible – $10.98) by the conversion price for such series (Series A redeemable convertible – $6.10, Series B redeemable convertible – $6.10, Series B–1 redeemable convertible – $6.10, Series B–2 redeemable convertible – $6.10, and Series C redeemable convertible – $10.98).
F-34
Table of Contents
Upland Software, Inc.
Notes to Consolidated Financial Statements (continued)
Each share of Preferred Stock shall automatically be converted into fully paid, nonassessable shares of common stock at the then–effective conversion rate for such share (i) immediately prior to the closing of a firm commitment, underwritten IPO pursuant to an effective registration statement filed under the Securities Act of 1933, covering the offer and sale of the Company’s common stock, provided that the offering price per share is not less than $14.82 if such event occurs on or before June 20, 2015, or $21.96 if such event occurs after June 20, 2015, and the aggregate gross proceeds to the Company exceed $25,000,000; (ii) with respect to Series A, B, B–1 and B–2 redeemable convertible preferred stock, upon the receipt by the Company of a written request for such conversion of holders of at least 50% of the then outstanding Series A, B, B–1, and B–2 redeemable convertible preferred stock entitled to vote; or (iii) with respect to Series C redeemable convertible preferred stock, upon receipt by the Company of a written request for such conversion from the holders of at least 50% of the Series C redeemable convertible preferred stock then outstanding, or, if later, the effective date for conversion specified in such requests.
11. Preferred Stock Warrants
The Company had 19,675 Series A redeemable convertible preferred stock warrants and 19,675 Series B preferred stock warrants outstanding as of December 31, 2012 with an exercise price of $6.10 per share. The Company had 19,675 Series A preferred stock warrants and 56,839 Series B redeemable convertible preferred stock warrants outstanding as of December 31, 2013 and June 30, 2014 (unaudited) with an exercise price of $6.10 per share. All of these warrants were issued in connection with the loan agreements described in Note 6.
The fair value of warrants to purchase convertible preferred stock was determined using the Black-Scholes option pricing model. The following table summarizes the inputs and assumptions used to develop their fair values:
| Series A Preferred Stock Warrant | ||||||||||||
| December 31, | June 30, | |||||||||||
| 2012 | 2013 | 2014 | ||||||||||
| (unaudited) | ||||||||||||
| Stock Price |
$ | 1.22 | $ | 10.67 | $ | 15.25 | ||||||
| Exercise price |
$ | 6.10 | $ | 6.10 | $ | 6.10 | ||||||
| Expected volatility |
72.52 | % | 53.30 | % | 54.07 | % | ||||||
| Risk-free interest rate |
1.36 | % | 1.75 | % | 1.62 | % | ||||||
| Expected life in years |
7.00 | 5.12 | 4.62 | |||||||||
| Dividend yield |
— | — | — | |||||||||
| Series B Preferred Stock Warrant | ||||||||||||
| December 31, | June 30, | |||||||||||
| 2012 | 2013 | 2014 | ||||||||||
| (unaudited) | ||||||||||||
| Stock Price |
$ | 1.22 | $ | 10.67 | $ | 15.25 | ||||||
| Exercise price |
$ | 6.10 | $ | 6.10 | $ | 6.10 | ||||||
| Expected volatility |
72.52 | % | 53.30 | % | 54.07% | |||||||
| Risk-free interest rate |
0.95 | % | 1.75 | % | 1.62% - 1.88 | % | ||||||
| Expected life in years |
6.12 | 5.18-6.28 | 4.68 - 5.79 | |||||||||
| Dividend yield |
— | — | — | |||||||||
F-35
Table of Contents
Upland Software, Inc.
Notes to Consolidated Financial Statements (continued)
12. Fair Value Measurements
Fair value is defined as the exit price, or the amount that would be received to sell an asset or paid to transfer a liability in an orderly transaction between market participants as of the measurement date. GAAP sets forth a three–tier fair value hierarchy, which prioritizes the inputs used in measuring fair value. The three tiers are Level 1, defined as observable inputs, such as quoted market prices in active markets; Level 2, defined as inputs other than quoted prices in active markets that are either directly or indirectly observable; and Level 3, defined as unobservable inputs in which little or no market data exists, therefore, requiring an entity to develop its own assumptions. At December 31, 2012, assets and liabilities measured at fair value on a recurring basis were not significant.
Assets and liabilities measured at fair value on a recurring basis are summarized below (in thousands):
| Fair Value Measurements at December 31, 2013 | ||||||||||||||||
| Level 1 | Level 2 | Level 3 | Total | |||||||||||||
| Assets: |
$ | — | $ | — | $ | — | $ | — | ||||||||
| Liabilities: |
||||||||||||||||
| Warrant liabilities |
$ | — | $ | — | $ | 525 | $ | 525 | ||||||||
| Fair Value Measurements at June 30, 2014 | ||||||||||||||||
| Level 1 | Level 2 | Level 3 | Total | |||||||||||||
| (unaudited) | (unaudited) | (unaudited) | (unaudited) | |||||||||||||
| Assets: |
$ | — | $ | — | $ | — | $ | — | ||||||||
| Liabilities: |
||||||||||||||||
| Warrant liabilities |
$ | — | $ | — | $ | 831 | $ | 831 | ||||||||
The following table presents additional information about fixed maturity securities measured at fair value on a recurring basis and for which we have utilized significant unobservable (Level 3) inputs to determine fair value:
| Beginning balance at January 1, 2012 |
$ | — | ||
| Issuance of preferred stock warrants |
— | |||
| Change in fair value of preferred stock warrants |
— | |||
|
|
|
|||
| Ending balance at December 31, 2012 |
— | |||
| Issuance of preferred stock warrants |
158 | |||
| Change in fair value of preferred stock warrants |
367 | |||
|
|
|
|||
| Ending balance at December 31, 2013 |
525 | |||
| Issuance of preferred stock warrants (unaudited) |
— | |||
| Change in fair value of preferred stock warrants (unaudited) |
306 | |||
|
|
|
|||
| Ending balance at June 30, 2014 (unaudited) |
$ | 831 | ||
|
|
|
The fair value of warrants to purchase convertible preferred stock was determined using Black-Scholes option pricing model. The valuation of the warrant liability is discussed in Note 11 Preferred Stock Warrants.
F-36
Table of Contents
Upland Software, Inc.
Notes to Consolidated Financial Statements (continued)
13. Net Loss per Common Share
The following table sets for the computations of loss per share (in thousands, except share and per share amounts):
| Year Ended December 31, | Six Months Ended June 30, |
|||||||||||||||
| 2012 | 2013 | 2013 | 2014 | |||||||||||||
| (unaudited) | (unaudited) | |||||||||||||||
| Numerators: |
||||||||||||||||
| Loss from continuing operations attributable to common stockholders |
$ | (4,298 | ) | $ | (8,555 | ) | $ | (2,274 | ) | $ | (14,997 | ) | ||||
| Income (loss) from discontinued operations attributable to common stockholders |
1, 791 | (642 | ) | (316 | ) | — | ||||||||||
| Preferred stock dividends and accretion |
(44 | ) | (98 | ) | (22 | ) | (875 | ) | ||||||||
| Net loss attributable to common stockholders |
$ | (2,551 | ) | $ | (9,295 | ) | $ | (2,612 | ) | $ | (15,872 | ) | ||||
| Denominator: |
||||||||||||||||
| Weighted–average common shares outstanding, basic and diluted |
751,416 | 1,196,668 | 1,061,906 | 3,255,077 | ||||||||||||
| Loss from continuing operations per share, basic and diluted |
$ | (5.78 | ) | $ | (7.23 | ) | $ | (2.16 | ) | $ | (4.92 | ) | ||||
| Loss from discontinued operations per share, basic and diluted |
$ | 2.39 | $ | (0.54 | ) | $ | (0.30 | ) | $ | — | ||||||
| Net loss per common share, basic and diluted |
$ | (3.39 | ) | $ | (7.77 | ) | $ | (2.46 | ) | $ | (4.92 | ) | ||||
Due to the net losses for the years ended December 31, 2012 and 2013 and for the six months ended June 30, 2013 and 2014, basic and diluted loss per share were the same, as the effect of all potentially dilutive securities would have been anti–dilutive. The following table sets forth the anti–dilutive common share equivalents:
| Year Ended December 31, | Six Months Ended June 30, | |||||||||||||||
| 2012 | 2013 | 2013 | 2014 | |||||||||||||
| (unaudited) | (unaudited) | |||||||||||||||
| Redeemable Convertible preferred stock: |
||||||||||||||||
| Series A preferred stock |
2,821,181 | 2,821,181 | 2,821,181 | 2,821,181 | ||||||||||||
| Series B preferred stock |
1,701,909 | 1,701,909 | 1,701,909 | 1,701,909 | ||||||||||||
| Series B–1 preferred stock |
131,168 | 237,740 | 131,168 | 237,740 | ||||||||||||
| Series B–2 preferred stock |
— | 155,598 | — | 155,598 | ||||||||||||
| Series C preferred stock |
— | 1,918,048 | — | 1,918,048 | ||||||||||||
| Stock options |
187,622 | 357,991 | 187,622 | 588,132 | ||||||||||||
| Restricted stock |
626,460 | 240,280 | 508,736 | 76,734 | ||||||||||||
|
|
|
|
|
|
|
|
|
|||||||||
| Total anti–dilutive common share equivalents |
5,468,340 | 7,423,747 | 5,350,616 | 7,499,342 | ||||||||||||
|
|
|
|
|
|
|
|
|
|||||||||
F-37
Table of Contents
Upland Software, Inc.
Notes to Consolidated Financial Statements (continued)
Pro Forma Net Loss per Common Share (Unaudited)
The numerator and the denominator used in computing the unaudited pro forma net loss per common share for the year ended December 31, 2013 and the six months ended June 30, 2014 (unaudited) have been adjusted to assume the conversion of all outstanding shares of preferred stock into common stock at the later of January 1, 2013 or the date of issuance of the preferred stock. Pro forma net loss per common share does not give effect to potentially dilutive securities where the impact would be anti–dilutive (in thousands, except share and per share amounts):
| Year Ended December 31, 2013 |
Six Months Ended June 30, 2014 |
|||||||
| (unaudited) | ||||||||
| Numerator: |
||||||||
| Net loss attributable to common stockholders |
$ | (9,295 | ) | $ | (15,872 | ) | ||
| Add: Preferred stock dividends and accretion |
98 | 875 | ||||||
|
|
|
|
|
|||||
| Pro forma net loss attributable to common stockholders |
(9,197 | ) | (14,997 | ) | ||||
| Denominator: |
||||||||
| Historical denominator for basic and diluted net loss per common share – weighted–average common shares outstanding, basic and diluted |
1,196,668 | 3,225,077 | ||||||
| Plus: assumed conversion of preferred stock to common stock |
4,801,945 | 6,834,476 | ||||||
| Denominator for pro forma basic and diluted net loss per common share |
5,998,613 | 10,059,553 | ||||||
| Pro forma net loss per common share, basic and diluted |
$ | (1.55 | ) | $ | (1.49 | ) | ||
14. Employee Benefit Plans
The Company has established two voluntary defined contribution retirement plans qualifying under Section 401(k) of the Internal Revenue Code. The Company made no contributions to the 401(k) plans for the years ended December 31, 2012 and 2013.
15. Discontinued Operations
On November 6, 2013, the Company distributed all of the shares of its Visionael subsidiary to the Company’s stockholders in a spin–off. The subsidiary was not a discontinued operation or classified as held for sale as of December 31, 2012. However, since all shares of the subsidiary were distributed in 2013, the Company’s consolidated statements of operations have been presented to show the discontinued operations of the subsidiary separately from continuing operations for all periods presented. Since the transaction was between entities under common control, the distribution of the shares of the subsidiary did not result in a gain or loss on distribution as it was recorded at historical carrying values.
F-38
Table of Contents
Upland Software, Inc.
Notes to Consolidated Financial Statements (continued)
The following table sets forth the assets and liabilities of the discontinued operations which are included in the Company’s consolidated balance sheet at December 31, 2012 (in thousands):
| December 31, 2012 |
||||
| Assets: |
||||
| Cash |
$ | 270 | ||
| Accounts receivable, net |
1,000 | |||
| Fixed assets, net |
5 | |||
| Intangible assets, net |
2,648 | |||
| Goodwill |
2,357 | |||
| Other assets |
5 | |||
|
|
|
|||
| Total assets |
6,285 | |||
| Liabilities: |
||||
| Accounts payable and accrued expenses |
215 | |||
| Other current liabilities |
14 | |||
| Deferred revenue, current |
1,313 | |||
| Deferred tax liability |
5 | |||
| Deferred revenue, net of current portion |
429 | |||
|
|
|
|||
| Total liabilities |
1,976 | |||
|
|
|
|||
| Net assets |
$ | 4,309 | ||
|
|
|
|||
16. Domestic and Foreign Operations
Revenue by revenue is based on the ship-to address of the customer, which is intended to approximate where the customer’s users are located. The ship to country is generally the same as the billing country. The Company has operations in the U.S., Canada and Europe. Information about these operations is presented below (in thousands):
| Year Ended December 31, | ||||||||
| 2012 | 2013 | |||||||
| Revenues: |
||||||||
| U.S. |
$ | 16,999 | $ | 31,166 | ||||
| Canada |
$ | 2,920 | $ | 3,509 | ||||
| Other International |
$ | 2,844 | $ | 6,518 | ||||
|
|
|
|
|
|||||
| Total Revenues |
$ | 22,763 | $ | 41,193 | ||||
| Year Ended December 31, | ||||||||
| 2012 | 2013 | |||||||
| Identifiable long–lived assets: |
||||||||
| U.S. |
$ | 637 | $ | 3,310 | ||||
| Canada |
$ | 770 | $ | 632 | ||||
| Other International |
$ | 0 | $ | 0 | ||||
|
|
|
|
|
|||||
| Total identifiable long–lived assets |
$ | 1,407 | $ | 3,942 | ||||
F-39
Table of Contents
Upland Software, Inc.
Notes to Consolidated Financial Statements (continued)
17. Related Party Transactions
In 2012 and 2013, the Company borrowed and repaid monies from and to an investor in the Company pursuant to promissory notes (see Note 6). In 2012 and 2013, the Company purchased software development services pursuant to a technology services agreement with a company controlled by a non-management investor in the Company in the amount of $1,000,000 and $2,100,000, respectively. In January 2014, the Company issued 1,803,574 shares of common stock to this company in connection with the amendment of such technology services agreement and took a noncash charge of $11,200,000 recorded in research and development expenses. The Company has an outstanding purchase commitment for additional software development services from this company in 2014 in the amount of $2,100,000. For years after 2014, the purchase commitment amount for software development services will be equal to the prior year purchase commitment increased (decreased) by the percentage change in total revenue for the prior year as compared to the preceding year. For example, if 2014 total revenues increase by 10% as compared to 2013 total revenues, then the 2015 purchase commitment would increase by approximately $213,175 from the 2014 purchase commitment amount to $2,344,925. A similar 10% increase in 2015 total revenues as compared to 2014 total revenues would increase the 2016 purchase commitment amount from the 2015 purchase commitment amount of $2,344,925 by approximately $234,493 to $2,579,418.
When the Company receives requested services as detailed by statements of work pursuant to the software development agreement, it determines whether such software development costs should be capitalized as either internally-used software or software to be sold or otherwise marketed. If such costs are not capitalizable, the Company expenses such costs as the services are received. If the Company anticipates that it will not utilize the full amount of the annual minimum fee, the estimated unused portion of the annual minimum fee is expensed at that time.
18. Subsequent Events
The Company has evaluated subsequent events through the date the consolidated financial statements were available for issuance.
On October 9, 2014, the Board approved, and, on October 24, 2014 the Company effected, a 6.099-for-1 reverse stock split of its common and preferred stock. All share and per share information for all periods presented has been adjusted to reflect the effect of such reverse stock split.
F-40
Table of Contents
Report of Independent Auditors
To the Members of
LMR Solutions, LLC (dba EPM Live)
We have audited the accompanying financial statements of LMR Solutions, LLC (dba EPM Live), which comprise the balance sheet as of November 13, 2012, and the related statements of operations, changes in members’ equity (deficit), and cash flows for the period from January 1, 2012 to November 13, 2012, and the related notes to the financial statements.
Management’s Responsibility for the Financial Statements
Management is responsible for the preparation and fair presentation of these financial statements in accordance with accounting principles generally accepted in the United States of America; this includes the design, implementation, and maintenance of internal control relevant to the preparation and fair presentation of financial statements that are free from material misstatement, whether due to fraud or error.
Auditor’s Responsibility
Our responsibility is to express an opinion on these financial statements based on our audit. We conducted our audit in accordance with auditing standards generally accepted in the United States of America. Those standards require that we plan and perform the audit to obtain reasonable assurance about whether the financial statements are free from material misstatement.
An audit involves performing procedures to obtain audit evidence about the amounts and disclosures in the financial statements. The procedures selected depend on the auditor’s judgment, including the assessment of the risks of material misstatement of the financial statements, whether due to fraud or error. In making those risk assessments, the auditor considers internal control relevant to the entity’s preparation and fair presentation of the financial statements in order to design audit procedures that are appropriate in the circumstances, but not for the purpose of expressing an opinion on the effectiveness of the entity’s internal control. Accordingly, we express no such opinion. An audit also includes evaluating the appropriateness of accounting policies used and the reasonableness of significant accounting estimates made by management, as well as evaluating the overall presentation of the financial statements.
We believe that the audit evidence we have obtained is sufficient and appropriate to provide a basis for our audit opinion.
Opinion
In our opinion, the financial statements referred to above present fairly, in all material respects, the financial position of LMR Solutions, LLC (dba EPM Live) as of November 13, 2012, and the results of its operations and its cash flows for the period from January 1, 2012 to November 13, 2012 in accordance with accounting principles generally accepted in the United States of America.
/s/ Holtzman Partners, LLP
May 7, 2014
F-41
Table of Contents
LMR Solutions, LLC (dba EPM Live)
Balance Sheet
| November 13, 2012 |
||||
| Assets |
||||
| Current assets: |
||||
| Cash and cash equivalents |
$ | 387,604 | ||
| Accounts receivable, net allowance of $97,976 |
1,365,126 | |||
| Prepaid expenses and other |
53,231 | |||
|
|
|
|||
| Total current assets |
1,805,961 | |||
| Property and equipment, net |
407,706 | |||
|
|
|
|||
| Total assets |
$ | 2,213,667 | ||
|
|
|
|||
| Liabilities and members’ equity (deficit) |
||||
| Current liabilities: |
||||
| Accounts payable |
$ | 171,935 | ||
| Accrued liabilities |
479,238 | |||
| Line of credit |
524,502 | |||
| Current portion of notes payable |
126,240 | |||
| Current portion of capital lease obligations |
72,203 | |||
| Deferred revenue |
161,503 | |||
|
|
|
|||
| Total current liabilities |
1,535,621 | |||
| Notes payable, net of current portion |
346,096 | |||
| Capital lease obligations, net of current portion |
99,279 | |||
| Deferred revenue, non-current |
2,483,306 | |||
|
|
|
|||
| Total liabilities |
4,464,302 | |||
| Members’ equity (deficit): |
(2,250,635 | ) | ||
|
|
|
|||
| Total liabilities and members’ equity (deficit) |
$ | 2,213,667 | ||
|
|
|
|||
See accompanying notes to financial statements.
F-42
Table of Contents
LMR Solutions, LLC (dba EPM Live)
Statement of Operations
| For the period from January 1, 2012 to November 13, 2012 |
||||
| Revenues |
$ | 5,459,727 | ||
| Cost of revenues |
(2,023,347 | ) | ||
|
|
|
|||
| Gross profit |
3,436,380 | |||
| Operating expenses: |
||||
| Sales and marketing |
1,921,284 | |||
| Research and development |
1,063,644 | |||
| General and administrative |
1,677,670 | |||
|
|
|
|||
| Total operating expenses |
4,662,598 | |||
| Loss from operations |
(1,226,218 | ) | ||
| Other income (expense): |
||||
| Interest expense |
(45,024 | ) | ||
|
|
|
|||
| Total other income (expense) |
(45,024 | ) | ||
|
|
|
|||
| Net loss before taxes |
(1,271,242 | ) | ||
| Income taxes |
(15,674 | ) | ||
|
|
|
|||
| Net loss |
$ | (1,286,916 | ) | |
|
|
|
|||
See accompanying notes to financial statements.
F-43
Table of Contents
LMR Solutions, LLC (dba EPM Live)
Statement of Changes in Members’ Equity (Deficit)
| Members’ Equity (Deficit) |
||||
| Balance at December 31, 2011 (unaudited) |
$ | (882,734 | ) | |
| Distributions to members |
(80,985 | ) | ||
| Net loss |
(1,286,916 | ) | ||
|
|
|
|||
| Balance at November 13, 2012 |
$ | (2,250,635 | ) | |
|
|
|
|||
See accompanying notes to financial statements.
F-44
Table of Contents
LMR Solutions, LLC (dba EPM Live)
Statement of Cash Flows
| For the period from January 1, 2012 to November 13, 2012 |
||||
| Operating activities |
||||
| Net loss |
$ | (1,286,916 | ) | |
| Adjustments to reconcile net loss to net cash used in operating activities: |
||||
| Depreciation expense |
151,969 | |||
| Changes in operating assets and liabilities: |
||||
| Accounts receivable |
137,747 | |||
| Prepaid expenses and other |
568 | |||
| Accounts payable |
123,320 | |||
| Accrued expenses and other |
4,725 | |||
| Deferred revenue |
844,253 | |||
|
|
|
|||
| Net cash used in operating activities |
(24,334 | ) | ||
| Investing activities |
||||
| Purchases of property and equipment |
(35,091 | ) | ||
|
|
|
|||
| Net cash used in investing activities |
(35,091 | ) | ||
| Financing activities |
||||
| Borrowings on line of credit |
342,000 | |||
| Principal payments on notes payable |
(187,978 | ) | ||
| Principal payments on capital lease obligations |
(19,655 | ) | ||
| Distributions to shareholders |
(80,985 | ) | ||
|
|
|
|||
| Net cash provided by financing activities |
53,382 | |||
| Net change in cash and cash equivalents |
(6,043 | ) | ||
| Cash and cash equivalents at beginning of year |
393,647 | |||
|
|
|
|||
| Cash and cash equivalents at end of year |
$ | 387,604 | ||
|
|
|
|||
| Supplemental disclosures of cash flow information: |
||||
| Cash paid for interest |
$ | 36,586 | ||
|
|
|
|||
| Cash paid for income taxes |
$ | 15,674 | ||
|
|
|
|||
| Supplemental disclosure of non-cash investing activities: |
||||
| Equipment purchased under capital lease |
$ | 137,927 | ||
|
|
|
|||
See accompanying notes to financial statements.
F-45
Table of Contents
LMR Solutions, LLC (dba EPM Live)
Notes to Financial Statements
For the period from January 1, 2012 to November 13, 2012
1. Business Description and Organization
LMR Solutions, LLC (dba EPM Live) (the “Company”) was formed to provide online solutions, consulting services and Enterprise SharePoint Project Management applications to organizations in the e-commerce industry. The Company produces online applications, which include a fully integrated build-to-order work management platform that allows organizations to extend project portfolio management to all areas of their business leveraging pre-built, proven best practice applications. Applications include Project Portfolio Management, Application Lifecycle Management, New Product Development, IT Management, and Service Management. The Company also offers products such as business strategy workshops, requirements support, installation support, configuration support, development support, training, customer support, online support and consulting services.
LMR Solutions, LLC (dba EPM Live) was formed and began operations as a Limited Liability Company under the State of Delaware statutes on May 19, 2004. Under the terms of the LLC Operating Agreement, the term of the Company expires on May 19, 2024. The Company’s principal office is in Carlsbad, California.
2. Summary of Significant Accounting Policies
Basis of Accounting
The financial statements of the Company have been prepared on the accrual basis of accounting in accordance with accounting principles generally accepted in the United States of America.
Use of Estimates
The presentation of financial statements in conformity with accounting principles generally accepted in the United States of America requires management to make estimates and assumptions that affect the reported amounts of assets and liabilities and disclosure of contingent assets and liabilities at the date of the financial statements and the reported amounts of revenues and expenses during the reporting period.
On an ongoing basis, the Company evaluates its estimates, including those related to revenue recognition, the provision for doubtful accounts, sales returns and allowances, the useful lives of property and equipment, accrued liabilities, and contingencies, among others. The Company bases its estimates on historical experience and on various other assumptions that are believed to be reasonable under the circumstances, the results of which form the basis for making judgments about carrying values of assets and liabilities that are not readily apparent from other sources. Actual results could differ from the estimates made by management with respect to these items and other items that require management’s estimates.
Cash and Cash Equivalents
The Company considers all highly liquid investments acquired with an original maturity of three months or less at the date of purchase to be cash equivalents. Cash equivalents are stated at cost, which approximates market value, because of the short maturity of these instruments.
Accounts Receivable
Accounts receivable are recorded at net realizable value. The Company continually assesses the collectability of outstanding customer invoices; and if deemed necessary, maintains an allowance for estimated losses resulting
F-46
Table of Contents
LMR Solutions, LLC (dba EPM Live)
Notes to Financial Statements (continued)
2. Summary of Significant Accounting Policies (continued)
from the noncollection of customer receivables. In estimating this allowance, the Company considers factors such as: historical collection experience, a customer’s current credit-worthiness, customer concentrations, age of the receivable balance, both individually and in the aggregate, and general economic conditions that may affect a customer’s ability to pay. Actual customer collections could differ from the Company’s estimates. As of November 13, 2012, the allowance for doubtful accounts totaled $97,976.
Concentration of Credit Risk
Financial instruments that potentially subject the Company to concentrations of credit risk consist of cash and cash equivalents and trade receivables. The Company’s cash and cash equivalents are placed with high-credit-quality financial institutions and issuers, and at times may exceed federally insured limits or be held in foreign jurisdictions. The Company has not experienced any loss relating to cash and cash equivalents in these accounts. The Company performs periodic credit evaluations of its customers’ financial condition and generally does not require collateral.
Fair Value of Financial Instruments
The Financial Accounting Standards Board’s (“FASB”) authoritative guidance on fair value defines fair value, establishes a framework for measuring fair value in accordance with generally accepted accounting principles and expands disclosures about fair value measurements. The guidance establishes a three-tier fair value hierarchy, which prioritizes the inputs used in measuring fair value. These tiers include: Level 1, defined as observable inputs such as quoted prices in active markets; Level 2, defined as inputs other than quoted prices in active markets that are either directly or indirectly observable; and Level 3, defined as unobservable inputs in which little or no market data exists, therefore requiring an entity to develop its own assumptions.
The Company’s financial instruments consist principally of cash and cash equivalents, accounts receivable, accounts payable, accrued liabilities, line of credit, notes payable, and deferred revenue. The fair values of these financial instruments approximate their carrying amount due to the short maturity of the financial instruments.
Property and Equipment
Property and equipment are carried at cost less accumulated depreciation. Depreciation is computed using the straight-line method over the estimated useful lives of the related assets. Leasehold improvements and capitalized lease obligations are amortized using the straight-line method over the lesser of the estimated useful lives of the related assets or the term of the related leases and included in depreciation expense. When depreciable assets are sold or retired, the related cost and accumulated depreciation are removed from the accounts. Any gain or loss is included in other income (expense) in the Company’s statements of operations in the period incurred. Major additions and betterments are capitalized. Maintenance and repairs which do not materially improve or extend the lives of the respective assets are charged to operating expense as incurred.
Long-Lived Assets
The Company periodically reviews the carrying amounts of its long-lived assets, to determine whether current events or circumstances, as defined in Accounting Standards Codification (“ASC”) Topic 360, Property, Plant and Equipment, warrant adjustment to such carrying accounts. In reviewing the carrying amounts of long-lived assets, the Company considers, among other factors, the future cash inflows expected to result from the use of the
F-47
Table of Contents
LMR Solutions, LLC (dba EPM Live)
Notes to Financial Statements (continued)
2. Summary of Significant Accounting Policies (continued)
asset and its eventual disposition less the future cash outflows expected to be necessary to obtain those inflows. Upon a determination that the carrying value of assets will not be recovered from the undiscounted cash flow estimated to be generated by those assets, the carrying value of such assets would be considered impaired and reduced by a charge to operations in the amount of the impairment.
Deferred Revenue
Deferred revenue consists primarily of cash received in advance of revenue recognized on the related product or service and is recognized as the revenue recognition criteria are met. Deferred revenue that will be recognized during the succeeding twelve-month period is recorded as current deferred revenue and the remaining portion is recorded as noncurrent.
Revenue Recognition
The Company derives its revenues from the following sources: (1) subscription revenues, which comprise subscription fees from customers accessing its online service, (2) license revenue, (3) post-contract customer support, and (4) professional services. Post-contract customer support consists primarily of maintenance services. Professional services consist primarily of software configuration and training.
Revenue is recognized when the following criteria are met:
| • | There is persuasive evidence of an arrangement; |
| • | The service has been provided to the customer; |
| • | The collection of the fees is reasonably assured; and |
| • | The amount of fees to be paid by the customer is fixed or determinable. |
Subscription revenue arrangements with multiple deliverables are divided into separate units of accounting if each deliverable has stand-alone value to the customer and there is objective and reliable evidence of the fair value of each deliverable. Subscription arrangements not meeting these criteria are combined into a single unit of accounting. The Company has determined that its subscription arrangements represent a single unit of accounting and the entire arrangement fee is recognized ratably over the term of the agreement.
For sales of proprietary software products under perpetual licenses, the Company allocates revenue to each element of the contract based on the relative fair value of each of the elements based upon VSOE (vendor specific objective evidence) of fair value. The Company uses the residual method to recognize revenue when VSOE of the fair value exists for all the undelivered elements in the arrangement. VSOE for elements is based on normal pricing for those elements when sold separately. Under the residual method, the fair value of the undelivered elements is deferred and the remaining portion of the arrangement fee is recognized as revenue. For arrangements containing multiple elements when VSOE does not exist, all revenue is deferred until such time as delivery of the element or elements for which VSOE has not been determined has occurred. If the only undelivered element is maintenance and VSOE has not been established for maintenance, all revenue is recognized ratably over the term of the maintenance agreement.
F-48
Table of Contents
LMR Solutions, LLC (dba EPM Live)
Notes to Financial Statements (continued)
2. Summary of Significant Accounting Policies (continued)
Cost of Revenues
Cost of revenues primarily consists of salaries and related expenses for the Company’s online and support organizations, expenses related to running the Company’s help desk, training services, and salaries and related expenses for professional services provided to customers.
Research and Development
Research and development costs are expensed to operations as incurred. FASB authoritative guidance on accounting for the costs of computer software developed or obtained for internal use requires capitalization of certain costs incurred during the software application development stage and amortizes them over the software’s estimated useful life. Based on the Company’s product development process, costs incurred during the software application development stage where recoverability was reasonably assured have been insignificant. Through November 13, 2012 all software development costs have been expensed as incurred.
Advertising
Advertising costs are charged to operations as incurred. Advertising costs for the period from January 1, 2012 to November 13, 2012 were $7,205 and are included in sales and marketing on the statement of operations.
Income Taxes
As a limited liability corporation, the Company is not directly liable for federal income taxes. Federal taxable income is allocated to members in accordance with their respective percentage ownership, and is included on their respective federal income tax returns. The Company is subject to income tax in the state of California. The Company’s tax returns remain subject to examination by taxing authorities for the years including and subsequent to November 13, 2012.
The Company accounts for uncertainty of income taxes based on a “more-likely-than-not” threshold for the recognition and de-recognition of tax positions, which includes the accounting for interest and penalties relating to tax positions. The Company does not have any unrecognized tax benefits resulting from its tax positions at November 13, 2012.
3. Property and Equipment
Property and equipment consist of the following:
| November 13, 2012 |
||||
| Leasehold improvements |
$ | 25,322 | ||
| Furniture and fixtures |
23,168 | |||
| Computer software |
302,748 | |||
| Computer hardware |
514,697 | |||
|
|
|
|||
| 865,935 | ||||
| Less: accumulated depreciation |
(458,229 | ) | ||
|
|
|
|||
| Property and equipment, net |
$ | 407,706 | ||
|
|
|
|||
F-49
Table of Contents
LMR Solutions, LLC (dba EPM Live)
Notes to Financial Statements (continued)
3. Property and Equipment (continued)
Property and equipment are depreciated over estimated useful lives ranging from three to seven years. Leasehold improvements are amortized on a straight-line basis over the shorter of the lease term or the estimated useful life of the related asset. Depreciation expense relating to the Company’s property and equipment was $151,969 for the period from January 1, 2012 to November 13, 2012, respectively.
4. Notes Payable
On November 3, 2010, the Company entered into a Promissory Note with a financial institution with a principal amount of $250,000. The note is payable in 59 monthly installments of principal and interest in the amount of $4,684.09 beginning December 3, 2010, and continuing on the same calendar day monthly thereafter, and one final payment of outstanding principal, together with all accrued interest and any other unpaid amounts due under this Note, shall be paid on November 3, 2015. The principal amount outstanding under the agreement accrues interest at a per annum rate equal to 4.64%. Borrowings under the note are collateralized by all business asset, inventory, equipment, accounts, general intangibles, chattel paper, documents, instruments, and letter of credit rights. The principal and interest of this promissory note was $156,920 as of November 13, 2012.
On September 12, 2011, the Company entered into a Commercial Security Agreement with a financial institution with a principal amount of $400,000. The note is payable in sixty equal monthly installments of principal and interest. The principal amount outstanding under the agreement accrues interest at a per annum rate equal to 5.06%, which was fixed as of the effective date of the agreement. Borrowings under the note are collateralized by all inventory, chattel paper, accounts, equipment and general intangibles. The principal and interest of this Commercial Security Agreement was $315,416 as of November 13, 2012.
As of November 13, 2012, scheduled maturities of debt are as follows:
| Period |
Debt | |||
| November 14, 2012 to December 31, 2012 |
$ | 10,104 | ||
| 2013 |
125,537 | |||
| 2014 |
132,744 | |||
| 2015 |
135,266 | |||
| 2016 and thereafter |
68,685 | |||
|
|
|
|||
| Total debt maturities |
$ | 472,336 | ||
|
|
|
|||
5. Line of credit
On September 14, 2012, the Company entered into a loan agreement with a financial institution for a line of credit with availability of $600,000. The Company can borrow, repay, and re-borrow all or any part of the commitment at any time before the maturity date, so long as the combined total unpaid principal amount outstanding under the note and the face amount of any outstanding letters of credit does not exceed the commitment at any time. The principal amount outstanding under the line of credit is subject to change from time to time based on changes in an index which is the LIBOR Rate (“the Index”). The interest rate to be applied to the unpaid principal balance of this note will be at the rate of 3.192% over the Index. The interest is payable monthly beginning November 1, 2012 and all outstanding plus all accrued unpaid interest is due in one payment on October 1, 2013. The line of credit is collateralized by the assets of the Company, excluding any intellectual
F-50
Table of Contents
LMR Solutions, LLC (dba EPM Live)
Notes to Financial Statements (continued)
property. The line of credit is subject to certain financial covenants. As of November 13, 2012, the Company had an outstanding balance of $524,502 on the line of credit.
6. Commitments and Contingencies
Commitments
The Company leases an office facility under a non-cancellable operating lease and certain equipment under non-cancellable capital leases. For the office facility, the Company recognizes expense on a straight-line basis.
Rent expense under the operating lease included in the results of operations was $189,338 for the period from January 1, 2012 to November 13, 2012, respectively. The lease term ended on November 30, 2012.
The gross amount of computer hardware under capital leases reported in the balance sheet is $195,554, and the accumulated amortization is $19,008 as of November 13, 2012, respectively. Amortization of assets under capital lease is included in depreciation expense.
Future minimum payments required under capital and operating leases, by year and in aggregate, that have initial or remaining non-cancellable lease terms in excess of one year as of November 13, 2012, are as follows:
| Period/Year ending December 31, |
Capital Leases |
Operating Leases |
||||||
| 2012 |
$ | 18,470 | $ | 14,468 | ||||
| 2013 |
73,272 | 174,044 | ||||||
| 2014 |
68,013 | 179,265 | ||||||
| 2015 |
32,239 | 184,643 | ||||||
| 2016 and thereafter |
— | 419,614 | ||||||
|
|
|
|
|
|||||
| Total future minimum lease payments |
$ | 191,994 | $ | 972,034 | ||||
|
|
|
|||||||
| Imputed interest |
(20,512 | ) | ||||||
|
|
|
|||||||
| Present value of minimum capital lease obligations |
171,482 | |||||||
| Current portion |
(72,203 | ) | ||||||
|
|
|
|||||||
| Long-term capital lease obligations |
$ | 99,279 | ||||||
|
|
|
|||||||
7. Member’s Equity
No capital contributions were made by the members of the Company at the inception of the Company. The members have no further obligation to contribute additional amounts of capital to the Company. In addition, members are not entitled to interest or other compensation for or on account of their capital contributions to the Company.
Each member’s capital account is increased by the Company’s net profits or net losses and is allocated on an annual basis in portion to each member’s relative capital interest in the Company.
The members shall determine and distribute available funds annually or at more frequent intervals as they see fit. Distributions in liquidation of the Company or in liquidation of a member’s interest shall be made in accordance with the positive capital account balances pursuant to Treasury Regulation 1.704.1(b)(2)(ii)(b)(2). To the extent a member shall have a negative capital account balance, there shall be a qualified income offset, as set forth in
F-51
Table of Contents
LMR Solutions, LLC (dba EPM Live)
Notes to Financial Statements (continued)
Treasury Regulation 1.704.1(b)(2)(ii)(d). No member has any right to any return of capital or other distribution except as expressly provided in the Company’s Operating Agreement.
8. Employee Benefit Plan
The Company sponsors a defined contribution plan in accordance with Section 401(k) of the Internal Revenue Code of 1986 (the “401(k) Plan”). The 401(k) Plan is available to all regular employees of the Company. The Company may make matching contributions based upon elective deferrals made by participants as well as non-elective contributions allocated to all employees eligible to participate in the 401(k) Plan based upon eligible earnings. No contributions were made by the Company to the 401(k) plan for the period ended November 13, 2012.
9. Subsequent Events
Management has evaluated subsequent events up to May 7, 2014, the date the financial statements were available to be issued, for events that meet the requirements for disclosure under ASC Topic 855, Subsequent Events.
On November 13, 2012, all membership interests of the Company were acquired by Upland Software, Inc.
F-52
Table of Contents
Independent Accountant’s Review Report
To the Board of Directors and Stockholders of
Marex Group, Inc. and FileBound Solutions, Inc.:
We have reviewed the accompanying combined balance sheet of Marex Group, Inc. and FileBound Solutions, Inc. (the “Company”) as of May 16, 2013, and the related combined statements of operations, stockholders’ equity, and cash flows for the period January 1, 2013 to May 16, 2013. A review includes primarily applying analytical procedures to management’s financial data and making inquiries of company management. A review is substantially less in scope than an audit, the objective of which is the expression of an opinion regarding the financial statements as a whole. Accordingly, we do not express such an opinion.
Management is responsible for the preparation and fair presentation of the combined financial statements in accordance with accounting principles generally accepted in the United States of America and for designing, implementing, and maintaining internal control relevant to the preparation and fair presentation of the combined financial statements.
Our responsibility is to conduct the review in accordance with Statements on Standards for Accounting and Review Services issued by the American Institute of Certified Public Accountants. Those standards require us to perform procedures to obtain limited assurance that there are no material modifications that should be made to the combined financial statements. We believe that the results of our procedures provide a reasonable basis for our report.
Based on our review, we are not aware of any material modifications that should be made to the accompanying combined financial statements in order for them to be in conformity with accounting principles generally accepted in the United States of America.

August 19, 2014

F-53
Table of Contents
Marex Group, Inc. and FileBound Solutions, Inc.
Combined Balance Sheet
(unaudited)
| May 16, 2013 | ||||
| Assets |
||||
| Current assets: |
||||
| Cash and cash equivalents |
$ | 195,188 | ||
| Accounts receivable, net of allowance of $289,818 |
2,197,337 | |||
| Prepaid expenses and other |
70,016 | |||
| Receivable from shareholders |
10,000 | |||
|
|
|
|||
| Total current assets |
2,472,541 | |||
| Property and equipment, net |
966,840 | |||
| Other assets |
15,920 | |||
|
|
|
|||
| Total assets |
$ | 3,455,301 | ||
|
|
|
|||
| Liabilities and stockholders’ equity |
||||
| Current liabilities: |
||||
| Accounts payable |
$ | 229,388 | ||
| Accrued expenses and other |
250,940 | |||
| Deferred revenue |
1,873,644 | |||
|
|
|
|||
| Total current liabilities |
2,353,972 | |||
|
|
|
|||
| Total liabilities |
2,353,972 | |||
| Stockholders’ equity |
||||
| Common stock – par value $0.01 per share, 45,000 shares authorized; 19,800 shares issued and outstanding |
198 | |||
| Additional paid in capital |
19,702 | |||
| Retained earnings |
1,081,429 | |||
|
|
|
|||
| Total stockholders’ equity |
1,101,329 | |||
|
|
|
|||
| Total liabilities and stockholders’ equity |
$ | 3,455,301 | ||
|
|
|
|||
See independent accountant’s report and accompanying notes.
F-54
Table of Contents
Marex Group, Inc. and FileBound Solutions, Inc.
Combined Statement of Operations
(unaudited)
| Period January 1, 2013 to May 16, 2013 |
||||
| Revenue: |
||||
| Subscription and support |
$ | 2,288,390 | ||
| Perpetual license |
1,328,760 | |||
| Professional services |
158,288 | |||
|
|
|
|||
| Total revenue |
3,775,438 | |||
| Cost of revenue: |
||||
| Subscription and support |
615,168 | |||
| Professional services |
124,842 | |||
|
|
|
|||
| Total cost of revenue |
740,010 | |||
| Gross Profit |
3,035,428 | |||
| Operating expenses: |
||||
| Sales and marketing |
1,168,800 | |||
| Research and development |
553,028 | |||
| General and administrative |
1,396,560 | |||
| Depreciation expense |
82,608 | |||
| Acquisition-related costs |
743,496 | |||
|
|
|
|||
| Total operating expenses |
3,944,492 | |||
| Loss from operations |
(909,064 | ) | ||
| Other income (expense): |
||||
| Other expense |
(39,209 | ) | ||
|
|
|
|||
| Total other income (expense) |
(39,209 | ) | ||
|
|
|
|||
| Net loss |
(948,273 | ) | ||
|
|
|
|||
See independent accountant’s report and accompanying notes.
F-55
Table of Contents
Marex Group, Inc. and FileBound Solutions, Inc.
Combined Statement of Stockholders’ Equity
(unaudited)
| Marex Group, Inc. | FileBound Solutions, Inc. | Additional | Total | |||||||||||||||||||||||||
| Common Stock | Common Stock | Paid-in |
Retained | Stockholders’ | ||||||||||||||||||||||||
| Shares | Par Value | Shares | Par Value | Capital | Earnings | Equity | ||||||||||||||||||||||
| Balance at January 1, 2013 |
9,900 | $ | 99 | 9,900 | $ | 99 | $ | 19,702 | $ | 2,772,992 | $ | 2,792,892 | ||||||||||||||||
| Dividends |
— | — | — | — | — | (743,290 | ) | (743,290 | ) | |||||||||||||||||||
| Net loss |
— | — | — | — | — | (948,273 | ) | (948,273 | ) | |||||||||||||||||||
|
|
|
|
|
|
|
|
|
|
|
|
|
|
|
|||||||||||||||
| Balance at May 16, 2013 |
9,900 | $ | 99 | 9,000 | $ | 99 | $ | 19,702 | $ | 1,081,429 | $ | 1,101,329 | ||||||||||||||||
|
|
|
|
|
|
|
|
|
|
|
|
|
|
|
|||||||||||||||
See independent accountant’s report and accompanying notes.
F-56
Table of Contents
Marex Group, Inc. and FileBound Solutions, Inc.
Combined Statement of Cash Flows
(unaudited)
| Period January 1, 2013 to May 16, 2013 |
||||
| Operating activities |
||||
| Net loss |
$ | (948,273 | ) | |
| Adjustments to reconcile net loss to net cash used in operating activities: |
||||
| Depreciation expense |
82,608 | |||
| Loss on asset disposals |
35,917 | |||
| Forgiveness of related party note receivable |
256,678 | |||
| Changes in operating assets and liabilities: |
||||
| Accounts receivable |
190,381 | |||
| Prepaid expenses and other |
206,748 | |||
| Accounts payable |
(17,596 | ) | ||
| Accrued expenses and other |
99,576 | |||
| Deferred revenue |
72,964 | |||
|
|
|
|||
| Net cash used in operating activities |
(20,997 | ) | ||
| Investing activities |
||||
| Purchase of property and equipment |
(94,745 | ) | ||
|
|
|
|||
| Net cash used in investing activities |
(94,745 | ) | ||
| Financing activities: |
||||
| Dividends paid to stockholders |
(743,290 | ) | ||
|
|
|
|||
| Net cash used in financing activities |
(743,290 | ) | ||
| Net change in cash |
(859,032 | ) | ||
| Cash at beginning of year |
1,054,220 | |||
|
|
|
|||
| Cash at end of year |
$ | 195,188 | ||
|
|
|
|||
See independent accountant’s report and accompanying notes.
F-57
Table of Contents
Marex Group, Inc. and FileBound Solutions, Inc.
Notes to Combined Financial Statements
(unaudited)
For the period January 1, 2013 to May 16, 2013
1. Organization and Description of Business
Marex Group, Inc. and FileBound Solutions, Inc., collectively called “the Company”, are both privately held corporations which are primarily engaged in the business of developing and marketing content management solutions under the brand name FileBound. These solutions allow organizations to manage, store, and retrace information assets. Marex Group, Inc. was formed on July 18, 2001 as a Nebraska Corporation. FileBound Solutions, Inc. was formed on October 18, 2010 as a Florida Corporation.
2. Summary of Significant Accounting Policies
Basis of Accounting and Combination
The financial statements of Marex Group, Inc. and FileBound Solutions, Inc. are combined because each company has common ownership and control and the nature of transactions between the entities is such that combined financial statements are more meaningful to stockholders. All significant intercompany transactions have been eliminated. The combined financial statements were prepared on the accrual basis of accounting in accordance with accounting principles generally accepted in the United States of America.
Use of Estimates
The preparation of financial statements in conformity with accounting principles generally accepted in the United States requires management to make estimates and assumptions that affect reported amounts of assets and liabilities and disclosure of contingent assets and liabilities at the date of the financial statements and the reported amounts of revenues and expenses during the reporting period. Actual results can differ from those estimates.
Cash and Cash Equivalents
The Company considers all highly liquid investments with original maturities of less than three months at the date of purchase to be cash equivalents. The Company maintains its cash in interest bearing and non-interest bearing cash accounts.
Accounts Receivable
Accounts receivable are recorded at net realizable value. The Company assesses the collectability of outstanding receivables and maintains an allowance for doubtful accounts as necessary. In estimating the allowance, the Company considers factors such as historical collection experience, customer credit-worthiness and the age of the receivable balance. Actual customer collections could differ from the Company’s estimates.
Concentration of Credit Risk
Financial instruments which potentially subject the Company to concentrations of credit risk consist of cash and cash equivalents and accounts receivable. The Company’s cash and cash equivalents are placed with high-credit-quality financial institutions, which at times may exceed federally insured limits. The Company has not experienced any losses in these accounts and the Company does not believe it is exposed to any significant credit risk related to cash and cash equivalents. The Company performs periodic credit evaluations of its customers and generally does not require collateral. The Company’s credit extension and collection policies include analyzing
F-58
Table of Contents
Marex Group, Inc. and FileBound Solutions, Inc.
Notes to Combined Financial Statements (continued)
(unaudited)
2. Summary of Significant Accounting Policies (continued)
the financial condition of potential customers as it deems necessary, monitoring payments, and aggressively pursuing delinquent accounts.
Customers representing 10% or more of the Company’s total accounts receivable as of May 16, 2013 are as follows:
| Customer A |
13 | % | ||
| Customer B |
11 | % |
One customer represented 11% of the Company’s total revenue for the period January 1, 2013 to May 16, 2013.
Fair Value of Financial Instruments
The Company accounts for financial instruments in accordance with the authoritative guidance on fair value measurements and disclosures for financial assets and liabilities. This guidance defines fair value, establishes a framework for measuring fair value in accordance with generally accepted accounting principles and expands disclosures about fair value measurements.
The guidance also establishes a three-tier fair value hierarchy, which prioritizes the inputs used in measuring fair value. These tiers include: Level 1, defined as observable inputs such as quoted prices in active markets; Level 2, defined as inputs other than quoted prices in active markets that are either directly or indirectly observable; and Level 3, defined as unobservable inputs in which little or no market data exists, therefore requiring an entity to develop its own assumptions.
The Company’s financial instruments consist principally of cash and cash equivalents, accounts and notes receivable, and notes payable. The carrying value of these financial instruments approximates market value, primarily due to short maturities. Cash equivalents, measured at fair value on a recurring basis, are categorized as Level 1 based on quoted prices in active markets.
Property and Equipment
Property and equipment are recorded at cost less accumulated depreciation. Capital expenditures less than $1,000 are expensed as incurred. Depreciation of property and equipment is computed using the straight-line method over each asset’s useful life which ranges from three to seven years. Leasehold improvements are amortized over the shorter of the life of the lease or the estimated useful life of the assets. Upon retirement or disposal, the cost of each asset and the related accumulated depreciation are removed from the accounts, and any resulting gain or loss is credited or charged to income. Repairs, maintenance, and minor replacements are expensed as incurred.
Long-lived Assets
Long-lived assets, which consist primarily of property and equipment, are reviewed for impairment whenever events or circumstances indicate their carrying value may not be recoverable. When such events or circumstances arise, an estimate of future undiscounted cash flows produced by the asset, or the appropriate grouping of assets, is compared to the asset’s carrying value to determine if impairment exists. If the asset is determined to be impaired, the impairment loss is measured based on the excess of its carrying value over its fair value. Assets to be disposed of are reported at the lower of carrying value or net realizable value. No indicators of impairment were identified during the period January 1, 2013 to May 16, 2013.
F-59
Table of Contents
Marex Group, Inc. and FileBound Solutions, Inc.
Notes to Combined Financial Statements (continued)
(unaudited)
2. Summary of Significant Accounting Policies (continued)
Revenue Recognition
The Company derives its revenues from the following sources: (1) subscription revenues, which comprise subscription fees from customers accessing its online service, (2) license revenue, (3) post-contract customer support, and (4) professional services. Post-contract customer support consists primarily of maintenance services. Professional services consist primarily of software configuration and training.
Revenue is recognized when the following criteria are met:
| • | There is persuasive evidence of an arrangement; |
| • | The service has been provided to the customer; |
| • | The collection of the fees is reasonably assured; and |
| • | The amount of fees to be paid by the customer is fixed or determinable. |
Subscription revenue arrangements with multiple deliverables are divided into separate units of accounting if each deliverable has stand-alone value to the customer and there is objective and reliable evidence of the fair value of each deliverable. Subscription arrangements not meeting these criteria are combined into a single unit of accounting. The Company has determined that its subscription arrangements represent a single unit of accounting and the entire arrangement fee is recognized ratably over the term of the agreement.
For sales of proprietary software products under perpetual licenses, the Company allocates revenue to each element of the contract based on VSOE (vendor specific objective evidence) of fair value. The Company uses the residual method to recognize revenue when VSOE of the fair value exists for all the undelivered elements in the arrangement. VSOE for elements is based on normal pricing for those elements when sold separately. Under the residual method, the fair value of the undelivered elements is deferred and the remaining portion of the arrangement fee is recognized as revenue. For arrangements containing multiple elements when VSOE does not exist, all revenue is deferred until such time as delivery of the element or elements for which VSOE has not been determined has occurred. If the only undelivered element is maintenance and VSOE has not been established for maintenance, all revenue is recognized ratably over the term of the maintenance agreement.
Deferred Revenue
Deferred revenue consists primarily of cash received in advance of revenue recognized on the related product or service and is recognized as the revenue recognition criteria are met. Deferred revenue that will be recognized during the succeeding twelve-month period is recorded as current.
Cost of Sales
Cost of sales consists primarily of compensation and benefits, including bonuses, for personnel directly involved in the delivery of revenue.
Advertising Costs
Adverting costs are expensed in the period incurred and were not significant for the period January 1, 2013 to May 16, 2013. Advertising costs are included in sales and marketing expenses in the accompanying combined statement of operations.
F-60
Table of Contents
Marex Group, Inc. and FileBound Solutions, Inc.
Notes to Combined Financial Statements (continued)
(unaudited)
2. Summary of Significant Accounting Policies (continued)
Research and Development and Software Development Costs
The Company expenses research and development costs as incurred. The Company begins to capitalize software development costs when a product’s technological feasibility is established. Capitalization ceases when a product is available for general release to customers. To date, the period between reaching technological feasibility and the general release of the products has been short and software development costs which would have qualified for capitalization during those periods have been insignificant. The Company’s software development costs are included in research and development expense in the accompanying combined statement of operations.
Income Taxes
The Company has elected to be an S corporation under the Internal Revenue Code. In lieu of corporation income taxes, the shareholders of an S corporation are taxed on their proportionate share of the Company’s taxable income. Therefore, no provision or liability for income taxes has been included in these financial statements.
The Company files income tax returns in the U.S. federal jurisdiction, and various state jurisdictions. The Company is no longer subject to U.S. federal, or state and local, income tax examinations by tax authorities for years before 2008.
The Company accounts for uncertainty of income taxes based on a “more-likely-than-not” threshold for the recognition and de-recognition of tax positions, which includes the accounting for interest and penalties relating to tax positions. The Company does not currently have any material tax positions they consider uncertain.
Subsequent Events
Subsequent events have been evaluated through August 19, 2014 which represents the date the combined financial statements were available to be issued.
3. Property and Equipment, net
Property and equipment consist of the following at May 16, 2013:
| Equipment |
$ | 311,588 | ||
| Furniture and fixtures |
144,928 | |||
| Computers |
992,495 | |||
| Software |
47,576 | |||
| Leasehold improvements |
608,025 | |||
|
|
|
|||
| 2,104,612 | ||||
| Less: Accumulated depreciation |
(1,137,772 | ) | ||
|
|
|
|||
| Property and equipment, net |
$ | 966,840 | ||
|
|
|
Depreciation expense on property and equipment was $82,608 for the period January 1, 2013 to May 16, 2013. The Company recorded no impairment of property and equipment during the period January 1, 2013 to May 16, 2013.
F-61
Table of Contents
Marex Group, Inc. and FileBound Solutions, Inc.
Notes to Combined Financial Statements (continued)
(unaudited)
4. Line of Credit
In May 2012, the Company entered into a line of credit with a financial institution for up to $700,000 which bore interest at the prime rate (3.75% at May 16, 2013) plus 0.5% per annum with a lower limit of 4.5% per annum. The line of credit is collateralized by business assets and personally guaranteed by two shareholders of the Company. The line of credit expired on May 1, 2013. No amounts were outstanding on the line of credit as of May 16, 2013.
5. Stock Subscription Agreements
On January 26, 2010, the Company entered into two stock subscription agreements with employees of the Company. Each employee purchased 300 shares of stock in return for a promissory note of $126,427. Interest accrued on the promissory notes at a rate of 2.45% per annum and were payable in full at maturity in February 2014. On May 16, 2013, the notes receivable from shareholders were forgiven by the Company.
6. Common Stock
The Company is authorized to issue up to 20,000 shares of Marex Group, Inc. common stock with a par value of $0.01 per share, and 25,000 shares of FileBound Solutions, Inc. common stock with a par value of $0.01 per share, of which 15,000 authorized shares of Marex Group, Inc. common stock and 15,000 authorized shares of FileBound Solutions, Inc. common stock are designated as voting common stock, and the remainder is designated as non-voting common stock. Each issued and outstanding share of voting common stock is entitled to one vote. At May 16, 2013, the Company had combined 19,800 shares of voting common stock issued and outstanding.
7. Commitments and Contingencies
The Company leases office space and certain equipment under multiple non-cancellable operating leases which expire between 2013 and 2018. The office space lease contains predetermined fixed rental payment escalations. The Company recognizes expense on a straight-line basis and records the difference between the recognized rental expense and amounts paid under the lease as deferred rent.
Future minimum payments under the Company’s operating leases are as follows at May 16, 2013:
| 2013 |
$ | 160,695 | ||
| 2014 |
236,503 | |||
| 2015 |
241,635 | |||
| 2016 |
248,798 | |||
| 2017 |
256,849 | |||
|
|
|
|||
| Total minimum lease payments |
$ | 1,144,480 | ||
|
|
|
Rent expense for the period of January 1, 2013 to May 16, 2013 was approximately $137,000. Deferred rent was not significant at May 16, 2013.
F-62
Table of Contents
Marex Group, Inc. and FileBound Solutions, Inc.
Notes to Combined Financial Statements (continued)
(unaudited)
7. Commitments and Contingencies (continued)
Litigation
In the normal course of business, the Company may become involved in various lawsuits and legal proceedings. While the ultimate results of these matters cannot be predicted with certainty, management does not expect them to have material adverse effect on the financial position or results of operations of the Company.
8. Defined Contribution Plan
The Company has a defined contribution retirement plan under Section 401(k) of the Internal Revenue Code of 1986. Employer contributions to the Plan totaled $112,764 for the period January 1, 2013 to May 16, 2013.
9. Related Party Transactions
The Company’s largest office lease was entered into with a related party through common ownership. In February 2013, this office property was sold to a third-party. Rent payments made while the lease was under common ownership were not significant.
10. Subsequent Events
On May 17, 2013, all outstanding shares of the Company were acquired by Upland Software, Inc. “Upland Software” (formerly Silverback Enterprise Group, Inc.). Upland Software acquires, optimizes, and builds software businesses that provide mission-critical software to enterprise customers.
F-63
Table of Contents

To the Board of Directors
Marex Group, Inc. and FileBound Solutions, Inc.
Lincoln, Nebraska
We have audited the accompanying combined balance sheet of Marex Group, Inc. (a Nebraska corporation) and FileBound Solutions, Inc. (a Florida corporation) as of December 31, 2012, and the related combined statements of income, changes in shareholders’ equity and cash flows for the year then ended.
Management’s Responsibility for the Financial Statements
Management is responsible for the preparation and fair presentation of these financial statements in accordance with accounting principles generally accepted in the United States of America; this includes the design, implementation, and maintenance of internal control relevant to the preparation and fair presentation of financial statements that are free from material misstatement, whether due to fraud or error.
Auditor’s Responsibility
Our responsibility is to express an opinion on these financial statements based on our audit. We conducted our audit in accordance with auditing standards generally accepted in the United States of America. Those standards require that we plan and perform the audit to obtain reasonable assurance about whether the financial statements are free from material misstatement.
An audit involves performing procedures to obtain audit evidence about the amounts and disclosures in the financial statements. The procedures selected depend on the auditor’s judgment, including the assessment of the risks of material misstatement of the financial statements, whether due to fraud or error. In making those risk assessments, the auditor considers internal control relevant to the entity’s preparation and fair presentation of the financial statements in order to design audit procedures that are appropriate in the circumstances, but not for the purpose of expressing an opinion on the effectiveness of the entity’s internal control. Accordingly, we express no such opinion. An audit also includes evaluating the appropriateness of accounting policies used and the reasonableness of significant accounting estimates made by management, as well as evaluating the overall presentation of the financial statements.
We believe that the audit evidence that we have obtained is sufficient and appropriate to provide a basis for our audit opinion.
Opinion
In our opinion, the financial statements referred to above present fairly, in all material respects, the financial position of Marex Group, Inc. and FileBound Solutions, Inc. as of December 31, 2012, and the results of its operations and its cash flows for the year then ended in accordance with accounting principles generally accepted in the United States of America.

Omaha, Nebraska
March 28, 2013
F-64
Table of Contents
Marex Group, Inc. and FileBound Solutions, Inc.
Combined Balance Sheet
December 31, 2012
| 2012 | ||||
| Assets |
||||
| Current Assets: |
||||
| Cash |
$ | 1,054,221 | ||
| Accounts receivable – net of allowance of $184,030 |
2,348,664 | |||
| Short-term note receivable from customer |
61,852 | |||
| Prepaid expenses |
189,415 | |||
| Escrow – customer contract |
15,920 | |||
|
|
|
|||
| Total current assets |
3,670,072 | |||
| Property and Equipment – at cost: |
||||
| Leasehold improvements |
586,538 | |||
| Equipment |
1,423,329 | |||
| Vehicles |
116,386 | |||
|
|
|
|||
| 2,126,253 | ||||
| Less accumulated depreciation |
(1,135,633 | ) | ||
|
|
|
|||
| Property and equipment – net |
990,620 | |||
| Other Assets: |
||||
| Due from shareholders |
281,439 | |||
|
|
|
|||
| Total Assets |
$ | 4,942,131 | ||
|
|
|
|||
See accompanying notes to financial statements.
F-65
Table of Contents
Marex Group, Inc. and FileBound Solutions, Inc.
Combined Balance Sheet (continued)
December 31, 2012
| 2012 | ||||
| Liabilities and Shareholders’ Equity |
||||
| Current Liabilities: |
||||
| Accounts payable |
$ | 197,196 | ||
| Accrued liabilities |
23,482 | |||
| Accrued 401k liabilities |
127,080 | |||
| Deferred revenue |
1,801,481 | |||
|
|
|
|||
| Total current liabilities |
2,149,239 | |||
| Commitments |
— | |||
| Shareholders’ Equity: |
||||
| Common stock – Marex Group, Inc., par value $1 per share, 10,000 shares authorized; |
9,900 | |||
| Common stock – FileBound Solutions, Inc. – par value $0.01 per share, 25,000 shares authorized; 9,900 shares issued and outstanding |
99 | |||
| Additional paid in capital |
9,901 | |||
| Retained earnings |
2,772,992 | |||
|
|
|
|||
| Total shareholders’ equity |
2,792,892 | |||
|
|
|
|||
| Total Liabilities and Shareholders’ Equity |
$ | 4,942,131 | ||
|
|
|
|||
See accompanying notes to financial statements.
F-66
Table of Contents
Marex Group, Inc. and FileBound Solutions, Inc.
Combined Statement of Income
Year Ended December 31, 2012
| 2012 | ||||
| Revenue |
$ | 9,884,792 | ||
| Operating Expenses: |
||||
| Advertising |
34,192 | |||
| Automobile expense |
32,274 | |||
| Bad debt expense |
139,205 | |||
| Bank charges |
19,083 | |||
| Client relations |
15,183 | |||
| Computer expense |
9,647 | |||
| Contract labor |
584,921 | |||
| Contributions |
1,770 | |||
| Data Center Services |
503,816 | |||
| Depreciation |
171,479 | |||
| Dues and subscriptions |
38,727 | |||
| Employee benefits |
159,486 | |||
| Insurance |
17,129 | |||
| Interest |
7,402 | |||
| Licensing |
101,366 | |||
| Life insurance |
9,660 | |||
| Meals and entertainment |
46,834 | |||
| Meetings and conferences |
73,235 | |||
| Office expense |
36,735 | |||
| Officers’ compensation |
966,042 | |||
| Outside services |
199,899 | |||
| Partner conference |
211,396 | |||
| Payroll taxes |
213,772 | |||
| Postage |
23,195 | |||
| Professional fees |
576,901 | |||
| Rents |
330,233 | |||
| Repairs and maintenance |
15,286 | |||
| Retirement plan contributions |
202,110 | |||
| Salaries |
2,439,869 | |||
| Supplies |
67,655 | |||
| Taxes |
41,937 | |||
| Telephone |
120,167 | |||
| Travel |
359,429 | |||
| Utilities |
28,572 | |||
|
|
|
|||
| Total Operating Expenses |
7,798,607 | |||
| Operating Income |
2,086,185 | |||
| Other Income/(Expenses) |
||||
| Interest Income |
31,205 | |||
| Other expense |
(158,008 | ) | ||
|
|
|
|||
| Net Income |
$ | 1,959,382 | ||
|
|
|
|||
See accompanying notes to financial statements.
F-67
Table of Contents
Marex Group, Inc. and FileBound Solutions, Inc.
Combined Statement of Changes in Shareholders’ Equity
Year Ended December 31, 2012
| Common Stock |
Additional Paid-in Capital |
Retained Earnings |
Total | |||||||||||||
| Balance, December 31, 2011 |
||||||||||||||||
| As previously reported |
$ | 9,999 | $ | 9,901 | $ | 2,057,254 | $ | 2,077,154 | ||||||||
| Prior period adjustment |
— | — | (303,196 | ) | (303,196 | ) | ||||||||||
|
|
|
|
|
|
|
|
|
|||||||||
| Balance, December 31, 2011 As restated |
9,999 | 9,901 | 1,754,058 | 1,773,958 | ||||||||||||
| Distributions |
— | — | (940,448 | ) | (940,448 | ) | ||||||||||
| Net Income |
— | — | 1,959,382 | 1,959,382 | ||||||||||||
|
|
|
|
|
|
|
|
|
|||||||||
| Balance, December 31, 2012 |
$ | 9,999 | $ | 9,901 | $ | 2,772,992 | $ | 2,792,892 | ||||||||
|
|
|
|
|
|
|
|
|
|||||||||
See accompanying notes to financial statements.
F-68
Table of Contents
Marex Group, Inc. and FileBound Solutions, Inc.
Combined Statement of Cash Flows
Year Ended December 31, 2012
| 2012 | ||||
| Cash Flows from Operating Activities: |
||||
| Net Income |
$ | 1,959,382 | ||
| Adjustments to Reconcile Net Income to Net Cash Provided by Operating Activities: |
||||
| Non-cash Transactions: |
||||
| Depreciation |
171,479 | |||
| Accrued interest on promissory notes |
(6,194 | ) | ||
| Prior period adjustment |
(303,196 | ) | ||
| (Increase) Decrease in Operating Assets: |
||||
| Accounts receivable |
(264,408 | ) | ||
| Employee advance |
5,000 | |||
| Prepaid expenses |
(108,140 | ) | ||
| Short-term notes receivable from customers |
(61,852 | ) | ||
| Increase (Decrease) in Operating Liabilities: |
||||
| Accounts payable |
132,320 | |||
| Deferred revenue |
937,925 | |||
| Accrued expenses |
27,702 | |||
|
|
|
|||
| Net Cash Provided by Operating Activities |
2,490,018 | |||
| Cash Flows From Investing Activities: |
||||
| Purchase equipment, signs and leasehold improvements |
(397,419 | ) | ||
|
|
|
|||
| Net Cash (Used) by Investing Activities |
(397,419 | ) | ||
| Cash Flows From Financing Activities: |
||||
| Repayment of debt on stock |
(71,404 | ) | ||
| Distributions |
(940,448 | ) | ||
| Payment on Line of Credit |
(473,000 | ) | ||
| Repayment of long-term debt |
(32,014 | ) | ||
|
|
|
|||
| Net Cash (Used by) Financing Activities |
(1,516,866 | ) | ||
|
|
|
|||
| Net Increase in Cash |
575,733 | |||
| Cash, December 31, 2011 |
478,488 | |||
|
|
|
|||
| Cash, December 31, 2012 |
$ | 1,054,221 | ||
|
|
|
|||
| Cash paid for interest and income taxes: |
||||
| Interest |
$ | 7,042 | ||
|
|
|
|||
| State income taxes |
$ | 2,700 | ||
|
|
|
|||
See accompanying notes to financial statements.
F-69
Table of Contents
Marex Group, Inc. and FileBound Solutions, Inc.
Notes to Combined Financial Statements
Year Ended December 31, 2012
1. Summary of significant accounting policies:
Marex Group, Inc. and FileBound Solutions, Inc. are both privately held corporations which are primarily engaged in the business of developing and marketing content management solutions under the brand name FileBound. These solutions allow organizations to manage, store and retrieve all their information assets.
A. Basis of accounting:
The Company prepares its financial statements on the accrual basis under generally accepted accounting principles in the United States of America.
B. Revenue Recognition:
Revenue from licensing of software is recognized upon shipment provided that persuasive evidence of an arrangement exists, payment terms are fixed and determinable, and collection of the related receivable is considered probable. Revenues from consulting, training, and other services are generally recognized as the services are performed.
When software licenses are bundled with related services, revenues are allocated to each element of the arrangement based on the relative fair values of the elements. The determination of fair value is based on information that is specific to the Company, commonly referred to as vendor-specific objective evidence (“VSOE”). Fair values for the Company’s products and services are based on prices charged when each element is sold separately. If an element has not been sold separately and VSOE of fair value is unavailable, fair value is determined by the Company’s management. If evidence of fair value for individual elements of the arrangement does not exist and if management cannot determine fair value, all revenue from the arrangement is deferred until such time that evidence of fair value exists or until all elements of the arrangement are delivered. If fair value does not exist for one or more of the delivered elements, revenue is recognized under the residual method of accounting. Under this method, the fair value of the undelivered elements is deferred and the remaining portion of the fee is recognized as revenue. Revenue is not deferred for undelivered elements that are deemed to be insignificant.
Generally, the arrangements for software licenses and/or the right to use multiple copies provide for nonrefundable fees. Revenues are recognized upon delivery of the first copy, provided all significant obligations have been met, persuasive evidence of an arrangement exists, fees are fixed and determinable, and collection is probable.
The Company provides an allowance for sales returns based upon estimated and known returns. Product returns are recorded as a reduction of net revenues and as a reduction of the accounts receivable balance.
C. Allowance for doubtful accounts:
Trade accounts receivable are stated net of an allowance for doubtful accounts. Management charges allowance for doubtful accounts when they are considered uncollectible. The Company evaluated accounts receivable and did provide an allowance of $184,030 as of December 31, 2012.
F-70
Table of Contents
Marex Group, Inc. and FileBound Solutions, Inc.
Notes to Combined Financial Statements (continued)
Year Ended December 31, 2012
D. Property and equipment:
Property and equipment are recorded at cost. Depreciation is provided on a straight line method over the estimated useful life of the assets.
| Leasehold improvements |
15 to 39 years | |
| Equipment |
3 to 7 years | |
| Vehicles |
5 years |
Depreciation expense for the year ended December 31, 2012 was $171,479.
E. Use of estimates:
The preparation of financial statements in conformity with U.S. generally accepted accounting principles requires management to make estimates and assumptions that affect certain reported amounts and disclosures. Accordingly, actual results could differ from those estimates.
F. Cash and cash equivalents:
For purposes of the statement of cash flows, the Company considers all highly liquid debt instruments with maturity at acquisition of three months or less to be cash equivalents.
G. Subsequent Events:
Management has evaluated subsequent events through March 28, 2012, the date which the financial statements were available for issue. Please see Note 15 for subsequent event.
2. Income Taxes:
The Company has elected to be an S corporation under the Internal Revenue Code. In lieu of corporation income taxes, the shareholders of an S corporation are taxed on their proportionate share of the Company’s taxable income. Therefore, no provision or liability for income taxes has been included in these financial statements.
The Company files income tax returns in the U.S. federal jurisdiction, and various state jurisdictions. The Company is no longer subject to U.S. federal, or state and local, income tax examinations by tax authorities for years before 2008.
The Company follows the provisions of uncertain tax positions as addressed in FASB Accounting Standards Codification 740-10-65-1. The Company recognized no increase in the liability for unrecognized tax benefits. The Company has no tax position at December 31, 2012 for which the ultimate deductibility is highly certain but for which there is uncertainty about the timing of such deductibility. The Company recognizes interest accrued related to unrecognized tax benefits in interest expense and penalties in operating expenses. No such interest or penalties were recognized during the year presented. The Company had no accruals for interest and penalties at December 31, 2012.
3. Deferred Revenue:
The Company engages in annual maintenance subscription agreements and warranty services with its clients. The payments are considered deferred revenue when received and amortized over the 12 month subscription period for maintenance. Warranty services have a one or three year amortization period.
F-71
Table of Contents
Marex Group, Inc. and FileBound Solutions, Inc.
Notes to Combined Financial Statements (continued)
Year Ended December 31, 2012
4. Leasing Arrangements – Related Party:
The Company conducts its operations from a 22,950 square foot facility that is leased under a five-year operating lease. In May 2007, the Company’s facility was purchased by a related party, a partnership owned equally by the controlling shareholders of the Company. The annual lease rate for 2012 was $11 per square foot, or $21,037 monthly. For years 2-3, the annual lease will increase $1 per square foot each year and $0.50 for years 4-5. Rent expense for 2012 was $231,412. See Note 15 for subsequent event related to this lease.
The following is a schedule of future obligations under the above operating lease as of December 31, 2012:
| Year ending December 31, |
Amount | |||
| 2013 |
$ | 275,400 | ||
| 2014 |
274,875 | |||
| 2015 |
298,350 | |||
|
|
|
|||
| $ | 848,625 | |||
|
|
|
|||
5. Employee Benefits:
For the year ended December 31, 2012, the Company paid the entire cost of employee health insurance coverage and one-half of the cost of family coverage. The Company also pays for deductible expenses. For employee only coverage, the deductible is $4,000 and the Company covers costs above $2,000. For family coverage, the deductible is $8,000 and the Company covers costs above $4,000. This expense for premiums and additional expenses was $139,985 for 2012.
6. Profit Sharing Plan:
The Company adopted a Standardized 401(k) Profit Sharing Plan, effective February 10, 2005. At the beginning of this year the plan was amended to a Safe Harbor Plan in which the Company is obligated to contribute 3% of each eligible employee’s compensation. Employees are eligible to participate in the plan after 90 days of employment. Employees can defer a portion of their salary in an amount not to exceed the maximum amount allowable under the Internal Revenue Code. There is no prior service obligation. Total plan expenses for the year ended 2012 was $202,110. The Company also provided a discretionary profit sharing contribution that is established by management at year-end. This discretionary amount is allocated amongst employees based on level of compensation and their employment classification. Included in the retirement plan contributions for the year ended December 31, 2012 is a profit sharing contribution of $97,260.
7. Operating Lease:
The Company has equipment that is leased under a five-year non-cancelable operating lease expiring in 2014. The Company has vehicles that are leased under a three-year and four-year non-cancelable operating lease expiring in 2013 and 2015. The Company leases office space in Colorado and Florida. The lease in Florida is a month to month lease. The Colorado lease is a thirty-eight month lease expiring in 2014.
F-72
Table of Contents
Marex Group, Inc. and FileBound Solutions, Inc.
Notes to Combined Financial Statements (continued)
Year Ended December 31, 2012
Future minimum rental payments due under the leases are as follows:
| Year Ending December 31, |
Equipment | Vehicles | Office | Total | ||||||||||||
| 2013 |
$ | 5,137 | $ | 19,971 | $ | 19,259 | $ | 44,367 | ||||||||
| 2014 |
1,712 | 9,378 | 1,610 | 12,700 | ||||||||||||
| 2015 |
— | 7,815 | — | 7,815 | ||||||||||||
|
|
|
|
|
|
|
|
|
|||||||||
| $ | 6,849 | $ | 37,164 | $ | 20,869 | $ | 64,882 | |||||||||
|
|
|
|
|
|
|
|
|
|||||||||
8. Line of credit:
The Company has a line of credit for $700,000 as of December 31, 2012. The note is collateralized by business assets and personally guaranteed by the majority shareholders. The line of credit bears interest at .5%, over the national prime rate, but not below 4.5%. The prime rate was 3.25% at December 31, 2012. Total borrowings under this line of credit at December 31, 2012 was $0.
9. Concentration of Credit Risk:
The Company maintains its primary cash balances in one financial institution. The Federal Deposit Insurance Corporation (FDIC) insures balances up to $250,000 for each account. At times the cash balance of the Company’s accounts may exceed this limit.
10. Stock Transactions:
On January 26, 2010, the Company entered into two stock subscription agreements with employees of the Company. Each employee purchased 300 shares of stock in return for a promissory note of $126,427 each. Interest shall accrue on the promissory notes at a rate of 2.45% per year with no payment due. If the notes are not paid in full by February 26, 2014, principal and accrued interest to date will be paid in 120 equal consecutive monthly installments.
11. Contingencies
The Company is involved in various claims and legal actions arising in the ordinary course of business. In the opinion of management, the ultimate disposition of these matters will not have a material adverse effect on the Company’s financial position, results of operations, or liquidity. Included in the financial statements are claims paid in relation to these obligations of $158,008.
12. Notes Receivable:
All notes receivable are payments due from recurring customers. The balance as of December 31, 2012 was $61,852. The note is non-interest bearing and is paid by the margin received on client billings.
13. Notes Payable:
As of December 31, 2012 the Company does not have any long-term obligations.
F-73
Table of Contents
Marex Group, Inc. and FileBound Solutions, Inc.
Notes to Combined Financial Statements (continued)
Year Ended December 31, 2012
14. Compensated Absences:
Employees of the Company are entitled to paid vacation, paid sick days, and personal days off, depending on job classification, length of service, and other factors. It is impracticable to estimate the amount of compensation for future absences, and accordingly, no liability has been recorded in the accompanying financial statements. The company’s policy is to recognize the costs of compensated absences when actually paid to employees.
15. Subsequent Event:
The building lease mentioned in Note 4 has been sold by the shareholders during February 2013. The new five-year lease was executed with a third party, effective March 1, 2013. The annual lease rate for the first twelve months is $9.85 per square foot, or $18,838 monthly. For years 2-5, the annual lease will increase $0.35 per square foot each year.
The following is a schedule of future obligations under the above operating lease as of December 31, 2012:
| Year ending December 31, |
Amount | |||
| 2013 |
$ | 188,381 | ||
| 2014 |
232,751 | |||
| 2015 |
240,784 | |||
| 2016 |
248,816 | |||
| 2017 |
256,849 | |||
|
|
|
|||
| $ | 1,167,581 | |||
|
|
|
|||
16. Prior period adjustment:
Retained earnings at the beginning of 2012 have been adjusted for a maintenance and licensing revenue recognition policy as stated in Note 1B. A portion of the licensing and implementation revenue has been adjusted for the deferred portion. The change in the deferred accounts created a prior period retained earnings adjustment of $303,196.
F-74
Table of Contents
Marex Group, Inc. and FileBound Solutions, Inc.
Combining Schedule – Balance Sheet Information
December 31, 2012
| Marex Group, Inc. |
FileBound Solutions, Inc |
Total | Eliminating Entries |
Combined Totals |
||||||||||||||||
| Assets |
||||||||||||||||||||
| Current Assets: |
||||||||||||||||||||
| Cash |
$ | 257,374 | $ | 796,847 | $ | 1,054,221 | $ | — | $ | 1,054,221 | ||||||||||
| Accounts receivable |
1,419,774 | 967,943 | 2,387,717 | (39,053 | ) | 2,348,664 | ||||||||||||||
| Short-term note receivable from customer |
71,652 | 61,852 | 133,504 | (71,652 | ) | 61,852 | ||||||||||||||
| Prepaid expenses |
172,265 | 27,886 | 200,151 | (10,736 | ) | 189,415 | ||||||||||||||
| Escrow – customer contract |
15,920 | — | 15,920 | — | 15,920 | |||||||||||||||
|
|
|
|
|
|
|
|
|
|
|
|||||||||||
| Total current assets |
1,936,985 | 1,854,528 | 3,791,512 | (121,440 | ) | 3,670,072 | ||||||||||||||
| Property and Equipment – at cost: |
||||||||||||||||||||
| Leasehold improvements |
586,538 | — | 586,538 | — | 586,538 | |||||||||||||||
| Equipment |
1,022,185 | 362,321 | 1,384,506 | 38,823 | 1,423,329 | |||||||||||||||
| Vehicles |
116,386 | — | 116,386 | — | 116,386 | |||||||||||||||
|
|
|
|
|
|
|
|
|
|
|
|||||||||||
| 1,725,109 | 362,321 | 2,087,430 | 38,823 | 2,126,253 | ||||||||||||||||
| Less accumulated depreciation |
(1,071,636 | ) | (63,997 | ) | (1,135,633 | ) | — | (1,135,633 | ) | |||||||||||
|
|
|
|
|
|
|
|
|
|
|
|||||||||||
| Property and equipment – net |
653,472 | 298,324 | 951,797 | 38,823 | 990,620 | |||||||||||||||
| Other Assets: |
||||||||||||||||||||
| Due from Shareholders |
281,439 | — | 281,439 | — | 281,439 | |||||||||||||||
|
|
|
|
|
|
|
|
|
|
|
|||||||||||
| Total Assets |
$ | 2,871,897 | $ | 2,152,851 | $ | 5,024,748 | $ | (82,617 | ) | $ | 4,942,131 | |||||||||
|
|
|
|
|
|
|
|
|
|
|
|||||||||||
| Liabilities and Shareholders’ Equity |
||||||||||||||||||||
| Current Liabilities: |
||||||||||||||||||||
| Accounts payable |
$ | 196,338 | $ | 50,646 | $ | 246,984 | $ | (49,788 | ) | $ | 197,196 | |||||||||
| Accrued liabilities |
21,284 | 2,198 | 23,482 | — | 23,482 | |||||||||||||||
| Accrued 401k liabilities |
126,480 | 600 | 127,080 | — | 127,080 | |||||||||||||||
| Intercompany transfers |
1,151,810 | (1,151,810 | ) | — | — | — | ||||||||||||||
| Current portion of long-term debt |
— | 71,652 | 71,652 | (71,652 | ) | 0 | ||||||||||||||
| Deferred revenue |
578,494 | 1,222,987 | 1,801,481 | — | 1,801,481 | |||||||||||||||
|
|
|
|
|
|
|
|
|
|
|
|||||||||||
| Total current liabilities |
2,074,406 | 196,273 | 2,270,680 | (121,440 | ) | 2,149,239 | ||||||||||||||
| Shareholders’ Equity: |
||||||||||||||||||||
| Common stock – Marex Group, Inc. |
9,900 | — | 9,900 | — | 9,900 | |||||||||||||||
| Common stock – FileBound Solutions, Inc. |
— | 99 | 99 | — | 99 | |||||||||||||||
| Additional paid in capital |
— | 9,901 | 9,901 | — | 9,901 | |||||||||||||||
| Retained earnings |
787,591 | 1,946,578 | 2,734,169 | 38,823 | 2,772,992 | |||||||||||||||
|
|
|
|
|
|
|
|
|
|
|
|||||||||||
| Total shareholders’ equity |
797,491 | 1,956,578 | 2,754,069 | 38,823 | 2,792,892 | |||||||||||||||
|
|
|
|
|
|
|
|
|
|
|
|||||||||||
| Total Liabilities and Shareholders’ Equity |
$ | 2,871,897 | $ | 2,152,851 | $ | 5,024,748 | $ | (82,617 | ) | $ | 4,942,131 | |||||||||
|
|
|
|
|
|
|
|
|
|
|
|||||||||||
Amounts may not foot due to rounding.
See accompanying independent auditors’ report.
F-75
Table of Contents
Marex Group, Inc. and FileBound Solutions, Inc.
Combining Schedule – Statement of Operations Information
Year Ended December 31, 2012
| Marex Group, Inc. |
FileBound Solutions, Inc. |
Total | Eliminating entries |
Combined Totals |
||||||||||||||||
| Revenue |
$ | 5,285,081 | $ | 4,599,711 | 9,884,792 | $ | — | 9,884,792 | ||||||||||||
| Operating Expenses: |
||||||||||||||||||||
| Advertising expense |
34,192 | — | 34,192 | — | 34,192 | |||||||||||||||
| Automobile expense |
31,807 | 468 | 32,274 | — | 32,274 | |||||||||||||||
| Bad Debt |
99,041 | 40,164 | 139,205 | — | 139,205 | |||||||||||||||
| Bank charges |
15,475 | 3,607 | 19,083 | — | 19,083 | |||||||||||||||
| Client relations |
15,183 | — | 15,183 | — | 15,183 | |||||||||||||||
| Computer expense |
9,647 | — | 9,647 | — | 9,647 | |||||||||||||||
| Contract labor |
512,121 | 72,800 | 584,921 | — | 584,921 | |||||||||||||||
| Contributions |
1,770 | — | 1,770 | — | 1,770 | |||||||||||||||
| Data Center Services |
288,094 | 215,721 | 503,816 | — | 503,816 | |||||||||||||||
| Depreciation Expense |
133,423 | 38,055 | 171,479 | — | 171,479 | |||||||||||||||
| Dues and subscriptions |
38,727 | — | 38,727 | — | 38,727 | |||||||||||||||
| Employee benefits |
159,486 | — | 159,486 | — | 159,486 | |||||||||||||||
| Insurance |
17,128 | — | 17,128 | — | 17,128 | |||||||||||||||
| Interest |
36,302 | 2,506 | 38,808 | (31,406 | ) | 7,402 | ||||||||||||||
| Licensing |
101,366 | — | 101,366 | — | 101,366 | |||||||||||||||
| Life Insurance |
9,660 | 9,660 | 9,660 | |||||||||||||||||
| Meals and entertainment |
46,834 | — | 46,834 | — | 46,834 | |||||||||||||||
| Meetings and conferences |
73,235 | — | 73,235 | — | 73,235 | |||||||||||||||
| Office expense |
(2,188,464 | ) | 2,225,198 | 36,735 | — | 36,735 | ||||||||||||||
| Officer compensation |
966,042 | 966,042 | 966,042 | |||||||||||||||||
| Outside services |
145,034 | 54,865 | 199,899 | — | 199,899 | |||||||||||||||
| Partner conference |
211,396 | — | 211,396 | — | 211,396 | |||||||||||||||
| Payroll taxes |
206,546 | 7,226 | 213,772 | — | 213,772 | |||||||||||||||
| Postage |
23,195 | — | 23,195 | — | 23,195 | |||||||||||||||
| Professional fees |
532,799 | 44,103 | 576,901 | — | 576,901 | |||||||||||||||
| Rents |
307,859 | 22,374 | 330,233 | — | 330,233 | |||||||||||||||
| Repairs and maintenance |
15,286 | — | 15,286 | — | 15,286 | |||||||||||||||
| Retirement plan contributions |
199,325 | 2,785 | 202,110 | — | 202,110 | |||||||||||||||
| Salaries |
2,347,763 | 92,106 | 2,439,869 | — | 2,439,869 | |||||||||||||||
| Supplies |
66,920 | 736 | 67,655 | — | 67,655 | |||||||||||||||
| Taxes |
41,737 | 200 | 41,937 | — | 41,937 | |||||||||||||||
| Telephone |
120,167 | — | 120,167 | — | 120,167 | |||||||||||||||
| Travel |
343,938 | 15,491 | 359,429 | — | 359,429 | |||||||||||||||
| Utilities |
28,572 | — | 28,572 | — | 28,572 | |||||||||||||||
|
|
|
|
|
|
|
|
|
|
|
|||||||||||
| 4,991,608 | 2,838,405 | 7,830,014 | (31,406 | ) | 7,798,607 | |||||||||||||||
|
|
|
|
|
|
|
|
|
|
|
|||||||||||
| Operating Income |
293,473 | 1,761,306 | 2,054,778 | 31,406 | 2,086,185 | |||||||||||||||
| Interest Income |
14,725 | 47,886 | 62,611 | (31,406 | ) | 31,205 | ||||||||||||||
| Other Expenses |
(158,008 | ) | — | (158,008 | ) | — | (158,008 | ) | ||||||||||||
|
|
|
|
|
|
|
|
|
|
|
|||||||||||
| Net Income |
$ | 150,190 | $ | 1,809,192 | $ | 1,959,382 | 0 | $ | 1,959,382 | |||||||||||
|
|
|
|
|
|
|
|
|
|
|
|||||||||||
Amounts may not foot due to rounding.
See accompanying independent auditors’ report.
F-76
Table of Contents
To the Board of Directors
Marex Group, Inc. and FileBound Solutions, Inc.
Lincoln, Nebraska
We have audited the accompanying combined balance sheet of Marex Group, Inc. (a Nebraska corporation) and FileBound Solutions, Inc. (a Florida corporation) as of December 31, 2011, and the related combined statements of income, changes in shareholders’ equity and cash flows for the year then ended. These combined financial statements are the responsibility of the Company’s management. Our responsibility is to express an opinion on these combined financial statements based on our audit.
We conducted our audit in accordance with auditing standards generally accepted in the United States of America. Those standards require that we plan and perform the audit to obtain reasonable assurance about whether the combined financial statements are free of material misstatements. An audit includes examining, on a test basis, evidence supporting the amounts and disclosures in the combined financial statements. An audit also includes assessing the accounting principles used and significant estimates made by management, as well as evaluating the overall financial statement presentation. We believe that our audit provides a reasonable basis for our opinion.
In our opinion, the combined financial statements referred to above present fairly, in all material respects, the financial position of Marex Group, Inc. and FileBound Solutions, Inc. as of December 31, 2011, and the results of its operations and its cash flows for the year then ended in conformity with accounting principles generally accepted in the United States of America.
As described in Note 15 to the financial statements, licensing and implementation revenue has been adjusted to reflect the deferred portion. Our opinion is not modified with respect to that matter.
Our audits were made for the purpose of forming an opinion on the consolidated financial statements taken as a whole. The supplementary information included on pages 13-14 is presented for purposes of additional analysis and is not a required part of the basic consolidated financial statements. Such information has been subjected to the auditing procedures applied in the audit of the basic combined financial statements and, in our opinion, is fairly stated in all material respects in relation to the combined financial statements taken as a whole.

Omaha, Nebraska
March 28, 2012, except for Note 15, as to which the date is March 28, 2013
F-77
Table of Contents
Marex Group, Inc. and FileBound Solutions, Inc.
Combined Balance Sheet
December 31, 2011
| 2011 | ||||
| Assets |
||||
| Current Assets: |
||||
| Cash |
$ | 478,488 | ||
| Accounts receivable |
2,080,590 | |||
| Prepaid expenses |
81,275 | |||
| Employee advances |
5,000 | |||
| Escrow – customer contract |
15,920 | |||
|
|
|
|||
| Total current assets |
2,661,273 | |||
| Property and Equipment – at cost: |
||||
| Leasehold improvements |
538,781 | |||
| Equipment |
1,101,195 | |||
| Vehicles |
88,858 | |||
|
|
|
|||
| 1,728,834 | ||||
| Less accumulated depreciation |
(964,154 | ) | ||
|
|
|
|||
| Property and equipment – net |
764,680 | |||
| Other Assets: |
||||
| Due from shareholders |
278,911 | |||
|
|
|
|||
| Total Assets |
$ | 3,704,864 | ||
|
|
|
|||
F-78
Table of Contents
Marex Group, Inc. and FileBound Solutions, Inc.
Combined Balance Sheet (continued)
December 31, 2011
| 2011 | ||||
| Liabilities and Shareholders’ Equity |
||||
| Current Liabilities: |
||||
| Accounts payable |
$ | 64,875 | ||
| Accrued liabilities |
2,616 | |||
| Accrued 401k liabilities |
120,244 | |||
| Line of credit |
473,000 | |||
| Current portion of long-term debt |
85,253 | |||
| Deferred revenue |
1,166,753 | |||
|
|
|
|||
| Total current liabilities |
1,912,741 | |||
| Long-term Liabilities: |
||||
| Note payable |
103,418 | |||
| Less current portion |
(85,253 | ) | ||
|
|
|
|||
| Total long-term liabilities |
18,165 | |||
|
|
|
|||
| Total Liabilities |
1,930,906 | |||
|
|
|
|||
| Shareholders’ Equity: |
||||
| Common stock – Marex Group, Inc., par value $1 per share, 10,000 shares authorized; 9,900 shares issued and outstanding |
9,900 | |||
| Common stock – FileBound Solutions, Inc. – par value $0.01 per share, 25,000 shares authorized; 9,900 shares issued and outstanding |
99 | |||
| Additional paid in capital |
9,901 | |||
| Retained earnings |
1,754,058 | |||
|
|
|
|||
| Total shareholders’ equity |
1,773,958 | |||
|
|
|
|||
| Total Liabilities and Shareholders’ Equity |
$ | 3,704,864 | ||
|
|
|
|||
See accompanying notes to financial statements.
F-79
Table of Contents
Marex Group, Inc. and FileBound Solutions, Inc.
Combined Statement of Income
Year Ended December 31, 2011
| 2011 | ||||
| Revenue |
$ | 8,095,463 | ||
| Operating Expenses: |
||||
| Advertising |
49,135 | |||
| Automobile expense |
26,648 | |||
| Bank charges |
12,458 | |||
| Client relations |
17,318 | |||
| Computer expense |
17,112 | |||
| Contract labor |
463,532 | |||
| Contributions |
2,610 | |||
| Data Center Services |
279,206 | |||
| Depreciation |
178,643 | |||
| Dues and subscriptions |
33,002 | |||
| Employee benefits |
142,026 | |||
| Insurance |
19,987 | |||
| Interest |
11,232 | |||
| Licensing |
8,175 | |||
| Life insurance |
9,429 | |||
| Meals and entertainment |
44,171 | |||
| Meetings and conferences |
17,800 | |||
| Office expense |
32,621 | |||
| Officers’ compensation |
856,423 | |||
| Outside services |
446,672 | |||
| Partner conference |
168,996 | |||
| Payroll taxes |
195,777 | |||
| Postage |
5,297 | |||
| Professional fees |
358,504 | |||
| Rents |
333,817 | |||
| Repairs and maintenance |
9,595 | |||
| Retirement plan contributions |
185,021 | |||
| Salaries |
2,194,846 | |||
| Supplies |
48,922 | |||
| Taxes |
47,616 | |||
| Telephone |
135,030 | |||
| Travel |
336,274 | |||
| Utilities |
27,104 | |||
|
|
|
|||
| Total Operating Expenses |
6,714,999 | |||
| Operating Income |
1,380,464 | |||
| Interest Income |
37,270 | |||
|
|
|
|||
| Net Income |
$ | 1,417,734 | ||
|
|
|
|||
See accompanying notes to financial statements.
F-80
Table of Contents
Marex Group, Inc. and FileBound Solutions, Inc.
Combined Statement of Changes in Shareholders’ Equity
Year Ended December 31, 2011
| Common Stock |
Additional Paid-in Capital |
Retained Earnings |
Total | |||||||||||||
| Balance, December 31, 2010 |
$ | 9,999 | $ | 9,901 | $ | 1,475,836 | $ | 1,495,736 | ||||||||
| Prior period adjustment |
— | — | (233,070 | ) | (233,070 | ) | ||||||||||
|
|
|
|
|
|
|
|
|
|||||||||
| Balance, December 31, 2010 |
9,999 | 9,901 | 1,242,766 | 1,262,666 | ||||||||||||
| Distributions |
— | — | (906,442 | ) | (906,442 | ) | ||||||||||
| Net Income |
— | — | 1,417,734 | 1,417,734 | ||||||||||||
|
|
|
|
|
|
|
|
|
|||||||||
| Balance, December 31, 2011 |
$ | 9,999 | $ | 9,901 | $ | 1,754,058 | $ | 1,773,958 | ||||||||
|
|
|
|
|
|
|
|
|
|||||||||
See accompanying notes to financial statements.
F-81
Table of Contents
Marex Group, Inc. and FileBound Solutions, Inc.
Combined Statement of Cash Flows
Year Ended December 31, 2011
| Cash Flows from Operating Activities: |
||||
| Net Income |
$ | 1,417,734 | ||
| Adjustments to Reconcile Net Income to Net Cash Provided by Operating Activities: |
||||
| Non-cash Transactions: |
||||
| Depreciation and Amortization |
178,643 | |||
| Accrued interest on promissory notes |
(6,194 | ) | ||
| Prior period adjustment |
(233,070 | ) | ||
| (Increase) Decrease in Operating Assets: |
||||
| Accounts receivable |
(807,128 | ) | ||
| Prepaid expenses |
(56,249 | ) | ||
| Short-term notes receivable |
182,193 | |||
| Increase (Decrease) in Operating Liabilities: |
||||
| Accounts payable |
648 | |||
| Deferred revenue |
172,574 | |||
| Accrued expenses |
(61,603 | ) | ||
|
|
|
|||
| Net Cash Provided by Operating Activities |
787,548 | |||
| Cash Flows From Investing Activities: |
||||
| Purchase equipment, signs and leasehold improvements |
(80,222 | ) | ||
|
|
|
|||
| Net Cash (Used) by Investing Activities |
(80,222 | ) | ||
| Cash Flows From Financing Activities: |
||||
| Repayment of debt on stock |
(250,000 | ) | ||
| Distributions |
(670,376 | ) | ||
| Advance on Line of Credit |
473,000 | |||
| Telephone Equipment Loan |
42,000 | |||
| Repayment of long-term debt |
(9,986 | ) | ||
|
|
|
|||
| Net Cash (Used by) Financing Activities |
(415,362 | ) | ||
|
|
|
|||
| Net Increase in Cash |
291,964 | |||
| Cash, December 31, 2010 |
186,524 | |||
|
|
|
|||
| Cash, December 31, 2011 |
$ | 478,488 | ||
|
|
|
|||
| Cash paid for interest and income taxes: |
||||
| Interest |
$ | 11,232 | ||
|
|
|
|||
| State income taxes |
$ | 8,202 | ||
|
|
|
|||
| Non-Cash Items: |
||||
| Decrease in Notes receivable – related party |
$ | 236,066 | ||
|
|
|
|||
See accompanying notes to financial statements.
F-82
Table of Contents
Marex Group, Inc. and FileBound Solutions, Inc.
Notes to Combined Financial Statements
Year Ended December 31, 2011
1. Summary of significant accounting policies
Marex Group, Inc. and FileBound Solutions, Inc. are both privately held corporations which are primarily engaged in the business of developing and marketing content management solutions under the brand name FileBound. These solutions allow organizations to manage, store and retrieve all their information assets.
A. Basis of accounting:
The Company prepares its financial statements on the accrual basis under generally accepted accounting principles in the United States of America.
B. Revenue Recognition:
Revenue from licensing of software is recognized upon shipment provided that persuasive evidence of an arrangement exists, payment terms are fixed and determinable, and collection of the related receivable is considered probable. Revenues from consulting, training, and other services are generally recognized as the services are performed.
When software licenses are bundled with related services, revenues are allocated to each element of the arrangement based on the relative fair values of the elements. The determination of fair value is based on information that is specific to the Company, commonly referred to as vendor-specific objective evidence (“VSOE”). Fair values for the Company’s products and services are based on prices charged when each element is sold separately. If an element has not been sold separately and VSOE of fair value is unavailable, fair value is determined by the Company’s management. If evidence of fair value for individual elements of the arrangement does not exist and if management cannot determine fair value, all revenue from the arrangement is deferred until such time that evidence of fair value exists or until all elements of the arrangement are delivered. If fair value does not exist for one or more of the delivered elements, revenue is recognized under the residual method of accounting. Under this method, the fair value of the undelivered elements is deferred and the remaining portion of the fee is recognized as revenue. Revenue is not deferred for undelivered elements that are deemed to be insignificant.
Generally, the arrangements for software licenses and/or the right to use multiple copies provide for nonrefundable fees. Revenues are recognized upon delivery of the first copy, provided all significant obligations have been met, persuasive evidence of an arrangement exists, fees are fixed and determinable, and collection is probable.
The Company provides an allowance for sales returns based upon estimated and known returns. Product returns are recorded as a reduction of net revenues and as a reduction of the accounts receivable balance.
C. Allowance for doubtful accounts:
Management charges income for doubtful accounts when they are considered uncollectible. The accounts receivable balance as of December 31, 2011 is thought to be substantially collectible. All accounts receivable are from business transactions spread across the geographic area of the United States and are subject to the normal concentration of credit risk associated with the overall economy and the industry in which the Company operates.
F-83
Table of Contents
Marex Group, Inc. and FileBound Solutions, Inc.
Notes to Combined Financial Statements (continued)
Year Ended December 31, 2011
D. Property and equipment:
Property and equipment are recorded at cost. Depreciation is provided on a straight line method over the estimated useful life of the assets.
| Leasehold improvements |
15 to 39 years | |||
| Equipment |
3 to 7 years | |||
| Vehicles |
5 years |
Depreciation expense for the year ended December 31, 2011 was $178,643.
E. Use of estimates:
The preparation of financial statements in conformity with U.S. generally accepted accounting principles requires management to make estimates and assumptions that affect certain reported amounts and disclosures. Accordingly, actual results could differ from those estimates.
F. Cash and cash equivalents:
For purposes of the statement of cash flows, the Company considers all highly liquid debt instruments with maturity at acquisition of three months or less to be cash equivalents.
G. Subsequent Events:
Management has evaluated subsequent events through March 28, 2012, the date which the financial statements were available for issue, except for Note 15, as to which the date is March 28, 2013.
2. Employee Advances:
Cash advances paid to employees are to be repaid from the employees’ future earnings, and are expected to be repaid fully within 12 months following the advances.
3. Notes payable:
| Union Bank – monthly payments of $1,250.54 including interest at the rate of 4.50% through March 2014; secured by certain equipment of the company. |
$ | 32,014 | ||
|
|
|
|||
| Total |
32,014 | |||
| Less current installments of notes payable |
(13,849 | ) | ||
|
|
|
|||
| Notes-payable, excluding current installments |
$ | 18,165 | ||
|
|
|
See Note 13 for additional notes payable.
F-84
Table of Contents
Marex Group, Inc. and FileBound Solutions, Inc.
Notes to Combined Financial Statements (continued)
Year Ended December 31, 2011
4. Income Taxes:
The Company has elected to be an S corporation under the Internal Revenue Code. In lieu of corporation income taxes, the shareholders of an S corporation are taxed on their proportionate share of the Company’s taxable income. Therefore, no provision or liability for income taxes has been included in these financial statements.
The Company files income tax returns in the U.S. federal jurisdiction, and various state jurisdictions. The Company is no longer subject to U.S. federal, or state and local, income tax examinations by tax authorities for years before 2007.
The Company follows the provisions of uncertain tax positions as addressed in FASB Accounting Standards Codification 740-10-65-1. The Company recognized no increase in the liability for unrecognized tax benefits. The Company has no tax position at December 31, 2011 for which the ultimate deductibility is highly certain but for which there is uncertainty about the timing of such deductibility. The Company recognizes interest accrued related to unrecognized tax benefits in interest expense and penalties in operating expenses. No such interest or penalties were recognized during the year presented. The Company had no accruals for interest and penalties at December 31, 2011.
5. Deferred Revenue:
The Company engages in annual maintenance subscription agreements and warranty services with its clients. The payments are considered deferred revenue when received and amortized over the 12 month subscription period for maintenance. Warranty services have a one- or three-year amortization period.
6. Leasing Arrangements – Related Party:
The Company conducts its operations from a 22,950 square foot facility that is leased under a five-year operating lease expiring in January 2016. In May 2007, the Company’s facility was purchased by a related party, a partnership owned equally by the controlling shareholders of the Company. On January 1, 2011 a new five-year lease was executed. The annual lease rate for 2011 was $10 per square foot, or $19,125 monthly. For years 2-3, the annual lease will increase $1 per square foot each year and $0.50 for years 4-5. Rent expense for 2011 was $231,412.
The following is a schedule of future obligations under the above operating lease as of December 31, 2011:
| Year ending December 31, |
Amount | |||
| 2012 |
$ | 252,444 | ||
| 2013 |
275,400 | |||
| 2014 |
274,875 | |||
| 2015 |
298,350 | |||
|
|
|
|||
| $ | 1,101,069 | |||
|
|
|
|||
7. Employee Benefits:
For the year ended December 31, 2011, the Company paid the entire cost of employee health insurance coverage and one-half of the cost of family coverage. The Company also pays for deductible expenses. For employee only coverage, the deductible is $4,000 and the Company covers costs above $2,000. For family coverage, the deductible is $8,000 and the Company covers costs above $4,000. This expense for premiums and additional expenses was $127,463 for 2011.
F-85
Table of Contents
Marex Group, Inc. and FileBound Solutions, Inc.
Notes to Combined Financial Statements (continued)
Year Ended December 31, 2011
8. Profit Sharing Plan:
The Company adopted a Standardized 401(k) Profit Sharing Plan, effective February 10, 2005. At the beginning of this year the plan was amended to a Safe Harbor Plan in which the Company is obligated to contribute 3% of each eligible employee’s compensation. Employees are eligible to participate in the plan after 90 days of employment. Employees can defer a portion of their salary in an amount not to exceed the maximum amount allowable under the Internal Revenue Code. There is no prior service obligation. Total plan expenses for the year ended 2011 was $185,021. The Company also provided a discretionary profit sharing contribution that is established by management at year-end. This discretionary amount is allocated amongst employees based on level of compensation and their employment classification. Included in the plan expenses for the year ended December 31, 2011 is a profit sharing contribution of $89,238.
9. Operating Lease:
The Company has equipment that is leased under a five-year non-cancelable operating lease expiring in 2014. The Company has vehicles that are leased under a three-year and four-year non-cancelable operating lease expiring in 2013 and 2015. The Company leases office space in Colorado and Florida. The lease in Florida is a month to month lease. The Colorado lease is a thirty-eight month lease expiring in 2014.
Future minimum rental payments due under the leases are as follows:
| Year Ending December 31, |
Equipment | Vehicles | Office | Total | ||||||||||||
| 2012 |
$ | 5,137 | $ | 19,971 | $ | 18,543 | $ | 43,651 | ||||||||
| 2013 |
5,137 | 19,971 | 19,259 | 44,367 | ||||||||||||
| 2014 |
1,712 | 9,378 | 1,610 | 12,700 | ||||||||||||
| 2015 |
— | 7,815 | — | 7,815 | ||||||||||||
|
|
|
|
|
|
|
|
|
|||||||||
| $ | 11,986 | $ | 57,135 | $ | 39,412 | $ | 108,533 | |||||||||
|
|
|
|
|
|
|
|
|
|||||||||
10. Line of credit:
The Company has a line of credit for $700,000 as of December 31, 2011. The note is collateralized by business assets and personally guaranteed by the majority shareholders. The line of credit bears interest at .5%, over the national prime rate, but not below 4.5%. The prime rate was 3.25% at December 31, 2011. Total borrowings under this line of credit at December 31, 2011, was $473,000.
11. Concentration of Credit Risk:
The Company maintains its primary cash balances in one financial institution. The Federal Deposit Insurance Corporation (FDIC) insures balances up to $250,000 for each account. At times the cash balance of the Company’s accounts may exceed this limit.
12. Capitalized Software Development Costs:
Software development costs are expensed as incurred until technological feasibility of the product is established. Development costs incurred subsequent to technological feasibility are capitalized and amortized on a straight-line basis over the estimated economic life of the product not to exceed three years. Amortization begins when the product is ready for release to customers. Amortization of software development costs for the year ended December 31, 2011 is $144. Net book value of the development costs is $867.
F-86
Table of Contents
Marex Group, Inc. and FileBound Solutions, Inc.
Notes to Combined Financial Statements (continued)
Year Ended December 31, 2011
13. Stock Transactions:
On December 30, 2009, one of the shareholders entered into a Stock Repurchase/Separation Agreement with the Company for the repurchase of all of his outstanding shares. Five hundred shares were repurchased on December 30, 2009 as part of a stock redemption agreement for $210,702. Common Stock was reduced by $500 and Retained Earnings was decreased by $210,202. The remaining 500 shares were repurchased on January 25, 2011 as part of a separation agreement for $421,404. Common Stock was reduced by $500 and Retained Earnings was reduced by $420,904. Payments made against the note were $250,000 in 2011. The repayment terms on the note to repurchase the stock are as follows:
| Year Ending December 31, |
Amount | |||
| 2012 |
71,404 | |||
|
|
|
|||
| $ | 71,404 | |||
|
|
|
|||
On January 26, 2010, the Company entered into two stock subscription agreements with employees of the Company. Each employee purchased 300 shares of stock in return for a promissory note of $126,427 each. Interest shall accrue on the promissory notes at a rate of 2.45% per year with no payment due. If the notes are not paid in full by February 26, 2014, principal and accrued interest to date will be paid in 120 equal consecutive monthly installments.
14. Contingencies
The Company is involved in various claims and legal actions arising in the ordinary course of business. In the opinion of management, the ultimate disposition of these matters will not have a material adverse effect on the Company’s financial position, results of operations, or liquidity.
15. Prior period adjustment:
Retained earnings at the beginning of 2011 have been adjusted for a maintenance and licensing revenue recognition policy as stated in Note 1B. A portion of the licensing and implementation revenue has been adjusted for the deferred portion. The change in the deferred accounts created a prior period retained earnings adjustment of $233,070.
F-87
Table of Contents
Marex Group, Inc. and FileBound Solutions, Inc.
Combining Schedule – Balance Sheet Information
December 31, 2011
| Marex Group, Inc. | FileBound Solutions, Inc. |
Total | Eliminating Entries |
Combined Totals |
||||||||||||||||
| Assets |
||||||||||||||||||||
| Current Assets: |
||||||||||||||||||||
| Cash |
$ | (30,992 | ) | $ | 509,480 | $ | 478,488 | $ | — | $ | 478,488 | |||||||||
| Accounts receivable |
1,540,805 | 557,897 | 2,098,702 | (18,112 | ) | 2,080,590 | ||||||||||||||
| Prepaid expenses |
50,744 | 30,531 | 81,275 | — | 81,275 | |||||||||||||||
| Employee advances |
5,000 | — | 5,000 | — | 5,000 | |||||||||||||||
| Escrow – customer contract |
15,920 | — | 15,920 | — | 15,920 | |||||||||||||||
|
|
|
|
|
|
|
|
|
|
|
|||||||||||
| Total current assets |
1,581,477 | 1,097,908 | 2,679,385 | (18,112 | ) | 2,661,273 | ||||||||||||||
| Property and Equipment – at cost: |
||||||||||||||||||||
| Leasehold improvements |
538,781 | — | 538,781 | — | 538,781 | |||||||||||||||
| Equipment |
930,982 | 131,390 | 1,062,372 | 38,823 | 1,101,195 | |||||||||||||||
| Vehicles |
88,858 | — | 88,858 | — | 88,858 | |||||||||||||||
|
|
|
|
|
|
|
|
|
|
|
|||||||||||
| 1,558,621 | 131,390 | 1,690,011 | 38,823 | 1,728,834 | ||||||||||||||||
| Less accumulated depreciation |
(938,212 | ) | (25,942 | ) | (964,154 | ) | — | (964,154 | ) | |||||||||||
|
|
|
|
|
|
|
|
|
|
|
|||||||||||
| Property and equipment – net |
620,409 | 105,448 | 725,857 | 38,823 | 764,680 | |||||||||||||||
| Other Assets: |
||||||||||||||||||||
| Due from Shareholders |
372,417 | 642,910 | 1,015,326 | (736,415 | ) | 278,911 | ||||||||||||||
|
|
|
|
|
|
|
|
|
|
|
|||||||||||
| Total Assets |
$ | 2,574,302 | $ | 1,846,266 | $ | 4,420,568 | $ | (715,704 | ) | $ | 3,704,864 | |||||||||
|
|
|
|
|
|
|
|
|
|
|
|||||||||||
| Liabilities and Shareholders’ Equity |
||||||||||||||||||||
| Current Liabilities: |
||||||||||||||||||||
| Accounts payable |
$ | 64,876 | $ | 18,111 | $ | 82,987 | $ | (18,112 | ) | $ | 64,875 | |||||||||
| Accrued liabilities |
2,317 | 299 | 2,616 | — | 2,616 | |||||||||||||||
| Accrued 401k liabilities |
119,542 | 702 | 120,244 | — | 120,244 | |||||||||||||||
| Line of credit |
1,115,910 | — | 1,115,910 | (642,910 | ) | 473,000 | ||||||||||||||
| Current portion of long-term debt |
85,253 | — | 85,253 | — | 85,253 | |||||||||||||||
| Deferred revenue |
318,399 | 848,354 | 1,166,753 | — | 1,166,753 | |||||||||||||||
|
|
|
|
|
|
|
|
|
|
|
|||||||||||
| Total current liabilities |
1,706,297 | 867,466 | 2,573,763 | (661,022 | ) | 1,912,741 | ||||||||||||||
| Long-term Liabilities: |
||||||||||||||||||||
| Note payable |
103,418 | 93,505 | 196,923 | (93,505 | ) | 103,418 | ||||||||||||||
| Less current portion |
(85,253 | ) | — | (85,253 | ) | — | (85,253 | ) | ||||||||||||
|
|
|
|
|
|
|
|
|
|
|
|||||||||||
| Total long-term liabilities |
18,165 | 93,505 | 111,670 | (93,505 | ) | 18,165 | ||||||||||||||
|
|
|
|
|
|
|
|
|
|
|
|||||||||||
| Total Liabilities |
1,724,462 | 960,971 | 2,685,433 | (754,527 | ) | 1,930,906 | ||||||||||||||
|
|
|
|
|
|
|
|
|
|
|
|||||||||||
| Shareholders’ Equity: |
||||||||||||||||||||
| Common stock – Marex Group, Inc. |
9,900 | — | 9,900 | — | 9,900 | |||||||||||||||
| Common stock – FileBound Solutions, Inc. |
— | 99 | 99 | — | 99 | |||||||||||||||
| Additional paid in capital |
— | 9,901 | 9,901 | — | 9,901 | |||||||||||||||
| Retained earnings |
839,940 | 875,295 | 1,715,235 | 38,823 | 1,754,058 | |||||||||||||||
|
|
|
|
|
|
|
|
|
|
|
|||||||||||
| Total shareholders’ equity |
849,840 | 885,295 | 1,735,135 | 38,823 | 1,773,958 | |||||||||||||||
|
|
|
|
|
|
|
|
|
|
|
|||||||||||
| Total Liabilities and Shareholders’ Equity |
$ | 2,574,302 | $ | 1,846,266 | $ | 4,420,568 | $ | (715,704 | ) | $ | 3,704,864 | |||||||||
|
|
|
|
|
|
|
|
|
|
|
|||||||||||
Amounts may not foot due to rounding.
See accompanying independent auditors’ report.
F-88
Table of Contents
Marex Group, Inc. and FileBound Solutions, Inc.
Combining Schedule – Statement of Operations Information
December 31, 2011
| Marex Group, Inc. |
FileBound Solutions, Inc. |
Total | Eliminating entries |
Combined Totals |
||||||||||||||||
| Revenue |
$ | 4,341,925 | $ | 3,753,538 | $ | 8,095,463 | $ | — | $ | 8,095,463 | ||||||||||
| Operating Expenses: |
||||||||||||||||||||
| Advertising expense |
49,135 | — | 49,135 | — | 49,135 | |||||||||||||||
| Automobile expense |
26,571 | 77 | 26,648 | — | 26,648 | |||||||||||||||
| Bank charges |
9,344 | 3,114 | 12,458 | — | 12,458 | |||||||||||||||
| Client relations |
17,318 | — | 17,318 | — | 17,318 | |||||||||||||||
| Computer expense |
17,112 | — | 17,112 | — | 17,112 | |||||||||||||||
| Contract labor |
415,698 | 47,834 | 463,532 | — | 463,532 | |||||||||||||||
| Contributions |
2,610 | — | 2,610 | — | 2,610 | |||||||||||||||
| Data Center Services |
240,434 | 38,772 | 279,206 | — | 279,206 | |||||||||||||||
| Depreciation Expense |
152,701 | 25,942 | 178,643 | — | 178,643 | |||||||||||||||
| Dues and subscriptions |
33,002 | — | 33,002 | — | 33,002 | |||||||||||||||
| Employee benefits |
142,026 | — | 142,026 | — | 142,026 | |||||||||||||||
| Insurance |
19,987 | — | 19,987 | — | 19,987 | |||||||||||||||
| Interest |
16,503 | 2,864 | 19,367 | (8,135 | ) | 11,232 | ||||||||||||||
| Licensing |
8,175 | — | 8,175 | — | 8,175 | |||||||||||||||
| Life Insurance |
9,429 | — | 9,429 | — | 9,429 | |||||||||||||||
| Meals and entertainment |
44,065 | 106 | 44,171 | — | 44,171 | |||||||||||||||
| Meetings and conferences |
17,800 | — | 17,800 | — | 17,800 | |||||||||||||||
| Office expense |
(2,045,026 | ) | 2,077,647 | 32,621 | — | 32,621 | ||||||||||||||
| Officer compensation |
856,423 | — | 856,423 | — | 856,423 | |||||||||||||||
| Outside services |
184,288 | 262,384 | 446,672 | — | 446,672 | |||||||||||||||
| Partner conference |
168,996 | — | 168,996 | — | 168,996 | |||||||||||||||
| Payroll taxes |
193,601 | 2,176 | 195,777 | — | 195,777 | |||||||||||||||
| Postage |
5,297 | — | 5,297 | — | 5,297 | |||||||||||||||
| Professional fees |
347,447 | 11,057 | 358,504 | — | 358,504 | |||||||||||||||
| Rents |
317,264 | 16,553 | 333,817 | — | 333,817 | |||||||||||||||
| Repairs and maintenance |
9,595 | — | 9,595 | — | 9,595 | |||||||||||||||
| Retirement plan contributions |
184,320 | 701 | 185,021 | — | 185,021 | |||||||||||||||
| Salaries |
2,163,138 | 31,708 | 2,194,846 | — | 2,194,846 | |||||||||||||||
| Supplies |
48,922 | — | 48,922 | — | 48,922 | |||||||||||||||
| Taxes |
46,736 | 880 | 47,616 | — | 47,616 | |||||||||||||||
| Telephone |
135,030 | — | 135,030 | — | 135,030 | |||||||||||||||
| Travel |
334,190 | 2,084 | 336,274 | — | 336,274 | |||||||||||||||
| Utilities |
27,104 | — | 27,104 | — | 27,104 | |||||||||||||||
|
|
|
|
|
|
|
|
|
|
|
|||||||||||
| 4,199,237 | 2,523,897 | 6,723,134 | (8,135 | ) | 6,714,999 | |||||||||||||||
|
|
|
|
|
|
|
|
|
|
|
|||||||||||
| Operating Income |
142,688 | 1,229,641 | 1,372,329 | 8,135 | 1,380,464 | |||||||||||||||
| Interest Income |
(11,942 | ) | 18,524 | 6,582 | 30,688 | 37,270 | ||||||||||||||
|
|
|
|
|
|
|
|
|
|
|
|||||||||||
| Net Income |
$ | 130,746 | $ | 1,248,165 | $ | 1,378,911 | $ | 38,823 | $ | 1,417,734 | ||||||||||
|
|
|
|
|
|
|
|
|
|
|
|||||||||||
Amounts may not foot due to rounding.
See accompanying independent auditors’ report.
F-89
Table of Contents

Report of Independent Auditors
To the Members of
ComSci, LLC
We have audited the accompanying financial statements of ComSci, LLC (the “Company”), which comprise the balance sheets as of October 31, 2013 and December 31, 2012, and the related statements of operations, changes in members’ equity, and cash flows for the ten-month period ended October 31, 2013 and the year ended December 31, 2012, and the related notes to the financial statements.
Management’s Responsibility for the Financial Statements
Management is responsible for the preparation and fair presentation of these financial statements in accordance with accounting principles generally accepted in the United States of America; this includes the design, implementation, and maintenance of internal control relevant to the preparation and fair presentation of financial statements that are free from material misstatement, whether due to fraud or error.
Auditor’s Responsibility
Our responsibility is to express an opinion on these financial statements based on our audits. We conducted our audits in accordance with auditing standards generally accepted in the United States of America. Those standards require that we plan and perform the audit to obtain reasonable assurance about whether the financial statements are free from material misstatement.
An audit involves performing procedures to obtain audit evidence about the amounts and disclosures in the financial statements. The procedures selected depend on the auditor’s judgment, including the assessment of the risks of material misstatement of the financial statements, whether due to fraud or error. In making those risk assessments, the auditor considers internal control relevant to the entity’s preparation and fair presentation of the financial statements in order to design audit procedures that are appropriate in the circumstances, but not for the purpose of expressing an opinion on the effectiveness of the entity’s internal control. Accordingly, we express no such opinion. An audit also includes evaluating the appropriateness of accounting policies used and the reasonableness of significant accounting estimates made by management, as well as evaluating the overall presentation of the financial statements.
We believe that the audit evidence we have obtained is sufficient and appropriate to provide a basis for our audit opinion.
Opinion
In our opinion, the financial statements referred to above present fairly, in all material respects, the financial position of ComSci, LLC, as of October 31, 2013 and December 31, 2012, and the results of its operations and its cash flows for the ten-month period ended October 31, 2013 and the year ended December 31, 2012, in accordance with accounting principles generally accepted in the United States of America.

February 28, 2014
| Holtzman Partners, LLP | 1710 West Sixth Street | Austin, Texas 78703 | Phone 512.610.7200 | fax 512.610.7201 | www.holtzmanpartners.com |
F-90
Table of Contents
Balance Sheets
| October 31, 2013 |
December 31, 2012 |
|||||||
| Assets |
||||||||
| Current assets: |
||||||||
| Cash |
$ | 562,020 | $ | 943,962 | ||||
| Investments |
— | 249,455 | ||||||
| Accounts receivable, net |
950,859 | 1,086,275 | ||||||
| Prepaid expenses and other |
47,396 | 78,595 | ||||||
|
|
|
|
|
|||||
| Total current assets |
1,560,275 | 2,358,287 | ||||||
| Property and equipment, net |
60,803 | 95,803 | ||||||
| Other |
7,631 | 7,631 | ||||||
|
|
|
|
|
|||||
| Total assets |
$ | 1,628,709 | $ | 2,461,721 | ||||
|
|
|
|
|
|||||
| Liabilities and members’ equity |
||||||||
| Current liabilities: |
||||||||
| Accounts payable |
$ | 260,447 | $ | 118,230 | ||||
| Accrued liabilities |
44,850 | 24,646 | ||||||
| Current portion of capital lease obligations |
32,131 | 30,441 | ||||||
| Deferred revenue |
78,016 | 24,000 | ||||||
|
|
|
|
|
|||||
| Total current liabilities |
415,444 | 197,317 | ||||||
| Capital lease obligations, less current portion |
28,737 | 55,657 | ||||||
|
|
|
|
|
|||||
| Total liabilities |
444,181 | 252,974 | ||||||
| Members’ equity |
1,184,528 | 2,208,747 | ||||||
|
|
|
|
|
|||||
| Total liabilities and members’ equity |
$ | 1,628,709 | $ | 2,461,721 | ||||
|
|
|
|
|
|||||
See accompanying notes.
F-91
Table of Contents
Statements of Operations
| Ten-month period ended October 31, 2013 |
Year ended December 31, 2012 |
|||||||
| Revenues |
$ | 4,543,526 | $ | 5,325,557 | ||||
| Cost of revenues |
1,267,160 | 1,389,953 | ||||||
|
|
|
|
|
|||||
| Gross profit |
3,276,366 | 3,935,604 | ||||||
| Operating expense: |
||||||||
| Sales and marketing |
1,654,738 | 1,792,780 | ||||||
| Research and development |
379,253 | 442,322 | ||||||
| General and administrative |
1,378,870 | 922,865 | ||||||
|
|
|
|
|
|||||
| Total operating expenses |
3,412,861 | 3,157,967 | ||||||
| Income (loss) from operations |
(136,495 | ) | 777,637 | |||||
| Other income (expense): |
||||||||
| Interest and dividend income |
12,146 | 18,204 | ||||||
| Unrealized gain (loss) on investments |
— | 29,665 | ||||||
| Realized gain (loss) on investments |
(5,662 | ) | — | |||||
| Interest expense |
(4,089 | ) | (6,652 | ) | ||||
|
|
|
|
|
|||||
| Total other income (expense) |
2,395 | 41,217 | ||||||
|
|
|
|
|
|||||
| Net income (loss) |
$ | (134,100 | ) | $ | 818,854 | |||
|
|
|
|
|
|||||
See accompanying notes.
F-92
Table of Contents
Statements of Changes in Members’ Equity
| Owner Investment |
Partner Distributions |
Retained Earnings |
Total Members’ Equity |
|||||||||||||
| Balance at December 31, 2011 |
$ | 1,000,000 | $ | (2,403,232 | ) | $ | 3,564,781 | $ | 2,161,549 | |||||||
| Distributions |
— | (771,656 | ) | — | (771,656 | ) | ||||||||||
| Net income |
— | — | 818,854 | 818,854 | ||||||||||||
|
|
|
|
|
|
|
|
|
|||||||||
| Balance at December 31, 2012 |
$ | 1,000,000 | $ | (3,174,888 | ) | $ | 4,383,635 | $ | 2,208,747 | |||||||
| Distributions |
— | (890,119 | ) | — | (890,119 | ) | ||||||||||
| Net loss |
— | — | (134,100 | ) | (134,100 | ) | ||||||||||
|
|
|
|
|
|
|
|
|
|||||||||
| Balance at October 31, 2013 |
$ | 1,000,000 | $ | (4,065,007 | ) | $ | 4,249,535 | $ | 1,184,528 | |||||||
|
|
|
|
|
|
|
|
|
|||||||||
See accompanying notes.
F-93
Table of Contents
Statements of Cash Flows
| Ten-month period ended October 31, 2013 |
Year ended December 31, 2012 |
|||||||
| Cash flows from operating activities: |
||||||||
| Net income (loss) |
$ | (134,100 | ) | $ | 818,854 | |||
| Adjustments to reconcile net income (loss) to net cash provided by operating activities: |
||||||||
| Depreciation and amortization |
35,000 | 43,519 | ||||||
| Net realized/unrealized gain (loss) on investments |
5,662 | (27,392 | ) | |||||
| Change in operating assets and liabilities: |
||||||||
| Accounts receivable |
135,416 | (24,567 | ) | |||||
| Prepaid expenses and other |
31,199 | (57,211 | ) | |||||
| Accounts payable and accrued liabilities |
162,421 | 24,100 | ||||||
| Deferred revenue |
54,016 | 6,500 | ||||||
|
|
|
|
|
|||||
| Net cash provided by operating activities |
289,614 | 783,803 | ||||||
|
|
|
|
|
|||||
| Cash flows from investing activities: |
||||||||
| Purchase of investments |
(738 | ) | (1,919 | ) | ||||
| Redemption of investments |
244,531 | 140,000 | ||||||
|
|
|
|
|
|||||
| Net cash provided by investing activities |
243,793 | 138,081 | ||||||
|
|
|
|
|
|||||
| Cash flows from financing activities: |
||||||||
| Distributions paid to members |
(890,119 | ) | (771,656 | ) | ||||
| Payments on capital leases |
(25,230 | ) | (28,531 | ) | ||||
|
|
|
|
|
|||||
| Net cash used in financing activities |
(915,349 | ) | (800,187 | ) | ||||
|
|
|
|
|
|||||
| Net change in cash and cash equivalents |
(381,942 | ) | 121,697 | |||||
| Cash and cash equivalents at beginning of year |
943,962 | 822,265 | ||||||
|
|
|
|
|
|||||
| Cash and cash equivalents at end of period/year |
$ | 562,020 | $ | 943,962 | ||||
|
|
|
|
|
|||||
| Supplemental disclosure of cash flow information |
||||||||
| Cash paid for taxes |
$ | 2,996 | $ | 3,498 | ||||
|
|
|
|
|
|||||
See accompanying notes.
F-94
Table of Contents
Notes to Financial Statements
For the ten-month period ended October 31, 2013 and
the year ended December 31, 2012
1. Nature of Operations
ComSci, LLC (the “Company”) was formed as a New Jersey limited liability company on July 29, 2005, and is headquartered in Iselin, New Jersey. The Company provides SaaS-based IT Financial and Business Management software and solutions that enable IT and shared services organizations to more effectively articulate the value of the services delivered to the business. The Company’s solution drives efficiencies, assists in reducing cost and promotes innovation across the enterprise.
2. Summary of Significant Accounting Policies
Basis of Accounting
The accompanying financial statements have been prepared on the accrual basis of accounting in accordance with accounting principles generally accepted in the United States (“GAAP”).
Use of Estimates
The preparation of financial statements in conformity with accounting principles generally accepted in the United States requires management to make estimates and assumptions that affect the amounts reported in the financial statements and accompanying notes. Actual results could differ from those estimates.
Cash and Cash Equivalents
Cash and cash equivalents consist of cash deposits and short-term investments with original maturities of three months or less when purchased and are stated at cost.
Accounts Receivable
Accounts receivable are recorded at estimated realizable value. The Company continuously assesses the collectability of outstanding customer invoices; and in doing such, the Company maintains an allowance for estimated losses resulting from the noncollection of customer receivables. In estimating this allowance, the Company considers factors such as: historical collection experience, a customer’s current credit-worthiness, customer concentrations, and general economic conditions that may affect a customer’s ability to pay. Actual customer collections could differ from the Company’s estimates. The Company estimated approximately $5,800 in uncollectible customer receivables as of October 31, 2013 and December 31, 2012.
Concentration of Credit Risk
Financial instruments that potentially subject the Company to concentrations of credit risk consist of cash and cash equivalents and trade receivables. The Company’s cash is placed with high-credit-quality financial institutions, which at times may exceed federally insured limits. The Company has not experienced any loss relating to cash in these accounts. The Company performs periodic credit evaluations of its customers’ financial condition and generally does not require collateral.
F-95
Table of Contents
ComSci, LLC
Notes to Financial Statements (continued)
Customers representing 10% or more of the Company’s total accounts receivable and revenues are as follows as of and for the ten-month period ended October 31, 2013:
| Accounts Receivable |
Revenues | |||||||
| Customer A |
20 | % | 28 | % | ||||
| Customer B |
15 | % | 12 | % | ||||
Property and Equipment
Depreciation of equipment used for corporate operations is computed using the straight-line method over estimated useful lives ranging from three to five years. Leasehold improvements are amortized using the straight-line method over the shorter of the estimated useful life or the lease term. Maintenance and repairs are charged to expense as incurred and major renewals and betterments are capitalized.
Income Taxes
The Company has elected to be treated as a limited liability company for Federal and New Jersey tax purposes. Under these provisions, any tax due is included on the members’ individual tax returns and the Company makes no provision for Federal or New Jersey income tax.
Advertising
The Company expenses advertising costs as incurred. Advertising costs totaled approximately $359,000 and $392,000 for the ten-month period ended October 31, 2013 and the year ended December 31, 2012, respectively.
Research and Development
Research and development costs are expensed to operations as incurred. Financial Accounting Standards Board (“FASB”) authoritative guidance on accounting for the costs of computer software developed or obtained for internal use requires capitalization of certain costs incurred during the software application development stage and amortizes them over the software’s estimated useful life. Based on the Company’s product development process, costs incurred during the software application development stage where recoverability was reasonably assured have been insignificant. Through October 31, 2013 all software development costs have been expensed as incurred.
Long-Lived Assets
The Company periodically reviews the carrying amounts of its long-lived assets to determine whether current events or circumstances warrant adjustment to such carrying amounts. In reviewing the carrying amounts of long-lived assets, the Company considers, among other factors, the future cash inflows expected to result from the use of the asset and its eventual disposition less the future cash outflows expected to be necessary to obtain those inflows.
Upon a determination that the carrying value of assets will not be recovered from the undiscounted cash flow estimated to be generated by those assets, the carrying value of such assets would be considered impaired and reduced by a charge to operations in the amount of the impairment. No indicators of impairment were identified during the ten-month period ended October 31, 2013 and the year ended December 31, 2012.
F-96
Table of Contents
ComSci, LLC
Notes to Financial Statements (continued)
Investments at Fair Value
Investment sales and purchases are recorded on a trade-date basis, which results in both investment receivables and payables on unsettled investment trades. Dividend income is recorded based upon the ex-dividend date, and interest income is recorded as earned on an accrual basis.
Fair Value of Financial Instruments
Financial Accounting Standards Board (“FASB”) authoritative guidance on fair value measurements for financial assets and liabilities defines fair value, establishes a framework for measuring fair value in accordance with generally accepted accounting principles and expands disclosures about fair value measurements. The guidance establishes a three-tier fair value hierarchy, which prioritizes the inputs used in measuring fair value. These tiers include: Level 1, defined as observable inputs such as quoted prices in active markets; Level 2, defined as inputs other than quoted prices in active markets that are either directly or indirectly observable; and Level 3, defined as unobservable inputs in which little or no market data exists, therefore requiring an entity to develop its own assumptions. See Note 5 for a summary of the inputs used as of October 31, 2013 and December 31, 2012, in determining the fair value of the Company’s investments.
The Company’s carrying amounts of its financial instruments, including cash and cash equivalents, short-term investments, accounts receivable, accounts payable, and accrued liabilities approximate their respective fair values due to their short maturities.
Investments are classified as short-term based on stated maturities of less than one year from the balance sheet date.
Revenue Recognition
The Company’s revenues are primarily derived from the sale of IT financial governance cost management solutions. The Company sells these services primarily as a hosted monthly or annual service, and in limited circumstances as a term license, and revenue is recognized monthly as the services are delivered based on the contractual fee, provided that no significant Company obligations remain, fees are fixed and determinable, and collection of the related receivable is probable.
For hosting arrangements that contain multiple elements, such as product and/or services, the Company allocates revenue to each element based on a selling price hierarchy. The selling price for a deliverable is based on its vendor specific objective evidence (“VSOE”) if available, third-party evidence (“TPE”) if VSOE is not available, or estimated selling price (“ESP”) if neither VSOE nor TPE is available. The objective of ESP is to determine the price at which the Company would transact a sale if the product or service were sold on a stand-alone basis.
The Company also derives revenue from services sold as discrete, non-recurring events. For these services, the Company recognizes revenue when persuasive evidence of an arrangement exists, the fee is fixed or determinable, the event has occurred and collection is reasonably assured. Revenues from these services approximated $235,000 and $450,000 for the ten-month period ended October 31, 2013 and the year ended December 31, 2012, respectively.
Deferred Revenue
Deferred revenue consists of billings or payments received in advance of revenue recognition from the Company’s service described above and is recognized as the revenue criteria are met.
F-97
Table of Contents
ComSci, LLC
Notes to Financial Statements (continued)
Cost of Revenues
Cost of revenues primarily consists of labor costs and indirect costs related to contract performance and expenses related to network infrastructure.
Subsequent Events
The Company evaluated events occurring between the end of the most recent fiscal year and February 28, 2014, the date the financial statements were available to be issued.
3. Property and Equipment
Property and equipment consists of the following:
| October 31, 2013 |
December 31, 2012 |
|||||||
| Furniture and Fixtures |
$ | 167,898 | $ | 167,898 | ||||
| Computer Equipment |
258,154 | 258,154 | ||||||
| Computer Software |
36,393 | 36,393 | ||||||
|
|
|
|
|
|||||
| 462,445 | 462,445 | |||||||
| Less: accumulated depreciation |
(401,642 | ) | (366,642 | ) | ||||
|
|
|
|
|
|||||
| $ | 60,803 | $ | 95,803 | |||||
|
|
|
|
|
|||||
Depreciation of property and equipment for the ten-month period ended October 31, 2013 and the year ended December 31, 2012 was $35,000 and $43,519, respectively.
4. Capital Lease Obligations
The Company leases equipment under capital leases. The arrangements require monthly payments of $3,063, including interest. Future minimum lease payments are as follows:
| Period/Year Ending December 31, |
||||
| 2013 |
$ | 6,126 | ||
| 2014 |
36,756 | |||
| 2015 |
20,954 | |||
| 2016 |
3,849 | |||
|
|
|
|||
| Total minimum lease payments |
67,685 | |||
| Less – Amount representing interest |
(6,817 | ) | ||
|
|
|
|||
| Present value of minimum lease payments |
60,868 | |||
|
|
|
|||
5. Investments at Fair Value
At December 31, 2012, the Company’s investments consist of the following:
| 2012 | ||||
| Mutual funds |
$ | 28,431 | ||
| Preferred securities |
221,024 | |||
|
|
|
|||
| Total investments at fair value |
$ | 249,455 | ||
|
|
|
|||
F-98
Table of Contents
ComSci, LLC
Notes to Financial Statements (continued)
The following is a summary of the inputs used as of December 31, 2012 in valuing the Company’s investments carried at fair value:
| Quoted prices in active markets for identical assets (Level 1) |
Significant other observable inputs (Level 2) |
Significant unobservable inputs (Level 3) |
Total | |||||||||||||
| Mutual funds |
$ | 28,431 | $ | — | $ | — | $ | 28,431 | ||||||||
| Preferred securities |
221,024 | — | — | 221,024 | ||||||||||||
|
|
|
|
|
|
|
|
|
|||||||||
| Totals |
$ | 249,455 | $ | — | $ | — | $ | 249,455 | ||||||||
|
|
|
|
|
|
|
|
|
|||||||||
6. Commitments and Contingencies
Operating Leases
The Company leases an office facility in Iselin, New Jersey under a non-cancelable, operating lease expiring in January 2020. Rent and occupancy expenses under this lease totaled $77,917 and $93,501 for the ten-month period ended October 31, 2013 and the year ended December 31, 2012, respectively.
Future minimum lease payments required under operating leases as of October 31, 2013 are as follows:
| 2013 |
$ | 15,261 | ||
| 2014 |
91,569 | |||
| 2015 |
95,258 | |||
| 2016 |
95,594 | |||
| 2017 |
95,594 | |||
| Thereafter |
199,154 | |||
|
|
|
|||
| Total minimum lease payments |
$ | 592,430 | ||
|
|
|
Contingencies
Certain contingent liabilities could arise during the ordinary course of providing services to customers. These contingencies are generally the result of contracts that require compliance with certain level-of-effort or performance measurements and the delivery of certain services by a specified deadline. Based on historical experience, the Company believes that the ultimate liability, if any, incurred under these contract provisions will not have a material adverse effect on the financial condition, results of operations, or cash flows of the Company. No allowance for contingencies has been recorded at October 31, 2013 or December 31, 2012.
7. Defined Contribution Plan
The Company sponsors a defined contribution plan (the “Plan”) in accordance with Section 401(k) of the Internal Revenue Code. The Plan is available to all regular employees of the Company. The Company’s contribution to the Plan is discretionary. The Company did not make any contributions to the Plan in 2013 or 2012.
8. Subsequent Events
On November 5, 2013, the Company made distributions to members in the amount of $457,932.
Effective as of November 7, 2013, the Company entered into a definitive purchase agreement, pursuant to which Upland Software, Inc. purchased all membership interests of ComSci, LLC.
F-99
Table of Contents
UNAUDITED PRO FORMA CONDENSED CONSOLIDATED STATEMENTS OF
OPERATIONS FOR THE YEAR ENDED DECEMBER 31, 2013
(in thousands, except share and per share amounts)
Upland Software, Inc., or the Company, made three acquisitions during the year ended December 31, 2013. On May 16, 2013, the Company acquired 100% of the outstanding capital of FileBound Solutions, Inc. and Marex Group, Inc. (together, FileBound). On November 7, 2013, the Company acquired 100% of the outstanding interests of ComSci, LLC, or ComSci. On December 23, 2013, the Company acquired 100% of the outstanding capital of Clickability, Inc. For accounting purpose, the acquisition of Clickability was recorded on December 31, 2013 and, accordingly the operations of Clickability had no impact on the Company’s statement of operations for the year ended December 31, 2013. As a result, the acquisition of Clickability is not reflected in the unaudited pro forma condensed consolidated statement of operations set forth below.
For purposes of the unaudited pro forma condensed consolidated statement of operations set forth below, the Company assumed that the acquisitions of FileBound and ComSci occurred on January 1, 2013. As a result, the unaudited pro forma consolidated statement of operations data was derived from:
| • | the audited historical consolidated statement of operations for the Company for the year ended December 31, 2013; |
| • | the unaudited historical statement of operations data for FileBound for the period from January 1, 2013 to May 15, 2013; and |
| • | the audited historical statement of operations data for ComSci for the period from January 1, 2013 to November 6, 2013. |
The unaudited pro forma condensed consolidated statement of operations data set forth below is presented for illustrative purposes only and does not necessarily indicate the operating results that would have been achieved if the acquisitions of FileBound and ComSci had occurred at the beginning of the period presented, nor is it indicative of future operating results. The unaudited pro forma condensed consolidated statement of operations should be read in conjunction with the Company’s historical consolidated financial statement and accompanying notes included elsewhere in this prospectus.
F-100
Table of Contents
UPLAND SOFTWARE, INC.
UNAUDITED PRO FORMA CONDENSED CONSOLIDATED STATEMENTS OF
OPERATIONS FOR THE YEAR ENDED DECEMBER 31, 2013
(in thousands, except share and per share amounts)
| Upland Historical 2013 |
FileBound Jan-May 2013 (Pre- Acquisition Period) |
FileBound Pro Forma Adjustments |
ComSci Jan- Nov 2013 (Pre-Acq Period) |
ComSci Pro Forma Adjustments |
Upland 2013 Pro Forma As Adjusted |
|||||||||||||||||||
| Revenue: |
||||||||||||||||||||||||
| Subscription and support |
$ | 30,887 | $ | 2,288 | (283 | )(a) | $ | 4,530 | (5 | )(a) | $ | 37,417 | ||||||||||||
| Perpetual license |
2,003 | 1,329 | — | — | — | 3,332 | ||||||||||||||||||
|
|
|
|
|
|
|
|
|
|
|
|
|
|||||||||||||
| Total product revenue |
32,890 | 3,617 | (283 | ) | 4,530 | (5 | ) | 40,749 | ||||||||||||||||
|
|
|
|
|
|
|
|
|
|
|
|
|
|||||||||||||
| Professional services |
8,303 | 158 | — | 13 | — | 8,474 | ||||||||||||||||||
|
|
|
|
|
|
|
|
|
|
|
|
|
|||||||||||||
| Total revenue |
41,193 | 3,775 | (283 | ) | 4,543 | (5 | ) | 49,223 | ||||||||||||||||
|
|
|
|
|
|
|
|
|
|
|
|
|
|||||||||||||
| Cost of revenue: |
||||||||||||||||||||||||
| Subscription and support |
7,787 | 615 | 128 | (b) | 1,245 | 169 | (b) | 9,944 | ||||||||||||||||
| Professional services |
5,680 | 125 | — | 22 | — | 5,827 | ||||||||||||||||||
|
|
|
|
|
|
|
|
|
|
|
|
|
|||||||||||||
| Total cost of revenue |
13,467 | 740 | 128 | 1,267 | 169 | 15,771 | ||||||||||||||||||
|
|
|
|
|
|
|
|
|
|
|
|
|
|||||||||||||
| Gross profit |
27,726 | 3,035 | (411 | ) | 3,276 | (174 | ) | 33,452 | ||||||||||||||||
| Operating expenses: |
||||||||||||||||||||||||
| Sales and marketing |
10,625 | 1,169 | — | 1,654 | — | 13,448 | ||||||||||||||||||
| Research and development |
10,340 | 553 | — | 379 | — | 11,272 | ||||||||||||||||||
| Refundable Canadian tax credits |
(583 | ) | — | — | — | — | (583 | ) | ||||||||||||||||
| General and administrative |
6,832 | 1,396 | — | 849 | — | 9,077 | ||||||||||||||||||
| Depreciation and amortization |
3,670 | 83 | 174 | (b) | 35 | 217 | (b) | 4,179 | ||||||||||||||||
| Acquisition-related expenses |
1,461 | 743 | (743 | )(c) | 495 | (495 | )(c) | 1,461 | ||||||||||||||||
|
|
|
|
|
|
|
|
|
|
|
|
|
|||||||||||||
| Total operating expenses |
32,345 | 3,944 | (569 | ) | 3,412 | (278 | ) | 38,854 | ||||||||||||||||
|
|
|
|
|
|
|
|
|
|
|
|
|
|||||||||||||
| Loss from operations |
(4,619 | ) | (909 | ) | 158 | (136 | ) | 104 | (5,402 | ) | ||||||||||||||
| Other income (expense): |
||||||||||||||||||||||||
| Interest expense, net |
(2,797 | ) | — | (259 | )(d) | 8 | (237 | )(d) | (3,285 | ) | ||||||||||||||
| Other expense net |
(431 | ) | (39 | ) | — | (6 | ) | — | (476 | ) | ||||||||||||||
|
|
|
|
|
|
|
|
|
|
|
|
|
|||||||||||||
| Total other income (expense) |
(3,228 | ) | (39 | ) | (259 | ) | 2 | (237 | ) | (3,761 | ) | |||||||||||||
|
|
|
|
|
|
|
|
|
|
|
|
|
|||||||||||||
| Loss before provision for income taxes |
(7,847 | ) | (948 | ) | (101 | ) | (134 | ) | (133 | ) | (9,163 | ) | ||||||||||||
| Provision for income taxes |
(708 | ) | — | (45 | )(e) | — | (48 | )(e) | (801 | ) | ||||||||||||||
|
|
|
|
|
|
|
|
|
|
|
|
|
|||||||||||||
| Loss from continuing operations |
(8,555 | ) | (948 | ) | (146 | ) | (134 | ) | (181 | ) | (9,964 | ) | ||||||||||||
|
|
|
|
|
|
|
|
|
|
|
|
|
|||||||||||||
| Loss from discontinued operations |
(642 | ) | — | — | — | — | (642 | ) | ||||||||||||||||
|
|
|
|
|
|
|
|
|
|
|
|
|
|||||||||||||
| Net loss |
(9,197 | ) | (948 | ) | (146 | ) | (134 | ) | (181 | ) | (10,606 | ) | ||||||||||||
|
|
|
|
|
|
|
|
|
|
|
|
|
|||||||||||||
| Preferred stock dividends and accretion |
(98 | ) | — | — | — | — | (98 | ) | ||||||||||||||||
|
|
|
|
|
|
|
|
|
|
|
|
|
|||||||||||||
| Net loss attributable to common shareholders |
(9,295 | ) | (948 | ) | (146 | ) | (134 | ) | (181 | ) | (10,704 | ) | ||||||||||||
|
|
|
|
|
|
|
|
|
|
|
|
|
|||||||||||||
| Net loss per common share: |
||||||||||||||||||||||||
| Loss from continuing operations per common share, basic and diluted |
$ | (7.23 | ) | — | — | — | — | $ | (7.57 | ) | ||||||||||||||
| Loss from discontinued operations per common share, basic and diluted |
$ | (0.54 | ) | — | — | — | — | $ | (0.48 | ) | ||||||||||||||
| Net loss per common share, basic and diluted |
$ | (7.77 | ) | — | — | — | — | $ | (8.05 | ) | ||||||||||||||
| Weighted-average common shares outstanding, basic and diluted |
1,196,668 | — | — | — | 132,578 | (f) | 1,329,246 | |||||||||||||||||
|
|
|
|
|
|
|
|
|
|
|
|
|
|||||||||||||
| Pro forma net loss per common share (unaudited), basic and diluted |
$ | (1.55 | ) | $ | (1.73 | ) | ||||||||||||||||||
| Pro forma weighted-average common shares outstanding (unaudited), basic and diluted |
5,998,613 | 172,287 | (g) | 6,170,900 | ||||||||||||||||||||
|
|
|
|
|
|
|
|||||||||||||||||||
F-101
Table of Contents
NOTES TO UNAUDITED PRO FORMA CONDENSED CONSOLIDATED
STATEMENTS OF OPERATIONS FOR THE YEAR ENDED DECEMBER 31, 2013
| (a) | Represents change in revenue based upon the adjustment of deferred revenue to fair value as of the date of the acquisition. |
| (b) | Represents change in amortization based upon preliminary estimates of fair values and useful lives of trade name, technology and customer relationships. The respective values and lives of trade name, technology and customer relationships are as follows: |
| Intangible Asset | Stated Value |
Useful Life (months) |
Mthly Amort. |
|||||||||||
| Filebound |
||||||||||||||
| Trade Name | $ | 320,000 | 36 | $ | 8,889 | |||||||||
| Technology | $ | 2,040,000 | 72 | $ | 28,333 | |||||||||
| Customer Relationships | $ | 3,600,000 | 120 | $ | 30,000 | |||||||||
| $ | 5,960,000 | $ | 67,222 | |||||||||||
| Comsci |
||||||||||||||
| Trade Name | $ | 180,000 | 36 | $ | 5,000 | |||||||||
| Technology | $ | 810,000 | 48 | $ | 16,875 | |||||||||
| Customer Relationships | $ | 2,000,000 | 120 | $ | 16,667 | |||||||||
| $ | 2,990,000 | $ | 38,542 | |||||||||||
| FileBound | ComSci | |||||||
| Removing historical amortization from cost of goods sold |
$ | 212,500 | $ | 33,750 | ||||
| Removing historical amortization from operating expenses |
$ | 291,667 | $ | 43,333 | ||||
|
|
|
|
|
|||||
| $ | 504,167 | $ | 77,083 | |||||
|
|
|
|
|
|||||
| Pro forma—Full-year amortization expense |
||||||||
| Pro forma amortization from cost of goods sold |
$ | 340,000 | $ | 202,500 | ||||
| Pro forma amortization from operating expenses |
$ | 466,667 | $ | 260,000 | ||||
|
|
|
|
|
|||||
| $ | 806,667 | $ | 462,500 | |||||
|
|
|
|
|
|||||
| (c) | Amount represents pre-acquisition seller transaction costs. |
| (d) | Reflects pro forma interest expense for the year ended December 31, 2013 resulting from the FileBound and ComSci acquisitions: |
| Cash Paid at Closing | Interest Expense(1) | |||||||
| FileBound |
14,026,131 | 259,387 | ||||||
| ComSci |
5,593,675 | 236,773 | ||||||
|
|
|
|||||||
| Total pro forma interest expense |
496,160 | |||||||
|
|
|
|||||||
| (1) | Reflects interest on the cash paid at closing for FileBound and ComSci at the 3.25% LIBOR rate plus 1.75%. Cash paid at closing is assumed to be borrowed under the Company’s U.S. loan and security agreement. |
| (e) | Represents the tax effect of the pro forma adjustments, calculated at an effective rate of 36.3%. |
| (f) | Represents the effect of 155,599 common shares issued in connection with the ComSci purchase as if they were outstanding for the entire year. |
| (g) | Represents the effect of 106,572 Series B-1 preferred shares and 155,598 Series B-2 preferred shares in connection with the FileBound and ComSci purchase, respectively, as if they were outstanding for the entire year. |
F-102
Table of Contents

Table of Contents
3,846,154 Shares
Common Stock
Prospectus
, 2014
William Blair
Raymond James
Canaccord Genuity
Needham & Company
Until , , all dealers that buy, sell or trade the common stock may be required to deliver a prospectus regardless of whether they are participating in this offering. This is in addition to the dealers’ obligation to deliver a prospectus when acting as underwriters and with respect to their unsold allotments or subscription.
Table of Contents
PART II
INFORMATION NOT REQUIRED IN PROSPECTUS
| Item 13. | Other expenses of issuance and distribution. |
The following table sets forth all costs and expenses, other than underwriting discounts and commissions, paid or payable by us in connection with the sale of the common stock being registered. All amounts shown are estimates except for the Securities and Exchange Commission, or SEC, registration fee and the Financial Industry Regulatory Authority, Inc., or FINRA, filing fee.
| Amount Paid or to be Paid |
||||
| SEC registration fee |
$ | 7,826 | ||
| FINRA filing fee |
11,750 | |||
| NASDAQ Global Market listing fee |
125,000 | |||
| Blue sky fees and expenses (including related legal fees) |
5,000 | |||
| Printing expenses |
250,000 | |||
| Legal fees and expenses |
1,500,000 | |||
| Accounting fees and expenses |
1,200,000 | |||
| Transfer agent and registrar fees and expenses |
15,000 | |||
| Miscellaneous fees and expenses |
200,424 | |||
|
|
|
|||
| Total |
$ | 3,315,000 | ||
|
|
|
|||
| * | To be filed by amendment |
| Item 14. | Indemnification of directors and officers. |
Section 145 of the Delaware General Corporation Law authorizes a court to award, or a corporation’s board of directors to grant, indemnity to directors and officers in terms sufficiently broad to permit such indemnification under certain circumstances for liabilities, including reimbursement for expenses incurred, arising under the Securities Act of 1933, as amended, or the Securities Act. Our amended and restated certificate of incorporation, to be effective upon the completion of this offering, provides for indemnification of our directors, officers, employees and other agents to the maximum extent permitted by the Delaware General Corporation Law, and our amended and restated bylaws, to be effective upon the completion of this offering, provide for indemnification of our directors, officers, employees and other agents to the maximum extent permitted by the Delaware General Corporation Law. In addition, we will enter into indemnification agreements with our directors, officers and some employees containing provisions that may be in some respects broader than the specific indemnification provisions contained in the Delaware General Corporation Law. The indemnification agreements may require us, among other things, to indemnify our directors against certain liabilities that may arise by reason of their status or service as directors and to advance their expenses incurred as a result of any proceeding against them as to which they could be indemnified. Reference is also made to Section 9 of the Underwriting Agreement to be filed as Exhibit 1.1 hereto, which provides for indemnification by the underwriters of our officers and directors against certain liabilities.
| Item 15. | Recent sales of unregistered securities. |
The following list sets forth information regarding all unregistered securities sold by us from January 1, 2011 to September 30, 2014:
(1) On March 16, 2011, we granted options under our 2010 Plan to purchase 37,383 shares of common stock to an employee, having an exercise price of $0.31 per share for an aggregate exercise price of $11,400. The issuance and sale of these securities were deemed to be exempt from registration pursuant to Rule 701
II-1
Table of Contents
promulgated under the Securities Act pursuant to a compensatory benefit plan approved by the registrant’s board of directors.
(2) On September 12, 2011, we sold and issued 1,779,343 shares of our Series A preferred stock to 14 investors at $6.10 per share, for a total consideration of $10,852,249. The issuance and sale of these securities were deemed to be exempt from registration pursuant to Section 4(2) of the Securities Act, as transactions by an issuer not involving a public offering.
(3) On December 9, 2011, we sold and issued 102,207 shares of our Series A preferred stock to six investors at $6.10 per share, for a total consideration of $623,376. The issuance and sale of these securities were deemed to be exempt from registration pursuant to Section 4(2) of the Securities Act, as transactions by an issuer not involving a public offering.
(4) On December 13, 2011, we sold and issued 32,791 shares of our Series A preferred stock to one investor at $6.10 per share, for a total consideration of $200,000. The issuance and sale of these securities were deemed to be exempt from registration pursuant to Section 4(2) of the Securities Act, as transactions by an issuer not involving a public offering.
(5) On December 20, 2011, we sold and issued 81,980 shares of our Series A preferred stock to one investor at $6.10 per share, for a total consideration of $500,000. The issuance and sale of these securities were deemed to be exempt from registration pursuant to Section 4(2) of the Securities Act, as transactions by an issuer not involving a public offering.
(6) On December 21, 2011, we sold and issued 507,853 shares of our Series A preferred stock to three investors at $6.10 per share, for a total consideration of $3,097,403. The issuance and sale of these securities were deemed to be exempt from registration pursuant to Section 4(2) of the Securities Act, as transactions by an issuer not involving a public offering.
(7) On December 22, 2011, we sold and issued 31,939 shares of our Series A preferred stock to two investors at $6.10 per share, for a total consideration of $194,805. The issuance and sale of these securities were deemed to be exempt from registration pursuant to Section 4(2) of the Securities Act, as transactions by an issuer not involving a public offering.
(8) On January 6, 2012, we sold and issued 8,517 shares of our Series A preferred stock to one investor at $6.10 per share, for a total consideration of $51,948. The issuance and sale of these securities were deemed to be exempt from registration pursuant to Section 4(2) of the Securities Act, as transactions by an issuer not involving a public offering.
(9) On January 17, 2012, we sold and issued 32,792 shares of our Series A preferred stock to two investors at $6.10 per share, for a total consideration of $200,000. The issuance and sale of these securities were deemed to be exempt from registration pursuant to Section 4(2) of the Securities Act, as transactions by an issuer not involving a public offering.
(10) On February 6, 2012, we sold and issued 127,762 shares of our Series A preferred stock to one investor at $6.10 per share, for a total consideration of $779,221. The issuance and sale of these securities were deemed to be exempt from registration pursuant to Section 4(2) of the Securities Act, as transactions by an issuer not involving a public offering.
(11) On January 25, 2012, we sold and issued 1,489,378 shares of our Series B preferred stock to 17 investors at $6.10 per share, for a total consideration of $9,083,767. The issuance and sale of these securities were deemed to be exempt from registration pursuant to Section 4(2) of the Securities Act, as transactions by an issuer not involving a public offering.
(12) On February 3, 2012, we sold and issued 187,937 shares of our Series B preferred stock to three investors at $6.10 per share, for a total consideration of $1,146,233. The issuance and sale of these securities were deemed to be exempt from registration pursuant to Section 4(2) of the Securities Act, as transactions by an issuer not involving a public offering.
II-2
Table of Contents
(13) On February 9, 2012, we sold and issued 24,594 shares of our Series B preferred stock to two investors at $6.10 per share, for a total consideration of $150,000. The issuance and sale of these securities were deemed to be exempt from registration pursuant to Section 4(2) of the Securities Act, as transactions by an issuer not involving a public offering.
(14) On February 10, 2012, we sold and issued a promissory note in the principal amount of $1,500,000 to one investor. The issuance and sale of these securities were deemed to be exempt from registration pursuant to Section 4(2) of the Securities Act, as transactions by an issuer not involving a public offering.
(15) On February 10, 2012, we issued a warrant exercisable for 19,675 shares of Series A preferred stock having an exercise price of $6.10 per share to one investor. The issuance and sale of these securities were deemed to be exempt from registration pursuant to Section 4(2) of the Securities Act, as transactions by an issuer not involving a public offering.
(16) On March 5, 2012, we issued a warrant exercisable for 19,675 shares of Series B preferred stock having an exercise price of $6.10 per share to one investor. The issuance and sale of these securities were deemed to be exempt from registration pursuant to Section 4(2) of the Securities Act, as transactions by an issuer not involving a public offering.
(17) On October 10, 2012, we granted options under our 2010 Plan to purchase 173,844 shares of common stock to our employees, directors and consultants, having an exercise price of $1.22 per share for an aggregate exercise price of $212,179. The issuance and sale of these securities were deemed to be exempt from registration pursuant to Rule 701 promulgated under the Securities Act pursuant to a compensatory benefit plan approved by the registrant’s board of directors.
(18) On October 10, 2012, we sold and issued 113,085 shares of our common stock pursuant to a restricted stock grant issued under our 2010 Plan, at a purchase price of $1.22 for an aggregate exercise price of $137,942. The issuance and sale of these securities were deemed to be exempt from registration pursuant to Rule 701 promulgated under the Securities Act as transactions pursuant to a compensatory benefit plan approved by the registrant’s board of directors.
(19) On November 14, 2012, we sold and issued a promissory note in the principal amount of $1,500,000 to one investor. The issuance and sale of these securities were deemed to be exempt from registration pursuant to Section 4(2) of the Securities Act, as transactions by an issuer not involving a public offering.
(20) On November 14, 2012, we issued 131,168 shares of our Series B-1 preferred stock to two investors. The issuance and sale of these securities were deemed to be exempt from registration pursuant to Section 4(2) of the Securities Act, as transactions by an issuer not involving a public offering.
(21) On November 14, 2012, we issued subordinated promissory notes in the aggregate principal amount of $1,500,000 to two investors. The issuance and sale of these securities were deemed to be exempt from registration pursuant to Section 4(2) of the Securities Act, as transactions by an issuer not involving a public offering.
(22) On December 3, 2012, we issued a warrant exercisable for 6,558 shares of Series B preferred stock having an exercise price of $6.10 per share to one investor. The issuance and sale of these securities were deemed to be exempt from registration pursuant to Section 4(2) of the Securities Act, as transactions by an issuer not involving a public offering.
(23) On April 11, 2013, we issued a warrant exercisable for 37,164 shares of Series B preferred stock having an exercise price of $6.10 per share to one investor. The issuance and sale of these securities were deemed to be exempt from registration pursuant to Section 4(2) of the Securities Act, as transactions by an issuer not involving a public offering.
(24) On May 16, 2013, we issued 106,572 shares of our Series B-1 preferred stock to four investors. The issuance and sale of these securities were deemed to be exempt from registration pursuant to Section 4(2) of the Securities Act, as transactions by an issuer not involving a public offering.
II-3
Table of Contents
(25) On May 16, 2013, we issued subordinated promissory notes in the aggregate principal amount of $3,500,000 to four investors. The issuance and sale of these securities were deemed to be exempt from registration pursuant to Section 4(2) of the Securities Act, as transactions by an issuer not involving a public offering.
(26) On October 9, 2013, we sold and issued convertible promissory notes in the aggregate principal amount of $4,647,099 to 17 investors. The issuance and sale of these securities were deemed to be exempt from registration pursuant to Section 4(2) of the Securities Act, as transactions by an issuer not involving a public offering.
(27) On October 25, 2013, we granted options under our 2010 Plan to purchase 191,045 shares of common stock to our employees, directors and consultants, having an exercise price of $1.77 per share for an aggregate exercise price of $338,198. The issuance and sale of these securities were deemed to be exempt from registration pursuant to Rule 701 promulgated under the Securities Act pursuant to a compensatory benefit plan approved by the registrant’s board of directors.
(28) On November 6, 2013, we issued a warrant exercisable for 2,459 shares of common stock having an exercise price of $1.77 to one investor. The issuance and sale of these securities were deemed to be exempt from registration pursuant to Section 4(2) of the Securities Act, as transactions by an issuer not involving a public offering.
(29) On November 7, 2013, we sold and issued a convertible promissory note in the aggregate principal amount of $150,000 to two investors. The issuance and sale of these securities were deemed to be exempt from registration pursuant to Section 4(2) of the Securities Act, as transactions by an issuer not involving a public offering.
(30) On November 7, 2013, we issued 155,598 shares of our Series B-2 preferred stock to one investor. The issuance and sale of these securities were deemed to be exempt from registration pursuant to Section 4(2) of the Securities Act, as transactions by an issuer not involving a public offering.
(31) On November 7, 2013, we issued 155,599 shares of our common stock to one investor. The issuance and sale of these securities were deemed to be exempt from registration pursuant to Section 4(2) of the Securities Act, as transactions by an issuer not involving a public offering.
(32) On December 6, 2013, we sold and issued a convertible promissory note in the principal amount of $90,000 to one investor. The issuance and sale of these securities were deemed to be exempt from registration pursuant to Section 4(2) of the Securities Act, as transactions by an issuer not involving a public offering.
(33) On December 20, 2013, we sold and issued 1,356,189 shares of our Series C preferred stock to 20 investors at $10.98 per share, for a total consideration of $14,888,583. The issuance and sale of these securities were deemed to be exempt from registration pursuant to Rule 506 of Regulation D promulgated under the Securities Act.
(34) On December 20, 2013, we sold and issued 561,859 shares of our Series C preferred stock to 19 investors at $8.78 per share, for a total consideration of $4,934,624. The issuance and sale of these securities were deemed to be exempt from registration pursuant to Rule 506 of Regulation D promulgated under the Securities Act.
(35) On January 27, 2014, we sold and issued 1,803,574 shares of our common stock to one investor at $0.0001 per share, for a total consideration of $1,100. The issuance and sale of these securities were deemed to be exempt from registration pursuant to Section 4(2) of the Securities Act, as transactions by an issuer not involving a public offering.
(36) On March 31, 2014, we granted options under our 2010 Plan to purchase 262,196 shares of common stock to our employees, directors and consultants, having an exercise price of $6.23 per share for an aggregate exercise price of $1,631,490. The issuance and sale of these securities were deemed to be exempt from registration pursuant to Rule 701 promulgated under the Securities Act pursuant to a compensatory benefit plan approved by the registrant’s board of directors.
II-4
Table of Contents
(37) On April 12, 2014, we granted options under our 2010 Plan to purchase 819 shares of common stock to an employee, having an exercise price of $6.23 per share for an aggregate exercise price of $5,100. The issuance and sale of these securities were deemed to be exempt from registration pursuant to Rule 701 promulgated under the Securities Act pursuant to a compensatory benefit plan approved by the registrant’s board of directors.
(38) On June 9, 2014, we sold and issued 150 shares of common stock pursuant to an option exercise by the holder of a stock option issued under our 2010 Stock Plan, at a purchase price of $1.77 per share for a total consideration of $266. The issuance and sale of these securities were deemed to be exempt from registration pursuant to Rule 701 promulgated under the Securities Act pursuant to a compensatory benefit plan approved by the registrant’s board of directors.
(39) On August 4, 2014, we sold and issued 163 shares of common stock pursuant to an option exercise by the holder of a stock option issued under our 2010 Stock Plan, at a purchase price of $0.29 per share for a total consideration of $290. The issuance and sale of these securities were deemed to be exempt from registration pursuant to Rule 701 promulgated under the Securities Act pursuant to a compensatory benefit plan approved by the registrant’s board of directors.
(40) On September 2, 2014, we sold and issued 294,010 shares of common stock pursuant to a restricted stock grant issued under our 2010 Stock Plan, at a purchase price of $8.73 per share for a total consideration of $2,564,237. The issuance and sale of these securities were deemed to be exempt from registration pursuant to Rule 701 promulgated under the Securities Act pursuant to a compensatory benefit plan approved by the registrant’s board of directors.
(41) On September 2, 2014, we granted options under our 2010 Stock Plan to purchase 123,785 shares of common stock to our employees, directors and consultants, having an exercise price of $8.73 per share for an aggregate exercise price of $1,079,650. The issuance and sale of these securities were deemed to be exempt from registration pursuant to Rule 701 promulgated under the Securities Act pursuant to a compensatory benefit plan approved by the registrant’s board of directors.
None of the foregoing transactions involved any underwriters, underwriting discounts or commissions, or any public offering. Stock certificates issued in the foregoing transactions bear the appropriate Securities Act legends as to the restricted nature of such securities. Each recipient of the securities in these transactions represented his or her intention to acquire the securities for investment only and not with a view to, or for resale in connection with, any distribution thereof, and appropriate legends were affixed to the share certificates issued in each such transaction. In each case, the recipient received adequate information about the registrant or had adequate access, through his or her relationship with the registrant, to information about the registrant.
| Item 16. | Exhibits and Financial Statement Schedules |
| (a) | Exhibits |
| Exhibit |
Description of Exhibit | |
| 1.1* | Form of Underwriting Agreement | |
| 2.1* | Agreement and Plan of Merger by and among the Registrant, Steering Wheel Acquisition Corp., PowerSteering Software, Inc. and Michael Pehl, as Stockholder representative, dated February 3, 2012 | |
| 2.2* | Stock Purchase Agreement by and among the Registrant, Tenrox Inc., the stockholders named therein and Novacap II, L.P. and Aramazd Israilian, as representatives, dated February 10, 2012 | |
| 2.3* | Membership Interest Purchase Agreement by and among the Registrant, LMR Solutions, LLC, Joseph Larscheid and Cheryl Larscheid, dated November 13, 2012 | |
II-5
Table of Contents
| Exhibit |
Description of Exhibit | |
| 2.4* | Stock Purchase Agreement by and among the Registrant, Marex Group Inc., FileBound Solutions, Inc., the Selling Stockholders (as defined therein) and Rex Lamb, as representative of the Selling Stockholders, dated May 16, 2013 | |
| 2.5* | Membership Interest Purchase Agreement by and among the Registrant, Upland Software, Inc., ComSci, LLC and Robert Svec, dated November 7, 2013 | |
| 2.6* | Stock Purchase Agreement by and among the Registrant, Clickability, Inc. and Limelight Networks, Inc. dated December 23, 2013 | |
| 3.1* | Amended and Restated Certificate of Incorporation of the Registrant, dated January 27, 2014 | |
| 3.1.1* | Certificate of Amendment to Amended and Restated Certificate of Incorporation, dated October 24, 2014 | |
| 3.2* | Form of Amended and Restated Certificate of Incorporation of the Registrant, to be effective immediately prior to the closing of the offering | |
| 3.3* | Bylaws of the Registrant, as currently in effect | |
| 3.4* | Form of Amended and Restated Bylaws of the Registrant, to be effective immediately prior to the closing of the offering | |
| 4.1* | Amended and Restated Investors’ Rights Agreement among the Registrant and certain stockholders, dated December 20, 2013 | |
| 4.2* | Amended and Restated Right of First Refusal and Co-Sale Agreement among the Registrant and certain stockholders, dated December 20, 2013 | |
| 4.3* | Amended and Restated Voting Agreement among the Registrant and certain stockholders, dated December 20, 2013 | |
| 4.4* | Restricted Stock Agreement between the Registrant, Joseph Larscheid and Cheryl Larscheid, dated November 14, 2012 | |
| 4.5* | Market Standoff Agreement between the Registrant and Robert Svec, dated November 6, 2013 | |
| 4.6* | Letter Agreement between the Registrant and Austin Ventures IX, L.P. regarding management rights, dated October 28, 2010 | |
| 4.7* | Letter Agreement between the Registrant and Austin Ventures X, L.P. regarding management rights, dated October 28, 2010 | |
| 4.8* | Warrant to Purchase Series A Preferred Stock issued to Comerica Bank dated February 10, 2012 | |
| 4.9* | Warrant to Purchase Series B Preferred Stock issued to Comerica Bank dated March 5, 2012 | |
| 4.10* | Warrant to Purchase Series B Preferred Stock issued to Comerica Bank dated April 11, 2013 | |
| 4.11* | Warrant to Purchase Common Stock issued to Entrepreneurs Foundation of Central Texas dated November 6, 2013 | |
| 5.1* | Opinion of Wilson Sonsini Goodrich & Rosati, Professional Corporation | |
| 10.1+* | Form of Indemnification Agreement for directors and officers, as currently in effect | |
| 10.2+* | Form of Indemnification Agreement for directors and officers, to be effective prior to the closing of the offering | |
| 10.3+* | Amended and Restated 2010 Stock Plan, as amended | |
| 10.3.1+* | Amended and Restated 2010 Stock Plan, as amended September 2, 2014 | |
| 10.4+* | Form of Stock Option Agreement under Amended and Restated 2010 Stock Plan (Standard) | |
II-6
Table of Contents
| Exhibit |
Description of Exhibit | |
| 10.4.1+* | Form of Stock Option Agreement under Amended and Restated 2010 Stock Plan (Former ComSci, LLC Employees) | |
| 10.4.2+* | Form of Stock Option Agreement under Amended and Restated 2010 Stock Plan (Executive) | |
| 10.4.3+* | Form of Amendment to Stock Option Agreement under Amended and Restated 2010 Stock Plan with Certain Executives | |
| 10.5+* | Form of Restricted Stock Purchase Agreement under Amended and Restated 2010 Stock Plan | |
| 10.5.1+* | Form of Amendment to Restricted Stock Purchase Agreement under Amended and Restated 2010 Stock Plan | |
| 10.6+* | Form of 2014 Equity Incentive Plan, to be adopted prior to the closing of the offering | |
| 10.7+* | Form of Stock Option Award Agreement under 2014 Equity Incentive Plan | |
| 10.7.1+* | Form of Stock Option Award Agreement under 2014 Equity Incentive Plan (Executive) | |
| 10.8+* | Form of Restricted Stock Purchase Agreement under 2014 Equity Incentive Plan | |
| 10.8.1+* | Form of Restricted Stock Purchase Agreement under 2014 Equity Incentive Plan (Executive) | |
| 10.9+* | Form of Restricted Stock Unit Award Agreement under 2014 Equity Incentive Plan | |
| 10.9.1+* | Form of Restricted Stock Unit Award Agreement under 2014 Equity Incentive Plan (Executive) | |
| 10.10+* | Offer of Employment between the Registrant and John T. McDonald, dated July 23, 2010 | |
| 10.11+* | Offer of Employment between the Registrant and R. Brian Henley, dated January 10, 2013 | |
| 10.11.1+* | Employment Agreement between the Registrant and R. Brian Henley, dated July 25, 2014. | |
| 10.12+* | Employment Agreement between the Registrant and John T. McDonald, dated May 9, 2014 | |
| 10.13+* | Employment Agreement between the Registrant and Ludwig Melik, dated February 10, 2012 | |
| 10.13.1+* | Amendment to Employment Agreement between the Registrant and Ludwig Melik, dated December 18, 2012 | |
| 10.14+* | Restricted Stock Purchase Agreement between the Registrant and John T. McDonald, dated July 23, 2010 | |
| 10.15+* | Restricted Stock Purchase Agreement between the Registrant and John T. McDonald, dated October 18, 2010 | |
| 10.16+* | Restricted Stock Purchase Agreement between the Registrant and John T. McDonald, dated September 2, 2014 | |
| 10.16.1+* | Restricted Stock Purchase Agreement between the Registrant and R. Brian Henley, dated September 2, 2014 | |
| 10.17* | Office Lease between the Registrant and TPG-401 Congress LLC, dated February 27, 2014 | |
| 10.17.1* | First Amendment to Office Lease between Registrant and TPG-401 Congress LLC | |
| 10.18* | Lease Agreement between Tenrox Inc. and A.R.E. Quebec, dated November 5, 2012, as amended | |
| 10.19* | Sublease Agreement between Marex Properties, LLC and Marex Group Inc., dated May 10, 2013 | |
| 10.20* | Loan and Security Agreement and Joinder between the Registrant, Visionael Corporation, PowerSteering Software, Inc., LMR Solutions LLC, Marex Group, Inc., FileBound Solutions, Inc., ComSci, LLC, ComSci, Inc. and Comerica Bank, dated March 5, 2012, as amended through December 6, 2013 | |
| 10.21* | Security Agreement between Tenrox Inc. and Comerica Bank, dated March 5, 2012, as amended | |
| 10.22* | Unconditional Guaranty by Tenrox Inc., dated March 5, 2012 | |
| 10.23* | Affirmation of Guaranty Documents by Tenrox Inc. for the benefit of Comerica Bank, dated December 3, 2012, as amended through May 16, 2013 | |
II-7
Table of Contents
| Exhibit |
Description of Exhibit | |
| 10.24* | Loan and Security Agreement between Tenrox, Inc., successor to Silverback Two Canada Merger Corporation, and Comerica Bank, dated February 10, 2012, as amended through December 6, 2013 | |
| 10.25* | Pledge and Security Agreement between the Registrant and Comerica Bank, dated February 10, 2012, as amended through May 16, 2013. | |
| 10.26* | Security Agreement between Marex Group, Inc. and Comerica Bank, dated May 16, 2013, as amended through December 6, 2013 | |
| 10.27* | Security Agreement between LMR Solutions LLC and Comerica Bank, dated December 3, 2012, as amended through December 6, 2013 | |
| 10.28* | Security Agreement between PowerSteering Software Inc. and Comerica Bank, dated February 10, 2012, as amended through March 19, 2014 | |
| 10.29* | Security Agreement between Tenrox Inc. and Comerica Bank, dated February 10, 2012, as amended through December 6, 2013 | |
| 10.30* | Unconditional Guaranty by Marex Group, Inc., dated May 16, 2013 | |
| 10.31* | Unconditional Guaranty by LMR Solutions LLC, dated December 3, 2012 | |
| 10.32* | Unconditional Guaranty by PowerSteering Software Inc., dated February 10, 2012 | |
| 10.33* | Unconditional Guaranty by Tenrox Inc., dated February 10, 2012 | |
| 10.34* | Unconditional Guaranty by the Registrant, dated February 10, 2012 | |
| 10.35* | Amendment to and Affirmation of Guaranty Documents and Waiver by Tenrox Inc. for the benefit of Comerica Bank, dated April 11, 2013 | |
| 10.36* | Series C Preferred Stock Purchase Agreement among the Registrant and the Investors listed on the Schedule of Investors thereto, dated December 20, 2013 | |
| 10.37* | Amended and Restated Technology Services Agreement between the Registrant and DevFactory FZ-LLC, dated January 1, 2014 | |
| 10.38* | Letter Agreement between the Registrant and DevFactory FZ-LLC, dated January 1, 2014 | |
| 10.39* | Stock Purchase Agreement between the Registrant and DevFactory FZ-LLC, dated January 27, 2014 | |
| 10.40* | Note Purchase Agreement between the Registrant and the Investors listed on Schedule I thereto, dated October 9, 2013, as amended | |
| 21.1* | List of subsidiaries of the Registrant. | |
| 23.1 | Consent of Ernst & Young LLP, Independent Registered Public Accounting Firm. | |
| 23.2 | Consent of Holtzman Partners, LLP, Independent Public Accounting Firm. | |
| 23.3 | Consent of Blackman & Associates, P.C. | |
| 23.4* | Consent of Wilson Sonsini Goodrich & Rosati, Professional Corporation (included in Exhibit 5.1). | |
| 24.1* | Power of Attorney (see page II-10 to the original filing of this registration statement on Form S-1). | |
| * | Previously filed. |
| + | Indicates management contract or compensatory plan. |
| (b) | Financial statement schedule. |
No financial statement schedules are provided because the information called for is not required or is shown either in the financial statements or notes.
II-8
Table of Contents
| Item 17. | Undertakings. |
The undersigned registrant hereby undertakes to provide to the underwriters at the closing specified in the underwriting agreement, certificates in such denominations and registered in such names as required by the underwriters to permit prompt delivery to each purchaser.
Insofar as indemnification for liabilities arising under the Securities Act may be permitted to directors, officers and controlling persons of the registrant pursuant to the foregoing provisions, or otherwise, the registrant has been advised that in the opinion of the Securities and Exchange Commission such indemnification is against public policy as expressed in the Securities Act and is, therefore, unenforceable. In the event that a claim for indemnification against such liabilities (other than the payment by the registrant of expenses incurred or paid by a director, officer or controlling person of the registrant in the successful defense of any action, suit or proceeding) is asserted by such director, officer or controlling person in connection with the securities being registered, the registrant will, unless in the opinion of its counsel the matter has been settled by controlling precedent, submit to a court of appropriate jurisdiction the question whether such indemnification by it is against public policy as expressed in the Securities Act and will be governed by the final adjudication of such issue.
The undersigned registrant hereby undertakes that:
(1) For purposes of determining any liability under the Securities Act, the information omitted from the form of prospectus filed as part of this registration statement in reliance upon Rule 430A and contained in a form of prospectus filed by the registrant pursuant to Rule 424(b)(1) or (4) or 497(h) under the Securities Act shall be deemed to be part of this registration statement as of the time it was declared effective.
(2) For the purpose of determining any liability under the Securities Act, each post-effective amendment that contains a form of prospectus shall be deemed to be a new registration statement relating to the securities offered therein, and the offering of such securities at that time shall be deemed to be the initial bona-fide offering thereof.
II-9
Table of Contents
SIGNATURES
Pursuant to the requirements of the Securities Act of 1933, as amended, the registrant has duly caused this Amendment to the registration statement on Form S-1 to be signed on its behalf by the undersigned, thereunto duly authorized, in the City of Austin, State of Texas, on the 5th day of November, 2014.
| UPLAND SOFTWARE, INC. | ||
| By: | /s/ John T. McDonald | |
| John T. McDonald Chief Executive Officer and Chairman | ||
Pursuant to the requirements of the Securities Act of 1933, as amended, this Amendment to the registration statement has been signed in the capacities and on the dates indicated.
| Signature |
Title |
Date | ||
| /s/ John T. McDonald John T. McDonald |
Director, Chief Executive Officer and Chairman (Principal Executive Officer) | November 5, 2014 | ||
| /s/ Michael D. Hill Michael D. Hill |
Chief Financial Officer, Assistant Secretary and Treasurer (Principal Financial Officer and Principal Accounting Officer) | November 5, 2014 | ||
| * John D. Thornton |
Director | November 5, 2014 | ||
| * Steven Sarracino |
Director | November 5, 2014 | ||
| * Stephen E. Courter |
Director | November 5, 2014 | ||
| * Rodney C. Favaron |
Director | November 5, 2014 | ||
| *By: | /s/ John T. McDonald | |
| John T. McDonald Attorney-in-Fact | ||
II-10
Table of Contents
EXHIBIT INDEX
| Exhibit No. |
Description of Exhibit | |
| 1.1* | Form of Underwriting Agreement | |
| 2.1* | Agreement and Plan of Merger by and among the Registrant, Steering Wheel Acquisition Corp., PowerSteering Software, Inc. and Michael Pehl, as Stockholder representative, dated February 3, 2012 | |
| 2.2* | Stock Purchase Agreement by and among the Registrant, Tenrox Inc., the stockholders named therein and Novacap II, L.P. and Aramazd Israilian, as representatives, dated February 10, 2012 | |
| 2.3* | Membership Interest Purchase Agreement by and among the Registrant, LMR Solutions, LLC, Joseph Larscheid and Cheryl Larscheid, dated November 13, 2012 | |
| 2.4* | Stock Purchase Agreement by and among the Registrant, Marex Group Inc., FileBound Solutions, Inc., the Selling Stockholders (as defined therein) and Rex Lamb, as representative of the Selling Stockholders, dated May 16, 2013 | |
| 2.5* | Membership Interest Purchase Agreement by and among the Registrant, Upland Software, Inc., ComSci, LLC and Robert Svec, dated November 7, 2013 | |
| 2.6* | Stock Purchase Agreement by and among the Registrant, Clickability, Inc. and Limelight Networks, Inc. dated December 23, 2013 | |
| 3.1* | Amended and Restated Certificate of Incorporation of the Registrant, dated January 27, 2014 | |
| 3.1.1* | Certificate of Amendment to Amended and Restated Certificate of Incorporation, dated October 24, 2014 | |
| 3.2* | Form of Amended and Restated Certificate of Incorporation of the Registrant, to be effective immediately prior to the closing of the offering | |
| 3.3* | Bylaws of the Registrant, as currently in effect | |
| 3.4* | Form of Amended and Restated Bylaws of the Registrant, to be effective immediately prior to the closing of the offering | |
| 4.1* | Amended and Restated Investors’ Rights Agreement among the Registrant and certain stockholders, dated December 20, 2013 | |
| 4.2* | Amended and Restated Right of First Refusal and Co-Sale Agreement among the Registrant and certain stockholders, dated December 20, 2013 | |
| 4.3* | Amended and Restated Voting Agreement among the Registrant and certain stockholders, dated December 20, 2013 | |
| 4.4* | Restricted Stock Agreement between the Registrant, Joseph Larscheid and Cheryl Larscheid, dated November 14, 2012 | |
| 4.5* | Market Standoff Agreement between the Registrant and Robert Svec, dated November 6, 2013 | |
| 4.6* | Letter Agreement between the Registrant and Austin Ventures IX, L.P. regarding management rights, dated October 28, 2010 | |
| 4.7* | Letter Agreement between the Registrant and Austin Ventures X, L.P. regarding management rights, dated October 28, 2010 | |
| 4.8* | Warrant to Purchase Series A Preferred Stock issued to Comerica Bank dated February 10, 2012 | |
| 4.9* | Warrant to Purchase Series B Preferred Stock issued to Comerica Bank dated March 5, 2012 | |
| 4.10* | Warrant to Purchase Series B Preferred Stock issued to Comerica Bank dated April 11, 2013 | |
| 4.11* | Warrant to Purchase Common Stock issued to Entrepreneurs Foundation of Central Texas dated November 6, 2013 | |
| 5.1* | Opinion of Wilson Sonsini Goodrich & Rosati, Professional Corporation | |
Table of Contents
| Exhibit No. |
Description of Exhibit | |
| 10.1+* | Form of Indemnification Agreement for directors and officers, as currently in effect | |
| 10.2+* | Form of Indemnification Agreement for directors and officers, to be effective prior to the closing of the offering | |
| 10.3+* | Amended and Restated 2010 Stock Plan, as amended | |
| 10.3.1+* | Amended and Restated 2010 Stock Plan, as amended September 2, 2014 | |
| 10.4+* | Form of Stock Option Agreement under Amended and Restated 2010 Stock Plan (Standard) | |
| 10.4.1+* | Form of Stock Option Agreement under Amended and Restated 2010 Stock Plan (Former ComSci, LLC Employees) | |
| 10.4.2+* | Form of Stock Option Agreement under Amended and Restated 2010 Stock Plan (Executive) | |
| 10.4.3+* | Form of Amendment to Stock Option Agreement under Amended and Restated 2010 Stock Plan with Certain Executives | |
| 10.5+* | Form of Restricted Stock Purchase Agreement under Amended and Restated 2010 Stock Plan | |
| 10.5.1+* | Form of Amendment to Restricted Stock Purchase Agreement under Amended and Restated 2010 Stock Plan | |
| 10.6+* | Form of 2014 Equity Incentive Plan, to be adopted prior to the closing of the offering | |
| 10.7+* | Form of Stock Option Award Agreement under 2014 Equity Incentive Plan | |
| 10.7.1+* | Form of Stock Option Award Agreement under 2014 Equity Incentive Plan (Executive) | |
| 10.8+* | Form of Restricted Stock Purchase Agreement under 2014 Equity Incentive Plan | |
| 10.8.1+* | Form of Restricted Stock Purchase Agreement under 2014 Equity Incentive Plan (Executive) | |
| 10.9+* | Form of Restricted Stock Unit Award Agreement under 2014 Equity Incentive Plan | |
| 10.9.1+* | Form of Restricted Stock Unit Award Agreement under 2014 Equity Incentive Plan (Executive) | |
| 10.10+* | Offer of Employment between the Registrant and John T. McDonald, dated July 23, 2010 | |
| 10.11+* | Offer of Employment between the Registrant and R. Brian Henley, dated January 10, 2013 | |
| 10.11.1+* | Employment Agreement between the Registrant and R. Brian Henley, dated July 25, 2014 | |
| 10.12+* | Employment Agreement between the Registrant and John T. McDonald, dated May 9, 2014 | |
| 10.13+* | Employment Agreement between the Registrant and Ludwig Melik, dated February 10, 2012 | |
| 10.13.1+* | Amendment to Employment Agreement between the Registrant and Ludwig Melik, dated December 18, 2012 | |
| 10.14+* | Restricted Stock Purchase Agreement between the Registrant and John T. McDonald, dated July 23, 2010 | |
| 10.15+* | Restricted Stock Purchase Agreement between the Registrant and John T. McDonald, dated October 18, 2010 | |
| 10.16+* | Restricted Stock Purchase Agreement between the Registrant and John T. McDonald, dated September 2, 2014 | |
| 10.16.1+* | Restricted Stock Purchase Agreement between the Registrant and R. Brian Henley, dated September 2, 2014 | |
| 10.17* | Office Lease between the Registrant and TPG-401 Congress LLC, dated February 27, 2014 | |
| 10.17.1* | First Amendment to Office Lease between Registrant and TPG-401 Congress LLC | |
| 10.18* | Lease Agreement between Tenrox Inc. and A.R.E. Quebec, dated November 5, 2012, as amended | |
| 10.19* | Sublease Agreement between Marex Properties, LLC and Marex Group Inc., dated May 10, 2013 | |
| 10.20* | Loan and Security Agreement and Joinder between the Registrant, Visionael Corporation, PowerSteering Software, Inc., LMR Solutions LLC, Marex Group, Inc., FileBound Solutions, Inc., ComSci, LLC, ComSci, Inc. and Comerica Bank, dated March 5, 2012, as amended through December 6, 2013 | |
| 10.21* | Security Agreement between Tenrox Inc. and Comerica Bank, dated March 5, 2012, as amended | |
Table of Contents
| Exhibit No. |
Description of Exhibit | |
| 10.22* | Unconditional Guaranty by Tenrox Inc., dated March 5, 2012 | |
| 10.23* | Affirmation of Guaranty Documents by Tenrox Inc. for the benefit of Comerica Bank, dated December 3, 2012, as amended through May 16, 2013 | |
| 10.24* | Loan and Security Agreement between Tenrox, Inc., successor to Silverback Two Canada Merger Corporation, and Comerica Bank, dated February 10, 2012, as amended through December 6, 2013 | |
| 10.25* | Pledge and Security Agreement between the Registrant and Comerica Bank, dated February 10, 2012, as amended through May 16, 2013. | |
| 10.26* | Security Agreement between Marex Group, Inc. and Comerica Bank, dated May 16, 2013, as amended through December 6, 2013 | |
| 10.27* | Security Agreement between LMR Solutions LLC and Comerica Bank, dated December 3, 2012, as amended through December 6, 2013 | |
| 10.28* | Security Agreement between PowerSteering Software Inc. and Comerica Bank, dated February 10, 2012, as amended through March 19, 2014 | |
| 10.29* | Security Agreement between Tenrox Inc. and Comerica Bank, dated February 10, 2012, as amended through December 6, 2013 | |
| 10.30* | Unconditional Guaranty by Marex Group, Inc., dated May 16, 2013 | |
| 10.31* | Unconditional Guaranty by LMR Solutions LLC, dated December 3, 2012 | |
| 10.32* | Unconditional Guaranty by PowerSteering Software Inc., dated February 10, 2012 | |
| 10.33* | Unconditional Guaranty by Tenrox Inc., dated February 10, 2012 | |
| 10.34* | Unconditional Guaranty by the Registrant, dated February 10, 2012 | |
| 10.35* | Amendment to and Affirmation of Guaranty Documents and Waiver by Tenrox Inc. for the benefit of Comerica Bank, dated April 11, 2013 | |
| 10.36* | Series C Preferred Stock Purchase Agreement among the Registrant and the Investors listed on the Schedule of Investors thereto, dated December 20, 2013 | |
| 10.37* | Amended and Restated Technology Services Agreement between the Registrant and DevFactory FZ-LLC, dated January 1, 2014 | |
| 10.38* | Letter Agreement between the Registrant and DevFactory FZ-LLC, dated January 1, 2014 | |
| 10.39* | Stock Purchase Agreement between the Registrant and DevFactory FZ-LLC, dated January 27, 2014 | |
| 10.40* | Note Purchase Agreement between the Registrant and the Investors listed on Schedule I thereto, dated October 9, 2013, as amended | |
| 21.1* | List of subsidiaries of the Registrant. | |
| 23.1 | Consent of Ernst & Young LLP, Independent Registered Public Accounting Firm. | |
| 23.2 | Consent of Holtzman Partners, LLP, Independent Public Accounting Firm. | |
| 23.3 | Consent of Blackman & Associates, P.C. | |
| 23.4* | Consent of Wilson Sonsini Goodrich & Rosati, Professional Corporation (included in Exhibit 5.1). | |
| 24.1* | Power of Attorney (see page II-10 to the original filing of this registration statement on Form S-1). | |
| * | Previously filed. |
| + | Indicates management contract or compensatory plan. |