Attached files
| file | filename |
|---|---|
| EXCEL - IDEA: XBRL DOCUMENT - STILLWATER MINING CO /DE/ | Financial_Report.xls |
| EX-95 - MINE SAFETY DISCLOSURES - STILLWATER MINING CO /DE/ | swc-09302014x10xqxexhibit95.htm |
| EX-32.1 - SECTION 1350 CERTIFICATION, DATED NOVEMBER 5, 2014 - STILLWATER MINING CO /DE/ | swc-09302014x10xqxexhibit321.htm |
| EX-31.2 - CERTIFICATION OF THE CFO, PURSUANT TO THE SECTION 302 OF THE SARBANES-OXLEY ACT - STILLWATER MINING CO /DE/ | swc-09302014x10xqxexhibit312.htm |
| EX-32.2 - SECTION 1350 CERTIFICATION, DATED NOVEMBER 5, 2014 - STILLWATER MINING CO /DE/ | swc-09302014x10xqxexhibit322.htm |
| EX-10.2 - MASTER GOODS AND SERVICES AGREE. SWC AND JM DTD JULY 1, 2014 - STILLWATER MINING CO /DE/ | swc-09302014x10xqxexhibit102.htm |
| EX-10.3 - PRECIOUS METALS SUPPLY AGREE SWC AND JM DTD JULY 1, 2014 - STILLWATER MINING CO /DE/ | swc-09302014x10xqxexhibit103.htm |
| EX-31.1 - CERTIFICATION OF THE CEO, PURSUANT TO THE SECTION 302 OF THE SARBANES-OXLEY ACT - STILLWATER MINING CO /DE/ | swc-09302014x10xqxexhibit311.htm |
UNITED STATES
SECURITIES AND EXCHANGE COMMISSION
Washington, D.C. 20549
FORM 10-Q
ý Quarterly Report Pursuant to Section 13 or 15(d) of the Securities Exchange Act of 1934
For the quarterly period ended September 30, 2014.
OR
o Transition Report Pursuant to Section 13 or 15(d) of the Securities Exchange Act of 1934
For the transition period from to
Commission file number 1-13053
STILLWATER MINING COMPANY
(Exact name of registrant as specified in its charter)
Delaware | 81-0480654 | |
(State or other jurisdiction of incorporation or organization) | (I.R.S. Employer Identification No.) | |
1321 Discovery Drive, Billings Montana 59102
(Address of principal executive offices and zip code)
(406) 373-8700
(Registrant’s telephone number, including area code)
Indicate by check mark whether the registrant: (1) has filed all reports required to be filed by Section 13 or 15(d) of the Securities Exchange Act of 1934 during the preceding 12 months (or for such shorter period that the registrant was required to file such reports), and (2) has been subject to such filing requirements for the past 90 days: YES ý NO o
Indicate by check mark whether the registrant has submitted electronically and posted on its corporate Web site, if any, every Interactive Data File required to be submitted and posted pursuant to Rule 405 of Regulation S-T (§232.405 of this chapter) during the preceding 12 months (or for such shorter period that the registrant was required to submit and post such files). YES ý NO o
Indicate by check mark whether the registrant is a large accelerated filer, an accelerated filer, a non-accelerated filer, or a smaller reporting company. See definitions of “large accelerated filer,” “accelerated filer” and “smaller reporting company” in Rule 12b-2 of the Exchange Act. (Check one).
Large Accelerated Filer | ý | Accelerated Filer | ¨ | |||
Non-Accelerated Filer | ¨ | Smaller reporting company | ¨ | |||
Indicate by check mark whether the registrant is a shell company (as defined in Rule 12b-2 of the Exchange Act)
YES o NO ý
At October 31, 2014, the Company had outstanding 120,179,345 shares of common stock, par value $0.01 per share.
STILLWATER MINING COMPANY
FORM 10-Q
QUARTER ENDED SEPTEMBER 30, 2014
INDEX
Item 1. | ||
Item 2. | ||
Item 3. | ||
Item 4. | ||
Item 1. | ||
Item 1A. | ||
Item 4. | ||
Item 6. | ||
2
PART I – FINANCIAL INFORMATION
ITEM 1
CONSOLIDATED FINANCIAL STATEMENTS
Stillwater Mining Company
Consolidated Statements of Comprehensive Income (Loss)
(Unaudited)
Three Months Ended | Nine Months Ended | ||||||||||||||
September 30, | September 30, | ||||||||||||||
(In thousands, except per share data) | 2014 | 2013 | 2014 | 2013 | |||||||||||
REVENUES | |||||||||||||||
Mine Production | $ | 137,067 | $ | 123,193 | $ | 409,967 | $ | 364,249 | |||||||
PGM Recycling | 109,509 | 156,814 | 305,760 | 432,897 | |||||||||||
Other | 5,490 | — | 5,725 | — | |||||||||||
Total revenues | 252,066 | 280,007 | 721,452 | 797,146 | |||||||||||
COSTS AND EXPENSES | |||||||||||||||
Costs of metals sold | |||||||||||||||
Mine Production | 85,240 | 83,913 | 252,730 | 237,042 | |||||||||||
PGM Recycling | 106,801 | 136,843 | 297,773 | 402,859 | |||||||||||
Other | 5,278 | — | 5,357 | — | |||||||||||
Total costs of metals sold (excludes depletion, depreciation and amortization) | 197,319 | 220,756 | 555,860 | 639,901 | |||||||||||
Depletion, depreciation and amortization | |||||||||||||||
Mine Production | 16,923 | 15,057 | 49,373 | 43,824 | |||||||||||
PGM Recycling | 258 | 285 | 761 | 804 | |||||||||||
Total depletion, depreciation and amortization | 17,181 | 15,342 | 50,134 | 44,628 | |||||||||||
Total costs of revenues | 214,500 | 236,098 | 605,994 | 684,529 | |||||||||||
Marketing | 84 | 207 | 622 | 4,197 | |||||||||||
Exploration | 659 | 2,143 | 2,379 | 10,247 | |||||||||||
Proxy contest | — | — | — | 4,307 | |||||||||||
Accelerated equity based compensation for change-in-control | — | — | — | 9,063 | |||||||||||
Reorganization | — | — | 6,045 | — | |||||||||||
General and administrative | 9,967 | 9,420 | 27,395 | 36,038 | |||||||||||
Loss on long-term investments | 59 | 112 | 59 | 1,766 | |||||||||||
Impairment of non-producing mineral properties and property, plant and equipment | — | 290,417 | — | 290,417 | |||||||||||
(Gain) Loss on disposal of property, plant and equipment | 39 | 66 | (262 | ) | 106 | ||||||||||
Total costs and expenses | 225,308 | 538,463 | 642,232 | 1,040,670 | |||||||||||
OPERATING INCOME (LOSS) | 26,758 | (258,456 | ) | 79,220 | (243,524 | ) | |||||||||
OTHER INCOME (EXPENSE) | |||||||||||||||
Other | 785 | 8 | 849 | 1,170 | |||||||||||
Interest income | 931 | 1,102 | 2,750 | 3,516 | |||||||||||
Interest expense | (6,018 | ) | (5,556 | ) | (17,737 | ) | (17,646 | ) | |||||||
Foreign currency transaction gain, net | 998 | 6,220 | 5,359 | 15,679 | |||||||||||
INCOME (LOSS) BEFORE INCOME TAX PROVISION | 23,454 | (256,682 | ) | 70,441 | (240,805 | ) | |||||||||
Income tax (provision) benefit | (5,619 | ) | 54,698 | (15,909 | ) | 47,468 | |||||||||
NET INCOME (LOSS) | $ | 17,835 | $ | (201,984 | ) | $ | 54,532 | $ | (193,337 | ) | |||||
Net loss attributable to noncontrolling interest | (313 | ) | (489 | ) | (1,083 | ) | (1,117 | ) | |||||||
NET INCOME (LOSS) ATTRIBUTABLE TO COMMON STOCKHOLDERS | $ | 18,148 | $ | (201,495 | ) | $ | 55,615 | $ | (192,220 | ) | |||||
Other comprehensive income (loss), net of tax | |||||||||||||||
Net unrealized gains (losses) on investments available-for-sale | (183 | ) | 219 | (42 | ) | 288 | |||||||||
COMPREHENSIVE INCOME (LOSS) ATTRIBUTABLE TO COMMON STOCKHOLDERS | $ | 17,965 | $ | (201,276 | ) | $ | 55,573 | $ | (191,932 | ) | |||||
Comprehensive loss attributable to noncontrolling interest | (313 | ) | (489 | ) | (1,083 | ) | (1,117 | ) | |||||||
TOTAL COMPREHENSIVE INCOME (LOSS) | $ | 17,652 | $ | (201,765 | ) | $ | 54,490 | $ | (193,049 | ) | |||||
Weighted average common shares outstanding | |||||||||||||||
Basic | 120,067 | 119,153 | 119,849 | 118,347 | |||||||||||
Diluted | 156,391 | 119,153 | 156,045 | 118,347 | |||||||||||
Basic earnings (loss) per share attributable to common stockholders | $ | 0.15 | $ | (1.69 | ) | $ | 0.46 | $ | (1.62 | ) | |||||
Diluted earnings (loss) per share attributable to common stockholders | $ | 0.14 | $ | (1.69 | ) | $ | 0.43 | $ | (1.62 | ) | |||||
See accompanying notes to consolidated financial statements
3
Stillwater Mining Company
Consolidated Balance Sheets
(Unaudited)
September 30, | December 31, | ||||||
(In thousands, except share and per share data) | 2014 | 2013 | |||||
ASSETS | |||||||
Current assets | |||||||
Cash and cash equivalents | $ | 257,617 | $ | 286,687 | |||
Investments, at fair market value | 251,491 | 209,338 | |||||
Inventories | 154,144 | 158,650 | |||||
Trade receivables | 1,244 | 8,988 | |||||
Deferred income taxes | 18,838 | 21,547 | |||||
Prepaids | 4,476 | 3,912 | |||||
Other current assets | 14,854 | 14,757 | |||||
Total current assets | 702,664 | 703,879 | |||||
Mineral properties | 159,252 | 159,252 | |||||
Mine development, net | 394,410 | 346,346 | |||||
Property, plant and equipment, net | 117,407 | 124,731 | |||||
Deferred debt issuance costs | 6,367 | 7,945 | |||||
Other noncurrent assets | 4,359 | 4,527 | |||||
Total assets | $ | 1,384,459 | $ | 1,346,680 | |||
LIABILITIES AND EQUITY | |||||||
Current liabilities | |||||||
Accounts payable | $ | 25,653 | $ | 32,088 | |||
Accrued compensation and benefits | 29,664 | 30,646 | |||||
Property, production and franchise taxes payable | 13,424 | 14,495 | |||||
Current portion of long-term debt and capital lease obligations | 2,116 | 2,035 | |||||
Income taxes payable | 5,204 | 4,416 | |||||
Other current liabilities | 9,665 | 5,368 | |||||
Total current liabilities | 85,726 | 89,048 | |||||
Long-term debt and capital lease obligations | 290,140 | 308,667 | |||||
Deferred income taxes | 68,005 | 79,159 | |||||
Accrued workers compensation | 6,167 | 6,031 | |||||
Asset retirement obligation | 9,209 | 8,654 | |||||
Other noncurrent liabilities | 11,434 | 7,262 | |||||
Total liabilities | 470,681 | 498,821 | |||||
EQUITY | |||||||
Stockholders’ equity | |||||||
Preferred stock, $0.01 par value, 1,000,000 shares authorized; none issued | — | — | |||||
Common stock, $0.01 par value, 200,000,000 shares authorized; 120,123,275 and 119,466,449 shares issued and outstanding | 1,201 | 1,195 | |||||
Paid-in capital | 1,087,623 | 1,076,200 | |||||
Accumulated deficit | (193,821 | ) | (249,436 | ) | |||
Accumulated other comprehensive income | (36 | ) | 6 | ||||
Total stockholders’ equity | 894,967 | 827,965 | |||||
Noncontrolling interest | 18,811 | 19,894 | |||||
Total equity | 913,778 | 847,859 | |||||
Total liabilities and equity | $ | 1,384,459 | $ | 1,346,680 | |||
See accompanying notes to consolidated financial statements
4
Stillwater Mining Company
Consolidated Statements of Cash Flows
(Unaudited)
Nine Months Ended | ||||||||
September 30, | ||||||||
(In thousands) | 2014 | 2013 | ||||||
CASH FLOWS FROM OPERATING ACTIVITIES | ||||||||
Net income (loss) | $ | 54,532 | $ | (193,337 | ) | |||
Adjustments to reconcile net income (loss) to net cash provided by operating activities: | ||||||||
Depletion, depreciation and amortization | 50,134 | 44,628 | ||||||
(Gain) Loss on disposal of property, plant and equipment | (262 | ) | 106 | |||||
Impairment of non-producing mineral properties and property, plant and equipment | — | 290,417 | ||||||
Loss on long-term investments | 59 | 1,766 | ||||||
Amortization/accretion on investment premium/discount | 1,441 | 2,471 | ||||||
Deferred taxes | (3,229 | ) | (60,743 | ) | ||||
Foreign currency transaction gain, net | (5,359 | ) | (15,679 | ) | ||||
Accretion of asset retirement obligation | 554 | 512 | ||||||
Amortization of deferred debt issuance costs | 1,929 | 1,294 | ||||||
Accretion of convertible debenture debt discount | 12,746 | 11,722 | ||||||
Accelerated equity based compensation for change-in-control | — | 9,063 | ||||||
Share based compensation and other benefits | 10,238 | 13,673 | ||||||
Non-cash capitalized interest | (2,381 | ) | (1,918 | ) | ||||
Changes in operating assets and liabilities: | ||||||||
Inventories | 2,657 | (28,961 | ) | |||||
Trade receivables | 7,744 | (8,786 | ) | |||||
Prepaids | (564 | ) | (1,373 | ) | ||||
Accrued compensation and benefits | (986 | ) | 989 | |||||
Accounts payable | (7,088 | ) | 2,270 | |||||
Property, production and franchise taxes payable | 3,102 | 1,330 | ||||||
Income taxes payable | 788 | 9,454 | ||||||
Accrued workers compensation | 136 | 36 | ||||||
Other operating assets | 559 | (2,644 | ) | |||||
Other operating liabilities | 4,943 | 5,411 | ||||||
NET CASH PROVIDED BY OPERATING ACTIVITIES | 131,693 | 81,701 | ||||||
CASH FLOWS FROM INVESTING ACTIVITIES | ||||||||
Capital expenditures | (87,038 | ) | (91,187 | ) | ||||
Proceeds from disposal of property, plant and equipment | 323 | 126 | ||||||
Purchases of investments | (174,941 | ) | (116,769 | ) | ||||
Proceeds from maturities of investments | 131,441 | 147,103 | ||||||
NET CASH USED IN INVESTING ACTIVITIES | (130,215 | ) | (60,727 | ) | ||||
CASH FLOWS FROM FINANCING ACTIVITIES | ||||||||
Payments on debt and capital lease obligations | (31,536 | ) | (165,714 | ) | ||||
Issuance of common stock | 988 | 115 | ||||||
NET CASH USED IN FINANCING ACTIVITIES | (30,548 | ) | (165,599 | ) | ||||
CASH AND CASH EQUIVALENTS | ||||||||
Net decrease | (29,070 | ) | (144,625 | ) | ||||
Balance at beginning of period | 286,687 | 379,680 | ||||||
BALANCE AT END OF PERIOD | $ | 257,617 | $ | 235,055 | ||||
See accompanying notes to consolidated financial statements
5
Stillwater Mining Company
Notes to Consolidated Financial Statements
(Unaudited)
NOTE 1
GENERAL
In the opinion of management, the accompanying unaudited consolidated financial statements contain all adjustments (consisting only of normal recurring adjustments) necessary to present fairly the financial position of Stillwater Mining Company (the “Company”) at September 30, 2014, the results of its operations for the three- and nine-month periods ended September 30, 2014 and 2013, and its cash flows for the nine-month period then ended. The results of operations for the first nine months of 2014 are not necessarily indicative of the results to be expected for the full year. The accompanying consolidated financial statements in this quarterly report should be read in conjunction with the consolidated financial statements and notes thereto included in the Company's previously issued 2014 Quarterly Reports on Form 10-Q and the Company's 2013 Annual Report on Form 10-K. All intercompany transactions and balances have been eliminated in consolidation.
The preparation of the Company’s consolidated financial statements in conformity with United States generally accepted accounting principles (U. S. GAAP) requires management to make estimates and assumptions that affect the amounts reported in these consolidated financial statements and accompanying notes. The more significant areas requiring the use of management’s estimates relate to mineral reserves, reclamation and environmental obligations, valuation allowance for deferred tax assets, useful lives utilized for depreciation, amortization and accretion calculations, future cash flows from long-lived assets, and fair value of derivatives and other financial instruments. Actual results could differ from these estimates.
In April 2014, the Financial Accounting Standards Board (FASB) issued Accounting Standards Update (ASU) 2014-08, Reporting Discontinued Operations and Disclosures of Disposals of Components of an Entity, which includes amendments that change the requirements for reporting discontinued operations and requires additional disclosures about discontinued operations and long-lived assets classified as held for resale. Under new guidance, only disposals representing a strategic shift in operations should be presented as discontinued operations. The guidance is effective for annual periods beginning on or after December 15, 2014. The Company is evaluating the effect this standard may have on its consolidated financial statements.
On May 28, 2014, the FASB issued Accounting Standards Update (ASU) No. 2014-09, Revenue from Contracts with Customers, which requires an entity to recognize the amount of revenue it expects to be entitled to receive in return for the transfer of promised goods or services to customers. The new standard becomes effective on January 1, 2017, and will replace most existing revenue recognition guidance in U.S. GAAP. This updated standard permits the use of either the retrospective or cumulative effect transition method. The Company is evaluating the effect that ASU 2014-09 will have on its consolidated financial statements and disclosures and has not yet selected a transition method nor has it determined the effect of the standard on its ongoing financial reporting. Early application of the updated standard is not permitted.
The Company reclassified items previously included in Other to Other operating assets and Other operating liabilities for the period ended September 30, 2013, for presentation purposes within the operating activities section of the Company's Consolidated Statements of Cash Flows.
NOTE 2
SALES
MINE PRODUCTION
The Company mines and processes ore from its Montana operations containing palladium, platinum, rhodium, gold, silver, copper and nickel into intermediate and final products for sale to customers. Palladium, platinum, rhodium, gold and silver are sent to a third party refiner for final processing from where they are sold to consumers and dealers with whom the Company has established trading relationships. Refined platinum group metals (PGMs) in sponge form are transferred upon sale from the Company’s account at the third party refiner to the account of the purchaser. By-product metals are normally sold at market prices to customers, brokers or outside refiners. Sales of copper and nickel by-products typically reflect a discount from market prices. By-product sales are included in revenues from Mine Production. During the third quarters of 2014 and 2013, total by-product (copper, nickel, gold, silver and mined rhodium) sales were $6.9 million and $6.7 million, respectively. During the first nine months of 2014 and 2013, total by-product sales were $22.2 million and $21.1 million, respectively.
In the first half of 2014, all Company sales of mined PGMs were either in the spot market or under mutually agreed short-term (one year or less) supply agreements. On July 1, 2014, the Company executed five-year supply and refining agreements with Johnson Matthey.
6
Under the terms of these new agreements, Johnson Matthey has an exclusive five-year right to refine all of the PGM filter cake the Company produces at its Columbus, Montana facilities. Johnson Matthey also has the right to purchase all of the Company's mine production of palladium and platinum at competitive market prices (except for platinum sales under the Company's sales agreement with Tiffany, which are specifically excluded from the Johnson Matthey agreements) and has the right to bid for any recycling volumes the Company has available. Other provisions of the agreements include a good-faith effort by Johnson Matthey to assist in growing the Company's recycling volumes and the sharing of market intelligence to the extent permitted by law. The Company has the right to exit the Johnson Matthey PGM supply arrangement in return for the payment of a nominal fee. In addition, the Company, in its sole discretion, may elect to terminate the refining arrangement after four years.
In accordance with U.S. GAAP, the Company recognizes revenue when persuasive evidence of an arrangement exists, delivery has occurred either physically or through an irrevocable transfer of metals to customers’ accounts, the price is fixed or determinable, no related obligations remain and collectability is probable.
PGM RECYCLING
The Company purchases spent catalyst materials from third parties and processes this material within its facilities in Columbus, Montana, to recover palladium, platinum and rhodium for sale. It also accepts material supplied from third parties on a tolling basis, processing it for a fee and returning the recovered metals to the supplier. The Company has entered into sourcing arrangements for catalyst materials with various suppliers. Under these sourcing arrangements as currently structured, the Company may advance cash against a shipment of material shortly before actually receiving the physical shipment at its processing facility in Columbus, Montana. These advances are included in Other current assets on the Company’s Consolidated Balance Sheets until such time as the material has been physically received and title has transferred to the Company at which time the advance is reclassified into Inventories. Finance charges collected on advances and inventories prior to being earned are included in Other current liabilities on the Company’s Consolidated Balance Sheets. Finance charges are reclassified from Other current liabilities to Interest income ratably from the time the cash advance was made until the out-turn date of the inventory from the final refiner.
OTHER
Periodically, the Company acquires PGMs in the open market for resale to third parties. The Company recognized revenue of $5.3 million on PGMs acquired in the open market and simultaneously resold to third parties during the quarter ended September 30, 2014. This revenue is shown as Other revenue and the associated acquisition cost is shown as Other costs of metals sold in the Consolidated Statements of Comprehensive Income (Loss).
TOTAL SALES
Total sales to significant customers as a percentage of total revenues for the three- and nine-month periods ended September 30, 2014 and 2013 were as follows:
Three Months Ended | Nine Months Ended | |||||||||||
September 30, | September 30, | |||||||||||
2014 (1) | 2013 (1) | 2014 (1) | 2013 (1) | |||||||||
Customer A | 67 | % | 14 | % | 45 | % | 14 | % | ||||
Customer B | 10 | % | 30 | % | 16 | % | 28 | % | ||||
Customer C | — | 14 | % | — | 14 | % | ||||||
Customer D | — | — | — | 13 | % | |||||||
77 | % | 58 | % | 61 | % | 69 | % | |||||
(1) The “—” symbol represents less than 10% of total revenues.
7
NOTE 3
ASSET IMPAIRMENT
The Company reviews and evaluates its long-lived assets for impairment when events and changes in circumstances indicate that the related carrying amounts of its assets may not be recoverable. Impairment is considered to exist if the total estimated future cash flows on an undiscounted basis are less than the carrying amount of the asset.
The Company determined there were no material events or changes in circumstances requiring the Company to test long-lived assets for impairment at September 30, 2014. However, during the third quarter of 2013, the Company recorded a $290.4 million (before-tax) impairment in the carrying value of the Altar mineral property in Argentina, reducing the carrying value to its estimated fair market value of $102.0 million. At December 31, 2013, the Company recorded a $171.4 million (before-tax) impairment in the carrying value of the Marathon assets, reducing the carrying value to their estimated fair value of $57.2 million.
NOTE 4
NONCONTROLLING INTEREST
In 2012, the Company entered into an agreement with Mitsubishi Corporation (Mitsubishi) in which a Mitsubishi subsidiary acquired a 25% interest in the Company's wholly-owned subsidiary, Stillwater Canada Inc (SCI), which owns the Marathon PGM-copper project and related properties, for approximately $81.25 million in cash and contributed an additional $13.6 million to satisfy Mitsubishi's portion of the venture's initial cash call. Mitsubishi is responsible for funding 25% of the operating, capital and exploration expenditures on the Marathon properties and has agreed to cooperate and support efforts to secure project financing for Marathon. Mitsubishi will have an option to purchase up to 100% of Marathon's future PGM production under a related supply agreement at a discount to market. The change in the Company's equity as a result of the sale of the noncontrolling interest in SCI was an increase to Additional paid in capital of $42.5 million, offset in part by expenses incurred of $1.1 million.
Mitsubishi's 25% interest in the SCI net loss in each period is shown as Net loss attributable to noncontrolling interest in the Company's Consolidated Statements of Comprehensive Income (Loss). The amount of this loss is added back to the Company's reported Net income (loss) in each period in arriving at Net income (loss) attributable to common stockholders. The reported Net loss attributable to noncontrolling interest for the third quarters of 2014 and 2013 was $0.3 million and $0.5 million, respectively; for the first nine months of 2014 and 2013, it was $1.1 million in total for each period.
Mitsubishi's share of the equity in SCI is reflected as Noncontrolling interest in the Company's Consolidated Balance Sheets and totaled $18.8 million and $19.9 million at September 30, 2014 and December 31, 2013, respectively.
NOTE 5
DERIVATIVE INSTRUMENTS
The Company uses various derivative financial instruments to manage its exposure to changes in interest rates and PGM market commodity prices. Some of these derivatives are designated as hedges. Because the Company hedges only with instruments that have a high correlation with the value of the underlying exposures, changes in the derivatives’ fair value are expected to be offset by changes in the value of the hedged transaction.
COMMODITY DERIVATIVES
Mine Production
The Company had no derivative instruments outstanding pertaining to its mined production during the nine-month periods ended September 30, 2014 or 2013.
PGM Recycling
The Company customarily enters into fixed forward sales relating to PGM recycling of catalyst materials. The metals from PGM recycled materials are sold forward at the time of purchase and delivered against the fixed forward contracts when the ounces are recovered. Because the forward price is also used to determine the acquisition price, this arrangement significantly reduces exposure to PGM price volatility. The Company believes such transactions qualify for the exception to derivative accounting treatment and so has elected to account for these transactions as normal sales.
If the Company is unable to complete the processing of the recycled material by the contractual delivery date, it may acquire finished metal in the open market. If finished metal is acquired in the open market, the Company bears the risk of any changes in the acquisition price relative to the price stipulated in the delivery contract.
8
All of the fixed forward sales contracts open at September 30, 2014, will settle at various periods through March 2015. The Company has credit agreements with its major trading partners that provide for margin deposits in the event that forward prices for metals exceed the Company’s contractual hedged prices by a predetermined margin limit. At September 30, 2014, no such margin deposits were outstanding or due.
The following is a summary of the Company's commodity derivatives in place at September 30, 2014:
PGM Recycling: | |||||||||||||||||||||
Fixed Forward Contracts | Platinum | Palladium | Rhodium | ||||||||||||||||||
Settlement Period | Ounces | Average Price/Ounce | Ounces | Average Price/Ounce | Ounces | Average Price/Ounce | |||||||||||||||
Fourth Quarter 2014 | 26,291 | $ | 1,450 | 43,735 | $ | 862 | 6,395 | $ | 1,192 | ||||||||||||
First Quarter 2015 | 3,843 | $ | 1,376 | 4,532 | $ | 846 | 1,610 | $ | 1,289 | ||||||||||||
NOTE 6
SHARE-BASED COMPENSATION
STOCK PLANS
The Company sponsors stock plans (the “Plans”) that enable the Company to grant stock options or other equity based compensation to employees and non-employee directors. Effective March 2011, the Company ceased offering stock options as incentive compensation to employees and non-employee directors, and began to issue only cash awards or restricted stock units in lieu of stock options. The Company continues to have previously issued stock options that remain outstanding under two separate plans: the General Employee Plan and the 2004 Equity Incentive Plan. In April 2012, the Company's stockholders approved the 2012 Equity Incentive Plan. At inception of the plans, approximately 11.6 million shares of common stock were authorized for issuance under the Plans, including approximately 5.0 million, 5.2 million, and 1.4 million authorized shares for the 2012 Equity Incentive Plan, 2004 Equity Incentive Plan, and the General Employee Plan, respectively. The 1998 Incentive Plan and the General Employee Plan have been terminated and no additional options, shares or units may be issued under these two terminated plans. Approximately 4.3 million shares were available and reserved for grant under the 2012 Equity Incentive Plan at September 30, 2014.
The Compensation Committee of the Company’s Board of Directors administers the Plans and determines the type of equity awards to be issued, the exercise period, vesting period and all other terms of instruments issued under the Plans. Employees’ options and time-based restricted stock units vest in equal annual installments over a three-year period after date of grant. Options expire ten years after the date of grant. Certain of the Company's equity incentive plans and award agreements contain "change in control" provisions which provide that, among other triggering events, a "change in control" occurs if following the election of new directors to the Board of Directors, a majority of the members of the Board of Directors are not considered "incumbent directors."
Historically, the Company recognized compensation expense associated with its stock option grants based on their fair market value on the date of grant as determined, using a Black-Scholes option pricing model. Unless vesting was accelerated due to a change in control or other event, the Company recognized stock option expense ratably over the vesting period of the options and if the options were canceled or forfeited prior to vesting, the Company stopped recognizing the related expense effective with the date of forfeiture.
There was no compensation expense associated with stock option grants recorded for the three- and nine-month periods ended September 30, 2014. All outstanding, unvested stock options fully vested in the second quarter of 2013 due to the change in control event associated with the proxy contest in connection with the Company's 2013 annual stockholders meeting. There was no compensation expense related to the fair value of stock options during the three- month period ended September 30, 2013, and for the nine-month period ended September 30, 2013, compensation expense was approximately $41,400. The compensation expense for prior periods was recorded in General and administrative in the Company's Consolidated Statements of Comprehensive Income (Loss). The Company received approximately $1.0 million in cash from the exercise of stock options in the nine-month period ended September 30, 2014, and approximately $0.1 million in the comparable period in 2013.
9
NONVESTED SHARES
Time-Based and Performance-Based Restricted Stock Unit Awards
The 2012 Equity Incentive Plan allows for the grant of time-based and performance-based restricted stock unit awards. A performance-based restricted stock unit award provides the participant with the right to receive a number of shares of the Company's stock depending on achievement of specific measurable performance criteria. In the period it becomes probable that the performance criteria will be achieved, the Company recognizes expense for the proportionate share of the total fair value of the grant related to the vesting period that has already lapsed. The remaining cost of the grant is expensed over the balance of the vesting period. In the event the Company determines it is no longer probable that it will achieve the minimum performance criteria specified in the Plan, the Company reverses all of the previously recognized compensation expense in the period such a determination is made. Time-based and performance-based awards are not entitled to any dividend equivalents with respect to the restricted stock units nor any dividends on stock that may be delivered in settlement of the restricted stock units unless and until the stock is issued in settlement of the restricted stock units.
The following table summarizes the status of and changes in the Company’s nonvested shares during the first nine months of 2014:
Nonvested Shares | Weighted-Average Grant-Date Fair Value | ||||||
Nonvested shares at January 1, 2014 | 31,057 | $ | 11.55 | ||||
Granted | 563,375 | 14.66 | |||||
Vested | — | — | |||||
Forfeited | (200 | ) | 11.81 | ||||
Nonvested shares at March 31, 2014 | 594,232 | $ | 14.50 | ||||
Granted | 4,181 | 15.89 | |||||
Vested | (32,134 | ) | 13.88 | ||||
Forfeited | (37,997 | ) | 14.31 | ||||
Nonvested shares at June 30, 2014 | 528,282 | $ | 14.55 | ||||
Granted | 2,245 | 18.13 | |||||
Vested | (932 | ) | 11.57 | ||||
Forfeited | (4,736 | ) | 14.11 | ||||
Nonvested shares at September 30, 2014 | 524,859 | $ | 14.56 | ||||
At September 30, 2014, the Company had 310,623 and 214,236 outstanding nonvested time-based and performance-based restricted stock units, respectively. Total compensation expense related to grants of nonvested shares was $0.6 million and $3,300 in the three-month periods ended September 30, 2014 and 2013, respectively. Compensation expense related to grants of nonvested shares was $2.2 million and $14.6 million in the nine-month periods ended September 30, 2014 and 2013, respectively. The $12.4 million decrease in compensation expense is related to the accelerated vesting of the unvested shares in the second quarter of 2013 in conjunction with change of control events. Compensation expense is recorded in General and administrative in the Company's Consolidated Statements of Comprehensive Income (Loss).
The following table presents the compensation expense of the nonvested shares outstanding at September 30, 2014, to be recognized over the remaining vesting periods:
(In millions) | Compensation Expense | |||
Remaining 2014 | $ | 0.7 | ||
2015 | 2.5 | |||
2016 | 2.5 | |||
2017 | 0.1 | |||
Total | $ | 5.8 | ||
10
NOTE 7
INCOME TAXES
The Company determines income taxes using the asset and liability method, which results in the recognition of deferred tax assets and liabilities for the expected future tax consequences of temporary differences between the carrying amount and the tax basis of those assets and liabilities, as well as operating loss and tax carryforwards, using enacted tax rates in effect in the years in which the differences are expected to reverse. The effect on deferred tax assets and liabilities of a change in tax rates is recognized in income in the period that includes the enactment date. Deferred tax assets and liabilities are recorded on a jurisdictional basis.
At September 30, 2014, the Company has approximately $121.1 million of regular federal tax net operating loss carryforwards in the U.S. expiring from 2020 through 2028. Usage of $91.1 million of these net operating losses is limited to approximately $10.2 million annually as a result of the change in control of the Company that occurred in connection with the Norilsk Nickel transaction in 2003. The Company has $31.7 million of alternative minimum tax credit carryforwards which will not expire and $1.2 million in general business credits expiring during 2031 to 2033. The Company has approximately $2.9 million of state tax net operating loss carryforwards expiring during 2020 through 2029. The Company also has $52.7 million of foreign net operating loss carryforwards. The foreign net operating losses expire as follows: $20.6 million during 2014 to 2019 and $23.4 million during 2024 to 2034. Currently, $8.7 million of foreign net operating losses have an indefinite life.
In assessing the realizability of deferred tax assets, management considers whether it is more likely than not that some portion or all of the deferred tax assets will not be realized. Management considers the scheduled reversal of deferred tax liabilities, projected future taxable income and tax planning strategies in making this assessment. The Company has a valuation allowance in 2014 and 2013 that reflects the estimated amount of deferred tax assets which may not be realized, which principally relate to foreign and state net operating losses, capital losses, and certain tax credits.
The provision for income taxes for the three- and nine-month periods ended September 30, 2014 and 2013, consists of U.S. Federal income tax, state tax expense, and deferred tax benefit from certain foreign jurisdictions. Changes in the Company’s net deferred tax assets and liabilities have been partially offset by a corresponding change in the valuation allowance.
The Company recognized an income tax (provision)/benefit of $(5.6) million and $54.7 million for the three-month periods ended September 30, 2014 and 2013, respectively, and $(15.9) million and $47.5 million for the nine-month periods ended September 30, 2014 and 2013, respectively.
The Company’s policy is to recognize interest and penalties on unrecognized tax benefits in Income tax (provision) benefit in the Company's Consolidated Statements of Comprehensive Income (Loss). The interest and penalties accrued at September 30, 2014, were $0.8 million. There were no interest or penalties in the same period of 2013. The Company made income tax payments of $14.2 million and $2.4 million in the nine-month periods ended September 30, 2014 and 2013, respectively. Tax years still open for examination by the taxing authorities are the years ended December 31, 2013, 2012 and 2011, although net operating loss and credit carryforwards from all years are subject to examination and adjustment for the three years following the year in which the carryforwards are utilized.
NOTE 8
DEBT AND CAPITAL LEASE OBLIGATIONS
1.875% CONVERTIBLE DEBENTURES
In March 2008, the Company issued and sold $181.5 million aggregate principal amount of 1.875% senior unsecured convertible debentures due March 15, 2028, with interest payable semi-annually. Each $1,000 principal amount of the 1.875% debentures is initially convertible, at the option of the holders, into approximately 42.5351 shares of the Company’s common stock, at any time prior to the maturity date. The conversion rate is subject to certain adjustments, but will not be adjusted for accrued interest or any unpaid interest. The conversion rate initially represents a conversion price of $23.51 per share.
In October 2009, the Company exchanged $15.0 million face amount of the 1.875% debentures for 1.84 million shares of the Company's common stock, leaving $166.5 million aggregate principal amount. In March 2013, the holders of $164.3 million principal amount of the 1.875% debentures exercised their option to require the Company to redeem their 1.875% debentures at face value. The holders of the remaining $2.2 million of debentures may require the Company to redeem their 1.875% debentures at face value on March 15, 2018, or March 15, 2023, or at any time before March 15, 2028, upon the occurrence of certain events. The Company has the right at its discretion to redeem the remaining $2.2 million of outstanding 1.875% debentures for cash at any time prior to maturity. The outstanding balance at September 30, 2014, and December 31, 2013, is $2.2 million aggregate principal amount, reported as a long-term debt obligation.
11
There was no amortization expense related to the issuance costs of the 1.875% debentures for the three-month periods ended September 30, 2014 and 2013, nor for the nine-month period ended September 30, 2014. For the nine-month period ended September 30, 2013, the amortization expense was approximately $0.2 million. The interest expense on the 1.875% debentures was approximately $10,500 for each of the three-month periods ended September 30, 2014 and 2013. Interest expense for the nine-month periods ended September 30, 2014 and 2013, was $31,600 and $0.7 million, respectively. The Company made cash interest payments of $21,000 and $1.6 million on the 1.875% debentures for the nine-month periods ended September 30, 2014 and 2013, respectively.
1.75% CONVERTIBLE DEBENTURES
In October 2012, the Company issued $396.75 million aggregate principal amount of 1.75% senior unsecured convertible debentures due October 15, 2032 (1.75% debentures). Each $1,000 principal amount of these 1.75% debentures is initially convertible, under certain circumstances and during certain periods, into 60.4961 shares (subject to customary anti-dilution adjustments) of the Company's common stock, which represents an initial conversion price of $16.53 per share. The 1.75% debentures also include an embedded conversion enhancement feature that is equivalent to including with each debenture a warrant initially exercisable for 30.2481 shares at $16.53 per share (also subject to customary anti-dilution adjustments). The Company, at its election, may settle conversions of the 1.75% debentures in cash, shares of its common stock or any combination of cash and shares of its common stock. Holders have the right to redeem their 1.75% debentures at face value plus accrued and unpaid interest on October 15 of each of 2019, 2024, 2029, and upon the occurrence of certain corporate events. The Company will have the right to redeem the 1.75% debentures at any time on or after October 20, 2019.
The 1.75% debentures were bifurcated under U.S. GAAP into separate debt and equity components and reflect an effective maturity (to the first optional redemption date) of seven years. The residual amount of $141.6 million recorded in equity is treated for accounting purposes as additional debt discount and accreted as an additional non-cash interest charge to earnings over the expected life. Debt and equity issuance costs totaling approximately $12.4 million were deducted from the gross proceeds of the offering, and the debt portion is being amortized ratably over seven years.
The 1.75% debentures have an effective interest rate of 8.50% and a stated interest rate of 1.75% with interest paid semi-annually. The balance outstanding at September 30, 2014, and December 31, 2013, was approximately $286.8 million and $274.0 million, respectively, which is net of unamortized discount of $110.0 million and $122.8 million, respectively.
Amortization expense related to the issuance costs of the 1.75% debentures for each of the three-month periods ended September 30, 2014 and 2013, was $0.3 million and for each of the nine-month periods ended September 30, 2014 and 2013, was approximately $0.9 million. The interest expense for the three-month periods ended September 30, 2014 and 2013, was approximately $6.1 million and $5.7 million, respectively. The interest expense was approximately $17.9 million and $16.9 million for the nine-month periods ended September 30, 2014 and 2013, respectively. The Company made no cash payments for interest during the three-month periods ended September 30, 2014 and 2013. The Company made $3.5 million and $3.2 million in interest payments on the 1.75% debentures during the nine-month periods ended September 30, 2014, and 2013, respectively.
EXEMPT FACILITY REVENUE BONDS
During 2000, the Company completed a $30.0 million offering of 8.0% Exempt Facility Revenue Bonds, Series 2000. These bonds were issued by the State of Montana Board of Investments to finance a portion of the costs of constructing and equipping certain sewage and solid waste disposal facilities at both the Stillwater Mine and the East Boulder Mine. The bonds were scheduled to mature on July 1, 2020, and had a stated interest rate of 8.0% with interest paid semi-annually. Net discounted proceeds from the offering were $28.7 million, yielding an effective rate of 8.57%.
The balance outstanding on these bonds at December 31, 2013, was $29.7 million, which was net of unamortized discount of $0.3 million. The Company made $1.2 million in regularly scheduled semi-annual cash interest payments on the revenue bonds in the nine-month periods ended September 30, 2014 and 2013.
On July 7, 2014, the Company redeemed the entire $30.0 million of 8.0% Exempt Facility Revenue Bonds, Series 2000, which included accrued and unpaid interest of $40,000. The Company recognized approximately $0.7 million of debt retirement expense in the 2014 third quarter associated with unamortized debt discount and origination fees related to these revenue bonds.
12
ASSET-BACKED REVOLVING CREDIT FACILITY
In December 2011, the Company signed a $100.0 million asset-backed revolving credit agreement incurring debt issuance costs of $1.1 million. In January 2012, the Company completed the syndication of this facility and simultaneously expanded its maximum line of credit to $125.0 million, incurring additional debt issuance costs of $0.2 million. Borrowings under this working capital credit facility are limited to a borrowing base equal to the sum of 85% of eligible accounts receivable and 70% of eligible inventories. Terms of the credit agreement state that the borrowings will be secured by the Company's accounts receivable, metals inventories and other accounts. The asset-backed revolving credit facility includes a single fixed-charge coverage covenant that only takes effect when less than 30% of the total borrowing capacity under the facility remains available. The facility includes a $60.0 million letter of credit sub-facility. Outstanding borrowings under the facility accrue interest at a spread over the London Interbank Offer Rate that varies from 2.25% to 2.75%, decreasing progressively as the percentage drawn under the facility increases. The Company also pays a commitment fee on committed but unutilized borrowing capacity available under the facility at a rate per annum of 0.375% or 0.5%, depending on the amount of the facility drawn.
The Company recognized $0.3 million in fees associated with the asset-backed revolving credit agreement in each of the three-month periods ended September 30, 2014 and 2013, and $0.8 million in each of the nine-month periods ended September 30, 2014 and 2013. Amortization expense related to the issuance costs of the credit agreement was less than $0.1 million for each of the three-month periods ended September 30, 2014 and 2013, and $0.2 million for each of the nine-month periods ended September 30, 2014 and 2013. At September 30, 2014, there were no outstanding borrowings under this revolving credit facility and approximately $19.6 million in undrawn irrevocable letters of credit have been issued under this facility as collateral for sureties.
CAPITAL LEASE OBLIGATIONS
The Company entered into a lease agreement with General Electric Capital Corporation (GECC) covering the acquisition of a tunnel-boring machine (TBM) for use on the Blitz development adjacent to the Stillwater Mine. The transaction is structured as a capital lease with a four-year term maturing in 2016; lease payments are due quarterly in advance. The Company made cash payments of $1.6 million on its capital lease obligation in each of the nine-month periods ended September 30, 2014 and 2013. The cash payments for each of the nine-month periods ended September 30, 2014 and 2013, included interest of approximately $0.2 million. At September 30, 2014, and December 31, 2013, the outstanding balance under the capital lease was $3.1 million and $4.6 million, respectively.
The following is a schedule, by year, of the future minimum lease payments for the capital lease together with the present value of the net minimum lease payments:
(In thousands) | ||||
Remaining 2014 | $ | 540 | ||
2015 | 2,168 | |||
2016 | 590 | |||
Total minimum lease payments | $ | 3,298 | ||
Less interest at rates ranging from 5.21% to 5.46% (before-tax) | 153 | |||
Net minimum lease payments | $ | 3,145 | ||
Less current portion | 2,038 | |||
Total long-term capital lease obligation | $ | 1,107 | ||
CAPITALIZED INTEREST
The Company capitalizes interest incurred on its various debt instruments as a cost of specific and identified projects under development. For the three-month periods ended September 30, 2014 and 2013, the Company capitalized interest of $1.4 million and $1.2 million, respectively. For the nine-month periods ended September 30, 2014 and 2013, the Company capitalized interest of $3.6 million and $3.3 million, respectively. Capitalized interest is recorded as a reduction to Interest expense in the Company's Consolidated Statements of Comprehensive Income (Loss).
13
NOTE 9
MINERAL PROPERTIES AND MINE DEVELOPMENT
Mineral properties and mine development reflected in the accompanying balance sheets consisted of the following:
September 30, | December 31, | |||||||
(In thousands) | 2014 | 2013 | ||||||
Mineral Properties: | ||||||||
Montana, United States of America | ||||||||
Stillwater Mine | $ | 1,950 | $ | 1,950 | ||||
Ontario, Canada | ||||||||
Marathon properties | 50,915 | 50,915 | ||||||
Coldwell Complex property | 4,417 | 4,417 | ||||||
San Juan, Argentina | ||||||||
Altar property | 101,970 | 101,970 | ||||||
Mine Development: | ||||||||
Montana, United States of America | ||||||||
Stillwater Mine | $ | 595,701 | $ | 532,480 | ||||
East Boulder Mine | 197,402 | 179,263 | ||||||
$ | 952,355 | $ | 870,995 | |||||
Accumulated depletion and amortization | (398,693 | ) | (365,397 | ) | ||||
Total mineral properties and mine development, net | $ | 553,662 | $ | 505,598 | ||||
NOTE 10
PROPERTY, PLANT AND EQUIPMENT
Property, plant and equipment reflected in the accompanying balance sheets consisted of the following:
September 30, | December 31, | |||||||
(In thousands) | 2014 | 2013 | ||||||
Machinery and equipment | $ | 147,184 | $ | 138,351 | ||||
Buildings and structural components | 169,090 | 160,076 | ||||||
Land | 8,592 | 8,592 | ||||||
Construction-in-progress: | ||||||||
Stillwater Mine | 2,339 | 5,818 | ||||||
East Boulder Mine | 1,647 | 1,057 | ||||||
Marathon | 402 | 402 | ||||||
Processing facilities and other | 1,471 | 5,841 | ||||||
$ | 330,725 | $ | 320,137 | |||||
Accumulated depreciation | (213,318 | ) | (195,406 | ) | ||||
Total property, plant, and equipment, net | $ | 117,407 | $ | 124,731 | ||||
14
The Company's total capital outlay for mine development and property, plant and equipment for the nine-month periods ended September 30, 2014 and 2013, was as follows:
September 30, | September 30, | |||||||
(In thousands) | 2014 | 2013 | ||||||
Stillwater Mine | $ | 62,604 | $ | 57,185 | ||||
East Boulder Mine | 21,731 | 18,781 | ||||||
Marathon project | — | 9,189 | ||||||
Altar project | 2 | 100 | ||||||
Other | 2,701 | 5,932 | ||||||
Total capital outlay | $ | 87,038 | $ | 91,187 | ||||
NOTE 11
SEGMENT INFORMATION
The Company operates five reportable business segments: Mine Production, PGM Recycling, Canadian Properties, South American Properties and All Other. These segments are managed separately based on fundamental differences in operations and geographic separation.
The Mine Production segment consists of two business components: the Stillwater Mine and the East Boulder Mine. The Mine Production segment is engaged in the development, extraction, and processing of PGMs. The Company sells PGMs from mine production under short-term and long-term sales agreements. The financial results for the Stillwater Mine and the East Boulder Mine have been aggregated, as both have similar products, processes, customers, distribution methods and economic characteristics.
The PGM Recycling segment is engaged in the recycling of spent catalyst materials to recover the PGMs contained in the material. The Company purchases the majority of catalyst materials processed by the PGM Recycling segment from third party suppliers for its own account and sells the recovered metals directly. The PGM Recycling segment also accepts catalyst materials supplied from several third parties on a tolling basis, processing it for a fee and returning the recovered metals to the supplier. The Company allocates costs of the Company's processing facilities to both the Mine Production segment and to the PGM Recycling segment for internal and segment reporting purposes because these facilities support the PGM extraction requirements of both business segments.
The Canadian Properties segment consists of the Marathon PGM assets (which consist primarily of the Marathon project mineral property) and the Coldwell Complex (exploration mineral properties). The Marathon project mineral property is a large PGM and copper deposit located near the town of Marathon, Ontario, Canada. The Marathon project is currently in the exploration stage. The Coldwell Complex exploration mineral properties are located adjacent to the Marathon property.
The South American Properties segment consists of the Peregrine Metals Ltd. assets. The principal Peregrine property is the Altar project, a copper-gold resource, located in the San Juan province of Argentina. The Altar project is currently in the exploration stage. Financial information for this segment consists of total asset values, general and administrative costs and exploration costs.
The All Other group primarily consists of assets, including investments, revenues, and expenses of various corporate and support functions and, historically, marketing expenditures related to promoting palladium.
The Company evaluates performance and allocates resources based on income or loss before income tax provision.
15
The following financial information relates to the Company’s business segments:
(In thousands) | South American Properties | |||||||||||||||||||||||
Three Months Ended September 30, 2014 | Mine Production | PGM Recycling | Canadian Properties | All Other | Total | |||||||||||||||||||
Revenues | $ | 137,067 | $ | 109,509 | $ | — | $ | — | $ | 5,490 | $ | 252,066 | ||||||||||||
Depletion, depreciation and amortization | $ | 16,923 | $ | 258 | $ | — | $ | — | $ | — | $ | 17,181 | ||||||||||||
General and administrative expenses | $ | — | $ | — | $ | 794 | $ | 17 | $ | 9,156 | $ | 9,967 | ||||||||||||
Interest income | $ | — | $ | 681 | $ | 1 | $ | 13 | $ | 236 | $ | 931 | ||||||||||||
Interest expense | $ | — | $ | — | $ | — | $ | — | $ | 6,018 | $ | 6,018 | ||||||||||||
Income (loss) before income tax provision | $ | 34,904 | $ | 3,131 | $ | (1,205 | ) | $ | 748 | $ | (14,124 | ) | $ | 23,454 | ||||||||||
Capital expenditures | $ | 32,604 | $ | 28 | $ | — | $ | 2 | $ | 624 | $ | 33,258 | ||||||||||||
Total assets | $ | 584,538 | $ | 88,411 | $ | 76,678 | $ | 107,909 | $ | 526,923 | $ | 1,384,459 | ||||||||||||
(In thousands) | South American Properties | |||||||||||||||||||||||
Three Months Ended September 30, 2013 | Mine Production | PGM Recycling | Canadian Properties | All Other | Total | |||||||||||||||||||
Revenues | $ | 123,193 | $ | 156,814 | $ | — | $ | — | $ | — | $ | 280,007 | ||||||||||||
Depletion, depreciation and amortization | $ | 15,057 | $ | 285 | $ | — | $ | — | $ | — | $ | 15,342 | ||||||||||||
General and administrative expenses | $ | — | $ | — | $ | 245 | $ | 322 | $ | 8,853 | $ | 9,420 | ||||||||||||
Interest income | $ | — | $ | 867 | $ | 6 | $ | 23 | $ | 206 | $ | 1,102 | ||||||||||||
Interest expense | $ | — | $ | — | $ | — | $ | — | $ | 5,556 | $ | 5,556 | ||||||||||||
Income (loss) before impairment charge and income tax provision | $ | 24,223 | $ | 20,553 | $ | (1,941 | ) | $ | 5,470 | $ | (14,570 | ) | $ | 33,735 | ||||||||||
Impairment charge | $ | — | $ | — | $ | — | $ | 290,417 | $ | — | $ | 290,417 | ||||||||||||
Income (loss) after impairment charge and before income tax provision | $ | 24,223 | $ | 20,553 | $ | (1,941 | ) | $ | (284,947 | ) | $ | (14,570 | ) | $ | (256,682 | ) | ||||||||
Capital expenditures | $ | 26,425 | $ | 153 | $ | 3,036 | $ | — | $ | 1,837 | $ | 31,451 | ||||||||||||
Total assets | $ | 529,980 | $ | 110,503 | $ | 257,030 | $ | 111,113 | $ | 502,863 | $ | 1,511,489 | ||||||||||||
(In thousands) | South American Properties | |||||||||||||||||||||||
Nine Months Ended September 30, 2014 | Mine Production | PGM Recycling | Canadian Properties | All Other | Total | |||||||||||||||||||
Revenues | $ | 409,967 | $ | 305,760 | $ | — | $ | — | $ | 5,725 | $ | 721,452 | ||||||||||||
Depletion, depreciation and amortization | $ | 49,373 | $ | 761 | $ | — | $ | — | $ | — | $ | 50,134 | ||||||||||||
General and administrative expenses | $ | — | $ | — | $ | 2,783 | $ | 339 | $ | 24,273 | $ | 27,395 | ||||||||||||
Interest income | $ | — | $ | 1,998 | $ | 3 | $ | 44 | $ | 705 | $ | 2,750 | ||||||||||||
Interest expense | $ | — | $ | — | $ | — | $ | — | $ | 17,737 | $ | 17,737 | ||||||||||||
Income (loss) before income tax provision | $ | 107,864 | $ | 9,225 | $ | (3,843 | ) | $ | 2,841 | $ | (45,646 | ) | $ | 70,441 | ||||||||||
Capital expenditures | $ | 84,335 | $ | 155 | $ | — | $ | 2 | $ | 2,546 | $ | 87,038 | ||||||||||||
Total assets | $ | 584,538 | $ | 88,411 | $ | 76,678 | $ | 107,909 | $ | 526,923 | $ | 1,384,459 | ||||||||||||
16
(In thousands) | South American Properties | |||||||||||||||||||||||
Nine Months Ended September 30, 2013 | Mine Production | PGM Recycling | Canadian Properties | All Other | Total | |||||||||||||||||||
Revenues | $ | 364,249 | $ | 432,897 | $ | — | $ | — | $ | — | $ | 797,146 | ||||||||||||
Depletion, depreciation and amortization | $ | 43,824 | $ | 804 | $ | — | $ | — | $ | — | $ | 44,628 | ||||||||||||
General and administrative expenses | $ | — | $ | — | $ | 952 | $ | 2,264 | $ | 32,822 | $ | 36,038 | ||||||||||||
Interest income | $ | — | $ | 2,638 | $ | 15 | $ | 165 | $ | 698 | $ | 3,516 | ||||||||||||
Interest expense | $ | — | $ | — | $ | — | $ | — | $ | 17,646 | $ | 17,646 | ||||||||||||
Income (loss) before impairment charge and income tax provision | $ | 83,382 | $ | 31,873 | $ | (4,024 | ) | $ | 7,434 | $ | (69,053 | ) | $ | 49,612 | ||||||||||
Impairment charge | $ | — | $ | — | $ | — | $ | 290,417 | $ | — | $ | 290,417 | ||||||||||||
Income (loss) after impairment charge and before income tax provision | $ | 83,382 | $ | 31,873 | $ | (4,024 | ) | $ | (282,983 | ) | $ | (69,053 | ) | $ | (240,805 | ) | ||||||||
Capital expenditures | $ | 75,966 | $ | 285 | $ | 9,189 | $ | 100 | $ | 5,647 | $ | 91,187 | ||||||||||||
Total assets | $ | 529,980 | $ | 110,503 | $ | 257,030 | $ | 111,113 | $ | 502,863 | $ | 1,511,489 | ||||||||||||
NOTE 12
INVESTMENTS
The Company classifies the marketable securities in which it invests as available-for-sale securities. These securities are measured at fair market value in the financial statements with unrealized gains or losses recorded in Other comprehensive income in the Company's Consolidated Statements of Comprehensive Income (Loss). At the time the securities are sold or otherwise disposed of, gross realized gains and losses are included in Net income. Gross realized gains and losses are based on the carrying value (cost, net of discount or premiums) of the sold investment. The amounts reclassified out of Other comprehensive (loss) income during the three- and nine-month periods ended September 30, 2014 and 2013, were insignificant. All of the marketable securities amounts are available to satisfy current obligations.
The amortized cost, gross unrealized gains, gross unrealized losses, and fair market value of available-for-sale investment securities by major security type and class of security at September 30, 2014, and December 31, 2013 are as follows:
Investments | ||||||||||||||||||
(In thousands) | Amortized cost | Gross unrealized gains | Gross unrealized losses | Fair market value | ||||||||||||||
2014 | ||||||||||||||||||
Federal agency notes | $ | 149,073 | $ | 126 | $ | — | $ | 149,199 | ||||||||||
Commercial paper | 102,558 | 5 | (271 | ) | 102,292 | |||||||||||||
Mutual funds | 333 | 248 | — | 581 | ||||||||||||||
Total | $ | 251,964 | $ | 379 | $ | (271 | ) | $ | 252,072 | |||||||||
2013 | ||||||||||||||||||
Federal agency notes | $ | 97,509 | $ | 76 | $ | — | $ | 97,585 | ||||||||||
Commercial paper | 112,063 | 10 | (320 | ) | 111,753 | |||||||||||||
Mutual funds | 359 | 245 | — | 604 | ||||||||||||||
Total | $ | 209,931 | $ | 331 | $ | (320 | ) | $ | 209,942 | |||||||||
The mutual funds included in the investment table above are included in Other noncurrent assets on the Company's Consolidated Balance Sheets.
17
The maturities of available-for-sale securities at September 30, 2014 are as follows:
(In thousands) | Amortized cost | Fair market value | ||||||
Federal agency notes | ||||||||
Due in one year or less | $ | 60,278 | $ | 60,351 | ||||
Due after one year through two years | 88,795 | 88,848 | ||||||
Total | $ | 149,073 | $ | 149,199 | ||||
Commercial paper | ||||||||
Due in one year or less | $ | 68,896 | $ | 68,766 | ||||
Due after one year through two years | 33,662 | 33,526 | ||||||
Total | $ | 102,558 | $ | 102,292 | ||||
The Company has long-term investments in several Canadian junior exploration companies, recorded on the Company's Consolidated Balance Sheets at cost. The Company determined that certain of its long-term investments were other than temporarily impaired and recorded a loss less than $0.1 million for the quarter ended September 30, 2014. These long-term investments totaled slightly less than $1.0 million for the period ended September 30, 2014, and $1.0 million for the period ended December 31, 2013, and are recorded in Other noncurrent assets on the Company's Consolidated Balance Sheets.
NOTE 13
INVENTORIES
For purposes of inventory accounting, the market value of inventory is generally deemed equal to the Company’s current cost of replacing the inventory, provided that: (1) the market value of the inventory may not exceed the estimated selling price of such inventory in the ordinary course of business less reasonably predictable costs of completion and disposal, and (2) the market value may not be less than net realizable value reduced by an allowance for a normal profit margin. No adjustments were made to the inventory value in the first nine months of 2014 or 2013.
The costs of mined PGM inventories as of any date are determined based on combined production costs per ounce and include all inventoriable production costs, including direct labor, direct materials, depletion, depreciation, amortization, third party refining costs and other overhead costs relating to mining and processing activities incurred as of such date.
The costs of recycling PGM inventories as of any date are determined based on the acquisition cost of the recycled material and include all inventoriable processing costs, including direct labor, direct materials, depreciation and third party refining costs which relate to the processing activities incurred as of such date.
Inventories reflected in the accompanying balance sheets consisted of the following:
September 30, | December 31, | |||||||
(In thousands) | 2014 | 2013 | ||||||
Metals inventory | ||||||||
Raw ore | $ | 6,396 | $ | 4,638 | ||||
Concentrate and in-process | 59,313 | 67,251 | ||||||
Finished goods | 60,893 | 60,100 | ||||||
Total metals inventory | $ | 126,602 | $ | 131,989 | ||||
Materials and supplies | 27,542 | 26,661 | ||||||
Total inventory | $ | 154,144 | $ | 158,650 | ||||
The Company also holds in its possession materials it processes on a toll basis for customers until the tolled material is transported to a third party refiner.
18
NOTE 14
EARNINGS PER SHARE
Basic earnings per share attributable to common stockholders is computed by dividing net earnings available to common stockholders by the weighted average number of common shares outstanding during the period. Diluted earnings per share attributable to common stockholders reflects the potential dilution that could occur if the Company’s dilutive outstanding stock options and nonvested shares were exercised or vested, the contingently issuable shares were issued and the Company’s convertible debt was converted. For the purposes of calculating earnings per share attributable to common stockholders, reported net income attributable to common stockholders for the three- and nine-month periods of 2014 was adjusted for the interest expense, net of capitalized interest (including amortization expense of deferred debt fees), the related income tax effect and the loss attributable to the noncontrolling interest in the computation of basic and diluted earnings per share attributable to common stockholders. No adjustment was made to reported net income attributable to common stockholders during the three- and nine-month periods ended September 30, 2013, because the effect would have been anti-dilutive. The Company currently has only one class of equity shares outstanding.
Reconciliations showing the computation of basic and diluted shares and the related impact on income for the three- and nine-month periods ended September 30, 2014, are shown in the following table:
Three Months Ended | Nine Months Ended | |||||||||||||||||||||
September 30, 2014 | September 30, 2014 | |||||||||||||||||||||
(In thousands, except per share amounts) | Income (Numerator) | Weighted Average Shares (Denominator) | Per Share Amount | Income (Numerator) | Weighted Average Shares (Denominator) | Per Share Amount | ||||||||||||||||
Basic EPS | ||||||||||||||||||||||
Net income attributable to common stockholders | $ | 18,148 | 120,067 | $ | 0.15 | $ | 55,615 | 119,849 | $ | 0.46 | ||||||||||||
Effect of Dilutive Securities | ||||||||||||||||||||||
Stock options | — | 6 | — | 31 | ||||||||||||||||||
Nonvested shares | — | 113 | — | 22 | ||||||||||||||||||
Contingently issuable shares | — | 107 | — | 45 | ||||||||||||||||||
1.875% Convertible debentures, net of tax | — | 95 | — | 95 | ||||||||||||||||||
1.75% Convertible debentures, net of tax | 4,060 | 36,003 | 12,229 | 36,003 | ||||||||||||||||||
Diluted EPS | ||||||||||||||||||||||
Net income attributable to common stockholders and assumed conversions | $ | 22,208 | 156,391 | $ | 0.14 | $ | 67,844 | 156,045 | $ | 0.43 | ||||||||||||
Potential dilutive common shares include those associated with outstanding stock options, restricted stock units, performance shares and convertible debentures. For periods in which the Company reports a net loss attributable to common stockholders, potential dilutive common shares are excluded, as their conversion and exercise would be anti-dilutive. For the three- and nine-month periods ended September 30, 2013, the Company reported a net loss attributable to common stockholders resulting in all potentially dilutive shares being excluded from the computation of diluted weighted average shares.
The weighted average common shares outstanding for the three- and nine-month periods ended September 30, 2013 were 119,152,575 and 118,346,654, respectively. For the three- and nine-month periods ended September 30, 2013, the following items were excluded from the diluted earnings (loss) per share calculation because they were anti-dilutive:
Three Months Ended | Nine Months Ended | |||||
(In thousands) | September 30, 2013 | September 30, 2013 | ||||
Stock options | 138 | 144 | ||||
Nonvested shares | — | 177 | ||||
1.875% Convertible debentures, net of tax | 95 | 95 | ||||
1.75% Convertible debentures, net of tax | 36,003 | 36,003 | ||||
Total anti-dilutive shares | 36,236 | 36,419 | ||||
19
NOTE 15
FAIR VALUE MEASUREMENTS
Fair value is defined as the price that would be received to sell an asset or paid to transfer a liability (an exit price) in an orderly transaction between market participants. A three-level fair value hierarchy prioritizes the inputs used to measure fair value. This hierarchy requires an entity to maximize the use of observable inputs and minimize the use of unobservable inputs when measuring fair value. The classification of each financial asset or liability within the hierarchy is determined based on the lowest level input that is significant to the fair value measurement. The three levels of inputs used to measure fair value are as follows:
• | Level 1 - Quoted prices in active markets for identical assets or liabilities. |
• | Level 2 - Observable inputs other than quoted prices included in Level 1 such as quoted prices for similar assets and liabilities in active markets; quoted prices for identical or similar assets and liabilities in markets that are not active; or inputs that are observable or can be corroborated by observable market data. |
• | Level 3 - Unobservable inputs supported by little or no market activity and that are significant to the fair value of the assets or liabilities. |
Financial assets and liabilities measured at fair value on a recurring basis at September 30, 2014, and December 31, 2013, consisted of the following:
(In thousands) | Fair Value Measurements | |||||||||||||||
At September 30, 2014 | Total | Level 1 | Level 2 | Level 3 | ||||||||||||
Mutual funds | $ | 581 | $ | 581 | $ | — | $ | — | ||||||||
Investments | ||||||||||||||||
Federal agency notes | $ | 149,199 | $ | — | $ | 149,199 | $ | — | ||||||||
Commercial paper | $ | 102,292 | $ | — | $ | 102,292 | $ | — | ||||||||
(In thousands) | Fair Value Measurements | |||||||||||||||
At December 31, 2013 | Total | Level 1 | Level 2 | Level 3 | ||||||||||||
Mutual funds | $ | 604 | $ | 604 | $ | — | $ | — | ||||||||
Investments | ||||||||||||||||
Federal agency notes | $ | 97,585 | $ | — | $ | 97,585 | $ | — | ||||||||
Commercial paper | $ | 111,753 | $ | — | $ | 111,753 | $ | — | ||||||||
The fair value of the mutual funds is based on market prices that are readily available and are recorded in Other noncurrent assets on the Company's Consolidated Balance Sheets. The money market fund is classified as Level 1 and is recorded in Cash and cash equivalents on the Company's Consolidated Balance Sheets. The fair value of the investments is valued indirectly using observable data, quoted prices for similar assets or liabilities in active markets. Unrealized gains or losses on mutual funds and investments are recorded in Accumulated other comprehensive income on the Company's Consolidated Balance Sheets.
Assets and liabilities measured at fair value on a nonrecurring basis at September 30, 2014, and December 31, 2013, consisted of the following:
(In thousands) | Fair Value Measurements | |||||||||||||||
At September 30, 2014 | Total | Level 1 | Level 2 | Level 3 | ||||||||||||
1.875% Convertible debentures | $ | 2,245 | $ | — | $ | 2,245 | $ | — | ||||||||
1.75% Convertible debentures | $ | 307,467 | $ | — | $ | 307,467 | $ | — | ||||||||
20
(In thousands) | Fair Value Measurements | |||||||||||||||
At December 31, 2013 | Total | Level 1 | Level 2 | Level 3 | ||||||||||||
Marathon mineral properties and property, plant and equipment | $ | 57,272 | $ | — | $ | — | $ | 57,272 | ||||||||
1.875% Convertible debentures | $ | 2,245 | $ | — | $ | 2,245 | $ | — | ||||||||
1.75% Convertible debentures | $ | 308,574 | $ | — | $ | 308,574 | $ | — | ||||||||
Exempt facility industrial revenue bonds | $ | 30,050 | $ | — | $ | — | $ | 30,050 | ||||||||
Long-term investments | $ | 1,021 | $ | 1,021 | $ | — | $ | — | ||||||||
The Company used its current trading data to determine the fair value of its $2.2 million of outstanding 1.875% debentures. The Company determined the fair value of the liability component of its $396.75 million of outstanding 1.75% debentures at September 30, 2014 and December 31, 2013, by using observable market based information for debt instruments of similar amounts and duration. The Company used implicit interest rates of comparable unsecured obligations to calculate the fair value of the Company's $30.0 million, 8% Series 2000 exempt facility industrial revenue bonds at December 31, 2013. The fair value of the Company's long-term investments in certain Canadian junior exploration companies at December 31, 2013, is based on market prices which are readily available. The fair market value of the Marathon mineral property at December 31, 2013, was based on comparable transactions for similar undeveloped mineral properties and market multiples for similar projects. The fair market value of the Company's Altar mineral property was remeasured at the end of the third quarter of 2013 based on Level 3 inputs such as comparable transactions for similar undeveloped mineral properties and market multiples for similar projects.
NOTE 16
RELATED PARTIES
Mitsubishi owns a 25% interest in the Company's previously wholly-owned subsidiary, SCI, which owns the Marathon PGM-copper project and related properties located in northern Ontario, Canada. The Company made PGM sales of $24.9 million and $82.8 million to Mitsubishi in the three-month periods ended September 30, 2014 and 2013, respectively, and $118.7 million and $222.5 million for the nine-month periods ended September 30, 2014 and 2013, respectively.
21
ITEM 2
MANAGEMENT’S DISCUSSION AND ANALYSIS OF FINANCIAL CONDITION AND
RESULTS OF OPERATIONS
The commentary that follows should be read in conjunction with the consolidated financial statements and notes thereto included in this quarterly report and with the information provided in the Company's previously issued Quarterly Reports on Form 10-Q in 2014 and its 2013 Annual Report on Form 10-K.
OVERVIEW
Stillwater Mining Company (the “Company”) is a Delaware corporation, headquartered in Billings, Montana, and is listed on the New York and Toronto Stock Exchanges under the symbols SWC and SWC.U, respectively. The Company mines, and processes palladium and platinum ore from two underground mines situated within the J-M Reef, which is an extensive trend of platinum group metal (PGM) mineralization located in Stillwater and Sweet Grass Counties in south central Montana. Ore produced from the mines is crushed and concentrated in mills located at each mine site. The concentrates are then trucked to the Company’s processing complex in Columbus, Montana, which further processes the concentrates and also recycles spent catalyst materials containing PGMs received from third parties. A large portion of the recycling material processed by the Company is purchased for the Company’s own account; the balance is toll processed on behalf of others. After being processed through the Company's processing facilities in Columbus, the final product is a PGM-rich filter cake, which is shipped to a third party for final refining and then delivered as finished metal into the Company's account.
During the first nine months of 2014, the Company has continued to focus on initiatives intended to improve operating efficiency and increase its overall return on capital. Such efforts to date have included reassessing the Company's capital spending program, mining practices, corporate organization and its development and exploration activities. Noteworthy steps taken recently in support of these efficiency improvements include some ongoing adjustment to the Company's workforce levels (now principally through attrition); finalizing and implementing new PGM refining and supply agreements with Johnson Matthey; upgrading mine planning capabilities to optimize selection and scheduling of mining areas; scaling back or deferring spending on the Company's foreign property holdings; and in early July of 2014, redeeming approximately $30.0 million of the Company's long-term debt. The Company has set an internal goal to reduce its All-in Sustaining Costs (AISC) (a non-GAAP financial measure defined in more detail below - please see "Reconciliation of Non-GAAP Financial Measures to Consolidated Costs of Revenues.") by approximately $100 per ounce over the medium term from 2013 cost levels.
THIRD QUARTER 2014 SUMMARY RESULTS
For the third quarter of 2014, the Company reported consolidated net income attributable to common stockholders of $18.1 million, or $0.14 per diluted share, a significant improvement over the consolidated net loss attributable to common stockholders of $201.5 million, or $1.69 per share, reported in the third quarter 2013. The stronger 2014 third quarter earnings primarily reflect reduced pre-tax costs for marketing, general and administrative overhead, exploration, higher earnings from the Mine Production segment, and a $290.4 million (before-tax) impairment charge in the 2013 third quarter taken against the carrying value of the Altar mineral property in Argentina.
Mined palladium and platinum sold in this year's third quarter increased to 132,400 ounces from 131,400 ounces in the third quarter of 2013. The average combined realized price on sales of mined palladium and platinum was $983 per ounce in the third quarter of 2014, compared to $887 per ounce realized in the third quarter of 2013. Consolidated total cash costs, net of credits, per mined ounce for the Company’s mining operations averaged $554 per ounce in the third quarter of 2014, 29.7% higher than the $427 per ounce in the third quarter of 2013. (“Total cash costs, net of credits, per mined ounce” is a non-GAAP financial measure further defined below in Reconciliation of Non-GAAP Financial Measures to Consolidated Costs of Revenues.) The higher cash costs in the third quarter of 2014 reflect a decrease in recycling credits (discussed below) of $140 per ounce, as well as the effect of a scheduled 4% contractual wage rate increase that took effect at the beginning of July 2014. Consolidated total cash costs (before credits), however, were lower in the third quarter of 2014 than in the same quarter of 2013.
Total recycling volumes sold (including palladium, platinum and rhodium) during the third quarter of 2014 totaled 101,400 ounces at an average realization of $1,068 per ounce, compared to the 152,600 recycling ounces sold during the third quarter of 2013 at an average realization of $1,026 per ounce. The Company's recycling sales volumes during much of 2013 benefited from large volumes of recycling material the Company acquired in the U.S. market that previously had been exported to an offshore processor, as well as from approximately 12,000 recycled ounces recovered from reprocessing internal furnace brick. During 2014, the Company's recycling tonnages have returned to a level more consistent with historical experience.
22
PGM Recycling segment revenues for the third quarter of 2014 totaled $109.5 million, down 30.2% from the record $156.8 million reported for the third quarter of 2013. Tolling revenues, on the other hand, increased to $1.3 million in this year’s third quarter, compared to $0.3 million in the third quarter of 2013. Including tolled volumes, recycling material fed to the smelter during the third quarter of 2014 averaged approximately 18.7 tons per day, down from 27.2 tons per day for the same period of 2013. The cost of metals sold from the PGM Recycling segment was $106.8 million in the third quarter of 2014 compared to $136.8 million in the third quarter of 2013, a decrease of 21.9%. A majority of the cost of metals sold from the PGM Recycling segment in each period is attributable to the cost of purchasing recyclable catalyst materials for the Company's own account; therefore, the aggregate cost of metals sold from the PGM Recycling segment is mostly driven by the value of the recyclable catalyst materials purchased by the Company in a given period.
The Company's cash and cash equivalents balance was $257.6 million at September 30, 2014, compared to $286.7 million at December 31, 2013. Total outstanding liquidity, which includes highly liquid investments as well as available cash and cash equivalents, was $509.1 million at September 30, 2014, an increase over the $496.0 million reported at December 31, 2013 despite the redemption of the $30 million 8.0% Exempt Revenue Bonds. Net working capital (including cash and investments) increased to $616.9 million at September 30, 2014, from $614.8 million at December 31, 2013. During the first nine months of 2014, gross working capital in the PGM Recycling segment increased to $84.3 million from $76.1 million at December 31, 2013, as inventories and advances in the PGM Recycling segment have grown in line with average PGM prices.
MINING OPERATIONS
Mine production of palladium and platinum totaled 123,000 ounces in the third quarter of 2014, a decrease of 1.0% from the 124,200 ounces produced in the third quarter of 2013. Ore and subgrade (i.e., reef waste) volumes fed to the Stillwater Mine concentrator during the 2014 third quarter totaled 175,900 tons, down from 195,100 tons in the same quarter of 2013. This decline is attributable to the characteristics of the stopes available for mining in the period and the Company's efforts to direct mining toward higher margin ounces. For the same periods, East Boulder Mine ore and subgrade tonnages milled increased to 132,500 tons from 121,700 tons in 2013.
For historical reasons, the Company’s measurement of total cash costs per mined ounce has included the benefit of credits for by-product sales and PGM Recycling segment income before tax. The table below illustrates the effect of applying these credits to the average cash costs per mined ounce for the combined Montana mining operations.
Combined Montana Mining Operations Cash Costs Per Mined Ounce | 2014 Third Quarter | 2013 Third Quarter | 2014 Year-to-date | 2013 Year-to-date | ||||||||||||
Reported Total Cash Costs per Mined Ounce, Net of Credits * | $ | 554 | $ | 427 | $ | 557 | $ | 495 | ||||||||
By-Product Revenue Credit | 56 | 54 | 59 | 55 | ||||||||||||
PGM Recycling Income Credit | 25 | 165 | 24 | 83 | ||||||||||||
Total Cash Costs per Mined Ounce before Credits | $ | 635 | $ | 646 | $ | 640 | $ | 633 | ||||||||
* These are non-GAAP financial measures. For a full description and reconciliation of these and other non-GAAP financial measures to GAAP financial measures, see Reconciliation of Non-GAAP Financial Measures to Consolidated Costs of Revenues below.
For assessing the overall operating efficiency of the Company's Montana operations, the Company has recently introduced another, more comprehensive non-GAAP financial measure, All-in Sustaining Costs per mined ounce. This metric is intended as an indication of the total cash capital and operating cost per ounce required to sustain the Company's current level of mining activities. For the third quarter of 2014, all-in sustaining costs averaged $837 per ounce, compared to $845 per ounce in the third quarter of 2013, reflecting lower corporate costs and non-project capital spending during the third quarter of 2014. For a more complete discussion of this measure, please see -- "Reconciliation of Non-GAAP Financial Measures to Consolidated Costs of Revenues."
23
Stillwater Mine
At the Stillwater Mine, third quarter 2014 palladium and platinum production totaled 76,900 ounces, a decrease of 8.2% from the 83,800 ounces produced in the third quarter of 2013. The ore grade at the Stillwater Mine averaged approximately 0.48 combined ounces of palladium and platinum per ton in the quarter ended September 30, 2014, compared to 0.47 ounces per ton in the quarter ended September 30, 2013. Total ore and reef waste production averaged 1,912 tons per day at the Stillwater Mine during the third quarter of 2014, down from 2,121 tons per day in the third quarter of 2013. The reduced tonnage reflected a focus on producing only higher margin ounces, as well as reduced ore production early in the quarter as a result of implementing the changes necessary to refocus on higher margin ounces.
The following table illustrates the effect of applying the by-product and PGM Recycling segment credits to the total cash costs per mined ounce at the Stillwater Mine.
Stillwater Mine Cash Costs Per Mined Ounce | 2014 Third Quarter | 2013 Third Quarter | 2014 Year-to-date | 2013 Year-to-date | ||||||||||||
Reported Total Cash Costs per Mined Ounce, Net of Credits * | $ | 570 | $ | 434 | $ | 550 | $ | 490 | ||||||||
By-Product Revenue Credit | 50 | 46 | 51 | 47 | ||||||||||||
PGM Recycling Income Credit | 25 | 166 | 24 | 82 | ||||||||||||
Total Cash Costs per Mined Ounce before Credits | $ | 645 | $ | 646 | $ | 625 | $ | 619 | ||||||||
* These are non-GAAP financial measures. For a full description and reconciliation of these and other non-GAAP financial measures to GAAP financial measures, see Reconciliation of Non-GAAP Financial Measures to Consolidated Costs of Revenues below.
Stillwater Mine’s total cash costs per mined ounce, net of credits (a non-GAAP financial measure), increased significantly in the third quarter of 2014 mostly as a result of the much higher recycling credits that benefited the Company throughout 2013. Before credits, total cash costs per ounce were essentially unchanged. For the first nine months of 2014 total cash costs per mined ounce, net of credits, increased 12.2% from the same period in 2013, again mostly attributable to higher recycling credits in 2013.
Capital expenditures incurred at the Stillwater Mine totaled $26.8 million for the third quarter of 2014, including $7.2 million for Blitz development, compared to the $24.8 million of capital spent at the Stillwater Mine during the third quarter of 2013, of which $7.1 million was for the Blitz development. Primary and secondary development footages for the third quarter of 2014 increased over the comparable footages for the third quarter of 2013, with primary and secondary development advancing approximately 15,600 feet in the third quarter of 2014 and 11,900 feet in the third quarter of 2013. Diamond drilling footage for the third quarter of 2014 totaled approximately 91,500 feet, compared to the 71,500 feet drilled in the third quarter of 2013.
The focus on investing in development capital and diamond drilling is indicative of the Company’s commitment to setting up the Stillwater Mine for more efficient operations going forward.
East Boulder Mine
Mine production at the East Boulder Mine increased to 46,100 combined ounces of palladium and platinum for the third quarter of 2014, an increase of 14.1% over the 40,400 ounces produced in the third quarter of 2013. Total ore and reef waste production at the East Boulder Mine averaged 1,479 tons per day during the third quarter of 2014, an increase from 1,281 tons per day in the third quarter of 2013. With the startup of production from the Graham Creek area, the Company has recently added a third crew in the East Boulder concentrator, thereby increasing mill utilization by about 25%.
East Boulder Mine Cash Costs Per Mined Ounce | 2014 Third Quarter | 2013 Third Quarter | 2014 Year-to-date | 2013 Year-to-date | ||||||||||||
Reported Total Cash Costs per Mined Ounce, Net of Credits * | $ | 527 | $ | 412 | $ | 572 | $ | 507 | ||||||||
By-Product Revenue Credit | 68 | 68 | 72 | 73 | ||||||||||||
PGM Recycling Income Credit | 25 | 164 | 24 | 86 | ||||||||||||
Total Cash Costs per Mined Ounce before Credits | $ | 620 | $ | 644 | $ | 668 | $ | 666 | ||||||||
* These are non-GAAP financial measures. For a full description and reconciliation of these and other non-GAAP financial measures to GAAP financial measures, see Reconciliation of Non-GAAP Financial Measures to Consolidated Costs of Revenues below.
24
Total cash costs per mined ounce, net of credits, (a non-GAAP financial measure) for the third quarter of 2014 increased approximately 27.9% over the same period in 2013, mostly related to the greater recycling credits the mine enjoyed in 2013. Before credits, third quarter cash costs declined by about 3.7%. For the first nine months of 2014, total cash costs per mined ounce, net of credits, increased 12.8% over the same period of 2013; before credits, total cash costs per ounce were essentially unchanged.
Capital expenditures incurred at the East Boulder Mine totaled $8.7 million in the third quarter of 2014 compared to $7.3 million in the same quarter of 2013. Graham Creek capital expenditures totaled $0.2 million in the third quarter of 2014 as the project was completed, compared to $2.4 million in the third quarter of 2013. Actual primary and secondary development advanced approximately 5,400 feet during the third quarter of 2014. The comparable development advance in the third quarter of 2013 was 5,600 feet. Diamond drilling footage for the third quarter of 2014 totaled approximately 53,200 feet compared to the 30,000 feet drilled in the third quarter of 2013.
PGM RECYCLING SEGMENT
In the third quarter of 2014, the Company earned $3.1 million (before income taxes) from its PGM Recycling operations on revenues of $109.5 million; for the third quarter of 2013, the Company reported income from its PGM Recycling operations of $20.6 million (before income taxes) on revenues of $156.8 million. The 2013 third quarter included incremental revenue of $16.4 million on the sale of approximately 12,000 PGM ounces recovered internally from reprocessed furnace brick at low cost. The third quarter of 2013 also benefited from higher than normal volumes of recycled materials available in the market place.
Sold ounces of recycled PGMs decreased 33.6% to 101,400 ounces in the third quarter of 2014 from 152,600 ounces for the third quarter of 2013 (including approximately 12,000 ounces of recovered furnace brick). The combined average recycling sales realization (including palladium, platinum and rhodium) was $1,068 per sold ounce for the third quarter of 2014, up from $1,026 per sold ounce in the same quarter of 2013. Tolled recycling volume grew during the third quarter of 2014, as the Company processed and returned 22,900 tolled ounces in the third quarter of 2014, compared to 8,000 tolled ounces in the third quarter of 2013. Total recycling ounces fed to the smelter, including both purchased and tolled materials, decreased to 117,700 ounces in the third quarter of 2014 from 167,500 ounces in the third quarter of 2013.
In many cases, the Company has arrangements in place with its recycling suppliers that provide for advance payments to the suppliers prior to return of the finished metal from the final refiner. Outstanding procurement advances for material in transit not backed up by inventory physically in the Company’s possession totaled $9.8 million at September 30, 2014, and $6.9 million at December 31, 2013. The Company’s total gross working capital in its PGM Recycling segment was $84.3 million at September 30, 2014, and $76.1 million at December 31, 2013. This increase in recycling gross working capital reflects higher acquisition costs in 2014 as the price of the contained PGMs has risen during the year.
EXPLORATION AND DEVELOPMENT PROJECTS
The Company is continuing to develop new mining infrastructure adjacent to its current operations along the J-M Reef. At one of these Montana infrastructure projects, Graham Creek, the Company completed installation of the ventilation fan in the Graham Creek raise, thereby completing the scope of the infrastructure development at Graham Creek shortly after the end of the third quarter. Some initial PGM production has already being mined from the Graham Creek area in 2014. The Graham Creek development extended underground access from the existing East Boulder Mine infrastructure approximately 8,800 feet to the west. This area is positioned to support an expanded mining program at the East Boulder Mine facilities. The Company has commenced a substantial diamond drilling program that is intended to identify the optimal location for the next mining ramp system for development within the Graham Creek area. The total cost incurred to date for the basic Graham Creek development, including the ventilation shafts, is approximately $11.8 million.
25
A second, much larger infrastructure project in Montana is the Blitz development, designed to open up underground access to an extensive area east of the existing Stillwater Mine operations from which new mining stopes can be developed. The Blitz development over time is expected to replace gradually depleting production in the currently active mining areas of the Stillwater Mine. However, depending on the rate of this resource depletion, the Blitz development may also contribute some future growth in annual palladium and platinum production rates from the Stillwater complex. The Blitz development is designed to extend underground access eastward by approximately 25,000 feet from the existing Stillwater Mine infrastructure on two separate levels. The lower development heading is being driven with a tunnel-boring machine (TBM) and to date has advanced approximately 7,200 feet. Another parallel underground heading is being driven approximately 600 feet above the first using conventional drill and blast methods. Development of this parallel heading has resulted in approximately 7,700 feet of ramp and infrastructure development to date. Currently in the permitting process is a new portal for the Blitz area that will be developed at the far end of these two primary Blitz tunnels. It will intersect the tunnels from the surface in order to provide adequate ventilation and emergency egress for the Blitz development area. The Blitz development began in late 2010, to-date the Company has spent approximately $58.1 million.
In addition to its Montana operations, the Company also holds a 75% interest in the Marathon project, an undeveloped PGM-copper property situated near the north shore of Lake Superior in the province of Ontario, Canada. Following completion of a detailed feasibility analysis in late 2013, the partners concluded that the development scenario envisaged for the Marathon project does not provide an acceptable financial return. Consequently, the project has been placed on hold while assessing various alternative development strategies. Environmental review of the project, under the direction of a joint federal/provincial review panel, has also been suspended, recognizing that any final Marathon project design may differ materially from the plan originally presented. Administrative costs at Marathon are being scaled back, and for the third quarter of 2014 totaled $0.8 million on a 100% ownership basis. Exploration expense at Marathon totaled $0.3 million in this year's third quarter.
The Company also owns Altar, an exploration-stage property in the San Juan province of Argentina. Substantial exploratory drilling has been completed at Altar over the past several years that demonstrates the presence of large copper-gold porphyry deposits on the property. While the Altar exploration results are encouraging, the Company's strategic focus centers on PGM opportunities of manageable scale situated in politically stable jurisdictions, which is a description that does not currently accommodate Altar. Consequently, the Company is reviewing alternatives to best realize value on its investment in the project. Some minimum level of annual expenditure is required in order to maintain the Company's good standing and preserve its asset position at Altar. Future levels of exploration spending at Altar are discretionary and will be evaluated year by year. Costs at Altar have been scaled back, and totaled $0.4 million in the third quarter of 2014, consisting primarily of exploration expense. The Company also recognized a non-cash foreign currency gain of $0.7 million in Argentina during the same period.
26
CAPITAL AND EXPLORATION EXPENDITURES
The Company incurred capital cash spending of $33.3 million during the third quarter of 2014 and $87.0 million for the first nine months of the year. This compares to consolidated capital expenditures of $31.5 million in the third quarter of 2013 and $91.2 million during the first nine months of 2013.
Accrued Capital Spending | ||||||||||||||||
Three Months Ended | Nine Months Ended | |||||||||||||||
(In thousands) | September 30, | September 30, | ||||||||||||||
2014 | 2013 | 2014 | 2013 | |||||||||||||
Sustaining Capital Expenditures: | ||||||||||||||||
Stillwater Mine | $ | 15,558 | $ | 16,991 | $ | 44,228 | $ | 47,522 | ||||||||
East Boulder Mine | 5,974 | 4,670 | 13,731 | 13,080 | ||||||||||||
Processing & Other | 1,035 | 808 | 2,490 | 2,397 | ||||||||||||
Total Sustaining Capital Expenditures | $ | 22,567 | $ | 22,469 | $ | 60,449 | $ | 62,999 | ||||||||
Project Capital Expenditures | ||||||||||||||||
Blitz Project | $ | 7,245 | $ | 7,085 | $ | 16,413 | $ | 15,465 | ||||||||
Graham Creek Project | 421 | 1,999 | 1,585 | 5,706 | ||||||||||||
Hertzler Tailings Expansion | 3,434 | 80 | 7,708 | 212 | ||||||||||||
Other Projects | 2,878 | 2,125 | 7,540 | 4,250 | ||||||||||||
Total Project Capital Expenditures | $ | 13,978 | $ | 11,289 | $ | 33,246 | $ | 25,633 | ||||||||
Total Accrued U.S. Capital Spending | $ | 36,545 | $ | 33,758 | $ | 93,695 | $ | 88,632 | ||||||||
Foreign Project Capital with Interest | 2 | 3,036 | 2 | 9,723 | ||||||||||||
Total Accrued Capital Expenditures | $ | 36,547 | $ | 36,794 | $ | 93,697 | $ | 98,355 | ||||||||
Adjust Accrued Spending to Cash Basis | (3,289 | ) | (5,343 | ) | (6,659 | ) | (7,168 | ) | ||||||||
Cash Capital Spending for Period | $ | 33,258 | $ | 31,451 | $ | 87,038 | $ | 91,187 | ||||||||
In addition to capital expenditures, the Company also budgeted approximately $5.8 million for exploration programs during 2014. The Company recognized exploration expense of $0.7 million and $2.1 million for the three-month periods ended September 30, 2014 and 2013, respectively. For the nine-month periods ended September 30, 2014 and 2013, the Company has recognized exploration expense of $2.4 million and $10.2 million, respectively. All of the Company's exploration expenditures to date in 2014 and 2013 are associated with its Marathon and Altar assets.
SUPPLY AND DEMAND COMMENTARY FOR PGM MARKETS
(The following discussion reflects management’s assessment of the recent state of the PGM markets, based on discussion with industry analysts and the Company’s own observations of market dynamics. There can be no assurance that the Company’s conclusions reflect a complete or accurate picture of supply and demand trends or market outlook. However, management’s view of market conditions and the outlook for PGM supply and demand may influence its decisions on mining activities, future acquisitions, expansions or divestitures, capital investment, financing, hiring and various other factors.)
Following the resolution of the labor strikes that paralyzed much of South Africa’s mining industry during the first half of 2014, PGM producers in South Africa have been gradually bringing their mining operations back into production. Largely as a result of the strikes, analysts are projecting a supply shortfall during 2014 of approximately 1.4 million ounces in the platinum market and 1.6 million ounces in the palladium market. Any such shortfall will need to be met out of existing stocks of metal in inventory.
Market prices for palladium and platinum were relatively strong during the first half of 2014. During the third quarter, a combination of profit taking and a strengthening U.S. dollar sparked a strong sell-off in these metals. The palladium prices quoted by the London Bullion Market Association (LBMA) ended 2013 at $716 per ounce, trended upward and peaked on the first of September at $911 per ounce and, after the sell-off, ended the third quarter at $775 per ounce. Similarly, platinum quoted by the LBMA ended 2013 at $1,357 per ounce, rose to a high of $1,512 per ounce in early July, and then fell to close the third quarter at $1,300 per ounce.
27
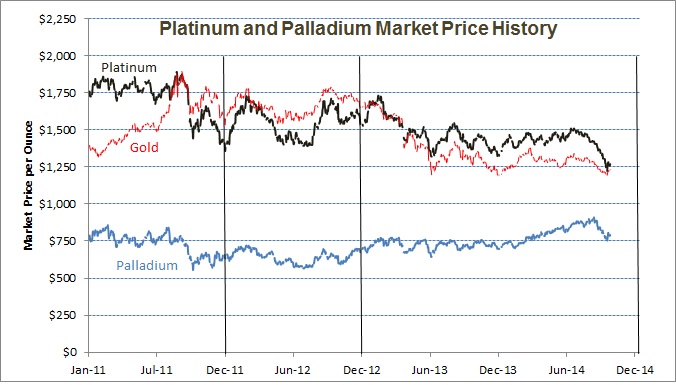
Despite its recent market weakness, palladium’s underlying supply and demand fundamentals generally continue to be viewed as favorable by analysts. Primary sources of PGM supply are limited to a few large producers in South Africa and Zimbabwe, significant PGM by-product output from Norilsk Nickel in Russia, the Company’s operations in Montana, and some mostly by-product producers in Canada. A recent report from Mitsubishi Corporation International has estimated that total primary (i.e., newly mined) palladium supply will total approximately 6.1 million ounces in 2014, down from around 6.2 million ounces last year. Supplies of palladium were not affected as dramatically as platinum by the labor strife in South Africa, as the South African mines typically produce more platinum than palladium. Releases of metal from the Russian strategic palladium reserves, which at one time were a major source of palladium supply, have been negligible for several years, leading some to conclude that those reserves are now substantially depleted. Recycled palladium volumes continue to increase gradually from year-to-year, and Mitsubishi projects they will contribute an additional 2.3 million ounces to supply in 2014, up from about 2.0 million ounces in 2013.
Mitsubishi reported that demand for palladium has continued to increase, driven mostly by growth in worldwide automobile production. North American automobile sales in 2014 appear on track to exceed their 2007 pre-recession level for the first time, and China’s year-on-year car sales growth through eight months was up 11% from 2013. Automobile sales in Europe through August also are up 5.9% from the same period in 2013, although from a low base. New Euro 6 emissions regulations for light vehicles have now taken effect in Europe for the latest model year, following closely on Euro VI standards implemented earlier for heavy duty diesels. All of this regional auto market strength is partially offset, however, by somewhat weaker car sales in Japan and other parts of the world. Overall, Mitsubishi estimates that palladium demand worldwide from the auto industry will increase by about 150,000 ounces between 2013 and 2014 to 7.3 million ounces.
Other elements of palladium demand include industrial applications, investment purchases and a relatively small jewelry component. Mitsubishi sees both industrial and jewelry demand declining in 2014, probably in response to stronger palladium prices. Investment in palladium, on the other hand, has expanded substantially in 2014. Mitsubishi estimates net growth in investment demand will absorb about 1.1 million ounces of palladium in 2014, up from essentially no net change in investment demand in 2013. Much of this investment growth is attributable to ETFs, including two new South African palladium ETFs introduced during 2014. Overall, Mitsubishi projects total worldwide 2014 palladium demand at approximately 10.0 million ounces, compared to total primary and secondary supply of 8.4 million ounces, leaving a shortfall of approximately 1.6 million ounces to be supplied from existing inventory stocks.
The market fundamentals for platinum are also generally viewed as favorable, but the price of platinum has proven less resilient than palladium during 2014. New production was badly constrained by the effect of the South African labor issues during the first half of this year, resulting in the loss of about 750,000 ounces from the South African mining operations. Elsewhere in the world, year-on-year primary and secondary platinum production has been essentially flat. Overall, Mitsubishi estimates 2014 primary platinum production will be about 5.0 million ounces, down from approximately 5.7 million ounces in 2013. Recycled platinum production will remain unchanged at about 2.0 million ounces in both 2014 and 2103.
28
Platinum demand has strengthened during 2014, mostly in response to recovery in European auto demand and tighter emission regulations for diesel engines. Over 50% of European auto demand is for diesel engines, which require heavier platinum loadings than gasoline engines, so the 2014 recovery in the European auto market is inherently beneficial to platinum demand. Similarly, the implementation of Euro VI restrictions on diesel emissions has increased demand for platinum. Mitsubishi estimates that demand for platinum in automotive applications will consume approximately 3.4 million ounces of platinum in 2014, up from 3.1 million ounces in 2013.
Industrial demand for platinum also appears to have strengthened in 2014. However, demand for platinum in jewelry and investment in 2014 has declined from the very strong levels seen in 2013. Worldwide, Mitsubishi projects that total demand for platinum in 2013 will be about 8.4 million ounces, down from 8.8 million ounces in 2013. Taking into account total supply of around 5.0 million primary platinum ounces and 2.0 million secondary ounces, the 2014 platinum deficit will probably be about 1.4 million ounces that must be supplied from inventories.
Stillwater’s share price during 2014 has outperformed the price of palladium. The following chart shows the Company’s share price history from the beginning of 2012 with the price of palladium superimposed.
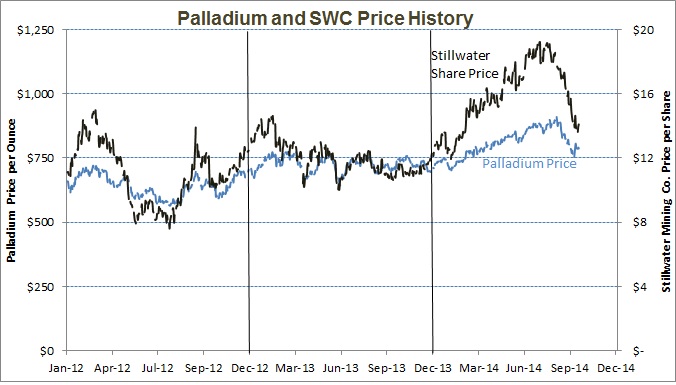
On the New York Stock Exchange, the Company's shares started the year 2014 trading at $12.44, peaked at $19.42 on July 30, 2014, and ended the third quarter of 2014 trading at $15.03.
SALES AND CUSTOMERS
During the first half of 2014, the Company made all of its sales of mined PGMs either in the spot market or under mutually agreed short-term (one year or less) supply agreements. In May 2014, the Company entered into a preliminary Framework Agreement with Johnson Matthey providing terms under which they would negotiate mutually acceptable supply and refining agreements. The parties have now executed a five-year arrangement reflecting the undertakings in the Framework Agreement.
Per the terms of these supply and refining agreements, effective July 1, 2014, Johnson Matthey has an exclusive five-year right to refine all the PGM filter cake the Company produces at its Columbus, Montana facilities under terms that are attractive to the Company. Johnson Matthey also has the right to purchase all of the Company's mine production of palladium and platinum at competitive market prices (with the exception of platinum sales under the Company’s sales agreement with Tiffany, which are specifically excluded) and has the right to bid for any recycling volumes the Company has available. Other provisions of the agreement include a good-faith effort by Johnson Matthey to assist in growing the Company's recycling volumes, appropriate sharing of market intelligence to the extent permitted by law, and a cooperative effort to evaluate and possibly develop new PGM technologies. The supply agreement includes a provision allowing the Company at its sole discretion to exit the agreement in return for the payment of a nominal fee.
29
To the extent possible, all recycling material that the Company purchases is sold forward at the time the material is acquired, thereby essentially fixing the sales margin on the material. Forward sales of recycled ounces are customarily offered to any of several counterparties who the Company believes are able to take future physical delivery of the underlying metal. Such forward sales are regarded as "normal sales" transactions for accounting purposes and therefore are not accounted for as derivatives.
30
STRATEGIC CONSIDERATIONS
The discussion of corporate strategies that follows is intended as an update of matters discussed in previous filings. For a discussion of the Company's strategic capital and exploration projects, please reference the previous sections of this Item 2 entitled Exploration and Development Projects and Capital and Exploration Expenditures.
The Company's safety performance is of paramount importance to every employee and is the Company's primary consideration in all aspects of its operations. The Company's safety systems include:
• | extensive and ongoing training and communications efforts intended to instill and reinforce a positive safety culture; |
• | workplace inspections and hazard mitigation; |
• | reporting, tracking, analysis and communication of safety incidents, including near misses; |
• | detailed task training; and |
• | a strong safety emphasis throughout all levels of the organization. |
The Company normally assesses its safety performance using two broad sets of measures - incidence rates and regulatory compliance. Incidence rates in the U.S. usually are measured as a rate per 200,000 man hours. Regulatory compliance is measured in terms of the number and severity of citations issued to the Company and its contractors on site by Mine Safety and Health Administration (MSHA) inspectors.
The Company's overall incidence rate per 200,000 man hours in its Montana operations for the first nine months of 2014 is trending favorably, declining by nearly 17% compared to the same period of 2013. The East Boulder Mine has experienced a particularly favorable safety performance in the first three quarters of 2014, with a decline in its incidence rate of 51% compared to the first nine months of 2013. This year likewise has seen a substantial year-on-year reduction in the number of MSHA citations issued to the Company - for further detail, please see Exhibit 95 - Mine Safety Disclosures, included as an exhibit to this filing.
The Company also continues its focus on environmental excellence. The Company works closely with governmental agencies and the local communities to ensure its strict compliance with environmental regulations and attention to its neighbors' environmental concerns. In addition, the Company's Good Neighbor Agreement, first entered into in the year 2000, stipulates a mutual commitment with local environmental organizations toward working together in shaping decisions with respect to the Company's operations that affect neighboring communities. Recently the United States Bureau of Land Management (BLM) honored the Company with its Hardrock Mineral Community Outreach and Economic Security Award. This national award recognizes the Company's concern for community responsibilities and highlights the economic benefits of mineral development. This award further recognizes the successful coordination of mineral projects with local and regional stakeholders. In granting the award, the BLM recognized the Company for its involvement and engagement in various partnerships and outreach initiatives at the local, state and federal levels, in addition to the Company's commitment to corporate responsibility.
Cost containment remains a key focus throughout the Company's operations. The Company utilizes a non-GAAP financial measure of overall cost efficiency, All-in Sustaining Costs (AISC), to assess the performance of its Montana operations. (Please see the later section of this Item 2 entitled All-in Sustaining Costs (A Non-GAAP Financial Measure) for a more detailed explanation of AISC.) The Company has established an internal goal to work toward reducing AISC by approximately $100 per mined ounce from its full-year 2013 results, over the medium term. In conjunction with this goal, the Company has undertaken a number of cost initiatives during 2014. For the nine months ended September 30, 2014, the Company's AISC has averaged $805 per ounce.
At the Stillwater Mine, the Company has restructured its mine plan to bypass or defer certain mining stopes that cannot be operated profitably at this time. In some cases, these are comparatively high-grade stopes that lack sufficient developed infrastructure in the immediate vicinity and so are better deferred until adequate infrastructure is available. There also appear to be opportunities to allocate mining resources away from some marginally profitable opportunities and into areas that offer higher profitability. The reserve base at Stillwater is large enough that such changes can be made without jeopardizing the longer-term viability of the mine.
The Company also has recently taken steps to update its approach to mine planning, introducing new software that is intended to facilitate evaluating different mining scenarios and improve underground mine modeling capabilities. While this remains a work in progress, the implementation effort is well underway.
Capital and exploration spending has been scaled back at the Marathon and Altar projects in 2014, pending decisions as to how best to proceed with those assets. In the existing Montana operations, the developed state of the mines is now sufficiently advanced that there may be future opportunities to slow development spending in some areas of the mines. Capital expenditures incurred corporate-wide through the first nine months of 2014 have totaled $93.7 million.
31
The Company's total workforce at September 30, 2014, was 1,641 employees, including 1,628 in Montana, and 13 in foreign subsidiaries. This reflects a reduction of 132 employees from a total of 1,773 at December 31, 2013, of which 1,742 were Montana-based and 31 were based in Canada and South America. These net reductions have stemmed from voluntary and involuntary severances as well as normal workforce attrition.
The Company currently has available capacity in its mine concentrators (mills) and in its processing facilities. With the startup of production from the Graham Creek area, the Company has recently added a third crew in the East Boulder concentrator, thereby increasing mill utilization by about 25%. The Company will consider adding a fourth crew as mine output expands further. Similarly, the Company has been exploring various opportunities to increase throughput at processing facilities in Columbus, primarily through growing its recycling business and potentially through other processing arrangements with third parties. While recycling volumes strengthened between the first and second quarters of 2014, with furnace input increasing from an average of approximately 17.0 tons per day in this year's first quarter to 18.7 tons per day in the third quarter, the recycling business is very competitive and attaining further significant growth while maintaining margins may prove to be challenging.
Another element of the Company's strategy is appropriate alignment of employee incentives with corporate objectives. In particular, the Company has implemented a modified incentive compensation structure for management beginning in 2014 that is intended to align short-term and long-term compensation with building shareholder value and optimizing total return to shareholders. The Company's closing share price as quoted on the New York Stock Exchange was $15.03 on September 30, 2014, up 21.8% from $12.34 per share on December 31, 2013.
The Company's liquidity at September 30, 2014, totaled $509.1 million, including cash and cash equivalents totaling $257.6 million and highly liquid investments of $251.5 million. The Company also has approximately $62.1 million of borrowing capacity available under its revolving line of credit. During the 2014 third quarter, the Company redeemed the entire $30.0 million outstanding balance of its 8% State of Montana Industrial Revenue bonds due 2020.
32
RESULTS OF OPERATIONS
Comparison of Three-Month Periods Ended September 30, 2014 and 2013
The Company’s total revenues decreased by 10.0% to $252.1 million in the third quarter of 2014 compared to $280.0 million for the third quarter of 2013. The following analysis covers key factors contributing to the decrease in revenues:
SALES AND PRICE DATA
Three Months Ended | |||||||||||||||
September 30, | Increase | Percentage | |||||||||||||
(In thousands, except for average prices) | 2014 | 2013 | (Decrease) | Change | |||||||||||
Revenues | $ | 252,066 | $ | 280,007 | $ | (27,941 | ) | (10 | )% | ||||||
Ounces Sold: | |||||||||||||||
Mine Production: | |||||||||||||||
Palladium (oz.) | 103 | 101 | 2 | 2 | % | ||||||||||
Platinum (oz.) | 29 | 30 | (1 | ) | (3 | )% | |||||||||
Total | 132 | 131 | 1 | 1 | % | ||||||||||
PGM Recycling: (1) | |||||||||||||||
Palladium (oz.) | 58 | 83 | (25 | ) | (30 | )% | |||||||||
Platinum (oz.) | 36 | 57 | (21 | ) | (37 | )% | |||||||||
Rhodium (oz.) | 7 | 12 | (5 | ) | (42 | )% | |||||||||
Total | 101 | 152 | (51 | ) | (34 | )% | |||||||||
Other: (5) | |||||||||||||||
Palladium (oz.) | 6 | — | 6 | 100 | % | ||||||||||
By-products from Mine Production: (2) | |||||||||||||||
Rhodium (oz.) | 1 | 1 | — | — | |||||||||||
Gold (oz.) | 3 | 2 | 1 | 50 | % | ||||||||||
Silver (oz.) | 2 | 1 | 1 | 100 | % | ||||||||||
Copper (lb.) | 173 | 171 | 2 | 1 | % | ||||||||||
Nickel (lb.) | 289 | 353 | (64 | ) | (18 | )% | |||||||||
Average realized price per ounce (3) | |||||||||||||||
Mine Production: | |||||||||||||||
Palladium ($/oz.) | $ | 859 | $ | 722 | $ | 137 | 19 | % | |||||||
Platinum ($/oz.) | $ | 1,421 | $ | 1,447 | $ | (26 | ) | (2 | )% | ||||||
Combined ($/oz.) (4) | $ | 983 | $ | 887 | $ | 96 | 11 | % | |||||||
PGM Recycling: (1) | |||||||||||||||
Palladium ($/oz.) | $ | 821 | $ | 716 | $ | 105 | 15 | % | |||||||
Platinum ($/oz.) | $ | 1,453 | $ | 1,459 | $ | (6 | ) | — | |||||||
Rhodium ($/oz.) | $ | 1,078 | $ | 1,097 | $ | (19 | ) | (2 | )% | ||||||
Combined ($/oz.) (4) | $ | 1,068 | $ | 1,026 | $ | 42 | 4 | % | |||||||
Other: (5) | |||||||||||||||
Palladium ($/oz.) | $ | 882 | $ | — | $ | 882 | 100 | % | |||||||
By-products from Mine Production: (2) | |||||||||||||||
Rhodium ($/oz.) | $ | 1,320 | $ | 975 | $ | 345 | 35 | % | |||||||
Gold ($/oz.) | $ | 1,266 | $ | 1,346 | $ | (80 | ) | (6 | )% | ||||||
Silver ($/oz.) | $ | 19 | $ | 21 | $ | (2 | ) | (10 | )% | ||||||
Copper ($/lb.) | $ | 2.96 | $ | 3.05 | $ | (0.09 | ) | (3 | )% | ||||||
Nickel ($/lb.) | $ | 6.79 | $ | 5.11 | $ | 1.68 | 33 | % | |||||||
Average market price per ounce (3) | |||||||||||||||
Palladium ($/oz.) | $ | 863 | $ | 722 | $ | 141 | 20 | % | |||||||
Platinum ($/oz.) | $ | 1,435 | $ | 1,449 | $ | (14 | ) | (1 | )% | ||||||
Combined ($/oz.) (4) | $ | 989 | $ | 887 | $ | 102 | 11 | % | |||||||
33
(1) | Ounces sold and average realized price per ounce from PGM Recycling relate to ounces produced from processing of catalyst materials. |
(2) | By-product metals sold reflect contained metal produced from mined ore alongside the Company's primary production of palladium and platinum. Realized prices reflect net values (discounted due to product form and transportation and marketing charges) per unit received. |
(3) | The Company’s average realized price represents revenues, which include the effect of hedging gains and losses realized on commodity instruments and agreement discounts, divided by ounces sold. The average market price represents the average London Bullion Market Association afternoon postings for the actual months of the period. |
(4) | The Company calculates the combined average realized and a combined average market price of palladium and platinum using the same ratio as the rate of ounces of each respective metal that are produced from the base metal refinery. |
(5) | Ounces sold and average realized price per ounce from Other relate to ounces acquired periodically in the open market and simultaneously resold to third parties. |
Net revenues from sales of Mine Production (including proceeds from the sale of by-products) were $137.1 million in the third quarter of 2014, compared to $123.2 million for the third quarter of 2013, an increase of 11.3%. The increase in Mine Production revenues reflects slightly higher volumes sold and an increase in realized prices on sales of palladium and platinum from mining operations in the third quarter of 2014. The total quantity of mined palladium and platinum sold in the third quarter of 2014 increased slightly to 132,400 ounces, compared to 131,400 ounces sold during the third quarter of 2013. As a result of earlier constraints on reprocessing slag inventories at the Stillwater Mine, metal inventory increased through the first quarter of 2014. Subsequently, inventories have been processed and PGM volumes in inventory have decreased. The Company’s average combined realized price on sales of palladium and platinum from mining operations was $983 per ounce in the third quarter of 2014, compared to $887 per ounce in the third quarter of 2013, a 10.8% increase.
The costs of metals sold from Mine Production totaled $85.2 million for the third quarter of 2014, compared to $83.9 million for the third quarter of 2013, a 1.5% increase. Higher royalties and metalliferous mines license tax (MMLT) driven by higher realized PGM prices contributed to the increase in cost of metals sold.
Revenues from PGM Recycling decreased to $109.5 million in the third quarter of 2014, down 30.2% from the $156.8 million in the third quarter of 2013. The decrease in PGM Recycling revenues in 2014 represents a return to more normal volumes of recycling after record performance in 2013. The Company’s combined average realization on recycling sales (which include palladium, platinum and rhodium) increased to $1,068 per ounce in the third quarter of 2014, compared to $1,026 per ounce realized in the third quarter of 2013. Recycling ounces sold decreased 33.6% to 101,400 ounces in the third quarter of 2014 from 152,600 ounces in the third quarter of 2013. Recycling ounces fed to the smelter, including ounces processed on a toll basis, decreased to 117,700 ounces in the third quarter of 2014, from 167,500 ounces in the third quarter of 2013. Revenues from sales of purchased recycling materials totaled $108.2 million in the third quarter of 2014, a decrease from $156.5 million in the third quarter of 2013. Tolling revenues increased to $1.3 million in the third quarter of 2014, compared to $0.3 million in the third quarter of 2013.
The costs of metals sold from PGM Recycling were $106.8 million in the third quarter of 2014, compared to $136.8 million in the third quarter of 2013, a decrease of 21.9%. This decrease was due to significantly lower recycling volumes processed and sold and the corresponding decrease in the total cost of acquiring recycling material for processing.
In addition to Mine Production and PGM Recycling metal sales, the Company recognized other revenue of $5.3 million for metal acquired in the open market and simultaneously resold to third parties during the third quarter of 2014. There were no comparable acquisitions in the open market in the third quarter of 2013.
The cost of metals sold in the open market for the quarter ended September 30, 2014, totaled $5.3 million. There were no open market acquisitions in the comparable period of 2013.
The Company’s total costs of metals sold (before depletion, depreciation, amortization, and corporate overhead expenses) decreased 10.6% to $197.3 million in the third quarter of 2014 from $220.8 million in the third quarter of 2013. The lower cost in the third quarter of 2014 was driven primarily by the 33.6% decrease in volumes of recycling material sold (and the lower associated cost of acquiring the contained metals) and was partially offset by the cost of slightly higher palladium and platinum ounces sold from Mine Production.
34
During the third quarter of 2014, the Company’s mining operations produced 123,000 ounces of PGMs, as shown in the following table:
Mined PGM Ounces Produced Three Months Ended September 30, 2014 and 2013 | |||||||||
Platinum | Palladium | Total | |||||||
Stillwater Mine | |||||||||
2014 | 17,500 | 59,400 | 76,900 | ||||||
2013 | 19,300 | 64,500 | 83,800 | ||||||
Percentage change | (9.3 | )% | (7.9 | )% | (8.2 | )% | |||
East Boulder Mine | |||||||||
2014 | 10,300 | 35,800 | 46,100 | ||||||
2013 | 9,200 | 31,200 | 40,400 | ||||||
Percentage change | 12.0 | % | 14.7 | % | 14.1 | % | |||
Totals | |||||||||
2014 | 27,800 | 95,200 | 123,000 | ||||||
2013 | 28,500 | 95,700 | 124,200 | ||||||
Percentage change | (2.5 | )% | (0.5 | )% | (1.0 | )% | |||
General and administrative (G&A) costs increased by $0.6 million to $10.0 million in the third quarter of 2014, compared to $9.4 million for the same period of 2013. This increase is primarily related to the increase in the share based compensation for the third quarter of 2014. Exploration expenses during the third quarter of 2014 decreased to $0.7 million from $2.1 million in the third quarter of 2013, with most of the decrease due to reduced exploration activity in 2014 on both the Marathon and Altar properties. Marketing expenses totaled less than $0.1 million in the third quarter of 2014, compared to $0.2 million in the third quarter of 2013, as the Company continued to cut back its palladium marketing efforts.
Total interest income for the third quarter of 2014 decreased to $0.9 million from $1.1 million in the corresponding quarter of 2013, mostly reflecting lower financing income on recycling balances in 2014. Interest expense in the third quarters of 2014 and 2013 was $6.0 million and $5.6 million, respectively, net of capitalized interest of $1.4 million and $1.2 million, respectively. Reduced interest expense as a result of the redemption of the $30 million of 8.0% Exempt Facility Revenue Bonds was more than offset by growth in accretion expense on the Company's convertible debentures.
The net foreign currency transaction gain recognized in the third quarter of 2014 was $1.0 million, compared to $6.2 million in the same quarter of 2013. During the third quarter of 2013, the Company recorded a foreign currency transaction gain of $6.7 million related to the deferred tax liability recorded (and subsequently revalued upon impairment) in association with the acquisition of Peregrine Metals Ltd. The reduction of the net foreign currency transaction gain in the third quarter of 2014 is primarily driven by the reduction in the deferred tax liability following the impairment taken in the prior year. During 2014, the rate of Argentine peso inflation has declined significantly, reducing the Company's currency gains. The overall gain was a result of the strength of the U.S. dollar relative to a rapidly depreciating Argentine peso. As the deferred tax obligation will be settled at a future date in Argentine pesos, changes in the relative currency values are recognized in the period within Foreign currency transaction gain, net on the Company's Consolidated Statements of Comprehensive Income (Loss).
35
Comparison of Nine-Month Periods Ended September 30, 2014 and 2013
The Company’s total revenues decreased by 9.5% to $721.5 million in the first nine months of 2014 compared to $797.1 million in the first nine months of 2013. The following analysis covers key factors contributing to the decrease in revenues:
SALES AND PRICE DATA
Nine Months Ended | |||||||||||||||
September 30, | Increase | Percentage | |||||||||||||
(In thousands, except for average prices) | 2014 | 2013 | (Decrease) | Change | |||||||||||
Revenues | $ | 721,452 | $ | 797,146 | $ | (75,694 | ) | (9 | )% | ||||||
Ounces Sold: | |||||||||||||||
Mine Production: | |||||||||||||||
Palladium (oz.) | 315 | 300 | 15 | 5 | % | ||||||||||
Platinum (oz.) | 93 | 84 | 9 | 11 | % | ||||||||||
Total | 408 | 384 | 24 | 6 | % | ||||||||||
PGM Recycling: (1) | |||||||||||||||
Palladium (oz.) | 171 | 230 | (59 | ) | (26 | )% | |||||||||
Platinum (oz.) | 103 | 149 | (46 | ) | (31 | )% | |||||||||
Rhodium (oz.) | 22 | 33 | (11 | ) | (33 | )% | |||||||||
Total | 296 | 412 | (116 | ) | (28 | )% | |||||||||
Other: (5) | |||||||||||||||
Palladium (oz.) | 6 | — | 6 | 100 | % | ||||||||||
By-products from Mine Production: (2) | |||||||||||||||
Rhodium (oz.) | 3 | 3 | — | — | |||||||||||
Gold (oz.) | 8 | 7 | 1 | 14 | % | ||||||||||
Silver (oz.) | 5 | 5 | — | — | |||||||||||
Copper (lb.) | 655 | 645 | 10 | 2 | % | ||||||||||
Nickel (lb.) | 1,066 | 1,040 | 26 | 3 | % | ||||||||||
Average realized price per ounce (3) | |||||||||||||||
Mine Production: | |||||||||||||||
Palladium ($/oz.) | $ | 809 | $ | 721 | $ | 88 | 12 | % | |||||||
Platinum ($/oz.) | $ | 1,435 | $ | 1,509 | $ | (74 | ) | (5 | )% | ||||||
Combined ($/oz.) (4) | $ | 951 | $ | 893 | $ | 58 | 6 | % | |||||||
PGM Recycling: (1) | |||||||||||||||
Palladium ($/oz.) | $ | 768 | $ | 709 | $ | 59 | 8 | % | |||||||
Platinum ($/oz.) | $ | 1,431 | $ | 1,548 | $ | (117 | ) | (8 | )% | ||||||
Rhodium ($/oz.) | $ | 1,019 | $ | 1,127 | $ | (108 | ) | (10 | )% | ||||||
Combined ($/oz.) (4) | $ | 1,018 | $ | 1,046 | $ | (28 | ) | (3 | )% | ||||||
Other: (5) | |||||||||||||||
Palladium ($/oz.) | $ | 882 | — | $ | 882 | 100 | % | ||||||||
By-products from Mine Production: (2) | |||||||||||||||
Rhodium ($/oz.) | $ | 1,167 | $ | 1,086 | $ | 81 | 7 | % | |||||||
Gold ($/oz.) | $ | 1,284 | $ | 1,431 | $ | (147 | ) | (10 | )% | ||||||
Silver ($/oz.) | $ | 20 | $ | 24 | $ | (4 | ) | (17 | )% | ||||||
Copper ($/lb.) | $ | 2.95 | $ | 3.16 | $ | (0.21 | ) | (7 | )% | ||||||
Nickel ($/lb.) | $ | 6.83 | $ | 5.55 | $ | 1.28 | 23 | % | |||||||
Average market price per ounce (3) | |||||||||||||||
Palladium ($/oz.) | $ | 808 | $ | 725 | $ | 83 | 11 | % | |||||||
Platinum ($/oz.) | $ | 1,437 | $ | 1,515 | $ | (78 | ) | (5 | )% | ||||||
Combined ($/oz.) (4) | $ | 951 | $ | 897 | $ | 54 | 6 | % | |||||||
36
(1) | Ounces sold and average realized price per ounce from PGM Recycling relate to ounces produced from processing of catalyst materials. |
(2) | By-product metals sold reflect contained metal produced from mined ore alongside the Company's primary production of palladium and platinum. Realized prices reflect net values (discounted due to product form and transportation and marketing charges) per unit received. |
(3) | The Company’s average realized price represents revenues, which include the effect of hedging gains and losses realized on commodity instruments and agreement discounts, divided by ounces sold. The average market price represents the average London Bullion Market Association afternoon postings for the actual months of the period. |
(4) | The Company calculates the combined average realized and a combined average market price of palladium and platinum using the same ratio as the rate of ounces of each respective metal that are produced from the base metal refinery. |
(5) | Ounces sold and average realized price per ounce from Other relate to ounces acquired periodically in the open market and simultaneously resold to third parties. |
For the first nine months of 2014, net revenues from sales of Mine Production (including proceeds from the sale of by-products) totaled $410.0 million, an increase of 12.6% compared to $364.2 million in the first nine months of 2013. This increase in Mine Production revenues reflects higher realized PGM prices in the first nine months of 2014 as compared to the first nine months of 2013, as well as slightly higher sales volumes in 2014. As a result of earlier constraints on reprocessing slag inventories at the Stillwater Mine, metal inventory increased through the first quarter of 2014. Subsequently, inventories have been processed and PGMs in inventory have decreased. Implementation of the Company's new supply and refining agreements with Johnson Matthey in July has reduced metal inventories. The Company's average combined realized price on sales of palladium and platinum from mining operations was $951 per ounce in the first nine months of 2014, compared to $893 per ounce in the first nine months of 2013, a 6.5% increase.
The cost of metals sold from Mine Production totaled $252.7 million in the first nine months of 2014, compared to $237.0 million in the first nine months of 2013, an increase of 6.6%, driven largely by labor and materials costs and higher sales volumes.
Revenues from PGM Recycling reflected a decrease of 29.4% during the first nine months of 2014, to $305.8 million from $432.9 million in the first nine months of 2013. Recycling ounces sold during the first nine months of 2014 totaled 296,300 ounces, a decrease of 28.2% compared to the 412,600 ounces sold in the first nine months of 2013. The Company’s combined average realization on recycling sales (which include palladium, platinum and rhodium) decreased to $1,018 per ounce in the first nine months of 2014 from $1,046 per ounce in the first nine months of 2013. Overall, recycling volumes processed during the first nine months of 2014 totaled 353,500 ounces of PGMs, a decrease of 28.8% from the 496,700 ounces processed in the first nine months of 2013. This decrease in recycling activity during the first nine months of 2014 is attributable to several factors, including unusually strong performance in 2013 as a result of reprocessing furnace brick from the Company's smelter and high availability of recycling material in the market during most of 2013.
Overall, recycling costs of metals sold decreased by 26.1% to $297.8 million in the first nine months of 2014 from $402.9 million in the first nine months of 2013, mostly the result of lower volumes available for purchase during 2014.
In addition to Mine Production and PGM Recycling metal sales, the Company recognized Other revenue of $5.3 million on PGMs acquired in the open market and simultaneously resold to third parties. There was no comparable revenue during the same period in 2013.
The cost of metal acquired in the open market and simultaneously resold to third parties in the first nine months of 2014 totaled $5.3 million.There were no open market acquisitions in the comparable period of 2013.
The Company’s total cost of metals sold (before depletion, depreciation, amortization, and corporate overhead expenses) decreased to $555.9 million in the first nine months of 2014, from $639.9 million in the first nine months of 2013, a decrease of 13.1%.
37
During the first nine months of 2014, the Company’s mining operations produced 380,100 ounces of PGMs, as shown in the following table:
Mined PGM Ounces Produced Nine Months Ended September 30, 2014 and 2013 | |||||||||
Platinum | Palladium | Total | |||||||
Stillwater Mine | |||||||||
2014 | 57,600 | 193,000 | 250,600 | ||||||
2013 | 61,400 | 206,000 | 267,400 | ||||||
Percentage change | (6.2 | )% | (6.3 | )% | (6.3 | )% | |||
East Boulder Mine | |||||||||
2014 | 28,800 | 100,700 | 129,500 | ||||||
2013 | 25,900 | 89,500 | 115,400 | ||||||
Percentage change | 11.2 | % | 12.5 | % | 12.2 | % | |||
Totals | |||||||||
2014 | 86,400 | 293,700 | 380,100 | ||||||
2013 | 87,300 | 295,500 | 382,800 | ||||||
Percentage change | (1.0 | )% | (0.6 | )% | (0.7 | )% | |||
The increase in production at the East Boulder Mine is in part the result of better than normal ore grades experienced during 2014.
General and administrative (G&A) costs decreased to $27.4 million in the first nine months of 2014, from $36.0 million in the first nine months of 2013, a reduction of 23.9%. Included in the G&A for the nine-month period ended September 30, 2013, were costs related to the retirement of the Company's former Chief Executive Officer, software licensing fees and higher share based compensation expense. The nine-month period ended September 30, 2014, included reorganization costs of $6.0 million as compared to the same period of 2013, which included proxy contest expenses of $4.3 million, and non-cash accelerated equity-based compensation of $9.1 million. The Company recognized $2.4 million in exploration expenses related to its mineral properties in Canada and South America in the first nine months of 2014, compared to $10.2 million in the first nine months of 2013. Most of this reduction resulted from a decision to scale back exploration drilling in South America during 2014. Marketing expenses totaled $0.6 million and $4.2 million for the nine month periods ended September 30, 2014 and 2013, respectively, reflecting the Company's decision to curtail its palladium marketing efforts.
Total interest income for the first nine months of 2014 decreased to $2.8 million from $3.5 million in the first nine months of 2013, reflecting decreased financing income on recycling balances in 2014. The Company’s balance of cash and related liquid assets earning interest increased during the first nine months of 2014 to $509.1 million at September 30, 2014, from $496.0 million reported at December 31, 2013.
During the first nine months of 2014, the Company recorded a net foreign currency transaction gain of $5.4 million, compared to a net gain of $15.7 million in the first nine months of 2013. Essentially all of these net gains related to the remeasurement into U.S. dollars of the deferred taxes recorded (and subsequently revalued upon impairment) in association with the acquisition of Peregrine Metals Ltd. The reduction of the net foreign currency transaction gain in the first nine months of 2014 is primarily driven by the reduction in the deferred tax liability following the impairment taken in the prior year. During 2014, the rate of Argentine peso inflation has declined significantly, reducing the Company's currency gains. The gain was a result of the strength of the U.S. dollar relative to a rapidly depreciating Argentine peso. The gains reflect the impact of a high inflation rate in Argentina as the deferred tax obligation is remeasured from Argentine pesos into U.S. dollars.
38
LIQUIDITY AND CAPITAL RESOURCES
Net cash provided by operating activities (which includes changes in working capital) was $131.7 million for the nine-month period ended September 30, 2014, compared to $81.7 million in the nine-month period ended September 30, 2013, an increase of 61.2%. The Company’s net cash flow from operating activities is affected by several key factors, including net realized prices for its products, the level of PGM production from the mines, cash operating costs, and the volume of activity in its PGM Recycling segment. Mining productivity rates and ore grades affect both PGM production and cash costs of production. Net cash flow from operations also takes into account changes in gross working capital in the PGM Recycling segment, including changes to inventories and advances and variation in the timing of trade receipts and payments. The stronger reported net cash provided from operating activities for the first nine months of 2014 reflected higher 2014 PGM prices and sales ounces from mining activity (partially offset by the weaker recycling volumes in 2014), lower G&A and exploration costs, and lower product inventories and trade receivables. (A delayed customer payment due at the end of September 2013 had inflated trade receivables in the year-earlier period.)
For its PGM Recycling segment, the Company customarily enters into fixed forward sales contracts that set the selling price for most of the PGMs recovered from recycled materials. Because the selling price of recycling material held by the Company is fixed up front by these forward sales contracts, day-to-day changes in the market price of palladium and platinum have almost no effect on the percentage margins earned from processing these materials or on cash flow from recycling operations. However, as PGM prices rise or fall over time, the total volume of material available in the market also may rise or fall, which affects the total profitability of the Company's recycling activities. On average, it takes the Company two to three months from the date of receipt to process and deliver metal from purchased lots of recycling material.
Changes in the cash costs of Mine Production generally flow through dollar-for-dollar into cash flow from operations. Using metals market prices at September 30, 2014, a reduction of annual mined production due to grade of 10%, or approximately 52,000 to 53,000 ounces would reduce annual cash flow from operations by an estimated $44 million.
Net cash used in investing activities for the nine-month period ended September 30, 2014, was approximately $130.2 million, comprised mainly of $87.0 million of cash capital expenditures and $43.5 million of net purchases of short-term investments. For the nine-month period ended September 30, 2013, net cash used by investing activities was $60.7 million, comprised of $91.2 million of cash capital expenditures and offset by a $30.3 million net reduction in investments.
Net cash consumed by financing activities in the nine-month period ended September 30, 2014, was $30.5 million reflecting the redemption of the 8.0% Exempt Facility Revenue Bonds, offset in part by $1.0 million of cash received from stock option exercises. For the nine-month period ended September 30, 2013, net cash used by financing activities was $165.6 million, mostly attributable to the payment made to redeem $164.3 million of outstanding 1.875% convertible debentures in March 2013.
At September 30, 2014, the Company’s cash and cash equivalents balance was $257.6 million, compared to $286.7 million at December 31, 2013. If highly liquid investments are included with available cash, the Company’s balance sheet liquidity is $509.1 million at September 30, 2014, an increase of $13.1 million from $496.0 million at December 31, 2013 despite the redemption of the $30.0 million 8.0% Exempt Facility Revenue Bonds, Series 2000. The September 30, 2014, cash and liquidity balances include approximately $17.2 million of cash held in Canada that is dedicated as funding for the Marathon PGM-copper project (and other related properties) and is not available to the Company for its general corporate purposes. Total working capital (including cash and cash equivalents) at September 30, 2014, was $616.9 million, compared to $614.8 million at December 31, 2013.
Outstanding debt reported at September 30, 2014, was approximately $292.3 million, down from the $310.7 million at December 31, 2013; the decrease primarily reflects the $30.0 million redemption of the 8.0% Exempt Facility Revenue Bonds, Series 2000, offset in part by accretion of the convertible debentures. The Company’s total debt includes approximately $286.8 million of 1.75% convertible debentures, $2.2 million of 1.875% convertible debentures, and less than $0.2 million of financing for a land purchase in 2012; and $3.1 million due under a capital lease. The $286.8 million of 1.75% convertible debentures represents the net discounted value of 1.75% notes first redeemable in 2019 valued against a borrowing rate of 8.5%; the gross principal amount borrowed was $396.75 million. The Company expects to pay $3.5 million of interest during the remaining three months of 2014 related to its outstanding debt obligations. The Company made cash payments for interest of $4.9 million for the nine-month period ended September 30, 2014, compared to $6.2 million for the same period of 2013.
The Company has in place a $125.0 million asset-backed revolving credit facility with a group of banks. Net available capacity under the borrowing base was approximately, $62.1 million at September 30, 2014, after taking into account $19.6 million utilized for undrawn irrevocable letters of credit under the facility.
39
CONTRACTUAL CASH OBLIGATIONS
The Company's contractual cash obligations as of December 31, 2013, are summarized in Item 7, "Management's Discussion and Analysis - Liquidity and Capital Resources - Contractual Obligations" of the Company's 2013 Annual Report on Form 10-K. In the first nine months of 2014, there have been no material changes in the Company's contractual obligations outside the ordinary course of business.
FACTORS THAT MAY AFFECT FUTURE RESULTS AND FINANCIAL CONDITION
Some statements contained in this report are forward-looking statements within the meaning of Section 27A of the Securities Act of 1933, as amended (Securities Act), and Section 21E of the Securities Exchange Act of 1934, as amended (Exchange Act), and, therefore, involve uncertainties or risks that could cause actual results to differ materially. These statements may contain words such as “believes,” “anticipates,” “plans,” “expects,” “intends,” “estimates,” “will” or similar expressions. Such statements also include, but are not limited to, comments regarding expansion plans, costs, grade, production and recovery rates; permitting; financing needs and the terms of future credit facilities; exchange rates; capital expenditures; increases in processing capacity; cost reduction measures; safety; timing for engineering studies; environmental permitting and compliance; litigating; labor matters; and the palladium, platinum, copper and gold market. The forward-looking statements in this report are based on assumptions and analyses made by the Company in light of its experience and its perception of historical trends, current conditions, expected future developments, and other factors that it believes are appropriate under the circumstances. These statements are not guarantees of the Company’s future performance and are subject to risks, uncertainties and other important factors that could cause its actual performance or achievements to differ materially from those expressed or implied by these forward-looking statements. Additional information regarding factors that could cause results to differ materially from management’s expectations is found in the Company’s 2013 Annual Report on Form 10-K and in its previously issued 2014 Quarterly Reports on Form 10-Q (all on file with the United States Securities and Exchange Commission, and available on the Company’s website at www.stillwatermining.com), and in corresponding filings with Canadian securities regulatory authorities.
The Company intends that the forward-looking statements contained herein be subject to the above-mentioned statutory safe harbors. Investors are cautioned not to rely on forward-looking statements. The forward-looking statements contained herein speak only as of the date of this report and the Company disclaims any obligation to update forward-looking statements.
CRITICAL ACCOUNTING POLICIES
The Company’s critical accounting policies are discussed in detail in the Company’s 2013 Annual Report on Form 10-K.
40
KEY OPERATING FACTORS
Stillwater Mining Company
Key Operating Factors
(Unaudited)
Three Months Ended | Nine Months Ended | |||||||||||||||
September 30, | September 30, | |||||||||||||||
(In thousands, except where noted) | 2014 | 2013 | 2014 | 2013 | ||||||||||||
OPERATING AND COST DATA FOR MINE PRODUCTION | ||||||||||||||||
Consolidated: | ||||||||||||||||
Ounces produced | ||||||||||||||||
Palladium | 95 | 96 | 294 | 296 | ||||||||||||
Platinum | 28 | 28 | 86 | 87 | ||||||||||||
Total | 123 | 124 | 380 | 383 | ||||||||||||
Tons milled | 281 | 301 | 845 | 902 | ||||||||||||
Mill head grade (ounce per ton) | 0.47 | 0.45 | 0.48 | 0.46 | ||||||||||||
Sub-grade tons milled (1) | 27 | 15 | 61 | 56 | ||||||||||||
Sub-grade tons mill head grade (ounce per ton) | 0.14 | 0.16 | 0.16 | 0.17 | ||||||||||||
Total tons milled (1) | 308 | 316 | 906 | 958 | ||||||||||||
Combined mill head grade (ounce per ton) | 0.44 | 0.43 | 0.46 | 0.44 | ||||||||||||
Total mill recovery (%) | 92 | 91 | 92 | 92 | ||||||||||||
Total mine concentrate shipped (tons) (3) | 6,997 | 7,045 | 21,201 | 21,361 | ||||||||||||
Platinum grade in concentrate (ounce per ton) (3) | 4.11 | 4.60 | 4.44 | 4.44 | ||||||||||||
Palladium grade in concentrate (ounce per ton) (3) | 13.95 | 14.05 | 14.59 | 14.36 | ||||||||||||
Total cash costs per ounce - net of credits (Non-GAAP) (2) | $ | 554 | $ | 427 | $ | 557 | $ | 495 | ||||||||
Total cash costs per ton milled - net of credits (Non-GAAP) (2) | $ | 221 | $ | 168 | $ | 234 | $ | 198 | ||||||||
Stillwater Mine: | ||||||||||||||||
Ounces produced | ||||||||||||||||
Palladium | 59 | 65 | 193 | 206 | ||||||||||||
Platinum | 18 | 19 | 58 | 61 | ||||||||||||
Total | 77 | 84 | 251 | 267 | ||||||||||||
Tons milled | 161 | 188 | 506 | 579 | ||||||||||||
Mill head grade (ounce per ton) | 0.51 | 0.48 | 0.53 | 0.49 | ||||||||||||
Sub-grade tons milled (1) | 15 | 7 | 28 | 29 | ||||||||||||
Sub-grade tons mill head grade (ounce per ton) | 0.18 | 0.25 | 0.22 | 0.23 | ||||||||||||
Total tons milled (1) | 176 | 195 | 534 | 608 | ||||||||||||
Combined mill head grade (ounce per ton) | 0.48 | 0.47 | 0.51 | 0.48 | ||||||||||||
Total mill recovery (%) | 92 | 91 | 93 | 92 | ||||||||||||
Total mine concentrate shipped (tons) (3) | 3,694 | 4,082 | 11,838 | 12,722 | ||||||||||||
Platinum grade in concentrate (ounce per ton) (3) | 5.00 | 4.90 | 5.40 | 5.05 | ||||||||||||
Palladium grade in concentrate (ounce per ton) (3) | 16.66 | 16.19 | 17.33 | 16.66 | ||||||||||||
Total cash costs per ounce - net of credits (Non-GAAP) (2) | $ | 570 | $ | 434 | $ | 550 | $ | 490 | ||||||||
Total cash costs per ton milled - net of credits (Non-GAAP) (2) | $ | 249 | $ | 187 | $ | 258 | $ | 215 | ||||||||
41
Stillwater Mining Company
Key Operating Factors (Continued)
(Unaudited)
Three Months Ended | Nine Months Ended | |||||||||||||||
September 30, | September 30, | |||||||||||||||
(In thousands, except where noted) | 2014 | 2013 | 2014 | 2013 | ||||||||||||
OPERATING AND COST DATA FOR MINE PRODUCTION | ||||||||||||||||
East Boulder Mine: | ||||||||||||||||
Ounces produced | ||||||||||||||||
Palladium | 36 | 31 | 101 | 90 | ||||||||||||
Platinum | 10 | 9 | 28 | 26 | ||||||||||||
Total | 46 | 40 | 129 | 116 | ||||||||||||
Tons milled | 120 | 113 | 339 | 323 | ||||||||||||
Mill head grade (ounce per ton) | 0.42 | 0.40 | 0.42 | 0.39 | ||||||||||||
Sub-grade tons milled (1) | 12 | 8 | 33 | 27 | ||||||||||||
Sub-grade tons mill head grade (ounce per ton) | 0.10 | 0.10 | 0.10 | 0.10 | ||||||||||||
Total tons milled (1) | 132 | 121 | 372 | 350 | ||||||||||||
Combined mill head grade (ounce per ton) | 0.39 | 0.37 | 0.39 | 0.37 | ||||||||||||
Total mill recovery (%) | 91 | 90 | 90 | 90 | ||||||||||||
Total mine concentrate shipped (tons) (3) | 3,303 | 2,963 | 9,363 | 8,639 | ||||||||||||
Platinum grade in concentrate (ounce per ton) (3) | 3.13 | 4.20 | 3.24 | 3.56 | ||||||||||||
Palladium grade in concentrate (ounce per ton) (3) | 10.93 | 11.10 | 11.12 | 10.97 | ||||||||||||
Total cash costs per ounce - net of credits (Non-GAAP) (2) | $ | 527 | $ | 412 | $ | 572 | $ | 507 | ||||||||
Total cash costs per ton milled - net of credits (Non-GAAP) (2) | $ | 184 | $ | 137 | $ | 199 | $ | 167 | ||||||||
(1) | Sub-grade tons milled includes reef waste material only. Total tons milled includes ore tons and sub-grade tons only. See “Proven and Probable Ore Reserves – Discussion” in the Company’s 2013 Annual Report on Form 10-K for further information. |
(2) | Total cash costs include total operating costs plus royalties, insurance and taxes other than income taxes. Cash costs per ounce, is a non-GAAP financial measure that management uses to monitor and evaluate the efficiency of its mining operations. This measure of cost is not defined under U.S. Generally Accepted Accounting Principles (GAAP). Please See “Reconciliation of Non-GAAP Financial Measures to Consolidated Costs of Revenues” and the accompanying discussion for additional detail. |
(3) | The concentrate tonnage and grade values are inclusive of periodic re-processing of smelter slag and brick PGM bearing materials. |
42
Stillwater Mining Company
Key Operating Factors (Continued)
(Unaudited)
Three Months Ended | Nine Months Ended | |||||||||||||||
September 30, | September 30, | |||||||||||||||
(In thousands, except for average prices) | 2014 | 2013 | 2014 | 2013 | ||||||||||||
SALES AND PRICE DATA | ||||||||||||||||
Ounces sold | ||||||||||||||||
Mine Production: | ||||||||||||||||
Palladium (oz.) | 103 | 101 | 315 | 300 | ||||||||||||
Platinum (oz.) | 29 | 30 | 93 | 84 | ||||||||||||
Total | 132 | 131 | 408 | 384 | ||||||||||||
PGM Recycling: (1) | ||||||||||||||||
Palladium (oz.) | 58 | 83 | 171 | 230 | ||||||||||||
Platinum (oz.) | 36 | 57 | 103 | 149 | ||||||||||||
Rhodium (oz.) | 7 | 12 | 22 | 33 | ||||||||||||
Total | 101 | 152 | 296 | 412 | ||||||||||||
Other: (5) | ||||||||||||||||
Palladium (oz.) | 6 | — | 6 | — | ||||||||||||
By-products from Mine Production: (2) | ||||||||||||||||
Rhodium (oz.) | 1 | 1 | 3 | 3 | ||||||||||||
Gold (oz.) | 3 | 2 | 8 | 7 | ||||||||||||
Silver (oz.) | 2 | 1 | 5 | 5 | ||||||||||||
Copper (lb.) | 173 | 171 | 655 | 645 | ||||||||||||
Nickel (lb.) | 289 | 353 | 1,066 | 1,040 | ||||||||||||
Average realized price per ounce (3) | ||||||||||||||||
Mine Production: | ||||||||||||||||
Palladium ($/oz.) | $ | 859 | $ | 722 | $ | 809 | $ | 721 | ||||||||
Platinum ($/oz.) | $ | 1,421 | $ | 1,447 | $ | 1,435 | $ | 1,509 | ||||||||
Combined ($/oz) (4) | $ | 983 | $ | 887 | $ | 951 | $ | 893 | ||||||||
PGM Recycling: (1) | ||||||||||||||||
Palladium ($/oz.) | $ | 821 | $ | 716 | $ | 768 | $ | 709 | ||||||||
Platinum ($/oz.) | $ | 1,453 | $ | 1,459 | $ | 1,431 | $ | 1,548 | ||||||||
Rhodium ($/oz) | $ | 1,078 | $ | 1,097 | $ | 1,019 | $ | 1,127 | ||||||||
Combined ($/oz) (4) | $ | 1,068 | $ | 1,026 | $ | 1,018 | $ | 1,046 | ||||||||
Other: (5) | ||||||||||||||||
Palladium ($/oz.) | $ | 882 | $ | — | $ | 882 | $ | — | ||||||||
By-products from Mine Production: (2) | ||||||||||||||||
Rhodium ($/oz.) | $ | 1,320 | $ | 975 | $ | 1,167 | $ | 1,086 | ||||||||
Gold ($/oz.) | $ | 1,266 | $ | 1,346 | $ | 1,284 | $ | 1,431 | ||||||||
Silver ($/oz.) | $ | 19 | $ | 21 | $ | 20 | $ | 24 | ||||||||
Copper ($/lb.) | $ | 2.96 | $ | 3.05 | $ | 2.95 | $ | 3.16 | ||||||||
Nickel ($/lb.) | $ | 6.79 | $ | 5.11 | $ | 6.83 | $ | 5.55 | ||||||||
Average market price per ounce (3) | ||||||||||||||||
Palladium ($/oz.) | $ | 863 | $ | 722 | $ | 808 | $ | 725 | ||||||||
Platinum ($/oz.) | $ | 1,435 | $ | 1,449 | $ | 1,437 | $ | 1,515 | ||||||||
Combined ($/oz) (4) | $ | 989 | $ | 887 | $ | 951 | $ | 897 | ||||||||
43
(1) | Ounces sold and average realized price per ounce from PGM Recycling relate to ounces produced from processing of catalyst materials. |
(2) | By-product metals sold reflect contained metal produced from mined ore alongside the Company's primary production of palladium and platinum. Realized prices reflect net values (discounted due to product form and transportation and marketing charges) per unit received. |
(3) | The Company’s average realized price represents revenues, which include the effect of hedging gains and losses realized on commodity instruments and agreement discounts, divided by ounces sold. The average market price represents the average London Bullion Market Association afternoon postings for the actual months of the period. |
(4) | The Company calculates the combined average realized and a combined average market price of palladium and platinum using the same ratio as the rate of ounces of each respective metal that are produced from the base metal refinery. |
(5) | Ounces sold and average realized price per ounce from Other relate to ounces acquired periodically in the open market and simultaneously resold to third parties. |
RECONCILIATION OF NON-GAAP FINANCIAL MEASURES TO CONSOLIDATED COSTS OF REVENUES
The Company utilizes certain non-GAAP financial measures as indicators in assessing the performance of its mining and processing operations during any period. Because of the processing time required to complete the extraction of finished PGM products, there are typically lags of one to three months between ore production and sale of the finished product. Sales in any period include some portion of material mined and processed from prior periods as the revenue recognition process is completed. Consequently, while costs of revenues (a GAAP measure included in the Company’s Consolidated Statements of Comprehensive Income (Loss)) appropriately reflects the expense associated with the materials sold in any period, the Company has developed certain non-GAAP financial measures to assess the costs associated with its producing and processing activities in a particular period and to compare those costs between periods.
While the Company believes that these non-GAAP financial measures may also be of value to outside readers, both as general indicators of the Company’s mining efficiency from period to period and as insight into how the Company internally measures its operating performance, these non-GAAP financial measures are not standardized across the mining industry and in most cases will not be directly comparable to similar measures that may be provided by other companies. These non-GAAP financial measures are only useful as indicators of relative operational performance in any period, and because they do not take into account the inventory timing differences that are included in costs of revenues, they cannot meaningfully be used to develop measures of earnings or profitability. A reconciliation of these measures to costs of revenues, the most comparable measure under GAAP, for each period shown is provided as part of the following tables, and a description of each non-GAAP financial measure is provided below.
Total Consolidated Costs of Revenues: For the Company as a whole, this measure is equal to total costs of revenues, as reported in the Company's Consolidated Statements of Comprehensive Income (Loss). For the Stillwater Mine, the East Boulder Mine, and other PGM activities, the Company segregates the expenses within total costs of revenues that are directly associated with each of these activities and then allocates the remaining facility costs included in total cost of revenues in proportion to the monthly volumes from each activity. The resulting total costs of revenues measures for the Stillwater Mine, the East Boulder Mine and other PGM activities are equal in total to total consolidated costs of revenues as reported in the Company’s Consolidated Statements of Comprehensive Income (Loss).
Total Cash Costs (Non-GAAP): This non-GAAP financial measure is calculated as total costs of revenues (for each mine or combined) adjusted to exclude gains or losses on asset dispositions, costs and profit from recycling activities, revenues from the sale of mine by-products, depreciation and amortization and asset retirement costs, and timing differences resulting from changes in product inventories. The Company uses this measure as a comparative indication of the cash costs related to production and processing operations in any period. It is a measure of extraction efficiency.
When divided by the total tons milled in the respective period, Total Cash Costs per Ton Milled (Non-GAAP) – measured for each mine or combined – provides an indication of the level of cash costs incurred per ton milled in that period. Because of variability of ore grade in the Company’s mining operations, production efficiency underground is frequently measured against ore tons produced rather than contained PGM ounces. Because ore tons are first weighed as they are fed into the mill, mill feed is the first point at which production tons are measured precisely. Consequently, Total Cash Costs per Ton Milled (Non-GAAP) is a general measure of production efficiency, and is affected both by the level of Total Cash Costs (Non-GAAP) and by the volume of tons produced and fed to the mill.
44
When divided by the total recoverable PGM ounces from production in the respective period, Total Cash Costs per Ounce (Non-GAAP) – measured for each mine or combined – provides an indication of the level of cash costs incurred per PGM ounce produced in that period. Recoverable PGM ounces from production are an indication of the amount of PGM product extracted through mining in any period. Because ultimately extracting PGM material is the objective of mining, the cash cost per ounce of extracting and processing PGM ounces in a period is a useful measure for comparing extraction efficiency between periods and between the Company’s mines. Consequently, Total Cash Costs per Ounce (Non-GAAP) in any period is a general measure of extraction efficiency, and is affected by the level of Total Cash Costs (Non-GAAP), by the grade of the ore produced and by the volume of ore produced in the period.
Stillwater Mining Company
Reconciliation of Non-GAAP Financial Measures to Costs of Revenues
(Unaudited)
Three Months Ended | Nine Months Ended | |||||||||||||||
September 30, | September 30, | |||||||||||||||
(In thousands, except per ounce and per ton data) | 2014 | 2013 | 2014 | 2013 | ||||||||||||
Consolidated: | ||||||||||||||||
Total cash costs before by-product and recycling credits (Non-GAAP) | $ | 78,156 | $ | 80,292 | $ | 243,291 | $ | 242,465 | ||||||||
By-product credit | (6,929 | ) | (6,652 | ) | (22,238 | ) | (21,103 | ) | ||||||||
Recycling income credit | (3,114 | ) | (20,553 | ) | (9,207 | ) | (31,873 | ) | ||||||||
Total cash costs net of by-product and recycling credits (Non-GAAP) | $ | 68,113 | $ | 53,087 | $ | 211,846 | $ | 189,489 | ||||||||
Divided by platinum/palladium ounces produced | 123 | 124 | 380 | 383 | ||||||||||||
Total cash costs before by-product and recycling credits per ounce Pt/Pd produced (Non-GAAP) | $ | 635 | $ | 646 | $ | 640 | $ | 633 | ||||||||
By-product credit per ounce Pt/Pd produced | (56 | ) | (54 | ) | (59 | ) | (55 | ) | ||||||||
Recycling income credit per ounce Pt/Pd produced | (25 | ) | (165 | ) | (24 | ) | (83 | ) | ||||||||
Total cash costs net of by-product and recycling credits per ounce Pt/Pd produced (Non-GAAP) | $ | 554 | $ | 427 | $ | 557 | $ | 495 | ||||||||
Divided by ore tons milled | 308 | 316 | 906 | 958 | ||||||||||||
Total cash costs before by-product and recycling credits per ore ton milled (Non-GAAP) | $ | 253 | $ | 254 | $ | 269 | $ | 253 | ||||||||
By-product credit per ore ton milled | (22 | ) | (21 | ) | (25 | ) | (22 | ) | ||||||||
Recycling income credit per ore ton milled | (10 | ) | (65 | ) | (10 | ) | (33 | ) | ||||||||
Total cash costs net of by-product and recycling credits per ore ton milled (Non-GAAP) | $ | 221 | $ | 168 | $ | 234 | $ | 198 | ||||||||
Reconciliation to consolidated costs of revenues: | ||||||||||||||||
Total cash costs net of by-product and recycling credits (Non-GAAP) | $ | 68,113 | $ | 53,087 | $ | 211,846 | $ | 189,489 | ||||||||
Asset retirement costs | 184 | 174 | 554 | 512 | ||||||||||||
Depletion, depreciation and amortization | 16,923 | 15,057 | 49,373 | 43,824 | ||||||||||||
Depletion, depreciation and amortization (in inventory) | (1,508 | ) | (410 | ) | (1,848 | ) | (282 | ) | ||||||||
Change in product inventories | 13,686 | 3,857 | 16,090 | (5,653 | ) | |||||||||||
Cost of PGM Recycling | 106,801 | 136,843 | 297,773 | 402,859 | ||||||||||||
PGM Recycling - depreciation | 258 | 285 | 761 | 804 | ||||||||||||
By-product credit | 6,929 | 6,652 | 22,238 | 21,103 | ||||||||||||
Profit from PGM Recycling (before gain/loss on asset disposals) | 3,114 | 20,553 | 9,207 | 31,873 | ||||||||||||
Total consolidated cost of revenues | $ | 214,500 | $ | 236,098 | $ | 605,994 | $ | 684,529 | ||||||||
45
Stillwater Mining Company
Reconciliation of Non-GAAP Financial Measures to Consolidated Costs of Revenues (Continued)
(Unaudited)
Three Months Ended | Nine Months Ended | |||||||||||||||
September 30, | September 30, | |||||||||||||||
(In thousands, except per ounce and per ton data) | 2014 | 2013 | 2014 | 2013 | ||||||||||||
Stillwater Mine: | ||||||||||||||||
Total cash costs before by-product and recycling credits (Non-GAAP) | $ | 49,552 | $ | 54,234 | $ | 156,720 | $ | 165,520 | ||||||||
By-product credit | (3,812 | ) | (3,886 | ) | (12,854 | ) | (12,634 | ) | ||||||||
Recycling income credit | (1,944 | ) | (13,934 | ) | (6,067 | ) | (21,975 | ) | ||||||||
Total cash costs net of by-product and recycling credits (Non-GAAP) | $ | 43,796 | $ | 36,414 | $ | 137,799 | $ | 130,911 | ||||||||
Divided by platinum/palladium ounces produced | 77 | 84 | 251 | 267 | ||||||||||||
Total cash costs before by-product and recycling credits per ounce Pt/Pd produced (Non-GAAP) | $ | 645 | $ | 646 | $ | 625 | $ | 619 | ||||||||
By-product credit per ounce Pt/Pd produced | (50 | ) | (46 | ) | (51 | ) | (47 | ) | ||||||||
Recycling income credit per ounce Pt/Pd produced | (25 | ) | (166 | ) | (24 | ) | (82 | ) | ||||||||
Total cash costs net of by-product and recycling credits per ounce Pt/Pd produced (Non-GAAP) | $ | 570 | $ | 434 | $ | 550 | $ | 490 | ||||||||
Divided by ore tons milled | 176 | 195 | 534 | 608 | ||||||||||||
Total cash costs before by-product and recycling credits per ore ton milled (Non-GAAP) | $ | 282 | $ | 278 | $ | 293 | $ | 272 | ||||||||
By-product credit per ore ton milled | (22 | ) | (20 | ) | (24 | ) | (21 | ) | ||||||||
Recycling income credit per ore ton milled | (11 | ) | (71 | ) | (11 | ) | (36 | ) | ||||||||
Total cash costs net of by-product and recycling credits per ore ton milled (Non-GAAP) | $ | 249 | $ | 187 | $ | 258 | $ | 215 | ||||||||
Reconciliation to costs of revenues: | ||||||||||||||||
Total cash costs net of by-product and recycling credits (Non-GAAP) | $ | 43,796 | $ | 36,414 | $ | 137,799 | $ | 130,911 | ||||||||
Asset retirement costs | 175 | 161 | 520 | 474 | ||||||||||||
Depletion, depreciation and amortization | 12,273 | 11,539 | 36,934 | 33,666 | ||||||||||||
Depletion, depreciation and amortization (in inventory) | (1,386 | ) | (407 | ) | (2,207 | ) | (215 | ) | ||||||||
Change in product inventories | 6,753 | 3,261 | 10,482 | (2,953 | ) | |||||||||||
By-product credit | 3,812 | 3,886 | 12,854 | 12,634 | ||||||||||||
Profit from PGM Recycling (before gain/loss on asset disposals) | 1,944 | 13,934 | 6,067 | 21,975 | ||||||||||||
Total cost of revenues | $ | 67,367 | $ | 68,788 | $ | 202,449 | $ | 196,492 | ||||||||
46
Stillwater Mining Company
Reconciliation of Non-GAAP Financial Measures to Consolidated Costs of Revenues (Continued)
(Unaudited)
Three Months Ended | Nine Months Ended | |||||||||||||||
September 30, | September 30, | |||||||||||||||
(In thousands, except per ounce and per ton data) | 2014 | 2013 | 2014 | 2013 | ||||||||||||
East Boulder | ||||||||||||||||
Total cash costs before by-product and recycling credits (Non-GAAP) | $ | 28,604 | $ | 26,058 | $ | 86,571 | $ | 76,945 | ||||||||
By-product credit | (3,117 | ) | (2,766 | ) | (9,384 | ) | (8,469 | ) | ||||||||
Recycling income credit | (1,170 | ) | (6,619 | ) | (3,140 | ) | (9,898 | ) | ||||||||
Total cash costs net of by-product and recycling credits (Non-GAAP) | $ | 24,317 | $ | 16,673 | $ | 74,047 | $ | 58,578 | ||||||||
Divided by platinum/palladium ounces produced | 46 | 40 | 129 | 116 | ||||||||||||
Total cash costs before by-product and recycling credits per ounce Pt/Pd produced (Non-GAAP) | $ | 620 | $ | 644 | $ | 668 | $ | 666 | ||||||||
By-product credit per ounce Pt/Pd produced | (68 | ) | (68 | ) | (72 | ) | (73 | ) | ||||||||
Recycling income credit per ounce Pt/Pd produced | (25 | ) | (164 | ) | (24 | ) | (86 | ) | ||||||||
Total cash costs net of by-product and recycling credits per ounce Pt/Pd produced (Non-GAAP) | $ | 527 | $ | 412 | $ | 572 | $ | 507 | ||||||||
Divided by ore tons milled | 132 | 121 | 372 | 350 | ||||||||||||
Total cash costs before by-product and recycling credits per ore ton milled (Non-GAAP) | $ | 217 | $ | 214 | $ | 232 | $ | 219 | ||||||||
By-product credit per ore ton milled | (24 | ) | (23 | ) | (25 | ) | (24 | ) | ||||||||
Recycling income credit per ore ton milled | (9 | ) | (54 | ) | (8 | ) | (28 | ) | ||||||||
Total cash costs net of by-product and recycling credits per ore ton milled (Non-GAAP) | $ | 184 | $ | 137 | $ | 199 | $ | 167 | ||||||||
Reconciliation to costs of revenues: | ||||||||||||||||
Total cash costs net of by-product and recycling credits (Non-GAAP) | $ | 24,317 | $ | 16,673 | $ | 74,047 | $ | 58,578 | ||||||||
Asset retirement costs | 9 | 13 | 34 | 38 | ||||||||||||
Depletion, depreciation and amortization | 4,650 | 3,518 | 12,439 | 10,158 | ||||||||||||
Depletion, depreciation and amortization (in inventory) | (122 | ) | (3 | ) | 359 | (67 | ) | |||||||||
Change in product inventories | 1,655 | 596 | 251 | (2,700 | ) | |||||||||||
By-product credit | 3,117 | 2,766 | 9,384 | 8,469 | ||||||||||||
Profit from PGM Recycling (before gain/loss on asset disposals) | 1,170 | 6,619 | 3,140 | 9,898 | ||||||||||||
Total cost of revenues | $ | 34,796 | $ | 30,182 | $ | 99,654 | $ | 84,374 | ||||||||
PGM Recycling and Other: (1) | ||||||||||||||||
Cost of open market acquisitions | $ | 5,278 | $ | — | $ | 5,357 | $ | — | ||||||||
Cost of PGM Recycling | 106,801 | 136,843 | 297,773 | 402,859 | ||||||||||||
PGM Recycling - depreciation | 258 | 285 | 761 | 804 | ||||||||||||
Total cost of revenues | $ | 112,337 | $ | 137,128 | $ | 303,891 | $ | 403,663 | ||||||||
(1) | PGM Recycling and Other include PGM recycling and metal acquired periodically in the open market and simultaneously resold to third parties. |
47
Stillwater Mining Company
All-In Sustaining Costs (A Non-GAAP Financial Measure)
(Unaudited)
All-In Sustaining Costs (Non-GAAP): This non-GAAP financial measure is used as an indicator from period to period of the level of total cash required by the Company to maintain and operate the existing mines, including corporate administrative costs and replacement capital. The measure is calculated beginning with total cash costs (another non-GAAP financial measure, described above), and adding to it the recycling income credit, domestic corporate overhead and marketing costs (excluding any depreciation and amortization costs as well as research and development, non-recurring and reorganization costs included in corporate overhead costs) and that portion of total capital expenditures associated with sustaining the current level of mining operations. (Capital expenditures for Blitz, Graham Creek and certain other one-time projects are not included in the calculation.)
When divided by the total recoverable PGM ounces in the respective period, All-In Sustaining Costs per Mined Ounce (non-GAAP) provides an indication of the level of total cash required to maintain and operate the mines per PGM ounce produced in the period. Recoverable PGM ounces from production are an indication of the amount of PGM product extracted through mining in any period. Because the objective of PGM mining activity is to extract PGM material, the all-in cash costs per ounce to produce PGM material, administer the business and sustain the operating capacity of the mines is a useful measure for comparing overall extraction efficiency between periods. This measure is affected by the total level of spending in the period and by the grade and volume of ore produced.
Three Months Ended | Nine Months Ended | |||||||||||||||
September 30, | September 30, | |||||||||||||||
(In thousands, except $/oz.) | 2014 | 2013 | 2014 | 2013 | ||||||||||||
All-In Sustaining Costs | ||||||||||||||||
Total cash costs net of by-product and recycling credits (Non-GAAP) | $ | 68,113 | $ | 53,087 | $ | 211,846 | $ | 189,489 | ||||||||
Recycling income credit | 3,114 | 20,553 | 9,207 | 31,873 | ||||||||||||
$ | 71,227 | $ | 73,640 | $ | 221,053 | $ | 221,362 | |||||||||
Consolidated Corporate General & Administrative costs | $ | 9,967 | $ | 9,420 | $ | 27,395 | $ | 36,038 | ||||||||
Corporate depreciation and amortization and research and development included in Consolidated Corporate General & Administrative costs | (109 | ) | (203 | ) | (364 | ) | (468 | ) | ||||||||
General & Administrative Costs in Foreign Subsidiaries | (811 | ) | (567 | ) | (3,122 | ) | (3,216 | ) | ||||||||
Marketing costs | 84 | 207 | 622 | 4,197 | ||||||||||||
$ | 9,131 | $ | 8,857 | $ | 24,531 | $ | 36,551 | |||||||||
Total incurred capitalized costs | $ | 36,545 | $ | 33,758 | $ | 93,695 | $ | 88,632 | ||||||||
Capital associated with expansion projects | (13,978 | ) | (11,289 | ) | (33,246 | ) | (25,633 | ) | ||||||||
Total Capital incurred to sustain existing operations | $ | 22,567 | $ | 22,469 | $ | 60,449 | $ | 62,999 | ||||||||
All-In Sustaining Costs (Non-GAAP) | $ | 102,925 | $ | 104,966 | $ | 306,033 | $ | 320,912 | ||||||||
Mined ounces produced | 123.0 | 124.2 | 380.1 | 382.8 | ||||||||||||
All-In Sustaining Costs per Mined Ounce ($/oz.) (Non-GAAP) | $ | 837 | $ | 845 | $ | 805 | $ | 838 | ||||||||
For a full description and reconciliation of this non-GAAP financial measure to a GAAP financial measure, see Reconciliation of Non-GAAP Financial Measures to Consolidated Costs of Revenues section, above.
48
ITEM 3
QUANTITATIVE AND QUALITATIVE DISCLOSURES ABOUT MARKET RISK
The Company is exposed to market risk, including the effects of adverse changes in metal prices, interest rates and foreign currencies as discussed below.
COMMODITY PRICE RISK
The Company produces and sells palladium, platinum and associated by-product metals directly to its customers and through third parties. As a result, financial performance can be materially affected when prices for these commodities fluctuate. In order to manage commodity price risk and to reduce the impact of fluctuation in prices, the Company has entered into supply agreements with suppliers and customers, and from time to time, has employed various derivative financial instruments. The Company also attempts to maintain adequate liquidity to sustain operations during a downturn in PGM prices.
In its PGM recycling activities, the Company customarily enters into fixed forward sales to mitigate pricing exposure. Under these fixed forward transactions, metals contained in the spent catalytic materials are sold forward at the time the material is purchased and then are delivered against the fixed forward contracts when the finished ounces are recovered. Because the forward price is also used to determine the acquisition price, this arrangement significantly reduces exposure to PGM price volatility. The Company accounts for these transactions as normal purchases and sales.
The following is a summary of the Company's commodity derivatives in place at September 30, 2014:
PGM Recycling: | |||||||||||||||||||||
Fixed Forward Contracts | Platinum | Palladium | Rhodium | ||||||||||||||||||
Settlement Period | Ounces | Average Price/Ounce | Ounces | Average Price/Ounce | Ounces | Average Price/Ounce | |||||||||||||||
Fourth Quarter 2014 | 26,291 | $ | 1,450 | 43,735 | $ | 862 | 6,395 | $ | 1,192 | ||||||||||||
First Quarter 2015 | 3,843 | $ | 1,376 | 4,532 | $ | 846 | 1,610 | $ | 1,289 | ||||||||||||
INTEREST RATE RISK
At September 30, 2014, all of the Company’s outstanding long-term debt obligations were subject to fixed rates of interest. Interest income on payments to the Company’s recycling suppliers is generally linked to short-term inter-bank rates. Undrawn letters of credit issued under the Company's revolving credit facility carry a fixed contractual rate of interest, although any cash borrowings against the facility would be subject to a floating interest rate. There were no such cash borrowings at September 30, 2014 and 2013.
The Company’s convertible debentures do not contain financial covenants. The Company’s asset-backed revolving credit facility includes a single fixed-charge coverage covenant that only takes effect when less than 30% of the total borrowing capacity under the line remains available. Because there are currently no cash borrowings under the asset-backed revolving credit facility the Company is not constrained by conventional financial covenants at this time. The issuance of the $396.75 million of 1.75% convertible debentures during the fourth quarter of 2012 increased the Company's total level of indebtedness, which could affect the Company's ability to service its outstanding debt in the future and its creditworthiness in general.
The Company may from time to time invest excess cash balances in short-term instruments. There can be no guarantee that future market disruptions affecting various short-term investments or the potential failure of financial institutions will not have a negative effect on the price and liquidity of investments made by the Company.
Prices of the Company's principal products, palladium and platinum, may be affected by changes or anticipated changes in interest rates. Broadly, rising interest rates may make investments in precious metals relatively less attractive than investments which pay a rate of interest, reducing demand for precious metals and thereby putting downward pressure on precious metal prices. Also, as U.S. interest rates increase, the U.S. dollar may strengthen against other currencies; a strengthening U.S. dollar tends to put downward pressure on commodity prices in general, including precious metals.
49
FOREIGN CURRENCY RISK
With the acquisition of the Marathon assets in Canada in 2010 and the Peregrine assets in 2011, the Company gained some exposure to fluctuations in foreign exchange rates, including exposure to Canadian, Argentine and Chilean currencies. These exposures currently include foreign cash deposits, expenses incurred for the services of a few foreign-based employees and contractors with the associated support costs, and the deferred tax liability recorded (and subsequently revalued upon impairment) in association with the acquisition of Peregrine Metals Ltd.
However, the Company has been exposed to a significant inflation rate on its deferred tax liability denominated in Argentine pesos, although, during the first nine months of 2014, the Argentine inflation rate slowed. For the third quarter of 2014, the Company recorded a foreign currency transaction gain of $0.6 million in Peregrine Metals Ltd. Changes in relative currency values are recognized in the period within Foreign currency transaction gain, net on the Company's Consolidated Statements of Comprehensive Income (Loss). To date, the Company has not hedged its foreign currency exposures.
ITEM 4
CONTROLS AND PROCEDURES
(a) | Disclosure Controls and Procedures. |
The Company’s management, with the participation of the Company’s President and Chief Executive Officer and Chief Financial Officer, has evaluated the effectiveness of the Company’s disclosure controls and procedures (as such term is defined in Rules 13a-15(e) and 15d-15(e) under the Securities Exchange Act of 1934, as amended (the “Exchange Act”)) as of the end of the period covered by this report. Based on such evaluation, the Company’s President and Chief Executive Officer and Chief Financial Officer have concluded that, as of the end of such period, the Company’s disclosure controls and procedures are effective in recording, processing, summarizing and reporting, on a timely basis, information required to be disclosed by the Company in the reports that it files or submits under the Exchange Act.
In designing and evaluating the Company’s disclosure controls and procedures, management recognized that disclosure controls and procedures, no matter how well conceived and well operated, can provide only reasonable, not absolute, assurance that the objectives of the disclosure controls and procedures are met. Additionally, in designing disclosure controls and procedures, the Company’s management was required to apply its judgment in evaluating the cost-benefit relationship of possible disclosure controls and procedures. The Company also designed disclosure controls and procedures based in part upon assumptions about the likelihood of future events, and there can be no assurance that any design will succeed in achieving its stated goals under all potential future conditions.
(b) | Internal Control Over Financial Reporting. |
In reviewing internal control over financial reporting based upon the framework in Internal Control Integrated Framework (1992) issued by the Committee of Sponsoring Organizations of the Treadway Commission (COSO) at September 30, 2014, management determined that during the third quarter of 2014 there have been no changes in the Company’s internal control over financial reporting (as such term is defined in Rules 13a-15(f) and 15d-15(f) under the Exchange Act) that have materially affected, or are reasonably likely to materially affect, the Company's internal control over financial reporting.
50
PART II – OTHER INFORMATION
ITEM 1
LEGAL PROCEEDINGS
The Company is involved in various claims and legal actions arising in the ordinary course of business, primarily consisting of employee lawsuits. In the opinion of management, the ultimate disposition of these matters is not expected to have a material adverse effect on the Company’s consolidated financial position, results of operations or liquidity.
For further information regarding legal guarantees and indemnities, see Note 20 “Commitments and Contingencies” in the Company’s audited consolidated financial statements as presented in the Company’s 2013 Annual Report on Form 10-K.
ITEM 1A
RISK FACTORS
The Company filed its Annual Report on Form 10-K for the year ended December 31, 2013, with the Securities and Exchange Commission on March 3, 2014, which sets forth certain Risk Factors associated with the Company in Item 1A therein.
There have been no material changes to the risk factors as previously disclosed in the Company's 2013 Annual Report on Form 10-K and the Company's previously filed Form10-Q for the quarter ended June 30, 2014, filed on July 31, 2014.
ITEM 4
MINE SAFETY DISCLOSURES
Valuing the people in the Company's workforce means being committed to their safety and well-being at all times. The Company's goal is that “Everyone Goes Home Safe - Every Day”. The Company's Safety & Health Management System, G.E.T. Safe, promotes a safety culture based on safety leadership and teamwork to improve safety performance. G.E.T. Safe includes incidence tracking and analysis, near miss reporting, hazard recognition, workplace inspections, pre-operational equipment inspections, team safety meetings, annual refresher training, task training, standard operating procedures training, safety sweeps, audits, stand-downs and employee engagement activities focused on working safely. The Company works closely with Mine Safety and Health Administration (MSHA) inspectors to act on their findings and incorporate their suggestions. Management also strives to maintain a consistent “tone at the top” that working safely every day is paramount to the overall success of the Company.
Under the Dodd-Frank Act, each operator of a coal or other mine is required to include certain mine safety results within its periodic reports filed with the Securities and Exchange Commission. In accordance with the reporting requirements included in Section 1503(a) of the Dodd-Frank Wall Street Reform and Consumer Protection Act and Item 104 of Regulation S-K (17 CFR 229.104), the required mine safety results regarding certain mining safety and health matters for each of the Company’s mine locations that are covered under the scope of the Dodd-Frank Act are included in Exhibit 95 - Mine Safety Disclosures of the Company's 2013 Annual Report on Form 10-K. In the third quarter of 2014, the Company received a total of seven violations of mandatory health or safety standards that could significantly and substantially contribute to the cause and effect of a coal or other mine safety or health hazard under section 104 of the Federal Mine Safety and Health Act. See Exhibit 95 - Mine Safety Disclosures of this quarterly report for more information.
ITEM 6
EXHIBITS
See attached exhibit index
51
SIGNATURES
Pursuant to the requirements of the Securities Exchange Act of 1934, the registrant has duly caused this report to be signed on its behalf by the undersigned thereunto duly authorized.
STILLWATER MINING COMPANY | |||||
(Registrant) | |||||
Date: | November 5, 2014 | ||||
By: | /s/ Michael J. McMullen | ||||
Michael J. McMullen | |||||
President and Chief Executive Officer | |||||
Date: | November 5, 2014 | ||||
By: | /s/ Gregory A. Wing | ||||
Gregory A. Wing | |||||
Vice President and Chief Financial Officer | |||||
52
EXHIBITS
Number | Description | ||
10.1 | Independent Director Deferred Share Unit Plan (incorporated by reference to Exhibit 10.1 to the Registrant's Form 8-K dated August 19, 2014). | ||
10.2 | Master Goods and Services Agreement between Stillwater Mining Company and Johnson Matthey Inc. effective July 1, 2014 (portions of the agreement have been omitted pursuant to a confidential treatment request) (filed herewith). | ||
10.3 | Precious Metals Supply Agreement between Stillwater Mining Company and Johnson Matthey Inc. effective July 1, 2014 (portions of the agreement have been omitted pursuant to a confidential treatment request) (filed herewith). | ||
31.1 | Certification of Chief Executive Officer pursuant to Section 302 of the Sarbanes - Oxley Act of 2002 (filed herewith). | ||
31.2 | Certification of Chief Financial Officer pursuant to Section 302 of the Sarbanes - Oxley Act of 2002 (filed herewith). | ||
32.1 | Section 1350 Certification (filed herewith). | ||
32.2 | Section 1350 Certification (filed herewith). | ||
95.0 | Mine Safety Disclosures | ||
101.INS | XBRL Instance Document | ||
101.SCH | XBRL Schema Document | ||
101.CAL | XBRL Calculation Linkbase Document | ||
101.DEF | XBRL Definition Linkbase Document | ||
101.LAB | XBRL Labels Linkbase Document | ||
101.PRE | XBRL Presentation Linkbase Document | ||
53