Attached files
| file | filename |
|---|---|
| EX-31.2 - EXHIBIT 31.2 - Clearway Energy, Inc. | yieldcoex312q32014.htm |
| EX-32 - EXHIBIT 32 - Clearway Energy, Inc. | yieldcoex32q32014.htm |
| EX-31.1 - EXHIBIT 31.1 - Clearway Energy, Inc. | yieldcoex311q32014.htm |
| EXCEL - IDEA: XBRL DOCUMENT - Clearway Energy, Inc. | Financial_Report.xls |
| EX-31.3 - EXHIBIT 31.3 - Clearway Energy, Inc. | yieldcoex313q32014.htm |
UNITED STATES SECURITIES AND EXCHANGE COMMISSION
Washington, D.C. 20549
FORM 10-Q
x | Quarterly report pursuant to Section 13 or 15(d) of the Securities Exchange Act of 1934 | |
For the Quarterly Period Ended: September 30, 2014 | ||
o | Transition report pursuant to Section 13 or 15(d) of the Securities Exchange Act of 1934 | |
Commission File Number: 001-36002
NRG Yield, Inc.
(Exact name of registrant as specified in its charter)
Delaware (State or other jurisdiction of incorporation or organization) | 46-1777204 (I.R.S. Employer Identification No.) | |
211 Carnegie Center, Princeton, New Jersey (Address of principal executive offices) | 08540 (Zip Code) | |
(609) 524-4500
(Registrant’s telephone number, including area code)
Indicate by check mark whether the registrant (1) has filed all reports required to be filed by Section 13 or 15(d) of the Securities Exchange Act of 1934 during the preceding 12 months (or for such shorter period that the registrant was required to file such reports), and (2) has been subject to such filing requirements for the past 90 days.
Yes x No o
Indicate by check mark whether the registrant has submitted electronically and posted on its corporate Web site, if any, every Interactive Data File required to be submitted and posted pursuant to Rule 405 of Regulation S-T (§232.405 of this chapter) during the preceding 12 months (or for such shorter period that the registrant was required to submit and post such files).
Yes x No o
Indicate by check mark whether the registrant is a large accelerated filer, an accelerated filer, a non-accelerated filer, or a smaller reporting company. See the definitions of “large accelerated filer,” “accelerated filer,” and “smaller reporting company” in Rule 12b-2 of the Exchange Act.
Large accelerated filer o | Accelerated filer o | Non-accelerated filer x | Smaller reporting company o | |||
(Do not check if a smaller reporting company) | ||||||
Indicate by check mark whether the registrant is a shell company (as defined in Rule 12b-2 of the Exchange Act).
Yes o No x
As of October 31, 2014, there were 34,586,250 shares of Class A common stock outstanding, par value $0.01 per share, and 42,738,750 shares of Class B common stock outstanding, par value $0.01 per share.
1
TABLE OF CONTENTS
Index
2
CAUTIONARY STATEMENT REGARDING FORWARD-LOOKING INFORMATION
This Quarterly Report on Form 10-Q of NRG Yield, Inc., or the Company, includes forward-looking statements within the meaning of Section 27A of the Securities Act of 1933, as amended, or the Securities Act, and Section 21E of the Securities Exchange Act of 1934, as amended, or the Exchange Act. The words "believes," "projects," "anticipates," "plans," "expects," "intends," "estimates" and similar expressions are intended to identify forward-looking statements. These forward-looking statements involve known and unknown risks, uncertainties and other factors that may cause the Company's actual results, performance and achievements, or industry results, to be materially different from any future results, performance or achievements expressed or implied by such forward-looking statements. These factors, risks and uncertainties include the factors described under Item 1A — Risk Factors in Part I, Item 1A of the Company's Annual Report on Form 10-K for the year ended December 31, 2013, including, but not limited to, the following:
• | The Company's ability to maintain and grow its quarterly dividend; |
• | The Company's ability to successfully identify, evaluate and consummate acquisitions; |
• | The Company's ability to raise additional capital due to its indebtedness, corporate structure, market conditions or otherwise; |
• | Hazards customary to the power production industry and power generation operations such as fuel and electricity price volatility, unusual weather conditions, catastrophic weather-related or other damage to facilities, unscheduled generation outages, maintenance or repairs, unanticipated changes to fuel supply costs or availability due to higher demand, shortages, transportation problems or other developments, environmental incidents, or electric transmission or gas pipeline system constraints and the possibility that the Company may not have adequate insurance to cover losses as a result of such hazards; |
• | The Company's ability to operate its businesses efficiently, manage maintenance capital expenditures and costs effectively, and generate earnings and cash flows from its asset-based businesses in relation to its debt and other obligations; |
• | The willingness and ability of the counterparties to the Company's offtake agreements to fulfill their obligations under such agreements; |
• | The Company's ability to enter into contracts to sell power and procure fuel on acceptable terms and prices as current offtake agreements expire; |
• | Government regulation, including compliance with regulatory requirements and changes in market rules, rates, tariffs and environmental laws; |
• | Operating and financial restrictions placed on the Company and its subsidiaries that are contained in the project-level debt facilities and other agreements of certain subsidiaries, the NRG Yield Operating LLC revolving credit facility and Senior Notes or the Company's convertible notes; and |
• | The Company's ability to borrow additional funds and access capital markets, as well as the Company's substantial indebtedness and the possibility that the Company may incur additional indebtedness going forward. |
Forward-looking statements speak only as of the date they were made, and the Company undertakes no obligation to publicly update or revise any forward-looking statements, whether as a result of new information, future events or otherwise. The foregoing review of factors that could cause the Company's actual results to differ materially from those contemplated in any forward-looking statements included in this Quarterly Report on Form 10-Q should not be construed as exhaustive.
3
GLOSSARY OF TERMS
When the following terms and abbreviations appear in the text of this report, they have the meanings indicated below:
2013 Form 10-K | NRG Yield, Inc.'s Annual Report on Form 10-K for the year ended December 31, 2013 | |
Alta Sellers | Terra-Gen Finance Company, LLC and certain of its affiliates | |
Acquired ROFO Assets | The TA-High Desert, RE Kansas South and El Segundo projects, which were acquired from NRG on June 30, 2014 | |
ASC | The FASB Accounting Standards Codification, which the FASB established as the source of authoritative U.S. GAAP | |
ASU | Accounting Standards Updates - updates to the ASC | |
CO2 | Carbon dioxide | |
Distributed Solar | Solar power projects that primarily sell power produced to customers for usage on site, or are interconnected to sell power into the local distribution grid | |
El Segundo | NRG West Holdings LLC, the subsidiary of Natural Gas Repowering LLC, which owns the El Segundo Energy Center project | |
EME-NYLD-Eligible Assets | Certain assets of Edison Mission Energy that fit within the Company's asset portfolio | |
EPA | U.S. Environmental Protection Agency | |
ERCOT | Electric Reliability Council of Texas, the Independent System Operator and the regional reliability coordinator of the various electricity systems within Texas | |
EWG | Exempt Wholesale Generator | |
Exchange Act | The Securities Exchange Act of 1934, as amended | |
FASB | Financial Accounting Standards Board | |
FERC | Federal Energy Regulatory Commission | |
GHG | Greenhouse gases | |
ISO | Independent System Operator | |
ISO-NE | ISO New England Inc. | |
LIBOR | London Inter-Bank Offered Rate | |
Marsh Landing | NRG Marsh Landing LLC, formerly GenOn Marsh Landing LLC | |
MMBtu | Million British Thermal Units | |
MW | Megawatt | |
MWh | Saleable megawatt hours, net of internal/parasitic load megawatt-hours | |
MWt | Megawatts Thermal Equivalent | |
NERC | North American Electric Reliability Corporation | |
Net Exposure | Counterparty credit exposure to NRG Yield, Inc. net of collateral | |
NOL | Net operating loss | |
NRG | NRG Energy, Inc. | |
NRG Yield | Accounting predecessor, representing the combination of the projects that were acquired by NRG Yield LLC in July 2013 | |
NRG Yield, Inc. | NRG Yield, Inc., or the Company | |
NRG Yield LLC | The holding company, owned by NRG, the holder of Class B common units, and NRG Yield, Inc., the holder of the Class A common units | |
NRG Yield Operating LLC | The holding company that owns the project companies and is a wholly owned subsidiary of NRG Yield LLC | |
NSPS | New Source Performance Standards | |
OCI/OCL | Other comprehensive income/loss | |
PPA | Power Purchase Agreement | |
PUCT | Public Utility Commission of Texas | |
PURPA | Public Utility Regulatory Policies Act of 1978 | |
QF | Qualifying Facility under PURPA | |
RE Kansas South | NRG Solar Kansas South LLC, the operating subsidiary of NRG Solar Kansas South Holdings LLC, which owns the RE Kansas South project | |
Senior Notes | NRG Yield Operating LLC's $500 million of 5.375% unsecured senior notes due 2024 | |
4
TA High Desert | TA-High Desert LLC, the operating subsidiary of NRG Solar Mayfair LLC, which owns the TA High Desert project | |
Terra-Gen | Terra-Gen Operating Company, LLC | |
U.S. | United States of America | |
U.S. GAAP | Accounting principles generally accepted in the United States | |
Utility Scale Solar | Solar power projects, typically 20 MW or greater in size (on an alternating current, or AC, basis), that are interconnected into the transmission or distribution grid to sell power at a wholesale level | |
VaR | Value at Risk | |
VIE | Variable Interest Entity | |
5
PART I — FINANCIAL INFORMATION
ITEM 1 — FINANCIAL STATEMENTS
NRG YIELD, INC.
CONSOLIDATED STATEMENTS OF OPERATIONS
(Unaudited)
Three months ended September 30, | Nine months ended September 30, | ||||||||||||||
(In millions, except per share amounts) | 2014 | 2013 (a) | 2014 | 2013 (a) | |||||||||||
Operating Revenues | |||||||||||||||
Total operating revenues | $ | 161 | $ | 126 | $ | 435 | $ | 261 | |||||||
Operating Costs and Expenses | |||||||||||||||
Cost of operations | 52 | 44 | 157 | 105 | |||||||||||
Depreciation and amortization | 34 | 18 | 94 | 38 | |||||||||||
General and administrative — affiliate | 3 | 1 | 7 | 5 | |||||||||||
Acquisition-related transaction and integration costs | 2 | — | 2 | — | |||||||||||
Total operating costs and expenses | 91 | 63 | 260 | 148 | |||||||||||
Operating Income | 70 | 63 | 175 | 113 | |||||||||||
Other Income (Expense) | |||||||||||||||
Equity in earnings of unconsolidated affiliates | 11 | 12 | 26 | 18 | |||||||||||
Other income, net | 1 | — | 2 | 1 | |||||||||||
Interest expense | (41 | ) | (21 | ) | (97 | ) | (32 | ) | |||||||
Total other expense | (29 | ) | (9 | ) | (69 | ) | (13 | ) | |||||||
Income Before Income Taxes | 41 | 54 | 106 | 100 | |||||||||||
Income tax expense | 10 | 5 | 15 | 5 | |||||||||||
Net Income | 31 | 49 | 91 | 95 | |||||||||||
Less: Pre-acquisition net income of Acquired ROFO Assets | — | 9 | 17 | 10 | |||||||||||
Less: Predecessor income prior to initial public offering on July 22, 2013 | — | 9 | — | 54 | |||||||||||
Net Income Subsequent to Initial Public Offering and Excluding Pre-acquisition Net Income of Acquired ROFO Assets | 31 | 31 | 74 | 31 | |||||||||||
Less: Income attributable to NRG (b) | 25 | 22 | 58 | 22 | |||||||||||
Net Income Attributable to NRG Yield, Inc. | $ | 6 | $ | 9 | $ | 16 | $ | 9 | |||||||
Basic and Diluted Earnings per Share Attributable to Class A Common Stockholders | |||||||||||||||
Weighted average number of Class A common shares outstanding | 31 | 23 | 25 | 23 | |||||||||||
Basic and Diluted Earnings per Class A Common Share | $ | 0.20 | $ | 0.39 | $ | 0.62 | $ | 0.39 | |||||||
Dividends per Class A Common Share | $ | 0.365 | $ | — | $ | 1.045 | $ | — | |||||||
(a) Retrospectively adjusted as discussed in Note 1, Nature of Business.
(b) The calculation of income attributable to NRG excludes pre-acquisition net income of the Acquired ROFO Assets.
See accompanying notes to consolidated financial statements.
6
NRG YIELD, INC.
CONSOLIDATED STATEMENTS OF COMPREHENSIVE INCOME
(Unaudited)
Three months ended September 30, | Nine months ended September 30, | ||||||||||||||
2014 | 2013 (a) | 2014 | 2013 (a) | ||||||||||||
(In millions) | |||||||||||||||
Net Income | $ | 31 | $ | 49 | $ | 91 | $ | 95 | |||||||
Other Comprehensive Income (Loss), net of tax | |||||||||||||||
Unrealized gain (loss) on derivatives | 7 | 5 | (17 | ) | 34 | ||||||||||
Other comprehensive income (loss) | 7 | 5 | (17 | ) | 34 | ||||||||||
Comprehensive Income | 38 | 54 | 74 | 129 | |||||||||||
Less: Predecessor comprehensive income prior to initial public offering on July 22, 2013 | — | 9 | — | 73 | |||||||||||
Less: Pre-acquisition net income of Acquired ROFO Assets | — | 9 | 17 | 10 | |||||||||||
Less: Comprehensive income attributable to NRG | 30 | 28 | 48 | 38 | |||||||||||
Comprehensive Income Attributable to NRG Yield, Inc. | $ | 8 | $ | 8 | $ | 9 | $ | 8 | |||||||
(a) Retrospectively adjusted as discussed in Note 1, Nature of Business.
See accompanying notes to consolidated financial statements.
7
NRG YIELD, INC.
CONSOLIDATED BALANCE SHEETS
September 30, 2014 | December 31, 2013 (a) | ||||||
(In millions) | (unaudited) | ||||||
ASSETS | |||||||
Current Assets | |||||||
Cash and cash equivalents | $ | 372 | $ | 59 | |||
Restricted cash | 54 | 67 | |||||
Accounts receivable — trade | 80 | 51 | |||||
Accounts receivable — affiliate | 4 | 5 | |||||
Inventory | 17 | 15 | |||||
Derivative instruments | — | 1 | |||||
Notes receivable | 6 | 6 | |||||
Renewable energy grant receivable | — | 147 | |||||
Prepayments and other current assets | 22 | 27 | |||||
Total current assets | 555 | 378 | |||||
Property, plant and equipment | |||||||
In service | 3,535 | 2,459 | |||||
Under construction | 7 | 6 | |||||
Total property, plant and equipment | 3,542 | 2,465 | |||||
Less accumulated depreciation | (266 | ) | (174 | ) | |||
Net property, plant and equipment | 3,276 | 2,291 | |||||
Other Assets | |||||||
Equity investments in affiliates | 230 | 227 | |||||
Notes receivable | 17 | 21 | |||||
Notes receivable — affiliate | — | 2 | |||||
Intangible assets, net of accumulated amortization of $17 and $6 | 1,517 | 103 | |||||
Derivative instruments | 7 | 20 | |||||
Deferred income taxes | 204 | 146 | |||||
Other non-current assets | 93 | 50 | |||||
Total other assets | 2,068 | 569 | |||||
Total Assets | $ | 5,899 | $ | 3,238 | |||
(a) Retrospectively adjusted as discussed in Note 1, Nature of Business.
See accompanying notes to consolidated financial statements.
8
NRG YIELD, INC.
CONSOLIDATED BALANCE SHEETS (Continued)
September 30, 2014 | December 31, 2013 (a) | ||||||
(In millions, except share information) | (unaudited) | ||||||
LIABILITIES AND STOCKHOLDERS' EQUITY | |||||||
Current Liabilities | |||||||
Current portion of long-term debt | $ | 157 | $ | 214 | |||
Accounts payable | 15 | 42 | |||||
Accounts payable — affiliate | 48 | 52 | |||||
Derivative instruments | 30 | 31 | |||||
Accrued expenses and other current liabilities | 52 | 30 | |||||
Total current liabilities | 302 | 369 | |||||
Other Liabilities | |||||||
Long-term debt | 3,926 | 1,569 | |||||
Out-of-market contracts | 5 | 5 | |||||
Derivative instruments | 23 | 16 | |||||
Other non-current liabilities | 29 | 27 | |||||
Total non-current liabilities | 3,983 | 1,617 | |||||
Total Liabilities | 4,285 | 1,986 | |||||
Commitments and Contingencies | |||||||
Stockholders' Equity | |||||||
Preferred stock, $0.01 par value; 10,000,000 shares authorized; none issued | — | — | |||||
Class A common stock, $0.01 par value; 500,000,000 shares authorized; 34,586,250 shares issued | — | — | |||||
Class B common stock, $0.01 par value; 500,000,000 shares authorized; 42,738,750 shares issued | — | — | |||||
Additional paid-in capital | 1,336 | 621 | |||||
Retained earnings | 5 | 8 | |||||
Accumulated other comprehensive loss | (6 | ) | — | ||||
Noncontrolling interest | 279 | 623 | |||||
Total Stockholders' Equity | 1,614 | 1,252 | |||||
Total Liabilities and Stockholders’ Equity | $ | 5,899 | $ | 3,238 | |||
(a) Retrospectively adjusted as discussed in Note 1, Nature of Business.
See accompanying notes to consolidated financial statements.
9
NRG YIELD, INC.
CONSOLIDATED STATEMENTS OF CASH FLOWS
(Unaudited)
Nine months ended September 30, | |||||||
2014 | 2013 (a) | ||||||
(In millions) | |||||||
Cash Flows from Operating Activities | |||||||
Net income | $ | 91 | $ | 95 | |||
Adjustments to reconcile net income to net cash provided by (used in) operating activities: | |||||||
Distributions and equity in earnings of unconsolidated affiliates | 17 | (10 | ) | ||||
Depreciation and amortization | 94 | 38 | |||||
Amortization of financing costs and debt discount/premium | 8 | 1 | |||||
Amortization of intangibles and out-of-market contracts | 8 | 2 | |||||
Changes in deferred income taxes | 15 | 5 | |||||
Changes in derivative instruments | (5 | ) | (14 | ) | |||
Changes in other working capital | (34 | ) | (27 | ) | |||
Net Cash Provided by Operating Activities | 194 | 90 | |||||
Cash Flows from Investing Activities | |||||||
Payment for Alta Acquisition | (901 | ) | — | ||||
Payment to NRG for Acquired ROFO Assets | (357 | ) | — | ||||
Capital expenditures | (28 | ) | (339 | ) | |||
Decrease (increase) in restricted cash | 28 | (88 | ) | ||||
Decrease in notes receivable, including affiliates | 6 | 4 | |||||
Proceeds from renewable energy grants | 137 | 24 | |||||
Investments in unconsolidated affiliates | (17 | ) | (19 | ) | |||
Other | 11 | — | |||||
Net Cash Used in Investing Activities | (1,121 | ) | (418 | ) | |||
Cash Flows from Financing Activities | |||||||
Capital contributions from NRG | 2 | 150 | |||||
Return of capital to NRG | (23 | ) | — | ||||
Payment of dividends and distributions | (72 | ) | (707 | ) | |||
Proceeds from issuance of long-term debt — external | 924 | 558 | |||||
Payment of debt issuance costs | (26 | ) | (5 | ) | |||
Payment of borrowings from affiliate | — | (2 | ) | ||||
Payments for long-term debt — external | (195 | ) | (35 | ) | |||
Proceeds from the issuance of Class A common stock | 630 | 468 | |||||
Net Cash Provided by Financing Activities | 1,240 | 427 | |||||
Net Increase in Cash and Cash Equivalents | 313 | 99 | |||||
Cash and Cash Equivalents at Beginning of Period | 59 | 22 | |||||
Cash and Cash Equivalents at End of Period | $ | 372 | $ | 121 | |||
(a) Retrospectively adjusted as discussed in Note 1, Nature of Business.
See accompanying notes to consolidated financial statements.
10
NRG YIELD, INC.
NOTES TO CONSOLIDATED FINANCIAL STATEMENTS
(Unaudited)
Note 1 — Nature of Business
NRG Yield, Inc., or the Company, was formed by NRG as a Delaware corporation on December 20, 2012. On July 22, 2013, the Company issued 22,511,250 shares of Class A common stock in an initial public offering. The Company utilized the net proceeds of the initial public offering to acquire 19,011,250 Class A units of NRG Yield LLC from NRG, in return for $395 million and 3,500,000 Class A units of NRG Yield LLC directly from NRG Yield LLC in return for $73 million. In connection with the acquisition of the Class A units, the Company also became the sole managing member of NRG Yield LLC, thereby acquiring a controlling interest in NRG Yield LLC.
Immediately prior to the acquisition, NRG Yield LLC acquired a portfolio of contracted renewable and conventional generation and thermal infrastructure assets, primarily located in the Northeast, Southwest and California regions of the United States, from NRG in return for Class B units in NRG Yield LLC. These assets were simultaneously contributed by NRG Yield LLC to its direct wholly owned subsidiary NRG Yield Operating LLC at their historical cost in accordance with ASC 805-50, Business Combinations - Related Issues.
As of June 30, 2014, the Company and NRG owned 34.5% and 65.5% of NRG Yield LLC, respectively. On July 29, 2014, the Company issued 12,075,000 shares of Class A common stock for net proceeds, after underwriting discount and expenses, of $630 million. The Company utilized the proceeds of the offering to acquire 12,075,000 additional Class A units of NRG Yield LLC and, as a result, as of September 30, 2014, the Company owns 44.7% of NRG Yield LLC, and consolidates the results of NRG Yield LLC through its controlling interest, with NRG's 55.3% interest shown as noncontrolling interest in the financial statements.
The following table represents the structure of the Company as of September 30, 2014:
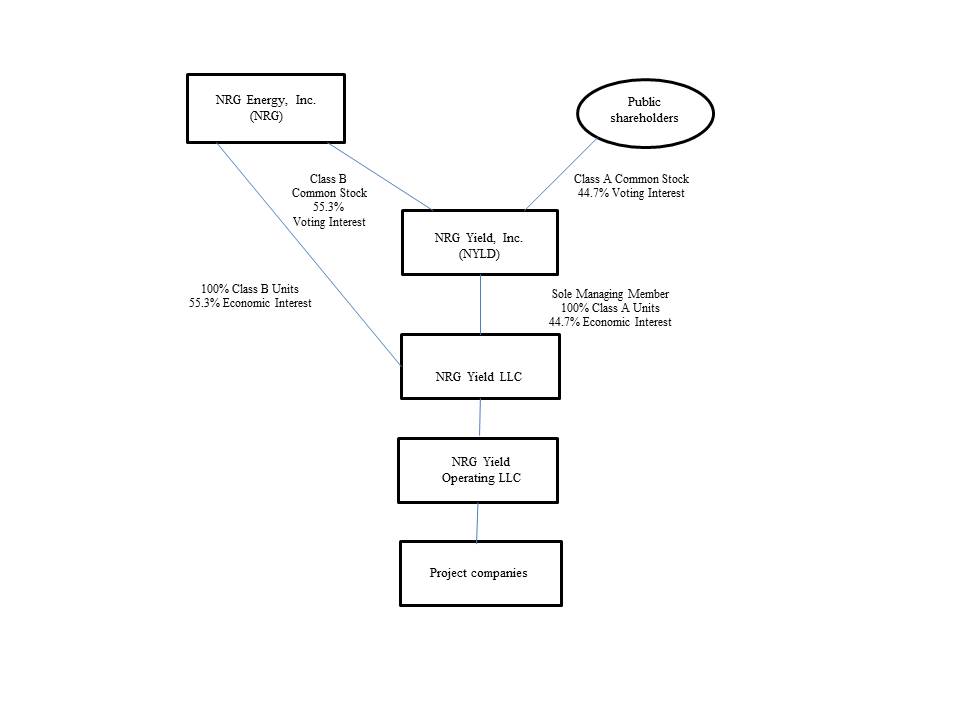
11
For the period prior to the initial public offering, the accompanying unaudited combined financial statements represent the combination of the assets that NRG Yield LLC acquired and were prepared using NRG's historical basis in the assets and liabilities. For the purposes of the unaudited combined financial statements, the term "NRG Yield" represents the accounting predecessor, or the combination of the acquired businesses. For all periods subsequent to the initial public offering, the accompanying unaudited consolidated financial statements represent the consolidated results of the Company, which consolidates NRG Yield LLC through its controlling interest.
12
As of September 30, 2014, the Company's operating assets are comprised of the following projects:
Projects | Percentage Ownership | Net Capacity (MW) (a) | Offtake Counterparty | Expiration | ||||||
Conventional | ||||||||||
GenConn Middletown | 49.95 | % | 95 | Connecticut Light & Power | 2041 | |||||
GenConn Devon | 49.95 | % | 95 | Connecticut Light & Power | 2040 | |||||
Marsh Landing | 100 | % | 720 | Pacific Gas and Electric | 2023 | |||||
El Segundo | 100 | % | 550 | Southern California Edison | 2023 | |||||
1,460 | ||||||||||
Utility-Scale Solar | ||||||||||
Alpine | 100 | % | 66 | Pacific Gas and Electric | 2033 | |||||
Avenal | 49.95 | % | 23 | Pacific Gas and Electric | 2031 | |||||
Avra Valley | 100 | % | 25 | Tucson Electric Power | 2032 | |||||
Blythe | 100 | % | 21 | Southern California Edison | 2029 | |||||
Borrego | 100 | % | 26 | San Diego Gas and Electric | 2038 | |||||
CVSR | 48.95 | % | 122 | Pacific Gas and Electric | 2038 | |||||
Roadrunner | 100 | % | 20 | El Paso Electric | 2031 | |||||
RE Kansas South | 100 | % | 20 | Pacific Gas and Electric | 2033 | |||||
TA High Desert | 100 | % | 20 | Southern California Edison | 2033 | |||||
343 | ||||||||||
Distributed Solar | ||||||||||
AZ DG Solar Projects | 100 | % | 5 | Various | 2025 - 2033 | |||||
PFMG DG Solar Projects | 51 | % | 5 | Various | 2032 | |||||
10 | ||||||||||
Wind | ||||||||||
Alta I | 100 | % | 150 | Southern California Edison | 2035 | |||||
Alta II | 100 | % | 150 | Southern California Edison | 2035 | |||||
Alta III | 100 | % | 150 | Southern California Edison | 2035 | |||||
Alta IV | 100 | % | 102 | Southern California Edison | 2035 | |||||
Alta V | 100 | % | 168 | Southern California Edison | 2035 | |||||
Alta X | 100 | % | 137 | Southern California Edison | 2038(c) | |||||
Alta XI | 100 | % | 90 | Southern California Edison | 2038(c) | |||||
South Trent | 100 | % | 101 | AEP Energy Partners | 2029 | |||||
1,048 | ||||||||||
Thermal | ||||||||||
Thermal equivalent MWt(b) | 100 | % | 1,346 | Various | Various | |||||
Thermal generation | 100 | % | 123 | Various | Various | |||||
Total net capacity (excluding equivalent MWt) | 2,984 | |||||||||
(a) Net capacity represents the maximum, or rated, generating capacity of the facility multiplied by the Company's percentage ownership in the facility as of September 30, 2014.
(b) For thermal energy, net capacity represents MWt for steam or chilled water and excludes 118 MWt which is available under the right-to-use provisions contained in agreements between two of NRG Yield Inc.'s thermal facilities and certain of their customers.
(c) PPA begins on January 1, 2016.
Substantially all of the Company's generation assets are under long-term contractual arrangements for the output or capacity from these assets. The thermal assets are comprised of district energy systems and combined heat and power plants that produce steam, hot water and/or chilled water and, in some instances, electricity at a central plant. Three of the district energy systems are subject to rate regulation by state public utility commissions while the other district energy systems have rates determined by negotiated bilateral contracts.
13
The historical combined financial statements include allocations of certain NRG corporate expenses. Management believes the assumptions and methodology underlying the allocation of general corporate overhead expenses are reasonable. The allocated costs include legal, accounting, tax, treasury, information technology, insurance, employee benefit costs, and other corporate costs. However, such expenses may not be indicative of the actual level of expense that would have been incurred if the Company had operated as an independent, publicly-traded company during the periods prior to the initial public offering or of the costs expected to be incurred in the future. Allocation of NRG corporate expenses was $4 million for the period beginning on January 1, 2013 and ending on July 22, 2013. In connection with the initial public offering, the Company entered into a management services agreement with NRG for various services, including human resources, accounting, tax, legal, information systems, treasury, and risk management. Costs incurred by the Company under this agreement were $1 million for the period beginning July 23, 2013 and ending September 30, 2013 and $7 million for the nine months ended September 30, 2014.
For all periods prior to the initial public offering, member's equity represents the combined equity of the Company's subsidiaries, including adjustments necessary to present the Company's financial statements as if the Company were in existence as of the beginning of the periods presented. Member's equity represents NRG's equity in the subsidiaries, and accordingly, in connection with the initial public offering, the historical equity balance as of that date was reclassified into noncontrolling interest. Subsequent to the initial public offering, stockholders' equity represents the equity associated with the Class A common stockholders, with the equity associated with the Class B common stockholders, or NRG, classified as noncontrolling interest.
As described in Note 3, Business Acquisitions, on June 30, 2014, NRG Yield Operating LLC acquired the TA High Desert, RE Kansas South, and El Segundo projects from NRG for total cash consideration of $357 million plus assumed project level debt. The acquisition of the TA High Desert, RE Kansas South, and El Segundo projects from NRG on June 30, 2014 was accounted for as a transfer of entities under common control. The guidance requires retrospective combination of the entities for all periods presented as if the combination has been in effect since the inception of common control. Accordingly, the Company prepared its consolidated financial statements to reflect the transfer as if it had taken place on January 1, 2013, or from the date the entities were under common control, which was May 13, 2013 for RE Kansas South and March 28, 2013 for TA High Desert, which represent the dates these entities were acquired by NRG. Member's equity represents NRG's equity in the subsidiaries, and accordingly, in connection with the acquisition by the Company, the balance was reclassified into noncontrolling interest.
The accompanying unaudited interim consolidated financial statements have been prepared in accordance with the Securities and Exchange Commission’s, or SEC’s, regulations for interim financial information. Accordingly, they do not include all of the information and notes required by U.S. GAAP for complete financial statements. The following notes should be read in conjunction with the accounting policies and other disclosures as set forth in the notes to the Company’s consolidated financial statements in the 2013 Form 10-K. Interim results are not necessarily indicative of results for a full year.
In the opinion of management, the accompanying unaudited interim consolidated financial statements contain all material adjustments consisting of normal and recurring accruals necessary to present fairly the Company's consolidated financial position as of September 30, 2014, and the results of operations, comprehensive income and cash flows for the nine months ended September 30, 2014, and 2013.
14
Note 2 — Summary of Significant Accounting Policies
Use of Estimates
The preparation of consolidated financial statements in accordance with U.S. GAAP requires management to make estimates and assumptions. These estimates and assumptions impact the reported amount of assets and liabilities and disclosures of contingent assets and liabilities as of the date of the consolidated financial statements. They also impact the reported amount of net earnings during the reporting period. Actual results could be different from these estimates.
Noncontrolling Interest
The following table reflects the changes in the Company's noncontrolling interest balance:
(In millions) | |||
Balance as of December 31, 2013 (As previously reported) | $ | 382 | |
Net Assets of Acquired ROFO Assets as of December 31, 2013 | 241 | ||
Balance as of December 31, 2013 (As currently reported) | 623 | ||
Payment to NRG for Acquired ROFO assets | (357 | ) | |
Comprehensive income, including pre-acquisition net income from Acquired ROFO Assets | 65 | ||
Non-cash contributions | 13 | ||
Cash distributions, net of cash contributions | (65 | ) | |
Balance as of September 30, 2014 | $ | 279 | |
Distributions
On January 30, 2014, NRG Yield LLC declared a distribution on its units of $0.33 per unit, which was paid on March 17, 2014. On May 5, 2014, NRG Yield LLC declared a distribution on its units of $0.35 per unit, which was paid on June 16, 2014. On July 29, 2014, NRG Yield LLC declared a distribution on its units of $0.365 per unit, which was paid on September 15, 2014. The portion of the distributions paid by NRG Yield LLC to NRG was recorded as a reduction to the Company's noncontrolling interest balance.
On June 30, 2014, the Company acquired the TA High Desert, RE Kansas South, and El Segundo projects, as discussed in Note 3, Business Acquisitions. The difference between the cash paid and historical value of the entities' equity of $113 million was recorded as a distribution to NRG and reduced the balance of its noncontrolling interest. In addition, as the TA High Desert, RE Kansas South and El Segundo projects were owned by NRG until June 30, 2014, the pre-acquisition earnings of such projects are recorded as attributable to NRG's noncontrolling interest. Prior to the date of acquisition, El Segundo made a distribution to NRG of $24 million.
Recent Accounting Developments
ASU 2014-09 - In May 2014, the FASB issued ASU No. 2014-09, Revenue from Contracts with Customers (Topic 606), or ASU No. 2014-09. The amendments of ASU No. 2014-09 complete the joint effort between the FASB and the International Accounting Standards Board, or IASB, to develop a common revenue standard for U.S. GAAP and International Financial Reporting Standards, or IFRS, and to improve financial reporting. The guidance in ASU No. 2014-09 provides that an entity should recognize revenue to depict the transfer of goods or services to customers in an amount that reflects the consideration to which the entity expects to be entitled to in exchange for the goods or services provided and establishes the following steps to be applied by an entity: (1) identify the contract with a customer; (2) identify the performance obligations in the contract; (3) determine the transaction price; (4) allocate the transaction price to the performance obligations in the contract; and (5) recognize revenue when (or as) the entity satisfies the performance obligation. The guidance of ASU No. 2014-09 is effective for annual reporting periods beginning after December 15, 2016, including interim periods therein. Early adoption is not permitted. The Company is currently evaluating the impact of the standard on the Company's results of operations, cash flows and financial position.
15
ASU 2013-11 - In July 2013, the FASB issued ASU No. 2013-11, Income Taxes (Topic 740) Presentation of an Unrecognized Tax Benefit When a Net Operating Loss Carryforward, a Similar Tax Loss, or a Tax Credit Carryforward Exists, or ASU No. 2013-11. The amendments of ASU 2013-11 requires an entity to present an unrecognized tax benefit, or a portion of an unrecognized tax benefit, as a reduction of a deferred tax asset for an NOL, a similar tax loss or tax credit carryforwards rather than a liability when the tax position would reduce the NOL or other carryforward under the tax law of the applicable jurisdiction and the entity intends to use the deferred tax asset for that purpose. The guidance is effective for fiscal years, and interim periods within those years, beginning after December 15, 2013 with early adoption permitted. The Company adopted this standard effective January 1, 2014. The adoption of this standard did not impact the Company's results of operations or cash flows as the Company has no uncertain tax benefits as of September 30, 2014.
Note 3 — Business Acquisitions
2014 Acquisitions
Acquisition of EME-NYLD-Eligible Assets from NRG
On November 4, 2014, the Company and NRG entered into a definitive agreement regarding the acquisition of the following NRG facilities: (i) Walnut Creek, (ii) Tapestry (Pinnacle, Buffalo Bear and Taloga) and (iii) Laredo Ridge for total expected cash consideration of $480 million plus assumed project level debt and working capital adjustments to be calculated at close. The sale is subject to customary closing conditions and is expected to close by the end of the fourth quarter of 2014. The Company expects to fund the acquisition with cash on hand and drawings under the Company's revolving credit facility.
Alta Wind Portfolio Acquisition — On August 12, 2014, the Company acquired 100% of the membership interests of Alta Wind Asset Management Holdings, LLC, Alta Wind Company, LLC, Alta Wind X Holding Company, LLC and Alta Wind XI Holding Company, LLC, which collectively own 7 wind facilities that total 947 MW located in Tehachapi, California and a portfolio of associated land leases, or the Alta Wind Assets. Power generated by the Alta Wind Assets is sold to Southern California Edison under long-term PPAs with 21 years of remaining contract life for Alta I-V and 22 years, beginning in 2016, for Alta X and XI.
The purchase price for the Alta Wind Assets was $923 million, which consisted of a base purchase price of $870 million, as well as a payment for working capital of $53 million, plus the assumption of $1.6 billion of non-recourse project-level debt. In order to fund the purchase price, the Company completed an equity offering of 12,075,000 shares of its Class A common stock at an offering price of $54.00 per share on July 29, 2014, which resulted in net proceeds of $630 million, after underwriting discounts and expenses. In addition, on August 5, 2014, NRG Yield Operating LLC issued $500 million of Senior Notes, which bear interest at a rate of 5.375% and mature in August 2024. Interest on the Senior Notes is payable semi-annually on February 15 and August 15, commencing on February 15, 2015. The excess of the equity proceeds over the amount utilized for the acquisition is available for general corporate purposes, including future acquisitions.
The acquisition was recorded as a business combination under ASC 805, with identifiable assets acquired and liabilities assumed provisionally recorded at their estimated fair values on the acquisition date. The initial accounting for the business combination is not complete because the evaluation necessary to assess the fair values of certain net assets acquired is still in process. The provisional amounts are subject to revision until the evaluations are completed to the extent that additional information is obtained about the facts and circumstances that existed as of the acquisition date. The allocation of the purchase price may be modified up to one year from the date of the acquisition as more information is obtained about the fair value of assets acquired and liabilities assumed.
16
The purchase price of $923 million was provisionally allocated as follows:
(In millions) | ||||
Assets | ||||
Cash | $ | 22 | ||
Current and non-current assets | 49 | |||
Property, plant and equipment | 1,057 | |||
Intangible assets | 1,420 | |||
Total assets acquired | 2,548 | |||
Liabilities | ||||
Debt | 1,591 | |||
Current and non-current liabilities | 34 | |||
Total liabilities assumed | 1,625 | |||
Net assets acquired | $ | 923 | ||
The Company incurred and expensed acquisition-related transaction costs related to the acquisition of the Alta Wind Assets of $2 million for the three and nine months ended September 30, 2014.
Fair value measurements
The provisional fair values of the property, plant and equipment and intangible assets at the acquisition date were measured primarily based on significant inputs that are not observable in the market and thus represent a Level 3 measurement as defined in ASC 820. Significant inputs were as follows:
Property, plant and equipment - The estimated fair values were determined primarily based on an income method using discounted cash flows and validated using a cost approach based on the replacement cost of the assets less economic obsolescence. The income approach was applied by determining the enterprise value for each acquired entity and subtracting the fair value of the intangible assets and working capital to determine the implied value of the tangible fixed assets. This methodology was primarily relied upon as the forecasted cash flows incorporate the specific attributes of each asset including age, useful life, equipment condition and technology. The income approach also allows for an accurate reflection of current and expected market dynamics such as supply and demand and regulatory environment as of the acquisition date.
Intangible assets - The fair values of the PPAs acquired were determined utilizing a variation of the income approach where the incremental future cash flows resulting from the acquired PPAs compared to the cash flows based on current market prices were discounted to present value at the weighted average cost of debt of the utility off-taker, as the PPA was determined to be a debt-like instrument for the off-taker. The values were corroborated with available market data. The PPA values will be amortized over an average period of 22 years.
Supplemental Pro Forma Information
Since the acquisition date, the Alta Wind Assets contributed $18 million in operating revenues and $7 million in net losses. The following supplemental pro forma information represents the results of operations as if the Company had acquired the Alta Wind Assets on January 1, 2013:
For the nine months ended | For the year ended | |||||||||||
(in millions except per share amounts) | September 30, 2014 | September 30, 2013 | December 31, 2013 | |||||||||
Operating revenues | $ | 551 | $ | 385 | $ | 562 | ||||||
Net income | 67 | 99 | 110 | |||||||||
Net income attributable to NRG Yield, Inc. | 16 | 12 | 11 | |||||||||
Basic and Diluted Earnings per share attributable to NRG Yield, Inc. Class A common stockholders: | $ | 0.47 | $ | 0.33 | $ | 0.31 | ||||||
17
The supplemental pro forma information has been adjusted to include the pro-forma impact of depreciation of property, plant and equipment and amortization of PPAs, based on the preliminary purchase price allocations. The pro forma data has also been adjusted to reflect the additional interest expense in connection with the issuance of Senior Notes, adjustment to the non-controlling interest due to the change in NRG's interest to 55.3% from 65.5% effective July 29, 2014, as well as the related tax impact. There were no transactions during the periods between NRG and the Alta Wind Assets. The pro forma results are presented for illustrative purposes only and do not reflect the realization of potential cost savings or any related integration costs.
Acquired ROFO Assets — On June 30, 2014, NRG Yield Operating LLC acquired the El Segundo, TA High Desert, and RE Kansas South projects for a total cash consideration of $357 million, which represents a base purchase price of $349 million and $8 million of working capital adjustments. In addition, the acquisition included the assumption of $612 million in project level debt. The assets and liabilities transferred to the Company relate to interests under common control by NRG and accordingly, were recorded at historical cost in accordance with ASC 805-50. The difference between the cash proceeds and historical value of the net assets was recorded as a distribution to NRG and reduced the balance of its noncontrolling interest. Since the transaction constituted a transfer of net assets under common control, the guidance requires retrospective combination of the entities for all periods presented as if the combination has been in effect since the inception of common control.
The following is a summary of assets and liabilities transferred in connection with the acquisition:
RE Kansas South | TA High Desert | El Segundo | |||||||||
(In millions) | |||||||||||
Current assets | $ | 1 | $ | 3 | $ | 43 | |||||
Property, plant and equipment | 50 | 67 | 625 | ||||||||
Non-current assets | 2 | 13 | 76 | ||||||||
Total assets | 53 | 83 | 744 | ||||||||
Debt | 35 | 57 | 520 | ||||||||
Other current and non-current liabilities | 2 | — | 30 | ||||||||
Total liabilities | 37 | 57 | 550 | ||||||||
Net assets acquired | $ | 16 | $ | 26 | $ | 194 | |||||
The following table presents historical information summary combining the financial information for the Acquired ROFO Assets transferred in connection with the acquisition:
December 31, 2013 | |||||||||||||||||||
As Previously Reported | RE Kansas South | TA High Desert | El Segundo | As Currently Reported | |||||||||||||||
(In millions) | |||||||||||||||||||
Current assets | $ | 267 | $ | 25 | $ | 28 | $ | 58 | $ | 378 | |||||||||
Property, plant and equipment | 1,541 | 51 | 63 | 636 | 2,291 | ||||||||||||||
Non-current assets | 505 | 3 | 10 | 51 | 569 | ||||||||||||||
Total assets | 2,313 | 79 | 101 | 745 | 3,238 | ||||||||||||||
Debt | 1,133 | 58 | 80 | 512 | 1,783 | ||||||||||||||
Other current and non-current liabilities | 169 | 5 | 3 | 26 | 203 | ||||||||||||||
Total liabilities | $ | 1,302 | $ | 63 | $ | 83 | $ | 538 | $ | 1,986 | |||||||||
18
Three months ended September 30, 2013 | Nine months ended September 30, 2013 | ||||||||||||||||||||||||||||||||||||||
As Previously Reported | RE Kansas South | TA High Desert | El Segundo | As Currently Reported | As Previously Reported | RE Kansas South | TA High Desert | El Segundo | As Currently Reported | ||||||||||||||||||||||||||||||
(In millions) | |||||||||||||||||||||||||||||||||||||||
Operating revenues | $ | 95 | $ | 2 | $ | 3 | $ | 26 | $ | 126 | $ | 227 | $ | 2 | $ | 6 | $ | 26 | $ | 261 | |||||||||||||||||||
Operating income | 45 | 2 | 3 | 13 | 63 | 95 | 2 | 4 | 12 | 113 | |||||||||||||||||||||||||||||
Net income | $ | 40 | $ | — | $ | 2 | $ | 7 | $ | 49 | $ | 85 | $ | 1 | $ | 2 | $ | 7 | $ | 95 | |||||||||||||||||||
2013 Acquisitions
Energy Systems — On December 31, 2013, NRG Energy Center Omaha Holdings, LLC, an indirect wholly owned subsidiary of NRG Yield LLC, acquired Energy Systems Company, or Energy Systems, for approximately $120 million. The acquisition was financed from cash on hand. Energy Systems is an operator of steam and chilled water thermal facilities that provides heating and cooling services to nonresidential customers in Omaha, Nebraska. The acquisition was recorded as a business combination under ASC 805, with identifiable assets acquired and liabilities assumed provisionally recorded at their estimated fair values on the acquisition date. The purchase price was primarily allocated to property, plant and equipment of $60 million, customer relationships of $59 million, and $1 million of working capital. The accounting for Energy Systems was completed as of September 30, 2014, at which point the provisional fair values became final with no material changes.
Note 4 — Property, Plant and Equipment
The Company’s major classes of property, plant, and equipment were as follows:
September 30, 2014 | December 31, 2013 | Depreciable Lives | |||||||
(In millions) | |||||||||
Facilities and equipment | $ | 3,487 | $ | 2,411 | 5 - 40 Years | ||||
Land and improvements | 48 | 48 | |||||||
Construction in progress | 7 | 6 | |||||||
Total property, plant and equipment | 3,542 | 2,465 | |||||||
Accumulated depreciation | (266 | ) | (174 | ) | |||||
Net property, plant and equipment | $ | 3,276 | $ | 2,291 | |||||
Renewable Energy Grants
The Borrego solar project achieved commercial operations on February 12, 2013 and transferred the construction in progress to property, plant and equipment. On May 16, 2013, the Borrego solar project, as a qualified renewable energy project, applied for a cash grant in lieu of investment tax credit from the U.S. Treasury Department in the amount of $39 million. A receivable for the cash grant was recorded when the application was filed, which resulted in a reduction to the book basis of the property, plant and equipment. In addition, the receivable was reduced to $36 million as a result of the federal government’s sequestration, which was put into effect on March 1, 2013. The related deferred tax asset of $10 million was recorded with a corresponding reduction of the book value of Borrego’s property, plant and equipment. In March 2014, the Company received payment of $30 million for the cash grant related to Borrego. The Company recorded a reserve for the shortage and is in the process of evaluating all of its options for recovering the full amount of the reserve.
The TA High Desert solar project achieved commercial operations on March 25, 2013 and transferred the construction in progress to property, plant and equipment. On May 22, 2013, the TA High Desert solar project, as a qualified renewable energy project, applied for a cash grant in lieu of investment tax credit from the U.S. Treasury Department in the amount of $25 million. A receivable for the cash grant was recorded when the application was filed, which resulted in a reduction to the book basis of the property, plant and equipment. In addition, the receivable was reduced as a result of the federal government’s sequestration, which was put into effect on March 1, 2013. The related deferred tax asset of $6 million was recorded with a corresponding reduction of the book value of TA High Desert's property, plant and equipment. In April 2014, TA High Desert received a payment of $20 million for the cash grant and reduced the book value of its property, plant and equipment by the amount by which the grant was reduced.
19
The RE Kansas South solar project achieved commercial operations on June 7, 2013 and transferred the construction in progress to property, plant and equipment. On June 27, 2013, the RE Kansas South solar project, as a qualified renewable energy project, applied for a cash grant in lieu of investment tax credit from the U.S. Treasury Department in the amount of $23 million. A receivable for the cash grant was recorded when the application was filed, which resulted in a reduction to the book basis of the property, plant and equipment. In addition, the receivable was reduced to $21 million as a result of the federal government’s sequestration, which was put into effect on March 1, 2013. The related deferred tax asset of $6 million was recorded with a corresponding reduction of the book value of RE Kansas South's property, plant and equipment. In April 2014, RE Kansas South received a payment of $21 million for the cash grant.
Note 5 — Variable Interest Entities, or VIEs
GenConn Energy LLC — The Company has a 49.95% interest in GCE Holdings LLC, the owner of GenConn Energy LLC, or GenConn, which owns and operates two 190 MW peaking generation facilities in Connecticut at the Devon and Middletown sites. Each of these facilities was constructed pursuant to a 30-year cost of service type contract with the Connecticut Light & Power Company. All four units at the GenConn Devon facility reached commercial operation in June 2010 and were released to the ISO-NE by July 2010. In June 2011, all four units at the GenConn Middletown facility reached commercial operation and were released to the ISO-NE. GenConn is considered a VIE under ASC 810, however the Company is not the primary beneficiary, and accounts for its investment under the equity method.
The project was funded through equity contributions from the owners and non-recourse, project level debt. As of September 30, 2014, the Company's investment in GenConn was $114 million and its maximum exposure to loss is limited to its equity investment. On September 17, 2013, GenConn refinanced its existing project financing facility. As of September 30, 2014, the refinanced facility has a $228 million note with an interest rate of 4.73% per annum and a maturity date of July 2041 and a $35 million working capital facility that matures in 2018 which can be used to issue letters of credit at an interest rate of 1.875% per annum. The refinancing is secured by all of the GenConn assets.
The following table presents summarized unaudited financial information for GCE Holdings LLC:
Three months ended September 30, | Nine months ended September 30, | ||||||||||||||
2014 | 2013 | 2014 | 2013 | ||||||||||||
Income Statement Data: | (In millions) | ||||||||||||||
Operating revenues | $ | 18 | $ | 21 | $ | 62 | $ | 60 | |||||||
Operating income | 10 | 11 | 30 | 34 | |||||||||||
Net income | 7 | 8 | 21 | 23 | |||||||||||
September 30, 2014 | December 31, 2013 | ||||||
Balance Sheet Data: | (In millions) | ||||||
Current assets | $ | 26 | $ | 32 | |||
Non-current assets | 442 | 453 | |||||
Current liabilities | 15 | 18 | |||||
Non-current liabilities | 224 | 231 | |||||
20
Note 6 — Fair Value of Financial Instruments
For cash and cash equivalents, restricted cash, accounts receivable — trade, accounts payable, affiliate accounts payable and receivable, accrued expenses and other liabilities, the carrying amount approximates fair value because of the short-term maturity of those instruments and are classified as Level 1 within the fair value hierarchy.
The estimated carrying amounts and fair values of the Company’s recorded financial instruments not carried at fair market value are as follows:
As of September 30, 2014 | As of December 31, 2013 | ||||||||||||||
Carrying Amount | Fair Value | Carrying Amount | Fair Value | ||||||||||||
(In millions) | |||||||||||||||
Assets: | |||||||||||||||
Notes receivable — affiliate | $ | — | $ | — | $ | 2 | $ | 2 | |||||||
Notes receivable, including current portion | 23 | 23 | 27 | 27 | |||||||||||
Liabilities: | |||||||||||||||
Long-term debt, including current portion | 4,083 | 4,157 | 1,783 | 1,785 | |||||||||||
The fair value of notes receivable and long-term debt are based on expected future cash flows discounted at market interest rates, or current interest rates for similar instruments and are classified as Level 3 within the fair value hierarchy.
Fair Value Accounting under ASC 820
ASC 820 establishes a fair value hierarchy that prioritizes the inputs to valuation techniques used to measure fair value into three levels as follows:
• | Level 1—quoted prices (unadjusted) in active markets for identical assets or liabilities that the Company has the ability to access as of the measurement date. |
• | Level 2—inputs other than quoted prices included within Level 1 that are directly observable for the asset or liability or indirectly observable through corroboration with observable market data. |
• | Level 3—unobservable inputs for the asset or liability only used when there is little, if any, market activity for the asset or liability at the measurement date. |
In accordance with ASC 820, the Company determines the level in the fair value hierarchy within which each fair value measurement in its entirety falls, based on the lowest level input that is significant to the fair value measurement.
Recurring Fair Value Measurements
The Company records its derivative assets and liabilities at fair market value on its consolidated balance sheet. The following table presents assets and liabilities measured and recorded at fair value on the Company's consolidated balance sheets on a recurring basis and their level within the fair value hierarchy:
As of September 30, 2014 | |||||||||||
Fair Value (a) | |||||||||||
(In millions) | Level 2 | Level 3 | Total | ||||||||
Derivative assets: | |||||||||||
Commodity contracts | $ | — | $ | — | $ | — | |||||
Interest rate contracts | 7 | — | 7 | ||||||||
Total assets | 7 | — | 7 | ||||||||
Derivative liabilities: | |||||||||||
Commodity contracts | 1 | — | 1 | ||||||||
Interest rate contracts | 52 | — | 52 | ||||||||
Total liabilities | $ | 53 | $ | — | $ | 53 | |||||
(a) There were no assets or liabilities classified as Level 1 as of September 30, 2014.
21
As of December 31, 2013 | |||||||||||
Fair Value (a) | |||||||||||
(In millions) | Level 2 | Level 3 | Total | ||||||||
Derivative assets: | |||||||||||
Commodity contracts | $ | 1 | $ | — | $ | 1 | |||||
Interest rate contracts | 20 | — | 20 | ||||||||
Total assets | 21 | — | 21 | ||||||||
Derivative liabilities: | |||||||||||
Commodity contracts | 1 | 1 | 2 | ||||||||
Interest rate contracts | 45 | — | 45 | ||||||||
Total liabilities | $ | 46 | $ | 1 | $ | 47 | |||||
(a) There were no assets or liabilities classified as Level 1 as of December 31, 2013.
The following table reconciles, for the three and nine months ended September 30, 2014, the beginning and ending balances for derivative instruments that are recognized at fair value in the consolidated financial statements, at least annually, using significant unobservable inputs:
Fair Value Measurement Using Significant Unobservable Inputs - Derivatives (Level 3) | ||||||||
Three months ended September 30, | Nine months ended September 30, | |||||||
(In millions) | 2014 | 2014 | ||||||
Beginning balance | $ | (1 | ) | $ | (1 | ) | ||
Included in earnings | 1 | 1 | ||||||
Ending balance as of September 30, 2014 | $ | — | $ | — | ||||
Derivative Fair Value Measurements
A majority of the Company's contracts are non-exchange-traded and valued using prices provided by external sources. For the Company’s energy markets, management receives quotes from multiple sources. To the extent that multiple quotes are received, the prices reflect the average of the bid-ask mid-point prices obtained from all sources believed to provide the most liquid market for the commodity. The remainder of the assets and liabilities represent contracts for which external sources or observable market quotes are not available. These contracts are valued using various valuation techniques including but not limited to internal models that apply fundamental analysis of the market and corroboration with similar markets.
The fair value of each contract is discounted using a risk free interest rate. In addition, a credit reserve is applied to reflect credit risk, which is calculated based on credit default swaps. To the extent that the net exposure is an asset, the Company uses the counterparty’s default swap rate. If the exposure is a liability, the Company uses its default swap rate. The credit reserve is added to the discounted fair value to reflect the exit price that a market participant would be willing to receive to assume the liabilities or that a market participant would be willing to pay for the assets. It is possible that future market prices could vary from those used in recording assets and liabilities and such variations could be material.
Concentration of Credit Risk
Credit risk relates to the risk of loss resulting from non-performance or non-payment by counterparties pursuant to the terms of their contractual obligations. The Company monitors and manages credit risk through credit policies that include: (i) an established credit approval process; (ii) a daily monitoring of counterparties' credit limits; (iii) the use of credit mitigation measures such as margin, collateral, prepayment arrangements, or volumetric limits; (iv) the use of payment netting agreements; and (v) the use of master netting agreements that allow for the netting of positive and negative exposures of various contracts associated with a single counterparty. Risks surrounding counterparty performance and credit could ultimately impact the amount and timing of expected cash flows. The Company seeks to mitigate counterparty risk by having a diversified portfolio of counterparties. The Company also has credit protection within various agreements to call on additional collateral support if and when necessary. Cash margin is collected and held at the Company to cover the credit risk of the counterparty until positions settle.
22
Counterparty credit exposure includes credit risk exposure under certain long-term agreements, including solar and other PPAs. As external sources or observable market quotes are not available to estimate such exposure, the Company estimates the exposure related to these contracts based on various techniques including but not limited to internal models based on a fundamental analysis of the market and extrapolation of observable market data with similar characteristics. Based on these valuation techniques, as of September 30, 2014, credit risk exposure to these counterparties attributable to the Company's ownership interests was approximately $1.7 billion for the next five years. The majority of these power contracts are with utilities with strong credit quality and public utility commission or other regulatory support. However, such regulated utility counterparties can be impacted by changes in government regulations, which the Company is unable to predict.
Note 7 — Accounting for Derivative Instruments and Hedging Activities
Energy-Related Commodities
As of September 30, 2014, the Company had forward contracts for the purchase of fuel commodities relating to the forecasted usage of the Company’s district energy centers extending through 2017. At September 30, 2014, these contracts were not designated as cash flow or fair value hedges.
Interest Rate Swaps
As of September 30, 2014, the Company had interest rate derivative instruments on project-level debt extending through 2031, some of which are designated as cash flow hedges.
Volumetric Underlying Derivative Transactions
The following table summarizes the net notional volume buy/(sell) of the Company's open derivative transactions broken out by category as of September 30, 2014 and December 31, 2013.
Total Volume | ||||||||
September 30, 2014 | December 31, 2013 | |||||||
Category | Units | (In millions) | ||||||
Natural Gas | MMBtu | 3 | 2 | |||||
Interest | Dollars | $ | 2,125 | $ | 1,234 | |||
The increase in the interest rate position was primarily the result of the interest rate swaps acquired with the Alta Wind Assets.
Fair Value of Derivative Instruments
The following table summarizes the fair value within the derivative instrument valuation on the balance sheet:
Fair Value | |||||||||||||||
Derivative Assets | Derivative Liabilities | ||||||||||||||
September 30, 2014 | December 31, 2013 | September 30, 2014 | December 31, 2013 | ||||||||||||
(In millions) | |||||||||||||||
Derivatives Designated as Cash Flow Hedges: | |||||||||||||||
Interest rate contracts current | $ | — | $ | — | $ | 24 | $ | 26 | |||||||
Interest rate contracts long-term | 5 | 14 | 18 | 16 | |||||||||||
Total Derivatives Designated as Cash Flow Hedges | 5 | 14 | 42 | 42 | |||||||||||
Derivatives Not Designated as Cash Flow Hedges: | |||||||||||||||
Interest rate contracts current | — | — | 5 | 3 | |||||||||||
Interest rate contracts long-term | 2 | 6 | 5 | — | |||||||||||
Commodity contracts current | — | 1 | 1 | 2 | |||||||||||
Commodity contracts long-term | — | — | — | — | |||||||||||
Total Derivatives Not Designated as Cash Flow Hedges | 2 | 7 | 11 | 5 | |||||||||||
Total Derivatives | $ | 7 | $ | 21 | $ | 53 | $ | 47 | |||||||
23
The Company has elected to present derivative assets and liabilities on the balance sheet on a trade-by-trade basis and does not offset amounts at the counterparty master agreement level. As of September 30, 2014 and December 31, 2013, there was no outstanding collateral paid or received. The following table summarizes the offsetting of derivatives by counterparty master agreement level:
Gross Amounts Not Offset in the Statement of Financial Position | |||||||||||
Gross Amounts of Recognized Assets/Liabilities | Derivative Instruments | Net Amount | |||||||||
As of September 30, 2014 | (In millions) | ||||||||||
Commodity contracts: | |||||||||||
Derivative assets | $ | — | $ | — | $ | — | |||||
Derivative liabilities | (1 | ) | — | (1 | ) | ||||||
Total commodity contracts | (1 | ) | — | (1 | ) | ||||||
Interest rate contracts: | |||||||||||
Derivative assets | 7 | (5 | ) | 2 | |||||||
Derivative liabilities | (52 | ) | 5 | (47 | ) | ||||||
Total interest rate contracts | (45 | ) | — | (45 | ) | ||||||
Total derivative instruments | $ | (46 | ) | $ | — | $ | (46 | ) | |||
Gross Amounts Not Offset in the Statement of Financial Position | |||||||||||
As of December 31, 2013 | Gross Amounts of Recognized Assets/Liabilities | Derivative Instruments | Net Amount | ||||||||
Commodity contracts: | (In millions) | ||||||||||
Derivative assets | $ | 1 | $ | — | $ | 1 | |||||
Derivative liabilities | (2 | ) | — | (2 | ) | ||||||
Total commodity contracts | (1 | ) | — | (1 | ) | ||||||
Interest rate contracts: | |||||||||||
Derivative assets | 20 | (12 | ) | 8 | |||||||
Derivative liabilities | (45 | ) | 12 | (33 | ) | ||||||
Total interest rate contracts | (25 | ) | — | (25 | ) | ||||||
Total derivative instruments | $ | (26 | ) | $ | — | $ | (26 | ) | |||
Accumulated Other Comprehensive Loss
The following table summarizes the effects on the Company’s accumulated other comprehensive loss, or OCL, balance attributable to interest rate swaps designated as cash flow hedge derivatives, net of tax:
Three months ended September 30, | Nine months ended September 30, | ||||||||||||||
2014 | 2013 | 2014 | 2013 | ||||||||||||
(In millions) | (In millions) | ||||||||||||||
Accumulated OCL beginning balance | $ | (24 | ) | $ | (19 | ) | $ | — | $ | (48 | ) | ||||
Reclassified from accumulated OCL to income due to realization of previously deferred amounts | 1 | 4 | 8 | 9 | |||||||||||
Mark-to-market of cash flow hedge accounting contracts | 6 | 1 | (25 | ) | 25 | ||||||||||
Accumulated OCL ending balance, net of income tax benefit of $3 and $1, respectively | (17 | ) | (14 | ) | (17 | ) | (14 | ) | |||||||
Accumulated OCL attributable to NRG | (11 | ) | (6 | ) | (11 | ) | (6 | ) | |||||||
Accumulated OCL attributable to NRG Yield, Inc. | $ | (6 | ) | $ | (8 | ) | $ | (6 | ) | $ | (8 | ) | |||
A loss of $12 million is expected to be realized from OCL during the next 12 months, net of $2 million tax.
Amounts reclassified from accumulated OCL into income and amounts recognized in income from the ineffective portion of cash flow hedges are recorded to interest expense.
24
Impact of Derivative Instruments on the Statements of Operations
The Company has interest rate derivative instruments that are not designated as cash flow hedges as well as ineffectiveness on cash flow hedge derivatives. The effect of interest rate hedges is recorded to interest expense. For the three months ended September 30, 2014 and 2013, the impact to the consolidated statements of operations was $0 million and a gain of $1 million, respectively. For the nine months ended September 30, 2014 and 2013, the impact to the consolidated statements of operations was a loss of $6 million and a gain of $10 million, respectively.
The Company’s derivative commodity contracts relate to its Thermal business for the purchase of fuel commodities based on the forecasted usage of the Thermal district energy centers. Realized gains and losses on these contracts are reflected in the fuel costs that are permitted to be billed to customers through the related customer contracts or tariffs and accordingly, no gains or losses are reflected in the statement of operations for these contracts.
See Note 6, Fair Value of Financial Instruments, for discussion regarding concentration of credit risk.
25
Note 8 — Long - Term Debt
This footnote should be read in conjunction with the complete description under Note 9, Long - Term Debt, to the Company's 2013 Form 10-K. Long-term debt consisted of the following:
September 30, 2014 | December 31, 2013 | Current interest rate % (a) | |||||||
(In millions, except rates) | |||||||||
NRG Yield Inc. Convertible Senior Notes, due 2019 (b) | $ | 325 | $ | — | 3.50 | ||||
NRG Yield LLC Senior Notes, due 2024 | 500 | — | 5.375 | ||||||
Project-level debt: | |||||||||
Alta Wind I, lease financing arrangement, due 2034 | 263 | — | 7.01 | ||||||
Alta Wind II, lease financing arrangement, due 2034 | 207 | — | 5.70 | ||||||
Alta Wind III, lease financing arrangement, due 2034 | 215 | — | 6.07 | ||||||
Alta Wind IV, lease financing arrangement, due 2034 | 139 | — | 5.94 | ||||||
Alta Wind V, lease financing arrangement, due 2035 | 222 | — | 6.07 | ||||||
Alta Wind X, due 2020 | 300 | — | L+2.00 | ||||||
Alta Wind XI, due 2020 | 191 | — | L+2.00 | ||||||
Alta Realty Investments, due 2031 | 34 | — | 7.00 | ||||||
Alta Wind Asset Management, due 2031 | 20 | — | L+2.375 | ||||||
NRG West Holdings LLC, due 2023 | 506 | 512 | L+2.25 - 2.875 | ||||||
NRG Marsh Landing LLC, due 2017 and 2023 | 477 | 473 | L+ 1.75 - 1.875 | ||||||
NRG Solar Alpine LLC, due 2022 | 166 | 221 | L+2.50/L+1.75 | ||||||
NRG Energy Center Minneapolis LLC, due 2017 and 2025 | 122 | 127 | 5.95 - 7.25 | ||||||
NRG Solar Borrego LLC, due 2024 and 2038 | 76 | 78 | L+ 2.50/5.65 | ||||||
South Trent Wind LLC, due 2020 | 66 | 69 | L+2.75 | ||||||
NRG Solar Avra Valley LLC, due 2031 | 64 | 63 | L+ 1.75 | ||||||
TA High Desert LLC, due 2023 and 2033 | 57 | 80 | L+2.50/5.15 | ||||||
NRG Roadrunner LLC, due 2031 | 42 | 44 | L+ 2.01 | ||||||
NRG Solar Kansas South LLC, due 2031 | 36 | 58 | L+2.00 | ||||||
NRG Solar Blythe LLC, due 2028 | 23 | 24 | L+ 2.75 | ||||||
PFMG and related subsidiaries financing agreement, due 2030 | 31 | 32 | 6.00 | ||||||
NRG Energy Center Princeton LLC, due 2017 | 1 | 2 | 5.95 | ||||||
Subtotal project-level debt: | 3,258 | 1,783 | |||||||
Total debt | 4,083 | 1,783 | |||||||
Less current maturities | 157 | 214 | |||||||
Total long-term debt | $ | 3,926 | $ | 1,569 | |||||
(a) As of September 30, 2014, L+ equals 3 month LIBOR plus x%, except for Kansas South where L+ equals 6 month LIBOR plus x%.
(b) Net of discount of $20 million as of September 30, 2014.
The financing arrangements listed above contain certain covenants, including financial covenants, that the Company is required to be in compliance with during the term of the arrangement. As of September 30, 2014, the Company was in compliance with all of the required covenants.
26
The discussion below lists changes to or additions of long-term debt for the nine months ended September 30, 2014.
NRG Yield, Inc. Convertible Notes
During the first quarter of 2014, the Company closed on its offering of $345 million aggregate principal amount of 3.50% Convertible Notes due 2019, or the Convertible Notes. The Convertible Notes are convertible, under certain circumstances, into the Company’s Class A common stock, cash or a combination thereof at an initial conversion price of $46.55 per Class A common share, which is equivalent to an initial conversion rate of approximately 21.4822 shares of Class A common stock per $1,000 principal amount of Convertible Notes. Interest on the Convertible Notes is payable semi-annually in arrears on February 1 and August 1 of each year, commencing on August 1, 2014. The Convertible Notes mature on February 1, 2019, unless earlier repurchased or converted in accordance with their terms. Prior to the close of business on the business day immediately preceding August 1, 2018, the Convertible Notes will be convertible only upon the occurrence of certain events and during certain periods, and thereafter, at any time until the close of business on the second scheduled trading day immediately preceding the maturity date. The Convertible Notes are guaranteed by NRG Yield Operating LLC and NRG Yield LLC.
The convertible notes are accounted for in accordance with ASC 470-20, Debt with Conversion and Other Options. Under ASC 470-20, issuers of convertible debt instruments that may be settled in cash upon conversion, including partial cash settlement, are required to separately account for the liability (debt) and equity (conversion option) components. The application of ACS 470-20 resulted in the recognition of $23 million as the value for the equity component with the offset to debt discount. The debt discount will be amortized to interest expense using the effective interest method over the term of the Convertible Notes.
NRG Yield Operating LLC Senior Notes
On August 5, 2014, NRG Yield Operating LLC issued $500 million of senior unsecured notes, or the Senior Notes. The Senior Notes bear interest at 5.375% and mature in August 2024. Interest on the notes is payable semi-annually on February 15 and August 15 of each year, commencing on February 15, 2015. The Senior Notes are senior unsecured obligations of NRG Yield Operating LLC and are guaranteed by NRG Yield LLC, and by certain of NRG Yield Operating LLC’s wholly owned current and future subsidiaries. The Senior Notes were issued as “Green Bonds,” and all proceeds from the Senior Notes were used to purchase the Alta Wind Assets, which qualify as eligible green projects.
NRG Yield LLC and NRG Yield Operating LLC Revolving Credit Facility
In connection with the Company's initial public offering of Class A common stock in July 2013, as further described in Note 1, Nature of Business, NRG Yield LLC and NRG Yield Operating LLC entered into a senior secured revolving credit facility, which provided a revolving line of credit of $60 million. On April 25, 2014, NRG Yield LLC and NRG Yield Operating LLC amended the revolving credit facility to increase the available line of credit to $450 million and extend its maturity to April 2019. The revolving credit facility can be used for cash or for the issuance of letters of credit. There was no cash drawn and $27 million of letters of credit issued under the revolving credit facility as of September 30, 2014.
Project - level Debt
NRG West Holdings Credit Agreement
On August 23, 2011, NRG West Holdings LLC, or West Holdings, entered into a credit agreement with a group of lenders in respect to the El Segundo project, or the West Holdings Credit Agreement. The West Holdings Credit Agreement is comprised of a $540 million two tranche construction loan facility with additional facilities for the issuance of letters of credit or working capital loans and is secured by the assets of West Holdings.
The two tranche construction loan facility consists of the $480 million Tranche A Construction Facility, or the Tranche A Facility, and the $60 million Tranche B Construction Facility, or the Tranche B Facility. The Tranche A and Tranche B Facilities, which mature in August 2023, convert to a term loan and have an interest rate of 3-month LIBOR, plus an applicable margin which (i) increases by 0.125% periodically from conversion through year eight for the Tranche A Facility, and (ii) increases by (A) 0.125% upon term conversion and on the third and sixth anniversary of the term conversion and (B) by 0.025% on the eighth anniversary of the term conversion for the Tranche B Facility. The Tranche A and Tranche B Facilities amortize based upon a predetermined schedule over the term of the loan with the balance payable at maturity. The construction loan converted to a term loan on January 28, 2014.
The West Holdings Credit Agreement also provides for the issuance of letters of credit and working capital loans to support the El Segundo project's collateral needs. This includes letter of credit facilities on behalf of West Holdings of up to $90 million in support of the PPA, up to $48 million in support of the collateral agent, and a working capital facility which permits loans or the issuance of letters of credit of up to $10 million.
27
As of September 30, 2014, under the West Holdings Credit Agreement, West Holdings had $447 million outstanding under the Tranche A Facility, $59 million under the Tranche B Facility, issued a $33 million letter of credit in support of the PPA, a $48 million letter in support of debt service and a $1 million letter of credit under the working capital facility.
Alpine Financing
On March 16, 2012, NRG Solar Alpine LLC, or Alpine, entered into a credit agreement with a group of lenders for a $166 million construction loan that was convertible to a term loan upon completion of the project and a $68 million cash grant loan. On January 15, 2013, the credit agreement was amended, reducing the cash grant loan to $63 million. On March 26, 2013, Alpine met the conditions under the credit agreement to convert the construction loan to a term loan. Immediately prior to the conversion, the Company drew an additional $164 million under the construction loan and $62 million under the cash grant loan. The term loan amortizes on a predetermined schedule with final maturity in November 2022.
In January 2014, Alpine repaid the $62 million of outstanding cash grant loan, including accrued interest and breakage fees, with the proceeds that it had received from the U.S. Treasury Department, as further described in in Note 4, Property, Plant and Equipment. On June 24, 2014, Alpine amended the credit agreement to increase its term loan borrowings by an additional $13 million and to reduce the related interest rate to 3 month LIBOR plus 1.75% through June 30, 2019 and 3 month LIBOR plus 2.00% through November 2022. The proceeds were utilized to make a distribution of $11 million to NRG Yield Operating LLC with the remaining $2 million utilized to fund the costs of the amendment.
TA High Desert Facility
The TA High Desert Facility is comprised of $53 million of fixed rate notes due 2033 at an interest rate of 5.15%, $7 million of floating rate notes due 2023, $22 million of bridge notes due the earlier of ten days after receipt of the cash grant or May 2014, and a revolving facility of $12 million. The floating rate notes have an interest rate of 3 month LIBOR plus 2.5% with LIBOR floor of 1.5%, while the bridge notes have an interest rate of 1 month LIBOR plus 2.50%. As described in Note 4, Property, Plant and Equipment, in April 2014, TA High Desert received payment of $20 million for its cash grant and utilized the proceeds, along with an additional $2 million of cash contributed by NRG to repay the cash grant bridge loan. The revolving facility can be used for cash or for the issuance of up to $9 million in letters of credit. As of September 30, 2014, $57 million of notes were outstanding and $8 million of letters of credit were outstanding under the revolving facility. The notes amortize on predetermined schedules and are secured by all of the assets of TA High Desert.
RE Kansas South Facility
The RE Kansas South Facility includes a $38 million term loan due 2031 and a $21 million cash grant bridge loan due ten days after receipt of the cash grant. The term loan has an interest rate of 6 month LIBOR plus an applicable margin of 2.625% and increases by 0.25% every 4 years. The cash grant bridge loan had an interest rate of 1 month LIBOR plus an applicable margin of 2.00%. The term loan amortizes on a predetermined schedule and is secured by all of the assets of RE Kansas South. As described in Note 4, Property, Plant and Equipment, in April 2014, the Company received payment of $21 million for the cash grant related to RE Kansas South and utilized the proceeds to repay the cash grant bridge loan. As of September 30, 2014, $36 million was outstanding under the term loan and $4 million of letters of credit were issued under the RE Kansas South Facility. On September 26, 2014, RE Kansas South amended its credit agreement to change the interest rate to 6 month LIBOR plus 2.00% through September 30, 2019 and to 6 month LIBOR plus 2.250% thereafter.
Additional Project-level Debt Amendments
On July 9, 2014, Avra Valley amended its credit agreement to increase its borrowings by $3 million and to reduce the related interest rate from 3 month LIBOR plus an applicable margin of 2.25% to 3 month LIBOR plus 1.75%. The proceeds were primarily utilized to make a distribution to NRG Yield Operating LLC.
On July 17, 2014, Marsh Landing amended its credit agreement to increase its borrowings by $34 million and to reduce the related interest rate for the Tranche A borrowings from 3 month LIBOR plus an applicable margin of 2.75% to 3 month LIBOR plus 1.75% through December 2017 and to 3 month LIBOR plus 2.00% thereafter; and for the Tranche B to reduce the related interest rate from 3 month LIBOR plus 3.00% to 3 month LIBOR plus 1.875% through December 2017 and to 3 month LIBOR plus 2.125% thereafter. The proceeds from the borrowings were utilized to make a distribution of $29 million to NRG Yield Operating LLC and to fund the costs of the amendment.
Alta Wind Financing Arrangements
As described in Note 3, Business Acquisitions, the Company acquired the Alta Wind Assets on August 12, 2014. In connection with the acquisition, the Company assumed the following debt arrangements:
28
Term loan and note facilities
Amount in millions, except rates | Term Loan Facility | Letter of Credit Facility | Notes Payable | |||||||||||||||||||||
Non-Recourse Debt | Amount Outstanding as of September 30, 2014 | Interest Rate | Maturity Date | Amount Outstanding as of September 30, 2014 | Interest Rate | Maturity Date | Amount Outstanding as of September 30, 2014 | Interest Rate | Maturity Date | |||||||||||||||
Alta Realty | $ | — | — | — | $ | — | — | — | $ | 34 | 7.00% | 1/31/2031 | ||||||||||||
AWAM | 20 | 3-Month LIBOR + 2.375% | 5/15/2031 | — | — | — | — | — | — | |||||||||||||||
Alta X | 300 | 3-Month LIBOR + 2.00% | 3/31/2020 | 5 | 2.00% | 3/31/2020 | — | — | — | |||||||||||||||
Alta XI | 191 | 3-Month LIBOR + 2.00% | 3/31/2020 | — | — | — | — | — | — | |||||||||||||||
Total | $ | 511 | $ | 5 | $ | 34 | ||||||||||||||||||
All of the assets of Alta X and Alta XI are pledged as collateral under their respective agreements.
Lease financing arrangements
Alta Wind Holdings (Alta Wind II - V) and Alta I have finance lease obligations issued under lease transactions whereby the respective operating entities sold and leased back undivided interests in specific assets of the project. All of the assets of Alta I - V are pledged as collateral under these arrangements. The sale and related lease transactions are accounted for as financing arrangements as the operating entities have continued involvement with the property.
Amount in millions, except rates | Lease Financing Arrangement | Letter of Credit Facility | ||||||||||||||
Non-Recourse Debt | Amount Outstanding as of September 30, 2014 | Interest Rate | Maturity Date | Amount Outstanding as of September 30, 2014 | Interest Rate | Maturity Date | ||||||||||
Alta Wind I | $ | 263 | 7.015% | 12/30/2034 | $ | 16 | 3.250% | 1/5/2016 | ||||||||
Alta Wind II | 207 | 5.696% | 12/30/2034 | 25 | 2.750% | 12/31/2017 | ||||||||||
Alta Wind III | 215 | 6.067% | 12/30/2034 | 25 | 2.750% | 4/13/2018 | ||||||||||
Alta Wind IV | 139 | 5.938% | 12/30/2034 | 18 | 2.750% | 5/20/2018 | ||||||||||
Alta Wind V | 222 | 6.071% | 6/30/2035 | 28 | 2.750% | 6/13/2018 | ||||||||||
Total | $ | 1,046 | $ | 112 | ||||||||||||
29
Interest Rate Swaps — Alta Wind Project Financings
Certain of Alta Wind's project subsidiaries entered into interest rate swaps, intended to hedge the risks associated with interest rates on non-recourse project level debt. These swaps amortize in proportion to their respective loans and are floating for fixed where the project subsidiary pays its counterparty the equivalent of a fixed interest payment on a predetermined notional value and will receive quarterly the equivalent of a floating interest payment based on the same notional value. All interest rate swap payments by a project subsidiary and its counterparty are made quarterly and LIBOR is determined in advance of each interest period. The following table summarizes the swaps related to Alta Wind project level debt as of September 30, 2014:
Non-Recourse Debt | % of Principal | Fixed Interest Rate | Floating Interest Rate | Notional Amount at September 30, 2014 (In millions) | Effective Date | Maturity Date | ||||||||
Alta X | 100% | various | 3-Month LIBOR | $ | 216 | December 31, 2013 | December 31, 2015 | |||||||
Alta X | 100% | various | 3-Month LIBOR | 84 | December 31, 2013 | December 31, 2025 | ||||||||
Alta X | 100% | various | 3-Month LIBOR | 162 | December 31, 2015 | December 31, 2020 | ||||||||
Alta X | 100% | various | 3-Month LIBOR | 103 | December 31, 2020 | December 31, 2025 | ||||||||
Alta XI | 100% | various | 3-Month LIBOR | 138 | December 31, 2013 | December 31, 2015 | ||||||||
Alta XI | 100% | various | 3-Month LIBOR | 53 | December 31, 2013 | December 31, 2025 | ||||||||
Alta XI | 100% | various | 3-Month LIBOR | 103 | December 31, 2015 | December 31, 2020 | ||||||||
Alta XI | 100% | various | 3-Month LIBOR | 65 | December 31, 2020 | December 31, 2025 | ||||||||
AWAM | 100% | 2.47% | 3-Month LIBOR | 20 | May 22, 2013 | May 15, 2031 | ||||||||
Total | $ | 944 | ||||||||||||
Note 9 — Earnings Per Share
Basic and diluted earnings per Class A common share are computed by dividing net income attributable to NRG Yield, Inc. by the weighted average number of Class A common shares outstanding. Shares issued during the year are weighted for the portion of the year that they were outstanding.
The reconciliation of the Company's basic and diluted earnings per share is shown in the following table:
Three months ended September 30, | Nine months ended September 30, | Period from July 23, 2013 to September 30, | |||||||||
2014 | 2014 | 2013 | |||||||||
(In millions, except per share data) | |||||||||||
Basic and diluted earnings per share attributable to Class A common stockholders | |||||||||||
Net Income Attributable to NRG Yield, Inc. | $ | 6 | $ | 16 | $ | 9 | |||||
Weighted average number of Class A common shares outstanding | 31 | 25 | 23 | ||||||||
Basic and Diluted Earnings per Class A common share | $ | 0.20 | $ | 0.62 | $ | 0.39 | |||||
There was a total of 7 million and 6 million shares of Class A common stock that were anti-dilutive for the three months and nine months ended September 30, 2014, respectively.
30
Note 10 — Changes in Capital Structure
As of September 30, 2014 and December 31, 2013, the Company had 34,586,250 and 22,511,250 shares of Class A common stock outstanding, respectively. On July 29, 2014, the Company issued 12,075,000 Class A common shares for net proceeds, after underwriting discount and expenses, of $630 million.
The following table lists the dividends paid on the Company's Class A common stock during the nine months ended September 30, 2014:
Third Quarter 2014 | Second Quarter 2014 | First Quarter 2014 | |||||||||
Dividends per share | $ | 0.365 | $ | 0.35 | $ | 0.33 | |||||
On November 5, 2014, the Company declared a quarterly dividend on its Class A common stock of $0.375 per share payable on December 15, 2014 to stockholders of record as of December 1, 2014.
The Company's Class A common stock dividends are subject to available capital, market conditions, and compliance with associated laws and regulations.
Note 11 — Segment Reporting
The Company’s segment structure reflects how management currently makes financial decisions and allocates resources. Its businesses are primarily segregated based on conventional power generation, renewable businesses which consist of solar and wind, and the thermal and chilled water business. The Corporate segment reflects the Company's corporate costs.
Three months ended September 30, 2014 | |||||||||||||||||||
(In millions) | Conventional Generation | Renewables | Thermal | Corporate | Total | ||||||||||||||
Operating revenues | $ | 65 | $ | 48 | $ | 48 | $ | — | $ | 161 | |||||||||
Cost of operations | 9 | 11 | 32 | — | 52 | ||||||||||||||
Depreciation and amortization | 15 | 14 | 5 | — | 34 | ||||||||||||||
General and administrative — affiliate | — | — | — | 3 | 3 | ||||||||||||||
Acquisition-related transaction and integration costs | — | — | — | 2 | 2 | ||||||||||||||
Operating income (loss) | 41 | 23 | 11 | (5 | ) | 70 | |||||||||||||
Equity in earnings of unconsolidated affiliates | 4 | 7 | — | — | 11 | ||||||||||||||
Other income, net | — | — | — | 1 | 1 | ||||||||||||||
Interest expense | (11 | ) | (19 | ) | (2 | ) | (9 | ) | (41 | ) | |||||||||
Income (loss) before income taxes | 34 | 11 | 9 | (13 | ) | 41 | |||||||||||||
Net Income (Loss) | 34 | 11 | 9 | (23 | ) | 31 | |||||||||||||
Total Assets | $ | 1,526 | $ | 3,413 | $ | 434 | $ | 526 | $ | 5,899 | |||||||||
Three months ended September 30, 2013 | |||||||||||||||||||
(In millions) | Conventional Generation | Renewables | Thermal | Corporate | Total | ||||||||||||||
Operating revenues | $ | 57 | $ | 29 | $ | 40 | $ | — | $ | 126 | |||||||||
Cost of operations | 13 | 3 | 28 | — | 44 | ||||||||||||||
Depreciation and amortization | 7 | 7 | 4 | — | 18 | ||||||||||||||
General and administrative — affiliate | — | — | — | 1 | 1 | ||||||||||||||
Operating income (loss) | 37 | 19 | 8 | (1 | ) | 63 | |||||||||||||
Equity in earnings of unconsolidated affiliates | 5 | 7 | — | — | 12 | ||||||||||||||
Interest expense | (10 | ) | (9 | ) | (2 | ) | — | (21 | ) | ||||||||||
Income (loss) before income taxes | 32 | 17 | 6 | (1 | ) | 54 | |||||||||||||
Net Income (Loss) | $ | 32 | $ | 17 | $ | 6 | $ | (6 | ) | $ | 49 | ||||||||
31
Nine months ended September 30, 2014 | |||||||||||||||||||
(In millions) | Conventional Generation | Renewables | Thermal | Corporate | Total | ||||||||||||||
Operating revenues | $ | 182 | $ | 97 | $ | 156 | $ | — | $ | 435 | |||||||||
Cost of operations | 31 | 18 | 108 | — | 157 | ||||||||||||||
Depreciation and amortization | 51 | 29 | 14 | — | 94 | ||||||||||||||
General and administrative — affiliate | — | — | — | 7 | 7 | ||||||||||||||
Acquisition-related transaction and integration costs | — | — | — | 2 | 2 | ||||||||||||||
Operating income (loss) | 100 | 50 | 34 | (9 | ) | 175 | |||||||||||||
Equity in earnings of unconsolidated affiliates | 11 | 15 | — | — | 26 | ||||||||||||||
Other income, net | — | 1 | — | 1 | 2 | ||||||||||||||
Interest expense | (33 | ) | (41 | ) | (6 | ) | (17 | ) | (97 | ) | |||||||||
Income (loss) before income taxes | 78 | 25 | 28 | (25 | ) | 106 | |||||||||||||
Net Income (Loss) | 78 | 25 | 28 | (40 | ) | 91 | |||||||||||||
Nine months ended September 30, 2013 | |||||||||||||||||||
(In millions) | Conventional Generation | Renewables | Thermal | Corporate | Total | ||||||||||||||
Operating revenues | $ | 77 | $ | 71 | $ | 113 | $ | — | $ | 261 | |||||||||
Cost of operations | 16 | 8 | 81 | — | 105 | ||||||||||||||
Depreciation and amortization | 9 | 18 | 11 | — | 38 | ||||||||||||||
General and administrative — affiliate | — | — | — | 5 | 5 | ||||||||||||||
Operating income (loss) | 52 | 45 | 21 | (5 | ) | 113 | |||||||||||||
Equity in earnings of unconsolidated affiliates | 12 | 6 | — | — | 18 | ||||||||||||||
Interest expense | (13 | ) | (13 | ) | (6 | ) | — | (32 | ) | ||||||||||
Other income, net | 1 | — | — | — | 1 | ||||||||||||||
Income (loss) before income taxes | 52 | 38 | 15 | (5 | ) | 100 | |||||||||||||
Net Income (Loss) | $ | 52 | $ | 38 | $ | 15 | $ | (10 | ) | $ | 95 | ||||||||
Note 12 — Income Taxes
Effective Tax Rate
The income tax provision consisted of the following:
Three months ended September 30, | Nine months ended September 30, | ||||||||||||||
(In millions, except otherwise noted) | 2014 | 2013 | 2014 | 2013 | |||||||||||
Income before income taxes | $ | 41 | $ | 54 | $ | 106 | $ | 100 | |||||||
Income tax expense | 10 | 5 | 15 | 5 | |||||||||||
Effective tax rate | 24.4 | % | 9.3 | % | 14.2 | % | 5.0 | % | |||||||
For the three and nine months ended September 30, 2014 and 2013, the overall effective tax rate was different than the statutory rate of 35% primarily due to taxable earnings allocated to NRG resulting from its interest of 55.3% and 65.5%, respectively, in NRG Yield LLC.
On July 22, 2013, the Company acquired a controlling interest in NRG Yield LLC and its subsidiary NRG Yield Operating LLC. On July 29, 2014, the Company issued additional shares of Class A common stock, and as a result, it currently owns 44.7% of NRG Yield LLC and consolidates the results due to its controlling interest. The Company records NRG's 55.3% ownership as noncontrolling interest in the financial statements. For tax purposes, NRG Yield LLC is treated as a partnership, therefore, the Company and NRG each record their respective share of taxable income or loss.
The Company's deferred tax balances reflect the difference in book and tax basis of the Company's assets primarily due to an increase in the tax basis of property, plant and equipment. The change in tax basis resulted in a non-cash addition of $71 million during the nine months ended September 30, 2014 and $153 million during the year ended December 31, 2013 to the Company's additional paid-in capital.
32
Note 13 — Related Party Transactions
Management Services Agreement with NRG
Subsequent to the initial public offering, NRG provides the Company with various operation, management, and administrative services, which include human resources, accounting, tax, legal, information systems, treasury, and risk management, as set forth in the Management Services Agreement. As of September 30, 2014, the base management fee was approximately $1.5 million per quarter subject to an inflation based adjustment annually at an inflation factor based on the year-over-year U.S. consumer price index. The fee is also subject to adjustments following the consummation of future acquisitions and as a result of a change in the scope of services provided under the Management Services Agreement. The fee was increased by approximately $2 million per year in connection with the acquisition of the Acquired ROFO Assets and Alta Wind Assets. Costs incurred under this agreement were approximately $7 million for the nine months ended September 30, 2014, which included certain direct expenses incurred by NRG on behalf of the Company in addition to the base management fee.
Operation and Maintenance Services Agreements by and between NRG and Thermal Entities
On October 1, 2014, NRG entered into Plant Operation and Maintenance Services Agreements with certain wholly owned subsidiaries of the Company. NRG agreed to provide necessary and appropriate services to operate and maintain the subsidiaries' plant operations, businesses and thermal facilities. NRG is to be reimbursed for the provided services, as well as for all reasonable and related expenses and expenditures, and payments to third parties for services and materials rendered to or on behalf of the parties to the agreements. NRG is not entitled to any management fee or mark-up under the agreements.
Accounts Payable to NRG Renew LLC
During the third quarter of 2013, NRG Renew LLC (formerly known as NRG Solar LLC), a wholly-owned subsidiary of NRG, made 100% of the required capital contributions to CVSR, including the Company's 48.95% portion, of which $14 million was outstanding as of December 31, 2013. This balance was repaid to NRG Renew LLC during the quarter ended March 31, 2014.
Accounts Payable to NRG Repowering Holdings LLC
During 2013, NRG Repowering Holdings, LLC, a wholly-owned subsidiary of NRG, made payments to BA Leasing BSC, LLC, or BA Leasing, of $18 million, which were expected to be repaid with the proceeds of the cash grant received by BA leasing with respect to the PFMG DG Solar Projects, a wholly-owned subsidiary of the Company, in connection with a sale-leaseback arrangement between the PFMG DG Solar Projects and BA Leasing. As of December 31, 2013, PFMG DG Solar Projects had a corresponding receivable for the reimbursement of the cash grant from BA Leasing and related payable to NRG Repowering Holdings, LLC. In the first quarter of 2014, the PFMG DG Solar Projects received $11 million from BA Leasing and reduced the remaining receivable with an offset to the deferred liability recorded in connection with the sale-leaseback arrangement. The PFMG DG Solar Projects utilized the $11 million to repay NRG Repowering Holdings LLC.
Note 14 — Environmental Matters
In 2013, NRG Energy Center San Francisco LLC, a wholly owned indirect subsidiary of the Company, received a notice of violation from the San Francisco Department of Public Health alleging improper monitoring of three underground storage tanks. The tanks have not leaked. The Company settled the matter in July 2014 for $123,000.
33
ITEM 2 — MANAGEMENT’S DISCUSSION AND ANALYSIS OF FINANCIAL CONDITION AND RESULTS OF OPERATIONS
The following discussion analyzes the Company's historical financial condition and results of operations. For all periods prior to the initial public offering, the discussion reflects the Company's accounting predecessor, or NRG Yield, the financial statements of which were prepared on a ''carve-out'' basis from NRG and are intended to represent the financial results of the contracted renewable energy and conventional generation and thermal infrastructure assets in the United States that were acquired by NRG Yield LLC on July 22, 2013. For all periods subsequent to the initial public offering, the discussion reflects the Company's consolidated financial results. In addition, as discussed in Note 1, Nature of Business to this Form 10-Q, the purchase of the Acquired ROFO Assets on June 30, 2014 was accounted for in accordance with ASC 850-50, Business Combinations - Related Issues, whereas the assets and liabilities transferred to the Company relate to interests under common control by NRG and accordingly, were recorded at historical cost. The difference between the cash proceeds and historical value of the net assets was recorded as a distribution to NRG and reduced the balance of its noncontrolling interest. The guidance requires retrospective combination of the entities for all periods presented as if the combination has been in effect since the inception of common control.
As you read this discussion and analysis, refer to the Company's Consolidated Statements of Operations to this Form 10-Q, which present the results of operations for the nine months ended September 30, 2014 and 2013. Also refer to the Company's 2013 Form 10-K, which includes detailed discussions of various items impacting the Company's business, results of operations and financial condition.
The discussion and analysis below has been organized as follows:
• | Executive Summary, including a description of the business and significant events that are important to understanding the results of operations and financial condition; |
• | Results of operations, including an explanation of significant differences between the periods in the specific line items of the consolidated statements of operations; |
• | Financial condition addressing liquidity position, sources and uses of cash, capital resources and requirements, commitments, and off-balance sheet arrangements; and |
• | Known trends that may affect the Company’s results of operations and financial condition in the future. |
34
Executive Summary
Introduction and Overview
The Company is a dividend growth-oriented company formed to serve as the primary vehicle through which NRG owns, operates and acquires contracted renewable and conventional generation and thermal infrastructure assets. The Company believes it is well positioned to be a premier company for investors seeking stable and growing dividend income from a diversified portfolio of lower-risk high-quality assets.
The Company owns a diversified portfolio of contracted renewable and conventional generation and thermal infrastructure assets in the United States. The Company’s contracted generation portfolio collectively represents 2,861 net MW. Each of these assets sells substantially all of its output pursuant to long-term offtake agreements with creditworthy counterparties. The average remaining contract duration of these offtake agreements was approximately 18 years as of September 30, 2014 based on cash available for distribution. The Company also owns thermal infrastructure assets with an aggregate steam and chilled water capacity of 1,346 net MWt and electric generation capacity of 123 net MW. These thermal infrastructure assets provide steam, hot water and/or chilled water, and in some instances electricity, to commercial businesses, universities, hospitals and governmental units in multiple locations, principally through long-term contracts or pursuant to rates regulated by state utility commissions.
Regulatory Matters
The Company’s regulatory matters are described in the Company’s 2013 Form 10-K in Item 1, Business — Regulatory Matters. These matters have been updated below for significant events occurring during the quarter ended September 30, 2014.
As owners of power plants and participants in wholesale and retail energy markets, certain of the Company's subsidiaries are subject to regulation by various federal and state government agencies. These include FERC and the PUCT, as well as other public utility commissions in certain states where the Company's assets are located. Each of the Company's U.S. generating facilities qualifies as an EWG or QF. In addition, the Company is subject to the market rules, procedures and protocols of the various ISO and RTO markets in which it participates. Likewise, the Company must also comply with the mandatory reliability requirements imposed by NERC and the regional reliability entities in the regions where the Company operates.
The Company's operations within the ERCOT footprint are not subject to rate regulation by FERC, as they are deemed to operate solely within the ERCOT market and not in interstate commerce. These operations are subject to regulation by PUCT.
National
New Jersey and Maryland’s Generator Contracting Programs — The New Jersey Board of Public Utilities and the Maryland Public Service Commission awarded long-term power purchase contracts to generation developers to encourage the construction of new generation capacity in the respective States. The constitutionality of the long-term contracts was challenged and the U.S. District Court for the District of New Jersey (in an October 25, 2013 decision) and the U.S. District Court for the District of Maryland (in an October 24, 2013 decision) found that the respective contracts violated the Supremacy Clause of the U.S. Constitution and were preempted. On June 30, 2014, the U.S. Court of Appeals for the Fourth Circuit affirmed the Maryland District Court's decision. On September 11, 2014, the U.S. Court of Appeals for the Third Circuit affirmed the New Jersey District Court's decision.
Environmental Matters
The Company is subject to a wide range of environmental laws in the development, ownership, construction and operation of projects. These laws generally require that governmental permits and approvals be obtained before construction and during operation of facilities. Environmental laws have become increasingly stringent and the Company expects this trend to continue. The electric generation industry is likely to face new requirements to address various emissions, including GHG, and threatened and endangered species.
In January 2014, the EPA re-proposed the NSPS for CO2 emissions from new fossil-fuel-fired electric generating units that had been previously proposed in April 2012. The re-proposed standards are 1,000 pounds of CO2 per MWh for large gas units and 1,100 pounds of CO2 per MWh for coal units and small gas units. Proposed standards are in effect until a final rule is published or another rule is re-proposed. On June 18, 2014, the EPA proposed a rule that would require states to develop CO2 emission standards that would apply to existing fossil-fueled generating facilities. Specifically, the EPA proposed state-specific rate-based standards for CO2 emissions, as well as guidelines for states to follow in developing plans to achieve the state-specific standards. The EPA anticipates finalizing this rule in June 2015.
35
Significant Events During the Nine Months Ended September 30, 2014
Alta Acquisition
On August 12, 2014, the Company acquired 100% of the membership interests of Alta Wind Asset Management Holdings, LLC, Alta Wind Company, LLC, Alta Wind X Holding Company, LLC and Alta Wind XI Holding Company, LLC, which collectively own 7 wind facilities that total 947 MW located in Tehachapi, California, or the Alta Wind Assets, and a portfolio of land leases associated with the Alta Wind Assets. The purchase price for the Alta Wind Assets was $923 million, which included a base purchase price of $870 million, and a payment for working capital of $53 million, plus the assumption of $1.6 billion of non-recourse project-level debt. Terra-Gen, an affiliate of the Alta Sellers, provides the day-to-day operations and maintenance services under a 10-year O&M agreement, which will automatically extend for additional five-year periods unless either party provides notice of termination at least 90 days prior to the expiration of the then-current term. Pursuant to the terms of such agreement, Terra-Gen is paid a fixed monthly payment (adjusted annually for inflation) and reimbursed for certain costs incurred.
Issuance of 5.375% NRG Yield Operating LLC Senior Notes
On August 5, 2014, NRG Yield Operating LLC issued $500 million in senior unsecured notes as described in Note 8, Long - Term Debt.
Acquisition of Acquired ROFO Assets from NRG
On June 30, 2014 the Company acquired from NRG: (i) El Segundo, a 550 MW fast-start, gas-fired facility located in Los Angeles County, California; (ii) TA High Desert, a 20 MW solar facility located in Los Angeles County, California; and (iii) RE Kansas South, a 20 MW solar facility located in Kings County, California. The assets were acquired pursuant to the Right of First Offer Agreement between the Company and NRG. The Company paid NRG total cash consideration of $357 million, which represents a base purchase price of $349 million and a payment for working capital of $8 million. In addition, the acquisition included the assumption of $612 million in project level debt.
Issuance of 3.50% Convertible Notes
During the first quarter of 2014, the Company issued $345 million in aggregate principal amount of its convertible notes as described in Note 8, Long - Term Debt.
Significant Events During the Nine Months Ended September 30, 2013
During the first nine months of 2013, Alpine, Borrego and Marsh Landing achieved commercial operations. In addition, Borrego completed financing arrangements with a group of lenders. The Company completed its initial public offering on July 22, 2013. See Note 1, Nature of Business, for information related to the initial public offering.
Basis of Presentation
For all periods prior to the initial public offering, the accompanying unaudited combined financial statements represent the combination of the assets that NRG Yield LLC acquired and were prepared using NRG's historical basis in the assets and liabilities. For the purposes of the unaudited combined financial statements, the term "NRG Yield" represents the accounting predecessor, or the combination of the acquired businesses. For all periods subsequent to the initial public offering, the accompanying unaudited consolidated financial statements represent the consolidated results of NRG Yield, Inc., which consolidates NRG Yield LLC through its controlling interest.
The acquisition of the TA High Desert, RE Kansas South, and El Segundo projects from NRG on June 30, 2014 was accounted for as a transfer of entities under common control. The guidance requires retrospective combination of the entities for all periods presented as if the combination has been in effect since the inception of common control. Accordingly, the Company prepared its consolidated financial statements to reflect the transfer as if it had taken place on January 1, 2013, or from the date the entities were under common control, which was May 13, 2013 for RE Kansas South and March 28, 2013 for TA High Desert. Member's equity represents NRG's equity in the subsidiaries, and accordingly, in connection with their acquisition by the Company, the balance was reclassified into noncontrolling interest. The Company reduces net income attributable to its Class A common shareholders by the pre-acquisition net income for the Acquired ROFO Assets as it is not available to the shareholders.
36
Consolidated Results of Operations
The following table provides selected financial information:
Three months ended September 30, | Nine months ended September 30, | ||||||||||||||||||||
(In millions except otherwise noted) | 2014 | 2013 | Change % | 2014 | 2013 | Change % | |||||||||||||||
Operating Revenues | |||||||||||||||||||||
Total operating revenues | $ | 161 | $ | 126 | 28 | $ | 435 | $ | 261 | 67 | |||||||||||
Operating Costs and Expenses | |||||||||||||||||||||
Cost of operations | 52 | 44 | 18 | 157 | 105 | 50 | |||||||||||||||
Depreciation and amortization | 34 | 18 | 89 | 94 | 38 | 147 | |||||||||||||||
General and administrative — affiliate | 3 | 1 | 200 | 7 | 5 | 40 | |||||||||||||||
Acquisition-related transaction and integration costs | 2 | — | 100 | 2 | — | 100 | |||||||||||||||
Total operating costs and expenses | 91 | 63 | 44 | 260 | 148 | 76 | |||||||||||||||
Operating Income | 70 | 63 | 11 | 175 | 113 | 55 | |||||||||||||||
Other Income (Expense) | |||||||||||||||||||||
Equity in earnings of unconsolidated affiliates | 11 | 12 | (8 | ) | 26 | 18 | 44 | ||||||||||||||
Other income, net | 1 | — | 100 | 2 | 1 | 100 | |||||||||||||||
Interest expense | (41 | ) | (21 | ) | 95 | (97 | ) | (32 | ) | 203 | |||||||||||
Total other expense | (29 | ) | (9 | ) | 222 | (69 | ) | (13 | ) | 431 | |||||||||||
Income Before Income Taxes | 41 | 54 | (24 | ) | 106 | 100 | 6 | ||||||||||||||
Income tax expense | 10 | 5 | 100 | 15 | 5 | 200 | |||||||||||||||
Net Income | 31 | 49 | (37 | ) | 91 | 95 | (4 | ) | |||||||||||||
Less: Pre-acquisition net income of Acquired ROFO Assets | — | 9 | (100 | ) | 17 | 10 | 70 | ||||||||||||||
Less: Predecessor income prior to initial public offering on July 22, 2013 | — | 9 | (100 | ) | — | 54 | (100 | ) | |||||||||||||
Net Income Subsequent to Initial Public Offering and Excluding Pre-acquisition Net Income of Acquired ROFO Assets | 31 | 31 | — | 74 | 31 | 139 | |||||||||||||||
Less: Income attributable to NRG | 25 | 22 | 14 | 58 | 22 | 164 | |||||||||||||||
Net Income Attributable to NRG Yield, Inc. | $ | 6 | $ | 9 | (33 | ) | $ | 16 | $ | 9 | 78 | ||||||||||
Three months ended September 30, | Nine months ended September 30, | ||||||||||
Business metrics: | 2014 | 2013 | 2014 | 2013 | |||||||
Renewable MWh sold (in thousands) | 377 | 207 | 868 | 656 | |||||||
Thermal MWt sold (in thousands) (a) | 467 | 389 | 1,576 | 1,251 | |||||||
(a) Volumes sold do not include MWh 65 thousand, 59 thousand, 189 thousand and 104 thousand for thermal generation for the three months and nine months ended September 30, 2014 and 2013, respectively.
37
Management’s Discussion of the Results of Operations for the Three Months ended September 30, 2014 and 2013
Operating Revenues
Conventional | Renewables | Thermal | Total | ||||||||||||
(In millions) | |||||||||||||||
Three Months Ended September 30, 2014 | $ | 65 | $ | 48 | $ | 48 | $ | 161 | |||||||
Three Months Ended September 30, 2013 | 57 | 29 | 40 | 126 | |||||||||||
Operating revenues increased by $35 million during the three months ended September 30, 2014, compared to the same period in 2013 due to:
Increase due to the acquisition of Alta Wind Assets in August 2014 | $ | 18 | |
Increase due to the acquisition of Energy Systems in December 2013 | 8 | ||
Increase in Conventional revenues as El Segundo reached commercial operations in July 2013 and was merchant for one month until the PPA began in August 2013. | 8 | ||
Increase in revenue generated from other Renewables projects | 1 | ||
$ | 35 | ||
Cost of Operations
Conventional | Renewables | Thermal | Total | ||||||||||||
(In millions) | |||||||||||||||
Three Months Ended September 30, 2014 | $ | 9 | $ | 11 | $ | 32 | $ | 52 | |||||||
Three Months Ended September 30, 2013 | 13 | 3 | 28 | 44 | |||||||||||
Costs of operations changed by $8 million during the three months ended September 30, 2014, compared to the same period in 2013 due to:
Increase due to the acquisition of Alta Wind Assets in August 2014 | $ | 7 | |
Increase due to the acquisition of Energy Systems in December 2013 | 4 | ||
Decrease in fuel costs for El Segundo as it was merchant in the prior year for one month until the PPA began in August 2013 | (4 | ) | |
Increased maintenance and operations costs for other Renewables projects | 1 | ||
$ | 8 | ||
Depreciation and Amortization
Depreciation and amortization increased by $16 million during the three months ended September 30, 2014, compared to the same period in 2013, due primarily to additional depreciation expense associated with the Alta Wind Assets acquired in the third quarter of 2014 and El Segundo which reached commercial operations in 2013.
Equity in Earnings of Unconsolidated Affiliates
Equity in earnings of unconsolidated affiliates decreased by $1 million during the three months ended September 30, 2014, compared to the same period in 2013 due primarily to a decrease in earnings from CVSR.
Interest Expense
Interest expense increased by $20 million during the three months ended September 30, 2014, compared to the same period in 2013, due to interest expense of $11 million on the assumed debt as a result of the Alta Wind Assets acquisition, as well as interest expense of $9 million on the Company's Senior Notes issued in August 2014 and Convertible Notes issued in February 2014.
38
Income Tax Expense
For the three months ended September 30, 2014, the Company recorded income tax expense of $10 million on pretax income of $41 million. For the same period in 2013, the Company recorded income tax expense of $5 million on pretax income of $54 million. For the three months ended September 30, 2014 and 2013, the overall effective tax rate was different than the statutory rate of 35% primarily due to the allocation to NRG of its respective share of taxable income or loss.
Income Attributable to NRG
For the three months ended September 30, 2014, there was an increase in the income attributable to NRG of $3 million, primarily due to the Company being public for the three months in 2014 as compared to a shorter period in 2013, partially offset by a decrease in NRG's interest in the Company from 65.5% to 55.3% as a result of the equity offering on July 29, 2014.
39
Management’s Discussion of the Results of Operations for the Nine Months ended September 30, 2014 and September 30, 2013
Operating Revenues
Conventional | Renewables | Thermal | Total | ||||||||||||
(In millions) | |||||||||||||||
Nine Months Ended September 30, 2014 | $ | 182 | $ | 97 | $ | 156 | $ | 435 | |||||||
Nine Months Ended September 30, 2013 | 77 | 71 | 113 | 261 | |||||||||||
Operating revenues increased by $174 million during the nine months ended September 30, 2014, compared to the same period in 2013 due to:
Increase in Conventional revenues as El Segundo and Marsh Landing reached commercial operations in 2013 | $ | 105 | |
Increase in Thermal revenues generated from Energy Systems acquired in the fourth quarter of 2013, repowering of Dover facilities in the second quarter of 2013, as well as increased generation at other Thermal facilities due to weather conditions in the first quarter of 2014 | 43 | ||
Increase due to the acquisition of Alta Wind Assets in August 2014 | 18 | ||
Increase in Renewables revenue generated by RE Kansas South, TA High Desert, Alpine and Borrego facilities which reached commercial operations in the first half of 2013 | 8 | ||
$ | 174 | ||
Cost of Operations
Conventional | Renewables | Thermal | Total | ||||||||||||
(In millions) | |||||||||||||||
Nine Months Ended September 30, 2014 | $ | 31 | $ | 18 | $ | 108 | $ | 157 | |||||||
Nine Months Ended September 31, 2013 | 16 | 8 | 81 | 105 | |||||||||||
Cost of operations increased by $52 million during the nine months ended September 30, 2014, compared to the same period in 2013 due to:
Higher cost of production due to repowering of Dover facilities in the second quarter of 2013, increased generation at other Thermal facilities due to weather conditions in the first quarter of 2014, and increased costs in connection with the Energy Systems acquisition | $ | 27 | |
Increase in costs associated with maintenance and operations at Marsh Landing and El Segundo which reached commercial operations in 2013 | 15 | ||
Increase due to acquisition of Alta Wind Assets in August 2014 | 7 | ||
Increase in costs associated with maintenance and operations of RE Kansas South, TA High Desert, Alpine and Borrego facilities which reached commercial operations in the first half of 2013 | 3 | ||
$ | 52 | ||
Depreciation and Amortization
Depreciation and amortization increased by $56 million during the nine months ended September 30, 2014, compared to the same period in 2013, due primarily to $42 million of additional depreciation associated with El Segundo and Marsh Landing in the Conventional segment, which reached commercial operations in the third and second quarters of 2013, respectively; $7 million from the acquisition of the Alta Wind Assets; and $4 million for other solar facilities that reached commercial operations in the first and second quarters of 2013.
Equity in Earnings of Unconsolidated Affiliates
Equity in earnings of unconsolidated affiliates increased by $8 million during the nine months ended September 30, 2014, compared to the same period in 2013, due to an increase of income for CVSR.
40
Interest Expense
Interest expense increased by $65 million during the nine months ended September 30, 2014, compared to the same period in 2013 primarily due to:
Increase in interest expense for the Marsh Landing and El Segundo projects which reached commercial operations in 2013 which resulted in lower capitalized interest in 2014 | $ | 20 | |
Issuance of Convertible Notes in February 2014, Senior Notes in August 2014 and to a lesser extent increased interest expense on the Company's revolving credit facility | 17 | ||
Increase in interest expense related to the Alpine interest rate swap | 14 | ||
Interest expense on the assumed project-level debt as the result of Alta Wind Assets acquisition in August 2014 | 11 | ||
Interest expense on other facilities from the Renewable segment which reached commercial operations in the first half of 2013 | 3 | ||
$ | 65 | ||
Income Tax Expense
For the nine months ended September 30, 2014, the Company recorded income tax expense of $15 million on pretax income of $106 million. For the same period in 2013, the Company recorded income tax expense of $5 million on pretax income of $100 million. For the nine months ended September 30, 2014 and 2013, the overall effective tax rate was different than the statutory rate of 35% primarily due to the allocation to NRG of its respective share of taxable income or loss.
Pre-acquisition Net Income of Acquired ROFO Assets
For the nine months ended September 30, 2014, the Company had an increase of $7 million in pre-acquisition net income of Acquired ROFO Assets primarily due to El Segundo reaching commercial operations in the third quarter of 2013.
Income Attributable to NRG
For the nine months ended September 30, 2014, there was an increase in the income attributable to NRG of $36 million, primarily due to the Company being public for the nine months in 2014 as compared to a shorter period in 2013, partially offset by a decrease in NRG's interest in the Company from 65.5% to 55.3% as a result of the equity offering on July 29, 2014.
Liquidity and Capital Resources
The Company's principal liquidity requirements are to meet its financial commitments, finance current operations, fund capital expenditures, including acquisitions from time to time, and to service debt. Historically, the Company's predecessor operations were financed as part of NRG's integrated operations and largely relied on internally generated cash flows as well as corporate and/or project-level borrowings to satisfy its capital expenditure requirements. As a normal part of the Company's business, depending on market conditions, the Company will from time to time consider opportunities to repay, redeem, repurchase or refinance its indebtedness. Changes in the Company's operating plans, lower than anticipated sales, increased expenses, acquisitions or other events may cause the Company to seek additional debt or equity financing in future periods. There can be no guarantee that financing will be available on acceptable terms or at all. Debt financing, if available, could impose additional cash payment obligations and additional covenants and operating restrictions.
Liquidity Position
As of September 30, 2014 and December 31, 2013, the Company's liquidity was approximately $849 million and $186 million, respectively, comprised of cash, restricted cash, and availability under the Company's revolving credit facility. The increase primarily relates to the available line of credit under the revolving credit facility. The Company's various financing arrangements are described in Note 8, Long-term Debt.
Management believes that the Company's liquidity position, cash flows from operations and availability under our revolving credit facility will be adequate to meet our financial commitments, operating and maintenance capital expenditures and debt service obligations. Management continues to regularly monitor the Company's ability to finance the needs of its operating, financing and investing activity within the dictates of prudent balance sheet management.
41
Sources of Liquidity
The Company's principal sources of liquidity include cash on hand, cash generated from operations, borrowings under new and existing financing arrangements and the issuance of additional equity and debt securities as appropriate given market conditions. As described in Note 8, Long - Term Debt, the Company's financing arrangements consist of the revolving credit facility, the Convertible Notes, the Senior Notes and project-level financings for its various assets.
On July 29, 2014, the Company issued 12,075,000 Class A common shares for net proceeds, after underwriting discount and expenses, of $630 million. The proceeds were partially used to fund the acquisition of the Alta Wind Assets and the excess of the proceeds over the amount utilized is available for general corporate purposes, including future acquisitions.
On August 5, 2014, NRG Yield Operating LLC issued $500 million of senior unsecured notes, or the Senior Notes, and used the proceeds to fund the acquisition of the Alta Wind Assets. The Senior Notes bear interest at 5.375% and mature in 2024.
Uses of Liquidity
The Company's requirements for liquidity and capital resources, other than for operating its facilities, are categorized as: (i) debt service obligations, as described more fully in Note 8, Long - Term Debt, (ii) capital expenditures, (iii) acquisitions and (iv) cash dividends to investors.
Capital Expenditures
The Company’s capital spending program is focused on growth capital expenditures, or construction of new assets and completing the construction of new assets where construction is in process, and maintenance capital expenditures, or costs to maintain the assets currently operating such as costs to replace or refurbish assets during routine maintenance. The Company develops annual capital spending plans based on projected requirements for maintenance capital and completion of facilities under construction.
For the nine months ended September 30, 2014, the Company used approximately $28 million to fund capital expenditures, including capital expenditures of $25 million that primarily relate to the remaining invoices for the construction of Marsh Landing and El Segundo in 2013, as well maintenance capital expenditures of $3 million.
Acquisitions
The Company intends to acquire generation assets developed and constructed by NRG in the future, as well as generation and thermal infrastructure assets from third parties where the Company believes its knowledge of the market, operating expertise and access to capital provides a competitive advantage, and to utilize such acquisitions as a means to grow its cash available for distribution.
On November 4, 2014, the Company and NRG entered into a definitive agreement regarding the acquisition of the following NRG facilities: (i) Walnut Creek, (ii) Tapestry (Pinnacle, Buffalo Bear and Taloga) and (iii) Laredo Ridge for total expected cash consideration of $480 million plus assumed project level debt and working capital adjustments to be calculated at close. The sale is subject to customary closing conditions and is expected to close by the end of the fourth quarter of 2014. The Company expects to fund the acquisition with cash on hand and drawings under the Company's revolving credit facility.
On August 12, 2014, the Company acquired 100% of the membership interests of Alta Wind Asset Management Holdings, LLC, Alta Wind Company, LLC, Alta Wind X Holding Company, LLC and Alta Wind XI Holding Company, LLC for $923 million, which included a base purchase price of $870 million, as well as a payment for working capital of $53 million, plus the assumption of $1.6 billion of non-recourse project-level debt. In order to fund the purchase price, the Company completed an equity offering of 12,075,000 shares of its Class A common stock at an offering price of $54.00 per share on July 29, 2014, which resulted in net proceeds of $630 million, after underwriting discounts and expenses. In addition, on August 5, 2014, NRG Yield Operating LLC issued $500 million of Senior Notes which bear interest at a rate of 5.375% and mature in August 2024. Interest on the Senior Notes is payable semi-annually on February 15 and August 15 of each year, commencing on February 15, 2015. The excess of the equity proceeds over the amount utilized for the acquisition is available for general corporate purposes, including future acquisitions.
42
Cash Dividends to Investors
The Company intends to use the amount of cash that it receives from its distributions from NRG Yield LLC to pay quarterly dividends to the holders of its Class A common stock. NRG Yield LLC intends to distribute to its unit holders in the form of a quarterly distribution all of the cash available for distribution that is generated each quarter less reserves for the prudent conduct of the business, including among others, maintenance capital expenditures to maintain the operating capacity of the assets. Cash available for distribution is defined as earnings before income taxes, depreciation and amortization, excluding contract amortization, cash interest paid, income taxes paid, maintenance capital expenditures, investments in unconsolidated affiliates, growth capital expenditures, net of capital and debt funding, and principal amortization of indebtedness, and including cash distributions from unconsolidated affiliates. Common stock dividends are subject to available capital, market conditions, and compliance with associated laws and regulations. The Company expects that, based on current circumstances, comparable cash dividends will continue to be paid in the foreseeable future.
The following table lists the dividends paid on the Company's Class A common stock during the nine months ended September 30, 2014:
Third Quarter 2014 | Second Quarter 2014 | First Quarter 2014 | |||||||||
Dividends per share | $ | 0.365 | $ | 0.35 | $ | 0.33 | |||||
On November 5, 2014, the Company declared a quarterly dividend on its Class A common stock of $0.375 per share payable on December 15, 2014 to stockholders of record as of December 1, 2014.
The Company's Class A common stock dividends are subject to available capital, market conditions, and compliance with associated laws and regulations.
Cash Flow Discussion
The following table reflects the changes in cash flows for the comparative nine month periods:
2014 | 2013 | Change | |||||||||
(In millions) | |||||||||||
Net cash provided by operating activities | $ | 194 | $ | 90 | $ | 104 | |||||
Net cash used in investing activities | (1,121 | ) | (418 | ) | (703 | ) | |||||
Net cash provided by financing activities | 1,240 | 427 | 813 | ||||||||
Net Cash Provided By Operating Activities
Changes to net cash provided by operating activities were driven by:
(In millions) | |||
Increase in operating income adjusted for non-cash items | $ | 111 | |
Changes in working capital | (7 | ) | |
$ | 104 | ||
Net Cash Used In Investing Activities
Changes to net cash used in investing activities were driven by:
(In millions) | |||
Payment to NRG for Acquired ROFO Assets | $ | (357 | ) |
Payment for acquisition of Alta Wind Assets | (901 | ) | |
Decrease in capital expenditures as most of the projects were placed in service in late 2012 or 2013 | 311 | ||
Increase in proceeds from renewable grants in the first half of 2014 | 113 | ||
Decrease in restricted cash, primarily for Marsh Landing | 116 | ||
Other | 15 | ||
$ | (703 | ) | |
43
Net Cash Provided By Financing Activities
Changes in net cash provided by financing activities were driven by:
(In millions) | |||
Increase due to the additional equity offering of Class A common stock on July 29, 2014 | $ | 162 | |
Increase in cash proceeds from issuance of Senior Notes and other long term debt, partially offset by higher principal payments in the first nine months of 2014 compared to the first nine of 2013 | 208 | ||
Decrease in dividends and distributions, net of contribution paid in the first nine months of 2014 compared to the first nine months of 2013 | 464 | ||
Increase in cash paid for debt issuance fees | (21 | ) | |
$ | 813 | ||
NOLs, Deferred Tax Assets and Uncertain Tax Position Implications, under ASC 740
The Company has no uncertain tax benefits. As of September 30, 2014, the Company has a cumulative NOL carry-forward balance of $99 million for financial statement purposes and does not anticipate any federal income tax payments for 2014. As a result of the Company's tax position, and based on current forecasts, the Company does not anticipate significant income tax payments for state and local jurisdictions in 2014.
Off-Balance Sheet Arrangements
Obligations under Certain Guarantee Contracts
The Company may enter into guarantee arrangements in the normal course of business to facilitate commercial transactions with third parties.
Retained or Contingent Interests
The Company does not have any material retained or contingent interests in assets transferred to an unconsolidated entity.
Obligations Arising Out of a Variable Interest in an Unconsolidated Entity
Variable interest in equity investments — As of September 30, 2014, the Company has several investments with an ownership interest percentage of 50% or less in energy and energy-related entities that are accounted for under the equity method. One of these investments is a variable interest entity for which the Company is not the primary beneficiary.
The Company's pro-rata share of non-recourse debt held by unconsolidated affiliates was approximately $568 million as of September 30, 2014. This indebtedness may restrict the ability of these subsidiaries to issue dividends or distributions to the Company. See also Note 5, Variable Interest Entities, or VIEs.
Contractual Obligations and Commercial Commitments
The Company has a variety of contractual obligations and other commercial commitments that represent prospective cash requirements in addition to our capital expenditure programs, as disclosed in the Company's 2013 Form 10-K. See also Note 8, Long - Term Debt, for additional discussion of contractual obligations incurred during the nine months ended September 30, 2014.
Fair Value of Derivative Instruments
The Company may enter into long-term fuel purchase contracts and other energy-related financial instruments to mitigate variability in earnings due to fluctuations in spot market prices and to hedge fuel requirements at certain generation facilities. In addition, in order to mitigate interest rate risk associated with the issuance of variable rate and fixed rate debt, the Company enters into interest rate swap agreements.
The tables below disclose the activities that include non-exchange traded contracts accounted for at fair value in accordance with ASC 820. Specifically, these tables disaggregate realized and unrealized changes in fair value; disaggregate estimated fair values at September 30, 2014, based on their level within the fair value hierarchy defined in ASC 820; and indicate the maturities of contracts at September 30, 2014. For a full discussion of the Company's valuation methodology of its contracts, see Note 6, Fair Value of Financial Instruments.
44
Derivative Activity Gains/(Losses) | (In millions) | ||
Fair value of contracts as of December 31, 2013 | $ | (26 | ) |
Contracts realized or otherwise settled during the period | 22 | ||
Contracts acquired during the period | (5 | ) | |
Changes in fair value | (37 | ) | |
Fair value of contracts as of September 30, 2014 | $ | (46 | ) |
Fair Value of Contracts as of September 30, 2014 | |||||||||||||||||||
Maturity | |||||||||||||||||||
Fair value hierarchy Gains/(Losses) | 1 Year or Less | Greater than 1 Year to 3 Years | Greater than 3 Years to 5 Years | Greater than 5 Years | Total Fair Value | ||||||||||||||
(In millions) | |||||||||||||||||||
Level 2 | $ | (30 | ) | $ | (27 | ) | $ | 2 | $ | 9 | $ | (46 | ) | ||||||
The Company has elected to disclose derivative assets and liabilities on a trade-by-trade basis and does not offset amounts at the counterparty master agreement level. As discussed below in Quantitative and Qualitative Disclosures about Market Risk -Commodity Price Risk, the Company measures the sensitivity of the portfolio to potential changes in market prices using VaR, a statistical model which attempts to predict risk of loss based on market price and volatility. The Company's risk management policy places a limit on one-day holding period VaR, which limits the net open position.
Based on a sensitivity analysis using simplified assumptions, the impact of a $0.50 per MMBtu increase or decrease in natural gas prices across the term of the derivative contracts would cause a change of approximately $1 million in the net value of derivatives as of September 30, 2014.
Critical Accounting Policies and Estimates
The Company's discussion and analysis of the financial condition and results of operations are based upon the consolidated financial statements, which have been prepared in accordance with U.S. GAAP. The preparation of these financial statements and related disclosures in compliance with U.S. GAAP requires the application of appropriate technical accounting rules and guidance as well as the use of estimates and judgments that affect the reported amounts of assets, liabilities, revenues and expenses, and related disclosures of contingent assets and liabilities. The application of these policies necessarily involves judgments regarding future events, including the likelihood of success of particular projects, legal and regulatory challenges, and the fair value of certain assets and liabilities. These judgments, in and of themselves, could materially affect the financial statements and disclosures based on varying assumptions, which may be appropriate to use. In addition, the financial and operating environment may also have a significant effect, not only on the operation of the business, but on the results reported through the application of accounting measures used in preparing the financial statements and related disclosures, even if the nature of the accounting policies has not changed.
On an ongoing basis, the Company evaluates these estimates, utilizing historic experience, consultation with experts and other methods the Company considers reasonable. In any event, actual results may differ substantially from the Company's estimates. Any effects on the Company's business, financial position or results of operations resulting from revisions to these estimates are recorded in the period in which the information that gives rise to the revision becomes known.
The Company's significant accounting policies are summarized in Note 2, Summary of Significant Accounting Policies. The Company identifies its most critical accounting policies as those that are the most pervasive and important to the portrayal of the Company's financial position and results of operations, and that require the most difficult, subjective and/or complex judgments by management regarding estimates about matters that are inherently uncertain. The Company's critical accounting policies include derivative instruments, income taxes and valuation allowance for deferred tax assets, impairment of long lived assets and other intangible assets, and contingencies.
45
ITEM 3 — QUANTITATIVE AND QUALITATIVE DISCLOSURES ABOUT MARKET RISK
The Company is exposed to several market risks in its normal business activities. Market risk is the potential loss that may result from market changes associated with the Company's power generation or with an existing or forecasted financial or commodity transaction. The types of market risks the Company is exposed to are commodity price risk, interest rate risk, liquidity risk, and credit risk.
Commodity Price Risk
Commodity price risks result from exposures to changes in spot prices, forward prices, volatilities, and correlations between various commodities, such as natural gas, and emissions credits. The Company manages the commodity price risk of its merchant generation operations by entering into derivative or non-derivative instruments to hedge the variability in future cash flows from forecasted purchases of fuel. The portion of forecasted transactions hedged may vary based upon management's assessment of market, weather, operation and other factors.
Based on a sensitivity analysis using simplified assumptions, the impact of a $0.50 per MMBtu increase or decrease in natural gas prices across the term of the derivative contracts would cause a change of approximately $1 million in the net value of derivatives as of September 30, 2014.
Interest Rate Risk
The Company is exposed to fluctuations in interest rates through its issuance of variable rate debt. Exposures to interest rate fluctuations may be mitigated by entering into derivative instruments known as interest rate swaps, caps, collars and put or call options. These contracts reduce exposure to interest rate volatility and result in primarily fixed rate debt obligations when taking into account the combination of the variable rate debt and the interest rate derivative instrument. The Company's risk management policies allow it to reduce interest rate exposure from variable rate debt obligations.
Most of the Company's project subsidiaries enter into interest rate swaps, intended to hedge the risks associated with interest rates on non-recourse project level debt. See Note 9, Long-Term Debt, to the Company's audited consolidated financial statements included in the Company's 2013 Form 10-K, and Note 8, Long - Term Debt, to this Form 10-Q for more information about interest rate swaps of the Company's project subsidiaries.
If all of the above swaps had been discontinued on September 30, 2014, the Company would have owed the counterparties $45 million. Based on the investment grade rating of the counterparties, the Company believes its exposure to credit risk due to nonperformance by counterparties to its hedge contracts to be insignificant.
The Company has long-term debt instruments that subject it to the risk of loss associated with movements in market interest rates. As of September 30, 2014, a 1% change in interest rates would result in an approximately $2 million change in interest expense on a rolling twelve month basis.
As of September 30, 2014, the fair value of the Company's debt was $4,157 million and the carrying value was $4,083 million. The Company estimates that a 1% decrease in market interest rates would have increased the fair value of its long-term debt by $265 million.
Liquidity Risk
Liquidity risk arises from the general funding needs of the Company's activities and in the management of the Company's assets and liabilities.
Counterparty Credit Risk
Credit risk relates to the risk of loss resulting from non-performance or non-payment by counterparties pursuant to the terms of their contractual obligations. The Company monitors and manages credit risk through credit policies that include: (i) an established credit approval process, and (ii) the use of credit mitigation measures such as prepayment arrangements or volumetric limits. Risks surrounding counterparty performance and credit could ultimately impact the amount and timing of expected cash flows. The Company seeks to mitigate counterparty risk by having a diversified portfolio of counterparties.
46
ITEM 4 — CONTROLS AND PROCEDURES
Conclusion Regarding the Effectiveness of Disclosure Controls and Procedures
Under the supervision and with the participation of the Company's management, including its principal executive officer, principal financial officer and principal accounting officer, the Company conducted an evaluation of the effectiveness of the design and operation of its disclosure controls and procedures, as such term is defined in Rules 13a-15(e) or 15d-15(e) of the Exchange Act. Based on this evaluation, the Company's principal executive officer, principal financial officer and principal accounting officer concluded that the disclosure controls and procedures were effective as of the end of the period covered by this Quarterly Report on Form 10-Q.
Changes in Internal Control over Financial Reporting
The Company is integrating certain business operations, information systems, processes and related internal control over financial reporting which will continue to the end of the fiscal year. The Company will assess the effectiveness of internal control over financial reporting as integration activities continue.
47
PART II — OTHER INFORMATION
ITEM 1 — LEGAL PROCEEDINGS
None.
ITEM 1A — RISK FACTORS
Information regarding risk factors appears in Part I, Item 1A, Risk Factors in the Company's 2013 Form 10-K. There have been no material changes in the Company's risk factors since those reported in its 2013 Form 10-K.
ITEM 2 — UNREGISTERED SALES OF EQUITY SECURITIES AND USE OF PROCEEDS
None.
ITEM 3 — DEFAULTS UPON SENIOR SECURITIES
None.
ITEM 4 — MINE SAFETY DISCLOSURES
Not applicable.
ITEM 5 — OTHER INFORMATION
None.
48
ITEM 6 — EXHIBITS
Number | Description | Method of Filing | ||
4.1 | Indenture, dated August 5, 2014, among NRG Yield Operating LLC, the guarantors named therein and Law Debenture Trust Company of New York. | Incorporated herein by reference to Exhibit 4.1 to the Company's Current Report on Form 8-K filed on August 5, 2014. | ||
4.2 | Form of 5.375% Senior Note due 2024. | Incorporated herein by reference to Exhibit 4.2 to the Company's Current Report on Form 8-K filed on August 5, 2014. | ||
4.3 | Registration Rights Agreement, dated August 5, 2014, among NRG Yield Operating LLC, the guarantors named therein and Merrill Lynch, Pierce, Fenner & Smith Incorporated, as representative of the initial purchasers. | Incorporated herein by reference to Exhibit 4.3 to the Company's Current Report on Form 8-K filed on August 5, 2014. | ||
31.1 | Rule 13a-14(a)/15d-14(a) certification of David Crane. | Filed herewith. | ||
31.2 | Rule 13a-14(a)/15d-14(a) certification of Kirkland B. Andrews. | Filed herewith. | ||
31.3 | Rule 13a-14(a)/15d-14(a) certification of Ronald B. Stark. | Filed herewith. | ||
32 | Section 1350 Certification. | Filed herewith. | ||
101 INS | XBRL Instance Document. | Filed herewith. | ||
101 SCH | XBRL Taxonomy Extension Schema. | Filed herewith. | ||
101 CAL | XBRL Taxonomy Extension Calculation Linkbase. | Filed herewith. | ||
101 DEF | XBRL Taxonomy Extension Definition Linkbase. | Filed herewith. | ||
101 LAB | XBRL Taxonomy Extension Label Linkbase. | Filed herewith. | ||
101 PRE | XBRL Taxonomy Extension Presentation Linkbase. | Filed herewith. | ||
49
SIGNATURES
Pursuant to the requirements of the Securities Exchange Act of 1934, the registrant has duly caused this report to be signed on its behalf by the undersigned thereunto duly authorized.
NRG YIELD, INC. (Registrant) | ||||
/s/ DAVID CRANE | ||||
David Crane | ||||
Chief Executive Officer (Principal Executive Officer) | ||||
/s/ KIRKLAND B. ANDREWS | ||||
Kirkland B. Andrews | ||||
Chief Financial Officer (Principal Financial Officer) | ||||
/s/ RONALD B. STARK | ||||
Ronald B. Stark | ||||
Date: November 5, 2014 | Chief Accounting Officer (Principal Accounting Officer) | |||
50