Attached files
| file | filename |
|---|---|
| EX-99.1 - EXHIBIT 99.1 - PPL Corp | exhibit99_1.htm |
| 8-K - FORM 8-K - PPL Corp | form8k.htm |

Exhibit 99.2
PPL Corporation
3rd Quarter Earnings
November 4, 2014

© PPL Corporation 2014
2
Cautionary Statements and Factors
That May Affect Future Results
That May Affect Future Results
Any statements made in this presentation about future
operating results or other future events are forward-looking
statements under the Safe Harbor Provisions of the Private
Securities Litigation Reform Act of 1995. Actual results may
differ materially from such forward-looking statements. A
discussion of factors that could cause actual results or events
to vary is contained in the Appendix to this presentation and in
the Company’s SEC filings.

© PPL Corporation 2014
3
Third Quarter Earnings Results, Operational
Overview and 2014 Earnings Forecast
Overview and 2014 Earnings Forecast
Segment Results and Financial Overview
Q&A
W. H. Spence
V. Sorgi
Agenda

© PPL Corporation 2014
4
Earnings Results

© PPL Corporation 2014
5
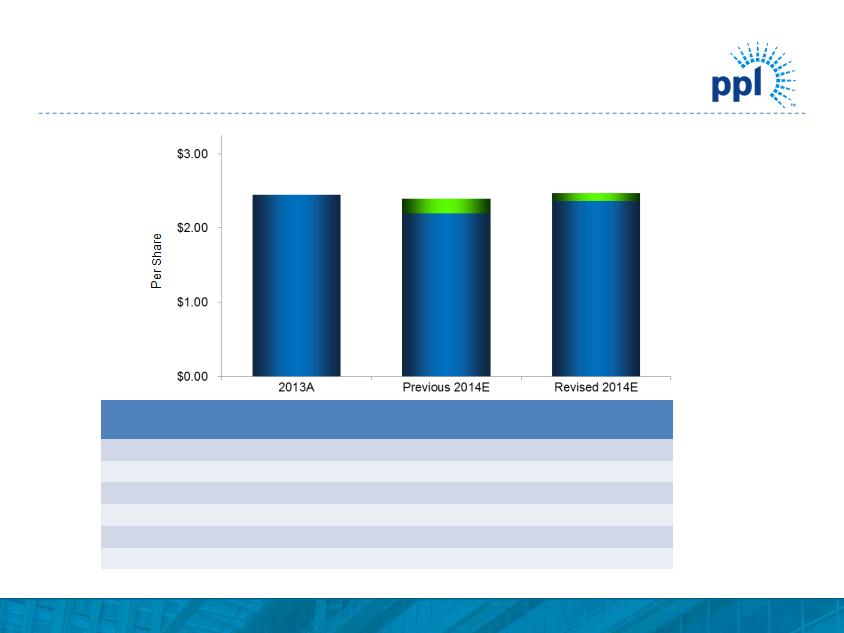
Note: See Appendix for the reconciliation of earnings from ongoing operations to reported earnings.
Increasing 2014 Ongoing Earnings Forecast
|
Segment
|
2013
(Ongoing)
|
Previous 2014E
Ongoing Midpoint
|
Revised 2014E
Ongoing Midpoint
|
|
U.K. Regulated
|
$1.32
|
$1.35
|
$1.38
|
|
Kentucky Regulated
|
0.48
|
0.45
|
0.45
|
|
PA Regulated
|
0.31
|
0.39
|
0.39
|
|
Supply
|
0.39
|
0.17
|
0.24
|
|
Corporate and Other
|
(0.05)
|
(0.06)
|
(0.04)
|
|
Total
|
$2.45
|
$2.30
|
$2.42
|
$2.45
$2.40
$2.20
$2.47
$2.37

© PPL Corporation 2014
6
• U.K. Regulated segment bonus revenues
– $130 million expected for regulatory year ending 3/31/2014
• Kentucky rate case announced
• Compass Transmission Project update
– Meetings initiated with key stakeholders
Regulated Operational Overview

© PPL Corporation 2014
7
Complete filings will be available at www.lge-ku.com/regulatory.asp
LG&E and KU Rate Case Facts
|
|
LG&E
|
KU
|
|
|
|
Electric
|
Gas
|
Electric
|
|
Revenue Increase Requested
|
$30 million
|
$14 million
|
$153 million
|
|
Test Year
|
12-months ended
6/30/2016 |
12-months ended
6/30/2016 |
12-months ended
6/30/2016 |
|
Requested ROE
|
10.5%
|
10.5%
|
10.5%
|
|
Jurisdictional Capitalization
|
$2.1 billion
|
$0.5 billion
|
$3.6 billion
|
|
Common Equity Ratio
|
52.75%
|
52.75%
|
53.02%
|
|
Docket No.
|
2014-00372
|
2014-00372
|
2014-00371
|

© PPL Corporation 2014
8
Note: Total includes Residential, Commercial and Industrial customer classes as well as “Other”, which is not depicted on the charts above.
Regulated Volume Variances

© PPL Corporation 2014
9
• Energy Supply spin/separation activities
– On track to achieve $155 million of synergies
• Montana hydro sale update
– Approvals received from Montana PSC and FERC
• Susquehanna update
• 3Q operations review
Supply Operational Overview

© PPL Corporation 2014
10
Q3 2014
Q3 2013
Change
U.K. Regulated
$0.28
$0.31
$(0.03)
Kentucky Regulated
0.12
0.14
(0.02)
Pennsylvania Regulated
0.08
0.08
-
Supply
0.07
0.14
(0.07)
Corporate and Other
(0.01)
(0.01)
-
Total
$0.54
$0.66
$(0.12)
Ongoing Earnings Overview
Note: See Appendix for the reconciliation of earnings from ongoing operations to reported earnings.

© PPL Corporation 2014
11
|
|
3rd Quarter
|
|
|
2013 EPS - Ongoing Earnings
|
|
$0.31
|
|
Utility revenue
|
0.02
|
|
|
O&M
|
0.01
|
|
|
Depreciation
|
(0.01)
|
|
|
Financing
|
(0.01)
|
|
|
Income taxes and other
|
(0.04)
|
|
|
Total
|
|
(0.03)
|
|
2014 EPS - Ongoing Earnings
|
|
$0.28
|
U.K. Regulated Segment
Earnings Drivers
Earnings Drivers
Note: See Appendix for the reconciliation of earnings from ongoing operations to reported earnings.

© PPL Corporation 2014
12
|
|
3rd Quarter
|
|
|
2013 EPS - Ongoing Earnings
|
|
$0.14
|
|
O&M
|
(0.01)
|
|
|
Interest Expense
|
(0.01)
|
|
|
Total
|
|
(0.02)
|
|
2014 EPS - Ongoing Earnings
|
|
$0.12
|
Kentucky Regulated Segment
Earnings Drivers
Earnings Drivers
Note: See Appendix for the reconciliation of earnings from ongoing operations to reported earnings.

© PPL Corporation 2014
13
|
|
3rd Quarter
|
|
|
2013 EPS - Ongoing Earnings
|
|
$0.08
|
|
Gross delivery margins
|
0.01
|
|
|
Income taxes and other
|
(0.01)
|
|
|
Total
|
|
-
|
|
2014 EPS - Ongoing Earnings
|
|
$0.08
|
Pennsylvania Regulated Segment
Earnings Drivers
Earnings Drivers
Note: See Appendix for the reconciliation of earnings from ongoing operations to reported earnings.

© PPL Corporation 2014
14
|
|
3rd Quarter
|
|
|
2013 EPS - Ongoing Earnings
|
|
$0.14
|
|
East energy margins
|
(0.12)
|
|
|
O&M
|
0.01
|
|
|
Income taxes and other
|
0.04
|
|
|
Total
|
|
(0.07)
|
|
2014 EPS - Ongoing Earnings
|
|
$0.07
|
Supply Segment Earnings Drivers
Note: See Appendix for the reconciliation of earnings from ongoing operations to reported earnings.
© PPL Corporation 2014
15
Note: See Appendix for the reconciliation of earnings from ongoing operations to reported earnings.
Increasing 2014 Ongoing Earnings Forecast
|
Segment
|
2013
(Ongoing)
|
Previous 2014E
Ongoing Midpoint
|
Revised 2014E
Ongoing Midpoint
|
|
U.K. Regulated
|
$1.32
|
$1.35
|
$1.38
|
|
Kentucky Regulated
|
0.48
|
0.45
|
0.45
|
|
PA Regulated
|
0.31
|
0.39
|
0.39
|
|
Supply
|
0.39
|
0.17
|
0.24
|
|
Corporate and Other
|
(0.05)
|
(0.06)
|
(0.04)
|
|
Total
|
$2.45
|
$2.30
|
$2.42
|
$2.45
$2.40
$2.20
$2.47
$2.37

© PPL Corporation 2014
16
Appendix

© PPL Corporation 2014
17
A predominantly rate-regulated business mix provides strong support
for current dividend and a platform for future growth
for current dividend and a platform for future growth
(1) Based on mid-point of forecast. Annualized dividend based on 2/6/2014 announced increase. Actual dividends to be determined by Board of Directors.
(2) From only regulated segments.
(3) See Appendix for the reconciliation of earnings from ongoing operations to reported earnings.
$/Share
Annualized
(2)
(1)
Dividend Profile
(3)
© PPL Corporation 2014
18
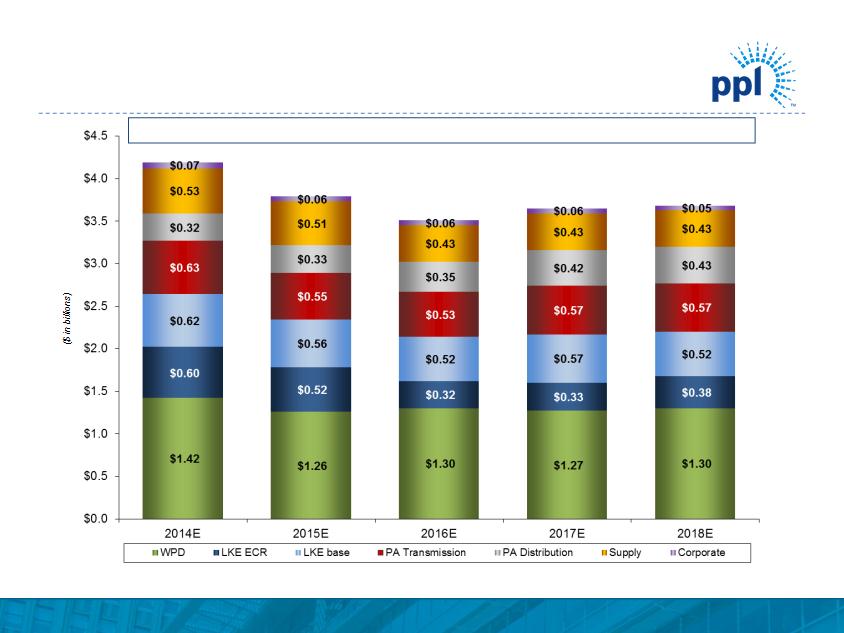
(1) Figures based on assumed exchange rate of $1.67 / £.
(2) Expect between 80% and 90% to receive timely returns via ECR mechanism based on historical experience and future projections.
(3) Excludes projected capex related to proposed Compass Project.
(1)
(2)
$4.19
$3.79
$3.51
$3.65
Projected Capital Expenditures
Significant and stable investment opportunities in regulated utilities
$3.68
(3)
© PPL Corporation 2014
19
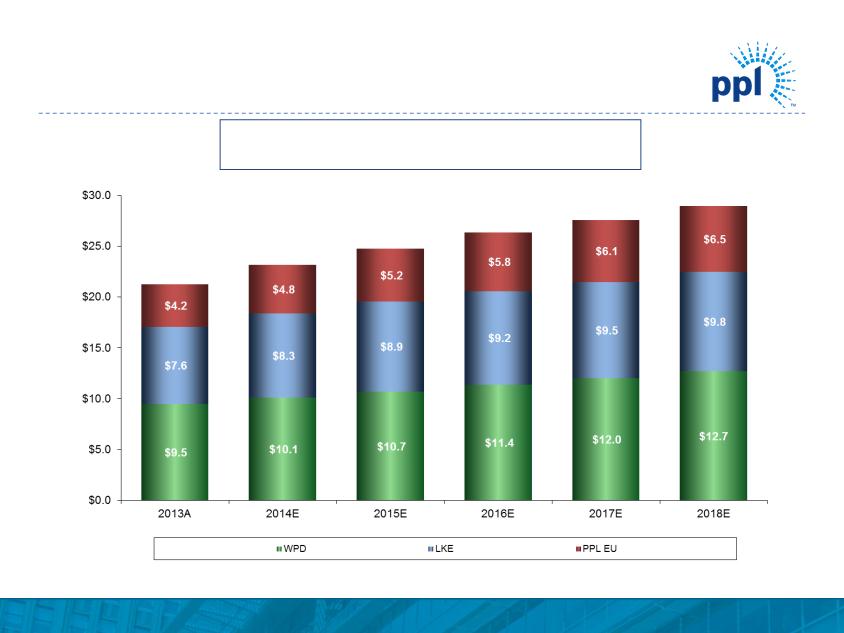
($ in billions)
(1) Represents capitalization for LKE, as LG&E and KU rate constructs are based on capitalization. Represents Regulatory Asset Value (RAV) for WPD.
(2) Figures based on assumed exchange rate of $1.67 / £ and the RIIO-ED1 business plan as filed on July 1, 2013.
(2)
5-Year Regulatory Asset Base(1) CAGR: 6.3%
Projected Regulated Rate Base Growth
$21.3
$23.2
$24.8
$26.4
$27.6
$29.0
Projected Regulated Rate Base Growth ($in billions) (2) 5-Year Regulatory Asset Base(1) CAGR: 6.3% $21.3 $23.2 $24.8 $26.4 $27.6 $29.0 (1) Represents capitalization for LKE, as LG&E and KU rate constructs are based on capitalization. Represents Regulatory Asset Value (RAV) for WPD. (2) Figures based on assumed exchange rate of $1.67 / £ and the RIIO-ED1 business plan as filed on July 1, 2013. © PPL Corporation 201419
© PPL Corporation 2014
20
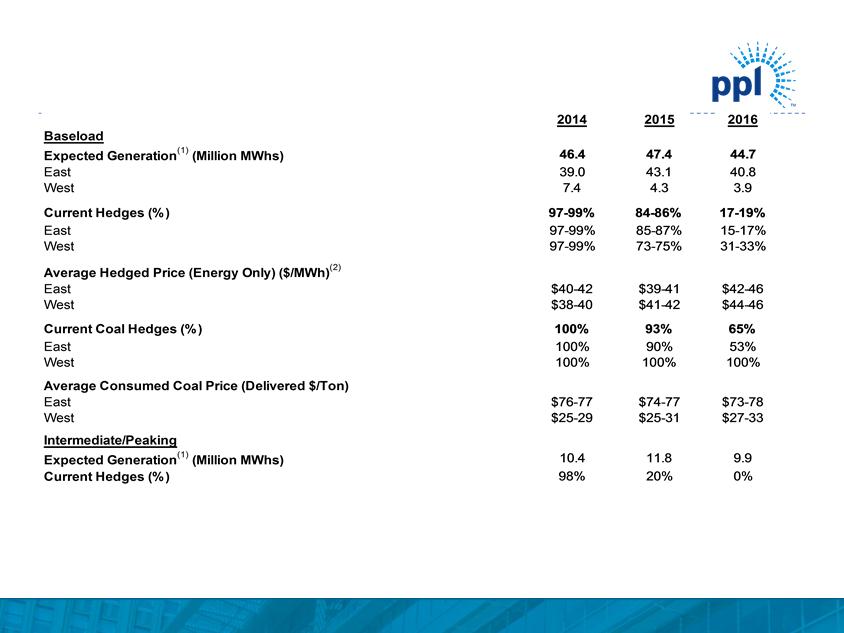
Energy Supply Hedge Update
Capacity revenues(3) are expected to be $560, $505 and $455 million for 2014, 2015 and 2016 respectively.
Note: As of September 30, 2014
Includes PPL Montana's hydroelectric facilities through the 3rd quarter of 2014. On September 26, 2013, PPL Montana, LLC reached an agreement to sell all 11 of its hydroelectric power plants. The
sale is subject to regulatory approvals and is expected to close in the fourth quarter of 2014.
(1) Represents expected sales of Supply segment based on current business plan assumptions.
(2) The 2015 and 2016 ranges of average energy prices for existing hedges were estimated by determining the impact on the existing collars resulting from 2015/2016 power prices at the 5th and 95th
percentile confidence levels.
(3) Expected capacity revenue includes all MWs cleared during PJMs RPM Auctions or during incremental auctions at the respective prices and any uncleared MWs at expected incremental auctions prices.
© PPL Corporation 2014
21
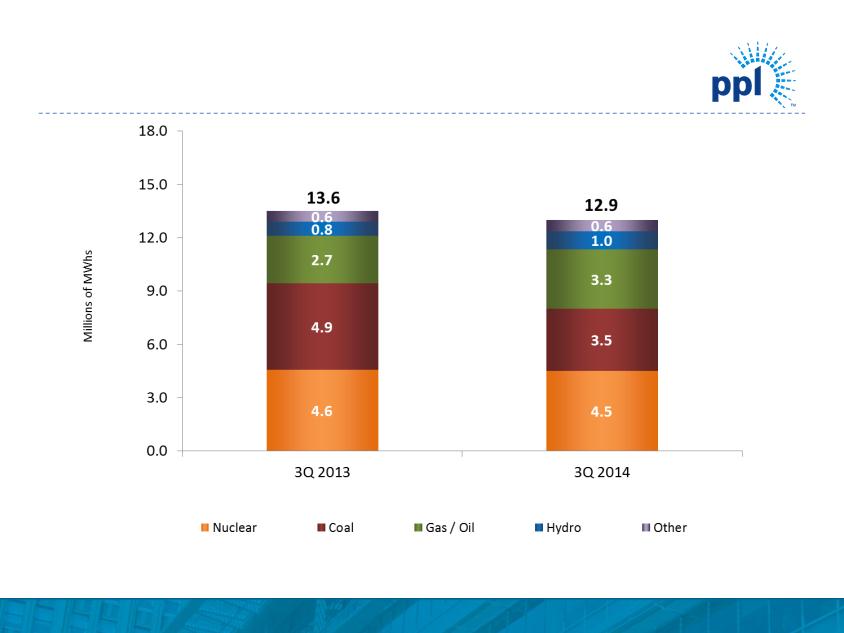
Competitive Generation Overview
Note: Includes owned and contracted generation. As of September 30, 2014
(1) Other includes PPAs, renewables and NUGS.
(1)

© PPL Corporation 2014
22
|
(1)
|
24-hour average.
|
|
(2)
|
NYMEX and TETCO M3 forward gas prices on 9/30/2014.
|
|
(3)
|
Market Heat Rate = PJM on-peak power price divided by TETCO M3 gas price.
|
Market Prices
© PPL Corporation 2014
23
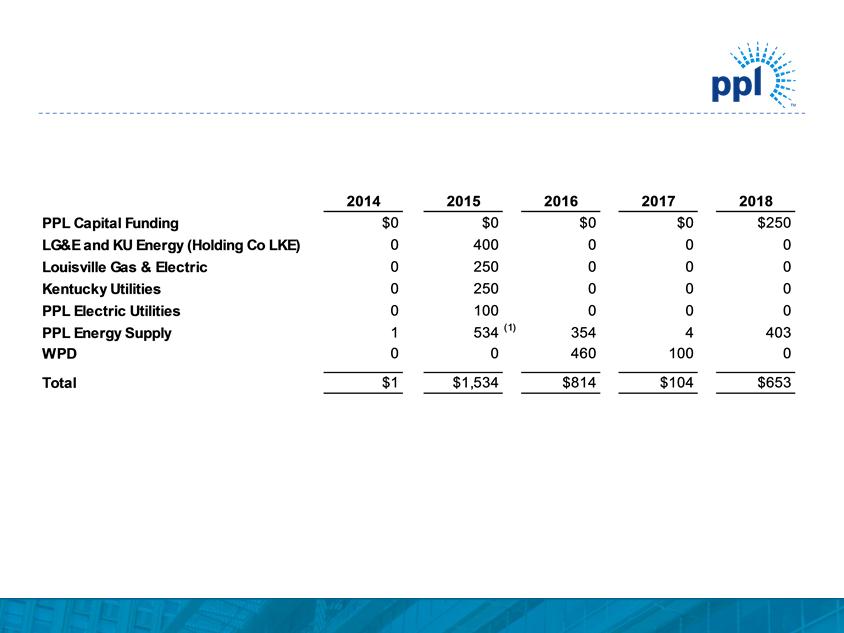
Debt Maturities
Note: As of September 30, 2014
(1) This amount includes $81 million of Pennsylvania Economic Development Financing Authority bonds due 2037 and $150 million of Pennsylvania Economic Development
Financing Authority bonds due 2038 that may be put by the holders in September 2015. This amount also includes $300 million of REset Put Securities due 2035 that
are required to be put by the holders in October 2015.
Financing Authority bonds due 2038 that may be put by the holders in September 2015. This amount also includes $300 million of REset Put Securities due 2035 that
are required to be put by the holders in October 2015.

© PPL Corporation 2014
24
Liquidity Profile
Note: As of September 30, 2014
Credit facilities consist of a diverse bank group, with no bank and its affiliates providing an aggregate commitment of more than 10% of the total committed capacity for the
domestic facilities and 13% of the total committed capacity for WPD’s facilities.
(1) As a result of the proposed spinoff transaction, PPL Energy Supply has syndicated a $1.85 billion credit facility which is currently fully committed. This syndicated credit facility
will replace the existing $3 billion PPL Energy Supply syndicated credit facility and will be effective upon closing of the spinoff transaction.
will replace the existing $3 billion PPL Energy Supply syndicated credit facility and will be effective upon closing of the spinoff transaction.
(2) In October 2014, the KU letter of credit facility was terminated and replaced with a new $198 million letter of credit facility expiring October 2017.
© PPL Corporation 2014
Reconciliation of Third Quarter Earnings from
Ongoing Operations to Reported Earnings
Ongoing Operations to Reported Earnings
25
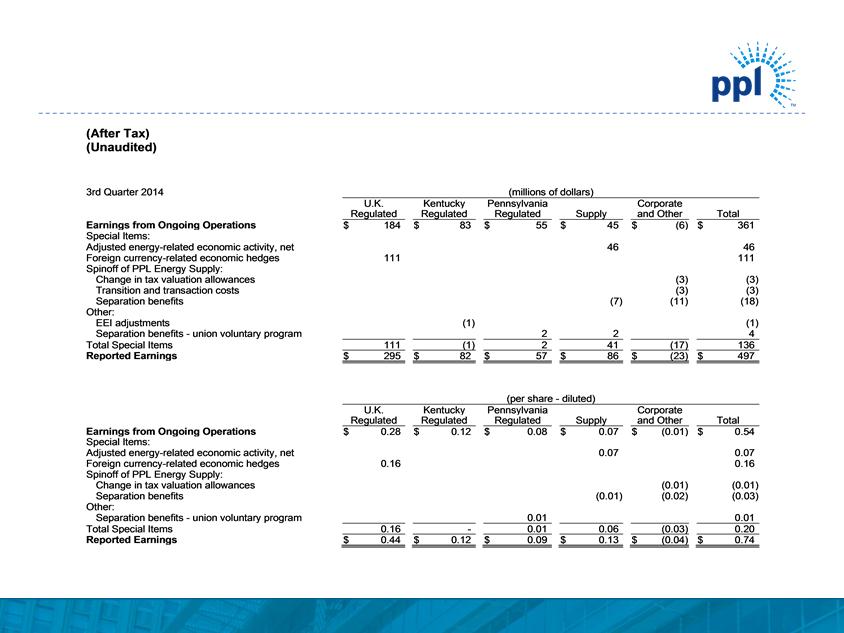
Reconciliation of Third Quarter Earnings from Ongoing Operations to Reported Earnings (After Tax) (Unaudited) 3rd Quarter 2014 Earnings from Ongoing Operations Special Items: Adjusted energy-related economic activity, net Foreign currency-related economic hedges Spinoff of PPL Energy Supply: Change in tax valuation allowances Transition and transaction costs Separation benefits Other: EEI adjustments Separation benefits - union voluntary program Total Special Items Reported Earnings U.K. Regulated $184 111 111 $295 Kentucky Regulated $83 (1) (1) $82 (millions of dollars) Pennsylvania Regulated Supply $55 $45 46 (7) 2 2 2 41 $57 $86 Corporate and Other $(6) (3) (3) (11) (17) $(23) $$ Total 361 46 111 (3) (3)(18) (1) 4 136 497 Earnings from Ongoing Operations Special Items: Adjusted energy-related economic activity, net Foreign currency-related economic hedges Spinoff of PPL Energy Supply: Change in tax valuation allowances Separation benefits Other: Separation benefits - union voluntary program Total Special Items Reported Earnings U.K. Regulated $0.28 0.16 0.16 $0.44 Kentucky Regulated $0.12- $0.12(per share - diluted) Pennsylvania Regulated Supply $0.08 $0.07 0.07 (0.01) 0.01 0.01 0.06 $0.09 $0.13 Corporate and Other $(0.01) (0.01) (0.02) (0.03) $(0.04) $$ Total 0.54 0.07 0.16 (0.01) (0.03) 0.01 0.20 0.74 © PPL Corporation 201425

© PPL Corporation 2014
26
Reconciliation of Third Quarter Earnings from
Ongoing Operations to Reported Earnings
Ongoing Operations to Reported Earnings
Reconciliation of Third Quarter Earnings from Ongoing Operations to Reported Earnings (After Tax) (Unaudited) 3rd Quarter 2013 (millions of dollars) U.K. Kentucky Pennsylvania Corporate Regulated Regulated Regulated Supply and Other Total Earnings from Ongoing Operations $199 $93 $51 $97 $(8) $432 Special Items: Adjusted energy-related economic activity, net (6) (6) Foreign currency-related economic hedges (82) (82) Acquisition-related adjustments: WPD Midlands Separation benefits (2) (2) Other: Change in WPD line loss accrual (16) (16) Change in U.K. tax rate 84 84 Total Special Items (16) (6) (22) Reported Earnings $183 $93 $51 $91 $(8) $410 (per share - diluted) (a) U.K. Kentucky Pennsylvania Corporate Regulated Regulated Regulated Supply and Other Total Earnings from Ongoing Operations $0.31 $0.14 $0.08 $0.14 $(0.01) $0.66 Special Items: Adjusted energy-related economic activity, net (0.01) (0.01) Foreign currency-related economic hedges (0.13) (0.13) Other: Change in WPD line loss accrual (0.03) (0.03) Change in U.K. tax rate 0.13 0.13 Total Special Items (0.03) (0.01) (0.04) Reported Earnings $0.28 $0.14 $0.08 $0.13 $(0.01) $0.62 (a) The " If-Converted Method" has been applied to PPL's 2011 Equity Units prior to settlement, resulting in $7 million of interest charges (after-tax) being added back to earnings for the three months ended September 30, 2013 and approximately 32 million shares of PPL Common Stock being treated as outstanding. Both adjustments are only for purposes of calculating diluted earnings per share. © PPL Corporation 201426
© PPL Corporation 2014
27
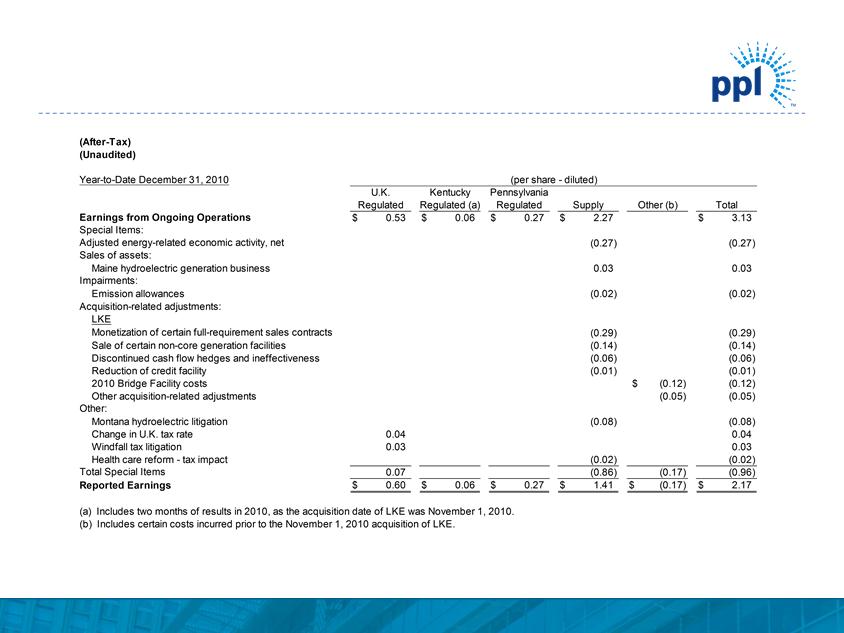
Reconciliation of Year-to-date Earnings from
Ongoing Operations to Reported Earnings
Ongoing Operations to Reported Earnings
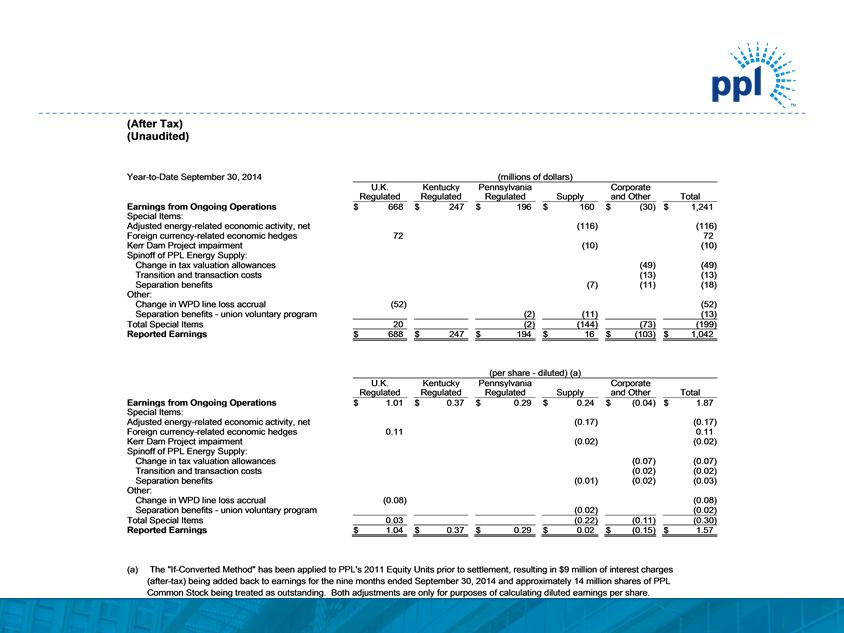
Reconciliation of Year- to- date Earnings from Ongoing Operations to Reported Earnings (After Tax) (Unaudited) Year- to- Date September 30, 2014 (millions of dollars) U.K. Kentucky Pennsylvania Corporate Regulated Regulated Regulated Supply and Other Total Earnings from Ongoing Operations $668 $247 $196 $160 $(30) $1,241 Special Items: Adjusted energy-related economic activity, net (116) (116) Foreign currency-related economic hedges 72 72 Kerr Dam Project impairment Spinoff of PPL Energy Supply: Change in tax valuation allowances (10) (49) (10) (49) Transition and transaction costs (13) (13) Separation benefits Other: (7) (11) (18) Change in WPD line loss accrual (52) (52) Separation benefits - union voluntary program (2) (11) (13) Total Special Items 20 (2) (144) (73) (199) Reported Earnings $688 $247 $194 $16 $(103) $1,042 (per share diluted) (a) U.K. Kentucky Pennsylvania Corporate Regulated Regulated Regulated Supply and Other Total Earnings from Ongoing Operations $1.01 $0.37 $0.29 $0.24 $(0.04) $1.87 Special Items: Adjusted energy-related economic activity, net (0.17) (0.17) Foreign currency-related economic hedges 0.11 0.11 Kerr Dam Project impairment Spinoff of PPL Energy Supply: Change in tax valuation allowances (0.02) (0.07) (0.02) (0.07) Transition and transaction costs (0.02) (0.02) Separation benefits Other: (0.01) (0.02) (0.03) Change in WPD line loss accrual (0.08) (0.08) Separation benefits - union voluntary program (0.02) (0.02) Total Special Items 0.03 (0.22) (0.11) (0.30) Reported Earnings $1.04 $0.37 $0.29 $0.02 $(0.15) $1.57 (a) The "If-Converted Method" has been applied to PPL's 2011 Equity Units prior to settlement, resulting in $9 million of interest charges (after-tax) being added back to earnings for the nine months ended September 30, 2014 and approximately 14 million shares of PPL Common Stock being treated as outstanding. Both adjustments are only for purposes of calculating diluted earnings per share. © PPL Corporation 201427
© PPL Corporation 2014
28
Reconciliation of Year-to-date Earnings from
Ongoing Operations to Reported Earnings
Ongoing Operations to Reported Earnings
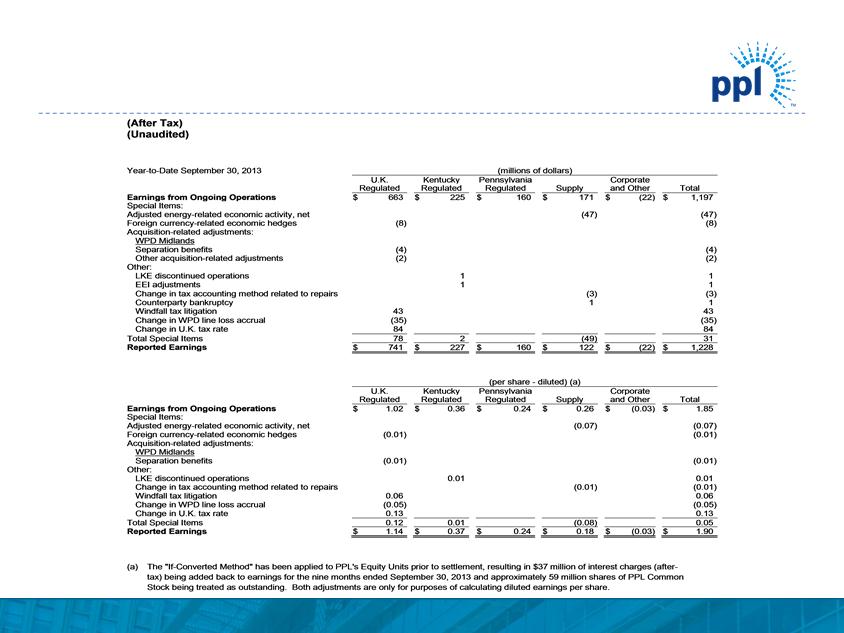
Reconciliation of Year- to- date Earnings from Ongoing Operations to Reported Earnings (After Tax) (Unaudited) Year-to-Date September 30, 2013 (millions of dollars) U.K. Kentucky Pennsylvania Corporate Regulated Regulated Regulated Supply and Other Total Earnings from Ongoing Operations $663 $225 $160 $171 $(22) $1,197 Special Items: Adjusted energy-related economic activity, net (47) (47) Foreign currency-related economic hedges (8) (8) Acquisition-related adjustments: WPD Midlands Separation benefits Other acquisition-related adjustments Other: (4) (2) (4) (2) LKE discontinued operations EEI adjustments 1 1 1 1 Change in tax accounting method related to repairs Counterparty bankruptcy Windfall tax litigation 43 (3)1 (3) 1 43 Change in WPD line loss accrual Change in U.K. tax rate (35) 84 (35) 84 Total Special Items 78 2 (49) 31 Reported Earnings $741 $227 $160 $122 $(22) $1,228 (per share - diluted) (a) U.K. Kentucky Pennsylvania Corporate Regulated Regulated Regulated Supply and Other Total Earnings from Ongoing Operations $1.02 $0.36 $0.24 $0.26 $(0.03) $1.85 Special Items: Adjusted energy-related economic activity, net Foreign currency-related economic hedges Acquisition-related adjustments: WPD Midlands(0.01) (0.07) (0.07) (0.01) Separation benefits Other: (0.01) (0.01) LKE discontinued operations Change in tax accounting method related to repairs Windfall tax litigation 0.06 0.01 (0.01) 0.01 (0.01) 0.06 Change in WPD line loss accrual (0.05) (0.05) Change in U.K. tax rate 0.13 0.13 Total Special Items 0.12 0.01 (0.08) 0.05 Reported Earnings $1.14 $0.37 $0.24 $0.18 $(0.03) $1.90 (a) The " If-Converted Method" has been applied to PPL's Equity Units prior to settlement, resulting in $37 million of interest charges (after tax) being added back to earnings for the nine months ended September 30, 2013 and approximately 59 million shares of PPL Common Stock being treated as outstanding. Both adjustments are only for purposes of calculating diluted earnings per share. © PPL Corporation 201428
© PPL Corporation 2014
29
Reconciliation of PPL’s Forecast of Earnings from
Ongoing Operations to Reported Earnings
Ongoing Operations to Reported Earnings
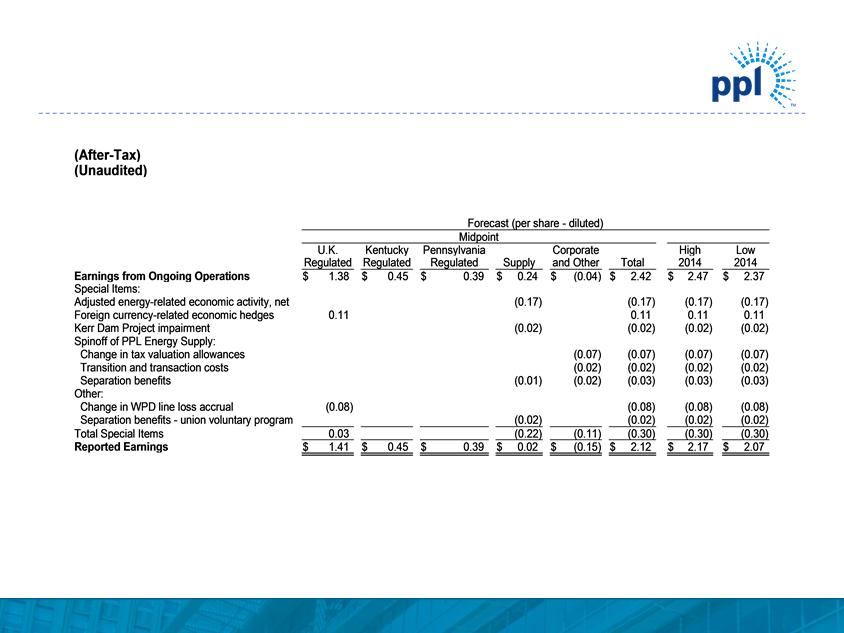
Reconciliation of PPL’s Forecast of Earnings from Ongoing Operations to Reported Earnings (After- Tax) (Unaudited) Earnings from Ongoing Operations Special Items: Adjusted energy-related economic activity, net Foreign currency-related economic hedges Kerr Dam Project impairment Spinoff of PPL Energy Supply: Change in tax valuation allowances Transition and transaction costs Separation benefits Other: Change in WPD line loss accrual Separation benefits - union voluntary program Total Special Items Reported Earnings U.K. Regulated $1.38 0.11 (0.08) 0.03 $1.41 Kentucky Regulated $0.45 $0.45Forecast (per share - diluted) Midpoint Pennsylvania Corporate Regulated Supply and Other $0.39 $0.24 $(0.04) (0.17) (0.02) (0.07) (0.02) (0.01) (0.02) (0.02) (0.22) (0.11) $0.39 $0.02 $(0.15) $$ Total 2.42 (0.17) 0.11 (0.02) (0.07) (0.02) (0.03) (0.08) (0.02) (0.30) 2.12 $$High 2014 2.47 (0.17) 0.11 (0.02) (0.07) (0.02) (0.03) (0.08) (0.02) (0.30) 2.17 $$Low 2014 2.37 (0.17) 0.11 (0.02) (0.07) (0.02) (0.03) (0.08) (0.02) (0.30) 2.07 © PPL Corporation 201429
© PPL Corporation 2014
30
Reconciliation of PPL’s Earnings from Ongoing
Operations to Reported Earnings
Operations to Reported Earnings
© PPL Corporation 2014
31
Reconciliation of PPL’s Earnings from Ongoing
Operations to Reported Earnings
Operations to Reported Earnings
(a) WPD Midlands' results are consolidated on a one-month lag, and include eight months of results in 2011, as the date of acquisition was April 1, 2011.
© PPL Corporation 2014
32
Reconciliation of PPL’s Earnings from Ongoing
Operations to Reported Earnings
Operations to Reported Earnings

© PPL Corporation 2014
33
Gross Margins Summary
© PPL Corporation 2014
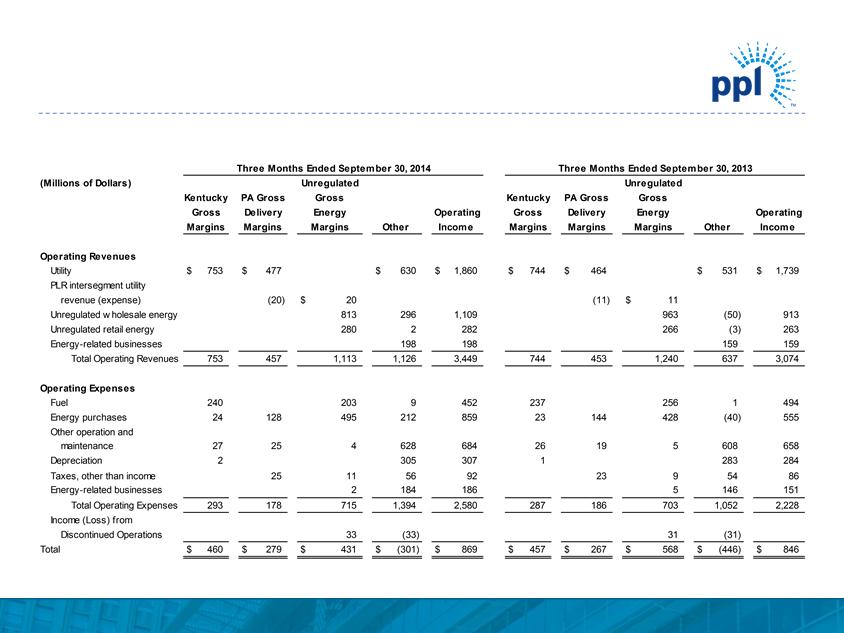
34
Reconciliation of Third Quarter
Margins to Operating Income
Margins to Operating Income

© PPL Corporation 2014
35
Statements contained in this presentation, including statements with respect to future earnings, cash flows, financing, regulation and
corporate strategy are "forward-looking statements" within the meaning of the federal securities laws. Although PPL Corporation
believes that the expectations and assumptions reflected in these forward-looking statements are reasonable, these statements are
subject to a number of risks and uncertainties, and actual results may differ materially from the results discussed in the statements.
The following are among the important factors that could cause actual results to differ materially from the forward-looking statements:
market demand and prices for energy, capacity and fuel; weather conditions affecting customer energy usage and operating costs;
competition in power markets; the effect of any business or industry restructuring; the profitability and liquidity of PPL Corporation and
its subsidiaries; new accounting requirements or new interpretations or applications of existing requirements; operating performance of
generating plants and other facilities; the length of scheduled and unscheduled outages at our generating plants; environmental
conditions and requirements and the related costs of compliance, including environmental capital expenditures and emission allowance
and other expenses; system conditions and operating costs; development of new projects, markets and technologies; performance of
new ventures; asset or business acquisitions and dispositions; any impact of hurricanes or other severe weather on our business,
including any impact on fuel prices; receipt of necessary government permits, approvals, rate relief and regulatory cost recovery;
capital market conditions and decisions regarding capital structure; the impact of state, federal or foreign investigations applicable to
PPL Corporation and its subsidiaries; the outcome of litigation against PPL Corporation and its subsidiaries; stock price performance;
the market prices of equity securities and the impact on pension income and resultant cash funding requirements for defined benefit
pension plans; the securities and credit ratings of PPL Corporation and its subsidiaries; political, regulatory or economic conditions in
states, regions or countries where PPL Corporation or its subsidiaries conduct business, including any potential effects of threatened or
actual terrorism or war or other hostilities; foreign exchange rates; new state, federal or foreign legislation, including new tax legislation;
and the commitments and liabilities of PPL Corporation and its subsidiaries. Any such forward-looking statements should be
considered in light of such important factors and in conjunction with PPL Corporation's Form 10-K and other reports on file with the
Securities and Exchange Commission.
Forward-Looking Information Statement

© PPL Corporation 2014
36
Definitions of Non-GAAP Financial Measures
"Earnings from ongoing operations," also referred to as "ongoing earnings," should not be considered as an alternative to reported earnings, or
net income attributable to PPL shareowners, which is an indicator of operating performance determined in accordance with U.S. generally
accepted accounting principles (GAAP). PPL believes that "earnings from ongoing operations," although a non-GAAP financial measure, is also
useful and meaningful to investors because it provides management's view of PPL's fundamental earnings performance as another criterion in
making investment decisions. PPL's management also uses "earnings from ongoing operations" in measuring certain corporate performance
goals. Other companies may use different measures to present financial performance.
"Earnings from ongoing operations" is adjusted for the impact of special items. Special items include:
• Adjusted energy-related economic activity (as discussed below).
• Unrealized gains or losses on foreign currency-related economic hedges.
• Gains and losses on sales of assets not in the ordinary course of business.
• Impairment charges (including impairments of securities in the company's nuclear decommissioning trust funds).
• Workforce reduction and other restructuring effects.
• Acquisition and disposition-related adjustments.
• Other charges or credits that are, in management's view, not reflective of the company's ongoing operations.
Adjusted energy-related economic activity includes the changes in fair value of positions used to economically hedge a portion of the economic
value of the competitive generation assets, full-requirement sales contracts and retail activities. This economic value is subject to changes in fair
value due to market price volatility of the input and output commodities (e.g., fuel and power) prior to the delivery period that was hedged.
Adjusted energy-related economic activity also includes the ineffective portion of qualifying cash flow hedges, the monetization of certain full-
requirement sales contracts and premium amortization associated with options. Unrealized gains and losses related to this activity are deferred,
with the exception of the full-requirement sales contracts that were monetized, and included in earnings from ongoing operations over the
delivery period of the item that was hedged or upon realization. Management believes that adjusting for such amounts provides a better matching
of earnings from ongoing operations to the actual amounts settled for PPL's underlying hedged assets. Please refer to the Notes to the
Consolidated Financial Statements and MD&A in PPL Corporation's periodic filings with the Securities and Exchange Commission for additional
information on adjusted energy-related economic activity.
Free cash flow before dividends is derived by deducting capital expenditures, proceeds from the sale of certain assets and other investing
activities-net, from cash flow from operations. Free cash flow before dividends should not be considered as an alternative to cash flow from
operations, which is determined in accordance with GAAP. PPL believes that free cash flow before dividends, although a non-GAAP measure, is
an important measure to both management and investors, as it is an indicator of the company's ability to sustain operations and growth without
additional outside financing beyond the requirement to fund maturing debt obligations. Other companies may calculate free cash flow before
dividends in a different manner.

© PPL Corporation 2014
37
Definitions of Non-GAAP Financial Measures
PPL utilizes the following non-GAAP financial measures as indicators of performance for its businesses. These measures are not intended to replace "Operating
Income," which is determined in accordance with GAAP, as an indicator of overall operating performance. Other companies may use different measures to
analyze and report their results of operations. Management believes these measures provide additional useful criteria to make investment decisions. These
performance measures are used, in conjunction with other information, by senior management and PPL's Board of Directors to manage the operations, analyze
actual results compared with budget and, in certain cases, to measure certain corporate financial goals used to determine variable compensation.
"Kentucky Gross Margins" is a single financial performance measure of the Kentucky Regulated segment's, LKE's, LG&E's and KU's electricity generation,
transmission and distribution operations as well as LKE's and LG&E's distribution and sale of natural gas. In calculating this measure, fuel, energy purchases
and certain variable costs of production (recorded as "Other operation and maintenance" on the Statements of Income) are deducted from revenues. In addition,
certain other expenses, recorded as "Other operation and maintenance" and "Depreciation" on the Statements of Income, associated with approved cost
recovery mechanisms are offset against the recovery of those expenses, which are included in revenues. These mechanisms allow for direct recovery of these
expenses and, in some cases, returns on capital investments and performance incentives. As a result, this measure represents the net revenues from the
electricity and gas operations.
"Pennsylvania Gross Delivery Margins" is a single financial performance measure of the Pennsylvania Regulated segment's and PPL Electric's electricity
delivery operations, which includes transmission and distribution activities. In calculating this measure, utility revenues and expenses associated with approved
recovery mechanisms, including energy provided as a PLR, are offset with minimal impact on earnings. Costs associated with these mechanisms are recorded
in "Energy purchases," "Other operation and maintenance," which is primarily Act 129 costs, and "Taxes, other than income," which is primarily gross receipts
tax. This performance measure includes PLR energy purchases by PPL Electric from PPL EnergyPlus, which are reflected in "PLR intersegment utility revenue
(expense)." As a result, this measure represents the net revenues from the Pennsylvania Regulated segment's and PPL Electric's electricity delivery operations.
"Unregulated Gross Energy Margins" is a single financial performance measure of the Supply segment's and PPL Energy Supply's competitive energy activities,
which are managed on a geographic basis. In calculating this measure, energy revenues, including operating revenues associated with certain businesses
classified as discontinued operations, are offset by the cost of fuel, energy purchases, certain other operation and maintenance expenses, primarily ancillary
charges, gross receipts tax, recorded in "Taxes, other than income," and operating expenses associated with certain businesses classified as discontinued
operations. This performance measure is relevant due to the volatility in the individual revenue and expense lines on the Statements of Income that comprise
"Unregulated Gross Energy Margins." This volatility stems from a number of factors, including the required netting of certain transactions with ISOs and
significant fluctuations in unrealized gains and losses. Such factors could result in gains or losses being recorded in either "Unregulated wholesale energy",
"Unregulated retail energy" or "Energy purchases" on the Statements of Income. This performance measure includes PLR revenues from energy sales to PPL
Electric by PPL EnergyPlus, which are reflected in "PLR intersegment utility revenue (expense)." "Unregulated Gross Energy Margins" excludes adjusted
energy-related economic activity, which includes the changes in fair value of positions used to economically hedge a portion of the economic value of the
competitive generation assets, full-requirement sales contracts and retail activities. This economic value is subject to changes in fair value due to market price
volatility of the input and output commodities (e.g., fuel and power) prior to the delivery period that was hedged. Adjusted energy-related economic activity
includes the ineffective portion of qualifying cash flow hedges, the monetization of certain full-requirement sales contracts and premium amortization associated
with options. Unrealized gains and losses related to this activity are deferred, with the exception of the full-requirement sales contracts that were monetized, and
included in "Unregulated Gross Energy Margins" over the delivery period that was hedged or upon realization.