Attached files
| file | filename |
|---|---|
| 8-K - FORM 8-K 11/4/2014 - KITE REALTY GROUP TRUST | form8k_11042014.htm |

* NAREIT 2014: ATLANTA November 2014

* COMPANY OVERVIEW City Center White Plains, NY

* COMPANY SNAPSHOT * KITE REALTY GROUP TRUST KITE REALTY GROUP TRUST Number of Properties 132 Headquarters Indianapolis, IN Number of States 26 Total GLA (SF) 26.7mm Owned GLA (SF) 18.2mm Average Size Of Center (SF) ~225,000 Planned Disposition Markets Planned Disposition Assets States In Pro Forma Portfolio Geography Breakdown By ABR (1) ABR excludes ground lease revenue attributable to parcels and outlots owned by the Company and ground leased to tenants. Geography breakdown calculated pro forma for announced disposition and includes operating retail properties. Note: All data as of September 30, 2014 unless otherwise noted.

CURRENT PORTFOLIO OVERVIEW * (1) As of Q3 2014. (2) Other includes office, unanchored strip centers and single tenant assets. Source: demographic data from AGS. Total Leased (Owned SF) 94.9% Shop Leased (Owned SF) 85.8% Annualized Base Rent per SF $14.98 Ground Lease (ABR) $18.6mm 3-Mile Portfolio Demographics: Population / Growth (2013-2018) ~54,000 / ~8% Average Household Income ~$76,000 Retail Diversification By ABR (1) Summary Statistics (1) By Property Type ~62% of assets anchored with a grocery (2) The high-quality portfolio continues to improve with 62% of properties having a grocery component at nearly $15 of ABR per square foot

INTRODUCING KITE 2.0 * 2010 Today Enhanced Scale 63 Properties 9 States 132 Properties 26 States Strong Leasing 78.0% Small Shops Leased 85.8% Small Shops Leased Quality Markets $12.80 ABR per GLA $14.98 ABR per GLA Geographically Diverse 41.1% % of ABR from IN ~14% % of ABR from IN Reduced Risk 15.5% CIP & LHD as a % of GAV < 5% CIP & LHD as a % of GAV Conservative Balance Sheet 9.1x Net Debt / EBITDA ~6.5x Net Debt / EBITDA S&P: BBB- Moody’s: Baa3 Note: Financial information as of September 30, 2014. After the ~$300mm acquisition last November, the ~$1.2bn merger in July and announcing the 15-asset disposition in September, Kite has transformed in the recent past into Kite 2.0

IMPROVING PORTFOLIO QUALITY WHILE DELEVERING Growing ABR Through High-Quality Assets… …While Continuing To Strengthen The Balance Sheet 1. Base rent shown for retail operating properties at the end of each period. Source: Company filings. *

* PORTFOLIO UPDATE Plaza at Cedar Hill Dallas, TX Delray Marketplace Delray, FL

PERFORMANCE RECAP & RECENT EVENTS * 8th consecutive quarter of >4% same property NOI growth, at 4.7% for Q3 2014 Cash rent spreads of 14.4% marking the 4th consecutive quarter in excess of 13% Increased FFO by 17% since 2012 while significantly delevering the balance sheet (1) Bolton Plaza moved to operating portfolio Burlington opened at Gainsville Plaza; Ross Dress For Less under construction Expect to commence construction at Tamiami Crossing in 1H’15 $10-11mm of NOI yet to come on-line from Parkside, Holly Phase II SSNOI Growth Leasing FFO Growth Development / Redevelopment Recent Events Successfully integrated IDIV merger Completed redevelopment at Bolton Plaza Announced 15-asset sale to focus on core markets Received IG credit ratings from S&P and Moody’s (1) Assumes mid-point of guidance range, of $2.02 for 2014 FY, versus $1.72 FFO per share ($0.43, adjusted for reverse stock split). Net debt to EBITDA lowered from 8.6x to ~6.5x over the same period.

* STRONG OPERATING METRICS Portfolio % Leased Same Store NOI Growth Operating fundamentals underscore strength of portfolio and will continue to drive growth opportunities in the future Agg. Cash Lease Spreads >90% Leased For Last 5 Years Same Property NOI Growth >4% For 2 Years Strong Lease Spreads, Averaging Over 15%

KEY SUB-MARKETS DRIVE FUTURE GROWTH * . Source: demographic data from AGS; 3-mile radius shown. Note: demographic data is pro forma for announced asset dispositions. Portfolio Quality Supported By Strongest Sub-Markets Within Top 5 States Median Household Income ($000’s)

DEFENSIVE MERCHANDISE MIX AMONG TENANTS * Non-Defensive Non-Defensive Sector % ABR Office Supplies 2.7% Hobby & Party 2.5% Books, Music, Video, Games 1.9% Other 1.5% Small Electronics 0.6% ~98% of openings YTD have come from defensive / omni-channel tenants, totaling~96% of the SQFT opened in 2014 Increasing eCommerce Resistant Tenants YTD Omni-Channel Defensive Note: Defensive industries include service-oriented tenants and eCommerce protected sectors. Omni-channel tenants refer to those tenants with a notable online platform. Non-defensive also includes office supplies despite retailers’ eCommerce platforms given the sector’s consolidation and resulting decreased demand for leasable area. Over 90% of Kite’s tenant base is either defensive and / or has robust omni-channel capabilities in place; we continue to shrink the non-defensive portion of our portfolio

LEASING STRATEGIES ENHANCE FUTURE GROWTH OPPORTUNITIES * Fast, Casual Dining Specialty Grocer Growth Multiple Leases Executed An aggressive leasing strategy that focuses on tenant retention, long-term relationships and defensive retailers continues to enhance the quality of the portfolio

Tenant # Stores % ABR 20 3.5% 22 2.5% 21 2.3% 20 2.0% 10 2.0% 5 1.9% 16 1.8% 16 1.7% 15 1.5% 7 1.5% Total 152 20.7% HIGH-QUALITY & DIVERSIFIED TENANTS REMAIN CORE TO KITE 2.0 Strong relationships represented by consistency in top tenants by ABR since 2010; healthy diversification persists with no single tenant contributing >4% of ABR Top 10 Tenants By ABR (1) As of Q3 2014, includes development and redevelopment projects. TJ Maxx includes TJ Maxx, Marshalls and HomeGoods. 2010’s Top 5 Tenants 2010’s Top 5 Tenants 1 Publix 2 Petsmart 3 Bed Bath & Beyond 4 Lowe’s 5 Ross Dress For Less Strong Tenant Relationships Core To KRG Platform *

* MERGER & PORTFOLIO RECYCLYING UPDATE Landstown Commons Virginia Beach, VA Rivers Edge Indianapolis, IN

Debt Management System KITE CAPITALIZES ON INTERNAL & EXTERNAL OPPORTUNITIES VIA MERGER *

KITE DELIVERS ON MERGER CLOSING, INTEGRATION AND EXPECTATIONS * IDIV under contract to sell net lease portfolio to Realty Income Complete 1031 exchange; redeploy $72mm of capital IDIV sold net lease portfolio Completed 1031 exchange Disposed of 2 multi-family assets Expected closing in late Q2 / Q3 July 1st closing completed as targeted KRG to sell certain non-core assets (some executed early) Use asset sale proceeds to delever Disposed of securities portfolio Proceeds delevered KRG as expected Announced 15-asset sale Argus Enterprise MRI Accounting and Leasing Software Debt Management System Oracle Sales Force Argus Enterprise MRI Accounting and Leasing Software Debt Management System Oracle Sales Force Pre-Closing Actions Completed Timing Execution Ahead Of Schedule Post-Closing Plans In Process Merger Announcement (1) (1) Source: Company presentation, February 2014, page 2. Integrated Systems Actions Taken To Date

INLAND DIVERSIFIED MERGER EXECUTION * Lower Net Debt to EBITDA to ~6.5x FFO neutral & strengthened balance sheet Acquired at a 6.6% cap rate on $2.03bn of assets Estimated $17-19mm synergies or $6-8mm of incremental operating expense Estimated ~$25-27mm Guidance Given In Feb. 2014 (1) Reduce Leverage Net Debt to EBITDA: ~6.5x Q2’14 FFO: $0.50 Q3’14 FFO: $0.51 Incremental annualized cash NOI of approximately $134mm Incremental expenses of ~$8mm, result in $17mm in synergies Total costs not exceeding ~$27mm Execution Status FFO Neutral (2) Implied Cap Rate Synergy Creation Source: Company presentation, February 2014, page 4. Note: FFO defined as FFO as adjusted, which excludes merger and acquisition costs. Source: Company filings; Q2 2014 quarterly supplemental, page 7. FFO is adjusted for merger and acquisition costs and re-stated for Q2’14 for the reverse stock split. The restated FFO as adjusted for Q2’14 is calculated as: = [($17,432,171 / 138,382,817) *4]. Transaction still on track to be 2014E FFO per share neutral Merger Costs

SWIFT DISPOSITION SEIZES OPPORTUNITY TO ENHANCE PORTFOLIO FURTHER * Key Highlights Of Asset Sale 15 properties for ~$318mm 2 tranche closing: December 2014; March 2015 Ability to sell a 16th asset via 3rd tranche option 50% levered; only 2 are unencumbered ~$140mm secured debt; average rate of ~4.6% KITE 2.0 KEEPS IMPROVING Re-focuses portfolio on core markets Sale at equivalent cap rate to merger Improves ABR to $15.03 Remaining Inland Diversified portion of combined portfolio has an ABR of $16.98 Pro Forma Demo Stat Impact: Current & expected population: +8-9% Number of households: +8-8.5% Reduces concentration in targeted anchors, including single-tenant properties Reduces unanchored grocery exposure Strategic Rationale (1) ___________________________ (1) Demographic statistics per AGS; population as of 2013 and estimated population for 2018 for both 3-mile and 5-mile. Growth in number of households shown as average for 3-mile and 5-mile demographics. Excludes non-operating / development projects. Planned Disposition Markets Planned Disposition Assets States In Pro Forma Portfolio

BALANCE SHEET Parkside Town Commons Cary, NC Beechwood Promenade Athens, GA

* A BALANCED APPROACH TO CAPITAL MANAGEMENT Well Managed Debt Maturity Schedule (1) ___________________________ As of September 30, 2014. Chart excludes principal payments and net premiums on fixed rate. Note: Revolver and Term Loan are shown at final maturities after extension options exercised. Annual total amounts are pro forma for the announced asset sale. Fixed charge metrics per covenant definitions outstanding at the time. Focus on maintaining investment grade-quality metrics and further improving financial flexibility with goals to reduce asset-level debt, extend maturities and lower overall leverage Extended Debt Maturities Lower Net Debt/EBITDA Fixed Charge Coverage (2) Executing A Balanced Approach To Capital Management Achieved Investment Credit Grade Ratings S&P: BBB- (stable); Moody’s: Baa3 (stable) Target Metrics To Achieve And Maintain: Further reduce net debt / EBITDA to ≤ 6.0x Increase unencumbered pool to ≥ 50% of total NOI Maintain fixed charge coverage ≥ 2.5x ($mm) Pro Forma For Disposition Asset-Related Debt

* FUTURE GROWTH INITIATIVES Portofino Shopping Center Houston, TX Kingwood Commons Houston, TX

COMPANY OBJECTIVES AND STRATEGY KRG will continue to be focused on generating strong operational performance and maintaining a conservative capital structure to drive shareholder value Lease Management Identified over $100mm actionable projects across ~20 different opportunities Expected to result in incremental returns of 8-10% Ongoing assessment of owned and non-owned peripheral out-parcel opportunities throughout the portfolio Right-sizing anchor space and optimizing tenant mix of anchor and small shop space at each shopping center Renewal cash spread of 5-8% with a focus on annual rent bumps In-contract rent bumps to add ~1-1.25% of SSNOI growth annually, for 2015-2016 ABR expiring in 2015 and 2016 are 4.3% and 12.3% below the portfolio’s current average of $14.98 per SF Announced 15-asset disposition expected to close over next ~6 months Improves demographics and ABR post disposition Sales in non-core markets provide increased geographic focus Enhances growth profile of overall portfolio Focused on enhancing tenant mix by capitalizing on tenant consolidation initiatives and increasing daily traffic patterns Portfolio Repositioning Development / Redevelopment Execution *

REPOSITIONING THE PORTFOLIO: TENANT OPTIMIZATION * Located next to Daytona International Speedway which hosts over 300 events annually Moved Staples into existing Petco space Downsized the office supply anchor by 50% to ~12,000 SF Executed lease with Total Wine & More to backfill the original~24,000 SF Staples box Total Wine & More opened in May 2014 Cost-efficient way to optimize existing space International Speedway Square Daytona, FL Quick Facts Quick Facts MSA Daytona Beach Total Owned GLA 233,495 % Leased 99.5% Incremental Return on Invested Capital 14.6% Project Type Tenant Optimization Downsized Staples International Speedway Square

REPOSITIONING THE PORTFOLIO: RIGHT-SIZING LARGE ANCHOR SPACE * Key highway intersection; traffic counts of 81,000 / day during peak season Acquired Winn-Dixie lease from bankruptcy ~50,000 SF Winn-Dixie anchor space Demised GLA into 2 right-sized spaces (~25,000 SF each) Added a specialty grocer component with The Fresh Market Adding a Panera Bread outlot in 2015 Shops At Eagle Creek Naples, FL Quick Facts Quick Facts MSA Naples Total Owned GLA 70,755 % Leased ~90% Incremental Return on Invested Capital 9.7% Project Type Converting space
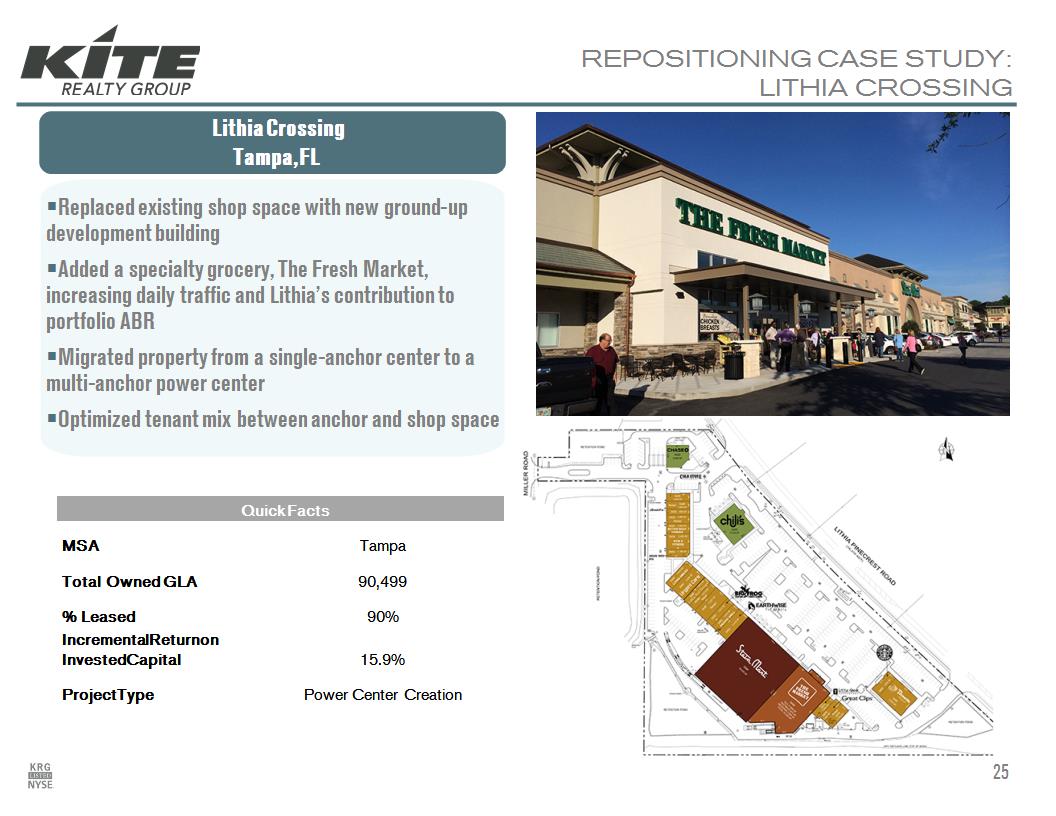
REPOSITIONING CASE STUDY: LITHIA CROSSING * Replaced existing shop space with new ground-up development building Added a specialty grocery, The Fresh Market, increasing daily traffic and Lithia’s contribution to portfolio ABR Migrated property from a single-anchor center to a multi-anchor power center Optimized tenant mix between anchor and shop space Lithia Crossing Tampa, FL Quick Facts Quick Facts MSA Tampa Total Owned GLA 90,499 % Leased 90% Incremental Return on Invested Capital 15.9% Project Type Power Center Creation

REDEVELOPMENT CASE STUDY: KING’S LAKE SQUARE UPDATE * Naples, FL Owned GLA: 87,073 89% Leased ABR per SQFT: $17.27 Demolished a 30 year old property and replaced with ground-up development Build to suit for Publix grocer, including an increased size of ~45,000 square feet and equipped with energy saving upgrades Complete overhaul of outer façade and ancillary external features, including landscaping New 20-year lease negotiated and executed with Publix at an on-market rate, to replace existing terms King’s Lake Square Overview

REDEVELOPMENT CASE STUDY: KING’S LAKE SQUARE BEFORE & AFTER * Before Before Before

WHY INVEST?…BECAUSE KITE DELIVERS * Kite Delivers Value Proposition (1) Successfully closed ~$2.5bn of M&A within the last year No surprises or unexpected events in full system integration Reduced net debt / EBITDA by a full turn to ~6.5x Received 2 investment grade credit ratings of BBB- and Baa3 Increased ABR per SF by ~12% since Q2 ‘14 to ~$15 Execution Seamless Integration Balance Sheet Strength Portfolio Quality 1. Source: Bloomberg, SNL Financial. As of 10/30/14. NAV Per Share ($, Price) Price / 2015E FFO

* INDUSTRY UPDATE Village Walk Fort Meyers, FL Wheatland Town Crossing Wheatland, TX

NEW SUPPLY OFF THE LOWS BUT REMAINS LIMITED * Construction Starts For Aggregate REIT Industry (1) Source: CBRE and Citi Research. Portfolio Managers Quarterly, October 2014. Data shown is seasonally adjusted in thousand square feet. New shopping center supply remains depressed, growing at the slowest pace in more than 40 years last year Starts within the retail sub-sector continue to lag, currently over 100 bps below the historical average as a % of total stock

REIT INDUSTRY TRENDS * Development / Redevelopment Landlords looking to reposition high-quality assets with strong tenants that increase daily traffic Focused on right-sizing anchor tenant space and optimizing mix of anchor and small shop space at shopping centers Omni-Channel Retailers continue to build eCommerce platforms as Bricks & Mortar remain core 94% of total retail spending occur in-store; “web-rooming” (view online, buy in-store) remains popular Consumer Trends Holiday spending is expected to rise the most in 3 years, with sales expected to grow 4.1% Fresh format groceries expected to grow store count and sales by 63% and 90% respectively, by 2018 Value sector visits up as young shoppers & openings increase traffic 14% vs. -4% across overall industry Capital Access IG Credit REIT supply is up ~65% YTD U.S. REITs have issued over $21bn in equity YTD Lending activity for CMBS has increased 45% in 2014 Shopping Center REIT Trends (1) Sources: The NPD Group. Results measured year-over-year from May 2014-July 2014. The National Retail Federation, October 2014. FTI Analysts Paint Optimistic Picture for REITs in 2015. ICSC Shopping Centers: America’s First and Foremost Marketplace, 2014. Citi Research, Portfolio Managers Quarterly; October 2014. JLL report, cited in Tampa Bay Business Journal, October 3, 2014. USA Today; Retailers Will Win Holidays With Omni-Channel, October 2014. ICSC, Shopping Centers: America’s First and Foremost Marketplace, 2014. Global footprint via Alliance Boots acquisition Global expansion; target footprint: 1,875 new stores Go Bank; Savings Catcher Intel partnership; GoPro and ‘Technology Experience Zones’ Est. 25-30 new stores / year, both in U.S. and abroad Plans to moderate U.S. store growth & lower CapEx; continue to focus on e-commerce spend New Store Concept Market Expansion New Brick & Motor In-Store Pick Up Alt. Cost Initiatives Tenant Talk: Retailer Trends Impacting REITs Euro restructuring est. ~$90mm in new savings

* QUALITY, QUALITY, QUALITY

Certain statements in this presentation that are not in the present or past tense or that discuss the Company’s expectations (including any use of the words “anticipate,” “assume,” “believe,” “estimate,” “expect,” “forecast,” “guidance,” “intend,” “may,” “might,” “outlook,” “project,” “should,” or similar expressions) are forward-looking statements within the meaning of the federal securities laws and as such are based upon current beliefs as to the outcome and timing of future events. These forward-looking statements, which are based on current expectations, estimates and projections about the industry and markets in which the Company operates and beliefs of and assumptions made by management, involve uncertainties that could significantly affect the financial results of the Company. There can be no assurance that actual future developments affecting the Company will be those anticipated by the Company. These forward-looking statements involve risks and uncertainties (some of which are beyond the control of the Company) and are subject to change based upon various factors including, but not limited to, the following risks and uncertainties: changes in the real estate industry and in performance of the financial markets and interest rates; the demand for and market acceptance of the Company’s properties for rental purposes; the ability of the Company to enter into new leases or renewal leases on favorable terms; the amount and growth of the Company’s expenses; tenant financial difficulties and general economic conditions, including interest rates, as well as economic conditions and competition in those areas where the Company owns properties; risks associated with joint venture partners; risks associated with the ownership and development of real property; the outcome of claims and litigation involving or affecting the Company; the ability to satisfy conditions necessary to close pending transactions and the ability to successfully integrate pending transactions; applicable regulatory changes; risks associated with acquisitions, including the integration of the Company’s and Inland Diversified Real Estate Trust, Inc.’s businesses; risks associated with achieving expected revenue synergies or cost savings; and other risks and uncertainties detailed from time to time in the Company’s filings with the Securities and Exchange Commission (the “SEC”). Should one or more of these risks or uncertainties occur, or should underlying assumptions prove incorrect, the business, financial condition, liquidity, cash flows and financial results of the Company could differ materially from those expressed in the forward-looking statements. Any forward-looking statement speaks only as of the date on which it is made. New risks and uncertainties arise over time, and it is not possible for us to predict the occurrence of those matters or the manner in which they may affect us. The Company does not undertake to update forward-looking statements (including EBITDA and net debt to adjusted EBITDA estimates) except as may be required by law. FORWARD – LOOKING STATEMENTS *