Attached files
| file | filename |
|---|---|
| 8-K - 8-K - Sunstone Hotel Investors, Inc. | a14-23533_18k.htm |
Exhibit 99.1
|
|
[staying the course] COMPANY PRESENTATION NOVEMBER 2014 |
|
|
/ This presentation contains forward-looking statements that have been made pursuant to the provisions of the Private Securities Litigation Reform Act of 1995. These statements relate to future events or our future financial performance. In some cases, you can identify forward-looking statements by terminology such as “anticipate,” “believe,” “continue,” “could,” “estimate,” “expect,” “intend,” “may,” “plan,” “predict,” “project,” “should,” “will” or the negative of such terms and other comparable terminology. These statements are only predictions. Actual events or results may differ materially from those expressed or implied by these forward-looking statements. In evaluating these statements, you should specifically consider the risks outlined in detail under the heading “Risk Factors” in our Annual Report on Form 10-K, filed with the Securities and Exchange Commission (“SEC”) on February 25, 2014, including, but not limited to, the following factors: volatility in the debt or equity markets affecting our ability to acquire or sell hotel assets; international, national and local economic and business conditions, including the likelihood of a U.S. recession or global economic slowdown, as well as any type of flu or disease-related pandemic, affecting the lodging and travel industry; the need to operate as a REIT and comply with other applicable laws and regulations; rising operating expenses; relationships with and requirements of franchisors and hotel brands; relationships with and the performance of the managers of our hotels; the ground, operating or air leases for 9 of our 30 hotels; our ability to complete acquisitions and dispositions; and competition for the acquisition of hotels. These factors may cause our actual events to differ materially from the expectations expressed or implied by any forward-looking statement. We do not undertake to update any forward-looking statement. Definitions of non-GAAP financial measures can be found on Form 10-Q filed November 4, 2014, and reconciliations to non-GAAP financial measures can be found on Forms 8-K furnished on November 3, 2014 and February 20, 2014. [Forward-Looking Statements] COMPANY PRESENTATION SUNSTONE HOTEL INVESTORS, INC. 2 |
|
|
/ Company Update Hotel Portfolio Sunstone Strategy Value Creation 2015 & Beyond Exhibits [Table of Contents] COMPANY PRESENTATION SUNSTONE HOTEL INVESTORS, INC. 3 |
|
|
[Company Update] |
|
|
/ Our Profile We own 30 institutional-quality hotels (14,303 rooms). Our enterprise value is approximately $4.5 billion. [Company Update] SUNSTONE HOTEL INVESTORS, INC. 5 High-Quality Diversified Portfolio EBITDA Concentrated in Top 25 MSAs Significant Balance Sheet Capacity Consistent Execution of Stated Strategy Best-in-Class Disclosure & Corporate Governance COMPANY PRESENTATION |
|
|
/ Valuation Our portfolio quality, growth prospects and discount valuation imply meaningful upside in our share price. [Company Update] SUNSTONE HOTEL INVESTORS, INC. 6 COMPANY PRESENTATION Capital Structure / Valuation Metrics Sunstone Portfolio Metrics Recent Stock Price 1 $15.00 Hotels 30 Shares Outstanding (MM) 205.4 Rooms 14,303 Equity Market Cap (MM) $3,081 2013 Comparable Hotel RevPAR 149.92 Total Mortgage Debt (MM) $1,329 2013 Industry Peer Hotel RevPAR 4 $142.32 Total Preferred Equity (MM) 115.0 Variance $7.60 Total Corporate Debt + Preferred (MM) $1,444 2014 Comparable Hotel RevPAR Guidance 2 +6.5% - 7.0% Total Enterprise Value (MM) $4,526 2014 Adjusted EBITDA Guidance (MM) 2 $309 - $313 Implied Value per Key $323,100 2014 Pro Forma Adjusted EBITDA (MM) 3 $321 - $324 Relative Valuation Valuation Sensitivity A change of: Would result in a share price 2014 Consensus SHO EBITDA Multiple 4 14.5x change of: 2014 Consensus Industry Peer EBITDA Multiple 4 15.4x $10,000 / key $0.68 Variance -0.9x 1.0x in EBITDA multiple $1.48 1 As of 10/27/2014. 2 Data as provided in supplemental financial information reported on Form 8-K, furnished 11/3/2014. Includes partial year ownership of the Wailea Beach Marriott Resort & Spa. 3 Includes full-year estimated EBITDA of $19.3M for the Wailea Beach Marriott Resort & Spa, acquired 7/17/2014. 4 Based Source: SNL Financial, FactSet. Median figures. Data for Industry Peer group includes DRH, RHP, HST, LHO, PEB, FCH, AHT, HT, BEE, RLJ, CHSP. |
|
|
/ Recent Earnings Highlights [Company Update] SUNSTONE HOTEL INVESTORS, INC. 7 • Q3 RevPAR Growth Guidance: 4.0% - 5.5% • Actual Q3 RevPAR Growth: 7.7% Q3 2014 RevPAR • Q3 Adjusted EBITDA Guidance: $83 - $86M • Actual Q3 Adjusted EBITDA: $91M Q3 2014 EBITDA • Q3 FFO per share Guidance (1): $0.30 - $0.32 • Actual Q3 FFO per share: $0.34 Q3 2014 FFO • 2015 Group Pace (as of Q2 2014): + 0.3% • 2015 Group Pace (as of Q3 2014): + 1.5% Group Pace • Quarterly Cash Dividend: $0.05 / share • Year-End Distribution: $0.36 / share Dividends Our Q3 2014 results surpassed expectations and demonstrate improving fundamentals. COMPANY PRESENTATION (1) Adjusted FFO per diluted share. |
|
|
/ Full Year Expectations [Company Update] SUNSTONE HOTEL INVESTORS, INC. 8 Our full year expectations imply significant FFO growth despite a meaningfully strengthened balance sheet. COMPANY PRESENTATION $210 $230 $250 $270 $290 $310 $330 2013 2014 Guidance (1) Adjusted EBITDA ($MM) (1) Represents mid-point of full-year 2014 guidance provided on November 3, 2014 29% Implied Growth $0.80 $0.85 $0.90 $0.95 $1.00 $1.05 $1.10 $1.15 $1.20 2013 2014 Guidance (1) Adjusted FFO per Share (1) Represents mid-point of full-year 2014 guidance provided on November 3, 2014 25% Implied Growth |
|
|
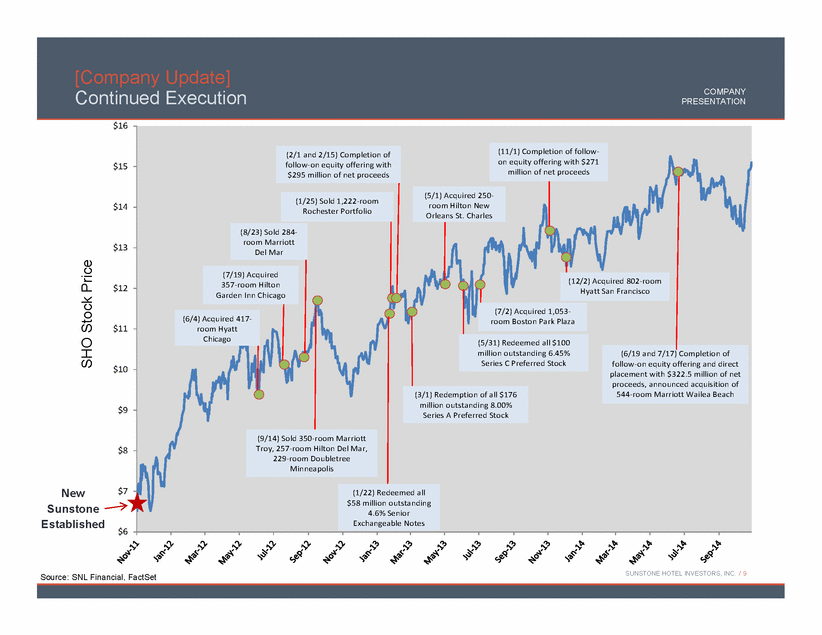
/ Continued Execution [Company Update] SUNSTONE HOTEL INVESTORS, INC. 9 SHO Stock Price Source: SNL Financial, FactSet COMPANY PRESENTATION New Sunstone Established $6 $7 $8 $9 $10 $11 $12 $13 $14 $15 $16 (6/4) Acquired 417- room Hyatt Chicago (7/19) Acquired 357-room Hilton Garden Inn Chicago (8/23) Sold 284- room Marriott Del Mar (12/2) Acquired 802-room Hyatt San Francisco (11/1) Completion of followon equity offering with $271 million of net proceeds (1/25) Sold 1,222-room Rochester Portfolio (1/22) Redeemed all $58 million outstanding 4.6% Senior Exchangeable Notes (3/1) Redemption of all $176 million outstanding 8.00% Series A Preferred Stock (2/1 and 2/15) Completion of follow-on equity offering with $295 million of net proceeds (5/1) Acquired 250- room Hilton New Orleans St. Charles (6/19 and 7/17) Completion of follow-on equity offering and direct placement with $322.5 million of net proceeds, announced acquisition of 544-room Marriott Wailea Beach (9/14) Sold 350-room Marriott Troy, 257-room Hilton Del Mar, 229-room Doubletree Minneapolis (7/2) Acquired 1,053- room Boston Park Plaza (5/31) Redeemed all $100 million outstanding 6.45% Series C Preferred Stock |
|
|
[Hotel Portfolio] |
|
|
/ Our Properties [Hotel Portfolio] SUNSTONE HOTEL INVESTORS, INC. 11 West: 40% • San Diego (16%) • Maui (6%) • Los Angeles (6%) • San Francisco (5%) • Orange County (3%) • Portland (2%) • Park City (1%) Midwest: 6% • Chicago (6%) Northeast: 41% • Boston (15%) • NYC (13%) • DC/Baltimore (13%) • Philadelphia (1%) South: 13% • New Orleans (6%) • Orlando (4%) • Houston (3%) Our assets are concentrated in the top 25 MSAs. COMPANY PRESENTATION * Data as provided in supplemental financial information reported on Form 8-K, furnished 08/07/2014. |
|
|
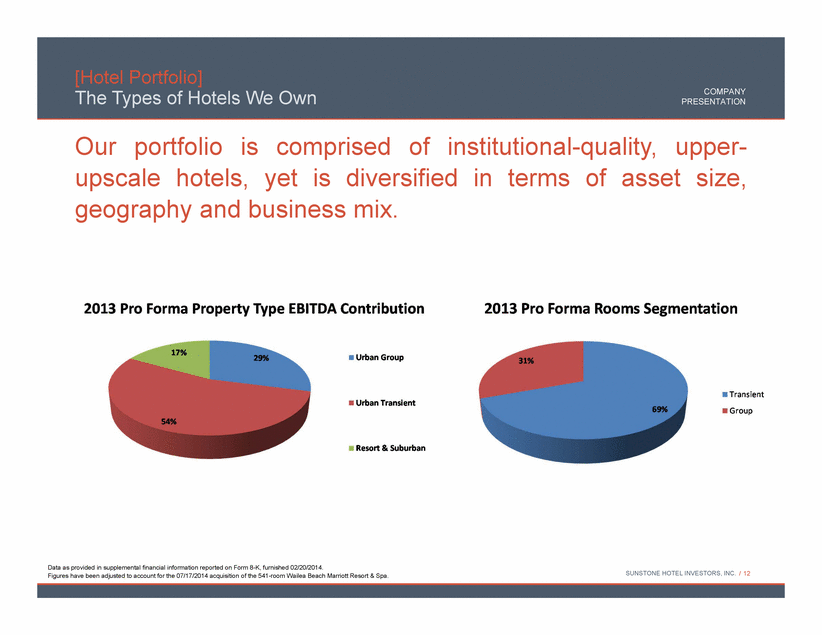
/ The Types of Hotels We Own Our portfolio is comprised of institutional-quality, upperupscale hotels, yet is diversified in terms of asset size, geography and business mix. [Hotel Portfolio] SUNSTONE HOTEL INVESTORS, INC. 12 Data as provided in supplemental financial information reported on Form 8-K, furnished 02/20/2014. Figures have been adjusted to account for the 07/17/2014 acquisition of the 541-room Wailea Beach Marriott Resort & Spa. COMPANY PRESENTATION |
|
|
/ Urban Transient Hotels [Hotel Portfolio] SUNSTONE HOTEL INVESTORS, INC. 13 803-room Hyatt Regency San Francisco Our Growth is Fueled by Strength in Business Transient . 13 hotels achieved double-digit RevPAR growth in Q3. . On a same-store basis, our Q3 occupancy was 130 basis points above prior Q3 peak, yet our Q3 ADR was 4.8% (nearly $10) below prior peak Q3 ADR, implying meaningful near-term upside. COMPANY PRESENTATION * Data as provided in supplemental financial information reported on Form 8-K, furnished 11/03/2014. Urban Transient Hotels Number of Hotels 17 Rooms 7,341 Q3 2014 RevPAR % Change Year-over-Year $200.06 9.3% Q3 2014 EBITDA ($MM) % Change Year-over-Year $57.3 13.6% Q3 2014 Sell-Out Nights % Change Year-over-Year 41.2% -4% |
|
|
/ Urban Group Hotels [Hotel Portfolio] SUNSTONE HOTEL INVESTORS, INC. 14 1,190-room Hilton San Diego Bayfront Group Recovery is Increasing Our Compression Base . Our current 2014 group pace, for all 30 hotels is up +5.5%, driven by growth in occupied room nights. . Q3 group production increased 14.9%, coming in at its second highest level over the last seven years. COMPANY PRESENTATION Urban Group Hotels Number of Hotels 4 Rooms 3,400 Q3 2014 RevPAR % Change Year-over-Year $152.72 3.5% Q3 2014 EBITDA ($MM) % Change Year-over-Year $25.1 14.5% Q3 2014 Sell-Out Nights % Change Year-over-Year 18.8% 3% * Data as provided in supplemental financial information reported on Form 8-K, furnished 11/03/2014. |
|
|
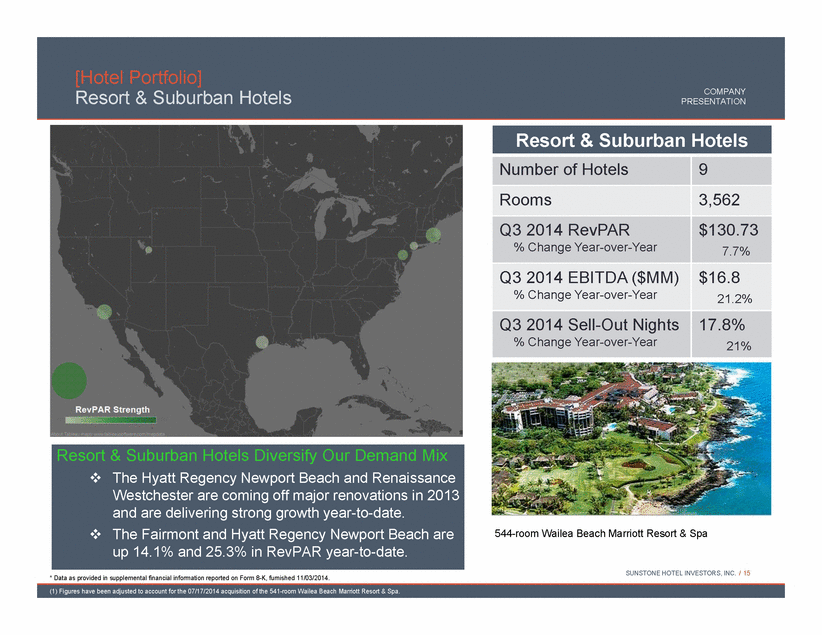
/ Resort & Suburban Hotels [Hotel Portfolio] SUNSTONE HOTEL INVESTORS, INC. 15 544-room Wailea Beach Marriott Resort & Spa Resort & Suburban Hotels Diversify Our Demand Mix . The Hyatt Regency Newport Beach and Renaissance Westchester are coming off major renovations in 2013 and are delivering strong growth year-to-date. . The Fairmont and Hyatt Regency Newport Beach are up 14.1% and 25.3% in RevPAR year-to-date. COMPANY PRESENTATION (1) Figures have been adjusted to account for the 07/17/2014 acquisition of the 541-room Wailea Beach Marriott Resort & Spa. Resort & Suburban Hotels Number of Hotels 9 Rooms 3,562 Q3 2014 RevPAR % Change Year-over-Year $130.73 7.7% Q3 2014 EBITDA ($MM) % Change Year-over-Year $16.8 21.2% Q3 2014 Sell-Out Nights % Change Year-over-Year 17.8% 21% * Data as provided in supplemental financial information reported on Form 8-K, furnished 11/03/2014. |
|
|
[Sunstone Strategy] |
|
|
/ Strategic Pillars During the ongoing growth phase of the cycle, our plan is to drive meaningful returns for our shareholders by improving the quality and scale of our portfolio while maintaining balance sheet strength. We will continue to deliver on our plan by executing on a five-pillar strategy: [Sunstone Strategy] SUNSTONE HOTEL INVESTORS, INC. 17 Proactive Portfolio Management Disciplined Capital Allocation Aggressive Asset Management Focused Cost of Capital Management Superior Corporate Governance 412-room Marriott Boston Long Wharf COMPANY PRESENTATION |
|
|
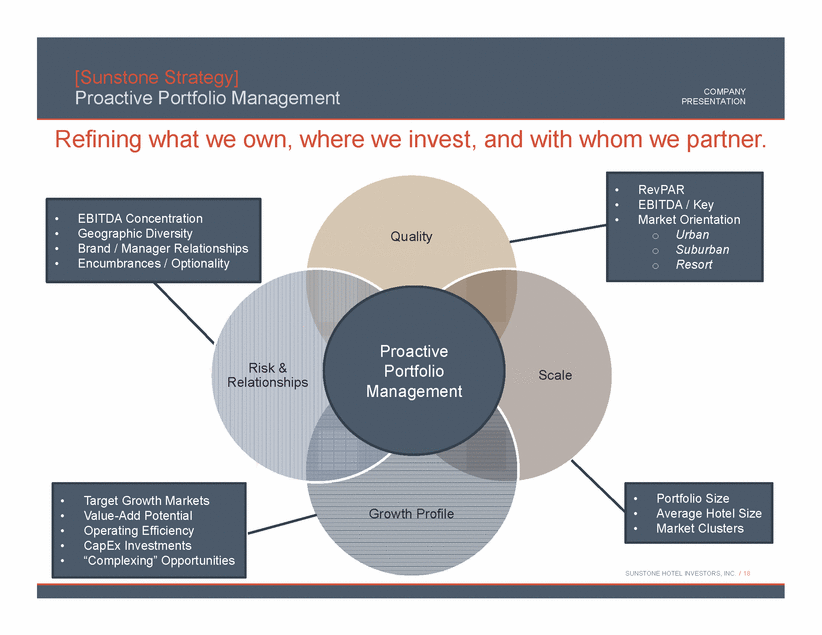
/ Proactive Portfolio Management Refining what we own, where we invest, and with whom we partner. [Sunstone Strategy] SUNSTONE HOTEL INVESTORS, INC. 18 • EBITDA Concentration • Geographic Diversity • Brand / Manager Relationships • Encumbrances / Optionality Quality Scale Growth Profile Risk & Relationships • RevPAR • EBITDA / Key • Market Orientation o Urban o Suburban o Resort • Target Growth Markets • Value-Add Potential • Operating Efficiency • CapEx Investments • “Complexing” Opportunities • Portfolio Size • Average Hotel Size • Market Clusters Proactive Portfolio Management COMPANY PRESENTATION |
|
|
/ Disciplined Capital Allocation [Sunstone Strategy] SUNSTONE HOTEL INVESTORS, INC. 19 COMPANY PRESENTATION Improving portfolio quality through disciplined acquisitions and dispositions. $30 $20 $10 $0 $10 $20 $30 $40 $50 San Diego Maui New Orleans Chicago Boston San Francisco Minneapolis Troy, MI Rochester, MN Hotel EBITDA ($mm) 1 Acquisitions Value $1.65B Dispositions Value $0.4B 1. Represents 2011 data for comparison purposes. Since 2011, we have added net $76M of high-quality EBITDA to our portfolio $85 $148 $70 $80 $90 $100 $110 $120 $130 $140 $150 $160 Sold Hotels Acquired Hotels Average RevPAR 1 1. Represents 2011 data for comparison purposes. 74.4% INCREASE $12,000 $20,700 $10,000 $12,000 $14,000 $16,000 $18,000 $20,000 $22,000 Sold Hotels Acquired Hotels Average EBITDA / Key 1 1. Represents 2011 data for comparison purposes. 72.5% INCREASE |
|
|
/ Aggressive Asset Management [Sunstone Strategy] SUNSTONE HOTEL INVESTORS, INC. 20 Revenue Management • Optimizing Revenues Operational Efficiency • Controlling Expenses Capital Investment • Maximizing Asset Value COMPANY PRESENTATION Maximizing the value of our individual hotels. |
|
|
/ Aggressive Asset Management - 2013 Renovations Highlights [Sunstone Strategy] SUNSTONE HOTEL INVESTORS, INC. 21 JW Marriott New Orleans • Scope: Entry, lobby, new social living spaces / bar and dining, all meeting spaces • 2012 YTD September RevPAR Index: 111.1% • 2014 YTD September RevPAR Index: 123.3% (+12.2 pts) • 2014 YTD Margin Expansion (compared to 2012): +630 bps Hyatt Regency Newport Beach • Scope: Establish California resort ambiance that complements hotel’s location • 2012 YTD September RevPAR Index: 116.4% • 2014 YTD September RevPAR Index: 136.6% (+20.2 pts) • 2014 YTD Margin Expansion (compared to 2012): +440 bps Hilton Times Square • Scope: Full hotel renovation, new social living / bar, competitive enhancements • 2012 YTD September RevPAR Index: 97.0% • 2014 YTD September RevPAR Index: 101.3% (+4.3pts) • 2014 YTD Margin Expansion (compared to 2012): +90 bps Embassy Suites Chicago • Scope: Full hotel renovation, new social living / bar, competitive enhancements • 2012 YTD September RevPAR Index: 104.6% • 2014 YTD September RevPAR Index: 117.8% (+13.3 pts) • 2014 YTD Margin Expansion (compared to 2012) (1): +360 bps COMPANY PRESENTATION (1) Excludes prior year property tax adjustment * Margin data as provided in supplemental financial information furnished 11/11/2013 and 11/03/2014 |
|
|
/ Focused Cost of Capital Management [Sunstone Strategy] SUNSTONE HOTEL INVESTORS, INC. 22 COMPANY PRESENTATION Source: SNL Financial, FactSet Total Return calculated from 12/31/2011 to 10/27/2014 Leverage (Net Debt plus Preferred to EBITDA) as of 12/31/2011 and 6/30/2014. 2014 Median Consensus EBITDA estimates. Consistently managing our balance sheet in a shareholder-friendly way. 87.1% 65.1% 56.5% 73.0% 50% 55% 60% 65% 70% 75% 80% 85% 90% 2.0x 3.0x 4.0x 5.0x 6.0x 7.0x 8.0x 9.0x Sunstone Host DiamondRock LaSalle Relative Leverage & Total Returns (2011 - 2014) 2011 2014F Period Total Return (R-Axis) Deleveraging while delivering superior shareholder value! |
|
|
/ Superior Corporate Governance [Sunstone Strategy] SUNSTONE HOTEL INVESTORS, INC. 23 . Ranked 4th highest in corporate governance by Green Street Advisors . out of 84 REITs in their coverage universe . ISS Quick Score of 1 . 1 = most shareholder friendly, 10 = least shareholder friendly . First in our space to opt-out of MUTA provision . Best-in-class disclosures with quarterly supplemental . Culture of Transparency Our priority is to maximize shareholder returns. Our board structure, corporate charter and culture of transparency place us at the top of the REIT space in terms of Corporate Governance. COMPANY PRESENTATION |
|
|
[Value Creation] |
|
|
/ Returns on Current Cycle Acquisitions [Value Creation] SUNSTONE HOTEL INVESTORS, INC. 25 COMPANY PRESENTATION Our recent investments are providing compelling returns. JW Marriott New Orleans 496 rooms Hilton San Diego Bayfront 1,190 rooms Hyatt Chicago Mag Mile 419 rooms Hilton New Orleans St. Charles 250 rooms Boston Park Plaza 1,054 rooms Wailea Beach Marriott Resort & Spa 541 rooms Hyatt San Francisco 803 rooms Hilton Garden Inn Chicago 361 rooms 7.4% 11.9x 10.0x 10.5x 11.0x 11.5x 12.0x 12.5x 5.0% 5.5% 6.0% 6.5% 7.0% 7.5% 8.0% Current Cycle Acquisitions - Average Return on 2014 Expected Earnings Avg. NOI Yield Avg. EBITDA Multiple |
|
|
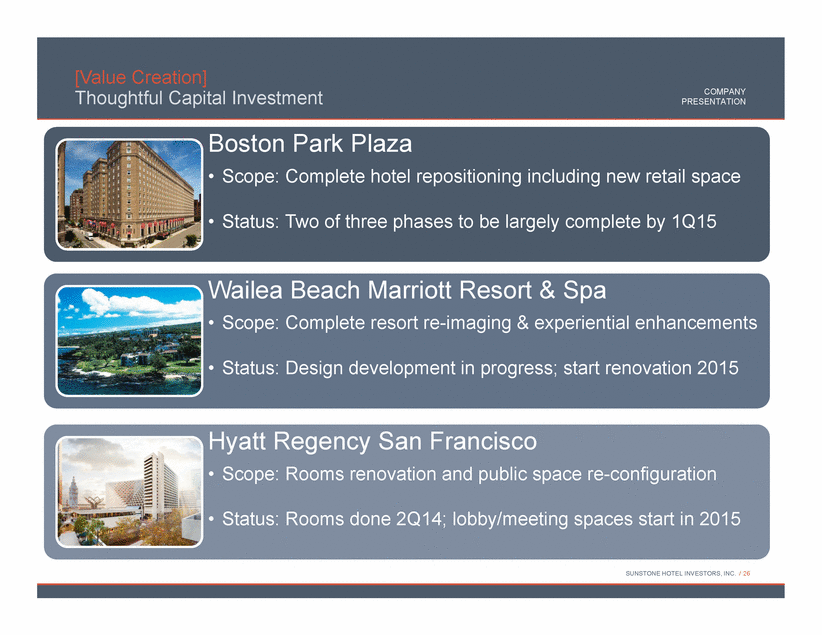
/ Thoughtful Capital Investment [Value Creation] SUNSTONE HOTEL INVESTORS, INC. 26 Boston Park Plaza • Scope: Complete hotel repositioning including new retail space • Status: Two of three phases to be largely complete by 1Q15 Wailea Beach Marriott Resort & Spa • Scope: Complete resort re-imaging & experiential enhancements • Status: Design development in progress; start renovation 2015 Hyatt Regency San Francisco • Scope: Rooms renovation and public space re-configuration • Status: Rooms done 2Q14; lobby/meeting spaces start in 2015 COMPANY PRESENTATION |
|
|
/ Boston Park Plaza [Value Creation] SUNSTONE HOTEL INVESTORS, INC. 27 Our minimally disruptive, phased renovation of the Boston Park Plaza is proceeding according to plan. 2014 2015 2016 • Retail: Hermes is already open; additional retail strategies in the works for new found lobby spaces (e.g. Starbucks). • Hotel Infrastructure: Roofs, sidewalks and façade and 50% MEP progressing on time and on budget (done 4Q 2014); Elevator modernization fully underway; guestroom 4- pipe system (done 1Q 2015). • Hotel Podium: Hotel podium (entrance lobby and bar F&B) and +50k SF of meeting space on 2nd and 4th floor bought-out and FF&E ordered (commence 4Q 2014). • Hotel Rooms: Rooms design and pricing fully underway with final rooms scope decisions due January 2015. • Retail: David Barton Gym is already under construction (opens 1Q 2015); Strega already under construction (opens 1Q 2015). • Hotel Infrastructure: Remaining 50% MEP work to be completed 3Q 2015. • Hotel Podium: New hotel entrance, lobby, bar F&B and +50k SF of meeting space on 2nd and 4th floor (done by 1Q 2015). • Hotel Rooms: Commence rooms renovation 4Q 2015 (during seasonally slower period): • Hotel Rooms: Complete rooms, bathrooms, corridors, suites renovation no later than May 15, 2016. Current expectation is to displace no more than 15,000 rooms ($3M). Project Estimate: $96M See Exhibit A for Positioning Statement |
|
|
/ Boston Park Plaza [Value Creation] SUNSTONE HOTEL INVESTORS, INC. 28 Post-renovation, we expect performance at the Boston Park Plaza to increase meaningfully. In the near-term, our asset management initiatives continue to drive incremental upside despite heavy capital investment at the property. RevPAR + 8.5% to + 9.5% RevPAR Index + 250 to + 275 bps EBITDA + 6.5% to + 7.5% EBITDA Margin + 25 to + 50 bps 2014 Full Year Expected Performance Highlights Pro Forma Expectations . Trip Advisor Rank 70th (currently out of 77 hotels) to Top 40. . STR RevPAR Index from low 80s (currently) to 90 – 95. $100 $125 $150 $175 $200 $225 $10,000 $15,000 $20,000 $25,000 $30,000 $35,000 2013 Stabilized Period Boston Park Plaza: Projections EBITDA (000s) (L) RevPAR (R) Expected Post-Renovation EBITDA & RevPAR Range Target Market Positioning Metrics |
|
|
/ Wailea Beach Marriott Resort & Spa [Value Creation] SUNSTONE HOTEL INVESTORS, INC. 29 We have begun the Master Planning Process to transform the Wailea Beach Marriott Resort & Spa into the top Marriott property in Hawaii. 2014 2015 2016 • Resort Talent: We have identified specific talent changes aimed at improving the resort experience, pool, activities, food quality and execution; and have determined what operating departments can be restructured to positively impact operations immediately. • Early Opportunities: Improve wholesale contracting; maximize opportunity for Marriott reward redemptions given the removal of the JW Marriott on Oahu. Leverage new onsite revenue management to improve ADR. • Master Planning: Determine F&B and retail strategy; complete meeting space and rooms design by December 31st; complete design planning fro all public spaces, pools and grounds by 2Q 2015. • Master Planning: Continue to fine-tune Master Planning and design for all public spaces, pools and F&B (done by 2Q 2015). • Meeting Spaces: Commence (2Q 2015) and complete all meeting spaces and public bathrooms by late 3Q 2015. • Hotel Rooms: Commence rooms and corridors (2Q 2015) and complete by end of 3Q 2015 / early 4Q 2015. • Food & Beverage: Finalize restaurant strategy and new concept 2Q 2015. • Lobby & Arrival: Commence (1Q 2016) landscape, hardscape, construction and FF&E. Completed by 4Q 2016. Exterior building finishes, architectural features and entry portals commence 1Q 2016 and complete 4Q 2016. • Grounds & Pools: Commence (1Q 2016) landscape, hardscape, construction and FF&E. Completed by 4Q 2016. Project Estimate: $65M See Exhibit B for Positioning Statement |
|
|
/ Wailea Beach Marriott Resort & Spa [Value Creation] SUNSTONE HOTEL INVESTORS, INC. 30 Our comprehensive plan will reposition the Marriott as a highly competitive destination resort. Post-renovation, we expect performance at the Wailea Beach Marriott Resort & Spa to increase meaningfully. RevPAR Opportunity Pro Forma Expectations $175 $200 $225 $250 $275 $300 $325 $10,000 $15,000 $20,000 $25,000 $30,000 $35,000 2013 Stabilized Period Wailea Beach Marriott Resort & Spa: Projections EBITDA (000s) (L) RevPAR (R) Expected Post-Renovation EBITDA & RevPAR Range . Trip Advisor Rank 39th (currently out of 53 hotels) to Top 10. . STR RevPAR Index from low 90s (currently) to above 102 – 107. . Our repositioning program is aimed at materially enhancing the resort’s long-term RevPAR potential. . In the near-term, our asset management initiatives are expected to yield noticeable performance results. (1) Represents expected post-renovation performance. Target Market Positioning Metrics |
|
|
/ Hyatt Regency San Francisco [Value Creation] SUNSTONE HOTEL INVESTORS, INC. 31 2014 2015 2016 • Standard Guestrooms: Clean up all 660 standard guestrooms with a complete soft goods and select case goods renovation of guestrooms, baths and corridors (Complete Q2 2014). • Suites: Update existing suites and redesign four themed suites to provide a “wow” factor for meeting planners (Q4 2014 – Q1 2015). • Operations: Work with Hyatt to bring total hotel management staffing levels more inline with comparable hotels in our portfolio (FY 2014). • F&B: Work with Hyatt and the union to design lobby F&B that meet guest expectations and minimize cost (2H 2014). Our renovation program for the Hyatt Regency San Francisco is already enhancing the guest experience and improving our ability to drive rate. • Lobby Renovation: Execute a full lobby renovation resulting in a functional and efficient space. Due to the size of the atrium, the renovation will be phased throughout the year (FY 2015). • Meeting Space: Standard cyclical renovation of the existing meeting space. We will phase the meeting room refresh as we have done in D.C. and San Diego, completing sections throughout the year in a non-disruptive manner (2015). • Sense of Arrival: Update the sense of arrival to convey an upscale and modern feel (2H 2015). • Infrastructure: Façade and curb work. Project Estimate: $43 million See Exhibit C for Positioning Statement |
|
|
/ Hyatt Regency San Francisco [Value Creation] SUNSTONE HOTEL INVESTORS, INC. 32 Performance at the Hyatt Regency San Francisco is improving markedly following the completion of the rooms renovation in Q1 2014. We expect near-term performance to continue to exceed our initial underwriting. RevPAR Opportunity Stabilized Pro Forma Expectations . Trip Advisor Rank 85th (currently out of 237 hotels) to Top 50. . STR RevPAR Index from low 100s (currently) to 108 – 112. $200 $225 $250 $275 $300 $15,000 $17,000 $19,000 $21,000 $23,000 $25,000 $27,000 $29,000 2013 Stabilized Period Hyatt Regency San Francisco: Projections EBITDA (000s) (L) RevPAR (R) Expected Post-Renovation EBITDA & RevPAR Range 100% 102% 104% 106% 108% 110% 112% 114% RevPAR Index Potential Current RevPAR Index RevPAR Index Potential Stabilized Index Implies $10 - $15 of RevPAR Pickup (in 2014$) Target Market Positioning Metrics |
|
|
[2015 & Beyond] |
|
|
/ Compelling Investment Factors [2015 & Beyond] SUNSTONE HOTEL INVESTORS, INC. 34 Industry • Positive Fundamentals Portfolio • Strong Markets, Renovation Upside Balance Sheet • Appropriately Geared Capital Structure COMPANY PRESENTATION |
|
|
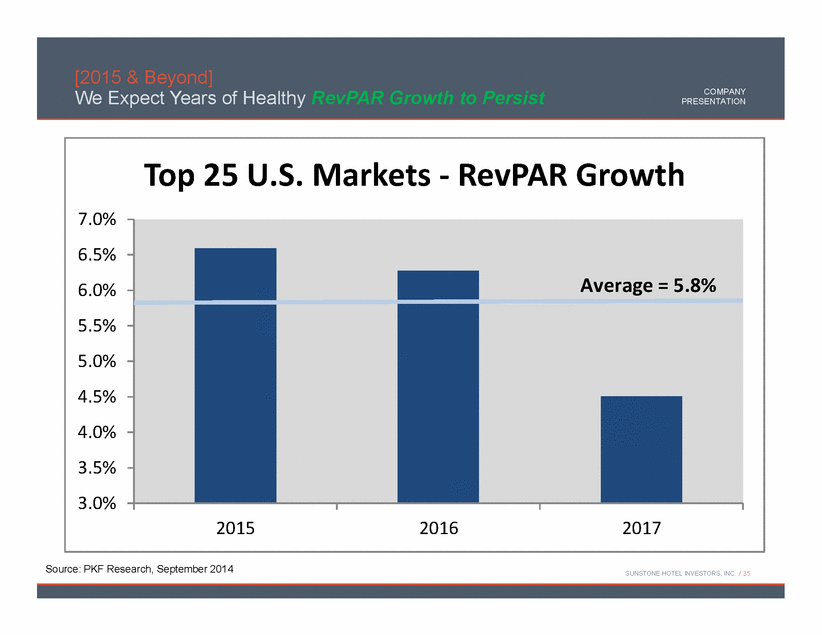
/ We Expect Years of Healthy RevPAR Growth to Persist [2015 & Beyond] SUNSTONE HOTEL INVESTORS, INC. 35 Source: PKF Research, September 2014 COMPANY PRESENTATION 3.0% 3.5% 4.0% 4.5% 5.0% 5.5% 6.0% 6.5% 7.0% 2015 2016 2017 Top 25 U.S. Markets - RevPAR Growth Average = 5.8% |
|
|
/ Our Hotels are Located in Prime Growth Markets [2015 & Beyond] SUNSTONE HOTEL INVESTORS, INC. 36 COMPANY PRESENTATION (1) Oahu is used as a proxy for Maui in calculating the SHO Average. (2) Salt Lake City is used as a proxy for Park City in calculating the SHO Average. Source: PKF Research, September 2014. RevPAR CAGRs (2014 – 2018). 6.58% 5.98% 5.87% 5.42% 5.40% 5.39% 5.29% 5.29% 5.27% 5.26% 5.23% 5.19% 5.07% 4.67% 4.61% 4.61% 4.59% 4.50% 4.20% 4.43% 3.71% 3.67% 3.58% 3.54% 3.32% 3.24% 3.23% Denver Anaheim-Orange County Los Angeles Tampa Oahu (1) Miami Dallas Boston Minneapolis Chicago Orlando San Francisco Baltimore SHO Average San Diego Atlanta Portland Fort Lauderdale U.S. Upper-Upscale Phoenix New York City Washington, D.C. New Orleans Salt Lake City (2) Philadelphia Houston Seattle SHO Markets Non- SHO Markets |
|
|
/ If History is a Guide, Lodging Stocks are Well Positioned for Growth [2015 & Beyond] SUNSTONE HOTEL INVESTORS, INC. 37 Source: MLV Equity Research COMPANY PRESENTATION 0 50 100 150 200 250 1 13 25 37 49 61 73 85 97 109 121 Months from Prior Peak Stock Returns Peak to Peak 90's Cycle Stock Index 2000's Cycle Stock Index Current Cycle Stock Index We are here |
|
|
[Exhibits] |
|
|
/ Boston Park Plaza – Positioning Statement [Exhibit A] SUNSTONE HOTEL INVESTORS, INC. 39 Product – Our total hotel renovation will: • Remove the current negatives associated with the product’s age and engage the guest with sensible design and modern comforts from arrival to departure. . • Allow the property to become neighborhood-centric; being warm with modern touches, featuring a lobby that engages the customer with a bar-centric experience and unique surrounding tenants, such as Hermes, Strip by Strega, David Barton’s Gym, Starbucks, and other retailors who are complementary to holistic guest experience. • Materially offset the small size of guest rooms via a design that is uncluttered and efficient; refresh and modernize the bathrooms. Operations – We expect: • That as we complete the major phases of the renovation, the hotel sales team will begin to sell with much higher confidence, garnering higher group rates, thus building a platform for higher transient rates. • Given ongoing Boston market strength, once the guest rooms are completed, we currently expect to exceed the long-term underwriting of the hotel, both in revenue and EBITDA as the reputation of the hotel improves dramatically through the repositioning process. Experience – The guest experience will: • Become positive and satisfying. Total hotel service re-training – highlighted by the creation of an entire new hotel operating culture, new written service standards, job behavioral essence, and job promises for each and every position in the hotel, new check-in process including free flowing pods, and the bar-centric lobby – will be the essence of guest engagement. We will activate all the hotel spaces, centered around the lobby, and focus on adding other service offerings built around health & fitness, innovation & technology, and the “best of Boston.” Guest Experience Product Operations Guest Experience |
|
|
/ Wailea Beach Marriott Resort & Spa – Positioning Statement [Exhibit B] SUNSTONE HOTEL INVESTORS, INC. 40 Product – Our total hotel renovation will: • Enable us to capitalize on the hotel’s exceptional location by creating a well-defined, cohesive destination resort experience. • Create a dramatic arrival experience, enhancing the current drive and providing significant service upgrades. We will expand and re-orient the lobby towards the ocean, creating dramatic and intimate spaces, and improved views. We will reinvent the F&B concept with a fresh new resort-directed concept, and optimize the currently underutilized Mala Restaurant space. We will redesign two of the three pools to create a fresh and upscale family pool and kids pool experiences with accompanying F&B. • Reinvigorate the resort’s landscaping, grounds and offerings and refresh all guest rooms, also ensuring that the resort has the best available guest technology from one end to the other. Operations – We expect: • That during 2015 the work being done will be less intrusive: meeting spaces, guest rooms, landscaping and possibly lobby Lanai work. We expect to improve the service culture enhancements as well. • 2016 will see outdoor pool projects that will impact demand. Throughout 2016 we expect the sales team to be able to sell strongly into the future and meet or exceed our 2017 and 2018 expectations with a complete repositioning of the resort. Experience – The guest experience will: • Go from unmemorable to unforgettable! The new experience will be centered on the lobby, grounds and pools. Lighting, music and fire and water elements will be implemented throughout the entire campus creating an emotional guest response. • Improve interaction / visual connectivity with the natural surroundings and create defining family, “tween,” and adult activity spaces for individuals, couples and families. • Marriott will enhance the guest experience from front driveway recognition, communication and welcome check-in processes, to enhanced room types and additional views. Guest recognition, advance planning with new or existing third party concierge and activity desks will create a consistent and memorable resort activity program. Product Operations Guest Experience |
|
|
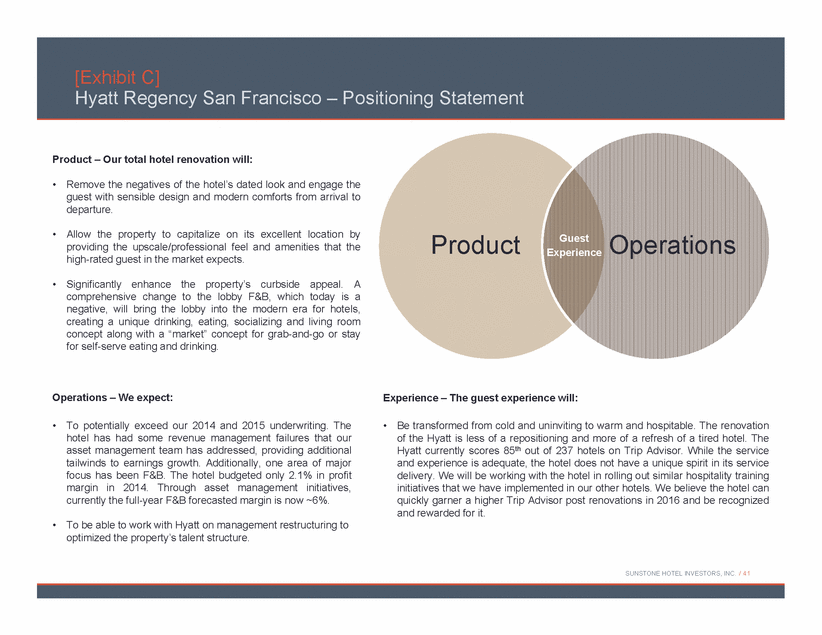
/ Hyatt Regency San Francisco – Positioning Statement [Exhibit C] SUNSTONE HOTEL INVESTORS, INC. 41 Product – Our total hotel renovation will: • Remove the negatives of the hotel’s dated look and engage the guest with sensible design and modern comforts from arrival to departure. • Allow the property to capitalize on its excellent location by providing the upscale/professional feel and amenities that the high-rated guest in the market expects. • Significantly enhance the property’s curbside appeal. A comprehensive change to the lobby F&B, which today is a negative, will bring the lobby into the modern era for hotels, creating a unique drinking, eating, socializing and living room concept along with a “market” concept for grab-and-go or stay for self-serve eating and drinking. Operations – We expect: • To potentially exceed our 2014 and 2015 underwriting. The hotel has had some revenue management failures that our asset management team has addressed, providing additional tailwinds to earnings growth. Additionally, one area of major focus has been F&B. The hotel budgeted only 2.1% in profit margin in 2014. Through asset management initiatives, currently the full-year F&B forecasted margin is now ~6%. • To be able to work with Hyatt on management restructuring to optimized the property’s talent structure. Experience – The guest experience will: • Be transformed from cold and uninviting to warm and hospitable. The renovation of the Hyatt is less of a repositioning and more of a refresh of a tired hotel. The Hyatt currently scores 85th out of 237 hotels on Trip Advisor. While the service and experience is adequate, the hotel does not have a unique spirit in its service delivery. We will be working with the hotel in rolling out similar hospitality training initiatives that we have implemented in our other hotels. We believe the hotel can quickly garner a higher Trip Advisor post renovations in 2016 and be recognized and rewarded for it. Product Operations Guest Experience |

