Attached files
| file | filename |
|---|---|
| 8-K - 8-K - Armada Hoffler Properties, Inc. | d812177d8k.htm |
| EX-99.1 - EX-99.1 - Armada Hoffler Properties, Inc. | d812177dex991.htm |
 Armada
Hoffler Properties, Inc. Third Quarter 2014 Supplemental Information
1
Exhibit 99.2 |
 Table of
Contents 2
Forward Looking Statements
3
Corporate Profile
4
Quarter Results and Financial Summary
5
Highlights
6
2014 Outlook
7
Summary Information
8
Summary Balance Sheet
9
Summary Income Statement
10
Core FFO & AFFO
11
Summary of Outstanding Debt
12
Core Debt to Core EBITDA
13
Debt Information
14
Portfolio Summary & Business Segment Overview
15
Stabilized Portfolio Summary
16
Stabilized Portfolio Summary Footnotes
17
Development Pipeline
18
Acquisitions & Dispositions
19
Construction Business Summary
20
Operating Results & Property-Type Segment Analysis
21
Same Store NOI by Segment
22
Top 10 Tenants by Annual Base Rent
23
Office Lease Summary
24
Retail Lease Summary
26
Historical Occupancy
28
Net Asset Value Component Data
31
Appendix - Definitions & Reconciliations
32
Definitions
33
Reconciliations
37 |
 Forward
Looking Statements 3
This Supplemental Information should be read in conjunction with
our Quarterly Report on Form 10-Q for
the quarter ended September 30, 2014, and the unaudited consolidated financial
statements appearing in our press release dated October 31, 2014, which has been
furnished as Exhibit 99.1 to our Form 8-K filed on October 31, 2014.
The Company makes statements in this Supplemental Information that are forward-
looking statements within the meaning of the Private Securities Litigation Reform Act
of 1995 (set forth in Section 27A of the Securities Act of 1933, as amended (the
“Securities Act”), and Section 21E of the Securities Exchange Act of
1934, as amended (the “Exchange Act”)). In particular, statements pertaining
to our capital resources, portfolio performance and results of operations contain
forward-looking statements. Likewise, all of our statements regarding
anticipated growth in our funds from operations, core funds from operations,
adjusted funds from operations, funds available for distribution and net
operating income are forward-looking statements. You can identify
forward-looking statements by the use of forward-looking terminology
such as “believes,” “expects,”
“may,”
“will,”
“should,”
“seeks,”
“approximately,”
“intends,”
“plans,”
“estimates”
or “anticipates”
or the negative of these words and
phrases or similar words or phrases which are predictions of or indicate future events
or trends and which do not relate solely to historical matters. You can also
identify forward-looking statements by discussions of strategy, plans or
intentions. Forward-looking statements involve numerous risks and
uncertainties and you should not rely on them as predictions of future events.
Forward-looking statements depend on assumptions, data or methods which
may
be
incorrect
or
imprecise
and
the
Company
may
not
be
able
to
realize
them.
The
Company
does
not
guarantee
that
the
transactions
and
events
described
will
happen
as
described
(or
that
they
will
happen
at all). For further discussion of risk factors and other events that could
impact our future results, please refer
to
the
section
entitled
“Risk
Factors”
in
our
most
recent
Annual
Report
on
Form
10-K
filed
with
the
Securities and Exchange Commission (the “SEC”), and the documents
subsequently filed by us from time to time with the SEC.
|
 Corporate Profile
4
Corporate Information
Management & Board
Board of Directors
Corporate Officers
Daniel A. Hoffler
Executive Chairman of the Board
Louis S. Haddad
President and Chief Executive Officer
A. Russell Kirk
Vice Chairman of the Board
Anthony P. Nero
President of Development
Louis S. Haddad
Director
Shelly R. Hampton
President of Asset Management
John W. Snow
Lead Independent Director
Eric E. Apperson
President of Construction
George F. Allen
Independent Director
Michael P. O’Hara
Chief Financial Officer and Treasurer
James A. Carroll
Independent Director
Eric L. Smith
Vice President of Operations and Secretary
James C. Cherry
Independent Director
Joseph W. Prueher
Independent Director
Analyst Coverage
Janney, Montgomery, & Scott LLC
Raymond James & Associates
Robert W. Baird & Co.
Stifel, Nicolaus & Company, Inc.
Wunderlich Securities
Michael Gorman
Richard Mulligan
David Rodgers
John Guinee
Craig Kucera
(215) 665-6224
(727) 567-2660
(216) 737-7341
(443) 224-1307
(540) 277-3366
mgorman@janney.com
rj.milligan@raymondjames.com
drodgers@rwbaird.com
jwguinee@stifel.com
ckucera@wundernet.com
Investor Relations Contact
Julie Loftus Trudell
Vice President of Investor Relations
(757) 366-6692
jtrudell@armadahoffler.com
Armada Hoffler Properties, Inc. (NYSE: AHH)
is a full service real estate company that develops, constructs, and owns institutional grade
office, retail, and multifamily properties in the Mid-Atlantic United States.
The Company also provides general contracting and development services to third-party clients
throughout the Mid-Atlantic and Southeastern regions. Armada Hoffler Properties,
Inc. was founded in 1979 and is headquartered in Virginia Beach, VA. The Company
has elected to be taxed as a real estate investment trust (REIT) for U.S. federal income tax purposes. |
 Third
Quarter Results and Financial Summary |
 Highlights
Funds From Operations (“FFO”) of $7.3 million, or $0.21 per diluted share,
for the quarter ended September 30, 2014.
Core FFO of $7.5 million, or $0.22 per diluted share, for the quarter ended September
30, 2014. Occupancy up to 95.1%, compared to 94.6% as of June 30, 2014.
Increased GAAP and Cash Same Store Net Operating Income (“NOI”) 4% and 2%,
respectively, compared to the third quarter of 2013.
Delivered
approximately
83,000
square
feet
of
office
space
to
Clark
Nexsen
–
the
anchor
tenant
in
the
new
4525
Main
Street
tower.
Delivered the initial units at both Encore Apartments and Whetstone Apartments in
September 2014. Leased
substantially
all
of
the
remaining
vacant
retail
space
at
the
Town
Center
of
Virginia
Beach.
Completed
the
previously
announced
acquisition
of
Dimmock
Square,
a
106,000
square
foot
retail
power
center
located
in
Colonial
Heights,
Virginia.
Completed
an
underwritten
public
offering
of
5.75
million
shares
of
common
stock
at
$9.05
per
share,
generating
net
proceeds
of
$49.3
million.
Entered into a preliminary agreement to sell the Sentara Williamsburg office building
for approximately $15.4 million, representing an implied cap rate of
6.3%.
Construction contract backlog of $153.5 million as of September 30, 2014.
6 |
 2014
Outlook 7
Current Parameters
Previous Parameters
As of September 30, 2014
As of June 30, 2014
Core FFO
(excluding the impact from non-stabilized projects)
Approximately $29.0 million
Approximately $27.5 million
General & administrative expenses
Approximately $7.6 million
Approximately $7.6 million
Construction company annual segment gross profit
Approximately $4.6 million
Approximately $4.3 million
Non-stabilized projects - negative impact to FFO
(excluded from Core FFO)
Approximately $400,000
Approximately $1.0 million
|
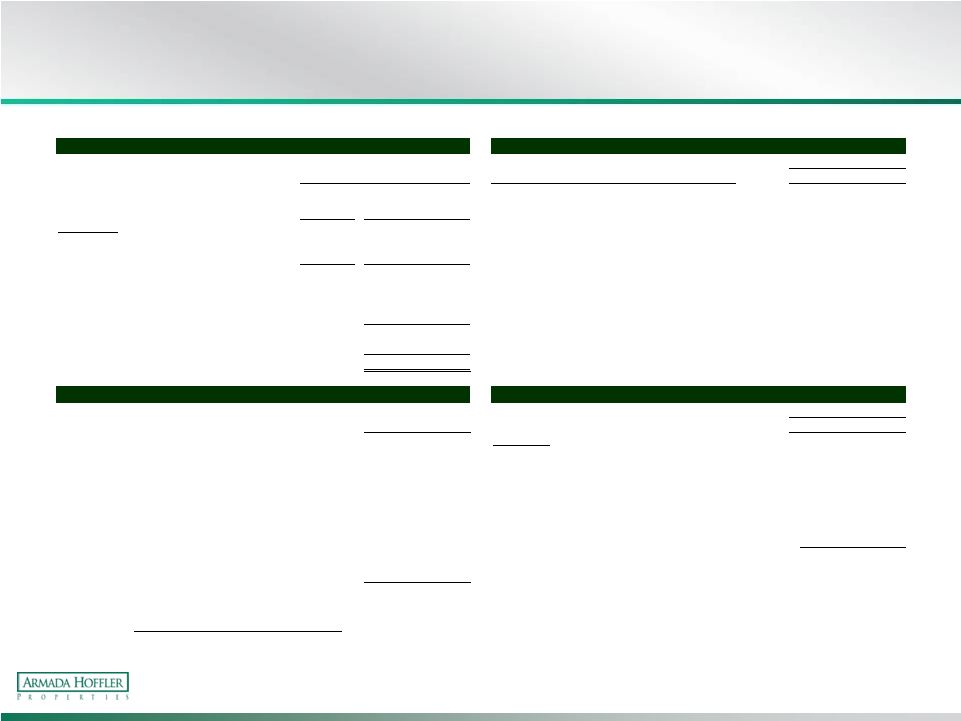 Summary
Information 8
$ in thousands, except per share
Market Capitalization
Key Financials
9/30/2014
Financial Information:
9/30/2014
% of Total
Equity
Total Market
Capitalization
Rental revenues
$16,713
Market Data
General contracting and real estate services revenues
31,532
Total Common Shares Outstanding
63%
25,018,733
Rental properties Net Operating Income (NOI)
10,819
Operating Partnership ("OP") Units
Outstanding 37%
14,775,967
General contracting and real estate services gross profit
1,064
Common shares and OP units
outstanding 100%
39,794,700
Net income
2,754
Market price per common
share $9.08
Funds From Operations (FFO)
7,321
Equity market
capitalization $361,336
FFO per diluted share
$0.21
Total debt
335,792
Core FFO
7,530
Total market capitalization
$697,128
Core FFO per diluted share
$0.22
Less: cash
(21,526)
Total enterprise value
$675,602
Weighted Average Shares/Units Outstanding
34,557,129
Stable Portfolio Metrics
Debt Metrics
9/30/2014
9/30/2014
Rentable square feet or number of units:
Key Metrics
Office
(1)
949,789
Core debt/enterprise value
35.7%
Retail
(2)
1,198,207
Multifamily
(3)
626
Fixed
charge coverage ratio: Core EBITDA
$9,986
Occupancy:
Interest
2,734
Office
(4)
94.8%
Principal
771
Retail
(4)
94.7%
Total Fixed Charges
3,505
Multifamily
(5)
96.6%
Fixed charge coverage ratio
2.85x
Weighted Average
(6)
95.1%
Core Debt/Annualized Core EBITDA
6.0x
Three months ended
Three months ended
(1) Excludes 4525 Main Street
(2) Excludes Greentree Shopping Center
(3) Excludes Liberty, Encore, and Whetstone Apartments
(4) Office and retail occupancy based on leased square feet as a % of respective tota
(5) Multifamily occupancy based on occupied units as a % of respective total
(6) Total occupancy weighted by annualized base rent |
 Summary
Balance Sheet 9
$ in thousands
9/30/2014
12/31/2013
Assets
(Unaudited)
Real estate investments:
Income producing property
$499,661
$406,239
Construction in progress
93,946
56,737
Accumulated depreciation
(115,839)
(105,228)
Net real estate investments
477,768
357,748
Cash and cash equivalents
17,101
18,882
Restricted cash
4,425
2,160
Accounts receivable, net
20,307
18,272
Construction receivables, including retentions
15,285
12,633
Costs and estimated earnings in excess of billings
40
1,178
Other assets
32,409
24,409
Total Assets
$567,335
$435,282
Liabilities and Equity
Indebtedness
$335,792
$277,745
Accounts payable and accrued liabilities
7,569
6,463
Construction payables, including retentions
39,820
28,139
Billings in excess of costs and estimated earnings
3,420
1,541
Other liabilities
17,979
15,873
Total Liabilities
404,580
329,761
Total Equity
162,755
105,521
Total Liabilities and Equity
$567,335
$435,282
As of |
 Summary
Income Statement 10
$ in thousands
Three months ended
Nine months ended
9/30/2014
9/30/2013
9/30/2014
9/30/2013
Revenues
(Unaudited)
Rental revenues
$16,713
$14,899
$47,225
$42,528
General contracting and real estate services
31,532
21,896
71,261
63,143
Total Revenues
48,245
36,795
118,486
105,671
Expenses
Rental expenses
4,414
3,840
12,230
10,468
Real estate taxes
1,480
1,317
4,231
3,777
General contracting and real estate services
30,468
20,907
67,807
60,868
Depreciation and amortization
4,567
3,933
12,593
11,112
General and administrative
1,741
1,638
5,768
5,212
Acquisition, development & other pursuit costs
174
-
174
-
Impairment charges
15
-
15
533
Total Expenses
42,859
31,635
102,818
91,970
Operating Income
5,386
5,160
15,668
13,701
Interest expense
(2,734)
(2,598)
(7,977)
(9,802)
Loss on extinguishment of debt
-
(1,127)
-
(2,252)
Gain on acquisitions
-
-
-
9,460
Other income (loss)
59
(109)
(23)
343
Income before taxes
2,711
1,326
7,668
11,450
Income tax benefit (provision)
43
(74)
(135)
137
Net Income
$2,754
$1,252
$7,533
$11,587 |
 Core
FFO & AFFO 11
$ in thousands, except per share
(1) Excludes tenant improvements and leasing commissions on first generation rental
space. Three months ended
Nine months ended
9/30/2014
9/30/2014
(Unaudited)
Net income
$2,754
$7,533
Depreciation and amortization
4,567
12,593
FFO
7,321
20,126
FFO per weighted
average share $0.21
$0.60
Core FFO
Adjustments
Non-cash stock compensation
198
720
Impairment charges
15
15
Acquisition costs
174
174
Non-stabilized development pipeline adjustments
(178)
384
Core FFO
7,530
21,419
Core FFO per
weighted average share $0.22
$0.64
AFFO
Adjustments
Non-Stabilized development pipeline adjustments
178
(384)
Acquisition costs
(174)
(174)
Tenant improvements, leasing commissions
(1)
(981)
(2,197)
Leasing
incentives (65)
(128)
Property related capital expenditures
(355)
(896)
Non cash interest expense
117
410
GAAP Adjustments
Net effect of straight-line rents
(803)
(1,493)
Amortization of lease incentives and above (below) market rents
144
461
Derivative (income) losses
(46)
123
Government development grants
300
300
AFFO
5,845
17,441
AFFO per weighted
average share $0.17
$0.52 |
 Summary
of Outstanding Debt 12
$ in thousands
(1) LIBOR rate is determined by individual lenders.
(2) Subject to an interest rate swap lock.
(3) Principal balance excluding any fair value
adjustment recognized upon acquisition.
(4) Excludes fair value adjustment
Debt
Amount
Outstanding
Interest Rate
(1)
Effective Rate as of
September 30, 2014
Maturity Date
Balance at
Maturity
Virginia Beach Town Center
249 Central Park Retail
$15,635
5.99%
September 8, 2016
$15,084
South Retail
6,898
5.99%
September 8, 2016
6,655
Studio 56 Retail
2,636
3.75%
May 7, 2015
2,592
Commerce Street Retail
5,566
LIBOR +2.25%
2.41%
October 31, 2018
5,264
Fountain Plaza Retail
7,818
5.99%
September 8, 2016
7,542
Dick's at Town Center
8,242
LIBOR+2.75%
2.91%
October 31, 2017
7,889
The Cosmopolitan
47,282
3.75%
July 1, 2051
-
Diversified Portfolio
Oyster Point
6,323
5.41%
December 1, 2015
6,089
Broad Creek Shopping Center
Note 1
4,465
LIBOR +2.25%
2.41%
October 31, 2018
4,223
Note 2
8,197
LIBOR +2.25%
2.41%
October 31, 2018
7,752
Note 3
3,432
LIBOR +2.25%
2.41%
October 31, 2018
3,246
Hanbury Village
Note 1
21,278
6.67%
October 11, 2017
20,499
Note 2
4,108
LIBOR +2.25%
2.41%
October 31, 2018
3,777
Harrisonburg Regal
3,706
6.06%
June 8, 2017
3,165
North Point Center
Note 1
10,193
6.45%
February 5, 2019
9,333
Note 2
2,775
7.25%
September 15, 2025
1,344
Note 4
1,011
5.59%
December 1, 2014
1,007
Note 5
690
LIBOR+2.00%
3.57%
(2)
February 1, 2017
641
Tyre Neck Harris Teeter
2,449
LIBOR +2.25%
2.41%
October 31, 2018
2,235
Smith's Landing
24,551
LIBOR+2.15%
2.31%
January 31, 2017
23,793
187,255
132,130
Credit Facility
54,000
LIBOR + 1.60% - 2.20%
2.11%
May 13, 2016
54,000
Total including Credit Facility
$241,255
$186,130
Development Pipeline
4525 Main Street
29,600
LIBOR+1.95%
2.11%
January 30, 2017
29,600
Encore Apartments
19,568
LIBOR+1.95%
2.11%
January 30, 2017
19,568
Whetstone Apartments
12,651
LIBOR+1.90%
2.06%
October 8, 2016
12,651
Sandbridge Commons
5,092
LIBOR+1.85%
2.01%
January 17, 2018
5,092
Liberty Apartments
20,673
(3)
5.66%
November 1, 2043
-
Oceaneering
7,699
LIBOR+1.75%
1.91%
February 28, 2018
7,699
Commonwealth of Virginia - Chesapeake
709
LIBOR+1.90%
2.06%
August 28, 2017
709
Total Notes Payable -
Development Pipeline 95,992
75,319
Unamortized fair value adjustments
(1,455)
Total Notes Payable
$335,792
$261,449
3Q 2014
Year to Date
Capitalized Interest
$698
$1,958
Weighted Average Fixed Interest Rate
5.3%
Weighted Average Variable Interest Rate
2.2%
Total Weighted Average Interest Rate
(4)
3.5%
Variable Interest Rate as a % of Total (excluding interest rate caps)
(4)
56.0%
Weighted Average Maturity (years)
(4)
9.0 |
 Core
Debt to Core EBITDA 13
$ in thousands
Three months
ended 9/30/2014
9/30/2014
(Unaudited)
(Unaudited)
Net Income
$2,754
Total Debt
$335,792
Excluding:
Excluding:
Interest Expense
2,734
Development Pipeline Unstabilized Debt
(94,538)
Income Tax
(43)
Depreciation and amortization
4,567
Core Debt
$241,254
EBITDA
10,012
Additional Adjustments:
Non-recurring or extraordinary (gains) losses
-
Early extinguishment of debt
-
Core Debt/Annualized Core EBITDA
6.0x
Derivative (income) losses
(46)
Non-cash stock compensation
198
Development Pipeline
(178)
Total Other Adjustments
(26)
Core EBITDA
9,986
Annualized Core EBITDA
$39,944 |
 Debt
Information 14
$ in thousands
Interest Rate Cap Agreements At or Below 1.50%
Effective Date
Maturity Date
Strike Rate
Notional Amount
May 31, 2012
May 29, 2015
1.09%
$8,950
September 1, 2013
March 1, 2016
1.50%
40,000
October 4, 2013
April 1, 2016
1.50%
18,500
March 14, 2014
March 1, 2017
1.25%
50,000
Total Interest Rate Caps at or Below 1.50%
$117,450
Fixed Debt Outstanding (excludes fair value adjustment)
146,918
Total Fixed Interest Rate Debt (including caps)
$264,368
Fixed Interest Rate Debt as a % of Total
78% |
 Portfolio Summary & Business
Segment Overview |
 Stabilized Portfolio Summary
16
As of 9/30/2014
Property
Location
Year Built
Net Rentable
Square Feet
(1)
% Leased
(2)
Annualized
Base Rent
(3)
Annualized
Base Rent per
Leased Sq. Ft.
(3)
Average Net
Effective
Annual Base
Rent per
Leased Sq. Ft.
(4)
Office Properties
Armada Hoffler Tower
(5)
Virginia Beach, VA
2002
323,966
95.6%
$8,055,758
$26.02
$27.56
One Columbus
Virginia Beach, VA
1984
129,424
100.0%
3,004,179
23.21
23.15
Two Columbus
Virginia Beach, VA
2009
109,091
90.7%
2,527,929
25.55
25.75
Virginia Natural Gas
Virginia Beach, VA
2010
31,000
100.0%
568,230
18.33
20.17
Richmond Tower
Richmond, VA
2010
206,969
98.0%
7,569,747
37.32
42.07
Oyster Point
Newport News, VA
1989
100,139
79.2%
1,749,151
22.06
21.49
Sentara Williamsburg
(6)
Williamsburg, VA
2008
49,200
100.0%
1,006,140
20.45
20.50
Subtotal / Weighted Average Office Portfolio
(7)
949,789
94.8%
$24,481,134
$27.19
$28.82
Retail Properties Not Subject to Ground Lease
Bermuda Crossroads
Chester, VA
2001
111,566
98.6%
1,491,853
13.57
13.79
Broad Creek Shopping Center
Norfolk, VA
1997-2001
227,691
97.3%
3,102,578
14.00
12.61
Courthouse 7-Eleven
Virginia Beach, VA
2011
3,177
100.0%
125,000
39.35
43.81
Gainsborough Square
Chesapeake, VA
1999
88,862
96.5%
1,342,034
15.64
15.37
Hanbury Village
Chesapeake, VA
2006-2009
61,049
86.4%
1,300,035
24.66
24.42
North Point Center
Durham, NC
1998-2009
215,690
92.1%
2,349,473
11.82
11.83
Parkway Marketplace
Virginia Beach, VA
1998
37,804
100.0%
734,111
19.42
20.02
Harrisonburg Regal
Harrisonburg, VA
1999
49,000
100.0%
683,550
13.95
13.95
Dick's at Town Center
Virginia Beach, VA
2002
100,804
83.3%
798,000
9.50
9.58
249 Central Park Retail
Virginia Beach, VA
(8)
2004
91,171
94.8%
2,493,554
28.84
27.97
Studio 56 Retail
Virginia Beach, VA
2007
11,600
84.8%
371,200
37.75
40.21
Commerce Street Retail
(9)
Virginia Beach, VA
2008
19,173
100.0%
781,588
40.77
40.61
Fountain Plaza Retail
Virginia Beach, VA
2004
35,961
100.0%
970,230
26.98
26.21
South Retail
(24)
Virginia Beach, VA
2002
38,493
88.2%
791,578
23.30
26.53
Dimmock Square
Colonial Heights, VA
1998
106,166
100.0%
1,767,178
16.65
17.05
Subtotal / Weighted Avg Retail Portfolio not Subject to Ground Leases
(10)
1,198,207
94.7%
$19,101,961
$16.84
$16.66
Retail Properties Subject to Ground Lease
Bermuda Crossroads
(11)
Chester, VA
2001
(13)
100.0%
163,350
Broad Creek Shopping Center
(12)
Norfolk, VA
1997-2001
(14)
100.0%
579,188
Hanbury Village
(11)
Chesapeake, VA
2006-2009
(15)
100.0%
1,067,598
North Point Center
(11)
Durham, NC
1998-2009
(16)
100.0%
1,062,784
Tyre Neck Harris Teeter
(12)
Portsmouth, VA
2011
(17)
100.0%
508,134
Subtotal / Weighted Avg Retail Portfolio Subject to Ground Leases
100.0%
$3,381,055
Total / Weighted Avg Retail Portfolio
1,198,207
(18)
94.7%
$22,483,016
$16.84
$16.66
Total / Weighted Average Retail and Office Portfolio
2,147,996
94.7%
$46,964,150
$21.42
$22.04
Property
Location
Year Built
Units
(19)
% Leased
(2)
Annualized
Base Rent
(20)
Average
Monthly Base
Rent per
Leased Unit
(21)
Multifamily
Smith's Landing
(22)
Blacksburg, VA
2009
284
96.5%
$3,379,428
$1,027.81
The Cosmopolitan
Virginia Beach, VA
2006
342
96.8%
7,116,900
1,565.68
Total / Weighted Avg Multifamily Portfolio
626
96.6%
$10,496,328
$1,322.08 |
 Stabilized Portfolio Summary Footnotes
17
1)
The net rentable square footage for each of our office properties is the sum of (a) the square
footages of existing leases, plus (b) for available space, management’s estimate of net rentable square footage based, in part, on past
leases. The net rentable square footage included in office leases is generally determined
consistently with the Building Owners and Managers Association, or BOMA, 1996 measurement guidelines. The net rentable square
footage for each of our retail properties is the sum of (a) the square footages of existing
leases, plus (b) for available space, the field verified square footage.
2)
Percentage leased for each of our office and retail properties is calculated as (a) square
footage under executed leases as of September 30, 2014, divided by (b) net rentable square feet, expressed as a percentage. Percentage
leased for our multifamily properties is calculated as (a) total units occupied as of
September 30, 2014, divided by (b) total units available, expressed as a percentage.
3)
For the properties in our office and retail portfolios, annualized base rent is calculated by
multiplying (a) base rental payments for executed leases as of September 30, 2014 (defined as cash base rents (before abatements)
excluding tenant reimbursements for expenses paid by the landlord), by (b) 12. Annualized base
rent per leased square foot is calculated by dividing (a) annualized base rent, by (b) square footage under commenced leases as of
September 30, 2014. In the case of triple net or modified gross leases, annualized base rent
does not include tenant reimbursements for real estate taxes, insurance, common area or other operating expenses.
4)
Average net effective annual base rent per leased square foot represents (a) the contractual
base rent for leases in place as of September 30, 2014, calculated on a straight-line basis to amortize free rent periods and
abatements, but without regard to tenant improvement allowances and leasing commissions,
divided by (b) square footage under commenced leases as of September 30, 2014.
5)
As of September 30, 2014, the Company occupied 16,151 square feet at this property at an
annualized base rent of $446,172 or $29.40 per leased square foot, which amounts are reflected in the % leased, annualized base rent
and annualized base rent per square foot columns in the table above. The rent paid by us is
eliminated from our revenues in consolidation. In addition, effective March 1, 2013, the Company sublease approximately 5,000
square feet of space from a tenant at this property.
6)
This property is subject to a triple net lease pursuant to which the tenant pays operating
expenses, insurance and real estate taxes.
7)
Includes square footage and annualized base rent pursuant to leases for space occupied by us.
8)
As of September 30, 2014, the Company occupied 8,995 square feet at this property at an
annualized base rent of $287,300, or $31.94 per leased square foot, which amounts are reflected in the % leased, annualized base rent
and annualized base rent per square foot columns in the table above. The rent paid by us is
eliminated from our revenues in consolidation.
9)
Includes $31,200 of annualized base rent pursuant to a rooftop lease.
10)
Reflects square footage and annualized base rent pursuant to leases for space occupied by AHH.
11)
For this ground lease, the Company own the land and the tenant owns the improvements
thereto. The Company will succeed to the ownership of the improvements to the land upon the termination of the ground lease.
12)
The Company lease the land underlying this property from the owner of the land pursuant to a
ground lease. The Company re-lease the land to our tenant under a separate ground lease pursuant to which our tenant owns the
improvements on the land.
13)
Tenants collectively lease approximately 139,356 square feet of land from us pursuant to
ground leases.
14)
Tenants collectively lease approximately 299,170 square feet of land from us pursuant to
ground leases.
15)
Tenants collectively lease approximately 105,988 square feet of land from us pursuant to
ground leases.
16)
Tenants collectively lease approximately 1,443,985 square feet of land from us pursuant to
ground leases.
17)
Tenant leases approximately 200,073 square feet of land from us pursuant to a ground lease.
18)
The total square footage of our retail portfolio excludes the square footage of land subject
to ground leases.
19)
Units represent the total number of apartment units available for rent at September 30, 2014.
20)
For the properties in our multifamily portfolio, annualized base rent is calculated by
multiplying (a) base rental payments for the month ended September 30, 2014 by (b) 12.
21)
Average monthly base rent per leased unit represents the average monthly rent for all leased
units for the month ended September 30, 2014.
22)
The Company lease the land underlying this property from the owner of the land pursuant to a
ground lease.
23)
The annualized base rent for The Cosmopolitan includes $898,000 of annualized rent from 15
retail leases at the property.
24)
As of September 30, 2014, The Company occupied 2,908 square feet at this property at an
annualized base rent of $12,000, or $4.13 per leased square foot, which amounts are reflected in the % leased, annualized base rent
and annualized base rent per square foot columns in the table above. The rent paid by us and
is eliminated from our revenues in consolidation. |
 Development Pipeline
18
$ in thousands
(1) Represents estimates that may change as the development process proceeds
(2) Originally a development pipeline project; now anticipate selling the first building to a
third party upon completion (3) AHH earns a preferred return on equity prior to any
distributions to JV partners (4) This property is located within the Virginia
Beach Town Center (5) Approximately 83,000 square feet is leased to Clark Nexsen,
an architectural firm and
approximately 23,000 square feet is leased to the Development Authority of Virginia Beach
Schedule
Development, Not Delivered
Location
Estimated
(1)
Estimated
Cost
(1)
Cost Incurred
through
9/30/2014
Start
Initial
Occupancy
Stabilized
Operation
AHH
Ownership %
Property Type
%leased
Anchor Tenants
Oceaneering
Chesapeake, VA
155,000 sf
$26,000
$16,000
4Q13
1Q15
1Q15
100%
Office
100%
Oceaneering
Sandbridge Commons
Virginia Beach, VA
70,000 sf
13,000
8,000
4Q13
1Q15
4Q15
100%
Retail
66%
Harris Teeter
Brooks Crossing
(2)
Newport News, VA
Commonwealth of VA -
Chesapeake
Chesapeake, VA
36,000 sf
7,000
4,000
2Q14
1Q15
1Q15
100%
Office
100%
Commonwealth of Virginia
Commonwealth of VA. -
Virginia Beach
Virginia Beach, VA
11,000 sf
3,000
2,000
2Q14
1Q15
100%
Office
100%
Commonwealth of Virginia
Lightfoot Marketplace
Williamsburg, VA
88,000 sf
24,000
9,000
3Q14
1Q16
2Q17
60%
(3)
Retail
60%
Harris Teeter
73,000
39,000
Schedule
Development, Delivered Not Stabilized
Location
Estimated
(1)
Estimated
Cost
(1)
Cost Incurred
through
9/30/2014
Start
Initial
Occupancy
Stabilized
Operation
AHH
Ownership %
(1)
Property Type
%leased
Anchor Tenants
4525 Main Street
(4)
Virginia Beach, VA
239,000 sf
(3)
$50,000
$40,000
1Q13
3Q14
1Q16
100%
Office
56%
(5)
Clark Nexsen, Development Authority
of Virginia Beach,
Anthropologie
Greentree Shopping Center
Chesapeake, VA
18,000 sf
6,000
5,000
4Q13
3Q14
3Q15
100%
Retail
40%
Wawa
Encore Apartments
(4)
Virginia Beach, VA
286 units
34,000
28,000
1Q13
3Q14
4Q15
100%
Multifamily
NA
NA
Whetstone Apartments
Durham, NC
203 units
28,000
25,000
2Q13
3Q14
4Q15
100%
Multifamily
NA
NA
118,000
98,000
Schedule
Re-Development
Location
Estimated
(1)
Estimated
Cost
(1)
Cost Incurred
through
9/30/2014
Start
Complete
(1)
Property Type
%leased
Anchor Tenants
Dick's at Town Center
Virginia Beach, VA
20,000 sf
$2,000
$1,000
1Q14
4Q14
Retail
100%
USI
Total
$193,000
$138,000
1Q15 |
 Acquisitions & Dispositions
19
$ in thousands
(1) Dimmock Square purchase price includes the issuance of operating partnership
(OP) units, based upon a negotiated value of $9.75 per OP
unit Acquisitions
Location
Approximately
Negotiated
Purchase Price
Purchased
Date
AHH
Ownership %
Property Type
%leased
Anchor Tenants
Liberty Apartments
Newport News, VA
197 units
$30,700
1Q14
100%
Multifamily
67%
NA
Dimmock Square
(1)
Colonial Heights, VA
106,166 sf
19,650
3Q14
100%
Retail
100%
Old Navy, Best Buy, Pier 1
Estimated
Pending Dispositions
Location
Approximately
Sale Price
Disposition
Date
AHH
Ownership %
Property Type
%leased
Anchor Tenants
Virginia Natural Gas
Virginia Beach, VA
31,000 sf
$8,900
4Q14
100%
Office
100%
Virginia Natural Gas
Sentara Williamsburg
Williamsburg, VA
49,200 sf
15,450
4Q14
100%
Office
100%
Sentara |
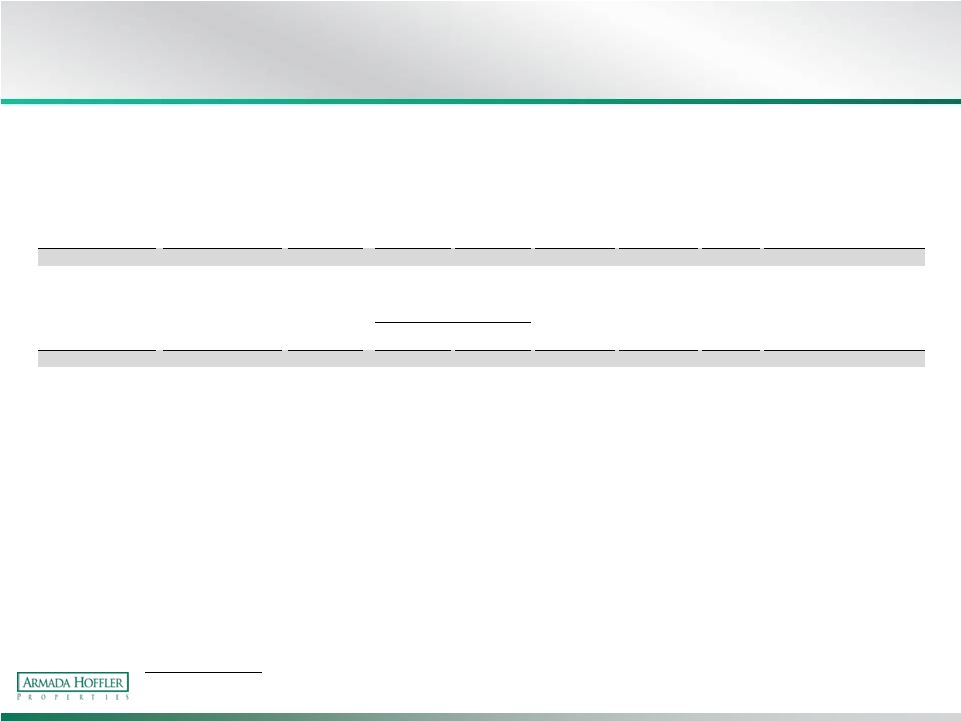
 Construction Business Summary
20
$ in thousands
Gross Profit Summary
Q3 2014
YTD 2014
(Unaudited)
Revenue
$31,532
$71,261
Expense
(30,468)
(67,807)
Gross Profit
$1,064
$3,454
Location
Total Contract
Value
Work in Place as
of 9/30/2014
Backlog
Estimated Date
of Completion
Projects Greater than $5.0M
Exelon
Baltimore, MD
$166,538
$22,729
$143,809
1Q 2016
Hyatt Place Baltimore / Inner Harbor Hotel
Baltimore, MD
25,592
23,564
2,028
4Q 2014
City of Suffolk Municipal Center
Suffolk, VA
25,240
22,904
2,336
2Q 2015
Sub Total
217,370
69,197
148,173
Projects Less than $5.0M
108,081
102,754
5,327
Total
$325,451
$171,951
$153,500
|
 Operating Results & Property-
Type Segment Analysis |
 Same
Store NOI by Segment 22
(Reconciliation to GAAP located in appendix pg. 37)
$ in thousands
Three months ended 9/30
Nine months ended 9/30
2014
2013
$ Change
% Change
2014
2013
$ Change
% Change
Office
(1)
(Unaudited)
(Unaudited)
Revenue
$6,623
$6,364
$259
4%
$19,645
$19,270
$375
2%
Expenses
2,139
2,081
58
3%
6,242
5,967
275
5%
Net Operating Income
4,484
4,283
201
5%
13,403
13,303
100
1%
Retail
(1)
Revenue
5,765
5,683
82
1%
15,625
15,299
326
2%
Expenses
1,739
1,745
(6)
0%
4,901
4,899
2
0%
Net Operating Income
4,026
3,938
88
2%
10,724
10,400
324
3%
Multifamily
(1)
Revenue
2,979
2,852
127
4%
5,752
5,684
68
1%
Expenses
1,386
1,331
55
4%
2,661
2,558
103
4%
Net Operating Income
1,593
1,521
72
5%
3,091
3,126
(35)
-1%
Same Store Net Operating Income (NOI), GAAP basis
$10,103
$9,742
$361
4%
$27,218
$26,829
$389
1%
Net effect of straight-line rents
(263)
(125)
(138)
110%
(886)
(429)
(457)
107%
Amortization of lease incentives and above (below) market rents
148
155
(7)
-5%
543
582
(39)
-7%
Same store portfolio NOI, cash basis
$9,988
$9,772
$216
2%
$26,875
$26,982
($107)
0%
Cash Basis:
Office
4,178
4,101
77
2%
12,245
12,548
(303)
-2%
Retail
4,188
4,120
68
2%
11,527
11,291
236
2%
Multifamily
1,622
1,551
71
5%
3,103
3,143
(40)
-1%
$9,988
$9,772
$216
2%
$26,875
$26,982
($107)
0%
GAAP Basis:
Office
4,484
4,283
201
5%
13,403
13,303
100
1%
Retail
4,026
3,938
88
2%
10,724
10,400
324
3%
Multifamily
1,593
1,521
72
5%
3,091
3,126
(35)
-1%
$10,103
$9,742
$361
4%
$27,218
$26,829
$389
1%
(1) See page 36 for Same Store vs. Non - Same Store Properties
|
 Top 10
Tenants by Annual Base Rent 23
Office Portfolio
(1)
Tenant
Number
of Leases
Number
of
Properties
Property(ies)
Lease
Expiration
Annualized
Base Rent
% of Office
Portfolio
Annualized
Base Rent
% of Total
Portfolio
Annualized
Base Rent
Williams Mullen
3
2
Armada Hoffler Tower, Richmond Tower
3/22/2026
$7,978,920
32.6%
13.9%
Sentara Medical Group
1
1
Sentara Williamsburg
3/31/2023
1,006,140
4.1%
1.8%
Cherry Bekaert
3
3
Armada Hoffler Tower, Richmond Tower, Oyster Point
1/31/2025
949,713
3.9%
1.7%
GSA
1
1
Oyster Point
4/26/2017
856,448
3.5%
1.5%
Troutman Sanders
1
1
Armada Hoffler Tower
1/31/2025
805,605
3.3%
1.4%
The Art Institute
1
1
Two Columbus
12/31/2019
787,226
3.2%
1.4%
Pender & Coward
2
1
Armada Hoffler Tower
1/31/2030
781,536
3.2%
1.4%
Hampton University
2
1
Two Columbus
2/28/2023
745,650
3.0%
1.3%
Kimley Horn
1
1
Armada Hoffler Tower
12/31/2018
682,162
2.8%
1.2%
Hankins & Anderson
1
1
Armada Hoffler Tower
4/30/2022
572,601
2.3%
1.0%
Top 10 Total
$15,166,001
61.9%
26.4%
Retail Portfolio
Tenant
Number
of Leases
Number
of
Properties
Property(ies)
Lease
Expiration
Annualized
Base Rent
% of Retail
Portfolio
Annualized
Base Rent
% of Total
Portfolio
Annualized
Base Rent
Home Depot
2
2
Broad Creek Shopping Center, North Point Center
12/3/2019
$2,189,900
9.7%
3.8%
Harris Teeter
2
2
Tyre Neck Harris Teeter, Hanbury Village
10/16/2028
1,430,532
6.4%
2.5%
Food Lion
3
3
Broad Creek Shopping Center, Bermuda Crossroads,
Gainsborough Square
3/19/2020
1,282,568
5.7%
2.2%
Dick's Sporting Goods
1
1
Dick's at Town Center
1/31/2020
798,000
3.5%
1.4%
Regal Cinemas
1
1
Harrisonburg Regal
4/23/2019
683,550
3.0%
1.2%
PetsMart
2
2
Broad Creek Shopping Center, North Point Center
7/21/2018
618,704
2.8%
1.1%
Kroger
1
1
North Point Center
8/31/2018
552,864
2.5%
1.0%
Yard House
1
1
Commerce Street Retail
11/30/2023
538,000
2.4%
0.9%
Rite Aid
2
2
Gainsborough Square, Parkway Marketplace
5/29/2019
484,193
2.2%
0.8%
Walgreens
1
1
Hanbury Village
12/31/2083
447,564
2.0%
0.8%
Top 10 Total
$8,868,044
40.1%
15.7%
As of September 30, 2014
(1) Virginia Beach Development Authority (~$0.65M ABR) and Clark Nexen (~$2.3M ABR)
would be included in the Office Portfolio top ten tenants based on ABR if 4525 Main
Street were stabilized |
 Office
Lease Summary 24
Renewal Lease Summary
(1)
GAAP
Cash
Quarter
Number of
Leases
Signed
Net rentable
SF Signed
Leases
Expiring
Net rentable
SF Expiring
Contractual
Rent per SF
Prior Rent
per SF
Annual
Change in
Rent per SF
Contractual
Rent per SF
Prior Rent
per SF
Annual Change
in Rent per SF
Weighted
Average Lease
Term
TI, LC, &
Incentives
TI, LC, &
Incentives
per SF
3rd Quarter 2014
3
6,859
2
6,082
$18.50
$19.63
($1.13)
$18.48
$19.85
($1.36)
2.62
$68,913
$10.05
2nd Quarter 2014
2
18,824
1
8,452
25.12
24.33
0.79
25.37
27.55
(2.18)
7.75
204,718
10.88
1st Quarter 2014
1
25,506
2
5,430
32.28
26.66
5.63
29.95
29.25
0.70
10.00
1,315,127
51.56
4th Quarter 2013
5
45,677
4
5,112
26.74
25.27
1.47
23.58
27.97
(4.39)
11.34
1,927,309
42.19
New Lease Summary
(1)
Quarter
Number of
Leases
Signed
Net rentable
SF Signed
Contractual
Rent per SF
Weighted
Average
Lease Term
TI, LC, &
Incentives
TI, LC, &
Incentives
per SF
3rd Quarter 2014
2
2,853
$22.65
2.56
$55,892
$19.59
2nd Quarter 2014
4
6,948
20.18
4.28
190,255
27.38
1st Quarter 2014
2
5,430
24.12
1.00
5,239
0.96
4th Quarter 2013
4
18,381
23.56
10.34
577,382
31.41
(1) Excludes leases for space occupied by AHH. |
 Office
Lease Expirations 25
Year of Lease Expiration
Number of
Leases
Expiring
Square
Footage of
Leases
Expiring
% Portfolio
Net Rentable
Square Feet
Annualized
Base Rent
% of Portfolio
Annualized
Base Rent
Annualized Base
Rent per Leased
Square Foot
Available
-
47,329
5.0%
$0
-
$0.00
Signed Leases not Commenced
1
2,220
0.2%
0
-
0.00
2014
3
5,726
0.6%
133,021
0.5%
23.23
2015
14
38,743
4.1%
862,230
3.5%
22.26
2016
11
34,258
3.6%
819,850
3.3%
23.93
2017
5
64,492
6.8%
1,564,421
6.4%
24.26
2018
17
157,665
16.6%
4,276,094
17.5%
27.12
2019
10
95,977
10.1%
2,266,218
9.3%
23.61
2020
3
25,283
2.7%
793,496
3.2%
31.38
2021
4
41,363
4.4%
973,852
4.0%
23.54
2022
3
48,117
5.1%
1,275,784
5.2%
26.51
2023
4
115,889
12.2%
2,432,759
9.9%
20.99
Thereafter
9
272,727
28.7%
9,083,408
37.1%
33.31
Total / Weighted Average
84
949,789
100.0%
24,481,134
$
100.0%
$27.19 |
 Retail
Lease Summary 26
Renewal Lease Summary
(1)
GAAP
Cash
Quarter
Number of
Leases
Signed
Net rentable
SF Signed
Leases
Expiring
Net
rentable SF
Expiring
Contractual
Rent per SF
Prior Rent
per SF
Annual Change
in Rent per SF
Contractual
Rent per SF
Prior Rent
per SF
Annual Change
in Rent per SF
Weighted
Average Lease
Term
TI, LC, &
Incentives
TI, LC, &
Incentives
per SF
3rd Quarter 2014
6
26,900
3
6,012
$17.64
$16.19
$1.45
$17.76
$16.98
$0.78
5.11
$44,109
$1.64
2nd Quarter 2014
6
12,916
2
3,842
20.47
19.66
0.81
20.20
20.65
(0.46)
1.87
5,730
0.44
1st Quarter 2014
5
23,857
3
6,540
20.84
20.41
0.43
21.18
21.82
(0.64)
4.55
63,339
2.65
4th Quarter 2013
7
37,733
6
7,928
13.82
13.49
0.33
13.79
14.12
(0.33)
4.70
40,540
1.07
New Lease Summary
(1)
Quarter
Number of
Leases
Signed
Net rentable
SF Signed
Contractual
Rent per SF
Weighted
Average
Lease Term
TI, LC, &
Incentives
TI, LC, &
Incentives
per SF
3rd Quarter 2014
7
35,574
$20.30
6.83
$522,738
$14.69
2nd Quarter 2014
4
10,574
25.73
7.78
1,071,485
101.33
1st Quarter 2014
1
3,160
16.25
10.50
126,558
40.05
4th Quarter 2013
2
3,270
18.67
5.06
75,884
23.21
(1)
(2) Tenant improvements and leasing commission expenses do not
include the redevelopment activities at Dick’s at Town Center Excludes leases from space
occupied by AHH |
 Retail
Lease Expiration 27
Year of Lease Expiration
Number of
Leases
Expiring
Square
Footage of
Leases
Expiring
% Portfolio
Net Rentable
Square Feet
Annualized
Base Rent
% of Portfolio
Annualized
Base Rent
Annualized Base
Rent per Leased
Square Foot
Available
-
42,535
3.5%
$0
-
$0.00
Signed Leases not Commenced
3
21,330
1.8%
-
-
-
2014
6
8,519
0.7%
176,716
0.9%
20.74
2015
18
63,739
5.3%
1,374,619
7.2%
21.57
2016
23
73,259
6.1%
1,651,561
8.6%
22.54
2017
24
148,963
12.4%
2,127,465
11.1%
14.28
2018
23
136,687
11.4%
2,040,950
10.7%
14.93
2019
24
326,041
27.2%
4,759,462
24.9%
14.60
2020
12
184,586
15.4%
2,408,800
12.6%
13.05
2021
5
25,204
2.1%
740,832
3.9%
29.39
2022
6
83,588
7.0%
1,215,718
6.4%
14.54
2023
5
30,125
2.5%
922,055
4.8%
30.61
Thereafter
10
53,631
4.5%
1,683,782
8.8%
31.40
Total / Weighted Average
159
1,198,207
100.0%
19,101,961
$
100.0%
$16.84 |
  Historical
Occupancy 28
(1) Office and retail occupancy based on occupied square feet as a % of respective
total (2) Multifamily occupancy based on occupied units as a % of respective total
(3) Total occupancy weighted by annualized base rent
Occupancy -
All Properties
as of
Sector
9/30/2014
6/30/2014
3/31/2014
12/31/2013
9/30/2013
Office
(1)
94.8%
95.3%
95.4%
95.2%
93.4%
Retail
(1)
94.7%
93.5%
93.4%
93.4%
93.6%
Multifamily
(2)
96.6%
94.9%
94.2%
94.2%
92.7%
Weighted Average
(3)
95.1%
94.6%
94.5%
94.4%
93.3% |
 (1) Total
units occupied as of each respective dat (2) Annualized base rent is calculated
by multiplying (a) contractual rent due from our tenants for the last month of the respective quarter by (b) 12
(3) Average Monthly Rent per Occupied Unit is calculated as (a) annualized base rent divided
by (b) the number of occupied units as of the end of the respective date.
(4) Excludes annualized base rent from retail leases
Multifamily Occupancy
29
Occupancy Summary - Smiths Landing (284 available units)
Quarter Ended
Number of Units
Occupied
Percentage
Occupied
(1)
Annualized Base
Rent
(2)
Average Monthly Rent
per Occupied Unit
9/30/2014
274
96.5%
$3,379,428
$1,028
6/30/2014
273
96.1%
3,321,096
1,014
3/31/2014
283
99.6%
3,430,260
1,010
12/31/2013
282
99.3%
3,382,380
1,000
9/30/2013
284
100.0%
3,427,980
1,006
Occupancy
Summary - The Cosmopolitan (342 available units) Quarter Ended
Number of Units
Occupied
Percentage
Occupied
(1)
Annualized Base
Rent
(2)(4)
Average Monthly Rent
per Occupied Unit
(3)
9/30/2014
331
96.8%
$6,218,892
$1,566
6/30/2014
321
93.9%
6,042,132
1,569
3/31/2014
307
89.8%
5,799,564
1,574
12/31/2013
308
90.1%
5,721,144
1,548
9/30/2013
296
86.5%
5,506,764
1,550
|
 30
Components of NAV
Stabilized Portfolio
NOI x Market Cap Rate = Stabilized Portfolio Value
Investment in Unstabilized Development Pipeline
Stabilized Development Pipeline
NOI x Market Cap Rate = Stabilized Development Portfolio Value
Annualized General Contracting and Real Estate Services x Appropriate Multiple = TRS
Value Other Assets
Liabilities
NAV |
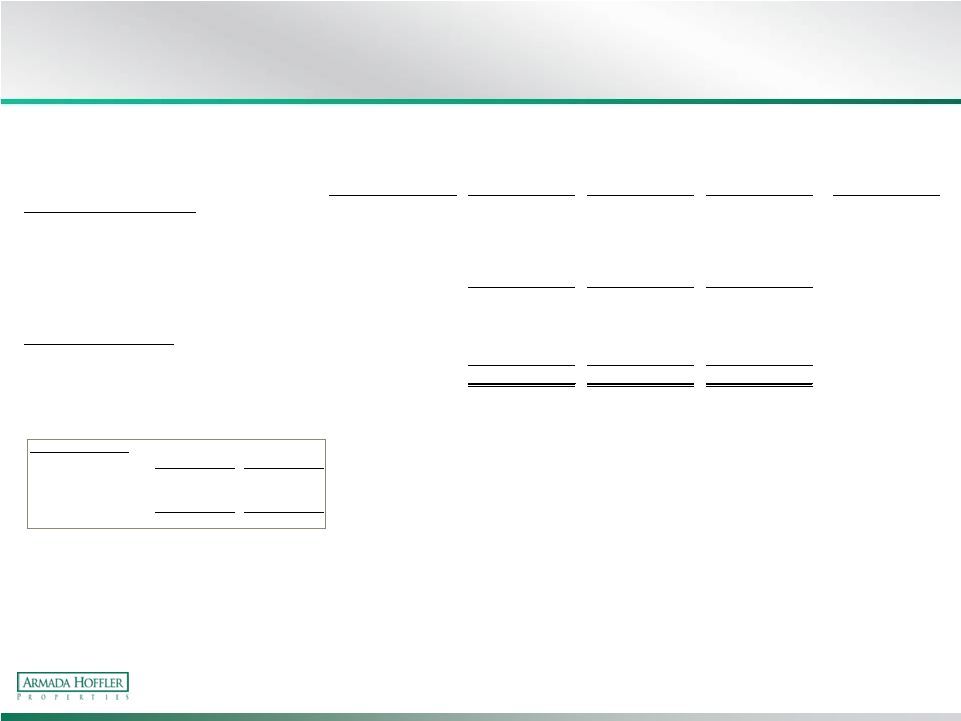
 Net
Asset Value Component Data 31
$ in thousands
(1) Includes leases for space occupied by Armada Hoffler which are eliminated for GAAP
purposes (2) Completed Not Stabilized properties are presented in our Consolidated
Balance Sheet as Income Producing Property Stabilized Portfolio NOI (Cash)
Other Assets
Three months
ended
Annualized
As of 9/30/2014
9/30/2014
9/30/2014
Other Assets
Diversified Portfolio
Cash and Cash Equivalents
$17,101
Office
$2,101
$8,404
Restricted Cash
4,425
Retail
3,232
12,928
Accounts Receivable
20,307
Multifamily
562
2,248
Construction receivables, including retentions
15,285
Total Diversified Portfolio NOI
$5,895
$23,580
Other Assets
32,449
Total Other Assets
$89,567
Virginia Beach Town Center
Office
(1)
$2,220
$8,880
Liabilities & Share Count
Retail
(1)
1,230
4,920
As of 9/30/2014
Multifamily
1,060
4,240
Liabilities
Total Virginia Beach Town Center NOI
$4,510
$18,040
Mortgages and notes payable
$335,792
Accounts payable and accrued liabilities
7,569
Stabilized Portfolio NOI (Cash)
$10,405
$41,620
Construction payables, including retentions
39,820
Other Liabilities
21,399
Development Pipeline
Total Liabilities
$404,580
9/30/2014
Construction in Progress: (pg. 9 balance sheet)
$93,946
Three months
ended
Development Pipeline Completed Not Stabilized at Cost
(2)
73,101
Share Count
9/30/2014
Weighted Average Common Shares Outstanding
20,266
Taxable REIT Subsidiary (TRS)
Weighted Average Operating Partnership ("OP") Units Outstanding
14,291
Outlook
Total Weighted Average Common shares and OP units outstanding
34,557
9/30/2014
$4,600
Annualized General Contracting and Real Estate Services per
Company September 30, 2014 parameters (pg. 7) |
 Appendix –
Definitions & Reconciliations |
 Definitions
Net Operating Income:
We calculate Net Operating Income (“NOI”) as property revenues (base rent,
expense reimbursements and other revenue)
less
property
expenses
(rental
expenses
and
real
estate
taxes).
For
our
office,
retail
and
multifamily
segments, NOI excludes general contracting and real estate services expenses,
depreciation and amortization, general and
administrative
expenses,
and
impairment
charges.
Other
REITs
may
use
different
methodologies
for
calculating
NOI,
and
accordingly,
our
NOI
may
not
be
comparable
to
such
other
REITs’
NOI.
NOI
is
not
a
measure
of
operating
income or cash flows from operating activities as measured by GAAP and is not
indicative of cash available to fund cash needs. As a result, net operating
income should not be considered an alternative to cash flows as a measure of
liquidity. We consider NOI to be an appropriate supplemental measure to net
income because it assists both investors and management in understanding the
core operations of our real estate business. (Reconciliation to GAAP located in
appendix pg. 37)
Funds From Operations:
We calculate Funds From Operations (“FFO”) in accordance with the standards
established by the National Association of Real Estate Investment Trusts
(“NAREIT”). NAREIT defines FFO as net income (loss) (calculated in accordance with
accounting principles generally accepted in the United States (“GAAP”)),
excluding gains (or losses) from sales of depreciable
operating
property,
real
estate
related
depreciation
and
amortization
(excluding
amortization
of
deferred
financing costs) and after adjustments for unconsolidated partnerships and joint
ventures. FFO is a supplemental non-GAAP financial measure. Management uses
FFO as a supplemental performance measure because it believes that FFO is
beneficial to investors as a starting point in measuring our operational performance.
Specifically, in excluding real estate related depreciation and amortization and gains
and losses from property dispositions, which do not relate to or are not
indicative of operating performance, FFO provides a performance measure that,
when compared year over year, captures trends in occupancy rates, rental rates and operating costs.
Other equity REITs may not calculate FFO in accordance with the NAREIT definition as we
do, and, accordingly, our FFO may not be comparable to such other
REITs’ FFO.
33 |
 Definitions
34
Core Funds From Operations:
Adjusted Funds From Operations:
We calculate Core Funds From Operations ("Core FFO") as FFO calculated in
accordance with the standards established by NAREIT, adjusted for losses on
debt extinguishments, non-cash stock compensation and impairment
charges. Such items are non-recurring or non-cash in nature. Our calculation of Core FFO also
excludes acquisition costs and the impact of development pipeline projects that are
still in lease-up. We generally consider a property to be in lease-up
until the earlier of (i) the quarter after which the property reaches 80%
occupancy or (ii) the thirteenth quarter after the property receives its certificate of occupancy.
Management
believes
that
the
computation
of
FFO
in
accordance
to
NAREIT’s
definition
includes
certain
items
that are not indicative of the results provided by the Company’s operating
portfolio and affect the comparability of the Company’s
period-over-period performance. Our calculation of Core FFO differs from NAREIT's definition
of FFO. Other equity REITs may not calculate Core FFO in the same manner as us,
and, accordingly, our Core FFO may not be comparable to other REITs' Core FFO.
We calculate Adjusted Funds From Operations (“AFFO”) as Core FFO, (i)
excluding the impact of tenant improvement and leasing commission costs,
capital expenditures, the amortization of deferred financing fees, derivative
(income) loss, the net effect of straight-line rents and the amortization of lease incentives and net
above (below) market rents and (ii) adding back the impact of development pipeline
projects that are still in lease-up and government development grants that
are not included in FFO. Management believes that AFFO provides useful
supplemental information to investors regarding our operating performance as it
provides a consistent comparison of our operating performance across time periods and allows
investors to more easily compare our operating results with other REITs. However,
other REITs may use different methodologies for calculating AFFO or similarly
entitled FFO measures and, accordingly, our AFFO may not always be comparable
to AFFO or other similarly entitled FFO measures of other REITs. |
 Definitions
EBITDA:
We calculate EBITDA as net income (loss) (calculated in accordance with GAAP),
excluding interest expense, income taxes and depreciation and amortization.
Management believes EBITDA is useful to investors in evaluating and facilitating
comparisons of our operating performance between periods and between REITs by removing the impact of
our capital structure (primarily interest expense) and asset base (primarily
depreciation and amortization) from our operating results.
Core EBITDA:
We calculate Core EBITDA as EBITDA, excluding certain items, including, but not limited
to, non-recurring or extraordinary gains (losses), early extinguishment of
debt, derivative (income) losses, acquisition costs and the impact of
development pipeline projects that are still in lease-up. We generally consider a property to be in lease-up until the
earlier of (i) the quarter after which the property reaches 80% occupancy or (ii) the
thirteenth quarter after the property receives its certificate of occupancy.
Management believes that Core EBITDA provides useful supplemental information to
investors regarding our ongoing operating performance as it provides a consistent comparison of our
operating performance across time periods and allows investors to more easily compare
our operating results with other REITs. However, other REITs may use different
methodologies for calculating Core EBITDA or similarly entitled measures and,
accordingly, our Core EBITDA may not always be comparable to Core EBITDA or other similarly entitled measures
of other REITs.
Core Debt:
We calculate Core Debt as our total debt, excluding any construction loans associated
with our development pipeline. Same Store Portfolio:
We define same store properties as including those properties that were owned and
operated for the entirety of the period being presented and excluding properties
that were in lease-up during the period present. We generally
consider
a
property
to
be
in
lease-up
until
the
earlier
of
(i)
the
quarter
after
which
the
property
reaches
80%
occupancy
or (ii) the thirteenth quarter after the property receives its certificate of
occupancy. The following table shows the properties included in the same
store and non-same store portfolio for the comparative periods presented.
35 |
 Same
Store vs. Non-Same Store Properties 36
Same Store
Non-Same Store
Same Store
Non-Same Store
Office Properties
Armada Hoffler Tower
X
X
One Columbus
X
X
Two Columbus
X
X
Virginia Natural Gas
X
X
Richmond Tower
X
X
Oyster Point
X
X
Sentara Williamsburg
X
X
4525 Main Street
X
X
Retail Properties
Bermuda Crossroads
X
X
Broad Creek Shopping Center
X
X
Courthouse 7-Eleven
X
X
Dimmock Square
X
X
Gainsborough Square
X
X
Hanbury Village
X
X
North Point Center
X
X
Parkway Marketplace
X
X
Harrisonburg Regal
X
X
Dick’s at Town Center
X
X
249 Central Park Retail
X
X
Studio 56 Retail
X
X
Commerce Street Retail
X
X
Fountain Plaza Retail
X
X
South Retail
X
X
Tyre Neck Harris Teeter
X
X
Greentree Shopping Center
X
X
Multifamily Properties
Encore Apartments
X
X
Smith’s Landing
X
X
The Cosmopolitan
X
X
Liberty Apartments
X
X
Whetstone Apartments
X
X
Comparison of Nine Months Ended
September 30, 2014 to 2013
Comparison of Three Months Ended
September 30, 2014 to 2013 |
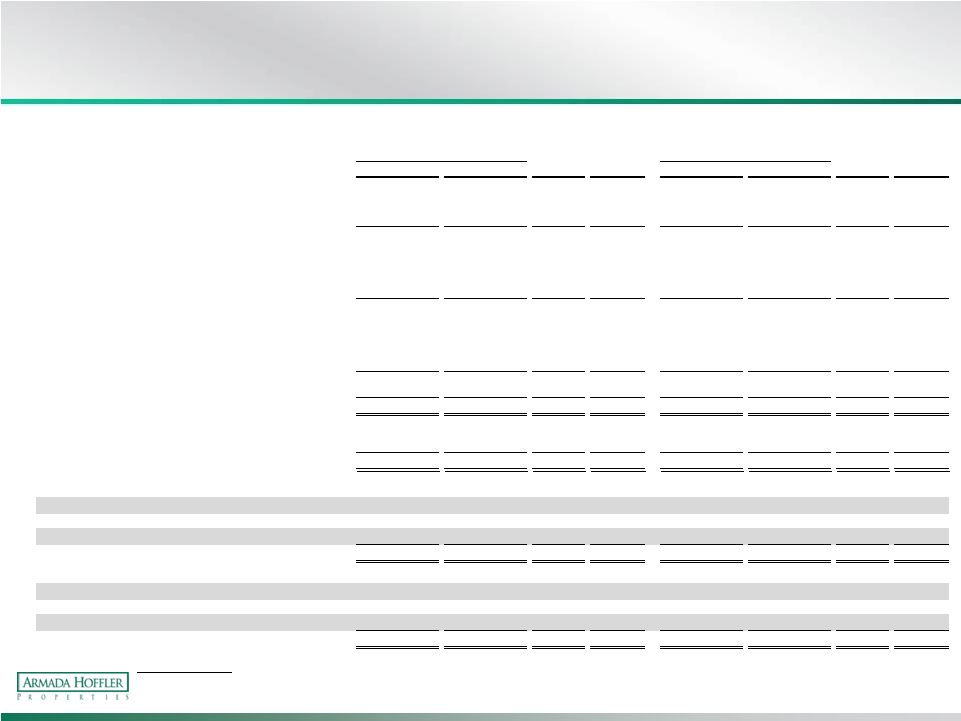
 Reconciliation to GAAP -
Segment Portfolio NOI
37
$ in thousands
Three months ended 9/30
Nine months ended 9/30
2014
2013
2014
2013
Office Same Store
(1)
Rental revenues
$6,623
$6,364
$19,645
$19,270
Property expenses
2,139
2,081
6,242
5,967
NOI
4,484
4,283
13,403
13,303
Non-Same Store NOI
460
-
507
-
Segment NOI
$4,944
$4,283
$13,910
$13,303
Retail Same Store
(1)
Rental revenues
$5,765
$5,683
$15,625
$15,299
Property expenses
1,739
1,745
4,901
4,899
NOI
4,026
3,938
10,724
10,400
Non-Same Store NOI
265
-
1,525
617
Segment NOI
$4,291
$3,938
$12,249
$11,017
Multifamily Same Store
(1)
Rental revenues
$2,979
$2,852
$5,752
$5,684
Property expenses
1,386
1,331
2,661
2,558
NOI
1,593
1,521
3,091
3,126
Non-Same Store NOI
(9)
-
1,514
837
Segment NOI
1,584
1,521
$4,605
$3,963
Total Segment Portfolio NOI
$10,819
$9,742
$30,764
$28,283
(1) See page 36 for Same Store vs. Non-Same Store Properties
|
 Reconciliation to GAAP -
Segment Portfolio NOI
38
$ in thousands
Three months ended 9/30/2014
Diversified Portfolio
Office
Retail
Multifamily
Total
Cash NOI
$2,101
$3,232
$562
$5,895
Net effect of straight-line rents
190
(96)
(11)
83
Amortization of lease incentives and (above) below market rents
(16)
44
(13)
15
GAAP NOI
$2,275
$3,180
$538
$5,993
Town Center of Virginia Beach
Office
Retail
Multifamily
Total
Cash NOI
$2,220
$1,230
$1,060
$4,510
Net effect of straight-line rents
157
28
(4)
181
Amortization of lease incentives and (above) below market rents
(26)
(132)
-
(158)
Elimination of AHH rent
(142)
(76)
-
(218)
GAAP NOI
$2,209
$1,050
$1,056
$4,315
GAAP NOI
Office
Retail
Multifamily
Total
Diversified Portfolio
$2,275
$3,180
$538
$5,993
Town Center of Virginia Beach
2,209
1,050
1,056
4,315
Unstabilized Properties
460
61
(10)
511
Total Segment Portfolio GAAP NOI
$4,944
$4,291
$1,584
$10,819 |
 Reconciliation to GAAP -
Segment Portfolio NOI
$ in thousands
39
Office
Retail
Multifamily
Total Rental
Properties
General Contracting &
Real Estate Services
Total
Segment revenues
7,295
$
6,086
$
3,332
$
16,713
$
31,532
$
48,245
$
Segment expenses
2,351
1,795
1,748
5,894
30,468
36,362
Net operating income
4,944
$
4,291
$
1,584
$
10,819
$
1,064
$
11,883
$
Depreciation and amortization
(4,567)
General and administrative expenses
(1,741)
Acquisition, development and other pursuit costs
(174)
Impairment charges
(15)
Interest expense
(2,734)
Other income
59
Income tax benefit
43
Net income
2,754
$
Office
Retail
Multifamily
Total Rental
Properties
General Contracting &
Real Estate Services
Total
Segment revenues
20,363
$
17,559
$
9,303
$
47,225
$
71,261
$
118,486
$
Segment expenses
6,453
5,310
4,698
16,461
67,807
84,268
Net operating income
13,910
$
12,249
$
4,605
$
30,764
$
3,454
$
34,218
$
Depreciation and amortization
(12,593)
General and administrative expenses
(5,768)
Acquisition, development and other pursuit costs
(174)
Impairment charges
(15)
Interest expense
(7,977)
Other loss
(23)
Income tax provision
(135)
Net income
7,533
$
Three months ended 9/30/2014
Nine months ended 9/30/2014 |