Attached files
| file | filename |
|---|---|
| 8-K - 8-K - AVIV REIT, INC. | d813686d8k.htm |
| EX-99.1 - EX-99.1 - AVIV REIT, INC. | d813686dex991.htm |
Exhibit 99.2
|
|
The Premier Skilled Nursing Facility REIT
October 31, 2014
|
|

Cautionary Language Regarding Forward-Looking Statements
This presentation includes forward-looking statements within the meaning of Section 27A of the Securities Act of 1933, as amended, and Section 21E of the Securities Exchange Act of 1934, as amended. All statements regarding Omega Healthcare Investors, Inc. (“Omega”), Aviv REIT’s (“Aviv”) or their respective operators’ or borrowers’ expected future financial position, results of operations, cash flows, funds from operations, dividends and dividend plans, financing plans, business strategy, budgets, projected costs, operating metrics, capital expenditures, competitive positions, acquisitions, investment opportunities, merger integration, growth opportunities, dispositions, expected lease income, continued qualification as a real estate investment trust (“REIT”), plans and objectives of management for future operations and statements that include d h “ ti i t ”“if ” b li ” l ”“ ti t ”“ t”“i t d ”“ ” words such as anticipate,” “if,” “believe,” “ plan,” “estimate,” “expect,” “intend,” “may,” “could,” “should,” “will” and other similar expressions or the negative form of the same are forward-looking statements. Such forward-looking statements are inherently uncertain, and security holders must recognize that actual results may differ from the
companies’ expectations. Neither Omega nor Aviv undertakes a duty to update such forward-looking statements, which speak only as of the date on which they are made. Omega’s and Aviv’s actual future results and trends may differ materially depending on a variety of factors discussed in their filings with the Securities and Exchange Commission (“SEC”). These factors include without limitation: (a) the ability and willingness of each company’s operators, borrowers and other third parties to meet and/or perform their obligations under their respective contractual arrangements with the company, including, in some cases, their obligations to indemnify, defend and hold harmless the company from and against various claims, litigation and liabilities; (b) the ability of each company’s operators and borrowers to maintain the financial strength and liquidity necessary to satisfy their respective obligations and liabilities to third parties, including without limitation obligations under their existing credit facilities and other indebtedness; (c) each company’s success in implementing its business strategy and its ability to identify, underwrite, finance, consummate and integrate diversifying acquisitions or investments, including those in different asset types; (d) the nature and extent of future competition; (e) the extent of future or pending healthcare reform and regulation, including cost containment measures and changes in reimbursement policies, procedures and rates; (f) increases in each company’s cost of borrowing as a result of changes in interest rates and other factors; (g) the ability of each company’s operators to deliver high quality services, to attract and retain qualified personnel and to attract residents and patients; (h) changes in general economic conditions and/or economic conditions in the markets in which each company may, from time to time, compete and the effect of those changes on the company’s revenues and its ability to access the capital markets or other sources of funds; (i) each company’s ability to pay down, refinance, restructure and/or extend its indebtedness as it becomes due; (j) each company’s ability and willingness to maintain its qualification as a REIT due to economic, market, legal, tax
or other considerations; (k) the ability and willingness of each company’s operators to renew their leases with the company upon expiration of the leases and each company’s ability to reposition its properties on the same or better terms in the event such leases expire and are not renewed by the operators or in the event the company exercises its
right to replace an existing operator upon default; (l) year-over-year changes in the Consumer Price Index and the effect of those changes on the rent escalators and each company’s earnings; (m) each company’s ability and the ability of its operators and borrowers to obtain and maintain adequate liability and other insurance from reputable and financially stable providers; (n) the impact of increased operating costs and uninsured professional liability claims on the liquidity, financial condition and results of operations on each company’s operators and borrowers, and the ability of those operators and borrowers to accurately estimate the magnitude of those claims; (o) the impact of market or issuer events on the liquidity or value of each company’s investments in marketable securities; (p) uncertainties relating to the business operations of the operators of each company’s properties, including those relating to reimbursement by third-party payors, regulatory matters and occupancy levels; (q) regulatory and other changes in the healthcare sector; (r) changes in the financial position of each company’s operators; (s) the ability of operators in bankruptcy to reject unexpired lease obligations, modify the terms of each company’s mortgages, and impede the ability of the company to collect unpaid rent or interest during the pendency of a bankruptcy proceeding and retain security deposits for the debtor’s obligations; (t) changes in Omega’s credit ratings and the ratings of its debt securities; (u) competition in the financing of healthcare facilities; and (v) the impact of any financial, accounting, legal or regulatory issues or litigation that may affect either company or its major operators or borrowers. Many of these factors are beyond the control of the companies and their management.
2
|
|
Additional Information about the Proposed Transaction and Where to Find It
This presentation does not constitute an offer to sell or the solicitation of an offer to buy any securities or a solicitation of any proxy, vote or approval. In connection with the proposed transaction, Omega and Aviv expect to prepare and file with the SEC a registration statement on Form S-4 containing a joint proxy statement/prospectus and other documents with respect to Omega’s proposed acquisition of Aviv. Investors are urged to read the joint proxy statement/prospectus (including all amendments and supplements thereto) and other relevant documents filed with the SEC if and when they become available because they will contain important information
about the proposed transaction. Investors may obtain free copies of the registration statement, the joint proxy statement/prospectus and other relevant documents filed by Omega and Aviv with the SEC (if and when they become available) through the website maintained by the SEC at www.sec.gov. Copies of the documents filed by Omega with the SEC will also be available free of charge on Omega’s website at www.omegahealthcare.com and copies of the documents filed by Aviv with the SEC are available free of charge on Aviv’s website at www.avivreit.com. Omega, Aviv and their respective directors and executive officers may be deemed to be participants in the solicitation of proxies from Omega’s and Aviv’s shareholders in respect of the proposed transaction. Information regarding Omega’s directors and executive officers can be found in Omega’s definitive proxy statement filed with the SEC on April 29, 2014. Information regarding Aviv’s directors and executive officers can be found in Aviv’s definitive proxy statement filed with the SEC on April 15, 2014. Additional information regarding the interests of such potential participants will be included in the joint proxy statement/prospectus and other relevant documents filed with the SEC in connection with the proposed transaction if and when they become available. These documents are available free of charge on the SEC’s website and from Omega and Aviv, as applicable, using the sources indicated above.
3
|
|
Transaction Summary
Overview Omega (NYSE: OHI) to merge with Aviv (NYSE: AVIV) in a stock-for-stock transaction
Creates premier $10Bn SNF REIT and only pure-play SNF REIT
Combined uniquely positioned to company consolidate highly attractive, highly fragmented industry
Consideration Aviv shareholders and unitholders to receive 0.90 OHI shares for each AVIV share or unit
Aviv shareholders and unitholders to own 30% of combined company
Represents Aviv total value of $3Bn including the assumption of debt
Management Team Taylor Pickett will be Chief Executive Officer of the combined company with HQ in Hunt Valley, MD
Dan Booth and Bob Stephenson will retain current roles as COO and CFO, respectively
Steven Insoft will lead the Chicago-based business development team, augmenting Omega’s i bili I Board of Directors
Craig Bernfield and 2 other Aviv Directors to join Omega’s Board
Omega’s long-tenured and experienced Board remains in place investment capabilities
Combines management teams with extensive industry knowledge, experience, and expertise
Closing Conditions and
Subject to Aviv and Omega shareholder votes
- LG Aviv LP, an affiliate of Lindsay Goldberg LLC, has entered into a voting agreement in support of transaction
g g p p Omega shareholders to vote to de-classify Omega Board
4
Timing the Expected to close Q1 2015 subject to other customary closing conditions
|
|
Transaction Rationale
High Quality and Complementary Portfolio
Combined company has substantial scale
Significant diversification with 83 operator relationships in 41 states
Long-term triple-net master leases with sector-leading rent coverage
Platforms With Superior Historical Management teams with strong track records of value creation for shareholders
Omega is the top performing REIT over the last decade - total shareholder return of ~586%
Commitment to high quality facilities
Positioned For Continued Track Records Aviv total shareholder return since IPO of ~64%
Demonstrated track record of attractive acquisitions and development
Consolidator in large, fragmented industry with attractive fundamentals
Sector
Leading Growth Combined relationships will lead to ongoing pipeline of off-market transactions
Over $900MM year-to-date combined investments
Accretive to Adjusted FFO and FAD
Si ifi i d i f li i i i
Attractive
Financial Impact
Significant cost synergies and meaningful interest savings opportunities
9% - 10% expected 2015 FAD per share growth over Omega 2014 guidance
Expect positive ratings momentum from enhanced credit profile
Strong balance sheet and lower cost of capital to drive future accretive growth
5
Market data as of 30-Oct-2014
Well positioned to continue to grow current, well-covered quarterly dividend
|
|
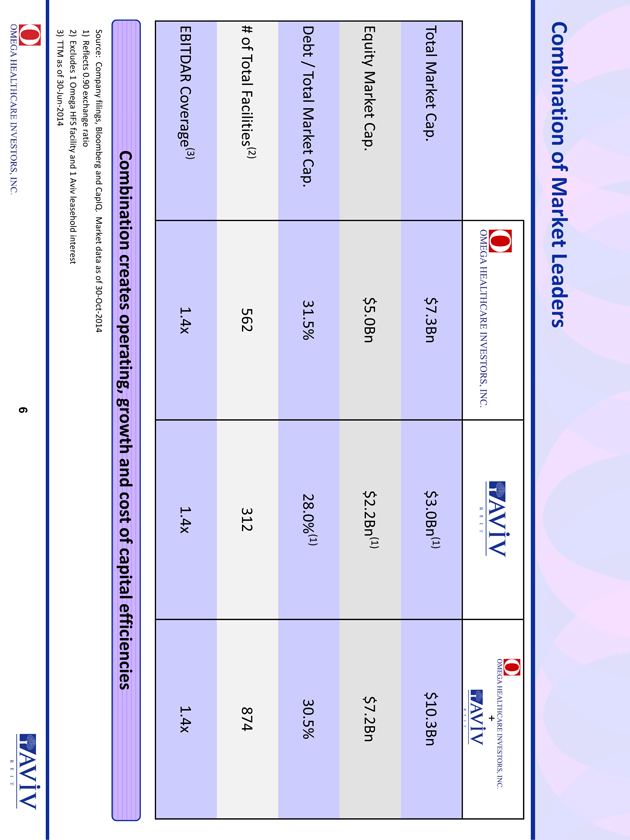
Combination of Market Leaders
+
Total Market Cap. $7.3Bn $3.0Bn(1) $10.3Bn
Equity Market Cap. $5.0Bn $2.2Bn(1) $7.2Bn
Debt / Total Market Cap. 31.5% 28.0%(1) 30.5%
# of Total Facilities(2) 562 312 874
EBITDAR Coverage(3) 1.4x 1.4x 1.4x
Source: Company filings, Bloomberg and CapIQ. Market data as of 30-Oct-2014
Combination creates operating, growth and cost of capital efficiencies
6
1) Reflects 0.90 exchange ratio
2) Excludes 1 Omega HFS facility and 1 Aviv leasehold interest
3) TTM as of 30-Jun-2014
|
|
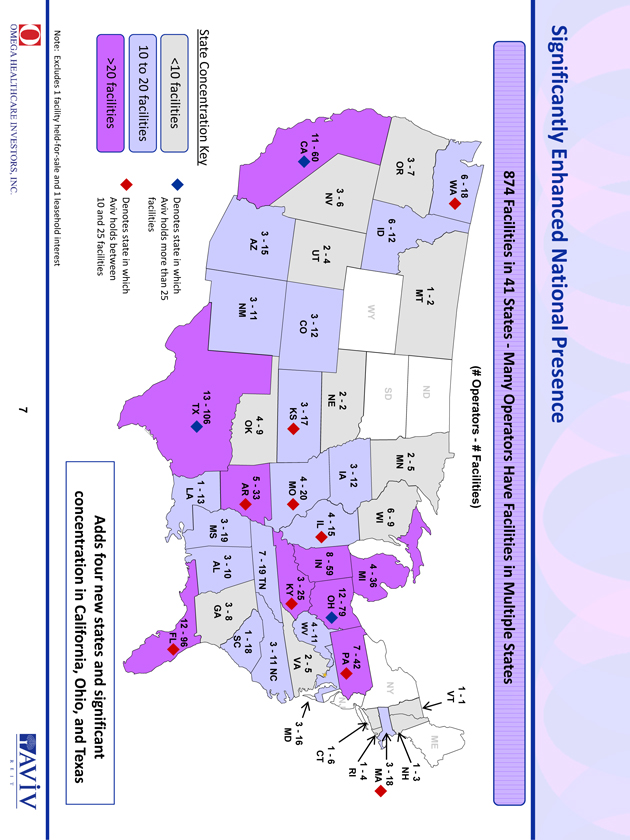
Significantly Enhanced National Presence
6 – 18 WA 1 – 1 VT (# Operators - # Facilities) 874 Facilities in 41 States - Many Operators Have Facilities in Multiple States 6 – 9 WI 6 – 12 ID 42 3 – 18 MA 1 – 3 NH 1 – 4 4 – 36 MI WY ND SD NY ME 3 – 7 OR 2 – 5 MN 1 – 2 MT - 6 NV 11 – 60 CA 3 – 12 CO 3 – 12 IA 4 – 20 MO 4 – 15 IL 8 – 59 IN 12 – 79 OH 3 – 25 KY - 4 – 1 WV 7 – PA RI 3 – 16 MD 3 – 17 KS J 2 – 4 UT 2 – 5 VA 1 – 6 CT 2 – 2 NE 3 – 19 S 3 – 11 NM 3 – 15 AZ 13 – 106 TX 5 – 33 AR 1 – 13 LA 7 - 19 TN 3 – 10 AL 12 – 96 3 – 8 GA 11 NC 4 – 9 OK 1 – 18 SC f l State Concentration Key D i hi h FL 10 to 20 facilities <10 facilities >20 facilities Adds four new states and significant Denotes state in which Aviv holds more than 25 facilities Denotes state in which Aviv holds between 10 and 25 facilities 7 concentration in California, Ohio, and Texas Note: Excludes 1 facility held-for-sale and 1 leasehold interest
|
|
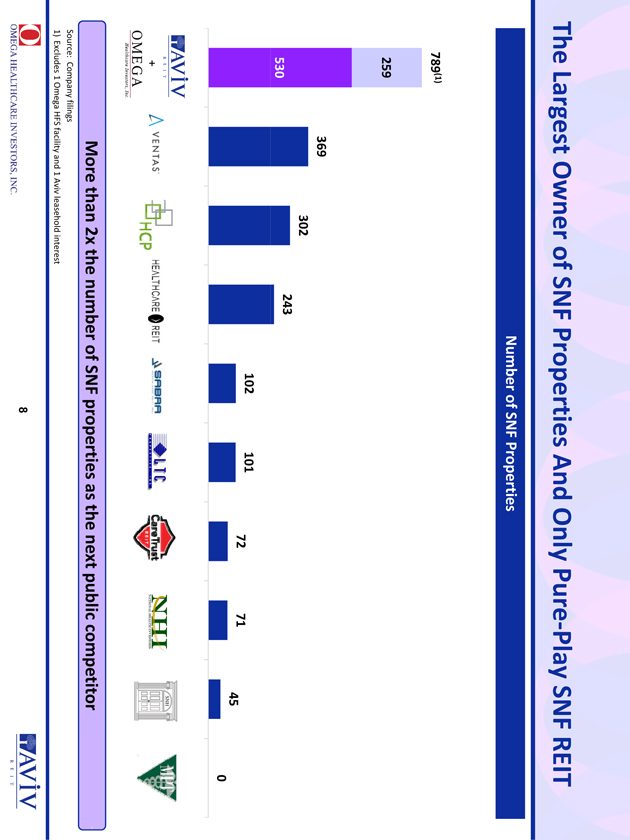
The Largest Owner of SNF Properties And Only Pure-Play SNF REIT
Number of SNF Properties
259
789(1)
530
369
302
243
102 101 72 71 45
0
More +
8
than 2x the number of SNF properties as the next public competitor
Source: Company filings
1) Excludes 1 Omega HFS facility and 1 Aviv leasehold interest
|
|
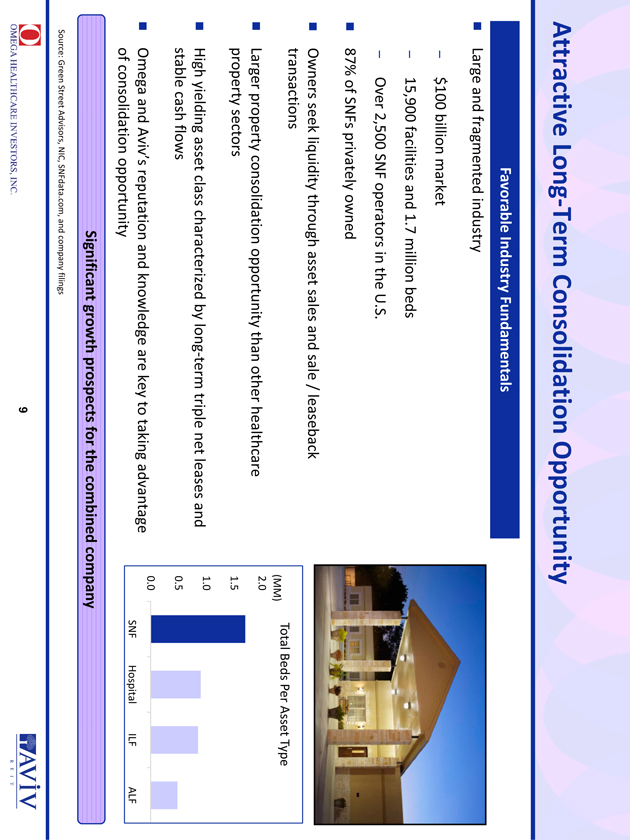
Attractive Long-Term Consolidation Opportunity
Large and fragmented industry
Favorable Industry Fundamentals
– $100 billion market
– 15,900 facilities and 1.7 million beds
– Over 2,500 SNF operators in the U.S.
87% of SNFs privately owned
Owners seek liquidity through asset sales and sale / leaseback
transactions Total Beds Per Asset Type (MM)
Larger property consolidation opportunity than other healthcare
property sectors
High yielding asset class characterized by long-term triple net leases and
stable cash flows
0 5
1.0
1.5
2.0
Omega and Aviv’s reputation and knowledge are key to taking advantage
of consolidation opportunity
0.0
0.5
SNF Hospital ILF ALF
Significant growth prospects for the company
9
Source: Green Street Advisors, NIC, SNFdata.com, and company filings
combined
|
|
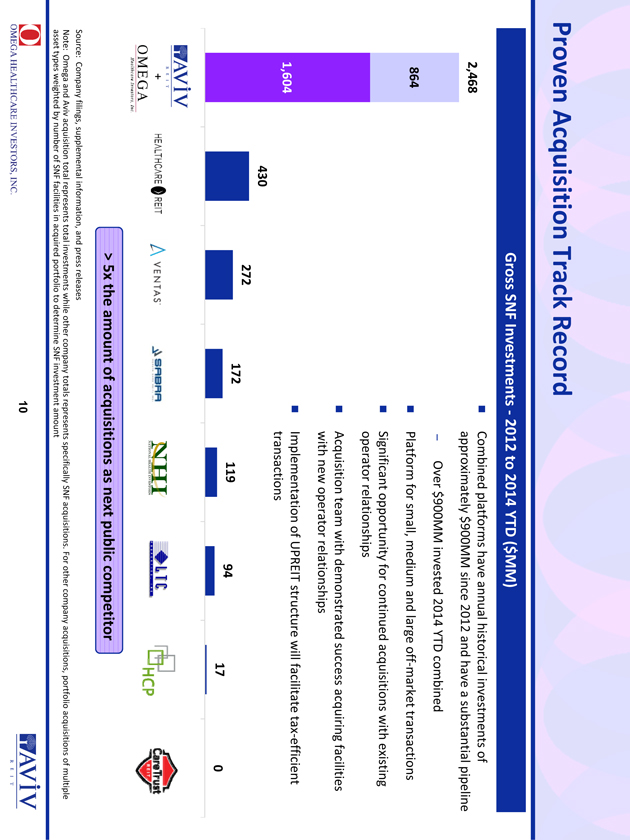
Proven Acquisition Track Record
2,468
Gross SNF Investments - 2012 to 2014 YTD ($MM)
Combined platforms have annual historical investments of
approximately $900MM since 2012 and have a substantial pipeline
864
– Over $900MM invested 2014 YTD combined
Platform for small, medium and large off-market transactions
Significant opportunity for continued acquisitions with existing
operator relationships
1,604
p p
Acquisition team with demonstrated success acquiring facilities
with new operator relationships
Implementation of UPREIT structure will facilitate tax-efficient
transactions
430
272
172 119 94 17 0
> 5x the amount of acquisitions as next public competitor
+
10
Source: Company filings, supplemental information, and press releases
Note: Omega and Aviv acquisition total represents total investments while other company totals represents specifically SNF acquisitions. For other company acquisitions, portfolio acquisitions of multiple
asset types weighted by number of SNF facilities in acquired portfolio to determine SNF investment amount
|
|

Commitment to High-Quality Facilities
Combined companies have invested approximately
$316MM since 2009 for reinvestment and new
construction
– $55MM invested YTD as of 9/30/2014
Projects produce returns consistent with returns
from acquisitions
Projects help gain competitive advantage in
markets, drive revenue and improve operator
profitability
Programmatic approach to investment
– Market screening optimizes allocation of capital
– Standardized finish packages
– Interior enhancements: therapy gyms and
specialty units
– Exterior enhancements: lighting, signage and
architectural features
11
|
|
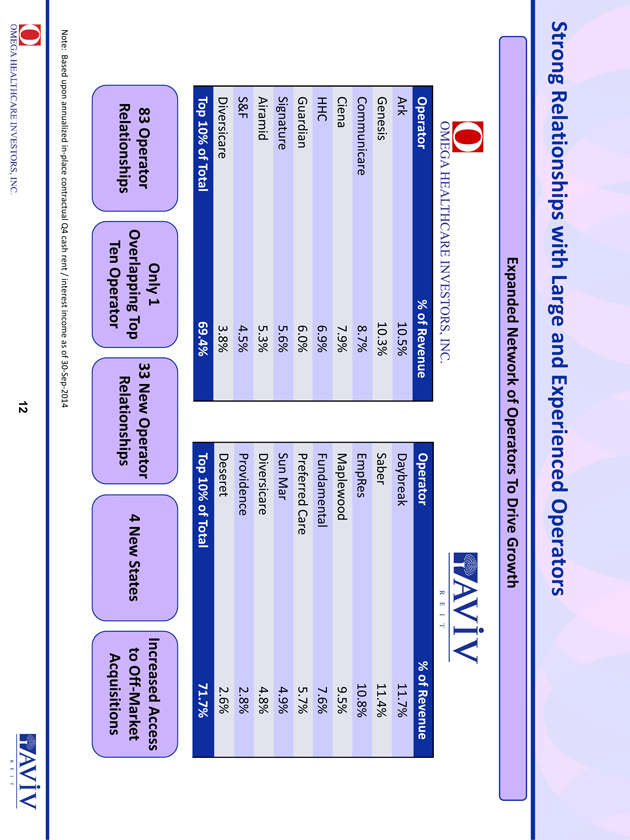
Strong Relationships with Large and Experienced Operators
Expanded Network of Operators To Drive Growth
Operator % of Revenue Ark 10.5%
Genesis 10.3% Communicare 8 7% Operator % of Revenue Daybreak 11.7%
Saber 11.4% 8.7% EmpRes 10 8% Ciena 7.9% HHC 6.9% Guardian 6.0% Signature 5.6% 10.8% Maplewood 9.5%
Fundamental 7.6% Preferred Care 5.7% Sun Mar 4.9% Airamid 5.3% S&F 4.5% Diversicare 3.8%
Top 10% of Total 69.4% Diversicare 4.8% Providence 2.8% Deseret 2.6% Top 10% of Total 71.7% Only 1
Overlapping Top Ten Operator 33 New Operator Relationships 83 Operator Relationships 4 New States
Increased Access to Off Market Acquisitions 12
Note: Based upon annualized in place contractual Q4 cash rent / interest income as of 30 Sep 2014
|
|
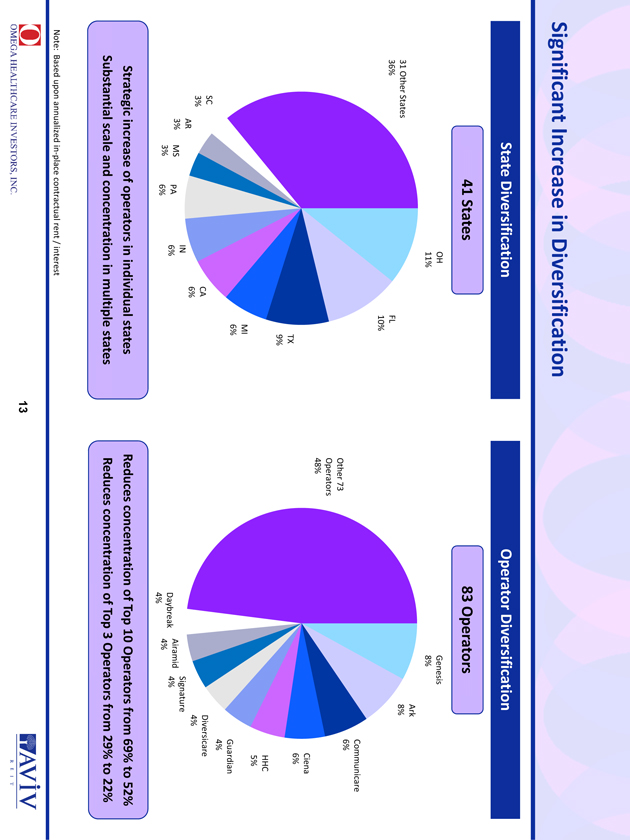
Significant Increase in Diversification
State Diversification Operator Diversification
41 States 83 Operators
Genesis
8% Ark 8% C I OH 11% FL 10% 31 Other States 36% Communicare 6% Ciena 6% Other 73 Operators 48% TX 9% HHC 5% Guardian 4% Diversicare 4% Signature CA 6% MI 6% AR IN SC 3% Airamid 4% Daybreak 4% 4% PA 6% 6% MS 3% 3% Strategic increase of operators in individual states
Substantial scale and concentration in multiple states
Reduces concentration of Top 10 Operators from 69% to 52%
Reduces concentration of Top 3 Operators from 29% to 22%
13
Note: Based upon annualized in place contractual rent / interest
|
|
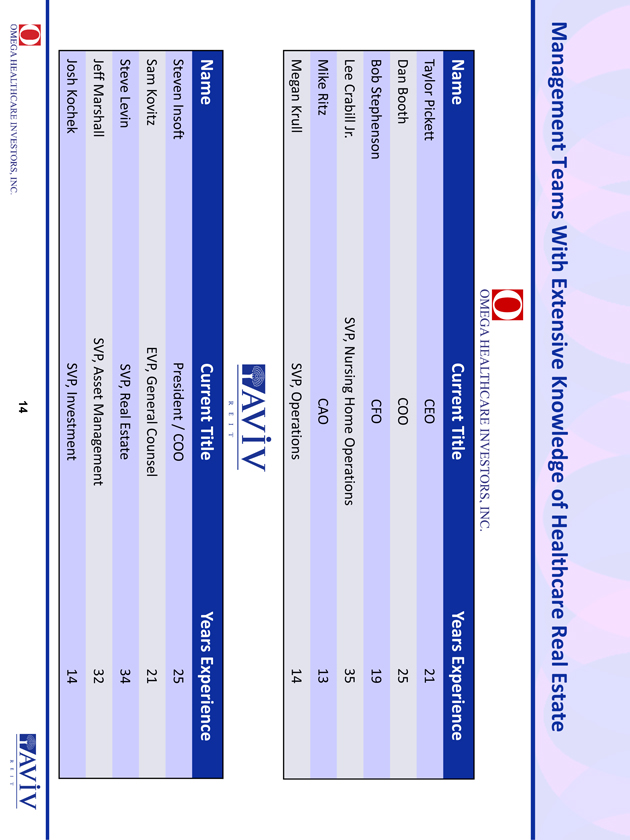
Management Teams With Extensive Knowledge of Healthcare Real Estate
Name Current Title Years Experience
Taylor Pickett CEO 21
Dan Booth COO 25
Bob Stephenson CFO 19
Lee Crabill Jr. SVP, Nursing Home Operations 35
Mike Ritz CAO 13
Megan Krull SVP, Operations 14
Name Current Title Years Experience
Steven Insoft President / COO 25
Sam Kovitz EVP, General Counsel 21
Steve Levin SVP, Real Estate 34
Jeff Marshall SVP, Asset Management 32
14
Josh Kochek SVP, Investment 14
|
|
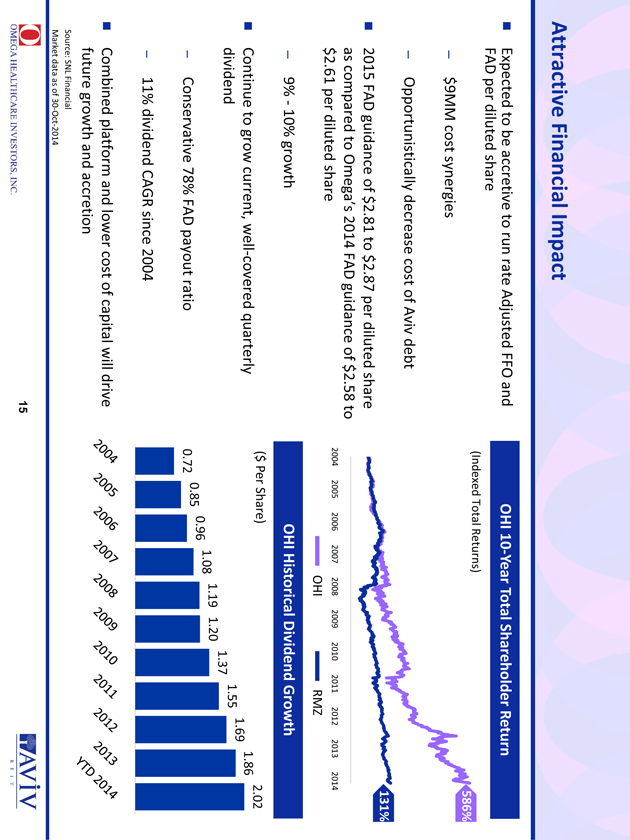
Attractive Financial Impact
Expected to be accretive to run rate Adjusted FFO and FAD per diluted share $9MM cost synergies OHI 10 Year Total Shareholder Return (Indexed Total Returns) 586% – Opportunistically decrease cost of Aviv debt
2015 FAD guidance of $2.81 to $2.87 per diluted share 131% 2004 2005 2006 2007 2008 2009 2010 2011 2012 2013 2014 as compared to Omega’s 2014 FAD guidance of $2.58 to $2.61 per diluted share
– 9% 10% growth OHI RMZ OHI Historical Dividend Growth 0.72 0.85 0.96 1.08 1.19 1.20 1.37 1.55 1.69 1.86
2.02 Continue to grow current, well covered quarterly dividend – Conservative 78% FAD payout ratio ($ Per Share) p y
– 11% dividend CAGR since 2004 Combined platform and lower cost of capital will drive f t th d ti 15
future growth and accretion Source: SNL Financial Market data as of 30 Oct 2014
|
|
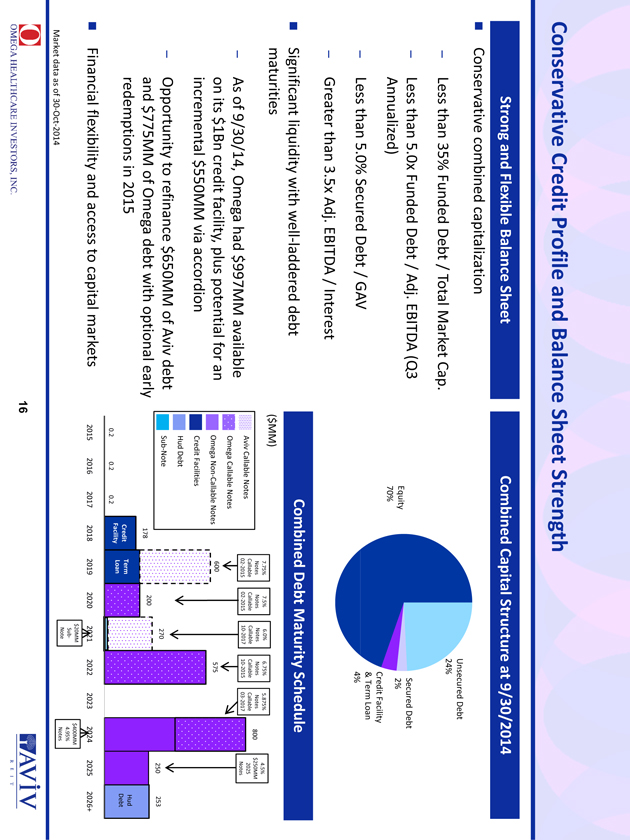
Conservative Credit Profile and Balance Sheet Strength Unsecured Debt 24% Combined Capital Structure at /30/2014 Conservative combined capitalization Strong and Flexible Balance Sheet Secured Debt 2% Credit Facility & Term Loan Equity 70% – Less than 35% Funded Debt / Total Market Cap. – Less than 5.0x Funded Debt / Adj. EBITDA (Q3 Annualized) – Less 5 0%Secured Debt / 4% Combined Debt Maturity Schedule than 5.0% AV
– Greater than 3.5x Adj. EBITDA / Interest Significant liquidity with well laddered debt maturities ($MM) 4.5% $250MM 2025 Notes 6.0% Notes Callable 10 2017 7.5% Notes Callable 02 2015 6.75% Notes Callable 10 2015 5.875% Notes Callable 03 2017 7.75% Notes Callable 02 2015 575 800 – As of 9/30/14, mega had $997MM available on its $1Bn credit facility, plus potential for an incremental $550MM via accordion 600 Aviv Callable Notes Omega Callable Notes Credit Facilities Omega Non Callable Notes Hud Debt 0.2 0.2 0.2 Hud Credit Debt Facility Term Loan 178 200 270 250 253 2015 2016 2017 2018 2019 2020 2021 2022 2023 2024 025 2026+ – Opportunity to refinance $650MM of Aviv debt and $775MM of Omega debt with optional early redemptions in 2015 flexibility and access Sub Note 16 Market data as of 30 Oct 2014 $400MM 4.95% Notes $20MM Sub Note
Financial to capital markets
|
|
Vision for Success
Leverage our unique consolidation strategy, our management knowledge and expertise and
operator relationships to continue owning, acquiring and developing SNFs
Leverage our disciplined approach and cost of capital advantage to fund accretive transactions
Continue to strengthen the credit quality of our tenant relationships
Continue to improve the quality of our properties and overall portfolio
Continue to maintain our strong balance sheet with minimal maturity and interest rate risk
Continue to deliver meaningful dividend growth and total shareholder returns
17
|
|
Certain Non GAAP Information
Funds From Operations (“FFO”), Adjusted FFO and Adjusted Funds Available for Distribution (“FAD”) are not financial measures calculated or presented in accordance with generally accepted accounting principles in the United States (“GAAP”). The Company calculates and reports FFO in accordance with the definition and interpretive guidelines issued by the National Association of Real Estate Investment Trusts (“NAREIT”), and consequently, FFO is defined as net income available to common stockholders, adjusted for the effects of asset dispositions and certain non cash items, primarily depreciation and amortization and impairments on real estate assets. The Company references FFO, Adjusted FFO and FAD as important supplemental measures of its operating performance and not as measures of liquidity or cash flow. FFO, Adjusted FFO and FAD are not measures of financial performance under GAAP and should not be considered measures of liquidity, alternatives to net income or indicators of any other performance measure determined in accordance with GAAP. Investors and potential investors in the Company’s securities should not rely on these measures as a substitute for any GAAP measure, including net income. Adjusted FFO is calculated as FFO available to common stockholders excluding the impact of non cash stock based compensation and certain revenue and expense items identified above. FAD is calculated as Adjusted FFO less non cash interest expense and non cash revenue, such as straight line rent. The Company believes these measures provide an enhanced measure of the operating performance of the Company’s core portfolio as a REIT. The Company’s computation of adjusted FFO and FAD are not comparable to the NAREIT definition of FFO or to similar measures reported by other REITs, but the Company believes that they are p y y appropriate measures for this Company.
18