Attached files
| file | filename |
|---|---|
| 8-K - 8-K - Mastercard Inc | d811638d8k.htm |
| EX-99.1 - EX-99.1 - Mastercard Inc | d811638dex991.htm |
Exhibit 99.2
|
|
MasterCard Incorporated Third-Quarter 2014
Financial Results Conference Call
October 30, 2014
©2014 MasterCard.
Proprietary
|
|
Page 2
Business Update
Financial & Operational Overview
Economic Update
Business Highlights
©2014 MasterCard.
Proprietary
|
|
Page3
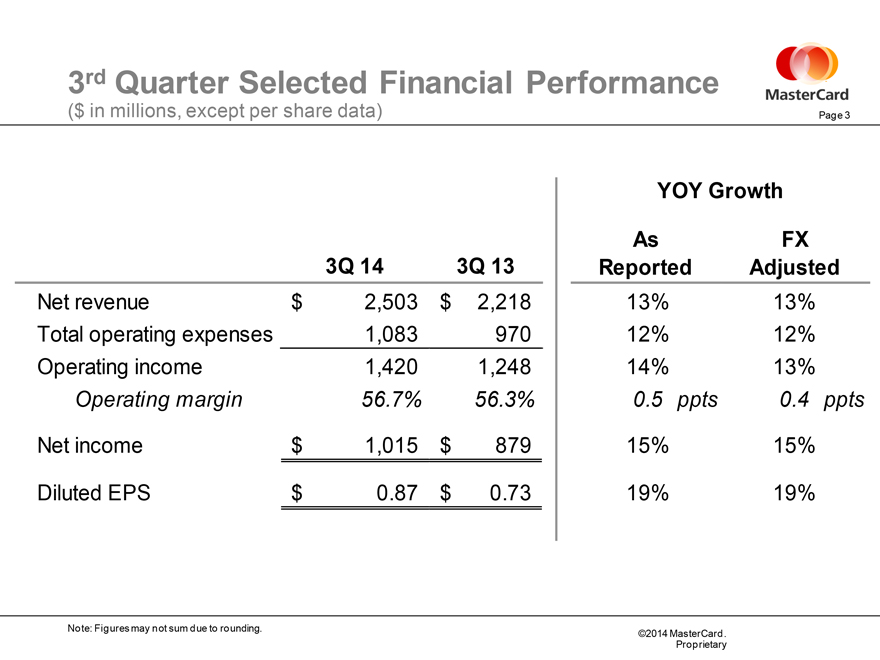
3rd Quarter Selected Financial Performance
($ in millions, except per share data)
YOY Growth
As FX
3Q 14 3Q 13 Reported Adjusted
Net revenue $ 2,503 $ 2,218 13% 13%
Total operating expenses 1,083 970 12% 12%
Operating income 1,420 1,248 14% 13%
Operating margin 56.7% 56.3% 0.5 ppts 0.4 ppts
Net income $ 1,015 $ 879 15% 15%
Diluted EPS $ 0.87 $ 0.73 19% 19%
Note: Figures may not sum due to rounding.
©2014 MasterCard.
Proprietary
|
|
Page 4
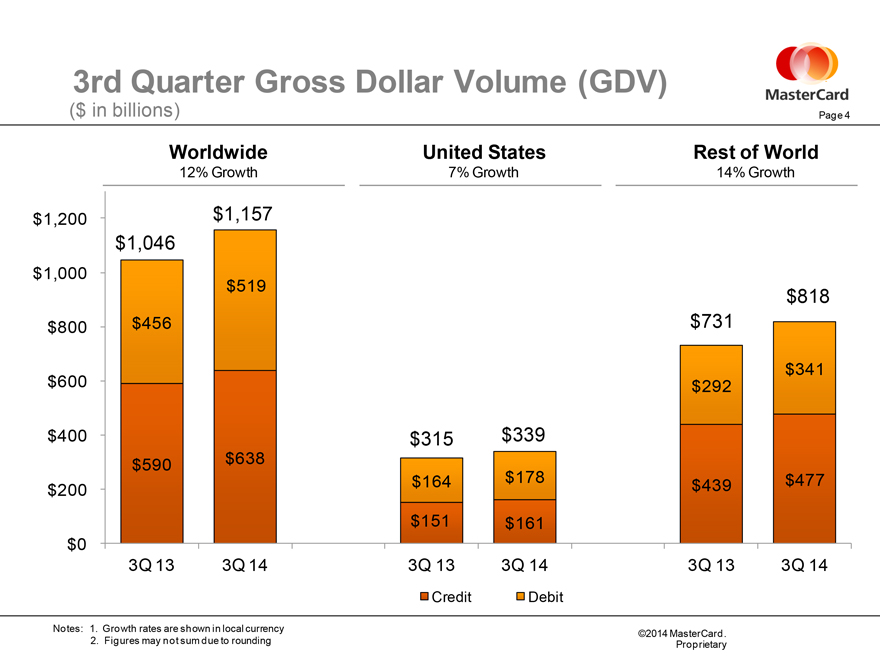
3rd Quarter Gross Dollar Volume (GDV)
($ in billions)
4
Worldwide United States Rest of World
12% Growth 7% Growth 14% Growth
$1,200 $1,157
$1,046
$1,000
$519 $818
$800 $456 $ 731
$341
$600 $292
$400 $315 $339
$590 $638
$200 $164 $178 $439 $477
$ 151 $161
$0
3Q 13 3Q 14 3Q 13 3Q 14 3Q 13 3Q 14
Credit Debit
Notes: 1. Growth rates are shown in local currency
2. Figures may not sum due to rounding
©2014 MasterCard.
Proprietary
|
|
Page 5
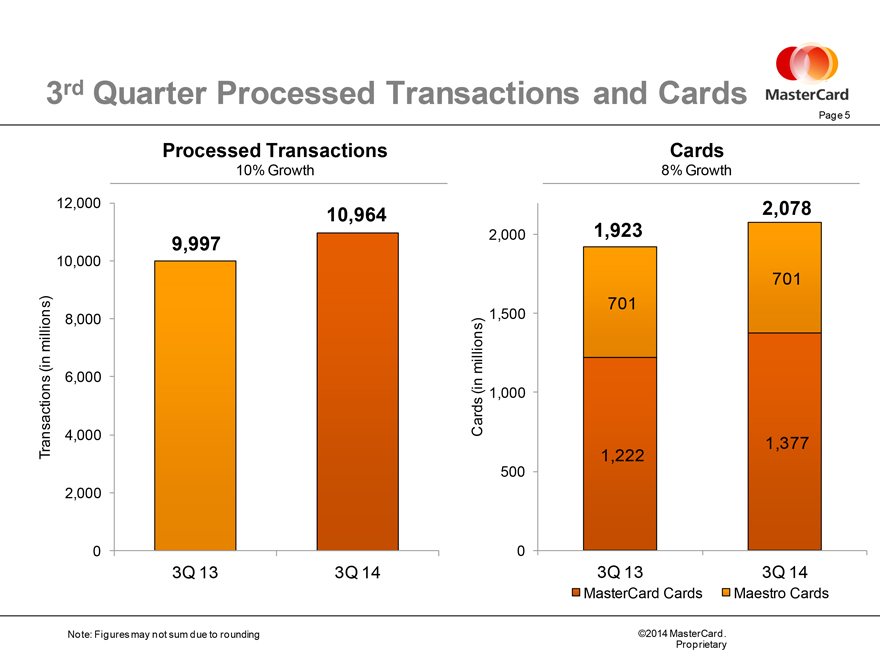
3rd Quarter Processed Transactions and Cards
5
Processed Transactions
10% Growth
12,000
10,964
9,997
10,000
millions) 8,000
(in
6,000
Transactions 4,000
2,000
0
3Q 13 3Q 14
Cards
8% Growth
2,078
2,000 1,923
701
701
millions) 1,500
(in 1,000
Cards
1,377
1,222
500
0
3Q 13 3Q 14
MasterCard Cards Maestro Cards
Note: Figures may not sum due to rounding
©2014 MasterCard.
Proprietary
|
|
Page 6
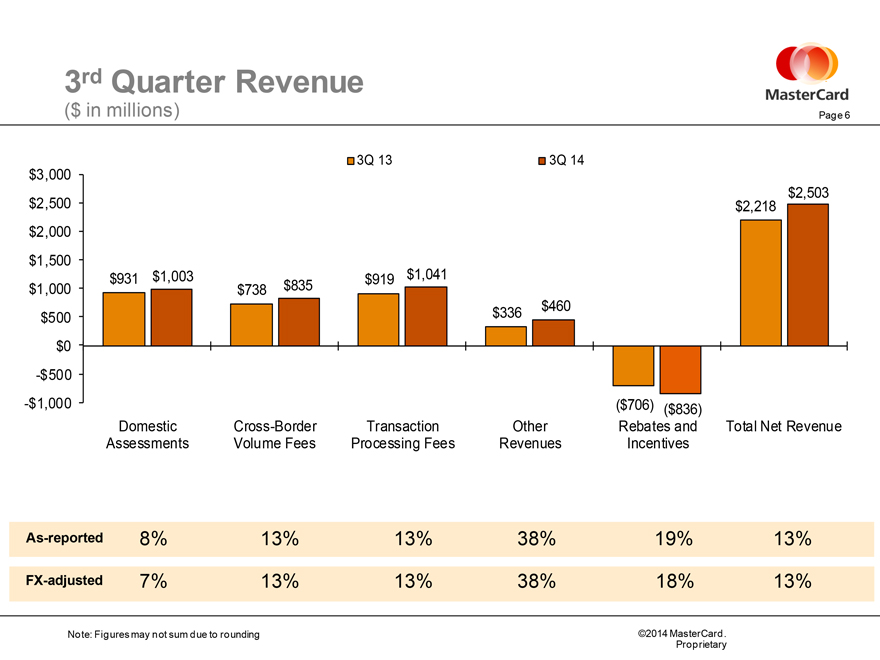
3rd Quarter Revenue
($ in millions)
3Q 13 3Q 14
$3,000
$2,503
$2,500 $2,218
$2,000
$1,500
$931 $1,003 $919 $1,041
$1,000 $738 $835
$460
$500 $336
$0
-$ 500
-$ 1,000($706) ($836)
Domestic Cross-Border Transaction Other Rebates and Total Net Revenue
Assessments Volume Fees Processing Fees Revenues Incentives
As-reported 8% 13% 13% 38% 19% 13%
FX-adjusted 7% 13% 13% 38% 18% 13%
Note: Figures may not sum due to rounding
©2014 MasterCard.
Proprietary
|
|
Page 7
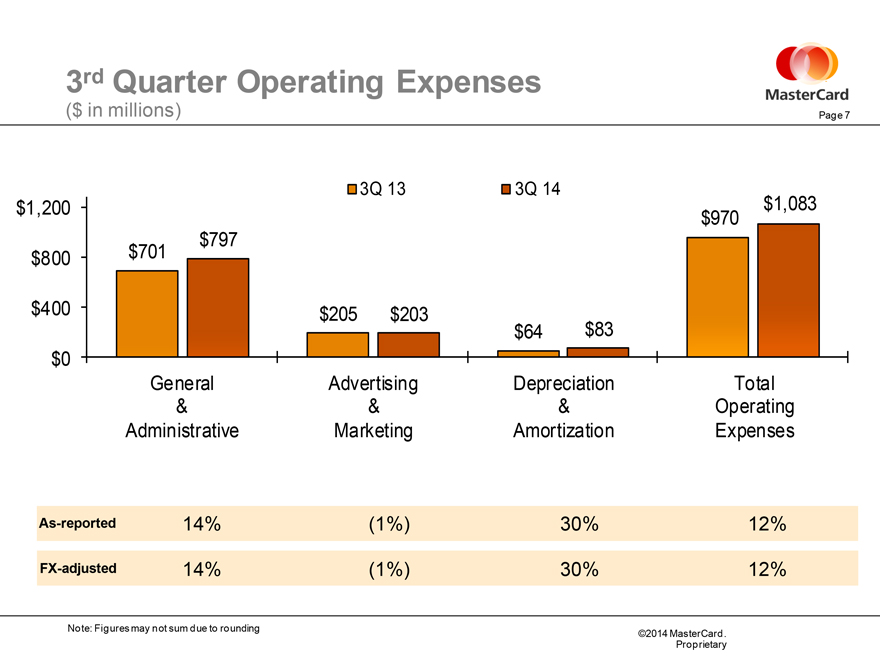
3rd Quarter Operating Expenses
($ in millions)
3Q 13 3Q 14
$1,200 $1,083
$970
$797
$800 $701
$400 $205 $203
$64 $83
$0
General Advertising Depreciation Total
& & & Operating
Administrative Marketing Amortization Expenses
As-reported 14%(1%) 30% 12%
FX-adjusted 14%(1%) 30% 12%
Note: Figures may not sum due to rounding
©2014 MasterCard.
Proprietary
|
|
Page 8
Thoughts for the Future
Business update through October 21
Long-Term Performance Objectives
Thoughts for 2014
Revenue
Expenses
Impact from Acquisitions
Tax Rate
FX Impact
©2014 MasterCard.
Proprietary
|
|

MasterCard
|
|
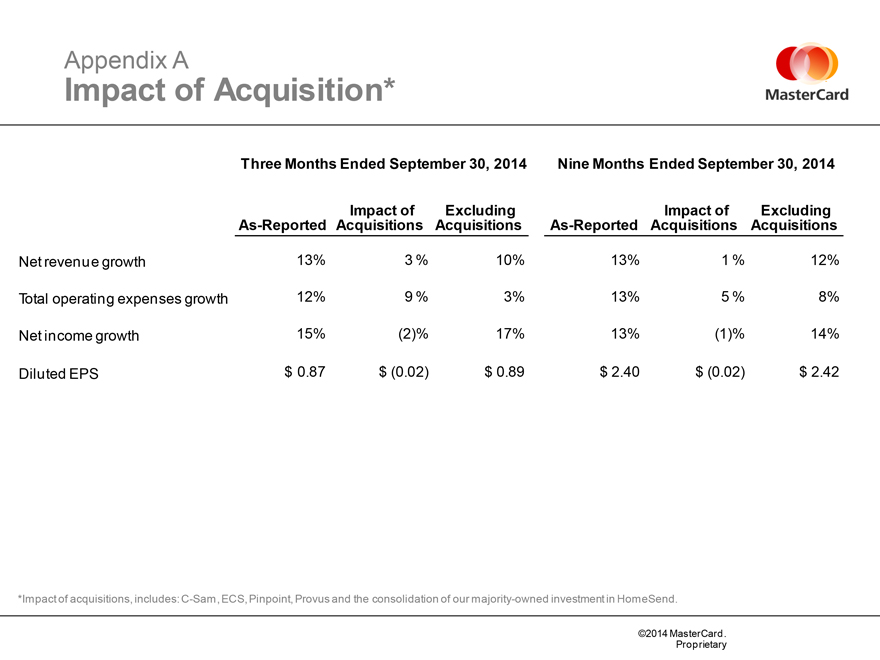
Appendix A
Impact of Acquisition*
Three Months Ended September 30, 2014 Nine Months Ended September 30, 2014
Impact of Excluding Impact of Excluding
As-Reported Acquisitions Acquisitions As-Reported Acquisitions Acquisitions
Net revenue growth 13% 3 % 10% 13% 1 % 12%
Total operating expenses growth 12% 9 % 3% 13% 5 % 8%
Net income growth 15%(2)% 17% 13%(1)% 14%
Diluted EPS $ 0.87 $ (0.02) $ 0.89 $ 2.40 $ (0.02) $ 2.42
*Impact of acquisitions, includes: C-Sam, ECS, Pinpoint, Provus and the consolidation of our majority-owned investment in HomeSend.
©2014 MasterCard.
Proprietary