Attached files
| file | filename |
|---|---|
| 8-K - FORM 8-K - Kearny Financial Corp. | d812254d8k.htm |
| EX-99.1 - EX-99.1 - Kearny Financial Corp. | d812254dex991.htm |
 Exhibit 99.2 |
 Forward-Looking Statements
2
This
presentation
may
include
certain
“forward-looking
statements,”
which
are
made
in
good
faith
by
Kearny
Financial
Corp.
(the
“Company”)
pursuant
to
the
“safe
harbor”
provisions
of
the
Private
Securities
Litigation
Reform
Act
of
1995.
These forward-looking statements involve risks and uncertainties, such as
statements of the Company’s plans, objectives, expectations,
estimates and intentions that are subject to change based on various important factors (some of
which
are
beyond
the
Company’s
control).
In
addition
to
the
factors
described
under
Item
1A.
Risk
Factors
in
the
Company’s Annual Report on Form 10-K, the following factors, among
others, could cause the Company’s financial performance to differ
materially from the plans, objectives, expectations, estimates and intentions expressed in such
forward-looking statements:
•
the strength of the United States economy in general and the strength of the
local economy in which the Company conducts operations,
•
the effects of and changes in, trade, monetary and fiscal policies and laws,
including interest rate policies of the Board of Governors of the Federal
Reserve System, inflation, interest rates, market and monetary
fluctuations, •
the
impact
of
changes
in
financial
services
laws
and
regulations
(including
laws
concerning
taxation,
banking, securities and insurance),
•
changes in accounting policies and practices, as may be adopted by regulatory
agencies, the Financial Accounting Standards Board (“FASB”) or
the Public Company Accounting Oversight Board, •
technological changes.
•
•
the
success
of
the
Company
at
managing
the
risks
involved
in
the
foregoing
and
managing
its
business.
The Company cautions that the foregoing list of important factors is not
exclusive. The Company does not undertake to update any
forward-looking statement, whether written or oral, that may be made from time to time
by or on behalf of the Company.
competition among financial services providers and,
|
 •
Kearny is committed to meeting the financial needs of the
individuals, businesses, and communities we serve throughout
Northern and Central New Jersey and the New York metro area.
•
By providing a superior level of service, we hope to earn long-
term loyalty and become a financial partner for many years to
come. Whether it is a loan request, information on a deposit
product or assistance with one of our other financial services, we
pledge to respond quickly, professionally and in a manner that
puts customers’
needs first.
•
We value and respect our customers and employees and will
strive to maintain an environment within which employees will
want to work and customers will want to bank.
Overview
3
Mission statement |
 •
Founded in 1884
•
3
th
Largest
publicly
traded
mutual
holding
company
in the country
•
6
th
Largest
financial
institution
headquartered
in
New Jersey
•
Market capitalization ($896.1 million)
Company Overview
4
Note: Financial data as of June 30, 2014; Market data as of October 28, 2014
($ Millions)
Assets
$3,510
Net Loans
$1,729
Deposits
$2,480
Equity
$495
Tang. Common Equity/Tang. Assets
11.33%
Number of Branches
42
6/30/2014 |
 Progressive community bank
Experienced management team
Seasoned acquirer and integrator
Best of breed technology platform
Stable financial condition
Well-capitalized balance sheet
Kearny Financial Corp. Background
5
Our Strengths |
 Kearny Financial Corp. Background
6
Growth through strategic mergers & acquisitions
Seller
Completed
Type
Assets
($000)
Branches
1
st
Bergen Bancorp
3/31/1999
Thrift
300,755
4
Pulaski Bancorp, Inc. MHC
10/18/2002
Thrift
237,596
6
West Essex Bancorp
7/1/2003
Thrift
390,333
8
Central Jersey Bancorp
11/30/2010
Bank
571,295
13
Atlas Bank
6/30/2014
Thrift
110,480
2
Acquire niche talent
Expand geographic diversity
Grow market share
Acquire new business lines
Leverage capital
Source: SNL Financial |
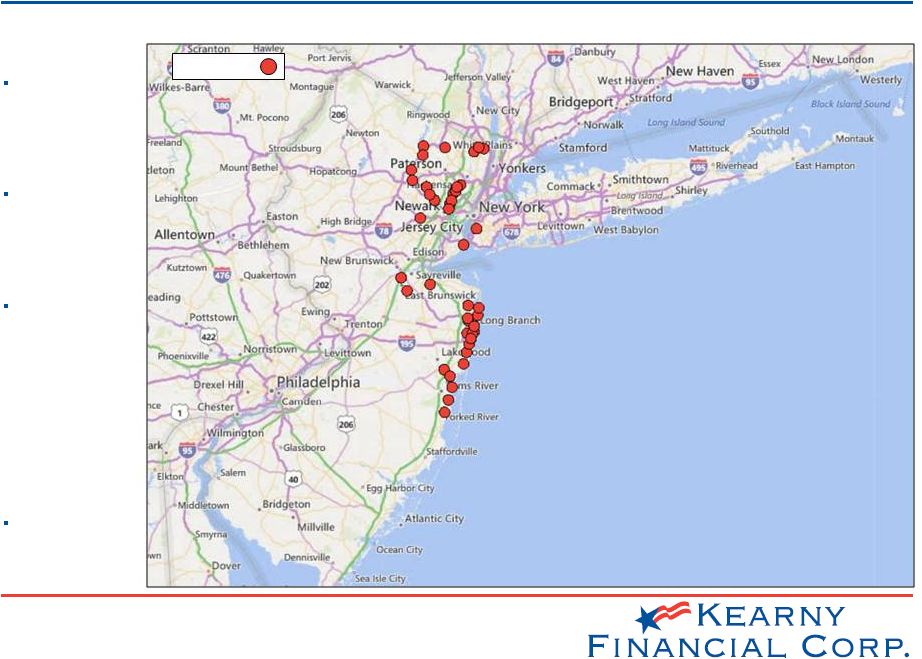 Deposit Franchise
7
Strong deposit franchise
Source: SNL Financial
6 largest New
Jersey based
deposit
franchise
$59.0 million in
average
deposits per
branch
42 branch
locations across
11 counties
throughout
Northern and
Central New
Jersey, and the
greater New
York City area
$2.48 billion in
deposits as of
June 30, 2014
KRNY (42)
th |
 Deposit Market Demographics
8
…with the ability to attract customers from across our footprint
(1)
Defined as the New York-Northern New Jersey-Long Island MSA.
Note: Deposit market share data as of June 30, 2014
Source: SNL Financial
Attractive
markets:
part
of
largest
MSA
in
the
U.S.
Weighted average median household income of Kearny franchise counties: $71,975 vs. $51,579 median
household income nationwide Household income poised to grow
Projected population growth in Kearny’s primary NJ counties of operation
2.36% vs. 1.64% for the entire state of New Jersey
Opportunities still exist for organic growth in existing branch footprint
1
Mkt.
Pct. Of Kearny
Median HH
Projected HH
Projected
Deposits
Share
MHC Deposits
Income
Income Change
Population Change
County
Branches
($M)
(%)
(%)
($)
2014-2019 (%)
2014-2019 (%)
Bergen, NJ
9
766.9
1.78
30.80
79,746
3.45
2.77
Hudson, NJ
2
505.9
1.78
20.32
59,841
8.75
4.58
Monmouth, NJ
12
473.3
2.31
19.01
80,904
3.09
0.03
Ocean, NJ
6
182.5
1.26
7.33
57,972
2.57
1.39
Morris, NJ
3
145.2
0.64
5.83
91,208
(0.14)
2.10
Middlesex, NJ
3
128.4
0.45
5.16
75,361
3.47
3.02
Essex, NJ
3
128.2
0.53
5.15
52,919
3.52
1.03
Kings, NY
1
58.5
0.14
2.35
44,890
6.75
4.12
Union, NJ
1
46.6
0.20
1.87
68,442
4.59
2.69
Richmond, NY
1
27.6
0.26
1.11
70,814
4.72
0.84
Passaic, NJ
1
27.0
0.25
1.09
53,787
2.28
0.77
42
2,490.2
100.00
Kearny MHC - Deposit Market Share by County |
 Kearny Financial Corp.
9
Deposit composition and strategies
Source: Company Filings, SNL Financial
•
Internal Strategies
Cultural transformation continued in 2014
Introduced Private Banker concept for high net-worth commercial and retail customers
Added small business bankers to improve volume
•
Results
Growth in core deposit balances continues
Increase in demand and NOW accounts
Retail Time
Deposits
47%
Jumbo Time
Deposits
14%
Demand
4%
NOW
7%
MMDA &
Savings
28%
Retail Time
Deposits
37%
Jumbo Time
Deposits
4%
Demand
9%
NOW
14%
MMDA &
Savings
36%
Deposits - June 30, 2007
Deposits - June 30, 2014
Retail
Banking
Group
training
leadership,
professionalism,
sales,
and
customer
service
: |
 Kearny Financial Corp.
10
Composition of loan portfolio
•
Last
fiscal
year
net
loan
growth
of
28%
•
Loan portfolio mix continues to shift
•
Strong growth in CRE & Multifamily category
June
June
June
June
June
June
June
June
2007
2008
2009
2010
2011
2012
2013
2014
1-4 Family
64.5%
66.9%
65.9%
65.5%
48.2%
43.8%
36.8%
39.1%
CRE & Multifamily
18.4%
17.4%
18.9%
20.0%
30.3%
37.8%
49.0%
56.2%
Construction
1.3%
1.2%
1.3%
1.5%
1.7%
1.6%
0.8%
0.7%
Consumer
12.7%
10.7%
10.5%
10.8%
8.7%
8.5%
8.2%
0.2%
C&I
0.5%
0.8%
1.4%
1.4%
8.3%
6.9%
5.2%
3.8%
Other
2.6%
3.0%
2.0%
0.8%
2.9%
1.4%
0.0%
0.0%
(1) Note: Loan growth includes integration of loans of Atlas
Bank Source: Company Filings, SNL Financial
1 |
 •
Expand upon expertise in commercial real estate, multifamily, and SBA
lending Continue to hire additional commercial lending personnel to
increase market share Business development officers continue to work
collaboratively with the retail branch network to further
develop/strengthen small business deposit, loan, and merchant business
relationships •
Rationale for commercial lending over residential lending
Commercial lending offers opportunity to lend at higher yields
Relationship based commercial lending requires borrower to establish meaningful
deposits
•
Recent developments
Entered NYC commercial real estate lending market
Focused on originating larger commercial real estate and multi-family
loans Launched new SBA product (discounted guarantee fees)
Kearny Financial Corp.
11
Organic loan growth strategies |
 Kearny Financial Corp.
12
Commercial lending success continues |
 Kearny Financial Corp.
13
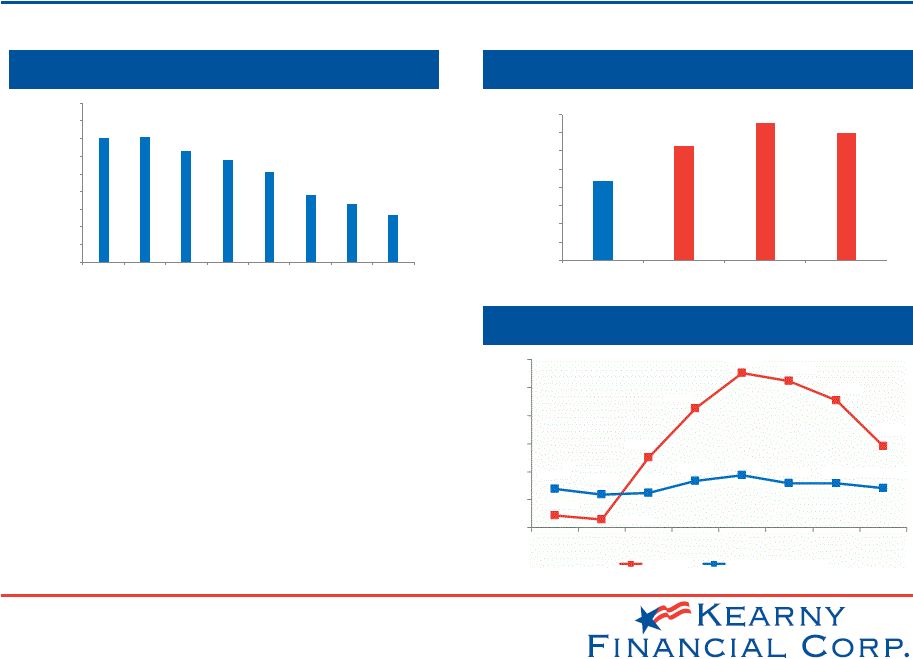
NPA / Assets trend
(1)
All MHCs that are publicly traded
(2)
The group is comprised of publicly traded banks and thrifts
Source: SNL Financial
•
Asset quality continues to improve
•
Level
of
“classified
assets”
declined
by
18.5%
year
over year
•
Minimal level of NPAs as compared to the industry
NPAs / Assets
Industry Comparison: NPAs / Assets
0.87%
1.26%
1.51%
1.40%
0.00%
0.20%
0.40%
0.60%
0.80%
1.00%
1.20%
1.40%
1.60%
KRNY
All MHC
New Jersey
Publicly Traded
Nationwide
Publicly Traded
1.30
1.31
1.23
1.18
1.11
0.98
0.93
0.87
0.60
0.70
0.80
0.90
1.00
1.10
1.20
1.30
1.40
1.50
Sep
2012
Dec
2012
Mar
2013
Jun
2013
Sep
2013
Dec
2013
Mar
2014
Jun
2014
ALL vs. NPLs
0.22%
0.15%
1.26%
2.13%
2.76%
2.61%
2.27%
1.45%
0.70%
0.59%
0.62%
0.84%
0.93%
0.79%
0.80%
0.71%
0.00%
0.50%
1.00%
1.50%
2.00%
2.50%
3.00%
2007
2008
2009
2010
2011
2012
2013
2014
NPLs/Loans
Reserves/Loans |
 Kearny Financial Corp.
14
Summary income statement
(1)
Related to a one-time
nonrecurring debt extinguishment expense in March 2013 (2)
Resulting from system conversion and merger-related expenses
Source: Company Financial Statements
(dollars in thousands, except EPS)
FY 2012
FY 2013
FY 2014
Net Interest Income
$70,180
$66,257
$73,821
Provision for Loan Losses
5,750
4,464
3,381
Loss on sale and write down of REO
(3,330)
(775)
(441)
Gain on Sale of Securities
47
10,427
1,517
Other Non-Interest Income
5,428
6,736
7,047
Restructuring, Conversion and Merger Charges
--
8,688
2,331
Other Non-Interest Expense
58,721
60,737
61,827
Income Tax Expense
2,776
2,250
4,217
Net Income
5,078
6,506
10,188
Diluted EPS
$0.08
$0.10
$0.16
1
1
2 |
 Kearny Financial Corp.
15
Net Interest Margin
(1)
NJ Peers includes all public banks and thrifts headquartered in New Jersey
Source: SNL Financial
1
2.43%
2.54%
2.81%
2.83%
2.79%
2.65%
2.50%
2.44%
3.34%
3.40%
3.24%
3.65%
3.75%
3.59%
3.44%
3.38%
1.00%
1.50%
2.00%
2.50%
3.00%
3.50%
4.00%
2007
2008
2009
2010
2011
2012
2013
2014
KRNY
NJ Peers |
 •
Completed Bank technology platform conversions Q3 2014
•
Restructured SBA Lending group
•
Closed Atlas Bank acquisition June 30, 2014
•
Developed Executive & Employee Compensation programs to align with
company strategic goals, probability focus, and long term shareholder
value creation
•
Continue to evaluate fee income based business lines such as the
acquisition of an insurance agency
Kearny Financial Corp.
16
Strategic review -
2014 |
 Second Step Summary
On September 5, 2014 Kearny filed a registration statement in connection
with
its
second
step
conversion
from
a
mutual
holding
company
to
a
stock
holding company
Reasons for the offering
Support growth
Eliminate uncertainties associated with the mutual holding company
structure Transition to a more familiar and flexible form of
ownership Facilitate additional mergers and acquisitions
In connection with the conversion a new charitable foundation will be
established by the new stock holding company with a $10.0 million
contribution
consisting
of
$5.0
million
of
common
stock
and
$5.0
million
in
cash
Kearny Financial Corp.
17
Strategic Focus -
2015 |
 •
Close second step offering
•
C&I business team build-out
expected to occur over the next three quarters
•
Continue to expand the commercial lending team in NYC via LPO
•
Develop
regional
advisory
board
of
COIs
to
help
with
loan
growth
and
relationship building
•
Continued reallocation of earning assets from investments into loans
•
Refresh current company brand with new logo & tag line
Kearny Financial Corp.
18
Strategic Focus -
2015 |
 Kearny Financial Corp.
19
Strategic Focus -
2015 |
 •
Enhance current product offerings and business services utilizing the
Bank’s new technology platforms
–
“Mobiliti”
-
a new mobile banking /payment services application
–
“Popmoney”
–
a quick and secure way for customers to send and receive money
–
“OpenNow/FundNow”
–
online account origination system
Kearny Financial Corp.
20
Strategic Focus -
2015 |
 Kearny Financial Corp.
21
Strategic Focus -
2015 |