Attached files
| file | filename |
|---|---|
| 8-K - FORM 8-K - HYSTER-YALE MATERIALS HANDLING, INC. | d811877d8k.htm |
| EX-99.2 - EX-99.2 - HYSTER-YALE MATERIALS HANDLING, INC. | d811877dex992.htm |
 1
Exhibit 99.1
Investor Presentation
October 30, 2014 |
 1
Safe Harbor Statement
The following information includes forward-looking statements within the meaning of
Section 27A of the Securities Act of 1933, as amended, and Section 21E of the
Securities Exchange Act of 1934, as amended. Any and all statements regarding the Company’s
expected future financial position, results of operations, cash flows, business
strategy, budgets, projected costs, capital expenditures, products, competitive
positions, growth opportunities, plans, goals and objectives of management for future operations, as well as
statements that include words such as “anticipate,” “if,”
“believe,” “plan,” “estimate,” “expect,” “intend,” “may,” “could,” “should,” “will,” and
other similar expressions are forward-looking statements. Such forward-looking
statements are inherently uncertain, and readers must recognize that actual
results may differ materially from the expectations of the Company’s management. The Company does not
undertake a duty to update such forward-looking statements. Among the factors that
could cause plans, actions and results to differ materially from current
expectations include, without limitation, reduction in demand for lift trucks and related aftermarket parts and
service on a global basis, the ability of dealers, suppliers and end-users to
obtain financing at reasonable rates, or at all, as a result of current economic
and market conditions, the political and economic uncertainties in Eastern Europe and Brazil, customer acceptance of
pricing, delays in delivery or increases in costs, including transportation costs, of
raw materials or sourced products and labor or changes in or unavailability of
quality suppliers, exchange rate fluctuations, changes in foreign import tariffs and monetary policies and other
changes in the regulatory climate in the foreign countries in which the Company
operates and/or sells products, delays in manufacturing and delivery schedules,
bankruptcy of or loss of major dealers, retail customers or suppliers, customer acceptance of, changes in the
costs of, or delays in the development of new products, introduction of new products
by, or more favorable product pricing offered by, competitors, product liability
or other litigation, warranty claims or returns of products, the effectiveness of the cost reduction programs
implemented globally, including the successful implementation of procurement and
sourcing initiatives, changes mandated by federal, state and other regulation,
including health, safety or environmental legislation and delays in or increased costs associated with the Brazil
plant construction and other risks identified in the Company’s Annual Report on
Form 10-K and other filings with the Securities and Exchange
Commission. Many of these factors are outside of the Company’s control.
|
 2
Hyster-Yale Snapshot
Hyster-Yale Materials Handling, Inc. (NYSE:HY)
Leading global designer, manufacturer and marketer of lift
trucks and provider of aftermarket parts and support
Headquartered in Cleveland, Ohio
Over 5,200 employees globally
LTM
9/30/14
Revenue
–
$2.8
billion
LTM 9/30/14 Net income
(1)
-
$109.1 million
LTM 9/30/14 EBITDA
(1)(2)
–
$183.1 million
9/30/14
Net
cash
–
$59.6
million
LTM 9/30/14 ROTCE
(1)(2)
of 28.6% (Net cash basis)
(1)
Net income, EBITDA and ROTCE for the LTM 9/30/14 include a $17.7 million pre-tax
gain on the sale of the Brazil land and facility.
(2)
EBITDA and ROTCE are non-GAAP measures and should not be considered in isolation or
as a substitute for GAAP measures. For discussion of non-GAAP items and the related
reconciliations to GAAP measures, see pages starting on 20. |
 3
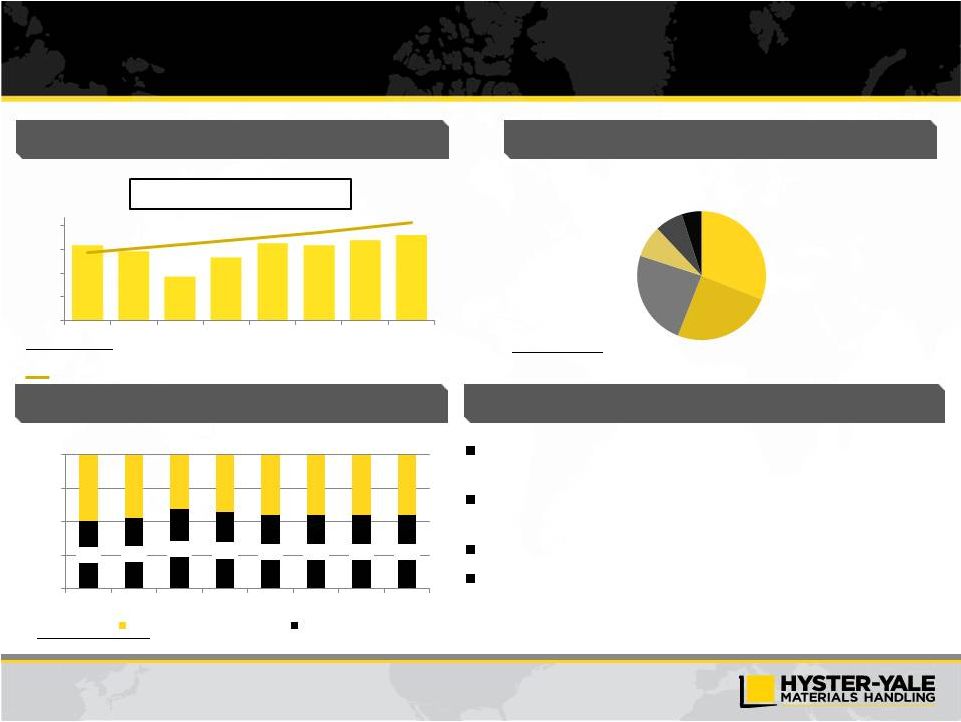
Growth similar to GDP levels in developed markets with emerging markets
driving expansion, particularly China.
Strong demand for warehouse and distribution industry applications in North
America and Western Europe
Increasing focus on electric truck technology development
Importance of total lifecycle cost of ownership
Key Themes
Industry Overview
(units in thousands)
Global Lift Truck Industry Size
Source: WITS. Represents order intake.
Global Lift Truck Industry Breakdown (Units)
Source: WITS. LTM 9/30/14 order intake.
Long-term CAGR (2003 –
2013) = 5.3%
(units in thousands)
Developed Market Warehouse Industry Growth
Source: WITS orders for North America and Western Europe
3
Europe
31%
China
25%
Americas
24%
Japan
8%
Asia Pacific
7%
Middle East & Africa
5%
951
872
547
794
975
944
1,009
1,071
0
300
600
900
1,200
2007
2008
2009
2010
2011
2012
2013
LTM Q3 14
50%
53%
59%
57%
55%
55%
55%
55%
0%
25%
50%
75%
100%
2007
2008
2009
2010
2011
2012
2013
LTM Q3 14
Counter Balanced
Warehouse
Trend line represents 5.3% CAGR from 2006-2008 Average Industry Size
|
 4
Economic Engine is Driven by Unit Volume
Geographic
and Product
Balance
Worldwide
Distribution
Strength to Drive
Market Share
Parts and Service
Volume
Large Lift Truck
Population in Service
Volume
Economies
of Scale
Design
Component Commonality
Supply Chain
Manufacturing
Quality
Marketing
Parts
Infrastructure
Capital Requirements
Drivers of long term competitive advantage
Basic Business Areas
A large lift truck population base drives parts and service volume resulting in enhanced
profitability for dealers and Hyster-Yale |
 5
Target Economics Goal and Gap to Target
Goal
is
to
achieve
minimum
operating
profit
margin
of
7%
at
mid-cycle
and
to
achieve
7%
operating
profit margin at the peak of the current market cycle
9/30/14 LTM Gap to Target Economics
Actual Operating Profit Margin: 5.4%
Margin variances:
(0.2%)
–
Unit margin
(0.9%)
–
Parts/other
+0.7%
Volume variances:
–
Manufacturing variances/other
(1.0%)
–
Operating Expenses
(1.0%)
Brazil gain:
+0.6%
Operating Profit % Gap
(1.6%)
Gap Excluding Brazil Gain
(1)
(2.2%)
Operating Profit $ Opportunity
(1)
$61m
Target Economics gap closure can be
achieved by:
1.
Increased margin on ICE trucks
-
Segmentation
-
Low cost of ownership
2.
Unit volume
-
Share growth
-
Stronger industry
-
Volume leverage
(1)
Gap excluding Brazil Gain of 0.6% is a non-GAAP measure and should not be considered
in isolation or as a substitute for the GAAP measure. Management believes that this measure assists the investor in understanding the results of operations.
|
 6
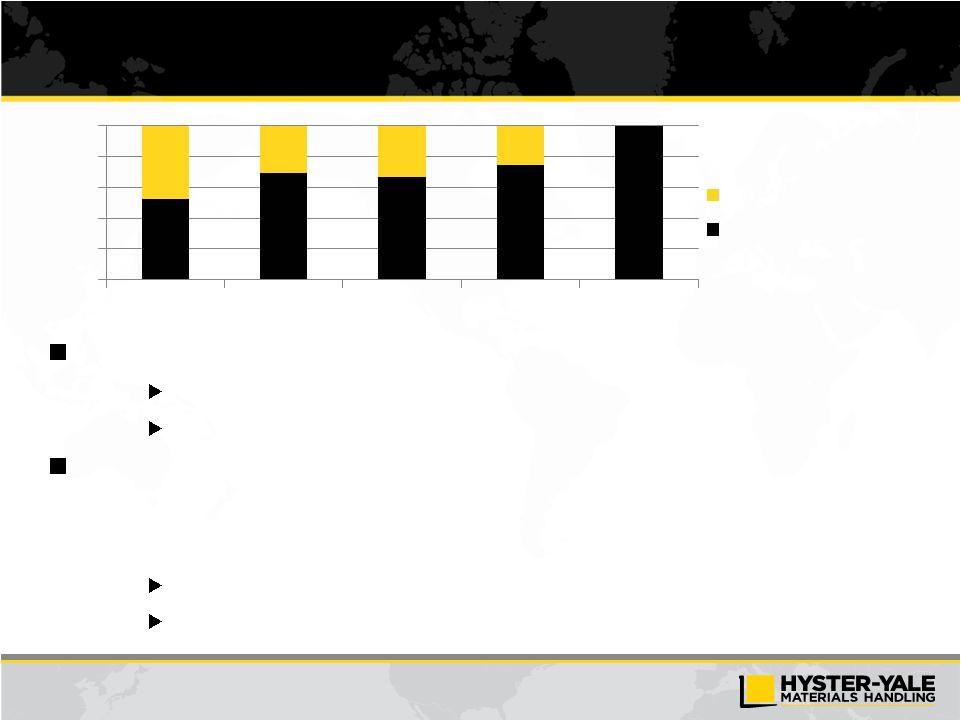
Leverage Gained from Moving Volume to Full
Manufacturing Capacity
Objective of minimum 25,000 unit volume increase from 2013 levels
$600m additional revenue
$70m+ incremental operating profit
Approximately $125m manufacturing fixed cost
–
Ability to produce 115,000* units annually
–
At capacity
Approximately $30m additional fixed cost absorption
Operating costs aligned with targets at increased sales volumes
* Excludes UTILEV and SN Products
48%
31%
33%
25%
0%
20%
40%
60%
80%
100%
2010
2011
2012
2013
2016-2017
Unused Capacity
Unit Volume |
 7
Over the Remainder of this Market Cycle, Target
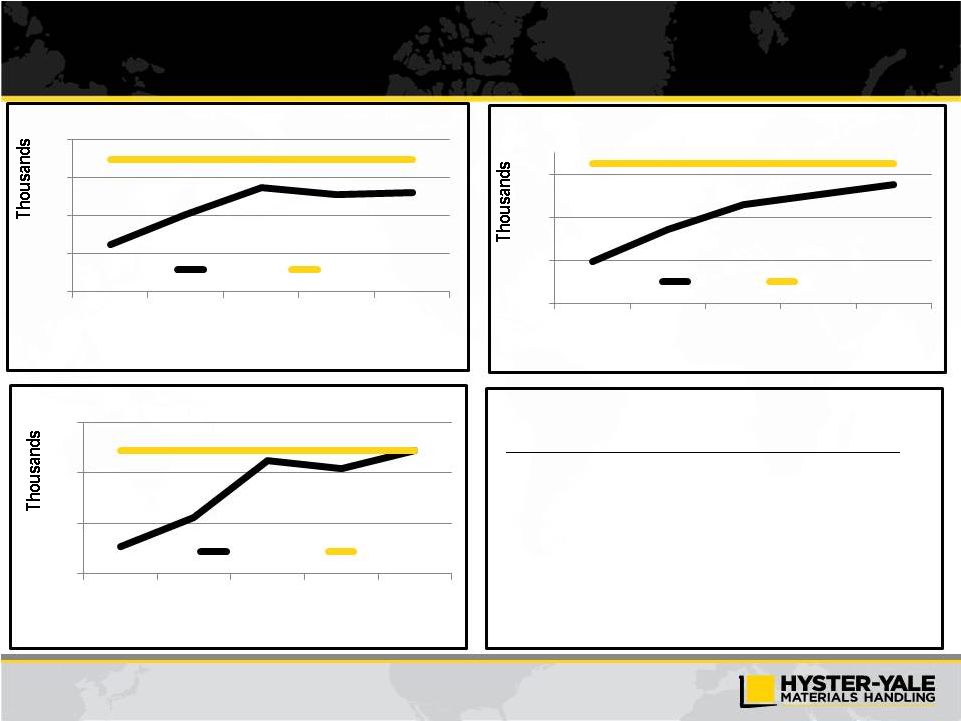
Volumes Driven by…
Share growth of approx. 2% pts
>
5 Strategic initiatives
Growth of 20-25% by 2018-2019*
Growth of 10-15% by 2016-2017*
Growth of 10-15% by 2017-2018*
* Growth is from 2013 levels.
100
200
300
400
500
2009
2010
2011
2012
2013
EMEA Industry
Actual
Prior Peak
50
100
150
200
2009
2010
2011
2012
2013
Americas Industry
Actual
Prior Peak
150
250
350
450
2009
2010
2011
2012
2013
Asia Industry
Actual
Peak
> 2 Supplemental initiatives
> Share growth is approximately
50% of volume increase required |
 8
Key Strategic & Supplemental Initiatives drive the
Economic Engine to Increased Share
Design
Component Commonality
Supply Chain
Manufacturing
Quality
Marketing
Parts
Infrastructure
Capital Requirements
Drivers of long term competitive advantage
Strategic and Supplemental Initiatives are designed to drive
increased share, which in turn increases the lift truck
population, which drives parts and service volumes.
Basic Business Areas
Geographic
and Product
Balance
Worldwide
Distribution
Strength
to
Drive
Market Share
Parts and Service
Volume
Large Lift Truck
Population in Service
Volume
Economies
of Scale
Crack the Code
in Warehouse
Leaders in
Independent
Distribution
Succeed in
Asia
Big Truck
Focus
Enhanced Sales and
Marketing Organization
Low Cost of
Ownership
Understand
Needs of
Customers |
 Applications
–
Global industry strategy teams
–
Initial focus on 8 industries
–
Early success in Metals and Trucking industries
–
Leveraging success across geographies
Strategic Objective
Status
Key Elements
Provide the right product and solution to meet
the specific needs of different customers across
multiple industries
Segmentation
–
Segmenting in all classes
–
Expanding Standard and Utility truck ranges
–
Improving the Premium truck ranges
–
Matching products to customer needs
Segmentation of products and industries
Development of Utility, Standard and Premium
products
Range of options to match needs of different
industries
Targeted sales and marketing effort
Enhanced Understanding of Customer
Needs to Drive Tailored Solutions
Win in Targeted Major Accounts and Applications
Outcome:
9 |
 10
Status
Key Elements
Masters of the World of Low Cost of Ownership
Deliver lowest cost of ownership for all of our
customers based on their specific application
Customer facing
–
Energy efficient product solutions
–
Factory fitted telematics
–
Enhanced fleet management capabilities
–
Increased lease residuals
–
Service repair costs reduced
–
Automation initiatives
Internal facing
–
Fewer, higher quality suppliers
–
Lean manufacturing
Understand major cost drivers:
Direct (truck price, fuel, service, operator, uptime)
Indirect (safety, litigation, pollution)
Strategic Objective
Competitive Advantage across Product Segments
Outcome:
10 |
 Strategic Objective
Status
Key Elements
Expand market penetration throughout Asia
Expanding production in India
Electrics
Big Trucks
Increased foreign brand share in China
Strategic relationship in China
New sales and marketing office in Malaysia
New financing program
Success with Japanese companies throughout
Asia
New dealers appointed
New products introduced
Organic growth through development of
dealer network and direct selling capabilities
Development of long term strategic
partnerships
Development of right products
Development of support infrastructure
Succeed in Asian Markets
Increase Share and Strengthen Distribution at Accelerated Pace
Outcome:
11 |
 Strategic Objective
Status
Key Elements
Develop the strongest independent
dealer network
New dealers recruited
Excellence programs enhanced
Enhanced sales specialization
Enhanced sales messaging
Dealer business plan process implemented
globally
New product configurator under
development
Awareness, participation and closure
tracking enhanced
Strengthened account identification and
coverage activities
Develop all dealers
Appoint / convert successful dealers
Expand number of dual line dealers
Enhance dealer value proposition
Combine dealer entrepreneurship with
OEM support
Enhanced Independent Distribution
Best Distribution Channels in the Industry
Outcome:
12 |
 Strategic Objective
Status
Key Elements
Strengthen penetration of the growing
warehouse segment
Increased NMHG and dealer sales specialization
Warehouse solutions groups formed
New products launched –
unique to market
Large customer wins
Enhanced selling tools developed
Enhance product ranges
Develop stronger direct sales capabilities
Develop dealer resources and specialization
Enhance marketing services and support
Significantly Improve Warehouse Business Position
Be a Top Tier Global Competitor in Warehouse Equipment
Outcome:
13 |
 14
Supplemental Initiatives
Big Truck Focus
–
New products
–
Specialist teams in each region
–
Global team coordination
–
Focus on industry and solutions
–
Success with large port operators
–
Comprehensive Tier 4 offering
Enhanced Sales and Marketing
Organization
–
Greater accountability for results
through smaller sales management
areas
–
Leaders provided with new tools and
enhanced reporting capabilities
–
Solutions Groups to develop product
specific expertise for customer clusters
–
Major focus on account identification
and coverage |
 15
Positive Environment for Hyster-Yale to Gain Share
and Margin Performance Over Next 3-5 Years
Product gaps filled to position Hyster-Yale in most application segments and
improve margins
Low-cost manufacturing base relative to German-centric and Japanese-centric
competitors
Second-tier competitors in the ICE segment more vulnerable due to their
weakened economy of scale position
Key warehouse segment competitors are regional
Key Big Truck segment competitors are niche
Over the longer-term, as key initiatives are executed and mature, share gains are
expected to occur. |
 16
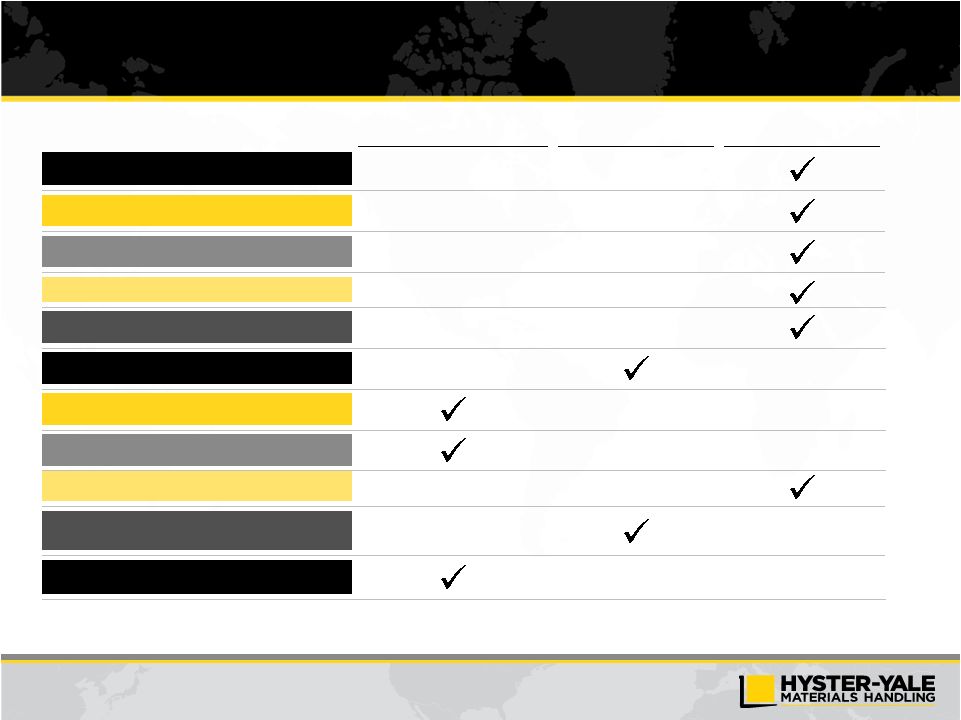
Share Gain Expected to Take Place Over Time as
Momentum is Gained in All Key Areas of Business
New Program
Developing
Achieved Momentum
Product Improvement
Supply Chain
Manufacturing
Quality
Pricing
Dealer Structure and Excellence
Account Identification/Coverage
Warehouse and Counterbalanced Solutions
Aftermarket
Fleet
Area Sales Management
|
 17
Substantial Cash being returned to Stockholders
Stockholder returns
Quarterly dividend established in November 2012
$50 million stock repurchase program announced in December 2012
Annual Dividends
2013
Annual
dividend
-
$1.00
per
share
or
$16.7
million
2014
Annual
dividend
–
10%
increase
in
May
2014
to
an
annualized
rate
of
$1.10
per
share
2014
Total
dividends
paid
-
$13.4
million
Share Buyback Activity
2012/2013
Share
buyback
–
103,619
shares
of
Class
A
common
stock
for
$5.2
million
2014
Share
buyback
–
431,357
shares
of
Class
A
common
stock
for
$33.3
million |
 18
Q3
2014
Highlights
Significantly lower estimated incentive compensation, as well as
expected improvements in unit and parts volumes and a shift in sales
mix to higher-margin units expected to be substantially offset by pricing
pressures, higher manufacturing costs and continued investments in the
strategic initiatives, resulting in a moderate improvement in operating
profit in the fourth quarter of 2014.
The Brazil market and currency fluctuations continue to be headwinds to
2014 results.
($ in millions)
Close gap to 7% target economics at mid-cycle and 7% at the peak of
the current market cycle
33%+ unit volume growth
•
Industry recovery
•
Share growth
Unit margin enhancement
•
Product segmentation
•
Low cost of ownership
_____________________
(1)
LTM Operating profit, net income and EBITDA include $17.7 million pre-tax gain on
sale from the Brazil land and facility (2)
EBITDA is a non-GAAP measure and should not be considered in isolation or as a
substitute for GAAP measures. For discussion of
non-GAAP
items
and
the
related
reconciliations
to
GAAP
measures,
see
pages
starting
on
20.
Revenue
$695.8
100.0%
$2,774.4
100.0%
Operating
Profit
(1)
36.3
5.2%
150.6
5.4%
Net Income
28.4
4.1%
109.1
3.9%
EBITDA
(2)
$41.2
5.9%
$183.1
6.6%
Debt
$38.3
Cash
$97.9
Net Cash
$59.6
2014 Third Quarter
9/30/14 LTM
(1)
8.1% growth in Q3 2014 revenue on a 16% increase in operating profit.
Revenue growth from a shift in sales to higher-priced lift trucks, an
increase in unit and parts volumes and favorable foreign currency
translation.
Q3 2014 Results
Hyster-Yale
Outlook
–
Longer-
term
Hyster-Yale Outlook –
Short Term
Growth rates for global lift truck market expected to decelerate during the remainder of
2014, with growth generally concentrated in Western Europe, Middle East
and Africa markets, with smaller growth in Asia-Pacific.
Americas market expected to slow in Q4 2014.
Backlog of 26,800 units, or approximately $710m at 9/30/14 represents
>16 weeks of production and supports 4th quarter 2014 production plan. Operating profit and net income up substantially, primarily as a result of lower incentive
compensation estimates, but gross profit declined. Benefits from higher unit and
parts volumes were more than offset by unfavorable foreign currency movements,
lower earnings on the remarketing of used trucks and increased warranty
expense. Modest declines in unit pricing were fully offset by lower
material costs. |
 Appendix
30 |
 20
Non-GAAP Disclosure
EBITDA and return on total capital employed are not measurements under U.S. GAAP,
should not be considered in isolation or as a substitute for GAAP measures, and
are not necessarily comparable with similarly titled measures of other companies.
Hyster-Yale defines each as the following:
EBITDA is defined as income before income taxes and non-controlling interest
income (loss) plus net interest expense and depreciation and amortization
expense; Return on total capital employed (“ROTCE”) is defined as net income before
interest expense, after tax, divided by average capital employed.
Average capital employed is defined as average stockholder’s
equity plus average debt less average cash.
For reconciliations from GAAP measurements to non-GAAP measurements, see pages 21
and 22. |
 21
Non-GAAP Reconciliation
Year Ended December 31
Qtr.
Trailing 12
Months
2009
2010
2011
2012
2013
9/30/14
9/30/14
Reconciliation of EBITDA
Net income (loss) attributable to stockholders
($43.1)
$32.4
$82.6
$98.0
$110.0
$28.4
$109.1
Noncontrolling interest income (loss)
(0.1)
(0.1)
–
0.1
0.2
0.1
0.3
Income taxes provision (benefit)
(3.6)
1.8
18.9
7.0
17.2
8.4
39.8
Interest expense
19.0
16.6
15.8
12.4
9.0
1.6
5.1
Interest income
(2.8)
(2.3)
(1.8)
(1.5)
(1.8)
(0.4)
(1.4)
Depreciation and amortization expense
36.2
33.9
31.3
28.0
30.2
7.5
30.2
EBITDA
$5.6
$82.3
$146.8
$144.0
$164.8
$45.6
$183.1
($ in millions)
(1)
Note: EBITDA in this investor presentation is provided solely as a supplemental
disclosure with respect to operating results. EBITDA does not represent net income, as defined by U.S. GAAP and
should not be considered as a substitute for net income or net loss, or as an indicator of operating
performance. The Company defines EBITDA as income before income taxes and non-controlling
interest income (loss) plus net interest expense and depreciation and amortization expense. EBITDA is
not a measurement under U.S. GAAP and is not necessarily comparable with similarly titled
measures of other companies.
(1) EBITDA for the LTM 9/30/14 includes a $17.7 million gain on the sale of the
Brazil land and facility.
_____________________ |
 22
Non-GAAP Reconciliation (continued)
($ in millions)
Reconciliation of Return on Total Capital Employed (ROTCE)
9/30/14 LTM
LTM Average Stockholders' Equity (9/30/14, 6/30/14, 3/31/14, 12/31/13 and
9/30/13) $460.8
LTM Average Debt (9/30/14, 6/30/14, 3/31/14, 12/31/13 and 9/30/13)
60.9
LTM Average Cash (9/30/14, 6/30/14, 3/31/14, 12/31/13 and 9/30/13)
(132.8)
LTM average capital employed
$388.9
LTM Net income
$109.1
Plus: LTM Interest expense, net
3.7
Less: Income taxes on interest expense, net at 38%
(1.4)
Actual return on capital employed = actual net income before interest expense, net, after
tax $111.4
Actual return on capital employed percentage
28.6%
_____________________
Note: Return on capital employed is provided solely as a supplemental disclosure with
respect to income generation because management believes it provides useful information with respect to earnings in a form that is comparable to the Company’s cost of capital
employed,
which
includes
both
equity
and
debt
securities,
net
of
cash. |
 23
Cash Flow before Financing Calculation
($ in millions)
Year Ended December 31
Trailing 12
Months
2009
2010
2011
2012
2013
9/30/14
Reconciliation of Cash Flow before Financing
Net cash provided by operations
$115.9
$47.5
$54.6
$128.7
$152.9
$105.3
Net cash provided by (used) for investing activities
5.8
(8.5)
(15.9)
(19.5)
(26.1)
(36.8)
Cash Flow before Financing
$121.7
$39.0
$38.7
$109.2
$126.8
$68.5
|
