Attached files
| file | filename |
|---|---|
| 8-K - 8-K - Western Midstream Operating, LP | d812321d8k.htm |
| EX-2.1 - EX-2.1 - Western Midstream Operating, LP | d812321dex21.htm |
| EX-10.1 - EX-10.1 - Western Midstream Operating, LP | d812321dex101.htm |
EXHIBIT 99.1

WESTERN GAS ANNOUNCES AGREEMENT TO ACQUIRE
NUEVO MIDSTREAM, LLC AND RELEASES
THIRD-QUARTER 2014 RESULTS
WES RAISES 2014 ADJUSTED EBITDA MIDPOINT AND FULL-YEAR MINIMUM
DISTRIBUTION GROWTH ESTIMATE AND PROVIDES
2015 DISTRIBUTION GROWTH GUIDANCE
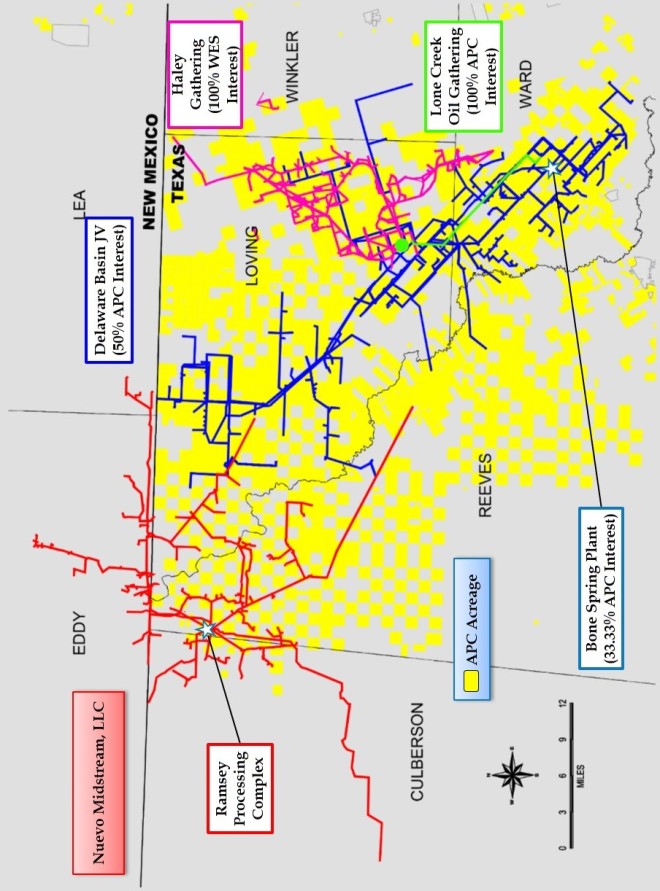
HOUSTON, October 28, 2014 – Western Gas Partners, LP (NYSE: WES) (“WES” or the “Partnership”) today announced that it has agreed to acquire Nuevo Midstream, LLC (“Nuevo”), a leading Delaware Basin gas gatherer and processor, for $1.5 billion. The Partnership expects the acquisition will close in the fourth quarter of 2014, subject to regulatory approval and customary closing conditions.
“We are excited to acquire the Nuevo assets, which are extremely valuable to us given their strategic location in the Delaware Basin and Anadarko’s significant acreage position and development plans in the area. The Nuevo management team has done an excellent job in utilizing their first-mover advantage to build a gathering and processing system that has over 150,000 dedicated acres plus volumetric commitments from high-quality producers,” said Chief Executive Officer, Don Sinclair. “Our top priority will be to provide excellent service to existing and future customers in a safe and reliable manner.”
Nuevo’s assets currently include a 300 MMcf/d cryogenic processing complex with an additional 400 MMcf/d of processing capacity that is scheduled to be in service in 2015, 275 miles of gathering pipeline, 1,800 gpm of amine treating capacity and four compressor stations. The assets serve production from Reeves, Loving and Culberson Counties, Texas and Eddy and Lea Counties, New Mexico. Over 70% of Nuevo’s gross margin is fee-based, and following the acquisition, the Partnership expects that over 95% of its consolidated gross margin will be either fee-based or covered under its fixed-price agreements with Anadarko.
The Partnership expects the acquisition to be accretive to its distributable cash flow per unit in 2015. The Partnership will partially finance the acquisition through the issuance to Anadarko of $750 million of Class C units, which will receive distributions in the form of additional Class C units until the end of 2017. The Class C units will convert into common units on a one-for-one basis on December 31, 2007, unless the Partnership converts such units earlier or Anadarko delays the conversion. The Class C units will be disregarded with respect to calculating the Partnership’s cash distributions until they are converted to common units.
Pursuant to the terms of a joint venture agreement between Anadarko and a third party, the Partnership will immediately offer the third party the right to acquire a 50% interest in Nuevo. The third party is required to respond to the Partnership’s offer within thirty days of receiving notice, and will have an additional thirty days to fund its share of the purchase price if it accepts the offer. As of September 30, 2014, the Partnership had $1 billion of available capacity under its revolving credit facility and the Partnership is prepared to purchase 100% of Nuevo if the third party does not participate.
“We are buying an early stage asset that we believe will deliver significant growth as the basin continues to develop,” added Sinclair, who also noted that the Partnership estimates that the purchase price represents an approximate 8.5 times multiple of the assets’ forecasted 2016 earnings before interest, taxes, depreciation and amortization (“EBITDA”). “Both the current robust level of drilling activity and Anadarko’s recent success in the area fuel our optimism regarding the further potential of the Delaware Basin, which has quickly become one of the most prolific resource plays in North America.”
The terms of the acquisition and the issuance of the Class C units to Anadarko were unanimously approved by the board of directors of the Partnership’s general partner. The board’s special committee, which is comprised entirely of independent directors, also approved the issuance of the Class C units. The special committee engaged Evercore Partners to act as its financial advisor and Bracewell and Giuliani LLP to act as its legal advisor.
2
THIRD-QUARTER 2014 RESULTS
The Partnership and Western Gas Equity Partners, LP (NYSE: WGP) (“WGP”) today also announced third-quarter 2014 financial and operating results.
“We delivered strong financial performance combined with healthy distribution coverage in the quarter,” said Sinclair. “Our portfolio delivered solid results while overcoming throughput declines at some of our lower-margin assets and unscheduled downtime at two of our plants.”
WESTERN GAS PARTNERS, LP
Net income available to limited partners for the third quarter of 2014 totaled $71.6 million, or $0.60 per common unit (diluted). For the third quarter of 2014, Adjusted EBITDA(1) was $167.3 million and Distributable cash flow(1) was $136.7 million, resulting in a Coverage ratio(1) of 1.23 times for the period.
WES previously declared a quarterly distribution of $0.675 per unit for the third quarter of 2014, representing a 4% increase over the prior quarter’s distribution and a 16% increase over the third-quarter 2013 distribution of $0.58 per unit. The distribution will be paid on November 13, 2014, to unitholders of record at the close of business on October 31, 2014. The third-quarter 2014 Coverage ratio(1) of 1.23 times is based on the quarterly distribution of $0.675 per unit.
Total throughput attributable to WES for natural gas assets for the third quarter of 2014 averaged 3.5 Bcf/d, which was 3% below the prior quarter and 5% above the third quarter of 2013. Total throughput for crude/NGL assets for the third quarter of 2014 averaged 138 MBbls/d, which was 20% above the prior quarter.
Capital expenditures attributable to WES on a cash basis, including equity investments but excluding acquisitions, totaled $133.5 million during the third quarter of 2014. Of this amount, maintenance capital expenditures were $12.0 million, or 7% of Adjusted EBITDA(1). Capital expenditures attributable to WES on an accrual basis, including equity investments but excluding acquisitions, totaled $148.9 million during the third quarter of 2014.
| (1) | Please see the tables at the end of this release for a reconciliation of non-GAAP to GAAP measures and calculation of the Coverage ratio. |
3
WESTERN GAS EQUITY PARTNERS, LP
WGP indirectly owns the 2% general partner interest in WES, 100% of the incentive distribution rights in WES and 49,296,205 WES common units. Net income available to limited partners for the third quarter of 2014 totaled $60.0 million, or $0.27 per common unit (diluted).
WGP previously declared a quarterly distribution of $0.29125 per unit for the third quarter of 2014, representing a 7% increase over the prior quarter’s distribution and a 36% increase over the third-quarter 2013 distribution of $0.21375. The distribution will be paid on November 21, 2014, to unitholders of record at the close of business on October 31, 2014. WGP will receive distributions from WES of $64.5 million attributable to the third quarter and will pay out $63.8 million in distributions for the same period.
UPDATED 2014 WES AND WGP OUTLOOKS AND 2015 WES DISTRIBUTION GROWTH GUIDANCE
Based on its current estimate, which does not include any 2014 contribution from Nuevo, WES’s Adjusted EBITDA(1) for 2014 is now expected to be between $625 million and $650 million. Total capital expenditures including equity investments, but excluding acquisitions, are expected to be between $670 million and $720 million with maintenance capital expenditures expected to be between 7% and 10% of Adjusted EBITDA(1). WES and WGP now expect 2014 distribution growth to be 16% and 36%, respectively, and WES also expects no less than 15% distribution growth in 2015.
| (1) | Please see the tables at the end of this release for a reconciliation of non-GAAP to GAAP measures and calculation of the Coverage ratio. |
4
CONFERENCE CALL TOMORROW AT 11 A.M. CDT
WES and WGP will host a joint conference call on Wednesday, October 29, 2014, at 11:00 a.m. Central Daylight Time (12:00 p.m. Eastern Daylight Time) to discuss the acquisition, third-quarter 2014 results and the updated outlook for 2014. To participate via telephone, please dial 877.621.4819 and enter participant code 95243621. Please call in 10 minutes prior to the scheduled start time. To access the live audio webcast of the conference call and slide presentation, please visit www.westerngas.com. A replay of the call will also be available on the website for approximately two weeks following the conference call.
Western Gas Partners, LP (“WES”) is a growth-oriented Delaware master limited partnership formed by Anadarko Petroleum Corporation to own, operate, acquire and develop midstream energy assets. With midstream assets in the Rocky Mountains, the Mid-Continent, north-central Pennsylvania and Texas, WES is engaged in the business of gathering, processing, compressing, treating and transporting natural gas, condensate, natural gas liquids and crude oil for Anadarko and other producers and customers.
Western Gas Equity Partners, LP (“WGP”) is a Delaware master limited partnership formed by Anadarko to own the following types of interests in WES: (i) the 2.0% general partner interest and all of the incentive distribution rights in WES, both owned through WGP’s 100% ownership of WES’s general partner, and (ii) a significant limited partner interest in WES.
For more information about Western Gas Partners, LP and Western Gas Equity Partners, LP, please visit www.westerngas.com.
This news release contains forward-looking statements. Western Gas Partners and Western Gas Equity Partners believe that their expectations are based on reasonable assumptions. No assurance, however, can be given that such expectations will prove to have been correct. A number of factors could cause actual results to differ materially from the projections, anticipated results or other expectations expressed in this news release. These factors include the ability to meet financial guidance or distribution growth expectations; the ability to safely and efficiently operate WES’s assets; the ability to obtain new sources of natural gas supplies; the effect of fluctuations in commodity prices and the demand for natural gas and related products; the ability to meet projected in-service dates for capital growth projects; construction costs or capital expenditures exceeding estimated or budgeted costs or expenditures; the ability to close and realize the expected benefits from the Neuvo acquisition; and the other factors described in the “Risk Factors” sections of WES’s and WGP’s most recent Forms 10-K filed with the Securities and Exchange Commission and in their other public filings and press releases. Western Gas Partners and Western Gas Equity Partners undertake no obligation to publicly update or revise any forward-looking statements.
# # #
WESTERN GAS CONTACT
Benjamin Fink, CFA
SVP, Chief Financial Officer and Treasurer
832.636.6010
benjamin.fink@westerngas.com
5
6
Western Gas Partners, LP Reconciliation of GAAP to Non-GAAP Measures
Below are reconciliations of (i) WES’s Distributable cash flow (non-GAAP) to net income attributable to Western Gas Partners, LP (GAAP), (ii) Adjusted EBITDA attributable to Western Gas Partners, LP (“Adjusted EBITDA”) (non-GAAP) to net income attributable to Western Gas Partners, LP (GAAP) and to net cash provided by operating activities (GAAP), and (iii) Adjusted gross margin attributable to Western Gas Partners, LP (“Adjusted gross margin”) (non-GAAP) to operating income (GAAP), as required under Regulation G of the Securities Exchange Act of 1934. Management believes that WES’s Distributable cash flow, Adjusted EBITDA, Adjusted gross margin, and Coverage ratio are widely accepted financial indicators of WES’s financial performance compared to other publicly traded partnerships and are useful in assessing its ability to incur and service debt, fund capital expenditures and make distributions. Distributable cash flow, Adjusted EBITDA, Adjusted gross margin and Coverage ratio, as defined by WES, may not be comparable to similarly titled measures used by other companies. Therefore, WES’s Distributable cash flow, Adjusted EBITDA, Adjusted gross margin, and Coverage ratio should be considered in conjunction with net income and other applicable performance measures, such as operating income or cash flows from operating activities.
Distributable Cash Flow
WES defines Distributable cash flow as Adjusted EBITDA, plus interest income, less net cash paid for interest expense (including amortization of deferred debt issuance costs originally paid in cash, offset by non-cash capitalized interest), maintenance capital expenditures, and income taxes.
| Three Months Ended September 30, |
Nine Months Ended September 30, |
|||||||||||||||
| thousands except Coverage ratio |
2014 | 2013 (1) | 2014 | 2013 (1) | ||||||||||||
| Reconciliation of Net income attributable to Western Gas Partners, LP to Distributable cash flow and calculation of the Coverage ratio |
||||||||||||||||
| Net income attributable to Western Gas Partners, LP |
$ | 102,677 | $ | 78,506 | $ | 285,144 | $ | 189,236 | ||||||||
| Add: |
||||||||||||||||
| Distributions from equity investees |
20,807 | 4,531 | 57,448 | 15,563 | ||||||||||||
| Non-cash equity-based compensation expense |
1,035 | 962 | 3,188 | 2,663 | ||||||||||||
| Income tax (benefit) expense |
278 | (27 | ) | 276 | 4,192 | |||||||||||
| Depreciation, amortization and impairments (2) |
45,005 | 36,970 | 128,083 | 104,651 | ||||||||||||
| Less: |
||||||||||||||||
| Equity income, net |
19,063 | 4,520 | 41,322 | 11,944 | ||||||||||||
| Cash paid for maintenance capital expenditures (2) |
12,023 | 7,389 | 32,563 | 19,595 | ||||||||||||
| Capitalized interest (3) |
1,900 | 3,111 | 7,347 | 9,552 | ||||||||||||
| Cash paid for (reimbursement of) income taxes |
— | — | (340 | ) | — | |||||||||||
| Other income (2) (4) |
94 | 39 | 251 | 419 | ||||||||||||
|
|
|
|
|
|
|
|
|
|||||||||
| Distributable cash flow |
$ | 136,722 | $ | 105,883 | $ | 392,996 | $ | 274,795 | ||||||||
|
|
|
|
|
|
|
|
|
|||||||||
| Distributions declared (5) |
||||||||||||||||
| Limited partners |
$ | 80,373 | $ | 231,476 | ||||||||||||
| General partner |
31,236 | 84,537 | ||||||||||||||
|
|
|
|
|
|||||||||||||
| Total |
$ | 111,609 | $ | 316,013 | ||||||||||||
|
|
|
|
|
|||||||||||||
| Coverage ratio |
1.23 x | 1.24 x | ||||||||||||||
|
|
|
|
|
|||||||||||||
| (1) | Financial information has been recast to include the financial position and results attributable to the 20% interest in each of Texas Express Pipeline LLC (“TEP”) and Texas Express Gathering LLC (“TEG”) and a 33.33% interest in Front Range Pipeline LLC (“FRP”) acquired from Anadarko (collectively, the “TEFR Interests”). |
| (2) | Includes WES’s 75% share of depreciation, amortization and impairments; cash paid for maintenance capital expenditures; and other income attributable to Chipeta. |
| (3) | Includes capitalized interest of $1.1 million and $1.5 million for the three and nine months ended September 30, 2013, respectively, for the construction of the Mont Belvieu JV, reflected as a component of the equity investment balance. |
| (4) | Excludes income of zero and $0.4 million for the three months ended September 30, 2014 and 2013, respectively, and $0.5 million and $1.2 million for the nine months ended September 30, 2014 and 2013, respectively, related to a component of a gas processing agreement accounted for as a capital lease. |
| (5) | Reflects distributions of $0.675 and $1.95 per unit declared for the three and nine months ended September 30, 2014, respectively. |
7
Western Gas Partners, LP Reconciliation of GAAP to Non-GAAP Measures, continued
Adjusted EBITDA Attributable to Western Gas Partners, LP
WES defines Adjusted EBITDA as net income (loss) attributable to Western Gas Partners, LP, plus distributions from equity investees, non-cash equity-based compensation expense, interest expense, income tax expense, depreciation, amortization and impairments, and other expense, less income from equity investments, interest income, income tax benefit, and other income.
| Three Months Ended September 30, |
Nine Months Ended September 30, |
|||||||||||||||
| thousands |
2014 | 2013 (1) | 2014 | 2013 (1) | ||||||||||||
| Reconciliation of Net income attributable to Western Gas Partners, LP to Adjusted EBITDA attributable to Western Gas Partners, LP |
||||||||||||||||
| Net income attributable to Western Gas Partners, LP |
$ | 102,677 | $ | 78,506 | $ | 285,144 | $ | 189,236 | ||||||||
| Add: |
||||||||||||||||
| Distributions from equity investees |
20,807 | 4,531 | 57,448 | 15,563 | ||||||||||||
| Non-cash equity-based compensation expense |
1,034 | 962 | 3,188 | 2,663 | ||||||||||||
| Interest expense |
20,878 | 13,018 | 55,703 | 37,483 | ||||||||||||
| Income tax expense |
278 | — | 504 | 4,219 | ||||||||||||
| Depreciation, amortization and impairments (2) |
45,005 | 36,970 | 128,083 | 104,651 | ||||||||||||
| Less: |
||||||||||||||||
| Equity income, net |
19,063 | 4,520 | 41,322 | 11,944 | ||||||||||||
| Interest income, net – affiliates |
4,225 | 4,225 | 12,675 | 12,675 | ||||||||||||
| Other income (2) (3) |
94 | 39 | 251 | 419 | ||||||||||||
| Income tax benefit |
— | 27 | 228 | 27 | ||||||||||||
|
|
|
|
|
|
|
|
|
|||||||||
| Adjusted EBITDA attributable to Western Gas Partners, LP |
$ | 167,297 | $ | 125,176 | $ | 475,594 | $ | 328,750 | ||||||||
|
|
|
|
|
|
|
|
|
|||||||||
| Reconciliation of Adjusted EBITDA attributable to Western Gas Partners, LP to Net cash provided by operating activities |
||||||||||||||||
| Adjusted EBITDA attributable to Western Gas Partners, LP |
$ | 167,297 | $ | 125,176 | $ | 475,594 | $ | 328,750 | ||||||||
| Adjusted EBITDA attributable to noncontrolling interest |
4,506 | 4,017 | 12,922 | 9,362 | ||||||||||||
| Interest income (expense), net |
(16,653 | ) | (8,793 | ) | (43,028 | ) | (24,808 | ) | ||||||||
| Non-cash equity-based compensation expense |
(11 | ) | (80 | ) | 22 | (99 | ) | |||||||||
| Debt-related amortization and other items, net |
687 | 630 | 2,045 | 1,756 | ||||||||||||
| Current income tax benefit (expense) |
(99 | ) | 9,888 | 366 | 25,024 | |||||||||||
| Other income (expense), net (3) |
97 | 43 | 260 | 424 | ||||||||||||
| Distributions from equity investments in excess of cumulative earnings |
(4,539 | ) | — | (14,387 | ) | — | ||||||||||
| Changes in operating working capital: |
||||||||||||||||
| Accounts receivable, net |
(18,055 | ) | (580 | ) | (41,408 | ) | (27,387 | ) | ||||||||
| Accounts and natural gas imbalance payables and accrued liabilities, net |
8,942 | 6,482 | 9,736 | 6,818 | ||||||||||||
| Other |
(2,602 | ) | (2,758 | ) | 1,645 | (2,523 | ) | |||||||||
|
|
|
|
|
|
|
|
|
|||||||||
| Net cash provided by operating activities |
$ | 139,570 | $ | 134,025 | $ | 403,767 | $ | 317,317 | ||||||||
|
|
|
|
|
|
|
|
|
|||||||||
| Cash flow information of Western Gas Partners, LP |
||||||||||||||||
| Net cash provided by operating activities |
$ | 403,767 | $ | 317,317 | ||||||||||||
| Net cash used in investing activities |
$ | (913,372 | ) | $ | (1,432,048 | ) | ||||||||||
| Net cash provided by financing activities |
$ | 476,714 | $ | 733,114 | ||||||||||||
|
|
|
|
|
|||||||||||||
| (1) | Financial information has been recast to include the financial position and results attributable to the TEFR Interests. |
| (2) | Includes WES’s 75% share of depreciation, amortization and impairments, and other income attributable to Chipeta. |
| (3) | Excludes income of zero and $0.4 million for the three months ended September 30, 2014 and 2013, respectively, and $0.5 million and $1.2 million for the nine months ended September 30, 2014 and 2013, respectively, related to a component of a gas processing agreement accounted for as a capital lease. |
8
Western Gas Partners, LP Reconciliation of GAAP to Non-GAAP Measures, continued
Adjusted gross margin attributable to Western Gas Partners, LP
WES defines Adjusted gross margin as total revenues less cost of product, plus distributions from equity investees and excluding the noncontrolling interest owner’s proportionate share of revenue and cost of product.
| Three Months Ended September 30, |
Nine Months Ended September 30, |
|||||||||||||||
| thousands |
2014 | 2013 (1) | 2014 | 2013 (1) | ||||||||||||
| Reconciliation of Adjusted gross margin attributable to Western Gas Partners, LP to Operating income |
||||||||||||||||
| Adjusted gross margin attributable to Western Gas Partners, LP for natural gas assets |
$ | 213,901 | $ | 175,348 | $ | 607,583 | $ | 472,827 | ||||||||
| Adjusted gross margin for crude/NGL assets |
19,396 | 4,031 | 51,692 | 10,996 | ||||||||||||
|
|
|
|
|
|
|
|
|
|||||||||
| Adjusted gross margin attributable to Western Gas Partners, LP |
$ | 233,297 | $ | 179,379 | $ | 659,275 | $ | 483,823 | ||||||||
|
|
|
|
|
|
|
|
|
|||||||||
| Adjusted gross margin attributable to noncontrolling interest |
$ | 5,582 | $ | 5,138 | $ | 15,611 | $ | 12,351 | ||||||||
| Equity income, net |
19,063 | 4,520 | 41,322 | 11,944 | ||||||||||||
| Less: |
||||||||||||||||
| Distributions from equity investees |
20,807 | 4,531 | 57,448 | 15,563 | ||||||||||||
| Operation and maintenance |
53,657 | 42,757 | 145,064 | 121,165 | ||||||||||||
| General and administrative |
7,889 | 7,276 | 24,304 | 22,228 | ||||||||||||
| Property and other taxes |
6,564 | 6,649 | 20,718 | 18,520 | ||||||||||||
| Depreciation, amortization and impairments |
45,651 | 37,615 | 130,009 | 106,551 | ||||||||||||
|
|
|
|
|
|
|
|
|
|||||||||
| Operating income |
$ | 123,374 | $ | 90,209 | $ | 338,665 | $ | 224,091 | ||||||||
|
|
|
|
|
|
|
|
|
|||||||||
| (1) | Financial information has been recast to include the financial position and results attributable to the TEFR Interests. |
9
Western Gas Partners, LP
CONDENSED CONSOLIDATED STATEMENTS OF INCOME
(Unaudited)
| Three Months Ended September 30, |
Nine Months Ended September 30, |
|||||||||||||||
| thousands except per-unit amounts |
2014 | 2013 (1) | 2014 | 2013 (1) | ||||||||||||
| Revenues |
||||||||||||||||
| Gathering, processing and transportation of natural gas and natural gas liquids |
$ | 168,356 | $ | 130,781 | $ | 471,055 | $ | 343,471 | ||||||||
| Natural gas, natural gas liquids and condensate sales |
150,094 | 141,326 | 453,186 | 402,616 | ||||||||||||
| Other, net |
8,015 | 1,395 | 11,625 | 4,583 | ||||||||||||
|
|
|
|
|
|
|
|
|
|||||||||
| Total revenues |
326,465 | 273,502 | 935,866 | 750,670 | ||||||||||||
|
|
|
|
|
|
|
|
|
|||||||||
| Equity income, net |
19,063 | 4,520 | 41,322 | 11,944 | ||||||||||||
|
|
|
|
|
|
|
|
|
|||||||||
| Operating expenses |
||||||||||||||||
| Cost of product |
108,393 | 93,516 | 318,428 | 270,059 | ||||||||||||
| Operation and maintenance |
53,657 | 42,757 | 145,064 | 121,165 | ||||||||||||
| General and administrative |
7,889 | 7,276 | 24,304 | 22,228 | ||||||||||||
| Property and other taxes |
6,564 | 6,649 | 20,718 | 18,520 | ||||||||||||
| Depreciation, amortization and impairments |
45,651 | 37,615 | 130,009 | 106,551 | ||||||||||||
|
|
|
|
|
|
|
|
|
|||||||||
| Total operating expenses |
222,154 | 187,813 | 638,523 | 538,523 | ||||||||||||
|
|
|
|
|
|
|
|
|
|||||||||
| Operating income |
123,374 | 90,209 | 338,665 | 224,091 | ||||||||||||
| Interest income, net – affiliates |
4,225 | 4,225 | 12,675 | 12,675 | ||||||||||||
| Interest expense |
(20,878 | ) | (13,018 | ) | (55,703 | ) | (37,483 | ) | ||||||||
| Other income (expense), net |
97 | 439 | 788 | 1,612 | ||||||||||||
|
|
|
|
|
|
|
|
|
|||||||||
| Income before income taxes |
106,818 | 81,855 | 296,425 | 200,895 | ||||||||||||
| Income tax (benefit) expense |
278 | (27 | ) | 276 | 4,192 | |||||||||||
|
|
|
|
|
|
|
|
|
|||||||||
| Net income |
106,540 | 81,882 | 296,149 | 196,703 | ||||||||||||
| Net income attributable to noncontrolling interest |
3,863 | 3,376 | 11,005 | 7,467 | ||||||||||||
|
|
|
|
|
|
|
|
|
|||||||||
| Net income attributable to Western Gas Partners, LP |
$ | 102,677 | $ | 78,506 | $ | 285,144 | $ | 189,236 | ||||||||
| Limited partners’ interest in net income: |
||||||||||||||||
| Net income attributable to Western Gas Partners, LP |
$ | 102,677 | $ | 78,506 | $ | 285,144 | $ | 189,236 | ||||||||
| Pre-acquisition net (income) loss allocated to Anadarko |
— | (106 | ) | 956 | (4,616 | ) | ||||||||||
| General partner interest in net (income) loss |
(31,058 | ) | (18,693 | ) | (83,939 | ) | (47,733 | ) | ||||||||
|
|
|
|
|
|
|
|
|
|||||||||
| Limited partners’ interest in net income |
$ | 71,619 | $ | 59,707 | $ | 202,161 | $ | 136,887 | ||||||||
| Net income per common unit – basic and diluted |
$ | 0.60 | $ | 0.53 | $ | 1.71 | $ | 1.26 | ||||||||
| Weighted average common units outstanding – basic and diluted |
119,068 | 112,143 | 118,326 | 108,540 | ||||||||||||
|
|
|
|
|
|
|
|
|
|||||||||
| (1) | Financial information has been recast to include the financial position and results attributable to the TEFR Interests. |
10
Western Gas Partners, LP
CONDENSED CONSOLIDATED BALANCE SHEETS
(Unaudited)
| thousands except number of units |
September 30, 2014 |
December 31, 2013 (1) |
||||||
| Current assets |
$ | 200,955 | $ | 194,810 | ||||
| Note receivable – Anadarko |
260,000 | 260,000 | ||||||
| Net property, plant and equipment |
3,767,587 | 3,383,255 | ||||||
| Other assets |
825,998 | 779,743 | ||||||
|
|
|
|
|
|||||
| Total assets |
$ | 5,054,540 | $ | 4,617,808 | ||||
|
|
|
|
|
|||||
| Current liabilities |
$ | 201,230 | $ | 190,460 | ||||
| Long-term debt |
2,082,914 | 1,418,169 | ||||||
| Asset retirement obligations and other |
86,683 | 117,143 | ||||||
|
|
|
|
|
|||||
| Total liabilities |
$ | 2,370,827 | $ | 1,725,772 | ||||
|
|
|
|
|
|||||
| Equity and partners’ capital |
||||||||
| Common units (119,070,104 and 117,322,812 units issued and outstanding at September 30, 2014, and December 31, 2013, respectively) |
$ | 2,524,313 | $ | 2,431,193 | ||||
| General partner units (2,430,007 and 2,394,345 units issued and outstanding at September 30, 2014, and December 31, 2013, respectively) |
89,150 | 78,157 | ||||||
| Net investment by Anadarko |
— | 312,092 | ||||||
| Noncontrolling interest |
70,250 | 70,594 | ||||||
|
|
|
|
|
|||||
| Total liabilities, equity and partners’ capital |
$ | 5,054,540 | $ | 4,617,808 | ||||
|
|
|
|
|
|||||
| (1) | Financial information has been recast to include the financial position and results attributable to the TEFR Interests. |
11
Western Gas Partners, LP
CONDENSED CONSOLIDATED STATEMENTS OF CASH FLOWS
(Unaudited)
| Nine Months Ended September 30, |
||||||||
| thousands |
2014 | 2013 (1) | ||||||
| Cash flows from operating activities |
||||||||
| Net income |
$ | 296,149 | $ | 196,703 | ||||
| Adjustments to reconcile net income to net cash provided by operating activities and changes in working capital: |
||||||||
| Depreciation, amortization and impairments |
130,009 | 106,551 | ||||||
| Change in other items, net |
(22,391 | ) | 14,063 | |||||
|
|
|
|
|
|||||
| Net cash provided by operating activities |
$ | 403,767 | $ | 317,317 | ||||
|
|
|
|
|
|||||
| Cash flows from investing activities |
||||||||
| Capital expenditures |
$ | (492,287 | ) | $ | (469,678 | ) | ||
| Contributions in aid of construction costs from affiliates |
183 | — | ||||||
| Acquisitions from affiliates |
(372,393 | ) | (469,884 | ) | ||||
| Acquisitions from third parties |
— | (240,274 | ) | |||||
| Investments in equity affiliates |
(63,267 | ) | (252,308 | ) | ||||
| Distributions from equity investments in excess of cumulative earnings |
14,387 | — | ||||||
| Proceeds from the sale of assets to affiliates |
— | 82 | ||||||
| Proceeds from the sale of assets to third parties |
5 | 14 | ||||||
|
|
|
|
|
|||||
| Net cash used in investing activities |
$ | (913,372 | ) | $ | (1,432,048 | ) | ||
|
|
|
|
|
|||||
| Cash flows from financing activities |
||||||||
| Borrowings, net of debt issuance costs |
$ | 1,136,878 | $ | 842,566 | ||||
| Repayments of debt |
(480,000 | ) | (495,000 | ) | ||||
| Increase (decrease) in outstanding checks |
2,908 | (3,335 | ) | |||||
| Proceeds from the issuance of common and general partner units, net of offering expenses |
101,502 | 427,848 | ||||||
| Distributions to unitholders |
(297,013 | ) | (215,115 | ) | ||||
| Contributions from noncontrolling interest owner |
— | 2,247 | ||||||
| Distributions to noncontrolling interest owner |
(11,349 | ) | (8,001 | ) | ||||
| Net contributions from Anadarko |
23,788 | 181,904 | ||||||
|
|
|
|
|
|||||
| Net cash provided by financing activities |
$ | 476,714 | $ | 733,114 | ||||
|
|
|
|
|
|||||
| Net increase (decrease) in cash and cash equivalents |
$ | (32,891 | ) | $ | (381,617 | ) | ||
| Cash and cash equivalents at beginning of period |
100,728 | 419,981 | ||||||
|
|
|
|
|
|||||
| Cash and cash equivalents at end of period |
$ | 67,837 | $ | 38,364 | ||||
|
|
|
|
|
|||||
| (1) | Financial information has been recast to include the financial position and results attributable to the TEFR Interests. |
12
Western Gas Partners, LP
OPERATING STATISTICS
(Unaudited)
| Three Months Ended September 30, |
Nine Months Ended September 30, |
|||||||||||||||
| MMcf/d except throughput measured in barrels and per-unit amounts |
2014 | 2013 (1) | 2014 | 2013 (1) | ||||||||||||
| Throughput for natural gas assets |
||||||||||||||||
| Gathering, treating and transportation (2) |
1,513 | 1,439 | 1,571 | 1,354 | ||||||||||||
| Processing (2) |
1,936 | 1,802 | 1,903 | 1,712 | ||||||||||||
| Equity investment (3) |
175 | 221 | 171 | 211 | ||||||||||||
|
|
|
|
|
|
|
|
|
|||||||||
| Total throughput for natural gas assets |
3,624 | 3,462 | 3,645 | 3,277 | ||||||||||||
|
|
|
|
|
|
|
|
|
|||||||||
| Throughput attributable to noncontrolling interest for natural gas assets |
165 | 177 | 169 | 166 | ||||||||||||
|
|
|
|
|
|
|
|
|
|||||||||
| Total throughput attributable to Western Gas Partners, LP for natural gas assets (4) |
3,459 | 3,285 | 3,476 | 3,111 | ||||||||||||
|
|
|
|
|
|
|
|
|
|||||||||
| Total throughput (MBbls/d) for crude/NGL assets (5) |
138 | 31 | 111 | 28 | ||||||||||||
|
|
|
|
|
|
|
|
|
|||||||||
| Adjusted gross margin per Mcf attributable to Western Gas Partners, LP for natural gas assets (6) |
$ | 0.67 | $ | 0.58 | $ | 0.64 | $ | 0.56 | ||||||||
|
|
|
|
|
|
|
|
|
|||||||||
| Adjusted gross margin per Bbl for crude/NGL assets (7) |
$ | 1.53 | $ | 1.39 | $ | 1.71 | $ | 1.43 | ||||||||
|
|
|
|
|
|
|
|
|
|||||||||
| (1) | Throughput has been recast to include throughput attributable to the TEFR Interests. |
| (2) | The combination of WES’s Wattenberg and Platte Valley systems in the first quarter of 2014 into the entity now referred to as the “DJ Basin complex” (also includes the Lancaster plant) resulted in the following: (i) the Wattenberg system volumes previously reported as “Gathering, treating and transportation” are now reported as “Processing” for all periods presented, and (ii) beginning with the first quarter of 2014, volumes both gathered and processed by the two systems are no longer separately reported. |
| (3) | Represents WES’s 14.81% share of average Fort Union and 22% share of average Rendezvous throughput. Excludes equity investment throughput measured in barrels (captured in “Total throughput (MBbls/d) for crude/NGL assets” as noted below). |
| (4) | Includes affiliate, third-party and equity investment throughput (as equity investment throughput is defined in the above footnote), excluding the noncontrolling interest owner’s proportionate share of throughput. |
| (5) | Represents total throughput measured in barrels, consisting of throughput from WES’s Chipeta NGL pipeline, WES’s 10% share of average White Cliffs throughput, WES’s 25% share of average Mont Belvieu JV throughput, WES’s 20% share of average TEG and TEP throughput and WES’s 33.33% share of average FRP throughput. |
| (6) | Average for period. Calculated as Adjusted gross margin attributable to Western Gas Partners, LP for natural gas assets (total revenues for natural gas assets less cost of product for natural gas assets plus distributions from our equity investments in Fort Union and Rendezvous, which are measured in Mcf) divided by total throughput (MMcf/d) attributable to Western Gas Partners, LP for natural gas assets. |
| (7) | Average for period. Calculated as Adjusted gross margin for crude/NGL assets (total revenues for crude/NGL assets less cost of product for crude/NGL assets plus distributions from our equity investments in White Cliffs, the Mont Belvieu JV, TEG, TEP and FRP, which are measured in barrels), divided by total throughput (MBbls/d) for crude/NGL assets. |
13
Western Gas
UPDATED 2014 GUIDANCE
(Unaudited)
| millions except percentages |
Previously Announced |
Current | Variance | |||
| Adjusted EBITDA |
$600 - $650 | $625 - $650 | $12.5 | |||
| Maintenance capital expenditures as a percentage of Adjusted EBITDA |
8% - 11% | 7% - 10% | (1)% | |||
| Total capital expenditures (1) |
$720 - $770 | $670 - $720 | $(50) | |||
| Minimum WES distribution growth |
15% | 16% | 1% | |||
| Minimum WGP distribution growth |
34% | 36% | 2% | |||
|
|
|
|
| (1) | Includes equity investments but excludes acquisitions. |
14
Western Gas Equity Partners, LP
CALCULATION OF CASH AVAILABLE FOR DISTRIBUTION
(Unaudited)
| thousands except per-unit amount and Coverage ratio |
Three Months Ended September 30, 2014 |
|||
| Distributions declared by Western Gas Partners, LP: |
||||
| General partner interest |
$ | 2,232 | ||
| Incentive distribution rights |
29,004 | |||
| Common units held by WGP |
33,275 | |||
| Less: |
||||
| Public company general and administrative expense |
714 | |||
|
|
|
|||
| Cash available for distribution |
$ | 63,797 | ||
|
|
|
|||
|
|
|
|||
| Declared distribution per common unit |
$ | 0.29125 | ||
|
|
|
|||
|
|
|
|||
| Distributions declared by Western Gas Equity Partners, LP |
$ | 63,756 | ||
|
|
|
|||
|
|
|
|||
| Coverage ratio |
1.00 x | |||
|
|
|
|||
15
Western Gas Equity Partners, LP
CONDENSED CONSOLIDATED STATEMENTS OF INCOME
(Unaudited)
| Three Months Ended September 30, |
Nine Months Ended September 30, |
|||||||||||||||
| thousands except per-unit amounts |
2014 | 2013 (1) | 2014 | 2013 (1) | ||||||||||||
| Revenues |
||||||||||||||||
| Gathering, processing and transportation of natural gas and natural gas liquids |
$ | 168,356 | $ | 130,781 | $ | 471,055 | $ | 343,471 | ||||||||
| Natural gas, natural gas liquids and condensate sales |
150,094 | 141,326 | 453,186 | 402,616 | ||||||||||||
| Other, net |
8,015 | 1,395 | 11,625 | 4,583 | ||||||||||||
|
|
|
|
|
|
|
|
|
|||||||||
| Total revenues |
326,465 | 273,502 | 935,866 | 750,670 | ||||||||||||
|
|
|
|
|
|
|
|
|
|||||||||
| Equity income, net |
19,063 | 4,520 | 41,322 | 11,944 | ||||||||||||
|
|
|
|
|
|
|
|
|
|||||||||
| Operating expenses |
||||||||||||||||
| Cost of product |
108,393 | 93,516 | 318,428 | 270,059 | ||||||||||||
| Operation and maintenance |
53,657 | 42,757 | 145,064 | 121,165 | ||||||||||||
| General and administrative |
8,666 | 7,962 | 26,809 | 25,100 | ||||||||||||
| Property and other taxes |
6,564 | 6,649 | 20,718 | 18,520 | ||||||||||||
| Depreciation, amortization and impairments |
45,651 | 37,615 | 130,009 | 106,551 | ||||||||||||
|
|
|
|
|
|
|
|
|
|||||||||
| Total operating expenses |
222,931 | 188,499 | 641,028 | 541,395 | ||||||||||||
|
|
|
|
|
|
|
|
|
|||||||||
| Operating income |
122,597 | 89,523 | 336,160 | 221,219 | ||||||||||||
| Interest income, net – affiliates |
4,225 | 4,225 | 12,675 | 12,675 | ||||||||||||
| Interest expense |
(20,878 | ) | (13,018 | ) | (55,703 | ) | (37,483 | ) | ||||||||
| Other income (expense), net |
118 | 466 | 849 | 1,686 | ||||||||||||
|
|
|
|
|
|
|
|
|
|||||||||
| Income before income taxes |
106,062 | 81,196 | 293,981 | 198,097 | ||||||||||||
| Income tax (benefit) expense |
278 | (27 | ) | 276 | 4,192 | |||||||||||
|
|
|
|
|
|
|
|
|
|||||||||
| Net income |
105,784 | 81,223 | 293,705 | 193,905 | ||||||||||||
| Net income attributable to noncontrolling interests |
45,832 | 36,779 | 128,958 | 82,562 | ||||||||||||
|
|
|
|
|
|
|
|
|
|||||||||
| Net income attributable to Western Gas Equity Partners, LP |
$ | 59,952 | $ | 44,444 | $ | 164,747 | $ | 111,343 | ||||||||
| Limited partners’ interest in net income: |
||||||||||||||||
| Net income attributable to Western Gas Equity Partners, LP |
$ | 59,952 | $ | 44,444 | $ | 164,747 | $ | 111,343 | ||||||||
| Pre-acquisition net (income) loss allocated to Anadarko |
— | (106 | ) | 956 | (4,616 | ) | ||||||||||
|
|
|
|
|
|
|
|
|
|||||||||
| Limited partners’ interest in net income |
$ | 59,952 | $ | 44,338 | $ | 165,703 | $ | 106,727 | ||||||||
| Net income per common unit – basic and diluted |
$ | 0.27 | $ | 0.20 | $ | 0.76 | $ | 0.49 | ||||||||
| Weighted average number of common units outstanding – basic and diluted |
218,903 | 218,896 | 218,903 | 218,896 | ||||||||||||
|
|
|
|
|
|
|
|
|
|||||||||
| (1) | Financial information has been recast to include the financial position and results attributable to the TEFR Interests. |
16
Western Gas Equity Partners, LP
CONDENSED CONSOLIDATED BALANCE SHEETS
(Unaudited)
| thousands except number of units |
September 30, 2014 |
December 31, 2013 (1) |
||||||
| Current assets |
$ | 211,384 | $ | 207,827 | ||||
| Note receivable – Anadarko |
260,000 | 260,000 | ||||||
| Net property, plant and equipment |
3,767,587 | 3,383,255 | ||||||
| Other assets |
825,998 | 779,743 | ||||||
|
|
|
|
|
|||||
| Total assets |
$ | 5,064,969 | $ | 4,630,825 | ||||
|
|
|
|
|
|||||
| Current liabilities |
$ | 201,413 | $ | 191,483 | ||||
| Long-term debt |
2,082,914 | 1,418,169 | ||||||
| Asset retirement obligations and other |
86,683 | 117,143 | ||||||
|
|
|
|
|
|||||
| Total liabilities |
$ | 2,371,010 | $ | 1,726,795 | ||||
|
|
|
|
|
|||||
| Equity and partners’ capital |
||||||||
| Common units (218,903,498 and 218,895,515 units issued and outstanding at September 30, 2014, and December 31, 2013, respectively) |
$ | 938,225 | $ | 905,082 | ||||
| Net investment by Anadarko |
— | 312,092 | ||||||
| Noncontrolling interests |
1,755,734 | 1,686,856 | ||||||
|
|
|
|
|
|||||
| Total liabilities, equity and partners’ capital |
$ | 5,064,969 | $ | 4,630,825 | ||||
|
|
|
|
|
|||||
| (1) | Financial information has been recast to include the financial position and results attributable to the TEFR Interests. |
17
Western Gas Equity Partners, LP
CONDENSED CONSOLIDATED STATEMENTS OF CASH FLOWS
(Unaudited)
| Nine Months Ended September 30, |
||||||||
| thousands |
2014 | 2013 (1) | ||||||
| Cash flows from operating activities |
||||||||
| Net income |
$ | 293,705 | $ | 193,905 | ||||
| Adjustments to reconcile net income to net cash provided by operating activities and changes in working capital: |
||||||||
| Depreciation, amortization and impairments |
130,009 | 106,551 | ||||||
| Change in other items, net |
(22,496 | ) | 13,863 | |||||
|
|
|
|
|
|||||
| Net cash provided by operating activities |
$ | 401,218 | $ | 314,319 | ||||
|
|
|
|
|
|||||
| Cash flows from investing activities |
||||||||
| Capital expenditures |
$ | (492,287 | ) | $ | (469,678 | ) | ||
| Contributions in aid of construction costs from affiliates |
183 | — | ||||||
| Acquisitions from affiliates |
(372,393 | ) | (469,884 | ) | ||||
| Acquisitions from third parties |
— | (240,274 | ) | |||||
| Investments in equity affiliates |
(63,267 | ) | (252,308 | ) | ||||
| Distributions from equity investments in excess of cumulative earnings |
14,387 | — | ||||||
| Proceeds from the sale of assets to affiliates |
— | 82 | ||||||
| Proceeds from the sale of assets to third parties |
5 | 14 | ||||||
|
|
|
|
|
|||||
| Net cash used in investing activities |
$ | (913,372 | ) | $ | (1,432,048 | ) | ||
|
|
|
|
|
|||||
| Cash flows from financing activities |
||||||||
| Borrowings, net of debt issuance costs |
$ | 1,136,878 | $ | 842,566 | ||||
| Repayments of debt |
(480,000 | ) | (495,000 | ) | ||||
| Increase (decrease) in outstanding checks |
2,908 | (3,335 | ) | |||||
| Offering expenses from the issuance of WGP common units |
— | (2,367 | ) | |||||
| Proceeds from the issuance of WES common units, net of offering expenses |
99,035 | 418,570 | ||||||
| Distributions to WGP unitholders |
(164,725 | ) | (90,211 | ) | ||||
| Contributions received from Chipeta noncontrolling interest owner |
— | 2,247 | ||||||
| Distributions to Chipeta noncontrolling interest owner |
(11,349 | ) | (8,001 | ) | ||||
| Distributions to noncontrolling interest owners of WES |
(129,247 | ) | (94,117 | ) | ||||
| Net contributions from Anadarko |
23,788 | 181,904 | ||||||
|
|
|
|
|
|||||
| Net cash provided by financing activities |
$ | 477,288 | $ | 752,256 | ||||
|
|
|
|
|
|||||
| Net increase (decrease) in cash and cash equivalents |
$ | (34,866 | ) | $ | (365,473 | ) | ||
| Cash and cash equivalents at beginning of period |
113,085 | 422,556 | ||||||
|
|
|
|
|
|||||
| Cash and cash equivalents at end of period |
$ | 78,219 | $ | 57,083 | ||||
|
|
|
|
|
|||||
| (1) | Financial information has been recast to include the financial position and results attributable to the TEFR Interests. |
18