Attached files
| file | filename |
|---|---|
| 8-K - FORM 8-K - WILLIS TOWERS WATSON PLC | d813108d8k.htm |
| EX-99.1 - EX-99.1 - WILLIS TOWERS WATSON PLC | d813108dex991.htm |
 THIRD
QUARTER 2014 RESULTS
Willis Group Holdings
October, 2014
Exhibit 99.2 |
 Important disclosures regarding forward-looking statements
1
This presentation contains certain “forward-looking statements” within the meaning of
Section 27A of the Securities Act of 1933, and Section 21E of the Securities Exchange Act of
1934, which are intended to be covered by the safe harbors created by those laws. These
forward-looking statements include information about possible or assumed future results of
our operations.
All statements, other than statements of historical facts, included in this document that address
activities, events or developments that we expect or anticipate may occur in the future,
including such things as our outlook, potential cost savings and accelerated adjusted operating margin
and adjusted earnings per share growth, future capital expenditures, growth in commissions and
fees, business strategies, competitive strengths, goals, the benefits of new initiatives, growth of our business and operations, plans, and references to future
successes are forward-looking statements. Also, when we use the words such as
‘anticipate’, ‘believe’, ‘estimate’, ‘expect’, ‘intend’, ‘plan’, ‘probably’, or similar expressions, we are
making forward-looking statements.
There are important uncertainties, events and factors that could cause our actual results or
performance to differ materially from those in the forward-looking statements contained in
this document, including the following: the impact of any regional, national or global political,
economic, business, competitive, market, environmental or regulatory conditions on our global
business operations; the impact of current global economic conditions on our results of operations and financial condition, including as a result of those associated with the
Eurozone, any insolvencies of or other difficulties experienced by our clients, insurance companies or
financial institutions; our ability to implement and fully realize anticipated benefits of our
new growth strategy and revenue generating initiatives; our ability to implement and realize anticipated benefits of any expense reduction initiative, including our ability to
achieve expected savings from the multi-year operational improvement program as a result of
unexpected costs or delays and demand on managerial, operational and administrative resources
and/or macroeconomic factors affecting the program; changes in the tax or accounting treatment of our operations and fluctuations in our tax rate; volatility or declines in
insurance markets and premiums on which our commissions are based, but which we do not control; our
ability to develop and implement technology solutions and invest in innovative product
offerings in an efficient and effective manner; our ability to continue to manage our significant indebtedness; our ability to compete in our industry; our ability to develop new
products and services; material changes in commercial property and casualty markets generally or the
availability of insurance products or changes in premiums resulting from a catastrophic event,
such as a hurricane; our ability to retain key employees and clients and attract new business; the timing or ability to carry out share repurchases and redemptions;
the timing or ability to carry out refinancing or take other steps to manage our capital and the
limitations in our long-term debt agreements that may restrict our ability to take these
actions; fluctuations in our earnings as a result of potential changes to our valuation allowance(s)
on our deferred tax assets; any fluctuations in exchange and interest rates that could affect
expenses and revenue; the potential costs and difficulties in complying with a wide variety of foreign laws and regulations and any related changes, given the global scope of our
operations; rating agency actions, including a downgrade to our credit rating, that could inhibit our
ability to borrow funds or the pricing thereof and in certain circumstances cause us to offer
to buy back some of our debt; a significant decline in the value of investments that fund our pension plans or changes in our pension plan liabilities or funding obligations; our
ability to achieve anticipated benefits of any acquisition or other transactions in which we may
engage, including any revenue growth or operational efficiencies; our ability to
effectively integrate any acquisition into our business; our inability to exercise full management
control over our associates, such as Gras Savoye; our ability to receive dividends or other
distributions in needed amounts from our subsidiaries; any potential impact from the US healthcare reform legislation; our involvement in and the results of any regulatory
investigations, legal proceedings and other contingencies; underwriting, advisory or reputational
risks associated with non-core operations as well as the potential significant impact our
non-core operations (including the Willis Capital Markets & Advisory operations) can have on
our financial results; our exposure to potential liabilities arising from errors and omissions
and other potential claims against us; the interruption or loss of our information processing systems,
data security breaches or failure to maintain secure information systems; and impairment of the
goodwill in one of our reporting units, in which case we may be required to record significant charges to earnings.
The foregoing list of factors is not exhaustive and new factors may emerge from time to time that
could also affect actual performance and results. For additional information see also
Part I, Item 1A “Risk Factors” included in Willis’ Form 10-K for the year ended
December 31, 2013, and our subsequent filings with the Securities and Exchange Commission. Copies
are available online at http://www.sec.gov or on request from the Company.
Although we believe that the assumptions underlying our forward-looking statements are reasonable,
any of these assumptions, and therefore also the forward-looking statements based on these
assumptions, could themselves prove to be inaccurate. In light of the significant uncertainties inherent in the forward-looking statements included in this presentation,
our inclusion of this information is not a representation or guarantee by us that our objectives and
plans will be achieved. Our forward-looking statements speak only as of the date made
and we will not update these forward-looking statements unless the securities laws require us to do so. In light of these risks, uncertainties and assumptions, the forward-looking
events discussed in this presentation may not occur, and we caution you against unduly relying on
these forward-looking statements. |
 Important disclosures regarding non-GAAP measures
This
presentation contains references to
"non-GAAP financial measures" as defined in Regulation G of SEC
rules. We present these measures because we
believe
they
are
of
interest
to
the
investment
community
and
they
provide
additional
meaningful
methods
of
evaluating
certain
aspects
of
the
Company’s operating performance from period to period on a basis that may not
be otherwise apparent on a generally accepted accounting principles (GAAP)
basis. These financial measures should be viewed in addition to, not in lieu of, the Company’s condensed consolidated income statements and
balance
sheet
as
of
the
relevant
date.
Consistent
with
Regulation
G,
a
description
of
such
information
is
provided
below
and
a
reconciliation
of
certain
of
such
items
to
GAAP
information
can
be
found
in
our
periodic
filings
with
the
SEC.
Our
method
of
calculating
these
non-GAAP
financial
measures
may
differ from other companies and therefore comparability may be limited.
Definitions of non-GAAP financial measures
We believe that investors’
understanding of the Company’s performance is enhanced by our disclosure of
the following non-GAAP financial measures. Our method of calculating
these measures may differ from those used by other companies and therefore comparability may be limited.
Organic commissions and fees growth
Organic commissions and fees growth excludes: (i) the impact of foreign currency
translation; (ii) the first twelve months of net commission and fee revenues
generated from acquisitions; and (iii) the net commission and fee revenues related to operations disposed of in each period presented, from
reported commissions and fees growth.
We
believe
organic
growth
in
commissions
and
fees
provides
a
measure
that
the
investment
community
may
find
helpful
in
assessing
the
performance
of
operations that were part of our operations in both the current and prior periods,
and provides a measure against which our businesses may be assessed in the
future. Underlying revenues, underlying total expenses, underlying salaries
and benefits, underlying operating income, underlying EBITDA, underlying net
income and underlying net income per diluted share
Underlying revenues, underlying total expenses, underlying salaries and benefits,
underlying operating income, underlying EBITDA, underlying net income and
underlying net income per diluted share are calculated by excluding the impact of certain items, including foreign currency translation, from
total revenue, total expenses, salaries and benefits, operating income, net (loss)
income and net (loss) income per diluted share, respectively, the most
directly comparable GAAP measures. We believe that excluding these items, as
applicable, from total revenue, total expenses, salaries and benefits,
operating
income
and
net
(loss)
income
and
net
(loss)
income
per
diluted
share,
provides
a
more
complete
and
consistent
comparative
analysis
of
our
results of operations.
2 |
 3Q
2014 Underlying EPS growth 3
See important disclosures regarding non-GAAP measures on page 2 and
reconciliations starting on page 17 Underlying
business
performance
–
comprising
revenue
and
expense
growth
–
resulted
in
net
$(0.04)
reduction to EPS
Other items -
higher interest expense and tax rate, partly offset by contributions from
Associates and Noncontrolling Interests –
resulted in net $(0.01) reduction to underlying EPS
Underlying EPS down $0.05 cents year over year
Underlying business
performance = $(0.04)
-
Increased tax rate= $(0.01)
-
Associates = $0.01
-
Noncontrolling interests = $0.01
$0.34
$0.09
$(0.13)
$(0.02)
$0.01
$0.00
$(0.10)
$(0.08)
$(0.15)
$0.19
$0.14
$(0.04)
Q3 2013
Reported EPS
Loss on
Extinguishment
of Debt
Q3 2013
Underlying EPS
Increased
Commissions
and Fees
Increased
Expenses
Interest Expense
Other
Share count
Q3 2014
Underlying EPS
Foreign Currency
Movements
Operational
Improvement
Program
Q3 2014
Reported EPS |
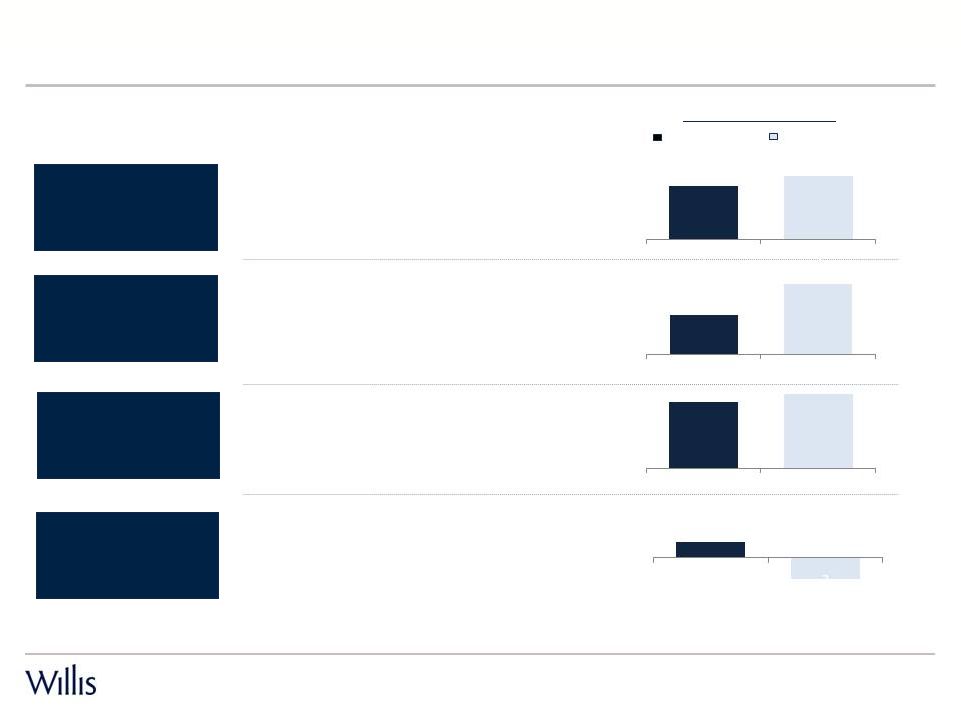
 $281
million generated through the first nine months of 2014 •
$85 million reduction from $366 million in year ago period
•
Year ago period benefited from significant non-recurring cash
inflows relating to close out of derivatives and current year
includes higher cash payments under the 2011 long-term
compensation plan
•
Partially offset by current year period reflecting increase in cash
collection of accounts receivable
YTD 2014 underlying EBITDA and cash generation
$636
$646
See important disclosures regarding non-GAAP measures on page 2 and
reconciliations starting on page 17 Underlying EBITDA down 1.5%
reflecting: Underlying revenue growth
International driven by emerging markets and Charles Monat
acquisition in Asia
North America growth in regions moderated by divestitures
Global reflects good growth in Reinsurance moderated by Willis
Insurance UK
Offset by underlying expense growth
Investments to drive sustained growth and support operations,
including Global Wealth Solutions and Connecting Willis
Other operating expense growth driven primarily by business
development costs
4
Net cash provided by operating activities
Underlying EBITDA
$ millions
$359
$362
$191
$187
$96
$87
YTD 2013
YTD 2014
1Q
2Q
3Q
$366
$281
Sept. 30
2013
Sept. 30
2014
$ millions
Net cash provided by operating activities |
 Reported
3Q 2014 Commissions and fees growth
5
•
Excellent result driven by growth in
emerging markets and Western
Europe
•
Growth led by International with solid
results in North America and
Reinsurance
•
Willis Re grew low-single digits, driven
by strong growth in North America
•
UK Insurance down mid-single digits:
•
Partly due to major construction
project in year ago quarter that did
not recur
•
Growth in geographic regions led by
Midwest and Atlantic
•
Human Capital up mid-single digits
•
Construction down due to lower projects
compared to prior year
Organic
Group
North
America
Global
International
% Growth
3Q 2014 vs. 3Q 2013
See important disclosures regarding non-GAAP measures on page 2 and
reconciliations starting on page 17 2.1%
2.5%
1
2
1.9%
3.4%
0.3%
-
0.4%
1
2
5.6%
6.3%
1
2
1
2 |
 Underlying
expense
growth over
past 4
quarters:
Q314: 4.1%
Q214: 6.1%
Q114: 5.5%
Q413: 7.1%
(1)
Total underlying operating expense growth of 4.1%
3Q 2014 Total operating expenses
Q3 2014 total underlying operating expenses up $30 million, or 4.1%, largely driven
by growth in salary and benefits (~75% of total operating expenses)
Underlying expense rate of growth declined significantly in the third quarter
relative to previous three quarters
6
$ millions
See important disclosures regarding non-GAAP measures on page 2 and
reconciliations starting on page 17 (1) Represents expense growth
on an “apples to apples basis”, as if company had been accruing bonuses throughout 2012. Underlying expense growth was 10.7% |
 $547
$569
$570
$575
$569
Q313
Q413
Q114
Q214
Q314
3Q 2014 Salaries and benefits
7
(1)
Q3 2013 has been rebased to current period exchange rates to remove the impact of
foreign currency movements when comparing periods Underlying salaries and
benefits ($ millions) $ millions
Q3 2013 Q3 2014 Change
•
Growth in underlying S&B of 4.0% in 3Q14
compared to prior year quarter
•
Increase driven by headcount growth and salary
reviews
•
Group headcount:
•
Up 2.2% Y-o-Y
•
Up 1.7% YTD with more than half of the
increase in Mumbai
•
Quarterly S&B is relatively flat over last four
quarters
•
2014 YTD headcount growth lower compared
to prior year period; growth rate in S&B
beginning to moderate
Reported S&B
$541
$ 569
Y-o-Y FX movement
(1)
6
-
Underlying S&B
$ 547
$ 569
4.0%
Full Time Employees (FTE)
17,900
18,300
2.2%
See important disclosures regarding non-GAAP measures on page 2 and
reconciliations starting on page 17 |
 3Q
2014 Non-operating segment items and Corporate & other 8
•
Improved performance from Associates in 3Q14, primarily Gras Savoye
•
Increase in expense in the quarter represents $14 million of
foreign exchange loss on revaluation of non-functional currency
assets and liabilities
•
Taxes for 3Q14 impacted by a $4 million expense recorded to bring the tax
charge for the prior two quarters in line with our latest estimates for the full
year
Other
income/expense
Tax
Associates |
 Balance sheet highlights
9
•
Share buyback program completed just after end of Q314
•
CapEx up due to investments in systems and infrastructure
•
Dividends increased 9% from year ago period
•
Acquisition of Charles Monat completed in 2Q14
•
Cash on hand up $33 million compared to 3Q13
•
Cash on hand down $140 million from year end 2013,
primarily due to the share buyback program and increased
cash dividends, offset by non-recurrence of $65 million debt
tender premium paid in 3Q13
Cash as of
Corporate Uses of Cash
$ millions
$ millions
$623
$796
$656
Sept. 30
2013
Dec. 31
2013
Sept. 30
2014
$30
$47
$200
$144
$157
$78
$81
2013 YTD
2014 YTD
Acquisitions
Share Buyback
Dividends
CapEx
$252
$
485 |
 Operational Improvement Program and metrics
10
$ millions
2014
2015
2016
2017
Cumulative
2014-2017
Annualized
2018+
As of April, 2014 announcement
Expected Charge
$410
Expected Savings
$5
$45
$135
$235
$420
$300
Key metrics to be updated annually :
As of March 31, 2014
•
Ratio of full time employees (FTEs) in higher cost vs. lower cost near-shore
and off-shore centers
•
Ratio of square footage of real estate per FTE (indexed to 100)
•
Ratio of desks per FTE (indexed to 100)
As of October, 2014 update
Expected Spend
$40
$130
$240
$410
Expected Savings
$8
$60
$135
$235
$420
$300
80:20
100
100 |
 Summary
11
Organic C&F
growth
Focused
M&A
Expense
discipline +
OIP
Earnings
growth
Margin
expansion
Improved
cash flow
•
Disciplined approach to expense management
•
Reduced net headcount additions
•
Encouraging early actions within the OIP
•
$300 million of annualized savings at end of
Program
•
Global presence
•
Connecting Willis
•
Innovation
•
Delivering better solutions for clients and driving
new business
•
High quality, specialized firms with leading positions
•
Recent examples include:
•
Charles Monat
•
Max Mattheissen
•
SurePoint Reinsurance Advisors
•
IFG’s Irish pension and financial advisory business
|
 APPENDICES |
 YTD
2014 Underlying EPS growth 13
See important disclosures regarding non-GAAP measures on page 2 and
reconciliations starting on page 17 Underlying business performance, together
with improved contributions from Associates, total to $nil per share
Other items -
increased tax rate $(0.15), increased share count $(0.04), increased interest
expense $(0.03), negatively impact underlying EPS in the YTD period
Underlying EPS down $0.20 YTD 2014 vs. YTD 2013, negatively impacted by higher tax
rate and increased share count
-
Deferred tax valuation allowance
= $(0.12)
-
Venezuela devaluation = $(0.07)
-
Loss on disposal = $(0.01)
-
Associates = $0.05
-
Increased interest expense = $(0.03)
-
Noncontrolling interests = $0.01
-
Other income /expense =$0.01
$0.34
$0.21
$0.45
$(0.50)
$0.04
$(0.15)
$(0.04)
$(0.16)
$(0.09)
$(0.20)
$1.67
$2.22
$2.02
$1.57
YTD 2013
Reported EPS
Loss on
Extinguishment
of Debt
Expense
Reduction
Initiative
YTD 2013
Underlying EPS
Increased
Commissions
and Fees
Increased
Expenses
Other
Increased Tax
Rate
Increased share
count
YTD 2014
Underlying EPS
Foreign
Currency
Movements
Operational
Improvement
Program
Other
YTD 2014
Reported EPS
Underlying business
performance =$(0.05) |
 Reported
YTD 2014 Commissions and fees growth
14
•
Very strong growth driven by increase in
emerging markets and solid
performance in Western Europe
•
Good growth despite challenging market
conditions in Reinsurance and moderating
rates across almost all markets
•
Mid-single digit growth in reinsurance
(led by North America)
•
Willis Insurance UK is lagging as UK
Retail continues in turnaround and
Specialties suffers from difficult
comparisons due to large projects in
prior year
•
Good growth driven by solid performances
by most regions and bolstered by growth
in
two
largest
practices
–
Employee
Benefits and Construction
Organic
Group
North
America
Global
International
See important disclosures regarding non-GAAP measures on page 2 and
reconciliations starting on page 17 1
2
1
2
1
2
3.3%
4.4%
3.2%
1.9%
6.0%
6.5%
3.9%
3.8%
% Growth
YTD 2014 vs. YTD 2013 |
 5.2%
underlying
total
operating
expense
growth
driven
by
S&B
and
other
operating
expenses
YTD 2014 Total operating expenses
15
$ millions
Salaries
and
benefits
up
5.1%
driven
by
investments
in
headcount
to
support
business
growth,
together with salary reviews
Other operating expenses up 6.5% driven by increased business development expenses
and systems related expenditure
See important disclosures regarding non-GAAP measures on page 2 and
reconciliations starting on page 17 $30
$(46)
$1
$83
$30
$2
$20
$2,218
$2,201
$2,316
$2,336
YTD 2013
Reported
Foreign
Currency
Movement
Expense
Reduction
Initiative
Debt
Extinguishment
Fees
YTD 2013
Underlying
Salaries and
Benefits
Other Operating
Expenses
Depreciation &
Amortization
YTD 2014
Underlying
Operational
Improvement
Program
YTD 2014
Reported |
 $1,631
$570
$575
$569
$1,714
YTD13
Q114
Q214
Q314
YTD14
$ millions
YTD2013 YTD2014 Change
Reported S&B
$1,638
$ 1,714
Expense Reduction Initiative
(29)
-
Y-o-Y FX movement
(1)
22
-
Underlying S&B
$1,631
$1,714
5.1%
Full Time Employees (FTE)
17,900
18,300
2.2%
YTD 2014 Salaries and benefits
16
(1)
YTD
2013 has been rebased to current period exchange rates to remove the impact of
foreign currency movements when comparing periods Underlying salaries and
benefits ($ millions)
•
Growth in underlying S&B of 5.1% YTD in 2014
compared to prior year
•
Increase driven by increased headcount and
salary reviews
•
Group headcount:
•
Up 2.2% Y-o-Y
•
Up 1.7% YTD with more than half of the
increase in Mumbai
•
YTD increase driven by investments in
revenue-producing talent, as well as client
service and risk management capabilities
•
Quarterly S&B expense is relatively level
throughout first three quarters of 2014
•
Sequential slowing of S&B growth rate
•
Y-o-Y increase of 4.0% in Q3 vs 6.3%
in Q2 and 5.0% in Q1
See important disclosures regarding non-GAAP measures on page 2 and
reconciliations starting on page 17 |
 Important disclosures regarding non-GAAP measures
17
Commissions and fees analysis
2014
2013
Change
Foreign
currency
translation
Acquisitions
and
disposals
Organic
commissions
and fees
growth
($ millions)
%
%
%
%
Three months ended
September 30, 2014
North America
$328
$322
1.9
-
(1.5)
3.4
International
190
180
5.6
(4.2)
3.5
6.3
Global
290
289
0.3
1.3
(0.6)
(0.4)
Total
$808
$791
2.1
(0.4)
-
2.5
2014
2013
Change
Foreign
currency
translation
Acquisitions
and
disposals
Organic
commissions
and fees
growth
($ millions)
%
%
%
%
Nine months ended
September 30, 2014
North America
$1,037
$1,004
3.3
(0.1)
(1.0)
4.4
International
691
652
6.0
(2.0)
1.5
6.5
Global
1,100
1,066
3.2
1.6
(0.3)
1.9
Total
$2,828
$2,722
3.9
0.2
(0.1)
3.8 |
 Important disclosures regarding non-GAAP measures
18
Operating income to underlying operating income
For prior periods, underlying measures have been rebased to current period exchange
rates to remove the impact of foreign currency movements when comparing
periods 2013
2014
($ millions)
1Q
2Q
3Q
YTD
1Q
2Q
3Q
YTD
Total revenue
$1,051
$890
$795
$2,736
$1,097
$935
$812
$2,844
excluding:
Foreign currency movements
3
5
(3)
5
-
-
-
-
Underlying revenue
$1,054
$895
$792
$2,741
$1,097
$935
$812
$2,844
Operating income
$281
$167
$70
$518
$326
$148
$34
$508
excluding:
Operational improvement program
-
-
-
-
-
3
17
20
Expense reduction initiative
46
-
-
46
-
-
-
-
Fees related to extinguishment of debt
-
-
1
1
-
Foreign currency movements
(4)
(11)
(10)
(25)
-
-
-
-
Underlying operating income
$323
$156
$61
$540
$326
$151
$51
$528
Operating margin (operating income as a
percentage of total revenue)
26.7%
18.8%
8.8%
18.9%
29.7%
15.8%
4.2%
17.9%
Underlying operating margin (underlying operating
income as a percentage of underlying total revenue)
30.6%
17.4%
7.7%
19.7%
29.7%
16.1%
6.3%
18.6% |
 Important disclosures regarding non-GAAP measures
19
Net income (loss) to underlying net income
2013
2014
($ millions, except per share data)
1Q
2Q
3Q
YTD
1Q
2Q
3Q
YTD
Net income (loss)
$219
$105
($27)
$297
$246
$47
($7)
$286
Excluding the following, net of tax:
Operational improvement program
-
-
-
-
-
2
14
16
Venezuela currency devaluation
-
-
-
-
-
13
-
13
Deferred tax valuation allowance
-
-
-
-
-
21
-
21
Expense reduction initiative
38
-
-
38
-
-
-
-
Loss on extinguishment of debt
-
-
60
60
-
Fees related to debt extinguishment
-
-
1
1
-
Net loss on disposal of operations
-
-
-
-
2
-
-
2
Foreign currency movements
(6)
(5)
(18)
(29)
-
-
-
-
Underlying net income
$251
$100
$16
$367
$248
$83
$7
$338
Diluted shares outstanding
176
178
180
178
182
182
181
182
Net income (loss) per diluted share
$ 1.67
$1.35
$0.26
($0.04)
$1.57
Underlying net income per diluted share
$2.22
$1.36
$0.49
$0.14
$2.02
$1.24
$0.59
$0.59
$1.46
($0.15)
$0.19
For prior periods, underlying measures (other than EPS) have been rebased to current period exchange
rates to remove the impact of foreign currency movements when comparing periods. In the current
three and nine month periods only, underlying EPS excludes the $0.10 and $0.16 respectively, negative
year over year impact of foreign currency movements in order to assist comparability to EPS figures
that have been disclosed in prior periods. |
 2013
2014
($ millions)
1Q
2Q
3Q
YTD
1Q
2Q
3Q
YTD
Net income (loss)
$219
$105
($27)
$297
$246
$47
($7)
$286
Add back:
Net income (loss) attributable to
noncontrolling interests
4
2
-
6
4
1
(1)
4
Interest in earning of associates,
net of tax
(15)
3
1
(11)
(19)
3
(3)
(19)
Income tax charge
48
29
11
88
63
59
2
124
Interest expense
31
32
30
93
32
35
34
101
Other expense (income)
(6)
(4)
(5)
(15)
-
3
9
12
Loss on extinguishment of debt
-
-
60
60
-
-
-
-
Depreciation
26
21
21
68
23
24
23
70
Amortization
14
14
14
42
13
12
13
38
EBITDA
$321
$202
$105
$628
$362
$184
$70
$616
Adjusting items:
Operational improvement program
-
-
-
-
-
3
17
20
Expense reduction initiative
41
-
-
41
-
-
-
-
Fees related to debt extinguishment
-
-
1
1
-
-
-
Foreign currency movements
(3)
(11)
(10)
(24)
-
-
-
-
Underlying EBITDA
$359
$191
$96
$646
$362
$187
$87
$636
Important disclosures regarding non-GAAP measures
20
Net income (loss) to underlying EBITDA
For prior periods, underlying measures have been rebased to current period exchange
rates to remove the impact of foreign currency movements when comparing
periods |
 Important disclosures regarding non-GAAP measures
21
Reported total expenses to underlying total expenses, and
Reported salaries and benefits to underlying salaries and benefits
For prior periods, underlying measures have been rebased to current period exchange
rates to remove the impact of foreign currency movements when comparing
periods 2013
2014
(In millions)
1Q
2Q
3Q
YTD
1Q
2Q
3Q
YTD
Reported total expenses
$770
$723
$725
$2,218
$771
$787
$778
$2,336
Excluding:
Operational improvement program
-
-
-
-
-
(3)
(17)
(20)
Expense reduction initiative
(46)
-
-
(46)
-
-
-
-
Fees related to extinguishment of debt
-
-
(1)
(1)
-
-
-
-
Foreign currency movements
7
16
7
30
-
-
-
-
Underlying total expenses
$731
$739
$731
$2,201
$771
$784
$761
$2,316
Reported salaries and benefits
$568
$529
$541
$1,638
$570
$575
$569
$1,714
Excluding:
Expense reduction initiative
(29)
-
-
(29)
-
-
-
-
Foreign currency movements
4
12
6
22
-
-
-
-
Underlying salaries and benefits
$543
$541
$547
$1,631
$570
$575
$569
$1,714 |
 IR
Contacts Peter Poillon
Tel: +1 212 915-8084
Email: peter.poillon@willis.com
Mark Jones
Tel: +1 212 915-8796
Email: mark.p.jones@willis.com
22 |