Attached files
| file | filename |
|---|---|
| 8-K - TMUS FORM 8-K - T-Mobile US, Inc. | tmus09302014form8-k.htm |
| EX-99.1 - TMUS EXHIBIT 99.1 - T-Mobile US, Inc. | tmus09302014ex991.htm |
EXHIBIT 99.2

1

2
CUSTOMER METRICS
Branded Postpaid Customers
▪ | Branded postpaid net customer additions were 1,379,000 in the third quarter of 2014 compared to 908,000 in the second quarter of 2014 and 648,000 in the third quarter of 2013. The third quarter of 2014 was the best quarter ever in terms of branded postpaid net additions due to the continued success of the Un-carrier initiatives and strong uptake of promotions for services and devices. |
▪ | T-Mobile again led the industry in branded postpaid phone net customer additions with 1,175,000 in the third quarter of 2014, more than doubling the 579,000 reported in the second quarter of 2014 and up from 643,000 in the third quarter of 2013. Sequentially and year-over-year, the increase was primarily due to higher gross additions, which were up 47% compared to the second quarter of 2014 and up 46% compared to the third quarter of 2013. |
▪ | Branded postpaid mobile broadband net customer additions (including tablets) were 204,000 in the third quarter of 2014, compared to 329,000 in the second quarter of 2014 and 5,000 in the third quarter of 2013. Sequentially, the decline was primarily a result of lower gross additions due to few new product introductions in the category. |
▪ | Branded postpaid phone churn was 1.6% in the third quarter of 2014, up 10 basis points compared to the second quarter of 2014 and down 10 basis points compared to the third quarter of 2013. Sequentially, the increase in phone churn was primarily due to seasonal factors as the second half of the calendar year typically experiences a higher rate of churn. Year-over-year, the decrease in phone churn was primarily due to the continued success of the Company’s Un-carrier initiatives. |


3
Branded Prepaid Customers
▪ | T-Mobile is expected to again lead the industry in branded prepaid net customer additions with 411,000 in the third quarter of 2014, quadrupling the 102,000 reported in the second quarter of 2014 and up from 24,000 in the third quarter of 2013. Sequentially and year-over-year, the increase was primarily due to the continued strength of the MetroPCS brand, expansion to additional markets, and the successful execution of promotional programs. |
▪ | Migrations to branded postpaid plans reduced branded prepaid net customer additions in the third quarter of 2014 by approximately 110,000, up from 85,000 in the second quarter of 2014, but down from 150,000 in the third quarter of 2013. |
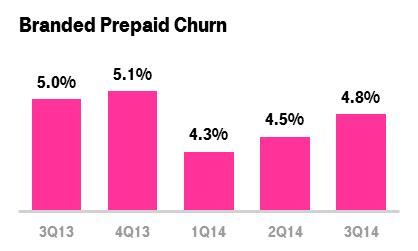
▪ | Branded prepaid churn was 4.8% in the third quarter of 2014, up 30 basis points from 4.5% in the second quarter of 2014 and down 20 basis points from 5.0% in the third quarter of 2013. Sequentially, the increase in churn was primarily due to higher deactivations as a result of the competitive environment in the prepaid market and seasonal factors as the second half of the calendar year typically experiences a higher rate of churn. Year-over-year, the decrease in churn was primarily due to the growth of MetroPCS customers, which historically have lower rates of churn than T-Mobile branded prepaid customers. |

Total Branded Customers
▪ | Total branded net customer additions were 1,790,000 in the third quarter of 2014 compared to 1,010,000 in the second quarter of 2014 and 672,000 in the third quarter of 2013. This was the third consecutive quarter in which branded customer net additions surpassed the one million milestone, and was also the best quarter ever in terms of total branded net customer additions. |

4
Wholesale Customers
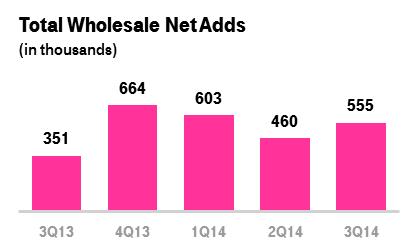
▪ | Total wholesale net customer additions were 555,000 in the third quarter of 2014 compared to 460,000 in the second quarter of 2014 and 351,000 in the third quarter of 2013. |
▪ | MVNO net customer additions were 333,000 in the third quarter of 2014 compared to 235,000 in the second quarter of 2014 and 344,000 in the third quarter of 2013. |
▪ | M2M net customer additions were 222,000 in the third quarter of 2014 compared to 225,000 in the second quarter of 2014 and 7,000 in the third quarter of 2013. |
Total Customers
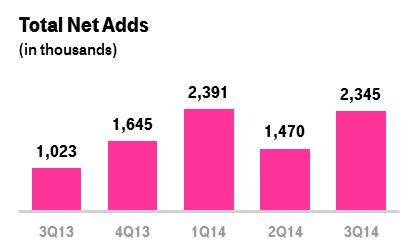
▪ | Total net customer additions were 2,345,000 in the third quarter of 2014 compared to 1,470,000 in the second quarter of 2014 and 1,023,000 in the third quarter of 2013. This was the second quarter in 2014 with total net customer additions in excess of two million. |
▪ | T-Mobile has added 10 million total customers over the last 6 quarters, since the launch of the Un-carrier initiatives. |
▪ | Total customers at the end of the third quarter of 2014 were 52.9 million. |
NETWORK
Network Modernization Update
• | T-Mobile’s 4G LTE network now covers 250 million people, already reaching its year-end goal. The company expects to cover more than 260 million people with 4G LTE by year-end 2014. |
• | T-Mobile is upgrading its remaining 2G only footprint by adding 4G LTE, and expects to cover more than 280 million people with 4G LTE by mid-2015. |
5
• | The Company is targeting a 4G LTE population coverage of 300 million people by year-end 2015. |
• | T-Mobile has rolled out 10+10 MHz 4G LTE in 43 of the Top 50 markets. Wideband LTE, which refers to markets that have bandwidth of at least 15+15 MHz dedicated to 4G LTE, is currently available in 19 markets and is expected to be available in at least 26 markets by year-end 2014. Customers in Wideband LTE markets are regularly observing peak speeds in the 70 Mbps range, with maximum real-world speeds in excess of 145 Mbps. |

Network Speed
• | T-Mobile has the fastest nationwide 4G LTE network in the U.S. based on download speed from millions of user generated test results. This is the third consecutive quarter that T-Mobile has led the industry in download speeds. |
• | In the third quarter of 2014, T-Mobile’s average 4G LTE download speed was 18.8 Mbps compared to Verizon at 16.8 Mbps, AT&T at 14.3 Mbps, and Sprint at 9.6 Mbps. |
• | T-Mobile’s average 4G LTE download speed in the third quarter of 2014 was 12% faster than Verizon, 31% faster than AT&T, and nearly twice as fast as Sprint. |

Spectrum
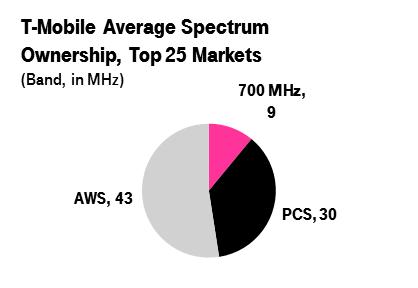
• | T-Mobile currently owns an average of 82 MHz of spectrum across the top 25 markets in the U.S. This is comprised of 9 MHz in the 700 MHz band, 30 MHz in the 1900 MHz PCS band, and 43 MHz in the AWS band. |
• | The Company expects to be a participant in future FCC spectrum auctions including the AWS-3 spectrum auction and the broadcast incentive auction. |
6
A-Block Update
• | T-Mobile owns or has agreements to own 700 MHz A-Block spectrum covering 176 million people or approximately 55% of the U.S. population and more than 70% of the Company’s existing customer base. The spectrum covers 9 of the Top 10 metro areas and 22 of the Top 30 metro areas in the U.S. |
• | The first 700 MHz sites are already on air and several Band 12 capable handsets are available in the market, including the Samsung Note 4. The Company will continue to aggressively roll-out new 700 MHz sites going forward. More Band 12 capable handsets will become available in the remainder of 2014 and first half of 2015. |
• | More than 50% of the markets covered by the Company’s A-Block spectrum are free and clear and ready to be deployed. The remaining markets are encumbered by Channel 51 broadcasts, generally limiting T-Mobile’s ability to use the spectrum until after the incumbent broadcasters are relocated. However, the Company has already entered into agreements to relocate broadcasters to new frequencies in 6 markets covering more than 17 million people, making those markets available for launch in 2015. |
• | T-Mobile has also entered into several agreements with multiple parties to acquire A-Block spectrum in additional markets covering 18 million people since completing the Verizon A-Block spectrum transaction in April 2014, bringing the total coverage to 176 million people. |
METROPCS
Integration and Expansion
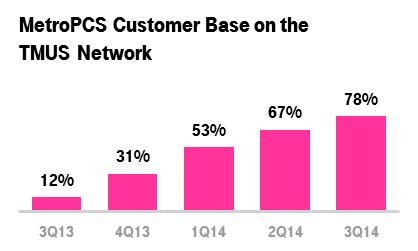
▪ | The MetroPCS customer base continues to rapidly migrate off the legacy CDMA network. At the end of the third quarter of 2014, 78% of the total MetroPCS customer base was already on the T-Mobile network compared to 67% and the end of the second quarter of 2014. |
▪ | Approximately 63% of the MetroPCS spectrum on a MHz/POP basis has already been re-farmed and integrated into the T-Mobile network at the end of the third quarter of 2014 compared to 60% at the end of the second quarter of 2014. |
▪ | MetroPCS expanded into an additional 10 markets in the third quarter of 2014, bringing the total market count to 55. New MetroPCS markets include Chicago, St. Louis, Minneapolis, Kansas City, and Salt Lake City. |
▪ | MetroPCS added 900 new points of sale in the third quarter of 2014, bringing the total to 4,000 in the 40 expansion markets and nearly 11,000 MetroPCS points of sale nationwide. |
7
Synergies and Integration Costs
▪ | At the time the business combination with MetroPCS was announced, the original projected synergy target called for $1.5 billion in annual run-rate synergies to be realized by the fifth year after the transaction close. The Company remains confident that the realized synergies will come in ahead of the original schedule. |
▪ | In July 2014, T-Mobile decommissioned the CDMA portion of the MetroPCS networks in Boston, Hartford, and Las Vegas, over two years ahead of the initial plan. The Company shut down the CDMA portion of the MetroPCS network in Philadelphia early in the fourth quarter, and will potentially de-commission several additional markets by the end of the year. These network shutdowns will provide the CDMA customers of MetroPCS with access to a faster 4G LTE network, free up spectrum that can be re-used to further improve the speed and quality of the T-Mobile network, and enable the Company to realize the synergies from running a single network structure. |
▪ | T-Mobile expects to incur network decommissioning costs between $250 million and $300 million in 2014, of which $97 million were recognized in the third quarter of 2014. Network decommissioning costs primarily relate to the accelerated recognition of future lease costs for cell sites, and will be excluded from Adjusted EBITDA. |
▪ | The Company will provide a full financial update on the realized and targeted synergies when it reports its full year 2014 results. |

UN-CARRIER INITIATIVES
▪ | At the end of the third quarter of 2014, 84% of the branded postpaid customer base was on a Simple Choice plan, up from 80% at the end of the second quarter of 2014 and 61% at the end of the third quarter of 2013. |
8
▪ | At the end of the third quarter of 2014, 8.0 million customers were enrolled in the JUMP! program, up from 6.7 million at the end of the second quarter of 2014 and 2.2 million at the end of the third quarter of 2013. |


Un-carrier 7.0
▪ | Introduced in September 2014, “Wi-Fi Unleashed” makes voice and texting available to customers worldwide, anywhere a Wi-Fi connection is available. The program also offers postpaid customers a Personal CellSpot device free of charge to boost coverage in more areas, and also enables free in-flight texting in a partnership with Gogo. |
▪ | T-Mobile is the first U.S. carrier to adopt Wi-Fi calling across all new smartphones as well as the first to introduce nationwide Voice over LTE (“VoLTE”). Customers can experience these ground-breaking technologies, including seamless handover between the two, on both the iPhone 6 and iPhone 6 Plus. |
DEVICES
▪ | Total device sales were 7.7 million units in the third quarter of 2014 compared to 6.9 million units in the second quarter of 2014 and 6.3 million units in the third quarter of 2013. |
▪ | Total smartphone sales were 6.9 million units in the third quarter of 2014 compared to 6.2 million units in the second quarter of 2014 and 5.6 million units in the third quarter of 2013. Smartphones comprised 93% of total phone unit sales in the third quarter of 2014. |
▪ | At the end of the third quarter of 2014, 84% of the total branded postpaid phone customer base used smartphones, flat compared to the second quarter of 2014, and up from 77% in the third quarter of 2013. |
▪ | At the end of the third quarter of 2014, 84% of the total branded prepaid phone customer base used smartphones, up from 83% in the second quarter of 2014 and 80% in the third quarter of 2013. |
▪ | The upgrade rate for branded postpaid customers was approximately 9% in the third quarter of 2014 compared to approximately 8% in the second quarter of 2014 and approximately 9% in the third quarter of 2013. |
▪ | T-Mobile has seen tremendous demand for the new iPhones. The launch of the iPhone 6 and iPhone 6 Plus was T-Mobile’s biggest launch ever. |
9

EQUIPMENT INSTALLMENT PLANS (EIP)
▪ | T-Mobile financed $1.317 billion of equipment sales on EIP in the third quarter of 2014, down 1.9% from $1.342 billion in the second quarter of 2014 and up 30.3% from $1.011 billion in the third quarter of 2013. |
▪ | Customers on Simple Choice plans had associated EIP billings of $967 million in the third quarter of 2014, up 19.4% from the $810 million reported in the second quarter of 2014 and up 122.3% from the $435 million reported in the third quarter of 2013. |
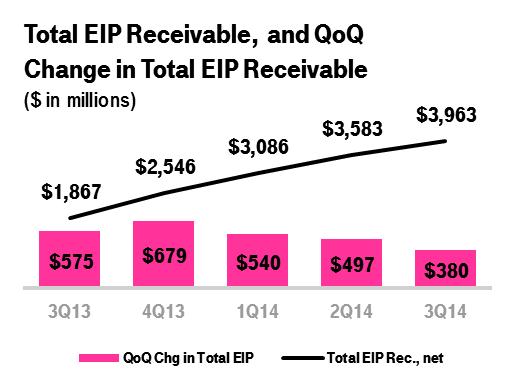
▪ | Total EIP receivables, net of deferred interest and allowances for credit losses, were $3.963 billion at the end of the third quarter of 2014 compared to $3.583 billion at the end of the second quarter of 2014 and $1.867 billion at the end of the third quarter of 2013. The $380 million sequential increase in total EIP receivables, net in the third quarter of 2014 was lower than the sequential increase of $497 million in the second quarter of 2014, and represents the third consecutive quarter in which the sequential increase in the total EIP receivable has declined. |
CUSTOMER QUALITY
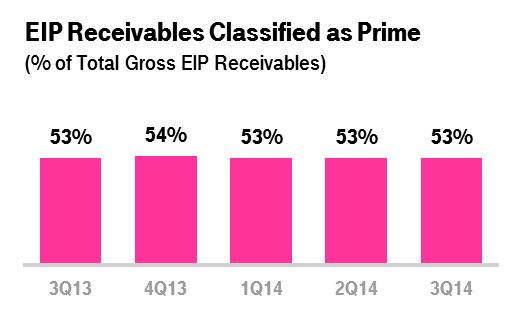
▪ | EIP receivables classified as Prime were 53% of total gross EIP receivables at the end of the third quarter of 2014, flat compared to the end of the second quarter of 2014 and the third quarter of 2013. |
▪ | Total bad debt expense was $85 million in the third quarter of 2014 compared to $87 million in the second quarter of 2014 and $120 million in the third quarter of 2013. Service bad debt in the third quarter of 2014 was flat sequentially and down 84% year-over-year. The year-over-year decrease was primarily due to the sale of service receivables under a factoring arrangement, which no longer results in service bad debt for receivables |
10
sold. EIP bad debt in the third quarter of 2014 decreased by 3% sequentially and increased by 48% year-over-year. The year-over-year increase was primarily due to a large expansion in the EIP program.
▪ | The net expense from the factoring arrangement was $67 million in the third quarter of 2014 compared to $77 million in the second quarter of 2014. The net expense from the factoring arrangement represents losses from the sale of receivables as well as transaction fees. |
▪ | Total bad debt and net expense from the factoring arrangement was $152 million in the third quarter of 2014 compared to $164 million in the second quarter of 2014 and $120 million in the third quarter of 2013. Year-over-year, the increase was primarily due to an increase in bad debt related to growth in the EIP program. |
AVERAGE BILLINGS PER USER (ABPU) and AVERAGE REVENUE PER USER (ARPU)
Branded Postpaid ABPU
▪ | Branded postpaid ABPU was $61.59 in the third quarter of 2014, up 3.0% from $59.79 in the second quarter of 2014 and up 4.2% from $59.08 in the third quarter of 2013. ABPU in the third quarter of 2014 was the highest in the Company’s history. Year-over-year, the increase was primarily due to growth in EIP billings on a per user basis, offset in part by a lower branded postpaid phone ARPU. The 4.2% year-over-year increase represents a significant improvement from the 1.8% year-over-year growth rate in the second quarter of 2014. |

Branded Postpaid Phone ARPU
▪ | Branded postpaid phone ARPU was $49.84 in the third quarter of 2014, up 1.1% from $49.32 in the second quarter of 2014 and down 5.3% from $52.62 in the third quarter of 2013. Branded postpaid phone ARPU in the second quarter of 2014 was impacted by a reduction in certain regulatory surcharges and a revenue adjustment for expected customer refunds on premium SMS charges. Excluding the $0.61 impact resulting from these non- |
11
recurring factors, branded postpaid phone ARPU stabilized from the second quarter of 2014 to the third quarter of 2014.
▪ | Sequentially, branded postpaid phone ARPU was supported by the fact that most of the customer base has already converted to Simple Choice plans, and by recent pricing actions including changes in requalification for corporate discount programs and the increase in pricing for unlimited data. These increases were partially offset by some dilution caused by promotions for services, including the “4 for $100” offer. |
▪ | Year-over-year, branded postpaid phone ARPU decreased primarily due to the continued growth of Simple Choice plans and promotions for services, including the “4 for $100” offer. Changes in requalification for corporate discounts programs positively impacted branded postpaid phone ARPU in the third quarter of 2014. The decrease in branded postpaid phone ARPU of 5.3% year-over-year was a significant improvement from the 7.6% year-over-year decline in the second quarter of 2014, excluding the non-recurring factors described above. |

Branded Prepaid ARPU
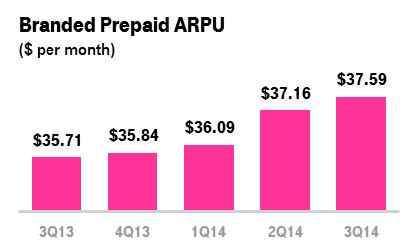
▪ | Branded prepaid ARPU was $37.59 in the third quarter of 2014, up 1.2% from $37.16 in the second quarter of 2014 and up 5.3% from $35.71 in the third quarter of 2013. Sequentially and year-over-year, the increase in ARPU was primarily due to growth in the MetroPCS customer base, which generates higher ARPU than T-Mobile’s other branded prepaid customers. |
REVENUES
Service Revenues
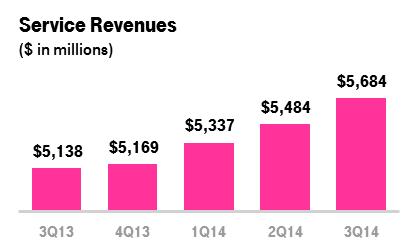
▪ | T-Mobile again led the industry in year-over-year service revenue growth and registered the sixth consecutive quarter of sequential growth. |
12
▪ | Service revenues were $5.684 billion in the third quarter of 2014, up 3.6% from $5.484 billion in the second quarter of 2014 and up 10.6% from $5.138 billion in the third quarter of 2013. The year-over-year growth rate of 10.6% in the third quarter of 2014 showed a further acceleration from the 7.1% pro forma combined year-over-year growth rate reported in the second quarter of 2014 and the 4.5% pro forma combined year-over-year growth rate reported in the first quarter of 2014. |
▪ | Sequentially, the increase in service revenues was primarily due to growth in the customer base. |
▪ | Year-over-year, the increase in service revenues was primarily due to growth in the customer base and increased adoption of insurance and upgrade programs such as JUMP!, partially offset by lower ARPU due to increased adoption of Simple Choice plans. |

Equipment Sales Revenues
▪ | Equipment sales revenues were $1.561 billion in the third quarter of 2014, down 2.4% from $1.600 billion in the second quarter of 2014 and up 6.4% from $1.467 billion in the third quarter of 2013. |
▪ | Sequentially, the decrease in equipment sales revenues was primarily due to revenue reductions from the reimbursement of other carriers’ ETFs and a lower average revenue per unit sold. These decreases were partially offset by growth in the number of devices and accessories sold and higher device upgrade volumes. |
▪ | Year-over-year, the increase in equipment sales revenues was primarily due to growth in the number of devices sold and higher upgrade volumes. The increases were partially offset by reductions to equipment sales revenues from the reimbursement of other carrier’s ETFs and a lower average revenue per unit sold. |
13

Total Revenues
▪ | T-Mobile again led the industry in year-over-year total revenue growth. |
▪ | Total revenues were $7.350 billion in the third quarter of 2014, up 2.3% from $7.185 billion in the second quarter of 2014 and up 9.9% from $6.688 billion in the third quarter of 2013. |

OPERATING EXPENSES
Cost of Services
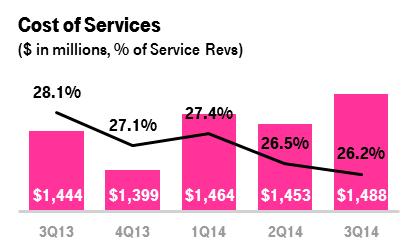
▪ | Cost of services was $1.488 billion in the third quarter of 2014, up 2.4% from $1.453 billion in the second quarter of 2014 and up 3.0% from $1.444 billion in the third quarter of 2013. The sequential and year-over-year increases were primarily due to higher lease expense relating to spectrum license lease agreements. |
▪ | While cost of services was up slightly compared to the second quarter of 2014, it declined as a percentage of service revenues by 30 basis points sequentially and by 190 basis points year-over-year. |
Cost of Equipment Sales
▪ | Cost of equipment sales was $2.308 billion in the third quarter of 2014, up 4.2% from $2.215 billion in the second quarter of 2014 and up 14.5% from $2.015 billion in the third quarter of 2013. The sequential and year- |
14
over-year increases were primarily due to growth in the number of devices and accessories sold and higher device upgrade volumes. These increases were offset in part by a lower average device cost.

Selling, General and Admin. (“SG&A”) Expenses
▪ | SG&A expenses were $2.283 billion in the third quarter of 2014, up 6.1% from $2.151 billion in the second quarter of 2014 and up 18.1% from $1.933 billion in the third quarter of 2013. The sequential and year-over-year increases were primarily due to higher commission expenses driven by increased gross customer additions and higher promotional costs. Additional year-over-year increases resulted from higher employee-related expenses associated with an increase in the number of retail and customer support employees. |

Adjusted EBITDA
▪ | Adjusted EBITDA was $1.346 billion in the third quarter of 2014, down 7.2% from $1.451 billion in the second quarter of 2014 and flat compared to the $1.344 billion reported in the third quarter of 2013. Sequentially, Adjusted EBITDA decreased primarily due to higher costs associated with a record level of customer additions in the third quarter of 2014 relative to the second quarter of 2014, including higher SG&A expenses and losses on equipment sales. |
▪ | Adjusted EBITDA margin was 24% in the third quarter of 2014 compared to 26% in the second quarter of 2014 and 26% in the third quarter of 2013. |
15

EARNINGS PER SHARE
▪ | Diluted earnings per share was a loss of $0.12 in the third quarter of 2014 compared to earnings of $0.48 in the second quarter of 2014 and a loss of $0.05 in the third quarter of 2013. The sequential decrease in earnings per share was primarily due to a non-cash gain of $731 million recognized in the second quarter of 2014 related to spectrum license transactions. Year-over-year, the loss increased partially due to higher MetroPCS business combination costs due to the shutdown of the CDMA portion of the MetroPCS network in Boston and Las Vegas. |
CAPITAL EXPENDITURES
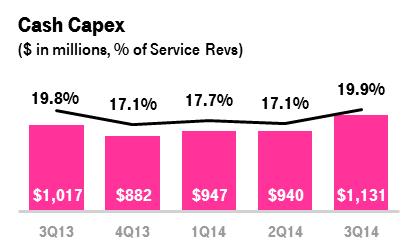
▪ | Cash capital expenditures for property and equipment were $1.131 billion in the third quarter of 2014 compared to $940 million in the second quarter of 2014 and $1.017 billion in the third quarter of 2013. The sequential and year-over-year increase was primarily due to the timing of network spend in connection with T-Mobile’s modernization program as well as commencing the rollout of 4G LTE on the 700 MHz A-Block and 1900 MHz PCS spectrum. |
SIMPLE FREE CASH FLOW
▪ | Simple free cash flow was $215 million in the third quarter of 2014 compared to $511 million in the second quarter of 2014 and $327 million in the third quarter of 2013. Sequentially, the decrease was primarily due to lower Adjusted EBITDA and higher cash capital expenditures. Year-over-year, the decrease was primarily due to higher capital expenditures. |

CAPITAL STRUCTURE
▪ | Net debt excluding tower obligations at the end of the third quarter of 2014 was $17.3 billion. |
▪ | Total debt excluding tower obligations at the end of the third quarter of 2014 was $23.1 billion and was comprised of short-term debt of $1.2 billion, long-term debt to affiliates of $5.6 billion, and long-term debt of $16.3 billion. |
▪ | The ratio of net debt to Adjusted EBITDA for the trailing last twelve month (“LTM”) period was 3.4x at the end of the third quarter of 2014 compared to 3.4x at the end of the second quarter of 2014 and 2.9x at the end of the third quarter of 2013. |
▪ | The Company’s cash position remains strong with $5.8 billion in cash at the end of the third quarter of 2014. This was reduced by approximately $1.0 billion in early October due to the redemption of the 7.875% Senior Notes due 2018. |

GUIDANCE
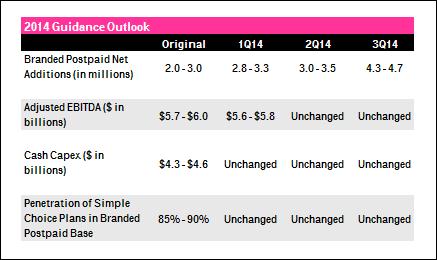
▪ | T-Mobile expects to drive further momentum while continuing to invest in profitable growth. With the success of T-Mobile's Simple Choice plan and the continued evolution of the Un-carrier value proposition, branded postpaid net additions for 2014 are now expected to be between 4.3 and 4.7 million, up significantly from the prior guidance of 3.0 to 3.5 million. |
▪ | For the full year of 2014, T-Mobile expects Adjusted EBITDA to be in the range of $5.6 to $5.8 billion, which is unchanged from prior guidance. Given the expected customer growth momentum, the Company anticipates an Adjusted EBITDA at the very low end of the range. |
▪ | Cash capital expenditures are expected to be in the range of $4.3 to $4.6 billion, which is unchanged from prior guidance. |
▪ | With this growth and rate plan migrations, the penetration of Simple Choice plans in the branded postpaid base is projected to be between 85% and 90% by the end of 2014, also unchanged from prior guidance. |
▪ | In the fourth quarter of 2014, T-Mobile expects branded postpaid phone ARPU will be down approximately 2.5% on a sequential basis primarily due to two factors. First, the Company saw incremental growth well beyond the expectations it provided previously, driven partially from lower-ARPU but very successful, NPV positive one-time promotions, including the “4 for $100” promotion. This incremental growth is estimated to reduce branded postpaid phone ARPU in the fourth quarter of 2014 by approximately 1.7%. Second, the Company is expected to see a reduction in certain regulatory surcharges, which are estimated to reduce branded postpaid phone ARPU in the fourth quarter of 2014 by approximately 0.8%. The reduction from regulatory surcharges will not affect EBITDA, since these are pass-through charges. When normalizing for this EBITDA-neutral item and for the incremental high quality growth beyond the forecasts T-Mobile provided previously, the Company is right on track for branded postpaid phone ARPU stabilization. The Company expects branded postpaid phone ARPU to increase sequentially in the first quarter of 2015, demonstrating the short-term nature of these effects in the fourth quarter of 2014. |
OTHER EVENTS
Debt Issuance
▪ | In September 2014, T-Mobile USA, Inc. issued $3.0 billion aggregate principal amount of notes in a registered public offering, consisting of $1.3 billion aggregate principal amount of 6.000% Senior Notes due 2023 and $1.7 billion aggregate principal amount of 6.375% Senior Notes due 2025. |
▪ | On October 6, 2014, T-Mobile used approximately $1.0 billion of the proceeds from the debt issuance to redeem its outstanding 7.875% Senior Notes due 2018. |
18
▪ | T-Mobile expects to use the balance of the offering proceeds for general corporate purposes, which may include capital investments and the acquisition of spectrum. |
UPCOMING EVENTS (All dates and attendance tentative)
▪ | Wells Fargo Technology, Media and Telecom Conference, November 12-13, 2014, New York, NY |
▪ | UBS 42nd Annual Global Media and Communications Conference, December 8-10, 2014, New York, NY |
▪ | CITI 25th Annual Global Internet, Media and Telecom Conference, January 5-7, 2015, Las Vegas, NV |
▪ | T-Mobile US, Inc. Q4 2014 Earnings Report, February 19, 2015 |
CONTACT INFORMATION
Press: Investor Relations:
Media Relations Nils Paellmann, nils.paellmann@t-mobile.com
T-Mobile US, Inc. Ben Barrett, ben.barrett@t-mobile.com
Chezzarae Hart, chezzarae.hart@t-mobile.com
877-281-TMUS or 212-358-3210
mediarelations@t-mobile.com investor.relations@t-mobile.com
http://newsroom.t-mobile.com http://investor.t-mobile.com
T-Mobile US, Inc.
Condensed Consolidated Balance Sheets
(Unaudited)
(in millions, except share and per share amounts) | September 30, 2014 | December 31, 2013 | |||||
Assets | |||||||
Current assets | |||||||
Cash and cash equivalents | $ | 5,787 | $ | 5,891 | |||
Accounts receivable, net of deferred interest and allowances of $465 and $381 | 4,433 | 3,619 | |||||
Accounts receivable from affiliates | 82 | 41 | |||||
Inventory | 674 | 586 | |||||
Current portion of deferred tax assets, net | 950 | 839 | |||||
Other current assets | 1,369 | 1,252 | |||||
Total current assets | 13,295 | 12,228 | |||||
Property and equipment, net of accumulated depreciation of $21,410 and $19,649 | 15,798 | 15,349 | |||||
Goodwill | 1,683 | 1,683 | |||||
Spectrum licenses | 21,689 | 18,122 | |||||
Other intangible assets, net of accumulated amortization of $726 and $476 | 956 | 1,204 | |||||
Other assets | 1,694 | 1,367 | |||||
Total assets | $ | 55,115 | $ | 49,953 | |||
Liabilities and Stockholders' Equity | |||||||
Current liabilities | |||||||
Accounts payable and accrued liabilities | $ | 6,057 | $ | 4,567 | |||
Current payables to affiliates | 315 | 199 | |||||
Short-term debt | 1,168 | 244 | |||||
Deferred revenue | 452 | 445 | |||||
Other current liabilities | 613 | 353 | |||||
Total current liabilities | 8,605 | 5,808 | |||||
Long-term debt to affiliates | 5,600 | 5,600 | |||||
Long-term debt | 16,284 | 14,345 | |||||
Long-term financial obligation | 2,510 | 2,496 | |||||
Deferred tax liabilities | 4,744 | 4,645 | |||||
Deferred rents | 2,289 | 2,113 | |||||
Other long-term liabilities | 558 | 701 | |||||
Total long-term liabilities | 31,985 | 29,900 | |||||
Commitments and contingencies | |||||||
Stockholders' equity | |||||||
Preferred stock, par value $0.00001 per share, 100,000,000 shares authorized; no shares issued and outstanding | — | — | |||||
Common stock, par value $0.00001 per share, 1,000,000,000 shares authorized; 808,680,349 and 803,262,309 shares issued, 807,297,844 and 801,879,804 shares outstanding | — | — | |||||
Additional paid-in capital | 37,466 | 37,330 | |||||
Treasury stock, at cost, 1,382,505 and 1,382,505 shares issued | — | — | |||||
Accumulated other comprehensive income | 1 | 3 | |||||
Accumulated deficit | (22,942 | ) | (23,088 | ) | |||
Total stockholders' equity | 14,525 | 14,245 | |||||
Total liabilities and stockholders' equity | $ | 55,115 | $ | 49,953 | |||
T-Mobile US, Inc.
Condensed Consolidated Statements of Comprehensive Income (Loss)
(Unaudited)
Three Months Ended | Nine Months Ended September 30, | ||||||||||||||||||
(in millions, except shares and per share amounts) | September 30, 2014 | June 30, 2014 | September 30, 2013 | 2014 | 2013 | ||||||||||||||
Revenues | |||||||||||||||||||
Branded postpaid revenues | $ | 3,670 | $ | 3,511 | $ | 3,302 | $ | 10,628 | $ | 9,849 | |||||||||
Branded prepaid revenues | 1,790 | 1,736 | 1,594 | 5,174 | 3,339 | ||||||||||||||
Total branded revenues | 5,460 | 5,247 | 4,896 | 15,802 | 13,188 | ||||||||||||||
Wholesale revenues | 171 | 172 | 157 | 517 | 449 | ||||||||||||||
Roaming and other service revenues | 53 | 65 | 85 | 186 | 262 | ||||||||||||||
Total service revenues | 5,684 | 5,484 | 5,138 | 16,505 | 13,899 | ||||||||||||||
Equipment sales | 1,561 | 1,600 | 1,467 | 4,609 | 3,452 | ||||||||||||||
Other revenues | 105 | 101 | 83 | 296 | 242 | ||||||||||||||
Total revenues | 7,350 | 7,185 | 6,688 | 21,410 | 17,593 | ||||||||||||||
Operating expenses | |||||||||||||||||||
Cost of services, exclusive of depreciation and amortization shown separately below | 1,488 | 1,453 | 1,444 | 4,405 | 3,880 | ||||||||||||||
Cost of equipment sales | 2,308 | 2,215 | 2,015 | 6,809 | 4,837 | ||||||||||||||
Selling, general and administrative | 2,283 | 2,151 | 1,933 | 6,530 | 5,286 | ||||||||||||||
Depreciation and amortization | 1,138 | 1,129 | 987 | 3,322 | 2,630 | ||||||||||||||
Cost of MetroPCS business combination | 97 | 22 | 12 | 131 | 51 | ||||||||||||||
Gains on disposal of spectrum licenses | (13 | ) | (747 | ) | — | (770 | ) | — | |||||||||||
Other, net | — | — | — | — | 52 | ||||||||||||||
Total operating expenses | 7,301 | 6,223 | 6,391 | 20,427 | 16,736 | ||||||||||||||
Operating income | 49 | 962 | 297 | 983 | 857 | ||||||||||||||
Other income (expense) | |||||||||||||||||||
Interest expense to affiliates | (83 | ) | (85 | ) | (183 | ) | (186 | ) | (586 | ) | |||||||||
Interest expense | (260 | ) | (271 | ) | (151 | ) | (807 | ) | (311 | ) | |||||||||
Interest income | 97 | 83 | 50 | 255 | 125 | ||||||||||||||
Other income (expense), net | (14 | ) | (12 | ) | (7 | ) | (32 | ) | 105 | ||||||||||
Total other expense, net | (260 | ) | (285 | ) | (291 | ) | (770 | ) | (667 | ) | |||||||||
Income (loss) before income taxes | (211 | ) | 677 | 6 | 213 | 190 | |||||||||||||
Income tax expense (benefit) | (117 | ) | 286 | 42 | 67 | 135 | |||||||||||||
Net income (loss) | $ | (94 | ) | $ | 391 | $ | (36 | ) | $ | 146 | $ | 55 | |||||||
Other comprehensive income (loss), net of tax | |||||||||||||||||||
Net gain on cross currency interest rate swaps, net of tax effect of $0, $0, $0, $0, and $13 | — | — | — | — | 23 | ||||||||||||||
Net loss on foreign currency translation, net of tax effect of $0, $0, $0, $0, and ($37) | — | — | — | — | (62 | ) | |||||||||||||
Unrealized gain (loss) on available-for-sale securities, net of tax effect of $0, $0, $0, ($1), and $0 | 1 | — | — | (2 | ) | — | |||||||||||||
Other comprehensive income (loss), net of tax | 1 | — | — | (2 | ) | (39 | ) | ||||||||||||
Total comprehensive income (loss) | $ | (93 | ) | $ | 391 | $ | (36 | ) | $ | 144 | $ | 16 | |||||||
Earnings (loss) per share | |||||||||||||||||||
Basic | $ | (0.12 | ) | $ | 0.49 | $ | (0.05 | ) | $ | 0.18 | $ | 0.09 | |||||||
Diluted | (0.12 | ) | 0.48 | (0.05 | ) | 0.18 | 0.09 | ||||||||||||
Weighted average shares outstanding | |||||||||||||||||||
Basic | 807,221,761 | 803,923,913 | 726,877,458 | 804,572,685 | 642,957,645 | ||||||||||||||
Diluted | 807,221,761 | 813,556,137 | 726,877,458 | 813,507,827 | 645,520,524 | ||||||||||||||
21
T-Mobile US, Inc.
Condensed Consolidated Statements of Cash Flows
(Unaudited)
Three Months Ended | Nine Months Ended September 30, | ||||||||||||||||||
(in millions) | September 30, 2014 | June 30, 2014 | September 30, 2013 | 2014 | 2013 | ||||||||||||||
Operating activities | |||||||||||||||||||
Net cash provided by operating activities | $ | 1,062 | $ | 970 | $ | 826 | $ | 2,791 | $ | 2,541 | |||||||||
Investing activities | |||||||||||||||||||
Purchases of property and equipment | (1,131 | ) | (940 | ) | (1,017 | ) | (3,018 | ) | (3,143 | ) | |||||||||
Purchases of spectrum licenses and other intangible assets | (23 | ) | (2,367 | ) | (1 | ) | (2,390 | ) | (52 | ) | |||||||||
Short term affiliate loan receivable, net | — | — | — | — | 300 | ||||||||||||||
Cash and cash equivalents acquired in MetroPCS business combination | — | — | — | — | 2,144 | ||||||||||||||
Change in restricted cash equivalents | — | — | (100 | ) | — | (100 | ) | ||||||||||||
Investments in unconsolidated affiliates, net | (10 | ) | (9 | ) | (22 | ) | (30 | ) | (22 | ) | |||||||||
Other, net | (1 | ) | 6 | 10 | (2 | ) | 5 | ||||||||||||
Net cash used in investing activities | (1,165 | ) | (3,310 | ) | (1,130 | ) | (5,440 | ) | (868 | ) | |||||||||
Financing activities | |||||||||||||||||||
Proceeds from issuance of long-term debt | 2,993 | — | 498 | 2,993 | 498 | ||||||||||||||
Proceeds from issuance of short-term debt for purchases of inventory | 100 | — | — | 100 | — | ||||||||||||||
Repayments of short-term debt for purchases of inventory, property and equipment | (283 | ) | (5 | ) | (194 | ) | (514 | ) | (194 | ) | |||||||||
Repayments related to a variable interest entity | — | — | (40 | ) | — | (80 | ) | ||||||||||||
Distribution to affiliate | — | — | — | — | (41 | ) | |||||||||||||
Proceeds from exercise of stock options | 2 | 9 | 44 | 25 | 116 | ||||||||||||||
Taxes paid related to net share settlement of stock awards | — | (72 | ) | — | (72 | ) | — | ||||||||||||
Excess tax benefit from stock-based compensation | 1 | 33 | 1 | 34 | 4 | ||||||||||||||
Other, net | (3 | ) | (16 | ) | (2 | ) | (21 | ) | (5 | ) | |||||||||
Net cash provided by (used in) financing activities | 2,810 | (51 | ) | 307 | 2,545 | 298 | |||||||||||||
Change in cash and cash equivalents | 2,707 | (2,391 | ) | 3 | (104 | ) | 1,971 | ||||||||||||
Cash and cash equivalents | |||||||||||||||||||
Beginning of period | 3,080 | 5,471 | 2,362 | 5,891 | 394 | ||||||||||||||
End of period | $ | 5,787 | $ | 3,080 | $ | 2,365 | $ | 5,787 | $ | 2,365 | |||||||||
22
T-Mobile US, Inc. Supplementary Operating and Financial Data
Quarter | Nine Months Ended September 30, | ||||||||||||||||||||||||||
(in thousands) | Q1 2013 | Q2 2013 | Q3 2013 | Q4 2013 | Q1 2014 | Q2 2014 | Q3 2014 | 2013 | 2014 | ||||||||||||||||||
Customers, end of period | |||||||||||||||||||||||||||
Branded postpaid phone customers | 19,668 | 20,355 | 20,997 | 21,797 | 23,054 | 23,633 | 24,807 | 20,997 | 24,807 | ||||||||||||||||||
Branded postpaid mobile broadband customers | 426 | 428 | 433 | 502 | 568 | 897 | 1,102 | 433 | 1,102 | ||||||||||||||||||
Total branded postpaid customers | 20,094 | 20,783 | 21,430 | 22,299 | 23,622 | 24,530 | 25,909 | 21,430 | 25,909 | ||||||||||||||||||
Branded prepaid customers | 6,028 | 14,935 | 14,960 | 15,072 | 15,537 | 15,639 | 16,050 | 14,960 | 16,050 | ||||||||||||||||||
Total branded customers | 26,122 | 35,718 | 36,390 | 37,371 | 39,159 | 40,169 | 41,959 | 36,390 | 41,959 | ||||||||||||||||||
M2M customers | 3,290 | 3,423 | 3,430 | 3,602 | 3,822 | 4,047 | 4,269 | 3,430 | 4,269 | ||||||||||||||||||
MVNO customers | 4,556 | 4,875 | 5,219 | 5,711 | 6,094 | 6,329 | 6,662 | 5,219 | 6,662 | ||||||||||||||||||
Total wholesale customers | 7,846 | 8,298 | 8,649 | 9,313 | 9,916 | 10,376 | 10,931 | 8,649 | 10,931 | ||||||||||||||||||
Total customers, end of period | 33,968 | 44,016 | 45,039 | 46,684 | 49,075 | 50,545 | 52,890 | 45,039 | 52,890 | ||||||||||||||||||
Quarter | Nine Months Ended September 30, | ||||||||||||||||||||||||||
(in thousands) | Q1 2013 | Q2 2013 | Q3 2013 | Q4 2013 | Q1 2014 | Q2 2014 | Q3 2014 | 2013 | 2014 | ||||||||||||||||||
Net customer additions (losses) | |||||||||||||||||||||||||||
Branded postpaid phone customers | (190 | ) | 685 | 643 | 800 | 1,256 | 579 | 1,175 | 1,138 | 3,010 | |||||||||||||||||
Branded postpaid mobile broadband customers | (9 | ) | 3 | 5 | 69 | 67 | 329 | 204 | (1 | ) | 600 | ||||||||||||||||
Total branded postpaid customers | (199 | ) | 688 | 648 | 869 | 1,323 | 908 | 1,379 | 1,137 | 3,610 | |||||||||||||||||
Branded prepaid customers | 202 | (10 | ) | 24 | 112 | 465 | 102 | 411 | 216 | 978 | |||||||||||||||||
Total branded customers | 3 | 678 | 672 | 981 | 1,788 | 1,010 | 1,790 | 1,353 | 4,588 | ||||||||||||||||||
M2M customers | 200 | 133 | 7 | 172 | 220 | 225 | 222 | 340 | 667 | ||||||||||||||||||
MVNO customers | 376 | 319 | 344 | 492 | 383 | 235 | 333 | 1,039 | 951 | ||||||||||||||||||
Total wholesale customers | 576 | 452 | 351 | 664 | 603 | 460 | 555 | 1,379 | 1,618 | ||||||||||||||||||
Total net customer additions | 579 | 1,130 | 1,023 | 1,645 | 2,391 | 1,470 | 2,345 | 2,732 | 6,206 | ||||||||||||||||||
Acquired customers | — | 8,918 | — | — | — | — | — | 8,918 | — | ||||||||||||||||||
Note: Certain customer numbers may not add due to rounding
Quarter | Nine Months Ended September 30, | ||||||||||||||||||||||||||
Q1 2013 | Q2 2013 | Q3 2013 | Q4 2013 | Q1 2014 | Q2 2014 | Q3 2014 | 2013 | 2014 | |||||||||||||||||||
Branded postpaid phone churn | 1.9 | % | 1.5 | % | 1.7 | % | 1.6 | % | 1.5 | % | 1.5 | % | 1.6 | % | 1.7 | % | 1.5 | % | |||||||||
Branded prepaid churn | 7.0 | % | 5.4 | % | 5.0 | % | 5.1 | % | 4.3 | % | 4.5 | % | 4.8 | % | 5.5 | % | 4.5 | % | |||||||||
23
T-Mobile US, Inc. Supplementary Operating and Financial Data (continued)
Quarter | Nine Months Ended September 30, | |||||||||||||||||
Q1 2013 | Q2 2013 | Q3 2013 | Q4 2013 | Q1 2014 | Q2 2014 | Q3 2014 | 2013 | 2014 | ||||||||||
Service revenues (in millions) | $4,005 | $4,756 | $5,138 | $5,169 | $5,337 | $5,484 | $5,684 | $13,899 | $16,505 | |||||||||
Total revenues (in millions) | $4,677 | $6,228 | $6,688 | $6,827 | $6,875 | $7,185 | $7,350 | $17,593 | $21,410 | |||||||||
Adjusted EBITDA (in millions) | $1,178 | $1,124 | $1,344 | $1,239 | $1,088 | $1,451 | $1,346 | $3,646 | $3,885 | |||||||||
Adjusted EBITDA margin | 29% | 24% | 26% | 24% | 20% | 26% | 24% | 26% | 24% | |||||||||
Net Income (loss) (in millions) | $107 | $(16) | $(36) | $(20) | $(151) | $391 | $(94) | $55 | $146 | |||||||||
Cash Capex - Property & Equipment (in millions) | $1,076 | $1,050 | $1,017 | $882 | $947 | $940 | $1,131 | $3,143 | $3,018 | |||||||||
Branded postpaid phone ARPU | $54.50 | $54.04 | $52.62 | $51.13 | $50.48 | $49.32 | $49.84 | $53.70 | $49.87 | |||||||||
Branded postpaid ABPU | $57.28 | $58.72 | $59.08 | $58.78 | $59.54 | $59.79 | $61.59 | $58.38 | $60.34 | |||||||||
Branded prepaid ARPU | $28.25 | $34.78 | $35.71 | $35.84 | $36.09 | $37.16 | $37.59 | $34.02 | $36.96 | |||||||||
Smartphone sales volume (in millions) | 2.2 | 4.3 | 5.6 | 6.2 | 6.9 | 6.2 | 6.9 | 12.1 | 20.0 | |||||||||
Smartphone sales / phone sales | 75% | 86% | 88% | 91% | 92% | 93% | 93% | 85% | 92% | |||||||||
Branded postpaid handset upgrade rate | 5% | 10% | 9% | 9% | 7% | 8% | 9% | 24% | 24% | |||||||||
EIP financed (in millions) | $298 | $811 | $1,011 | $1,207 | $1,249 | $1,342 | $1,317 | $2,120 | $3,908 | |||||||||
EIP billings (in millions) | $194 | $314 | $435 | $528 | $657 | $810 | $967 | $943 | $2,434 | |||||||||
EIP receivables (net) (in millions) | $774 | $1,292 | $1,867 | $2,546 | $3,086 | $3,583 | $3,963 | $1,867 | $3,963 | |||||||||
24
T-Mobile US, Inc.
Reconciliation of Non-GAAP Financial Measures to GAAP Financial Measures
(Unaudited)
This Investor Factbook includes non-GAAP financial measures. The non-GAAP financial measures should be considered in addition to, but not as a substitute for, the information provided in accordance with GAAP. Reconciliations for the non-GAAP financial measures to the most directly comparable GAAP financial measures are provided below.
Adjusted EBITDA is reconciled to net income (loss) as follows:
Quarter | Nine Months Ended September 30, | ||||||||||||||||||||||||||||||||||
(in millions) | Q1 2013 | Q2 2013 | Q3 2013 | Q4 2013 | Q1 2014 | Q2 2014 | Q3 2014 | 2013 | 2014 | ||||||||||||||||||||||||||
Net income (loss) | $ | 107 | $ | (16 | ) | $ | (36 | ) | $ | (20 | ) | $ | (151 | ) | $ | 391 | $ | (94 | ) | $ | 55 | $ | 146 | ||||||||||||
Adjustments: | |||||||||||||||||||||||||||||||||||
Interest expense to affiliates | 178 | 225 | 183 | 92 | 18 | 85 | 83 | 586 | 186 | ||||||||||||||||||||||||||
Interest expense | 51 | 109 | 151 | 234 | 276 | 271 | 260 | 311 | 807 | ||||||||||||||||||||||||||
Interest income | (35 | ) | (40 | ) | (50 | ) | (64 | ) | (75 | ) | (83 | ) | (97 | ) | (125 | ) | (255 | ) | |||||||||||||||||
Other expense (income), net | 6 | (118 | ) | 7 | 16 | 6 | 12 | 14 | (105 | ) | 32 | ||||||||||||||||||||||||
Income tax expense (benefit) | 72 | 21 | 42 | (119 | ) | (102 | ) | 286 | (117 | ) | 135 | 67 | |||||||||||||||||||||||
Operating income (loss) | 379 | 181 | 297 | 139 | (28 | ) | 962 | 49 | 857 | 983 | |||||||||||||||||||||||||
Depreciation and amortization | 755 | 888 | 987 | 997 | 1,055 | 1,129 | 1,138 | 2,630 | 3,322 | ||||||||||||||||||||||||||
Cost of MetroPCS business combination | 13 | 26 | 12 | 57 | 12 | 22 | 97 | 51 | 131 | ||||||||||||||||||||||||||
Stock-based compensation | — | 6 | 48 | 46 | 49 | 63 | 45 | 54 | 157 | ||||||||||||||||||||||||||
Gains on disposal of spectrum licenses (1) | — | — | — | — | — | (731 | ) | 11 | — | (720 | ) | ||||||||||||||||||||||||
Other, net (1) | 31 | 23 | — | — | — | 6 | 6 | 54 | 12 | ||||||||||||||||||||||||||
Adjusted EBITDA | $ | 1,178 | $ | 1,124 | $ | 1,344 | $ | 1,239 | $ | 1,088 | $ | 1,451 | $ | 1,346 | $ | 3,646 | $ | 3,885 | |||||||||||||||||
Adjusted EBITDA of MetroPCS (2) | 291 | 141 | — | — | — | — | — | 432 | — | ||||||||||||||||||||||||||
Pro Forma Combined Adjusted EBITDA | $ | 1,469 | $ | 1,265 | $ | 1,344 | $ | 1,239 | $ | 1,088 | $ | 1,451 | $ | 1,346 | $ | 4,078 | $ | 3,885 | |||||||||||||||||
(1) | Gains on disposal of spectrum licenses and other, net transactions may not agree in total to the gains on disposal of spectrum licenses and other, net in the condensed consolidated statements of comprehensive income (loss) primarily due to certain routine operating activities, such as insignificant routine spectrum license exchanges that would be expected to reoccur, and are therefore included in Adjusted EBITDA. |
(2) | The Adjusted EBITDA of MetroPCS for the second quarter of 2013 reflects the Adjusted EBITDA of MetroPCS for April 2013 and is included for informational purposes to allow for a comparison of T-Mobile’s Adjusted EBITDA for periods following the completion of the business combination of T-Mobile USA and MetroPCS to pro forma combined Adjusted EBITDA for periods prior to the completion of the business combination. For the first quarter of 2013, the Adjusted EBITDA of MetroPCS reflects the amounts previously reported by MetroPCS. |
25
T-Mobile US, Inc.
Reconciliation of Non-GAAP Financial Measures to GAAP Financial Measures (continued)
(Unaudited)
The following schedule reflects the branded postpaid phone ARPU calculation and provides a reconciliation to total branded postpaid service revenues reported in T-Mobile's condensed consolidated statements of comprehensive income.
Quarter | Nine Months Ended September 30, | |||||||||||||||||||||||||||||||||||
(in millions, except average number of branded postpaid phone customers and branded postpaid phone ARPU) | Q1 2013 | Q2 2013 | Q3 2013 | Q4 2013 | Q1 2014 | Q2 2014 | Q3 2014 | 2013 | 2014 | |||||||||||||||||||||||||||
Branded postpaid service revenues | $ | 3,263 | $ | 3,284 | $ | 3,302 | $ | 3,317 | $ | 3,447 | $ | 3,511 | $ | 3,670 | $ | 9,849 | $ | 10,628 | ||||||||||||||||||
Less: Branded postpaid mobile broadband revenues | (44 | ) | (42 | ) | (41 | ) | (42 | ) | (47 | ) | (54 | ) | (68 | ) | (127 | ) | (169 | ) | ||||||||||||||||||
Branded postpaid phone service revenues | $ | 3,219 | $ | 3,242 | $ | 3,261 | $ | 3,275 | $ | 3,400 | $ | 3,457 | $ | 3,602 | $ | 9,722 | $ | 10,459 | ||||||||||||||||||
Divided by: Average number of branded postpaid phone customers (in thousands) and number of months in period | 19,689 | 19,999 | 20,657 | 21,352 | 22,447 | 23,368 | 24,091 | 20,115 | 23,302 | |||||||||||||||||||||||||||
Branded postpaid phone ARPU | $ | 54.50 | $ | 54.04 | $ | 52.62 | $ | 51.13 | $ | 50.48 | $ | 49.32 | $ | 49.84 | $ | 53.70 | $ | 49.87 | ||||||||||||||||||
The following schedule reflects the branded postpaid ABPU calculation and provides a reconciliation of the billings for branded postpaid customers used for the branded postpaid ABPU calculation to total branded postpaid service revenues reported in T-Mobile's condensed consolidated statements of comprehensive income.
Quarter | Nine Months Ended September 30, | |||||||||||||||||||||||||||||||||||
(in millions, except average number of branded postpaid customers and branded postpaid ABPU) | Q1 2013 | Q2 2013 | Q3 2013 | Q4 2013 | Q1 2014 | Q2 2014 | Q3 2014 | 2013 | 2014 | |||||||||||||||||||||||||||
Branded postpaid service revenues | $ | 3,263 | $ | 3,284 | $ | 3,302 | $ | 3,317 | $ | 3,447 | $ | 3,511 | $ | 3,670 | $ | 9,849 | $ | 10,628 | ||||||||||||||||||
Add: EIP billings | 194 | 314 | 435 | 528 | 657 | 810 | 967 | 943 | 2,434 | |||||||||||||||||||||||||||
Total billings for branded postpaid customers | $ | 3,457 | $ | 3,598 | $ | 3,737 | $ | 3,845 | $ | 4,104 | $ | 4,321 | $ | 4,637 | $ | 10,792 | $ | 13,062 | ||||||||||||||||||
Divided by: Average number of branded postpaid customers (in thousands) and number of months in period | 20,117 | 20,425 | 21,084 | 21,805 | 22,975 | 24,092 | 25,095 | 20,542 | 24,054 | |||||||||||||||||||||||||||
Branded postpaid ABPU | $ | 57.28 | $ | 58.72 | $ | 59.08 | $ | 58.78 | $ | 59.54 | $ | 59.79 | $ | 61.59 | $ | 58.38 | $ | 60.34 | ||||||||||||||||||
26
Pro Forma Combined Results
The following pages contain certain pro forma combined financial and other operating data for periods through the second quarter of 2013 that are presented solely for informational purposes to provide comparative customer and financial trends since the business combination of T-Mobile USA and MetroPCS was completed for the combined company. The pro forma combined amounts for periods through and including the second quarter of 2013 were created by combining certain financial results and other operating data of the individual entities for the relevant periods. The pro forma combined financial data have not been determined in accordance with the requirements of Article 11 of Regulation S-X. The following pages also include reconciliations for certain additional non-GAAP financial measures to the most directly comparable GAAP financial measures.
27
T-Mobile US, Inc. Supplementary Pro Forma Combined Operating and Financial Data
Quarter | Nine Months Ended September 30, | ||||||||||||||||||||||||||
(in thousands) | Q1 2013 | Q2 2013 | Q3 2013 | Q4 2013 | Q1 2014 | Q2 2014 | Q3 2014 | 2013 | 2014 | ||||||||||||||||||
Customers, end of period | |||||||||||||||||||||||||||
Branded postpaid phone customers | 19,668 | 20,355 | 20,997 | 21,797 | 23,054 | 23,633 | 24,807 | 20,997 | 24,807 | ||||||||||||||||||
Branded postpaid mobile broadband customers | 426 | 428 | 433 | 502 | 568 | 897 | 1,102 | 433 | 1,102 | ||||||||||||||||||
Total branded postpaid customers | 20,094 | 20,783 | 21,430 | 22,299 | 23,622 | 24,530 | 25,909 | 21,430 | 25,909 | ||||||||||||||||||
Branded prepaid customers | 15,023 | 14,935 | 14,960 | 15,072 | 15,537 | 15,639 | 16,050 | 14,960 | 16,050 | ||||||||||||||||||
Total branded customers | 35,117 | 35,718 | 36,390 | 37,371 | 39,159 | 40,169 | 41,959 | 36,390 | 41,959 | ||||||||||||||||||
M2M customers | 3,290 | 3,423 | 3,430 | 3,602 | 3,822 | 4,047 | 4,269 | 3,430 | 4,269 | ||||||||||||||||||
MVNO customers | 4,556 | 4,875 | 5,219 | 5,711 | 6,094 | 6,329 | 6,662 | 5,219 | 6,662 | ||||||||||||||||||
Total wholesale customers | 7,846 | 8,298 | 8,649 | 9,313 | 9,916 | 10,376 | 10,931 | 8,649 | 10,931 | ||||||||||||||||||
Total customers, end of period | 42,963 | 44,016 | 45,039 | 46,684 | 49,075 | 50,545 | 52,890 | 45,039 | 52,890 | ||||||||||||||||||
Quarter | Nine Months Ended September 30, | ||||||||||||||||||||||||||
(in thousands) | Q1 2013 | Q2 2013 | Q3 2013 | Q4 2013 | Q1 2014 | Q2 2014 | Q3 2014 | 2013 | 2014 | ||||||||||||||||||
Net customer additions (losses) | |||||||||||||||||||||||||||
Branded postpaid phone customers | (190 | ) | 685 | 643 | 800 | 1,256 | 579 | 1,175 | 1,138 | 3,010 | |||||||||||||||||
Branded postpaid mobile broadband customers | (9 | ) | 3 | 5 | 69 | 67 | 329 | 204 | (1 | ) | 600 | ||||||||||||||||
Total branded postpaid customers | (199 | ) | 688 | 648 | 869 | 1,323 | 908 | 1,379 | 1,137 | 3,610 | |||||||||||||||||
Branded prepaid customers | 310 | (87 | ) | 24 | 112 | 465 | 102 | 411 | 247 | 978 | |||||||||||||||||
Total branded customers | 111 | 601 | 672 | 981 | 1,788 | 1,010 | 1,790 | 1,384 | 4,588 | ||||||||||||||||||
M2M customers | 200 | 133 | 7 | 172 | 220 | 225 | 222 | 340 | 667 | ||||||||||||||||||
MVNO customers | 376 | 319 | 344 | 492 | 383 | 235 | 333 | 1,039 | 951 | ||||||||||||||||||
Total wholesale customers | 576 | 452 | 351 | 664 | 603 | 460 | 555 | 1,379 | 1,618 | ||||||||||||||||||
Total net customer additions | 687 | 1,053 | 1,023 | 1,645 | 2,391 | 1,470 | 2,345 | 2,763 | 6,206 | ||||||||||||||||||
Note: Certain customer numbers may not add due to rounding
Quarter | Nine Months Ended September 30, | ||||||||||||||||||||||||||
Q1 2013 | Q2 2013 | Q3 2013 | Q4 2013 | Q1 2014 | Q2 2014 | Q3 2014 | 2013 | 2014 | |||||||||||||||||||
Branded postpaid phone churn | 1.9 | % | 1.5 | % | 1.7 | % | 1.6 | % | 1.5 | % | 1.5 | % | 1.6 | % | 1.7 | % | 1.5 | % | |||||||||
Branded prepaid churn | 4.4 | % | 4.9 | % | 5.0 | % | 5.1 | % | 4.3 | % | 4.5 | % | 4.8 | % | 4.8 | % | 4.5 | % | |||||||||
All historical and current porting activity between the T-Mobile and MetroPCS brands has been removed from deactivations and treated as migration activity between brands/products, consistent with the treatment of the combined business. The effect of this treatment lowers the churn rates for both branded postpaid and branded prepaid customer bases.
28
T-Mobile US, Inc. Supplementary Pro Forma Combined Operating and Financial Data (continued)
Quarter | Nine Months Ended September 30, | |||||||||||||||||
Q1 2013 | Q2 2013 | Q3 2013 | Q4 2013 | Q1 2014 | Q2 2014 | Q3 2014 | 2013 | 2014 | ||||||||||
Service revenues (in millions) | $5,106 | $5,122 | $5,138 | $5,169 | $5,337 | $5,484 | $5,684 | $15,366 | $16,505 | |||||||||
Thereof, branded postpaid revenues (in millions) | $3,263 | $3,284 | $3,302 | $3,317 | $3,447 | $3,511 | $3,670 | $9,849 | $10,628 | |||||||||
Thereof, branded prepaid revenues (in millions) | $1,604 | $1,608 | $1,594 | $1,606 | $1,648 | $1,736 | $1,790 | $4,806 | $5,174 | |||||||||
Total revenues (in millions) | $5,964 | $6,651 | $6,688 | $6,827 | $6,875 | $7,185 | $7,350 | $19,303 | $21,410 | |||||||||
Adjusted EBITDA (in millions) | $1,469 | $1,265 | $1,344 | $1,239 | $1,088 | $1,451 | $1,346 | $4,078 | $3,885 | |||||||||
Adjusted EBITDA margin | 29% | 25% | 26% | 24% | 20% | 26% | 24% | 27% | 24% | |||||||||
Cash Capex - Property & Equipment (in millions) | $1,230 | $1,111 | $1,017 | $882 | $947 | $940 | $1,131 | $3,358 | $3,018 | |||||||||
Branded postpaid phone ARPU | $54.50 | $54.04 | $52.62 | $51.13 | $50.48 | $49.32 | $49.84 | $53.70 | $49.87 | |||||||||
Branded prepaid ARPU | $35.87 | $35.97 | $35.71 | $35.84 | $36.09 | $37.16 | $37.59 | $35.85 | $36.96 | |||||||||
Three Months Ended | ||||||||||||||||||||||||
(in millions, except net debt ratio) | Jun 30, 2013 | Sep 30, 2013 | Dec 31, 2013 | Mar 31, 2014 | Jun 30, 2014 | Sep 30, 2014 | ||||||||||||||||||
Net Debt (excluding Tower Obligations) to Last Twelve Months Adjusted EBITDA Ratio | ||||||||||||||||||||||||
Short-term debt | $ | 210 | $ | 195 | $ | 244 | $ | 151 | $ | 272 | $ | 1,168 | ||||||||||||
Long-term debt to affiliates | 11,200 | 11,200 | 5,600 | 5,600 | 5,600 | 5,600 | ||||||||||||||||||
Long-term debt | 6,276 | 6,761 | 14,345 | 14,331 | 14,369 | 16,284 | ||||||||||||||||||
Less: Cash and cash equivalents | (2,362 | ) | (2,365 | ) | (5,891 | ) | (5,471 | ) | (3,080 | ) | (5,787 | ) | ||||||||||||
Net Debt (excluding Tower Obligations) | $ | 15,324 | $ | 15,791 | $ | 14,298 | $ | 14,611 | $ | 17,161 | $ | 17,265 | ||||||||||||
Last twelve months Adjusted EBITDA * | 5,781 | 5,433 | 5,317 | 4,936 | 5,122 | 5,124 | ||||||||||||||||||
Net Debt (excluding Tower Obligations) to Last Twelve Months Adjusted EBITDA Ratio | 2.7 | 2.9 | 2.7 | 3.0 | 3.4 | 3.4 | ||||||||||||||||||
* Pro Forma Combined EBITDA | ||||||||||||||||||||||||
29
Pro Forma Combined Reconciliations
Quarter | Nine Months Ended September 30, | |||||||||||||||||||||||||||||||||||
(in millions) | Q1 2013 | Q2 2013 | Q3 2013 | Q4 2013 | Q1 2014 | Q2 2014 | Q3 2014 | 2013 | 2014 | |||||||||||||||||||||||||||
Service Revenues | ||||||||||||||||||||||||||||||||||||
T-Mobile (1) | $ | 4,005 | $ | 4,756 | $ | 5,138 | $ | 5,169 | $ | 5,337 | $ | 5,484 | $ | 5,684 | $ | 13,899 | $ | 16,505 | ||||||||||||||||||
MetroPCS | 1,101 | 366 | — | — | — | — | — | 1,467 | — | |||||||||||||||||||||||||||
Total service revenues | $ | 5,106 | $ | 5,122 | $ | 5,138 | $ | 5,169 | $ | 5,337 | $ | 5,484 | $ | 5,684 | $ | 15,366 | $ | 16,505 | ||||||||||||||||||
Branded Revenues | ||||||||||||||||||||||||||||||||||||
T-Mobile (1) | $ | 3,766 | $ | 4,526 | $ | 4,896 | $ | 4,923 | $ | 5,095 | $ | 5,247 | $ | 5,460 | $ | 13,188 | $ | 15,802 | ||||||||||||||||||
MetroPCS | 1,101 | 366 | — | — | — | — | — | 1,467 | — | |||||||||||||||||||||||||||
Total branded revenues | $ | 4,867 | $ | 4,892 | $ | 4,896 | $ | 4,923 | $ | 5,095 | $ | 5,247 | $ | 5,460 | $ | 14,655 | $ | 15,802 | ||||||||||||||||||
Branded Prepaid Revenues | ||||||||||||||||||||||||||||||||||||
T-Mobile (1) | $ | 503 | $ | 1,242 | $ | 1,594 | $ | 1,606 | $ | 1,648 | $ | 1,736 | $ | 1,790 | $ | 3,339 | $ | 5,174 | ||||||||||||||||||
MetroPCS | 1,101 | 366 | — | — | — | — | — | 1,467 | — | |||||||||||||||||||||||||||
Total branded prepaid revenues | $ | 1,604 | $ | 1,608 | $ | 1,594 | $ | 1,606 | $ | 1,648 | $ | 1,736 | $ | 1,790 | $ | 4,806 | $ | 5,174 | ||||||||||||||||||
Total Revenues | ||||||||||||||||||||||||||||||||||||
T-Mobile (1) | $ | 4,677 | $ | 6,228 | $ | 6,688 | $ | 6,827 | $ | 6,875 | $ | 7,185 | $ | 7,350 | $ | 17,593 | $ | 21,410 | ||||||||||||||||||
MetroPCS | 1,287 | 423 | — | — | — | — | — | 1,710 | — | |||||||||||||||||||||||||||
Total revenues | $ | 5,964 | $ | 6,651 | $ | 6,688 | $ | 6,827 | $ | 6,875 | $ | 7,185 | $ | 7,350 | $ | 19,303 | $ | 21,410 | ||||||||||||||||||
Quarter | Nine Months Ended September 30, | |||||||||||||||||||||||||||||||||||
(in millions) | Q1 2013 | Q2 2013 | Q3 2013 | Q4 2013 | Q1 2014 | Q2 2014 | Q3 2014 | 2013 | 2014 | |||||||||||||||||||||||||||
Cash Capex - Property & Equipment | ||||||||||||||||||||||||||||||||||||
T-Mobile (1) | $ | 1,076 | $ | 1,050 | $ | 1,017 | $ | 882 | $ | 947 | $ | 940 | $ | 1,131 | $ | 3,143 | $ | 3,018 | ||||||||||||||||||
MetroPCS | 154 | 61 | — | — | — | — | — | 215 | — | |||||||||||||||||||||||||||
Total Cash Capex - Property & Equipment | $ | 1,230 | $ | 1,111 | $ | 1,017 | $ | 882 | $ | 947 | $ | 940 | $ | 1,131 | $ | 3,358 | $ | 3,018 | ||||||||||||||||||
(1) The second quarter of 2013 represents the results for T-Mobile USA for April, 2013 and the results for T-Mobile USA and MetroPCS on a combined basis for May and June 2013, as the business combination was completed on April 30, 2013. | ||||||||||||||||||||||||||||||||||||
Quarter | Nine Months Ended September 30, | |||||||||||||||||||||||||||||||||||
(in millions) | Q1 2013 | Q2 2013 | Q3 2013 | Q4 2013 | Q1 2014 | Q2 2014 | Q3 2014 | 2013 | 2014 | |||||||||||||||||||||||||||
Simple Free Cash Flow | ||||||||||||||||||||||||||||||||||||
Pro Forma Combined Adjusted EBITDA | $ | 1,469 | $ | 1,265 | $ | 1,344 | $ | 1,239 | $ | 1,088 | $ | 1,451 | $ | 1,346 | $ | 4,078 | $ | 3,885 | ||||||||||||||||||
Pro Forma Combined Total Cash Capex - Property & Equipment | 1,230 | 1,111 | 1,017 | 882 | 947 | 940 | 1,131 | 3,358 | 3,018 | |||||||||||||||||||||||||||
Simple Free Cash Flow | $ | 239 | $ | 154 | $ | 327 | $ | 357 | $ | 141 | $ | 511 | $ | 215 | $ | 720 | $ | 867 | ||||||||||||||||||
Forward-Looking Statements
This Investor Factbook includes "forward-looking statements" within the meaning of the U.S. federal securities laws. Any statements made herein that are not statements of historical fact, including statements about T-Mobile US, Inc.'s plans, outlook, beliefs, opinion, projections, guidance, strategy, integration of MetroPCS, expected network modernization and other advancements, are forward-looking statements. Generally, forward-looking statements may be identified by words such as "anticipate," "expect," "suggests," "plan," "project," "believe," "intend," "estimates," "targets," "views," "may," "will," "forecast," and other similar expressions. The forward-looking statements speak only as of the date made, are based on current assumptions and expectations, and involve a number of risks and uncertainties. Important factors that could affect future results and cause those results to differ materially from those expressed in the forward-looking statements include, among others, the following: T-Mobile's ability to compete in the highly competitive U.S. wireless telecommunications industry; adverse conditions in the U.S. and international economies and markets; significant capital commitments and the capital expenditures required to effect T-Mobile's business plan; T-Mobile's ability to adapt to future changes in technology, enhance existing offerings, and introduce new offerings to address customers' changing demands; changes in legal and regulatory requirements, including any change or increase in restrictions on T-Mobile's ability to operate its network; T-Mobile's ability to successfully maintain and improve its network, and the possibility of incurring additional costs in doing so; major equipment failures; severe weather conditions or other force majeure events; and other risks described in T-Mobile's filings with the Securities and Exchange Commission, including those described in T-Mobile's Annual Report on Form 10-K filed with the Securities and Exchange Commission on February 25, 2014. You should not place undue reliance on these forward-looking statements. T-Mobile does not undertake to update forward-looking statements, whether as a result of new information, future events or otherwise, except as required by law.
About T-Mobile US, Inc.
As America's Un-carrier, T-Mobile US, Inc. (NYSE: TMUS) is redefining the way consumers and businesses buy wireless services through leading product and service innovation. The Company's advanced nationwide 4G LTE network delivers outstanding wireless experiences to approximately 53 million customers who are unwilling to compromise on quality and value. Based in Bellevue, Washington, T-Mobile US, Inc. provides services through its subsidiaries and operates its flagship brands, T-Mobile and MetroPCS. For more information, please visit: http://www.T-Mobile.com.
30
Definitions of Terms
Operating and financial measures are utilized by T-Mobile's management to evaluate its operating performance and, in certain cases, its ability to meet liquidity requirements. Although companies in the wireless industry may not define measures in precisely the same way, T-Mobile believes the measures facilitate key operating performance comparisons with other companies in the wireless industry.
1. | Customer - SIM card with a unique T-Mobile mobile identity number which generates revenue. Branded customers generally include customers that are qualified either for postpaid service, where they generally pay after incurring service, or prepaid service, where they generally pay in advance. Wholesale customers include Machine-to-Machine (“M2M”) and Mobile Virtual Network Operator (“MVNO”) customers that operate on T-Mobile's network, but are managed by wholesale partners. |
2. | Churn - Number of customers whose service was discontinued as a percentage of the average number of customers during the specified period. T-Mobile believes churn provides management with useful information to evaluate customer retention and loyalty. |
3. | Average Revenue Per User (“ARPU”) - Average monthly service revenue earned from customers. Service revenues for the specified period divided by the average customers during the period, further divided by the number of months in the period. T-Mobile believes ARPU provides management with useful information to assess its per-customer service revenue realization and to assist in forecasting its future service revenues, and evaluate the average monthly service revenues generated from its customer base. |
Branded Postpaid Average Billings per User ("ABPU") - Average monthly branded postpaid service revenue earned from customers plus equipment installment plan ("EIP") billings divided by the average branded postpaid customers during the period, further divided by the number of months in the period. T-Mobile believes ABPU provides management, investors, and analysts with useful information to evaluate average per-branded postpaid customer billings as it approximates the expected cash collections, including equipment installments, from T-Mobile's customers each month.
Service revenues - Branded postpaid, including handset insurance, branded prepaid, wholesale, and roaming and other service revenues.
4. | Cost of services - Costs to operate and maintain T-Mobile's networks, including direct switch and cell site costs, such as rent, fixed line costs, utilities, maintenance, and labor costs associated with network employees; long distance costs; regulatory fees; roaming fees paid to other carriers; fixed and variable costs paid to third parties for the use of proprietary data applications. |
Cost of equipment sales - Costs to sell T-Mobile's equipment, including equipment, accessories, inventory adjustments, shipping, and warranty expenses.
Selling, general and administrative expenses - Salaries and wages and benefits not directly attributable to a service or product; bad debt charges; taxes other than income taxes; advertising and sales commission costs; customer billing; call center and information technology costs; regulatory fees, professional service fees; and rent and utilities for administrative space.
5. | Adjusted EBITDA - Earnings before interest expense (net of interest income), tax, depreciation, amortization, stock-based compensation and expenses not reflective of T-Mobile's ongoing operating performance. Adjusted EBITDA margin is Adjusted EBITDA divided by service revenues. Adjusted EBITDA is a non-GAAP financial measure utilized by T-Mobile's management to monitor the financial performance of its operations. T-Mobile uses Adjusted EBITDA internally as a metric to evaluate and compensate its personnel and management for their performance, and as a benchmark to evaluate T-Mobile's operating performance in comparison to its competitors. Management also uses Adjusted EBITDA to measure its ability to provide cash flows to meet future debt service, capital expenditures and working capital requirements, and to fund future growth. T-Mobile believes analysts and investors use Adjusted EBITDA as a supplemental measure to evaluate overall operating performance and facilitate comparisons with other wireless communications companies. Adjusted EBITDA has limitations as an analytical tool and should not be considered in isolation or as a substitute for income from operations, net income, or any other measure of financial performance reported in accordance with GAAP. The reconciliation of Adjusted EBITDA to net income (loss) is detailed in the Reconciliation of Non-GAAP Financial Measures to GAAP Financial Measures schedule. |
6. | Cash capital expenditures - Amounts paid for construction and the purchase of property and equipment. |
7. | Smartphones - UMTS/HSPA/HSPA+ 21/HSPA+ 42/4G LTE enabled converged devices, which integrate voice and data services. |
8. | Simple Free Cash Flow - Adjusted EBITDA less cash capital expenditures. Simple Free Cash Flow is utilized by management as a measure of liquidity and an indicator of how much cash is generated from the ordinary course of business operations. Simple free cash flow should not be construed as an alternative to cash flows from operating activities as determined in accordance with GAAP. |
9. | Net debt - Short-term debt, long-term debt to affiliates, and long-term debt (excluding tower obligations), less cash and cash equivalents. |
31