Attached files
| file | filename |
|---|---|
| 8-K - FIRST BANCORP. 8-K - FIRST BANCORP /PR/ | a50970732.htm |
| EX-99.1 - EXHIBIT 99.1 - FIRST BANCORP /PR/ | a50970732ex99_1.htm |
Exhibit 99.2
Financial Results Financial Results Third Quarter 2014 Third Quarter 2014
Forward-Looking Statements This presentation contains “forward-looking statements” concerning First BanCorp’s (the “Corporation”) future economic performance. The words or phrases “would be,” “will allow,” “intends to,” “will likely result,” “are expected to,” “expect,” “anticipate,” “look forward,” “should,” “believes” and similar expressions are meant to identify “forward-looking statements” within the meaning of Section 27A of the Private Securities Litigation Reform Act of 1995, and are subject to the safe harbor created by such section. The Corporation wishes to caution readers not to place undue reliance on any such “forward-looking statements,” which speak only as of the date made, and to advise readers that various factors, including, but not limited to, uncertainty about whether the Corporation and FirstBank Puerto Rico (“FirstBank” or “the Bank”) will be able to fully comply with the written agreement dated June 3, 2010 that the Corporation entered into with the Federal Reserve Bank of New York (the “FED”) and the order dated June 2, 2010 (the “Order”)that FirstBank entered into with the FDIC and the Office of the Commissioner of Financial Institutions of Puerto Rico that, among other things, require FirstBank to maintain certain capital levels and reduce its special mention, classified, delinquent and non-performing assets; the risk of being subject to possible additional regulatory actions; uncertainty as to the availability of certain funding sources, such as retail brokered CDs; the Corporation’s reliance on brokered CDs and its ability to obtain, on a periodic basis, approval from the FDIC to issue brokered CDs to fund operations and provide liquidity in accordance with the terms of the Order; the risk of not being able to fulfill the Corporation’s cash obligations or resume paying dividends to the Corporation’s stockholders in the future due to the Corporation’s inability to receive approval from the FED to receive dividends from FirstBank or FirstBank’s failure to generate sufficient cash flow to make a dividend payment to the Corporation; the strength or weakness of the real estate markets and of the consumer and commercial credit sectors and their impact on the credit quality of the Corporation’s loans and other assets, including the Corporation’s construction and commercial real estate loan portfolios, which have contributed and may continue to contribute to, among other things, the high levels of non-performing assets, charge-offs and the provision expense and may subject the Corporation to further risk from loan defaults and foreclosures; adverse changes in general economic conditions in the United States and in Puerto Rico, including the interest rate scenario, market liquidity, housing absorption rates, real estate prices and disruptions in the U.S. capital markets, which may reduce interest margins, impact funding sources and affect demand for all of the Corporation’s products and services and the value of the Corporation’s assets; an adverse change in the Corporation’s ability to attract new clients and retain existing ones; a decrease in demand for the Corporation’s products and services and lower revenues and earnings because of the continued recession in Puerto Rico and the current fiscal problems and budget deficit of the Puerto Rico government; uncertainty about regulatory and legislative changes for financial services companies in Puerto Rico, the United States and the U.S. and British Virgin Islands, which could affect the Corporation’s financial performance and could cause the Corporation’s actual results for future periods to differ materially from prior results and anticipated or projected results; uncertainty about the effectiveness of the various actions undertaken to stimulate the United States economy and stabilize the United States’ financial markets, and the impact such actions may have on the Corporation’s business, financial condition and results of operations; changes in the fiscal and monetary policies and regulations of the federal government, including those determined by the Federal Reserve System, the FDIC, government-sponsored housing agencies and regulators in Puerto Rico and the U.S. and British Virgin Islands; the risk of possible failure or circumvention of controls and procedures and the risk that the Corporation’s risk management policies may not be adequate; the risk that the FDIC may further increase the deposit insurance premium and/or require special assessments to replenish its insurance fund, causing an additional increase in the Corporation’s non-interest expense; risks of not being able to recover the assets pledged to Lehman Brothers Special Financing, Inc.; the impact on the Corporation’s results of operations and financial condition associated with acquisitions and dispositions; a need to recognize additional impairments on financial instruments or goodwill relating to acquisitions; risks that downgrades in the credit ratings of the Corporation’s long-term senior debt will adversely affect the Corporation’s ability to access necessary external funds; the impact of the Dodd-Frank Wall Street Reform and Consumer Protection Act on the Corporation’s businesses, business practices and cost of operations; and general competitive factors and industry consolidation. The Corporation does not undertake, and specifically disclaims any obligation, to update any “forward-looking statements” to reflect occurrences or unanticipated events or circumstances after the date of such statements except as required by the federal securities laws. Investors should refer to the Corporation’s Annual Report on Form 10-K for the year ended December 31, 2013 for a discussion of such factors and certain risks and uncertainties to which the Corporation is subject.

Agenda Third Quarter 2014 Highlights: Aurelio Alemán, President & Chief Executive Officer Third Quarter Results of Operations: Orlando Berges, Executive Vice President & Chief Financial Officer Questions & Answers
THIRD QUARTER 2014 THIRD QUARTER 2014 Highlights
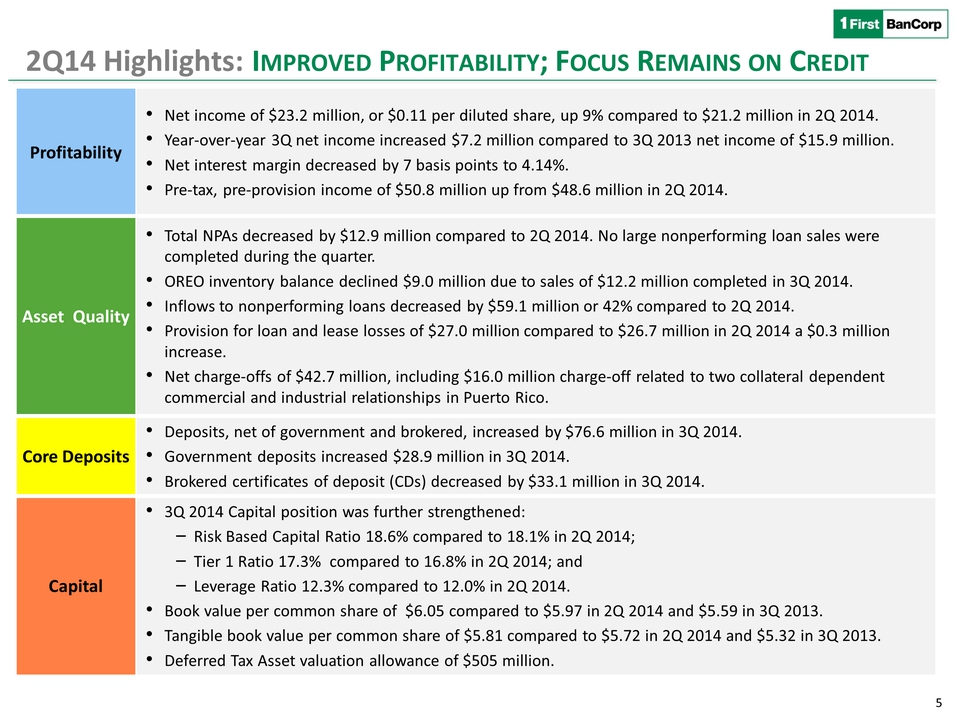
Profitability Net income of $23.2 million, or $0.11 per diluted share, up 9% compared to $21.2 million in 2Q 2014. Year-over-year 3Q net income increased $7.2 million compared to 3Q 2013 net income of $15.9 million. Net interest margin decreased by 7 basis points to 4.14%. Pre-tax, pre-provision income of $50.8 million up from $48.6 million in 2Q 2014. Asset Quality Total NPAs decreased by $12.9 million compared to 2Q 2014. No large nonperforming loan sales were completed during the quarter. OREO inventory balance declined $9.0 million due to sales of $12.2 million completed in 3Q 2014. Inflows to nonperforming loans decreased by $59.1 million or 42% compared to 2Q 2014. Provision for loan and lease losses of $27.0 million compared to $26.7 million in 2Q 2014 a $0.3 million increase. Net charge-offs of $42.7 million, including $16.0 million charge-off related to two collateral dependent commercial and industrial relationships in Puerto Rico. Core Deposits Deposits, net of government and brokered, increased by $76.6 million in 3Q 2014. Government deposits increased $28.9 million in 3Q 2014. Brokered certificates of deposit (CDs) decreased by $33.1 million in 3Q 2014. Capital 3Q 2014 Capital position was further strengthened: ‒Risk Based Capital Ratio 18.6% compared to 18.1% in 2Q 2014; ‒Tier 1 Ratio 17.3% compared to 16.8% in 2Q 2014; and ‒Leverage Ratio 12.3% compared to 12.0% in 2Q 2014. Book value per common share of $6.05 compared to $5.97 in 2Q 2014 and $5.59 in 3Q 2013. Tangible book value per common share of $5.81 compared to $5.72 in 2Q 2014 and $5.32 in 3Q 2013. Deferred Tax Asset valuation allowance of $505 million. 2Q14 Highlights: IMPROVED PROFITABILITY; FOCUS REMAINS ON CREDIT
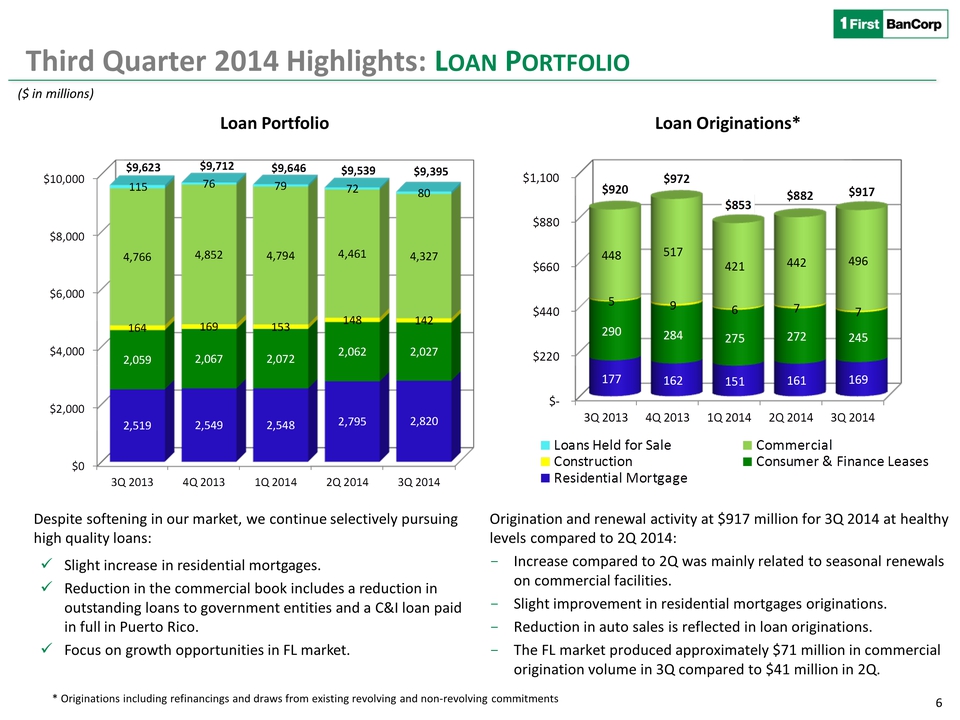
Third Quarter 2014 Highlights: LOAN PORTFOLIO Origination and renewal activity at $917 million for 3Q 2014 at healthy levels compared to 2Q 2014: Increase compared to 2Q was mainly related to seasonal renewals on commercial facilities. Slight improvement in residential mortgages originations. Reduction in auto sales is reflected in loan originations. The FL market produced approximately $71 million in commercial origination volume in 3Q compared to $41 million in 2Q. ($ in millions) Loan Originations* Despite softening in our market, we continue selectively pursuing high quality loans: Slight increase in residential mortgages. Reduction in the commercial book includes a reduction in outstanding loans to government entities and a C&I loan paid in full in Puerto Rico. Focus on growth opportunities in FL market. * Originations including refinancings and draws from existing revolving and non-revolving commitments Loan Portfolio $0$2,250$4,500$6,750$9,000$11,2503Q2,7672,7472,7142,5112,5191,9862,0132,0202,0472,0593533622231951645,0874,9324,6044,6924,76616485276238115$10,257 $10,140 $9,836 $9,683 9,623 Loans Held for Sale Commercial Construction Consumer & Finance Leases Residential Mortgage$0$2,000$4,000$6,000$8,000$10,0003Q 20134Q 20131Q 20142Q 20143Q 20142,5192,5492,5482,7952,8202,0592,0672,0722,0622,0271641691531481424,7664,8524,7944,4614,32711576797280$9,623 $9,712 $9,646 $9,539 $9,395 $-$220 $440 $660 $880 $1,100 3Q 20134Q 20131Q 20142Q 20143Q 2014177 162 151 161 169 290 284 275 272 245 5 9 6 7 7 448 517 421 442 496 $920$972$853$882$917
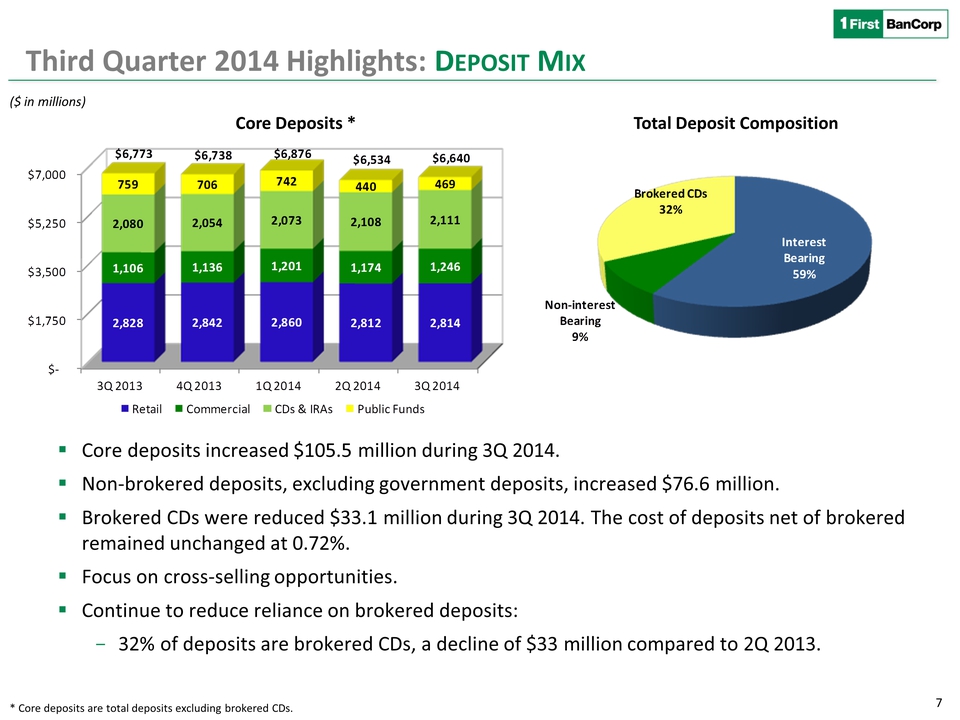
Core deposits increased $105.5 million during 3Q 2014. Non-brokered deposits, excluding government deposits, increased $76.6 million. Brokered CDs were reduced $33.1 million during 3Q 2014. The cost of deposits net of brokered remained unchanged at 0.72%. Focus on cross-selling opportunities. Continue to reduce reliance on brokered deposits: -32% of deposits are brokered CDs, a decline of $33 million compared to 2Q 2013. 7 ($ in millions) Core Deposits * Total Deposit Composition Third Quarter 2014 Highlights: DEPOSIT MIX * Core deposits are total deposits excluding brokered CDs. Interest Bearing59%Non-interest Bearing9%Brokered CDs32%$-$1,750 $3,500 $5,250 $7,000 3Q 20134Q 20131Q 20142Q 20143Q 20142,828 2,842 2,860 2,812 2,814 1,106 1,136 1,201 1,174 1,246 2,080 2,054 2,073 2,108 2,111 759 706 742 440 469 $6,773 $6,738 $6,876 $6,534 $6,640 Retail Commercial CDs & IRAs Public Funds
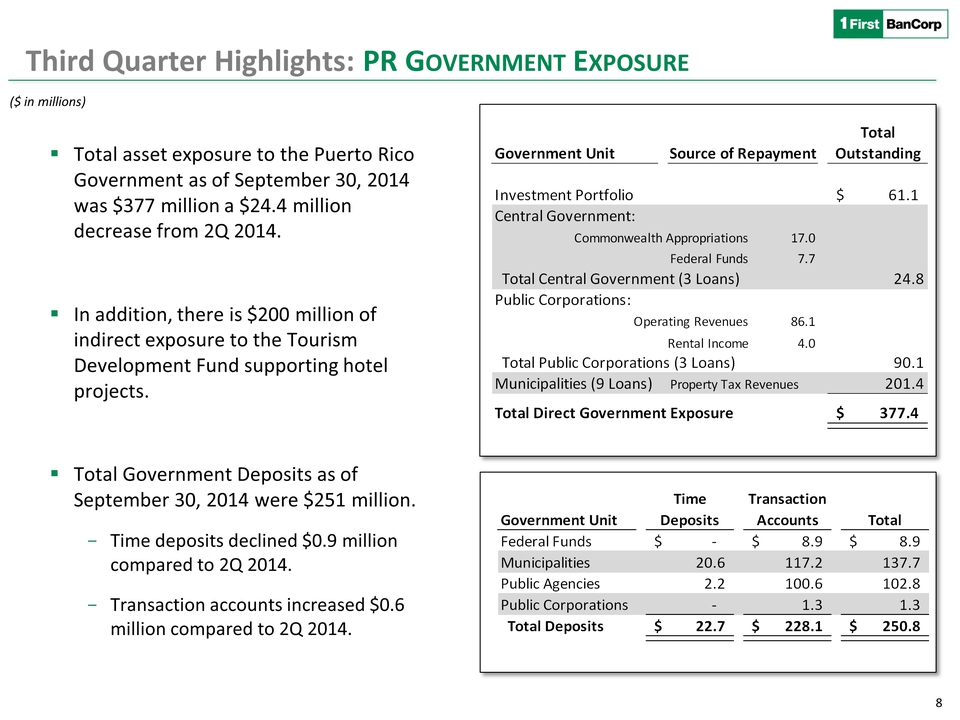
Third Quarter Highlights: PR GOVERNMENT EXPOSURE ($ in millions) Total asset exposure to the Puerto Rico Government as of September 30, 2014 was $377 million a $24.4 million decrease from 2Q 2014. In addition, there is $200 million of indirect exposure to the Tourism Development Fund supporting hotel projects. Total Government Deposits as of September 30, 2014 were $251 million. Time deposits declined $0.9 million compared to 2Q 2014. Transaction accounts increased $0.6 million compared to 2Q 2014. Government Unit Time Deposits Transaction Accounts Total Federal Funds-$ 8.9$ 8.9$ Municipalities20.6 117.2 137.7 Public Agencies2.2 100.6 102.8 Public Corporations- 1.3 1.3 Total Deposits22.7$ 228.1$ 250.8$ Total Government Unit Outstanding Investment Portfolio 61.1$ Central Government: Commonwealth Appropriations17.0Federal Funds7.7 Total Central Government (3 Loans) 24.8 Public Corporations: Operating Revenues 86.1 Rental Income 4.0 Total Public Corporations (3 Loans)90.1Municipalities (9 Loans)Property Tax Revenues201.4Total Direct Government Exposure377.4$ Source of Repayment
THIRD QUARTER 2014 THIRD QUARTER 2014 Results of Operations Results of Operations
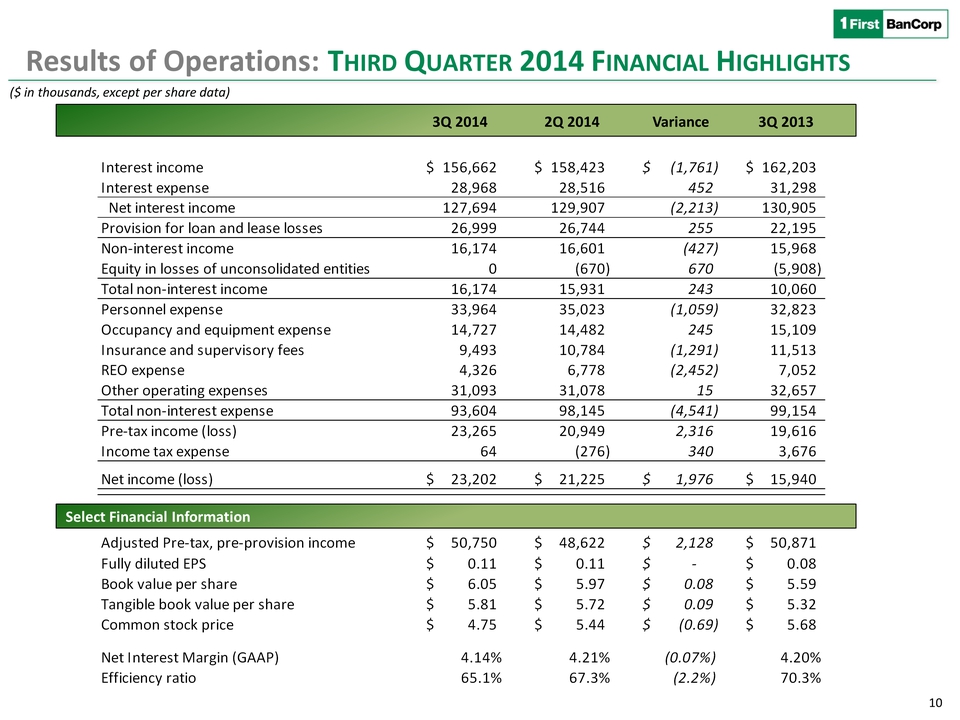
Interest income156,662$ 158,423$ (1,761)$ 162,203$ Interest expense28,968 28,516 452 31,298 Net interest income127,694 129,907 (2,213) 130,905 Provision for loan and lease losses26,999 26,744 255 22,195 Non-interest income16,174 16,601 (427) 15,968 Equity in losses of unconsolidated entities0 (670) 670 (5,908) Total non-interest income16,174 15,931 243 10,060 Personnel expense33,964 35,023 (1,059) 32,823 Occupancy and equipment expense14,727 14,482 245 15,109 Insurance and supervisory fees9,493 10,784 (1,291) 11,513 REO expense4,326 6,778 (2,452) 7,052 Other operating expenses31,093 31,078 15 32,657 Total non-interest expense93,604 98,145 (4,541) 99,154 Pre-tax income (loss)23,265 20,949 2,316 19,616 Income tax expense 64 (276) 340 3,676 Net income (loss)23,202$ 21,225$ 1,976$ 15,940$ Adjusted Pre-tax, pre-provision income50,750$ 48,622$ 2,128$ 50,871$ Fully diluted EPS0.11$ 0.11$ -$ 0.08$ Book value per share6.05$ 5.97$ 0.08$ 5.59$ Tangible book value per share5.81$ 5.72$ 0.09$ 5.32$ Common stock price4.75$ 5.44$ (0.69)$ 5.68$ Net Interest Margin (GAAP)4.14%4.21%(0.07%)4.20%Efficiency ratio65.1%67.3%(2.2%)70.3%10 ($ in thousands, except per share data) Select Financial Information 3Q 2014 2Q 2014 Variance Results of Operations: THIRD QUARTER 2014 FINANCIAL HIGHLIGHTS 3Q 2013
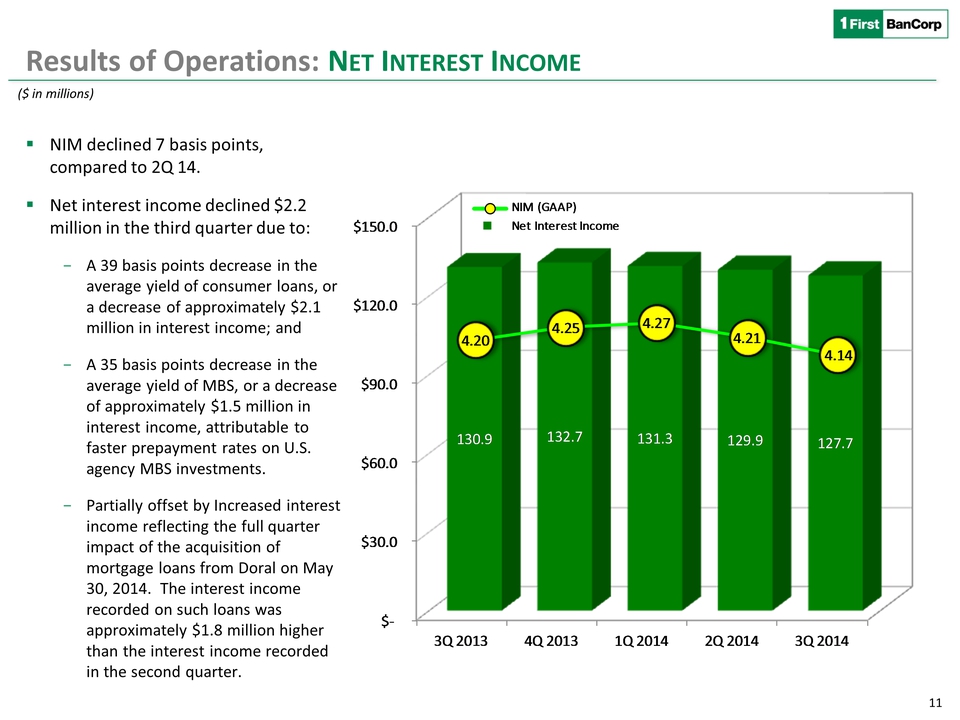
$-$30.0 $60.0 $90.0 $120.0 $150.0 3Q 20134Q 20131Q 20142Q 20143Q 2014130.9132.7131.3129.9127.7NIM (GAAP) Net Interest Income4.204.254.274.214.14 11 Results of Operations: NET INTEREST INCOME NIM declined 7 basis points, compared to 2Q 14. Net interest income declined $2.2 million in the third quarter due to: -A 39 basis points decrease in the average yield of consumer loans, or a decrease of approximately $2.1 million in interest income; and -A 35 basis points decrease in the average yield of MBS, or a decrease of approximately $1.5 million in interest income, attributable to faster prepayment rates on U.S. agency MBS investments. -Partially offset by Increased interest income reflecting the full quarter impact of the acquisition of mortgage loans from Doral on May 30, 2014. The interest income recorded on such loans was approximately $1.8 million higher than the interest income recorded in the second quarter. 2.602.752.943.203.46Net Interest ($ in millions)
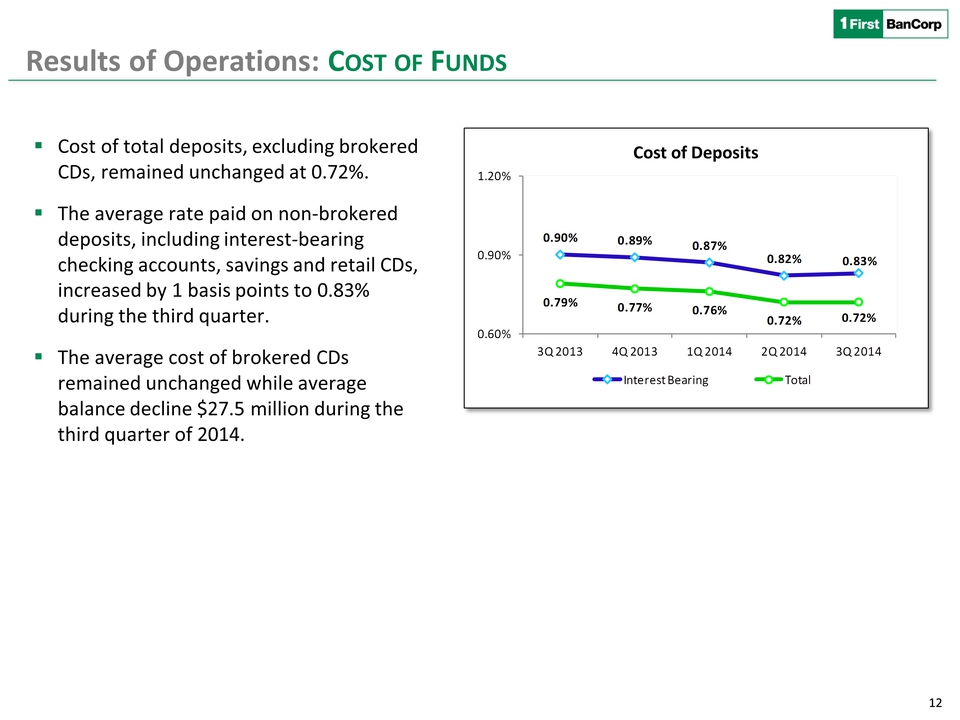
Results of Operations: COST OF FUNDS Cost of total deposits, excluding brokered CDs, remained unchanged at 0.72%. The average rate paid on non-brokered deposits, including interest-bearing checking accounts, savings and retail CDs, increased by 1 basis points to 0.83% during the third quarter. The average cost of brokered CDs remained unchanged while average balance decline $27.5 million during the third quarter of 2014. Cost of Deposits 0.90%0.89%0.87%0.82%0.83%0.79%0.77%0.76%0.72%0.72%0.60%0.90%1.20%3Q 20134Q 20131Q 20142Q 20143Q 2014 Interest Bearing Total
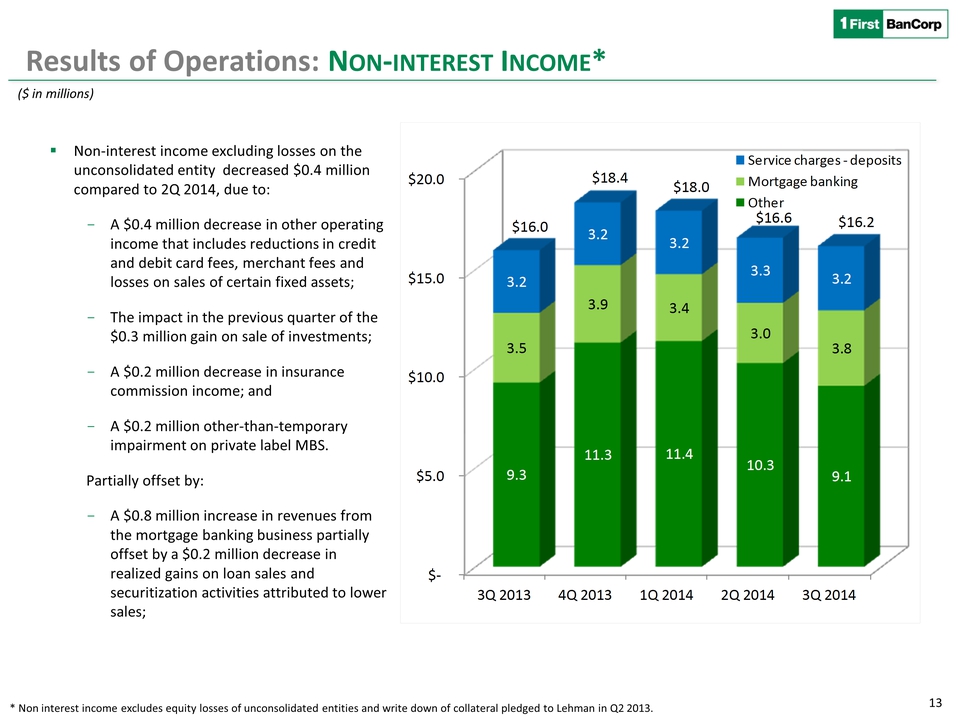
Results of Operations: NON-INTEREST INCOME* Non-interest income excluding losses on the unconsolidated entity decreased $0.4 million compared to 2Q 2014, due to: -A $0.4 million decrease in other operating income that includes reductions in credit and debit card fees, merchant fees and losses on sales of certain fixed assets; -The impact in the previous quarter of the $0.3 million gain on sale of investments; -A $0.2 million decrease in insurance commission income; and -A $0.2 million other-than-temporary impairment on private label MBS. Partially offset by: -A $0.8 million increase in revenues from the mortgage banking business partially offset by a $0.2 million decrease in realized gains on loan sales and securitization activities attributed to lower sales; * Non interest income excludes equity losses of unconsolidated entities and write down of collateral pledged to Lehman in Q2 2013. ($ in millions) $-$5.0 $10.0 $15.0 $20.0 3Q 20134Q 20131Q 20142Q 20143Q 20149.3 11.3 11.4 10.3 9.1 3.5 3.9 3.4 3.0 3.8 3.2 3.2 3.2 3.3 3.2 $16.0 $18.4 $18.0 $16.6 $16.2 Service charges –deposits Mortgage banking Other
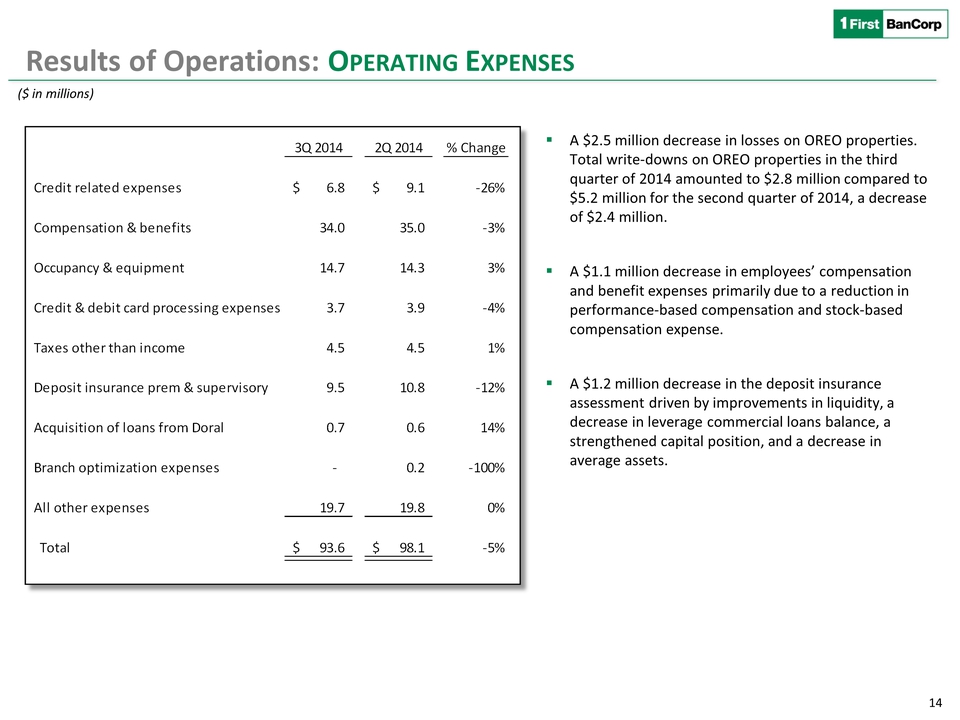
Results of Operations: OPERATING EXPENSES A $2.5 million decrease in losses on OREO properties. Total write-downs on OREO properties in the third quarter of 2014 amounted to $2.8 million compared to $5.2 million for the second quarter of 2014, a decrease of $2.4 million. A $1.1 million decrease in employees’ compensation and benefit expenses primarily due to a reduction in performance-based compensation and stock-based compensation expense. A $1.2 million decrease in the deposit insurance assessment driven by improvements in liquidity, a decrease in leverage commercial loans balance, a strengthened capital position, and a decrease in average assets. ($ in millions) 3Q 20142Q 2014% Change Credit related expenses6.8$ 9.1$ -26%Compensation & benefits34.0 35.0 -3%Occupancy & equipment14.7 14.3 3%Credit & debit card processing expenses3.7 3.9 -4%Taxes other than income4.5 4.5 1%Deposit insurance prem & supervisory9.5 10.8 -12%Acquisition of loans from Doral 0.7 0.6 14%Branch optimization expenses- 0.2 -100%All other expenses19.7 19.8 0% Total93.6$ 98.1$ -5% 2010 2011 2012 2013
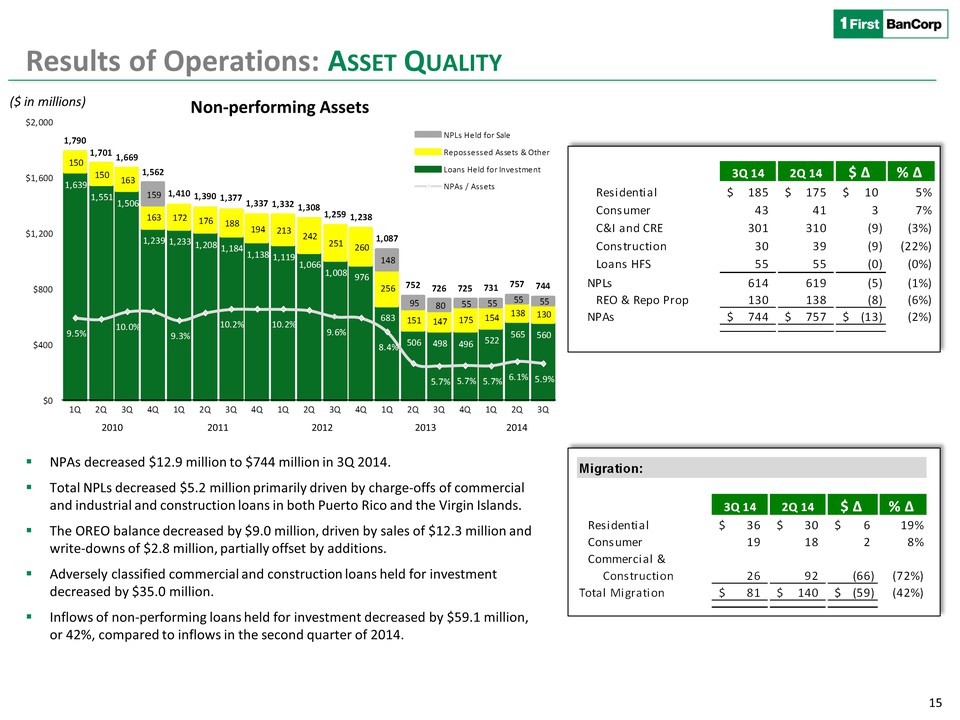
Results of Operations: ASSET QUALITY NPAs decreased $12.9 million to $744 million in 3Q 2014. Total NPLs decreased $5.2 million primarily driven by charge-offs of commercial and industrial and construction loans in both Puerto Rico and the Virgin Islands. The OREO balance decreased by $9.0 million, driven by sales of $12.3 million and write-downs of $2.8 million, partially offset by additions. Adversely classified commercial and construction loans held for investment decreased by $35.0 million. Inflows of non-performing loans held for investment decreased by $59.1 million, or 42%, compared to inflows in the second quarter of 2014. Residential and consumer migration declined $59 million or 42% compared to 2Q 2014. ($ in millions) Non-performing Assets 2014 1,639 1,551 1,506 1,239 1,233 1,208 1,184 1,138 1,119 1,066 1,008 976 683 506 498 496 522 565 560 150 150 163 163 172 176 188 194 213 242 251 260 256 151 147 175 154 138 130 159 148 95 80 55 55 55 55 1,7901,7011,6691,5621,4101,3901,3771,3371,3321,3081,2591,2381,0877527267257317577449.5% 10.0% 9.3% 10.2% 10.2% 9.6% 8.4% 5.7% 5.7% 5.7% 6.1% 5.9% $0$400$800$1,200$1,600$2,0001Q2Q3Q4Q1Q2Q3Q4Q1Q2Q3Q4Q1Q2Q3Q4Q1Q2Q3QNPLs Held for Sale Repossessed Assets & Other Loans Held for Investment NPAs / Assets3Q 142Q 14$ ∆ % ∆ Residential185$ 175$ 10$ 5%Consumer 43 41 3 7%C&I and CRE301 310 (9) (3%)Construction30 39 (9) (22%)Loans HFS55 55 (0) (0%)NPLs614 619 (5) (1%)REO & Repo Prop130 138 (8) (6%)NPAs744$ 757$ (13)$ (2%)Migration:3Q 142Q 14$ ∆ % ∆ Residential36$ 30$ 6$ 19%Consumer 19 18 2 8%Commercial & Construction26 92 (66) (72%)Total Migration81$ 140$ (59)$ (42%)
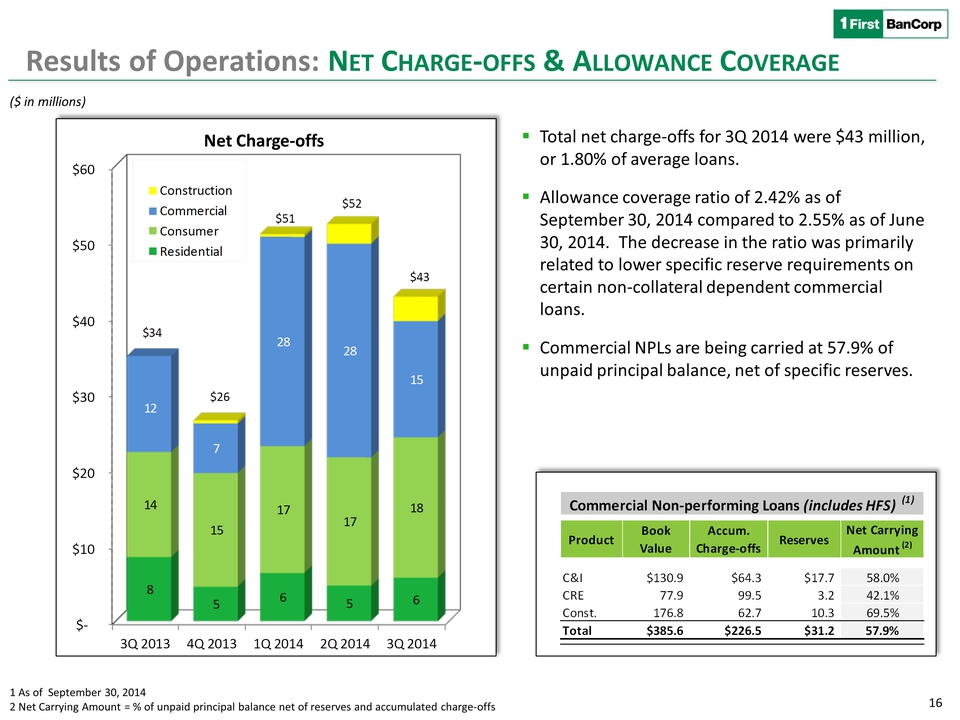
Results of Operations: NET CHARGE-OFFS & ALLOWANCE COVERAGE ($ in millions) Total net charge-offs for 3Q 2014 were $43 million, or 1.80% of average loans. Allowance coverage ratio of 2.42% as of September 30, 2014 compared to 2.55% as of June 30, 2014. The decrease in the ratio was primarily related to lower specific reserve requirements on certain non-collateral dependent commercial loans. Commercial NPLs are being carried at 57.9% of unpaid principal balance, net of specific reserves. Net Charge-offs 1 As of September 30, 2014 2 Net Carrying Amount = % of unpaid principal balance net of reserves and accumulated charge-offs Product Book Value Accum. Charge-offs Reserves Net Carrying Amount (2)C&I$130.9$64.3$17.758.0%CRE77.9 99.5 3.2 42.1%Const.176.8 62.7 10.3 69.5%Total$385.6$226.5$31.257.9%Commercial Non-performing Loans (includes HFS) (1)$-$10 $20 $30 $40 $50 $60 3Q 20134Q 20131Q 20142Q 20143Q 20148 5 6 5 6 14 15 17 17 18 12 7 28 28 15 $34 $26 $51 $52 $43 Construction Commercial Consumer Residential
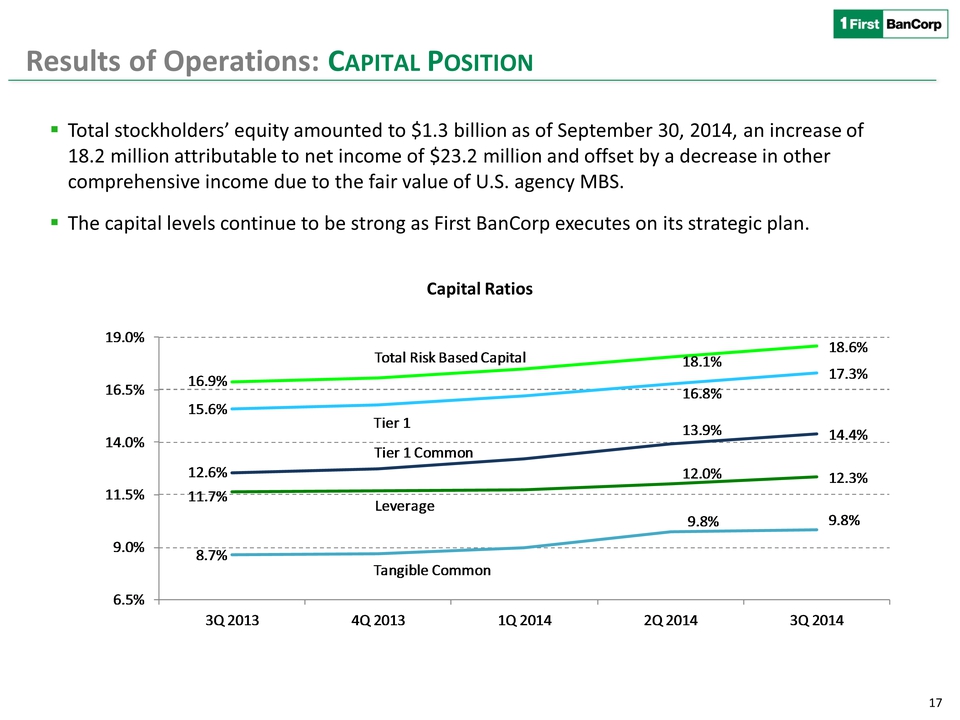
Results of Operations: CAPITAL POSITION Total stockholders’ equity amounted to $1.3 billion as of September 30, 2014, an increase of 18.2 million attributable to net income of $23.2 million and offset by a decrease in other comprehensive income due to the fair value of U.S. agency MBS. The capital levels continue to be strong as First BanCorp executes on its strategic plan. Capital Ratios 16.9%Total Risk Based Capital 18.1%18.6%15.6%Tier 116.8%17.3%11.7%Leverage12.0%12.3%12.6%Tier 1 Common13.9%14.4%8.7%Tangible Common9.8%9.8%6.5%9.0%11.5%14.0%16.5%19.0%3Q 20134Q 20131Q 20142Q 20143Q 2014

THIRD QUARTER 2014 THIRD QUARTER 2014 Q&A

EXHIBITS
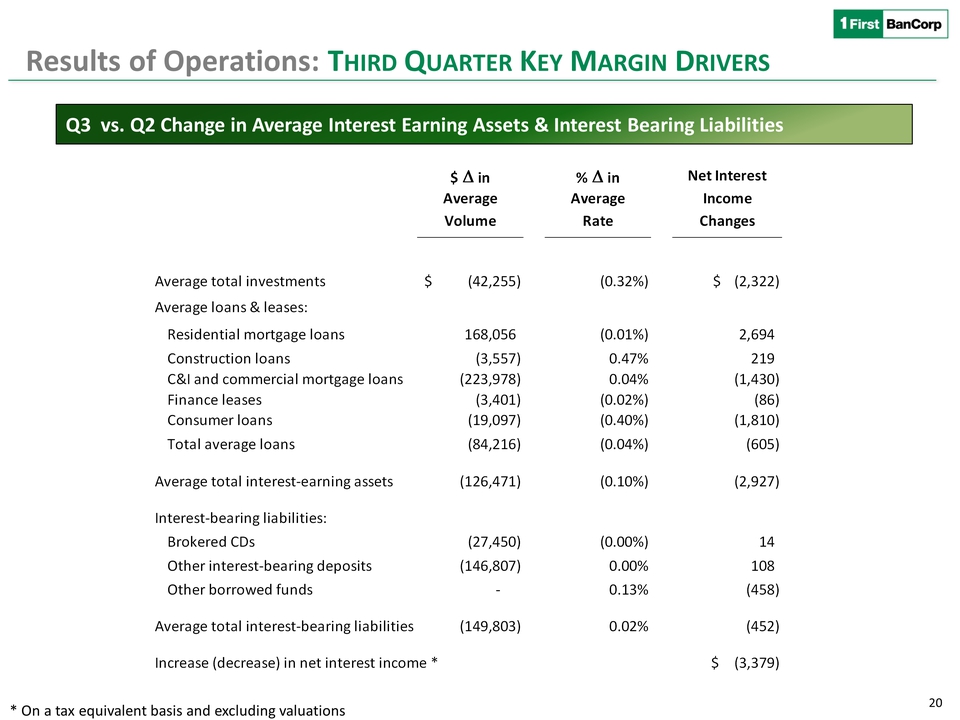
Results of Operations: THIRD QUARTER KEY MARGIN DRIVERS Q3 vs. Q2 Change in Average Interest Earning Assets & Interest Bearing Liabilities * On a tax equivalent basis and excluding valuations $ D in % D in Average Average Volume Rate Average total investments(42,255)$ (0.32%)(2,322)$ Average loans & leases: Residential mortgage loans168,056 (0.01%)2,694 Construction loans(3,557) 0.47%219 C&I and commercial mortgage loans(223,978) 0.04%(1,430) Finance leases(3,401) (0.02%)(86) Consumer loans(19,097) (0.40%)(1,810) Total average loans(84,216) (0.04%)(605) Average total interest-earning assets(126,471) (0.10%)(2,927) Interest-bearing liabilities: Brokered CDs(27,450) (0.00%)14 Other interest-bearing deposits(146,807) 0.00%108 Other borrowed funds- 0.13%(458) Average total interest-bearing liabilities(149,803) 0.02%(452) Increase (decrease) in net interest income *(3,379)$ Net Interest Income Changes
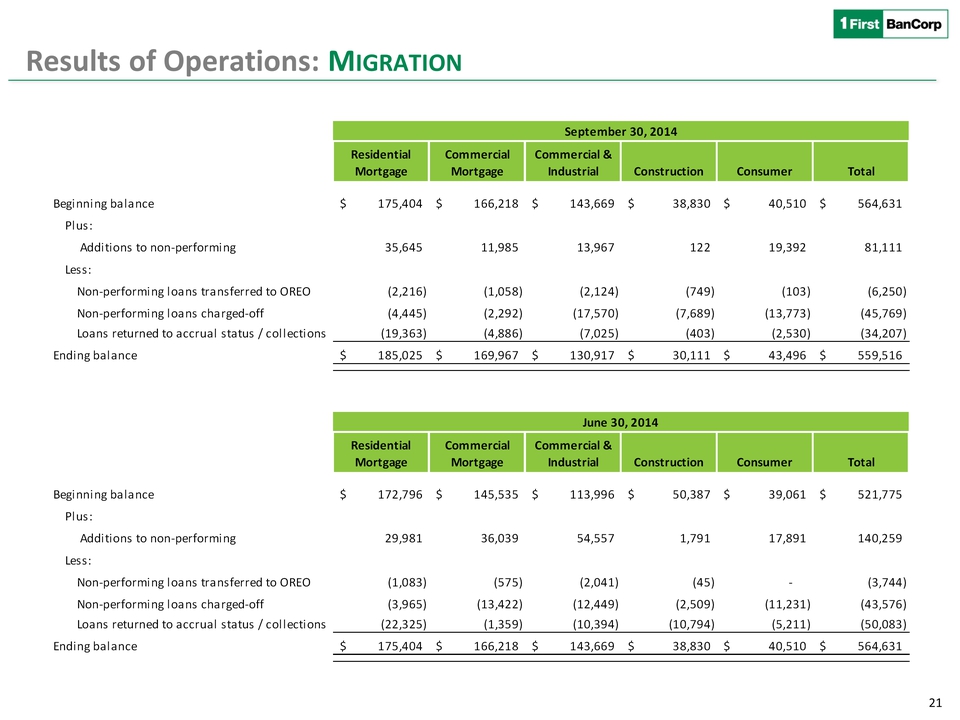
Results of Operations: MIGRATION Residential Mortgage Commercial Mortgage Commercial & Industrial Construction Consumer Total Beginning balance175,404$ 166,218$ 143,669$ 38,830$ 40,510$ 564,631$ Plus: Additions to non-performing35,645 11,985 13,967 122 19,392 81,111 Less: Non-performing loans transferred to OREO(2,216) (1,058) (2,124) (749) (103) (6,250) Non-performing loans charged-off(4,445) (2,292) (17,570) (7,689) (13,773) (45,769) Loans returned to accrual status / collections(19,363) (4,886) (7,025) (403) (2,530) (34,207) Ending balance185,025$ 169,967$ 130,917$ 30,111$ 43,496$ 559,516$ Residential Mortgage Commercial Mortgage Commercial & Industrial Construction Consumer Total Beginning balance172,796$ 145,535$ 113,996$ 50,387$ 39,061$ 521,775$ Plus: Additions to non-performing29,981 36,039 54,557 1,791 17,891 140,259 Less: Non-performing loans transferred to OREO(1,083) (575) (2,041) (45) - (3,744) Non-performing loans charged-off(3,965) (13,422) (12,449) (2,509) (11,231) (43,576) Loans returned to accrual status / collections(22,325) (1,359) (10,394) (10,794) (5,211) (50,083) Ending balance175,404$ 166,218$ 143,669$ 38,830$ 40,510$ 564,631$ September 30, 2014June 30, 2014
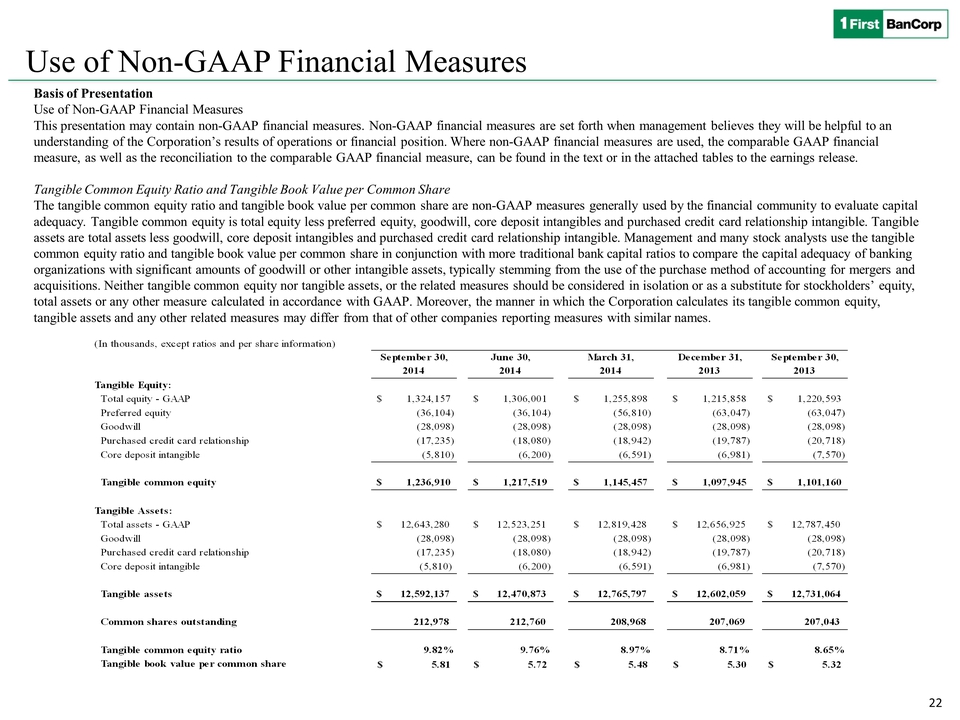
Use of Non-GAAP Financial Measures Basis of Presentation Use of Non-GAAP Financial Measures This presentation may contain non-GAAP financial measures. Non-GAAP financial measures are set forth when management believes they will be helpful to an understanding of the Corporation’s results of operations or financial position. Where non-GAAP financial measures are used, the comparable GAAP financial measure, as well as the reconciliation to the comparable GAAP financial measure, can be found in the text or in the attached tables to the earnings release. Tangible Common Equity Ratio and Tangible Book Value per Common Share The tangible common equity ratio and tangible book value per common share are non-GAAP measures generally used by the financial community to evaluate capital adequacy. Tangible common equity is total equity less preferred equity, goodwill, core deposit intangibles and purchased credit card relationship intangible. Tangible assets are total assets less goodwill, core deposit intangibles and purchased credit card relationship intangible. Management and many stock analysts use the tangible common equity ratio and tangible book value per common share in conjunction with more traditional bank capital ratios to compare the capital adequacy of banking organizations with significant amounts of goodwill or other intangible assets, typically stemming from the use of the purchase method of accounting for mergers and acquisitions. Neither tangible common equity nor tangible assets, or the related measures should be considered in isolation or as a substitute for stockholders’ equity, total assets or any other measure calculated in accordance with GAAP. Moreover, the manner in which the Corporation calculates its tangible common equity, tangible assets and any other related measures may differ from that of other companies reporting measures with similar names. (In thousands, except ratios and per share information)September 30,June 30,March 31,December 31,September 30,20142014201420132013Total equity - GAAP $ 1,324,157 $ 1,306,001 $ 1,255,898 $ 1,215,858 $ 1,220,593 Preferred equity(36,104)(36,104)(56,810)(63,047)(63,047)Goodwill(28,098)(28,098)(28,098)(28,098)(28,098)Purchased credit card relationship (17,235) (18,080) (18,942) (19,787) (20,718)Core deposit intangible(5,810)(6,200)(6,591)(6,981)(7,570)Tangible common equity $ 1,236,910 $ 1,217,519 $ 1,145,457 $ 1,097,945 $ 1,101,160 Total assets - GAAP $ 12,643,280 $ 12,523,251 $ 12,819,428 $ 12,656,925 $ 12,787,450 Goodwill(28,098)(28,098)(28,098)(28,098)(28,098)Purchased credit card relationship (17,235) (18,080) (18,942) (19,787) (20,718)Core deposit intangible (5,810)(6,200)(6,591)(6,981)(7,570)Tangible assets $ 12,592,137 $ 12,470,873 $ 12,765,797 $ 12,602,059 $ 12,731,064 Common shares outstanding 212,978 212,760 208,968 207,069 207,043 Tangible common equity ratio9.82%9.76%8.97%8.71%8.65%Tangible book value per common share5.81$ 5.72$ 5.48$ 5.30$ 5.32$ Tangible Equity: Tangible Assets:
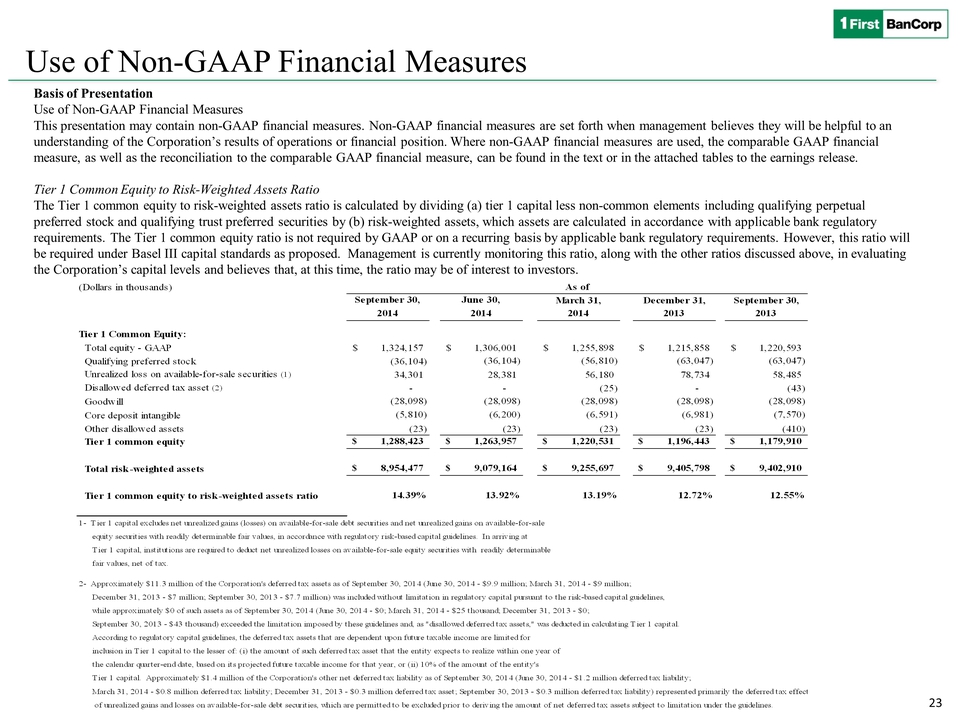
Use of Non-GAAP Financial Measures Basis of Presentation Use of Non-GAAP Financial Measures This presentation may contain non-GAAP financial measures. Non-GAAP financial measures are set forth when management believes they will be helpful to an understanding of the Corporation’s results of operations or financial position. Where non-GAAP financial measures are used, the comparable GAAP financial measure, as well as the reconciliation to the comparable GAAP financial measure, can be found in the text or in the attached tables to the earnings release. Tier 1 Common Equity to Risk-Weighted Assets Ratio The Tier 1 common equity to risk-weighted assets ratio is calculated by dividing (a) tier 1 capital less non-common elements including qualifying perpetual preferred stock and qualifying trust preferred securities by (b) risk-weighted assets, which assets are calculated in accordance with applicable bank regulatory requirements. The Tier 1 common equity ratio is not required by GAAP or on a recurring basis by applicable bank regulatory requirements. However, this ratio will be required under Basel III capital standards as proposed. Management is currently monitoring this ratio, along with the other ratios discussed above, in evaluating the Corporation’s capital levels and believes that, at this time, the ratio may be of interest to investors. (Dollars in thousands)September 30,June 30,March 31,December 31,September 30,20142014201420132013Total equity - GAAP1,324,157$ 1,306,001$ 1,255,898$ 1,215,858$ 1,220,593$ Qualifying preferred stock(36,104)(36,104)(56,810)(63,047)(63,047)Unrealized loss on available-for-sale securities (1)34,301 28,381 56,180 78,734 58,485 Disallowed deferred tax asset (2)- - (25) - (43) Goodwill(28,098)(28,098)(28,098)(28,098)(28,098)Core deposit intangible(5,810)(6,200)(6,591)(6,981)(7,570)Other disallowed assets(23) (23) (23) (23) (410) Tier 1 common equity $ 1,288,423 $ 1,263,957 $ 1,220,531 $ 1,196,443 $ 1,179,910 Total risk-weighted assets $ 8,954,477 $ 9,079,164 $ 9,255,697 $ 9,405,798 $ 9,402,910 Tier 1 common equity to risk-weighted assets ratio14.39%13.92%13.19%12.72%12.55%1- Tier 1 capital excludes net unrealized gains (losses) on available-for-sale debt securities and net unrealized gains on available-for-sale equity securities with readily determinable fair values, in accordance with regulatory risk-based capital guidelines. In arriving at Tier 1 capital, institutions are required to deduct net unrealized losses on available-for-sale equity securities with readily determinable fair values, net of tax.2- Approximately $11.3 million of the Corporation's deferred tax assets as of September 30, 2014 (June 30, 2014 - $9.9 million; March 31, 2014 - $9 million; December 31, 2013 - $7 million; September 30, 2013 - $7.7 million) was included without limitation in regulatory capital pursuant to the risk-based capital guidelines, while approximately $0 of such assets as of September 30, 2014 (June 30, 2014 - $0; March 31, 2014 - $25 thousand; December 31, 2013 - $0; September 30, 2013 - $43 thousand) exceeded the limitation imposed by these guidelines and, as "disallowed deferred tax assets," was deducted in calculating Tier 1 capital. According to regulatory capital guidelines, the deferred tax assets that are dependent upon future taxable income are limited for inclusion in Tier 1 capital to the lesser of: (i) the amount of such deferred tax asset that the entity expects to realize within one year of the calendar quarter-end date, based on its projected future taxable income for that year, or (ii) 10% of the amount of the entity's Tier 1 capital. Approximately $1.4 million of the Corporation's other net deferred tax liability as of September 30, 2014 (June 30, 2014 - $1.2 million deferred tax liability; March 31, 2014 - $0.8 million deferred tax liability; December 31, 2013 - $0.3 million deferred tax asset; September 30, 2013 - $0.3 million deferred tax liability) represented primarily the deferred tax effects of unrealized gains and losses on available-for-sale debt securities, which are permitted to be excluded prior to deriving the amount of net deferred tax assets subject to limitation under the guidelines. As ofTier 1 Common Equity:
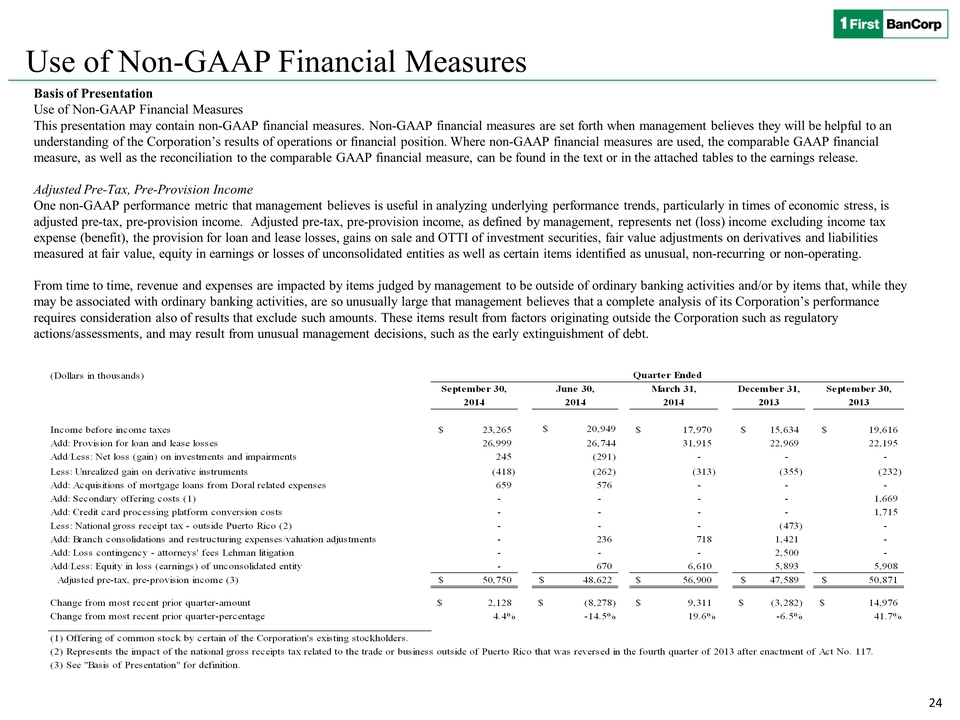
Use of Non-GAAP Financial Measures Basis of Presentation Use of Non-GAAP Financial Measures This presentation may contain non-GAAP financial measures. Non-GAAP financial measures are set forth when management believes they will be helpful to an understanding of the Corporation’s results of operations or financial position. Where non-GAAP financial measures are used, the comparable GAAP financial measure, as well as the reconciliation to the comparable GAAP financial measure, can be found in the text or in the attached tables to the earnings release. Adjusted Pre-Tax, Pre-Provision Income One non-GAAP performance metric that management believes is useful in analyzing underlying performance trends, particularly in times of economic stress, is adjusted pre-tax, pre-provision income. Adjusted pre-tax, pre-provision income, as defined by management, represents net (loss) income excluding income tax expense (benefit), the provision for loan and lease losses, gains on sale and OTTI of investment securities, fair value adjustments on derivatives and liabilities measured at fair value, equity in earnings or losses of unconsolidated entities as well as certain items identified as unusual, non-recurring or non-operating. From time to time, revenue and expenses are impacted by items judged by management to be outside of ordinary banking activities and/or by items that, while they may be associated with ordinary banking activities, are so unusually large that management believes that a complete analysis of its Corporation’s performance requires consideration also of results that exclude such amounts. These items result from factors originating outside the Corporation such as regulatory actions/assessments, and may result from unusual management decisions, such as the early extinguishment of debt. (Dollars in thousands)September 30,June 30,March 31,December 31,September 30,20142014201420132013Income before income taxes 23,265$ $ 20,949 17,970$ 15,634$ 19,616$ Add: Provision for loan and lease losses26,999 26,74431,915 22,969 22,195 Add/Less: Net loss (gain) on investments and impairments245 (291) - - - Less: Unrealized gain on derivative instruments (418) (262) (313) (355) (232) Add: Acquisitions of mortgage loans from Doral related expenses659 576 - - - Add: Secondary offering costs (1)- - - - 1,669 Add: Credit card processing platform conversion costs- - - - 1,715 Less: National gross receipt tax - outside Puerto Rico (2)- - - (473) - Add: Branch consolidations and restructuring expenses/valuation adjustments- 236 718 1,421 - Add: Loss contingency - attorneys' fees Lehman litigation- - - 2,500 - Add/Less: Equity in loss (earnings) of unconsolidated entity- 670 6,610 5,893 5,908 Adjusted pre-tax, pre-provision income (3)50,750$ 48,622$ 56,900$ 47,589$ 50,871$ Change from most recent prior quarter-amount2,128$ (8,278)$ 9,311$ (3,282)$ 14,976$ Change from most recent prior quarter-percentage4.4%-14.5%19.6%-6.5%41.7%(1) Offering of common stock by certain of the Corporation's existing stockholders.(2) Represents the impact of the national gross receipts tax related to the trade or business outside of Puerto Rico that was reversed in the fourth quarter of 2013 after enactment of Act No. 117.(3) See "Basis of Presentation" for definition. Quarter Ended