Attached files
| file | filename |
|---|---|
| 8-K - FORM 8-K - C. H. ROBINSON WORLDWIDE, INC. | d810676d8k.htm |
| EX-99.1 - PRESS RELEASE - C. H. ROBINSON WORLDWIDE, INC. | d810676dex991.htm |
 Earnings Conference Call –
Third Quarter 2014
October 29, 2014
John Wiehoff, Chairman & CEO
Chad Lindbloom, CFO
Tim Gagnon, Director, Investor Relations
Exhibit 99.2 |
 2
Safe Harbor Statement
Except for the historical information contained herein, the matters set forth in
this presentation and the accompanying earnings release are
forward-looking statements that represent our expectations, beliefs,
intentions or strategies concerning future events. These forward-looking
statements are subject to certain risks and uncertainties that could cause
actual results to differ materially from our historical experience or our
present expectations, including, but not limited to such factors as changes
in economic conditions, including uncertain consumer demand; changes in
market demand and pressures on the pricing for our services; competition and
growth rates within the third party logistics industry; freight levels and
increasing costs and availability of truck capacity or alternative means
of transporting freight,
and changes in relationships with existing truck, rail, ocean and air carriers;
changes in our customer base due to possible consolidation among our
customers; our ability to integrate the operations of acquired companies
with our historic operations successfully; risks associated with litigation
and insurance coverage; risks associated with operations outside of the
U.S.; risks associated with the potential impacts of changes in government
regulations; risks associated with the produce industry, including food
safety and contamination issues; fuel prices and availability; changes to
our share repurchase activity; the impact of war on the economy; and other risks
and uncertainties detailed in our Annual and Quarterly Reports.
|
 3
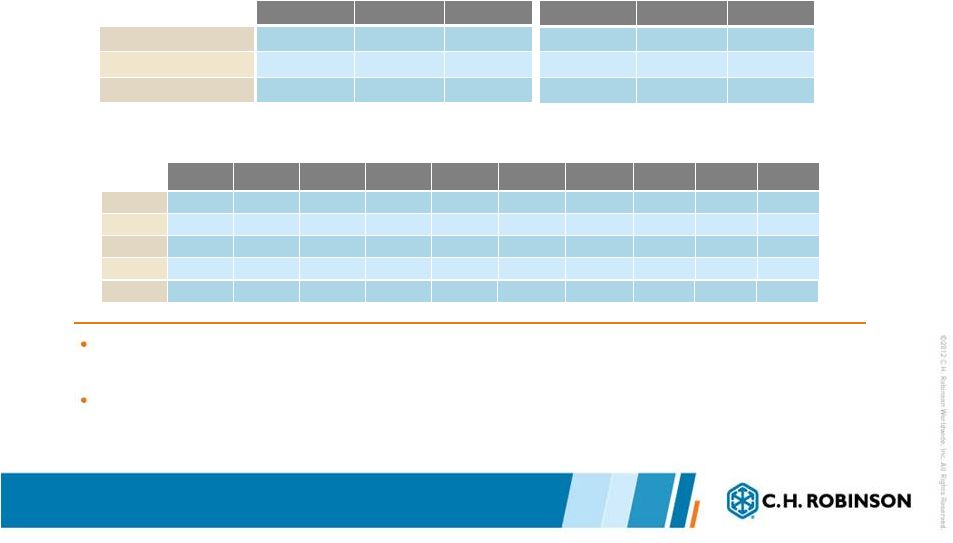
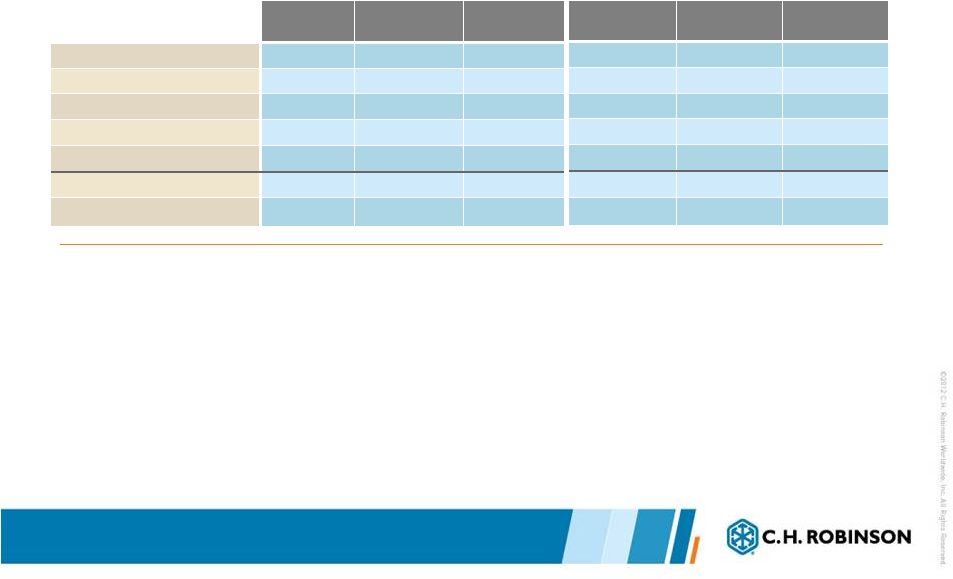
Results Q3 2014
Three months ended September 30
in thousands, except per share amounts
•
Net revenue growth in the third quarter was primarily driven by
double digit net revenue increases in nearly all services
•
Share repurchases positively impacted EPS growth in the third
quarter
•
Foreign tax credits increased earnings approximately $.03 per
share in the third quarter
2014
2013
% Change
2014
2013
% Change
Total revenues
$3,467,362
$3,316,665
4.5%
$10,112,865
$9,599,194
5.4%
Total net revenues
$527,564
$463,306
13.9%
$1,505,836
$1,391,630
8.2%
Income from operations
$203,337
$176,355
15.3%
$560,690
$527,537
6.3%
Net income
$124,981
$107,737
16.0%
$336,764
$322,952
4.3%
Earnings per share
(diluted)
$0.85
$0.69
23.2%
$2.28
$2.03
12.3%
Weighted average shares
outstanding
146,856
157,044
-6.5%
147,819
158,884
-7.0%
Nine months ended September 30 |
 4
Transportation Results Q3 2014
Net revenue growth exceeded total revenue growth as a result of margin
expansion and a change in our mix of business
Transportation net revenue margin improvement driven primarily by Truckload,
Ocean and Air results
2014
2013
% Change
Total revenues
$3,069,056
$2,880,901
6.5%
Total net revenues
$493,987
$429,978
14.9%
Net revenue margin
16.1%
14.9%
7.8%
Three months ended September 30
TRANSPORTATION in thousands
TRANSPORTATION NET REVENUE MARGIN PERCENTAGE
2005
2006
2007
2008
2009
2010
2011
2012
2013
2014
Q1
17.4%
18.3%
20.2%
18.2%
22.6%
17.4%
17.2%
16.9%
16.2%
15.3%
Q2
16.3%
17.1%
17.9%
15.4%
20.6%
15.8%
16.2%
14.9%
15.3%
15.9%
Q3
16.3%
17.5%
18.0%
15.9%
19.8%
16.6%
16.4%
15.6%
14.9%
16.1%
Q4
15.7%
18.3%
17.7%
19.0%
18.3%
17.6%
16.3%
15.8%
15.0%
Year
16.3%
17.8%
18.4%
17.0%
20.2%
16.8%
16.5%
15.8%
15.3%
2014
2013
% Change
$8,911,683
$8,302,160
7.3%
$1,405,418
$1,282,375
9.6%
15.8%
15.4%
2.1%
Nine months ended September 30 |
 5
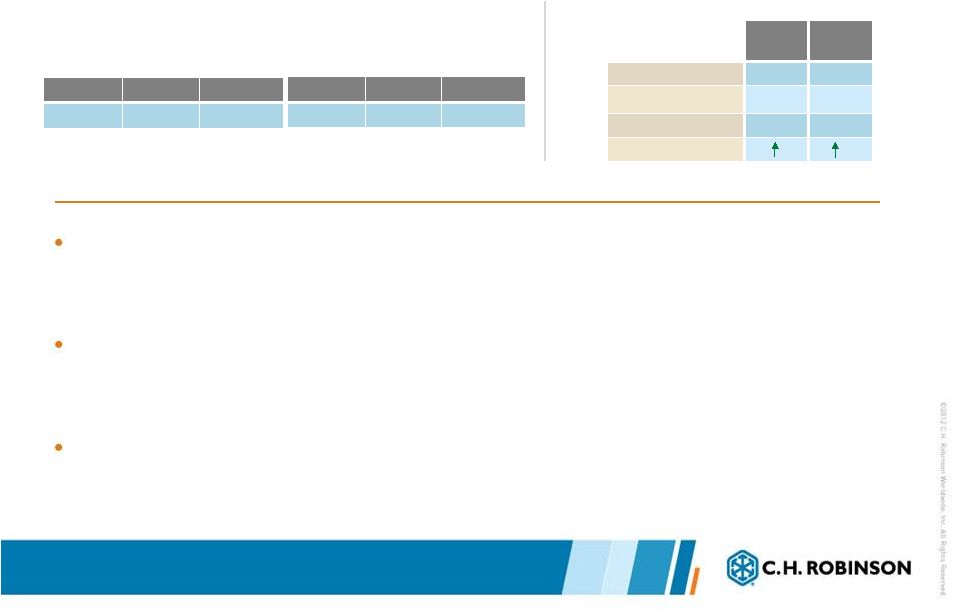
Quarter
YTD
Volume
1%
2%
Approximate pricing*
10%
10%
Approximate cost*
8%
10%
Net revenue margin
Truckload Results Q3 2014
*Pricing and cost measures exclude the estimated impact
of the change in fuel
Truckload net revenue margins expanded in the third quarter when
compared to the third quarter of 2013 driven by increased pricing
and a change in our mix of freight
North American Truckload price per mile, excluding the impact of
the change in fuel, increased approximately ten percent in the third
quarter when compared to the third quarter of 2013
North American Truckload cost per mile, excluding the impact of
the change in fuel, increased approximately eight percent in the
third quarter when compared to the third quarter of 2013
2014
2013
% Change
$307,376
$265,509
15.8%
Three months ended Sept 30
TRUCKLOAD NET REVENUES in thousands
Year over year change
2014
2013
% Change
$882,774
$798,448
10.6%
Nine months ended Sept 30
North America
Truckload |
 6
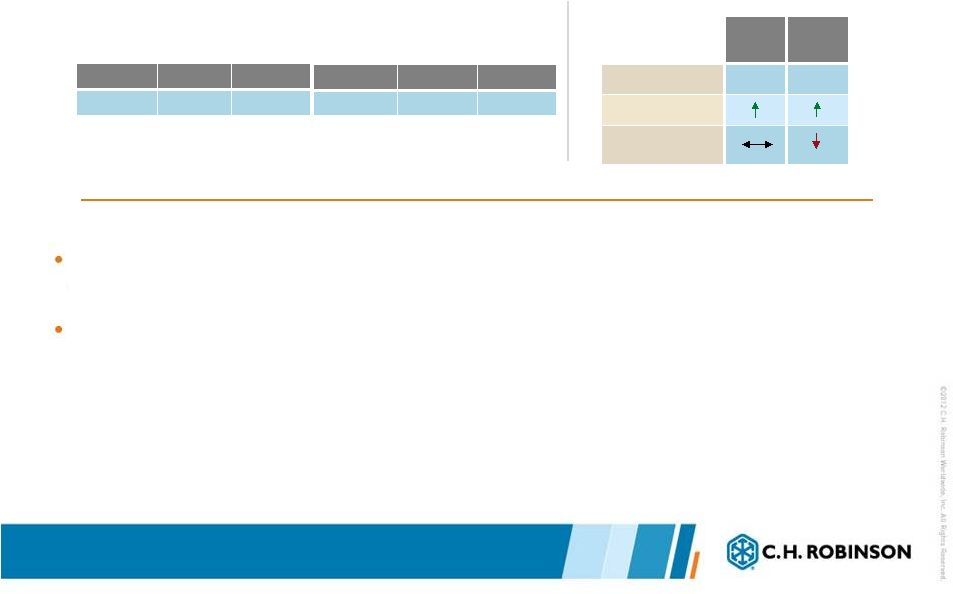
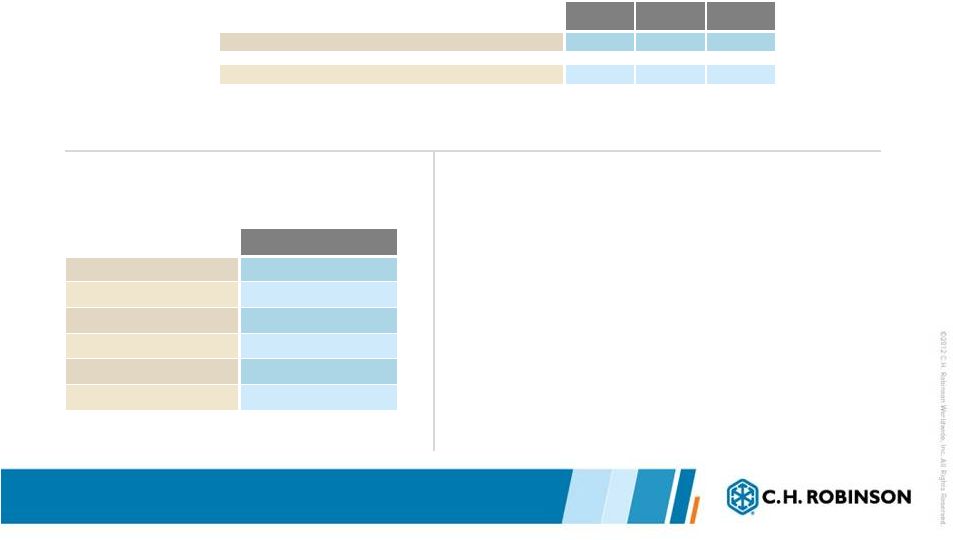
LTL Results Q3 2014
Three months ended Sept 30
LTL NET REVENUES in thousands
LTL
Year over year change
Total shipments increased approximately seven percent in the
third quarter when compared to the third quarter of 2013
LTL net revenue growth primarily driven by volume growth and
increased customer pricing partially offset by higher costs
Nine months ended Sept 30
Quarter
YTD
Volume
7%
7%
Pricing
Net revenue
margin
2014
2013
% Change
$67,968
$61,436
10.6%
2014
2013
% Change
$195,482
$180,638
8.2% |
 7
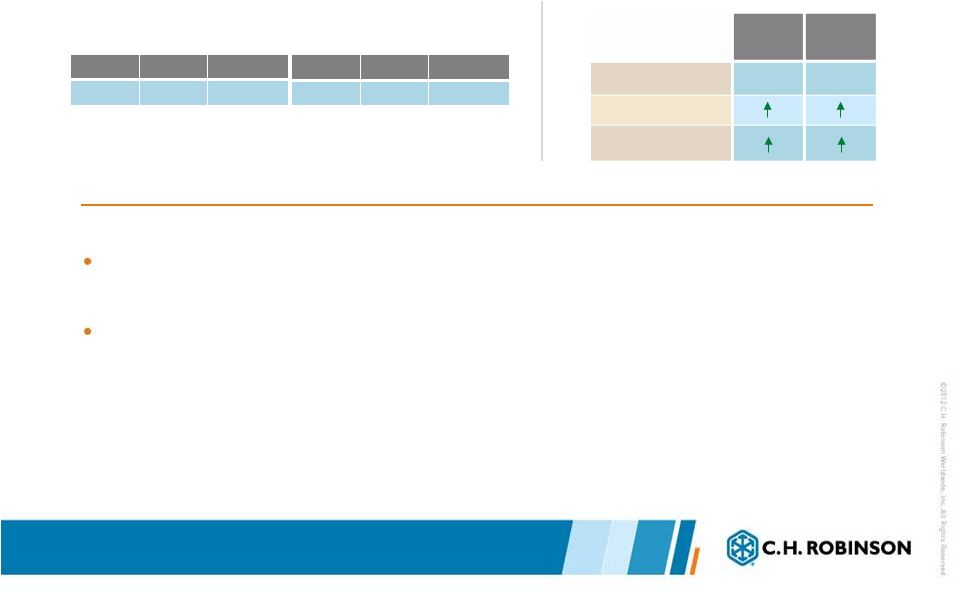
Intermodal Results Q3 2014
Net revenue growth was primarily driven by increased
operational efficiency and customer pricing
The Intermodal operating environment remains challenging as
rail service issues are ongoing
2014
2013
% Change
$10,593
$10,202
3.8%
Three months ended Sept 30
INTERMODAL NET REVENUES in thousands
Year over year change
2014
2013
% Change
$30,396
$29,223
4.0%
Nine months ended Sept 30
INTERMODAL
Quarter
YTD
Volume
0%
-1%
Pricing
Net revenue margin |
 8
Global Forwarding Results Q3 2014
Ocean, Air and Customs
2014
2013
% Change
Ocean
$57,380
$49,692
15.5%
Air
$20,520
$18,137
13.1%
Customs
$11,107
$8,932
24.4%
Three months ended Sept 30
NET REVENUES in thousands
OCEAN
AIR
Year over year change
Year over year change
Combined
Global
Forwarding
services
net
revenues
increased
16.0%
in
the
third quarter when compared to the third quarter of 2013
Global Forwarding net revenue growth was driven by margin expansion and
volume growth
Operational uniformity and cross selling initiatives are producing the intended
results
2014
2013
% Change
$151,478
$141,304
7.2%
$59,721
$55,107
8.4%
$30,751
$27,307
12.6%
Nine months ended Sept 30
YTD
Quarter
Volume
Pricing
Net revenue margin
Quarter
Volume
Pricing
Net revenue margin
YTD |
 9
Other Logistics Services Results Q3 2014
Other Logistics Services net revenues include transportation
management services, warehousing and small parcel
Transportation Management and Logistics Services, are
providing continued growth in Other Logistics Services
2014
2013
% Change
$19,043
$16,070
18.5%
Three months ended Sept 30
NET REVENUES in thousands
2014
2013
% Change
$54,816
$50,348
8.9%
Nine months ended Sept 30 |
 10
Sourcing Results Q3 2014
Net revenue margin improvement to levels in line with historic
ranges
Declines in the business of one large customer offset the overall net
revenue margin increase for the total service line
2014
2013
% Change
Total revenues
$393,980
$432,373
-8.9%
Total net revenues
$29,801
$30,553
-2.5%
Net revenue margin
7.6%
7.1%
7.0%
Three months ended Sept 30
SOURCING NET REVENUES in thousands
2014
2013
% Change
$1,190,604
$1,287,036
-7.5%
$91,541
$101,151
-9.5%
7.7%
7.9%
-2.2%
Nine months ended Sept 30 |
 11
in thousands
Summarized Income Statement
•
Growth in personnel expense primarily the result of our variable
compensation plans that are driven by changes in net revenue
and profitability
•
Average headcount was up approximately 1.6 percent when
compared to the third quarter of 2013
•
SG&A expenses decreased 3.6 percent when compared to the
third quarter of 2013 primarily driven by reduced travel and claims
expenses
Three months ended September 30
2014
2013
% Change
Total revenues
$3,467,362
$3,316,665
4.5%
Total net revenues
527,564
463,306
13.9%
Personnel expenses
244,621
204,388
19.7%
Selling, general & admin
79,606
82,563
-3.6%
Total operating expenses
324,227
286,951
13.0%
Income from operations
$203,337
$176,355
15.3%
Percent of net revenue
38.5%
38.1%
1.3%
2014
2013
% Change
$10,112,865
$9,599,194
5.4%
1,505,836
1,391,630
8.2%
703,904
623,042
13.0%
241,242
241,051
0.1%
945,146
864,093
9.4%
$560,690
$527,537
6.3%
37.2%
37.9%
-1.8%
Nine months ended September 30 |
 12
Three months ended Sept 30
Sept 30, 2014
Cash & investments
$127,716
Current assets
$1,824,716
Total assets
$2,941,784
Debt
$845,000
Current liabilities
$1,329,202
Stockholders’
investment
$1,018,717
CASH FLOW DATA
BALANCE SHEET DATA
Other Financial Information
in thousands
•
Strong cash flow quarter
•
Total debt balance $845 million
•
$500 million, 4.28% average coupon
•
$345 million drawn on revolver,
1.65% current rate
2014
2013
% Change
Net cash provided by operating activities
$176,954
$124,658
42.0%
Capital expenditures, net
$6,312
$11,659
-45.9% |
 13
in thousands
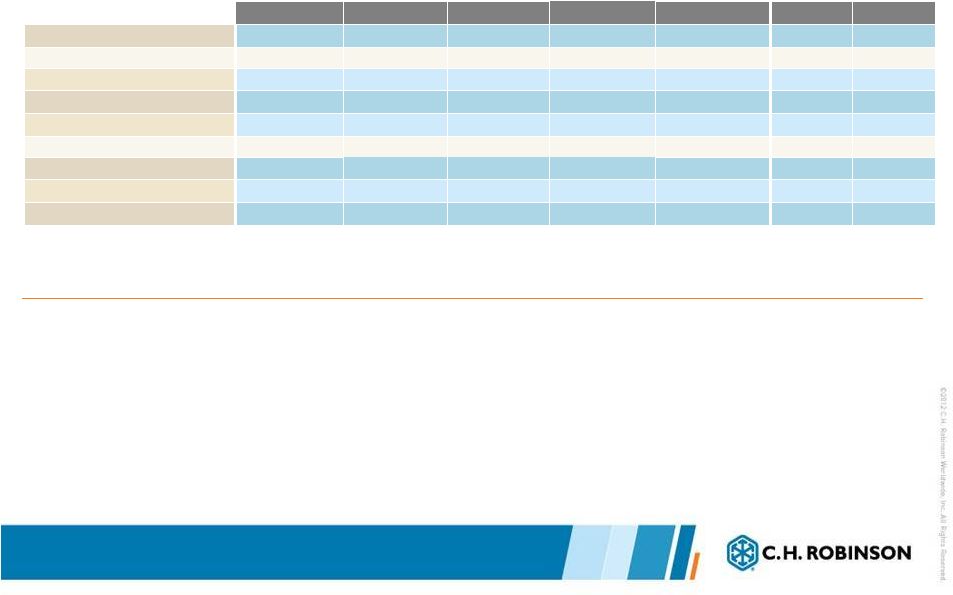
Capital Distribution
•
Capital returned to shareholders during the quarter
•
$52.7 million cash dividend
•
$76.8 million in cash for repurchase activity
•
1,127,100 shares
•
Average price $66.36 of shares repurchased
•
Target is to return approximately 90% of net income to shareholders
annually
2009
2010
2011
2012 (a)
2013
Q3 2014
YTD 2014
Net income
$360,830
$387,026
$431,612
$447,007
$415,904
$124,981
$336,764
Capital distribution
Cash dividends paid
$162,865
$168,902
$194,697
$219,313
$220,257
$52,681
$157,590
Share repurchases
266,906
157,381
250,274
255,849
807,449 (b)
76,762
136,919
Subtotal
$429,771
$326,283
$444,971
$475,162
$1,027,706
$129,443
$294,509
Percent of net income
Cash dividends paid
45%
44%
45%
49%
53%
42%
47%
Open market share repurchases
74%
41%
58%
57%
194%
61%
41%
Subtotal
119%
84%
103%
106%
247%
104%
87%
(a) 2012 Net Income is adjusted to excluded transaction related gains and expenses. A
reconciliation of adjusted results (b) Includes a $500 million accelerated share
repurchase. appears in Appendix A. 2012 Dividends exclude the fifth dividend payment
made during the year. |
 14
A look ahead
The long term growth targets presented at the Investor
Day, November 2013 outline our revenue and
earnings targets
We continue to execute on our long term growth
strategies and initiatives focused on balanced growth
North American Truckload net revenue growth in
October has increased approximately 13% per
business day when compared to October 2013
We will invest in additional talent in 2015 and beyond
|
 15
Appendix A: 2012 Summarized Adjusted Income Statement
In thousands, except per share amounts
Twelve months ended December 31, 2012
1)
T-Chek. The balance consists of transaction related bonuses.
2)
a)
Investment banking fees related to the acquisition of Phoenix
b)
External legal and accounting fees related to the acquisitions of Apreo and
Phoenix and the divestiture of T-Chek. 3)
The adjustment to investment and other income reflects the gain from the
divestiture of T-Chek. 4)
The adjustment to diluted weighted average shares outstanding relates to the
shares of C.H. Robinson stock issued as consideration paid to the sellers
in the acquisition of Phoenix. 5)
The adjustment to diluted weighted average shares outstanding relates to the
additional vesting of performance-based restricted stock as a result of
the gain on sale recognized from the divestiture of T-Chek.
2012 Actual
Non-recurring
Acquisition Impacts
Non-recurring
Divestiture Impacts
Adjusted
Total net revenues
$1,717,571
$1,717,571
Personnel expenses (1)
766,006
-385
-34,207
731,414
Other operating expenses (2)
276,245
-10,225
-379
265,641
Total operating expenses
1,042,251
-10,610
-34,586
997,055
Income from operations
675,320
10,610
34,586
720,516
Investment & other income (3)
283,142
-281,551
1,591
Income before taxes
958,462
10,610
-246,965
722,107
Provision for income taxes
364,658
2,745
-92,303
275,100
Net income
$593,804
7,865
-$154,662
$447,007
Net income per share (diluted)
3.67
2.76
Weighted average shares (diluted)
161,946
185 (4)
92 (5)
161,669
To assist investors in understanding our financial performance, we supplement the
financial results that are generated in accordance with the accounting
principles generally accepted in the United States, or GAAP, with non-GAAP financial measures, including non-GAAP operating expenses,
non-GAAP income from operations, non-GAAP net income and non-GAAP
diluted net income per share. We believe that these non-GAAP measures
provide meaningful insight into our operating performance excluding certain
event-specific charges, and provide an alternative perspective of our results
of operations. We use non-GAAP measures to assess our operating performance for
the quarter. Management believes that these non-GAAP financial measures
reflect an additional way of analyzing aspects of our ongoing operations that, when viewed with our GAAP results, provides a more complete
understanding of the factors and trends affecting our business.
The adjustments to other operating expenses reflect fees paid to third parties for: The adjustment to personnel consists of $33 million
of incremental vesting expense of our equity awards triggered by the gain on the divestiture of |
 |