Attached files
| file | filename |
|---|---|
| EX-99.1 - EX-99.1 - IBERIABANK CORP | d809008dex991.htm |
| EX-2.1 - EX-2.1 - IBERIABANK CORP | d809008dex21.htm |
| 8-K - 8-K - IBERIABANK CORP | d809008d8k.htm |
 Acquisition of Old Florida Bancshares, Inc.
October 27, 2014
Exhibit 99.2 |
| Safe
Harbor And Legend 2
Statements contained in this presentation which are not historical facts and which pertain to
future operating results of IBERIABANK Corporation and its subsidiaries constitute
“forward- looking statements” within the meaning of the Private Securities
Litigation Reform Act of 1995. These forward-looking statements involve significant risks and
uncertainties. Actual results may differ materially from the results discussed in these
forward-looking statements. Factors that might cause such a difference include, but are not
limited to, those discussed in IBERIABANK Corporation’s periodic filings with the
SEC.
In connection with the proposed merger, IBERIABANK Corporation will file a Registration
Statement on Form S-4 that will contain a proxy statement / prospectus. INVESTORS AND
SECURITY HOLDERS ARE URGED TO CAREFULLY READ THE PROXY STATEMENT /
PROSPECTUS REGARDING THE PROPOSED TRANSACTION WHEN IT BECOMES AVAILABLE,
BECAUSE IT WILL CONTAIN IMPORTANT INFORMATION. Investors and security holders may
obtain a free copy of the proxy statement / prospectus (when it is available) and other documents
containing information about the transaction with Old Florida Bancshares, Inc., and the pending
merger with Florida Bank Group, Inc. without charge, at the SEC’s website at http://www.sec.gov.
Copies of the proxy statement / prospectus and the SEC filings that will be incorporated by
reference in the proxy statement / prospectus may also be obtained for free from the
IBERIABANK Corporation website, www.iberiabank.com, under the heading “Investor
Information”. This
communication is not a solicitation of any vote or approval, is not an offer to purchase shares
of Old Florida Bancshares, Inc. common stock, nor is it an offer to sell shares of IBERIABANK
Corporation common stock which may be issued in any proposed merger with Old Florida Bancshares,
Inc. The issuance of IBERIABANK Corporation common stock in any proposed merger with Old
Florida Bancshares, Inc. would have to be registered under the Securities Act of 1933, as amended
(the “Act”), and such IBERIABANK Corporation common stock would be offered only by
means of a prospectus complying with the Act. |
 Compelling
Strategic
Rationale
Transaction Rationale
•
New market acquisition of an Orlando, Florida-based commercial bank
•
Largest community bank in the Orlando MSA
•
Established and complementary customer profile
•
Strong core deposit franchise with $1.2 billion in low-cost deposits
•
14 bank offices located in Florida –
12 offices in the Orlando area and
two offices approximately 70 miles north of Tampa
•
Emphasis on small to mid-market C&I / owner-occupied CRE with $1.1
billion in gross loans
•
Adds approximately $1.4 billion in total assets
•
Approximately 2% accretive to EPS in 2016 and 3% accretive in 2017
•
Tangible book value dilution of approximately 2% at consummation
•
Tangible book value breakeven, including one-time acquisition and
conversion related costs, in less than four years
•
Transaction has neutral impact on capital ratios
•
Anticipate internal rate of return in excess of 20%
•
Comprehensive due diligence completed, including credit review
•
Strong credit / underwriting culture and excellent asset quality
•
Limited loss content expected (1.2% of gross loans on a par basis)
•
Conversion and integration experience reduces integration risk
Financially
Attractive
Low Risk
3 |
 Notes:
(1)
The agreement provides for a fixed exchange ratio with pricing collars that fix the
value received by Old Florida’s shareholders if the weighted average trading price of
IBERIABANK
Corporation’s
common
stock
were
to
decline
below
$57.31
per
share,
or
exceed
$70.05
per
share,
over
a
specified
period
(2)
Assumes
common
and
preferred
converted
shares
and
no
exercise
of
options
outstanding
(3)
Assumes all stock options outstanding are cashed out at consummation
4
4
4
4
4
4
Transaction Overview
•
Tax-free, stock-for-stock exchange
•
Fixed exchange ratio of 0.34 share of IBERIABANK common stock for
each Old Florida Bancshares, Inc. ("Old Florida") share within price
collars
and
floating
exchange
ratios
outside
collars
(1)
Consideration
Deal Value
Valuation
Multiples
Due Diligence
Required
Approvals
Timing
•
$238
million
for
total
equity
(2)
outstanding
based
on
IBERIABANK
Corporation’s closing price of $64.13 on October 24, 2014
•
$21.80
per
Old
Florida
common
share
outstanding
(2)
•
Estimated $21 million in cash liquidation value of all options
outstanding
(3)
•
Completed comprehensive due diligence
•
Old Florida shareholder approval
•
Customary regulatory approvals
•
Expected closing in first quarter of 2015
Shareholders’ Aggregate Value
Equity
(2)
Including Options
(3)
•
Price
/
Total
Book:
163%
178%
•
Price
/
Tangible
Book:
170%
185% |
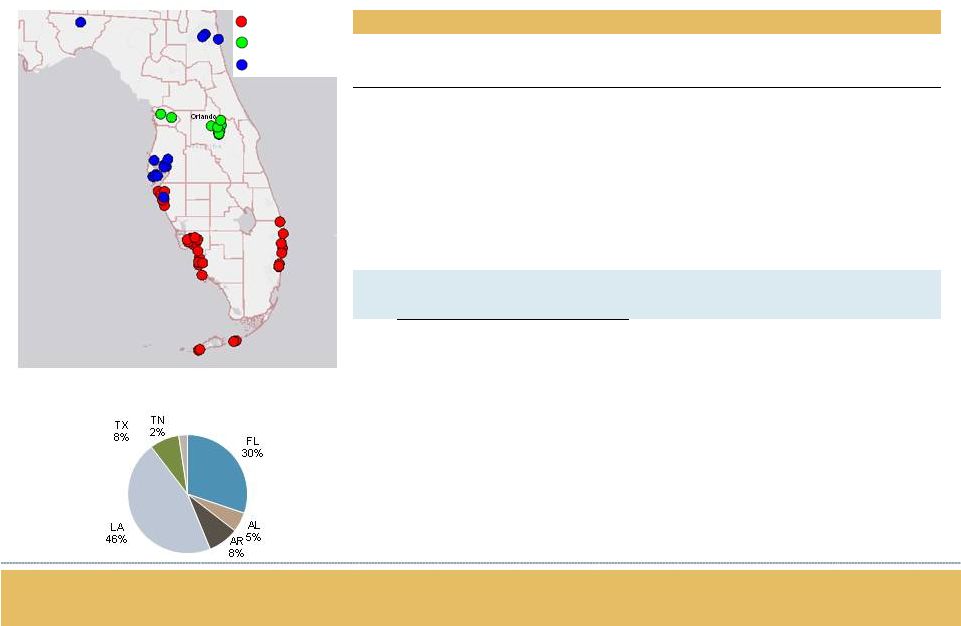 Solidifies our Florida Franchise
IBERIABANK
Old Florida
Florida Bank Group
Pro Forma Diversification (Deposits)
Florida Market Share & Rankings
Rank in Top 6 markets
2014
Rank
Institution
Branch
Deposits
($mm)
Market
Share
Miami
Tampa
Orlando
J'Ville
Sara-
sota
Fort
Myers
1
Bank of America
602
85,310
18.91
2
1
2
1
1
2
2
Wells Fargo
652
71,336
15.81
1
2
3
3
2
1
3
SunTrust
506
43,769
9.70
5
3
1
5
3
3
4
JPMorgan Chase
388
21,621
4.79
4
7
4
23
6
8
5
Regions
363
19,102
4.23
12
4
6
6
7
11
6
BB&T
326
15,773
3.50
7
6
7
7
4
5
7
Citigroup
56
15,201
3.37
3
-
-
34
-
-
8
EverBank
14
13,959
3.09
31
21
-
2
-
15
9
BankUnited
103
10,876
2.41
6
17
31
-
13
14
10
Toronto-Dominion
166
10,355
2.30
10
11
11
8
-
-
16
Pro Forma
IBERIABANK
78
4,248
0.85
41
22
8
26
8
7
21
IBERIABANK
(1)
64
3,042
0.58
41
22
-
26
8
7
Total for Institutions in
Market
5,441
451,131
•
IBERIABANK Corporation will have a meaningful presence in the
six largest MSAs in the state of Florida
•
Pro
forma
ranks
#16
in
the
state
of
Florida
with
$4.3
billion
in
total
deposits and 78 branches
•
Florida is the fourth largest state in the nation as measured by
both population and gross state product
5
Miami
Tampa
Orlando
Jacksonville
Sarasota
Fort Myers
Source: SNL Financial as of June 30, 2014 Regulatory Data
(1)
IBERIABANK is pro forma for acquisition of Florida Bank Group, Inc. announced in
October 2014 |
 6
6
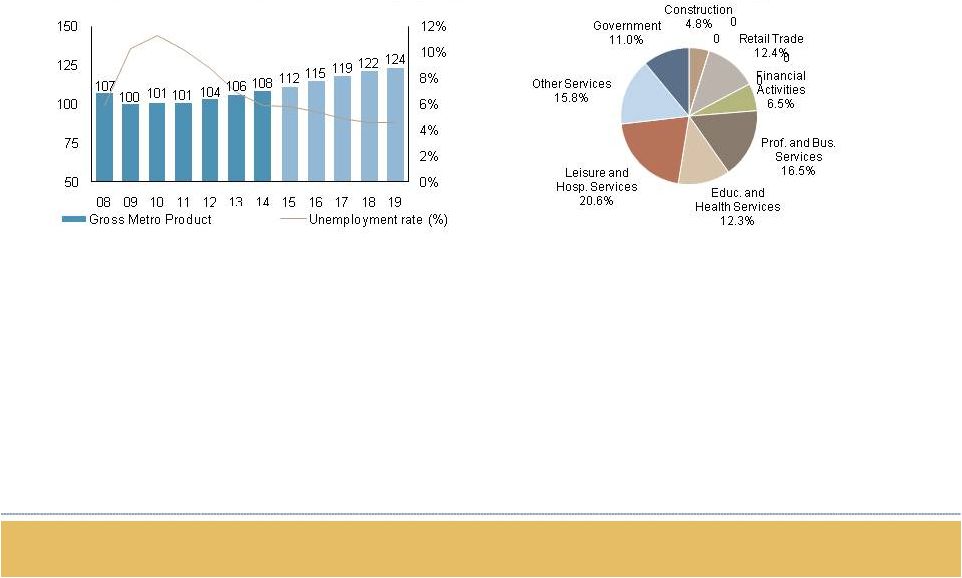
Orlando Market Highlights
Growing Metro Product with Falling Unemployment
•
Large and stable economy with a favorable growth forecast
•
Orlando MSA has current population of 2.3 million people with projected growth of
7.5% over the next five years
•
Strong job creation has led to net migration into the area, while keeping the
unemployment rate below 6% in 2014
•
New home permit issuance at 1.6% of the existing housing stock, about twice the
national average •
Deep and sophisticated C&I client base across a diversified array of
industries Diversified Economy
Source: SNL Financial as of June 30, 2014; Moody's Analytics indexed to 100 in
2009 |
 7
7
Franchise Highlights
Medical District -
South Orlando
–
918 South Orange Ave
Orlando, $111.7 mm
Lake Mary –
7090 CR 46A
Lake Mary, $40.0 mm
Apopka –
1420 W Orange Blossom Trail
Apopka, $36.9 mm
Source: SNL Financial as of June 30, 2014
(1)
SNL ranking $500 million to $5 billion in assets in 2013
•
In a market dominated by money center banks and
super-regionals, Old Florida is the largest local player
in terms of branches and deposit share
•
Old Florida's main office and 11 bank branches
in the Orlando area
•
Two branches in Citrus County, Florida,
expanding from the Tampa footprint
•
Strong core deposit franchise concentrated in
Orlando market
•
Total deposits of $1.1 billion in market
•
Average deposits per branch of $94 million
•
Cost of deposits of approximately 0.29%
•
High quality, experienced management team and
board of directors with strong local connectivity
•
Favorable commercial lending platforms, including
attractive niche specialty finance businesses
•
Top 100 best performing bank in the nation, two
years
in
a
row
(1) |
 8
8
Specialty Businesses
•
Mercantile Capital Corporation established in
2002
•
Acquired by Old Florida Bancshares, Inc. in
2010 and is a wholly-owned subsidiary of the
bank.
•
Provides structuring, SBA qualification,
underwriting and closing services to
borrowers
•
Provides short-term, interim first and second
mortgage loans that are typically paid off by
permanent first mortgage lender and SBA
debenture funding
•
Focus is on 504 lending and not 7(a) financing
•
30% of loans are in Florida
•
Approximately $45 million in book balances
•
In the 12 years of existence, MCC had only
one troubled loan
•
63% of portfolio is in Florida, 21% in Georgia,
6% in South Carolina, 3% in Mississippi, and
7% in other states
•
Entire portfolio is made up of loans (does not
provide lease financing)
•
Focus is on heavy, income producing
equipment –
where a rental value or specific
value in fulfilling a contract can be calculated
•
Industry concentration on logging and
excavation equipment
•
Loan portfolio is approximately $78 million
•
Typical deal size is less than $500,000 and
the maximum loan term is five years
SBA 504 Lending
Equipment Finance Business |
 9
9
Presence in Florida's Six-Largest MSAs
Source: SNL Financial as of June 30, 2014 Regulatory Data
IBERIABANK pro forma for pending acquisition of Florida Bank Group, Inc. and Old
Florida Bancshares, Inc. Miami –
Fort Lauderdale –
West Palm Beach
Rank
Institution
Branches
Deposits ($mm)
Market Share
1
Wells Fargo
204
31,326
16.76
2
Bank of America
199
28,896
15.46
3
Citigroup
55
15,184
8.12
4
JPMorgan Chase
185
14,143
7.56
5
SunTrust
102
11,317
6.05
6
BankUnited
69
8,837
4.73
7
BB&T
114
6,248
3.34
8
Mercantil Servicios
16
5,677
3.04
9
HSBC
17
5,309
2.84
10
Toronto
-
Dominion
71
5,301
2.84
41
IBERIABANK
8
404
0.22
Total in Market
1,665
175,835
North Port –
Sarasota –
Bradenton
Rank
Institution
Branches
Deposits ($mm)
Market Share
1
Bank of America
35
3,223
18.88
2
Wells Fargo
30
2,586
15.15
3
SunTrust
31
1,959
11.47
4
BB&T
20
1,189
6.97
5
Fifth Third
16
787
4.61
6
JPMorgan Chase
19
775
4.54
7
Regions
16
513
3.01
8
IBERIABANK
9
480
2.81
9
Bank of Montreal
11
480
2.81
10
PNC
10
372
2.18
Total in Market
300
17,072
Orlando –
Kissimmee -
Sanford
Rank
Institution
Branches
Deposits ($mm)
Market Share
1
SunTrust
64
9,490
23.34
2
Bank of America
63
8,381
20.61
3
Wells Fargo
55
6,817
16.76
4
JPMorgan Chase
53
2,589
6.37
5
Fifth Third
40
1,668
4.1
6
Regions
47
1,660
4.08
7
BB&T
40
1,578
3.88
8
IBERIABANK
12
1,129
2.78
9
PNC
23
628
1.54
10
Three Shores
4
547
1.35
Total in Market
579
40,664
Tampa –
St. Petersburg –
Clearwater
Rank
Institution
Branches
Deposits ($mm)
Market Share
1
Bank of America
93
10,855
19.64
2
Wells Fargo
87
9,715
17.57
3
SunTrust
95
7,725
13.97
4
Regions
79
5,878
10.63
5
Fifth Third
44
2,795
5.06
6
BB&T
48
2,539
4.59
7
JPMorgan Chase
55
1,650
2.98
8
USAmeriBancorp
13
1,547
2.8
9
Tampa Bay
10
1,210
2.19
10
TFS Financial
5
1,080
1.95
22
IBERIABANK
8
289
0.52
Total in Market
764
55,282
Cape Coral –
Fort Myers
Rank
Institution
Branches
Deposits ($mm)
Market Share
1
Wells Fargo
34
2,123
16.59
2
Bank of America
28
1,854
14.48
3
SunTrust
24
1,715
13.4
4
Fifth Third
18
1,114
8.7
5
BB&T
20
844
6.59
6
FineMark
3
520
4.06
7
IBERIABANK
10
439
3.43
8
JPMorgan Chase
11
373
2.91
9
Northern Trust
3
351
2.74
10
FCB
4
328
2.56
Total in Market
224
12,800
Jacksonville
Rank
Institution
Branches
Deposits ($mm)
Market Share
1
Bank of America
35
20,751
42.05
2
EverBank
6
12,303
24.93
3
Wells Fargo
63
5,973
12.1
4
BBVA
25
1,934
3.92
5
SunTrust
27
1,811
3.67
6
Regions
24
1,246
2.53
7
BB&T
14
557
1.13
8
Toronto
-Dominion
7
544
1.1
9
Ameris
10
470
0.95
10
Jacksonville
9
423
0.86
26
IBERIABANK
3
72
0.14
Total in Market
321
49,353 |
 10
10
10
10
10
10
•
Approximately 80 people involved in due
diligence process; credit team included 27
associates performing both on-site credit file and
off-site credit portfolio reviews
•
Reviewed 98% of outstanding loan balances
and nearly 98% of total number of loans
•
Approximately 60% of outstanding loan
balances were reviewed on-site with the
remainder analyzed by off-site portfolio review
Total Loans: $1.1 billion
Yield on Loans:
5.17%
Credit Summary
Diligence Scope
Loan Portfolio Comments
Loan Portfolio Composition
Source: Financial data as of September 30, 2014
•
Majority are in-market loans
•
Primarily focused on commercial lending
•
Good asset quality metrics:
•
Non-performing assets /Assets = 0.98%
•
Non-performing loans/Loans = 0.74%
•
Credit mark of approximately $13.1 million on a
pre-tax par basis ($5.6 million on a pre-tax book
basis)
•
Allowance for loan losses of $10.0 million |
 11
11
11
11
11
11
Merger Considerations
•
No corporate or bank board seats
•
Old Florida board members
invited to form the nucleus of
IBERIABANK Corporation’s
Central Florida Advisory Board
•
Two employment contracts
•
Savings equate to approximately
30% compared to Old Florida’s
total expenses
•
No office consolidations
anticipated
Approximately $22 million in pre-tax
costs:
•
$3.6 million in change of control contracts
•
$3.6 million in severance/retention payments
•
$3.2 million in contract terminations
•
$2.8 million in lease terminations
•
$1.3 million in system conversions
•
$0.6 million in marketing/communications
•
$6.5 million in other merger-related expense
Costs & Synergies
Merger-Related Costs |
 12
12
12
12
12
12
Conservative
Financial
Assumptions
Cost Savings:
Merger Related Costs:
•
Gross loss estimate of $13.1 million on a pre-tax par
basis, or $5.6 million on a pre-tax book basis
•
Current allowance for loan losses of $10.0 million
•
Approximately $22 million on a pre-tax basis
Credit Mark:
Other Marks:
•
Aggregate negative $3.0 in other marks including
securities portfolio, loan rate, OREO, fixed assets
Financial Assumptions & Impact
Attractive
Financial
Impact
Notes:
(1)
Pro forma capital ratios include pending Florida Bank Group, Inc. transaction
•
Approximately 2% accretive to EPS in 2016 and 3% accretive in 2017
•
Tangible book value dilution of approximately 2% at consummation
•
Tangible book value breakeven, including one-time acquisition and
conversion related costs, of under four years
•
Strong pro forma capital ratios
(1)
:
•
Tangible common equity ratio = 8.5%
•
Total risk based capital ratio = 12.3%
•
Internal rate of return over 20%; well in excess of our cost of capital
Annual run-rate cost savings of approximately $9
million on a pre-tax basis
Represents approximately of 30% of Old Florida’s
run-rate 2014 non-interest expenses
Expect run-rate savings to be achieved within
six months of closing |
 Appendix |
 14
14
14
14
14
14
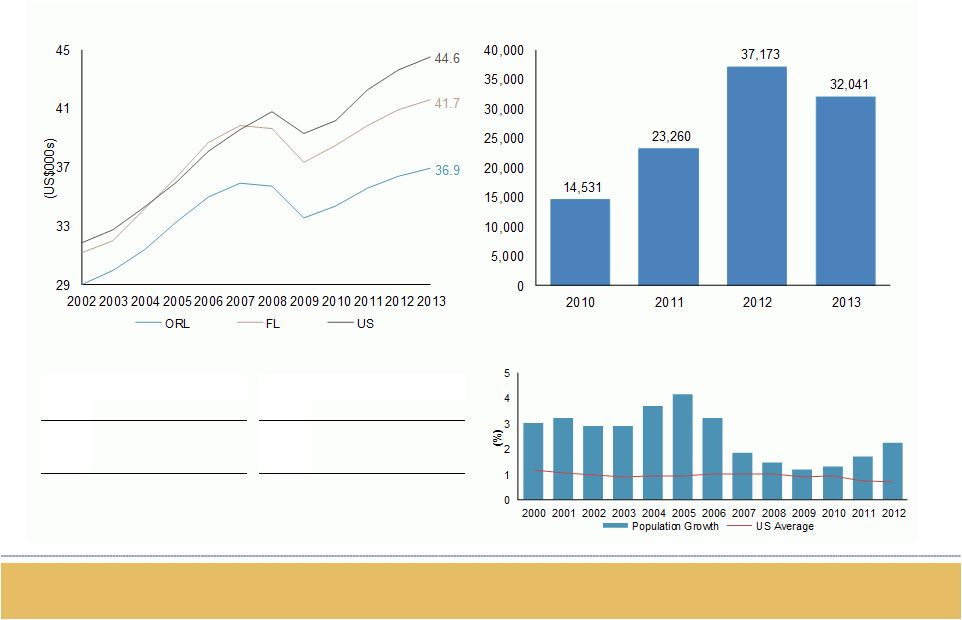
Orlando Marketplace
2008
2009
2010
2011
2012
2013
INDICATORS
2014
2015
2016
2017
2018
2019
107.2
100.4
100.6
101.1
103.5
106.0
Gross metro product
108.3
111.8
115.3
118.7
121.5
123.9
(2.3)
(6.4)
0.2
0.6
2.3
2.4
% change
2.2
3.2
3.2
2.9
2.4
2.0
1,064.7
997.5
992.3
1,005.6
1,031.9
1,065.0
Total employment (000s)
1,099.6
1,133.3
1,173.5
1,208.2
1,233.5
1,256.3
(1.7)
(6.3)
(0.5)
1.3
2.6
3.2
%change
3.2
3.1
3.6
3.0
2.1
1.8
5.9
10.3
11.3
10.2
8.7
6.9
Unemployment rate (%)
5.9
5.8
5.4
4.9
4.6
4.6
1.2
(5.1)
3.9
4.7
5.0
3.3
Personal income growth (%)
5.9
7.9
8.1
7.4
6.3
5.6
50.6
47.1
46.6
46.1
46.8
47.9
Median household income ($000s)
49.3
51.2
53.2
55.1
56.8
58.2
2,087.5
2,111.9
2,139.4
2,174.2
2,223.5
2,267.8
Population (000s)
2,314.6
2,368.6
2,429.5
2,496.6
2,566.5
2,638.1
1.4
1.2
7.3
7.6
2.3
2.0
% change
2.1
2.3
2.6
2.8
2.8
2.8
14.6
10.0
14.5
23.3
37.2
32.0
Net migration (000s)
35.0
42.2
49.0
55.1
57.9
59.5
5,280
3,707
4,221
4.533
7,322
9.222
Single-family permits (#)
8,539
13,607
19,681
21,088
19,968
19,565
4,953
780
1,033
1,972
4,684
6,341
Multifamily permits (#)
7,565
9,417
11.217
10,549
10,141
10,161
211.2
150.4
134.6
125.3
133.7
161.2
Existing-home price ($000s)
181.3
188.3
194.1
197.1
200.4
205.8
One of the fastest-growing mature economies in the nation, forecasted to well
outpace the US average The area provides abundant jobs for both skilled and
unskilled labor, moderate living cost, strong housing demand and thriving
industries including healthcare and tourism Source: Moody’s Analytics as
of June 2014 |
 15
15
15
15
15
15
Orlando Demographics
Per Capita Income
High-Tech Employment
(000s)
% of Total
ORL
44.5
4.2
US
6,431.1
4.7
Housing-Related Employment
(000s)
% of Total
ORL
120.3
11.3
US
12,401.4
9.1
Job Specialization
Net Migration
Population Growth
Source:
Moody's
Analytics
as
of
June
2014;
Local
Market
Monitor
for
the
Orlando
MSA
as
of
October
2014 |
 16
16
16
16
16
16
Orlando Housing Market
•
House values expected to increase by 12% over the next year, above the national
average of 7.2% •
Historical foreclosures from the housing bubble still pull down house prices, as
those are sold further potential for increase in prices
Actual and Equilibrium Home Prices
Housing Permits
Home Price Change
Monthly Rent
Source: Local Market Monitor as of October 2014 |
 |