Attached files
| file | filename |
|---|---|
| EX-99.1 - EX-99.1 - CITIZENS FINANCIAL GROUP INC/RI | d809034dex991.htm |
| EX-99.3 - EX-99.3 - CITIZENS FINANCIAL GROUP INC/RI | d809034dex993.htm |
| 8-K - FORM 8-K - CITIZENS FINANCIAL GROUP INC/RI | d809034d8k.htm |
 3Q14
Financial Results October 27, 2014
Exhibit 99.2 |
 Forward-looking statements
1
Note: Percentage changes, per share amounts, and ratios presented in this document are
calculated using whole dollars. This document contains
forward-looking statements within the Private Securities Litigation Reform Act of 1995. Statements regarding potential future share repurchases and future
dividends are forward-looking statements. Also, any statement that does not describe
historical or current facts is a forward-looking statement. These statements often include the
words “believes,” “expects,” “anticipates,”
“estimates,” “intends,” “plans,” “goals,” “targets,” “initiatives,” “potentially,” “probably,” “projects,” “outlook” or similar expressions or
future conditional verbs such as “may,” “will,” “should,”
“would,” and “could.”
Forward-looking statements are based upon the current beliefs and expectations of
management, and on information currently available to management. Our statements speak as
of the date hereof, and we do not assume any obligation to update these statements or to
update the reasons why actual results could differ from those contained in such
statements in light of new information or future events. We caution you, therefore, against
relying on any of these forward-looking statements. They are neither statements of
historical fact nor guarantees or assurances of future performance. While there is no
assurance that any list of risks and uncertainties or risk factors is complete, important factors
that could cause actual results to differ materially from those in the forward-looking
statements include the following, without limitation:
•
negative economic conditions that adversely affect the general economy, housing prices, the
job market, consumer confidence and spending habits which may affect, among other
things, the level of nonperforming assets, charge-offs and provision expense;
•
the rate of growth in the economy and employment levels, as well as general business and
economic conditions; •
our ability to implement our strategic plan, including the cost savings and efficiency
components, and achieve our indicative performance targets;
•
our ability to remedy regulatory deficiencies and meet supervisory requirements and
expectations; •
liabilities resulting from litigation and regulatory investigations; •
our capital and liquidity requirements (including under regulatory capital standards, such as
the Basel III capital standards) and our ability to generate capital internally or raise
capital on favorable terms;
•
the effect of the current low interest rate environment or changes in interest rates on our
net interest income, net interest margin and our mortgage originations, mortgage
servicing rights and mortgages held for sale; •
changes in interest rates and market liquidity, as well as the magnitude of such changes,
which may reduce interest margins, impact funding sources and affect the ability to
originate and distribute financial products in the primary and secondary markets; •
the effect of changes in the level of checking or savings account deposits on our funding
costs and net interest margin;
•
financial services reform and other current, pending or future legislation or regulation that
could have a negative effect on our revenue and businesses, including the Dodd-
Frank Act and other legislation and regulation relating to bank products and services; •
a failure in or breach of our operational or security systems or infrastructure, or those of
our third party vendors or other service providers, including as a result of cyber
attacks;
•
management’s ability to identify and manage these and other risks; and •
any failure by us to successfully replicate or replace certain functions, systems and
infrastructure provided by The Royal Bank of Scotland Group plc (RBS).
In addition to the above factors, we also caution that the amount and timing of any future
common stock dividends will depend on our financial condition, earnings, cash needs,
regulatory constraints, capital requirements (including requirements of our subsidiaries), and
any other factors that our Board of Directors deems relevant in making such a
determination. Therefore, there can be no assurance that we will pay any dividends to holders
of our common stock, or as to the amount of any such dividends. In addition, the timing
and manner of the sale of RBS's remaining ownership of our common stock remains uncertain, and we have no control over the manner in which RBS may seek to divest
such remaining shares. Any such sale would impact the price of our shares of common stock.
More information about factors that could cause actual results to differ materially
from those described in the forward-looking statements can be found under “Risk Factors” in our
Registration Statement on Form S-1 filed with the United States Securities and Exchange
Commission and declared effective on September 23, 2014. |
 3Q14
highlights 2
Improving
profitability and
returns
GAAP EPS of $0.34; Adjusted EPS
1
of $0.36 up 38% from 3Q13
Adjusted ROTCE
1
of 6.2% vs. 4.3% in 3Q13
YoY average loan growth of 6% drives 6% growth in NII
Benefit of growth and efficiency initiatives driving underlying sequential quarter PPNR
improvement Strong capital,
liquidity, and
funding
Excellent credit
quality and
progress on risk
management
Driving growth
and efficiency
initiatives
Robust capital levels with a Tier 1 Common Equity Ratio of 12.9%
2
Period-end deposits increased $1.8 billion, or 2% vs. 2Q14; Loan-to-deposit ratio
remained stable at 97% Successfully executed remaining 2014 capital transactions;
repurchased 14.3 million shares in early 4Q14
Strong balance sheet supports targeted future loan growth
Continued strong credit quality with NPLs down 10% from 2Q14 and
NPL coverage of 111%
Net
charge-off
ratio
of
0.38%,
up
7
bps
from
7-year
record
low
2Q14
levels;
down
23
bps
from
3Q13
Allowance for loan and lease losses of 1.32%
Continued progress in Mortgage, Business Banking and Wealth hiring
Leveraging Auto and Student platforms; launched attractive student loan re-finance
product Commercial lending momentum continues, #5 middle market book runner rank in
3Q14 Expense initiatives implementation on track
Regulatory capital ratios are preliminary.
2
Adjusted results are non-GAAP items and exclude the effect of net restructuring charges
and special items associated with Chicago Divestiture, efficiency and effectiveness
programs and separation from RBS. See important information on use of Non-GAAP items on
pages 27-31. “Chicago Divestiture“ refers to the sale of the Chicago-area
Charter One branches, small business and select middle market relationships.
1 |
 3Q14 financial
summary – GAAP
3
1
Non-GAAP item. See important information on use of Non-GAAP items on pages 27-31.
2
Includes held for sale.
3
Return on average tangible common equity.
4
Return on average total tangible assets.
5
Full-time equivalent employees.
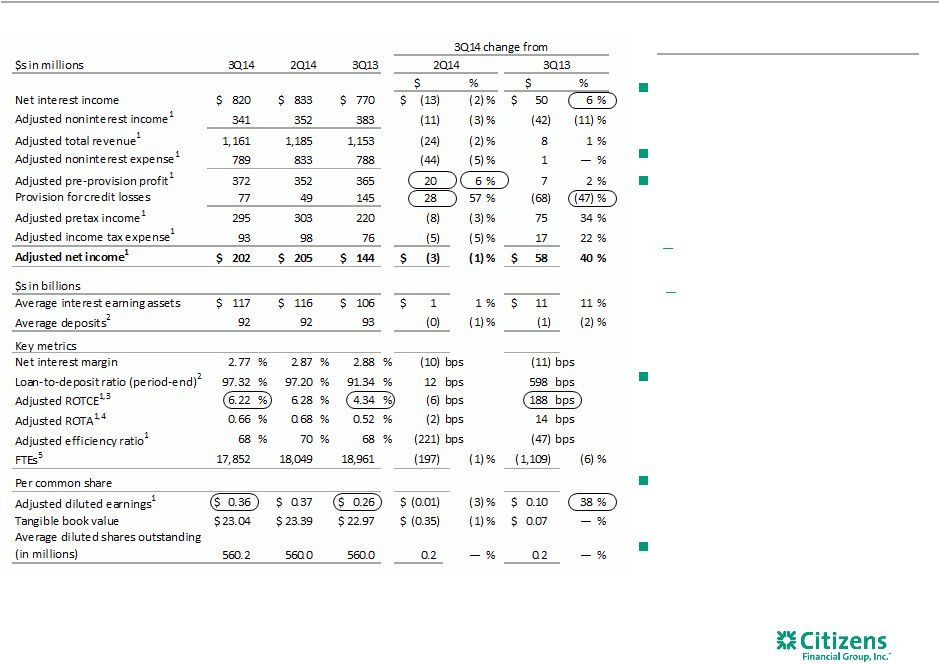
Linked Quarter:
Net income down 40% from 2Q14 which
included $108 million net benefit from
restructuring charges and special items
Net interest income down 2% as the benefit
of earning asset growth and one additional
business day in the quarter was more than
offset by effect of the Chicago Divestiture
and lower loan yields and deposit spreads
Chicago Divestiture reduced NII by an
estimated $13 million
Noninterest income down $299 million
driven by effect of 2Q14 Chicago
Divestiture net gain of $288 million
Chicago Divestiture reduced noninterest
income by an estimated $12 million
Expense management initiatives gaining
traction
Noninterest expense down $138
million; $94 million reduction in
restructuring charges and special items
Chicago Divestiture reduced noninterest
expense by an estimated $21 million
Prior Year Quarter:
Net income up 31%
NII up 6% from 3Q13
Provision lower by 47%
Highlights
3Q14 change from
$s in millions
3Q14
2Q14
3Q13
2Q14
3Q13
$
%
$
%
167
Net interest income
820
$
833
$
770
$
(13)
$
(2) %
50
$
6 %
168
Noninterest income
341
640
383
(299)
(47) %
(42)
(11) %
169
Total revenue
1,161
1,473
1,153
(312)
(21) %
8
1 %
170
Noninterest expense
810
948
788
(138)
(15) %
22
3 %
171
Pre-provision profit
351
525
365
(174)
(33) %
(14)
(4) %
172
Provision for credit losses
77
49
145
28
57 %
(68)
(47) %
173
Income before income tax expense
274
476
220
(202)
(42) %
54
25 %
174
Income tax expense
85
163
76
(78)
(48) %
9
12 %
175
Net income (loss)
189
$
313
$
144
$
(124)
$
(40) %
45
$
31 %
$s in billions
176
Average interest earning assets
117
$
116
$
106
$
1
$
1 %
11
$
11 %
177
Average deposits
2
92
92
93
(0)
(1) %
(1)
(2) %
Key metrics
178
Net interest margin
2.77
%
2.87
%
2.88
%
(10)
bps
(11)
bps
109
Loan-to-deposit ratio (period-end)
2
97.32
%
97.20
%
91.34
%
12
bps
598
bps
180
ROTCE
1,3
5.81
%
9.59
%
4.34
%
(378)
bps
147
bps
181
ROTA
1,4
0.61
%
1.04
%
0.52
%
(43)
bps
9
bps
182
Efficiency ratio
1
70
%
64
%
68
%
551
bps
135
bps
183
FTEs
5
17,852
18,049
18,961
(197)
(1) %
(1,109)
(6) %
Per common share
156
Diluted earnings
0.34
$
0.56
$
0.26
$
(0.22)
$
(39) %
0.08
$
31 %
157
Tangible book value
23.04
$
23.39
$
22.97
$
(0.35)
$
(1) %
0.07
$
—
%
158
Average diluted shares outstanding
(in millions)
560.2
560.0
560.0
0.2
—
%
0.2
—
% |
 Restructuring
charges and special items 4
3Q14 results included restructuring charges and special items related to enhancing efficiencies
and improving processes across the organization and separation from The Royal Bank of
Scotland Group plc (“RBS”). Expect to utilize the balance of the gain to
continue to reinvest to drive future growth, and to fund an additional $35-$45
million of further restructuring charges and special expense items in 4Q14, and $30-$40
million in 1H15. As of and for the three months ended
Restructuring charges and special items
($s in millions, except per share data)
pre-tax
after-tax
pre-tax
after-tax
pre-tax
after-tax
Noninterest income special items:
Other income
Net Gain on Chicago Divestiture
—
$
—
$
288
$
180
$
(288)
$
(180)
$
Total noninterest income special items
—
$
—
$
288
$
180
$
(288)
$
(180)
$
Noninterest expense restructuring charges and special items:
Salaries and employee benefits
Chicago Divestiture
—
$
—
$
3
$
2
$
(3)
$
(2)
$
Efficiency initiatives
—
—
40
25
(40)
(25)
Non-compensation expense
Chicago Divestiture
—
—
14
9
(14)
(9)
Efficiency initiatives
4
3
46
28
(42)
(25)
Separation / IPO related
2
1
6
4
(4)
(3)
Other
15
9
6
4
9
5
Total noninterest expense restructuring charges and special items
21
$
13
$
115
$
72
$
(94)
$
(59)
$
Net restructuring charges and special items
(21)
$
(13)
$
173
$
108
$
(194)
$
(121)
$
EPS impact
(0.02)
$
0.19
$
(0.21)
$
September 30, 2014
June 30, 2014
increase/decrease |
 Adjusted
3Q14
financial
summary
-
excluding
restructuring
charges
and
special
items
1
5
1
Non-GAAP item. Adjusted results exclude the effect of net restructuring charges and
special items associated with Chicago Divestiture, efficiency and effectiveness
programs and separation from RBS. See important information on use of Non-GAAP items on pages 27-31.
2
Includes held for sale.
3
Return on average tangible common equity.
4
Return on average total tangible assets.
5
Full-time equivalent employees.
Linked quarter:
Adjusted net income down $3 million
largely driven by effect of unusually low
2Q14 provision expense
Adjusted pre-provision profit up 6%
Adjusted revenue down $24 million
driven by an estimated $25 million
related to Chicago Divestiture
Adjusted NII stable excluding the
impact of the Chicago Divestiture
Adjusted noninterest income down
$11 million driven by effect of
Chicago Divestiture and 2Q14 loan
sale gain
Adjusted noninterest expense down $44
million, driven by an estimated $21
million from the Chicago Divestiture as
well as lower regulatory costs and
incentives expense
Adjusted efficiency ratio improved 221
bps
Prior Year Quarter:
Net income up $58 million reflecting
positive operating leverage and a $68
million reduction in provision expense
Highlights |
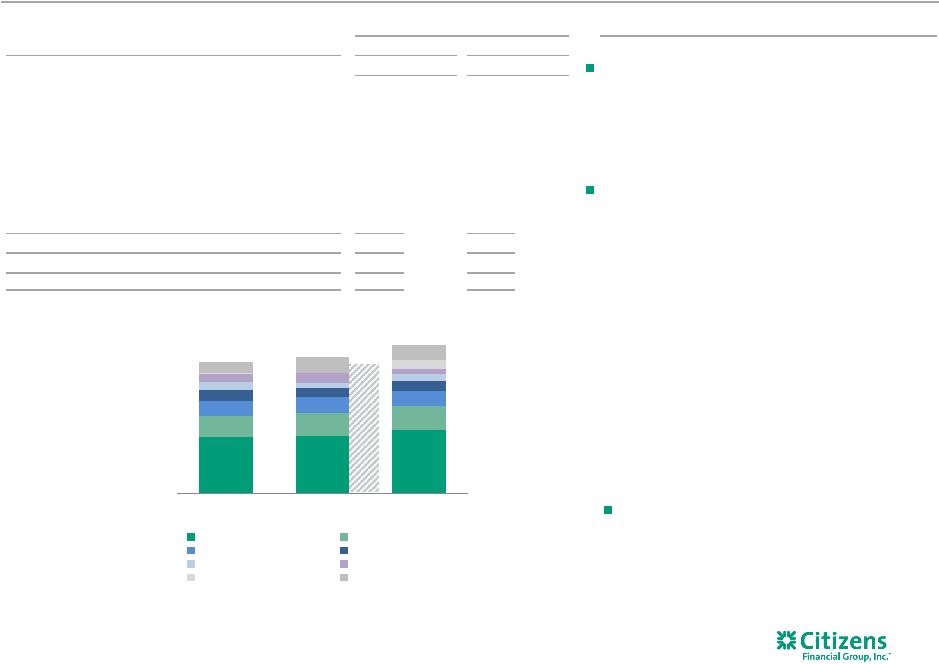
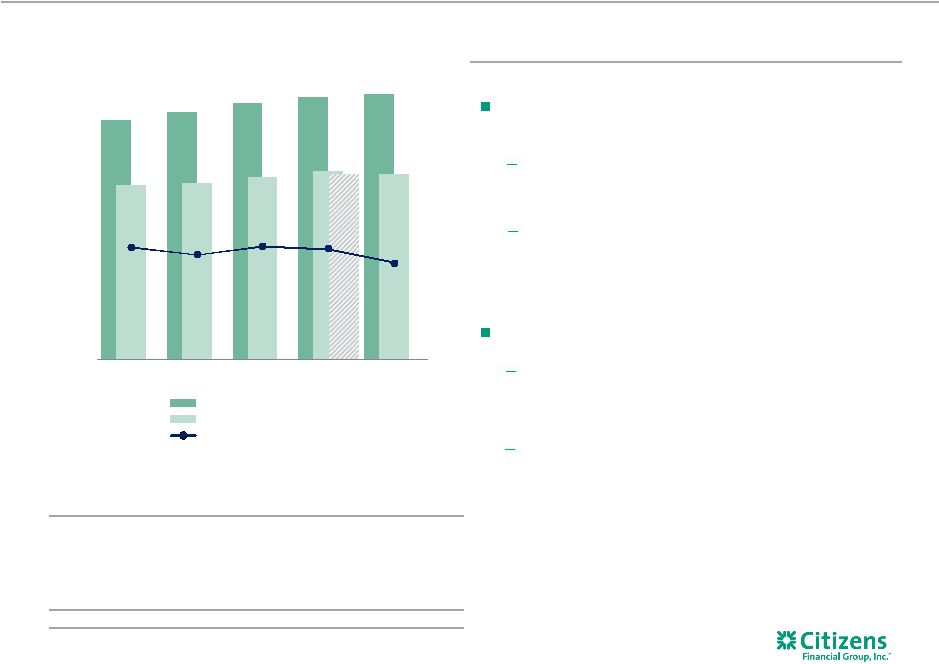 $106B
$109B
$113B
$116B
$117B
$770
$779
$808
$833
$820
3Q13
4Q13
1Q14
2Q14
3Q14
$s in billions
3Q13
4Q13
1Q14
2Q14
3Q14
210
Retail Loans
$46.0
$46.3
$46.4
$47.5
$48.5
211
Commercial Loans
38.5
39.5
39.7
40.5
41.2
212
Investments and interest
bearing deposits
21.0
22.9
25.2
26.8
27.3
213
Loans held for sale¹
0.4
0.3
1.2
1.2
0.2
214
Total interest-earning assets
$105.9
$109.0
$112.5
$116.0
$117.2
Net interest income
Linked quarter:
NII down $13 million driven by the effect of Chicago
Divestiture and higher 2Q14 loan recoveries
Estimated $13 million decrease related to Chicago
Divestiture and $7 million decrease related to 2Q14
commercial loan interest recoveries
Excluding the above decreases, NII growth of $7 million
reflects the benefit of a 2% increase in earning assets,
deposit growth, a reduction in pay-fixed swap costs and
one additional business day in the quarter
NIM decreased 10 bps to 2.77%
2Q14 included an estimated 4 bps benefit related to
the Chicago Divestiture and commercial loan interest
recoveries related to prior period charge-offs
Remaining 6 bps decrease largely reflects effect of the
relatively persistent low-rate environment, spread
compression in Commercial and issuance of sub-debt
partially offset by the benefit of lower pay-fixed swap
costs
6
Highlights
Net interest income
$s in millions
Average interest-earning assets
Average interest earning assets
Net interest income
Net interest margin
2.88%
2.83%
2.89%
2.87%
2.77%
$820
2
1
1Q14 and 2Q14 include other loans held for sale associated with Chicago Divestiture. 2
Represents estimated underlying net interest income adjusted for the effect of
Chicago Divestiture. |
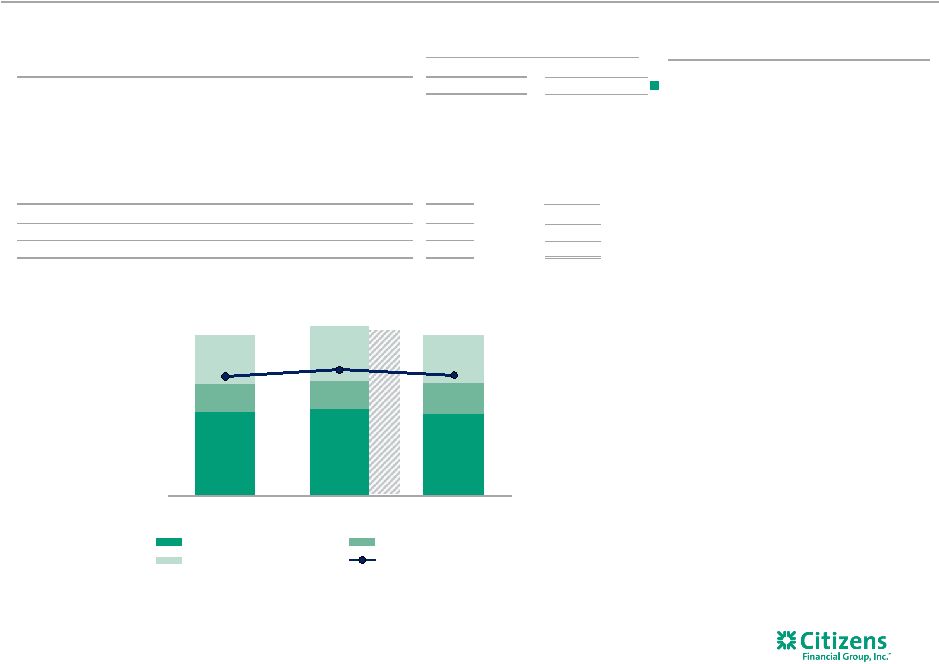
 $341
$352
$383
3Q14
2Q14
3Q13
Service charges and fees
Card fees
Trust and inv services
FX & trade finance fees
Mortgage banking fees
Capital markets fee income
Securities gains (losses)
Other income
Adjusted noninterest income –
excluding special items
Linked quarter:
Adjusted noninterest income down $11 million from
higher 2Q14 which included:
—
Estimated $12 million associated with Chicago
Divestiture including $6 million in service charges and
fees/$3 million card fees
—
$9 million gain on sale of student loans
Excluding these items, Adjusted noninterest income
was up around $10 million.
—
Underlying service charge growth reflecting
seasonality and the benefit of checking account
growth
—
Card fees were flat excluding the impact of the
Chicago Divestiture
—
Mortgage fees up $7 million reflecting the benefit of
MSR recapture as well as higher volume from growth
initiatives
—
Foreign exchange and trade finance fees up $4
million driven by improved cross-sell and market
conditions
—
Leasing and capital markets fees down from strong
2Q14
Prior year quarter:
Adjusted noninterest income down $42 million from
3Q13 as strength in capital markets was more than
offset by a $31 million decrease in securities gains
and other income, and lower service charges driven
by check-posting order changes
7
Highlights
1
Non-GAAP item. Adjusted results exclude the effect of net restructuring charges and
special items associated with Chicago Divestiture, efficiency and effectiveness
programs and separation from RBS. See important information on use of Non-GAAP items on pages 27-31.
2
Other income includes interest rate product fees, leasing income, bank owned life insurance,
and other income. 3
Non-GAAP item. Excludes impact of $288 million gain from Chicago Divestiture.
4
Excluding estimated impact of Chicago Divestiture.
2,3
$340
4
1
3Q14 change from
$s in millions
3Q14
2Q14
3Q13
2Q14
3Q13
$
%
$
%
215
Service charges and fees
144
$
147
$
163
$
(3)
$
(2) %
(19)
$
(12) %
216
Card fees
58
61
63
(3)
(5) %
(5)
(8) %
217
Trust & investment services fees
39
42
39
(3)
(7) %
—
—
%
218
FX & trade finance fees
26
22
25
4
18 %
1
4 %
219
Mortgage banking fees
21
14
20
7
50 %
1
5 %
220
Capital markets fees
22
26
11
(4)
(15) %
11
100 %
221
Securities gains, net
2
—
25
2
NM
(23)
(92) %
222
Adjusted other income
2,3
29
40
37
(11)
(28) %
(8)
(22) %
223
Adjusted noninterest income
1
341
$
352
$
383
$
(11)
$
(3) %
(42)
$
(11) %
224
Chicago Divestiture net gain
—
288
—
(288)
(100) %
—
NM
225
Noninterest income
341
$
640
$
383
$
(299)
$
(47) %
(42)
$
(11) % |
 Adjusted
noninterest expense – excluding restructuring charges and special items
Adjusted noninterest expense down
$44 million driven by an estimated $21
million decrease tied to the Chicago
Divestiture as well as lower regulatory
costs and the benefit of efficiency
initiatives
—
Salaries and benefits down $15
million driven by an estimated $12
million impact from the Chicago
Divestiture as well as lower
incentive and benefits expense
—
FTEs down 197 reflecting the
benefits of our efficiency
initiatives
—
Outside services increased $3
million, primarily due to
investments to drive future expense
reductions
—
Adjusted other expense down $30
million primarily due to lower
regulatory costs
8
Highlights
2
2
$812
3
1
3Q14 change from
$s in millions
3Q14
2Q14
3Q13
2Q14
3Q13
$
%
$
%
235
Adjusted salary and benefits
1
409
$
424
$
403
$
(15)
$
(4) %
6
$
1 %
236
Adjusted outside services
1,2
87
84
87
3
4 %
—
—
%
237
Adjusted occupancy
1
75
78
80
(3)
(4) %
(5)
(6) %
238
Adjusted equipment expense
1
58
62
69
(4)
(6) %
(11)
(16) %
239
Amortization of software
38
33
26
5
15 %
12
46 %
240
Adjusted other expense
1,3
122
152
123
(30)
(20) %
(1)
(1) %
241
Adjusted noninterest expense
1
789
$
833
$
788
$
(44)
$
(5) %
1
$
0 %
242
Restructuring charges and special items
21
115
—
(94)
(82) %
21
NM
243
Total noninterest expense
810
$
948
$
788
$
(138)
$
(15) %
22
$
3 %
$789
$833
$788
68%
70%
68%
3Q14
2Q14
3Q13
Adjusted salary and benefits
Adjusted occupancy & equip
Adjusted all other
Adjusted efficiency ratio
1
Non-GAAP item. Adjusted results exclude the effect of net restructuring charges and
special items associated with Chicago Divestiture, efficiency and effectiveness
programs and separation from RBS. See important information on use of Non-GAAP items on pages 27-31. Excludes restructuring charges and special items of: salaries
and benefits of $43 million in 2Q14, outside services of $19 million in 3Q14 and $41 million
in 2Q14, occupancy of $2 million in 3Q14 and $9 million in 2Q14, equipment of $3
million in 2Q14 and other expense of $19 million in 2Q14.
2
Excludes restructuring charges and special items. 3
Excluding estimated impact of Chicago Divestiture. |
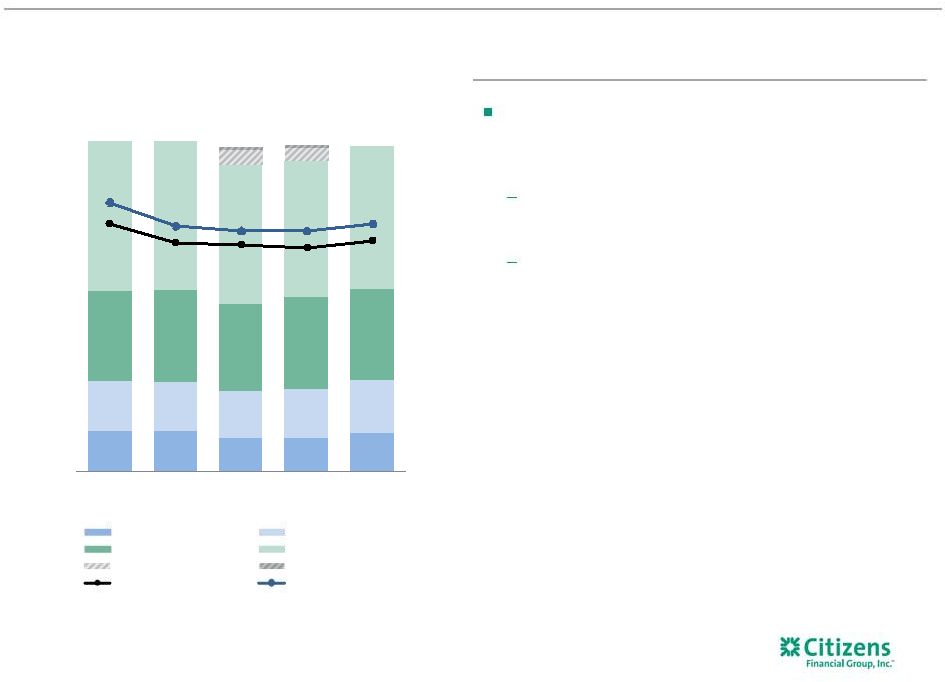
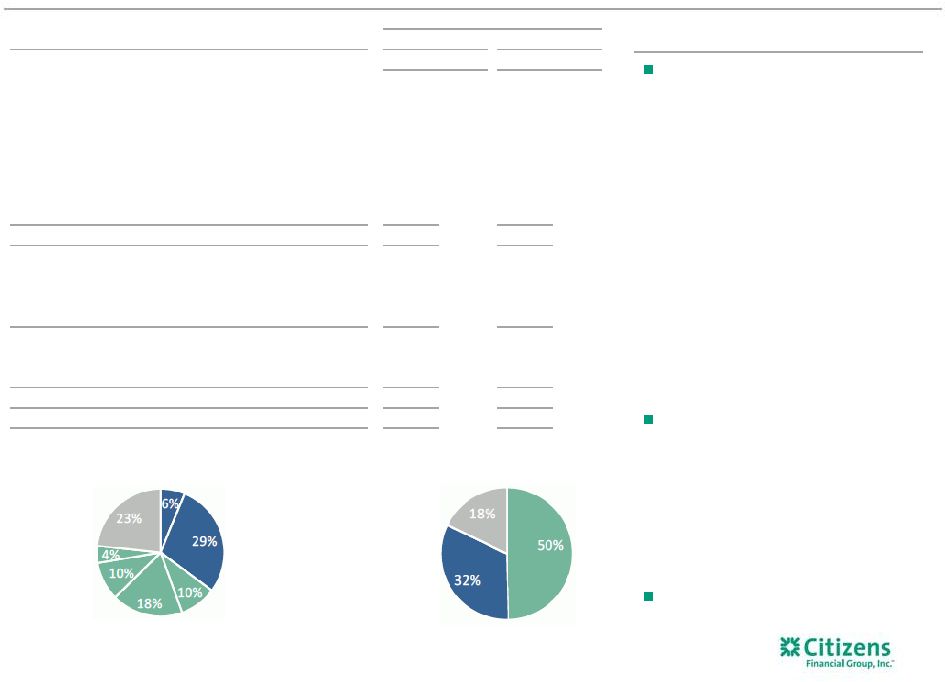 Consolidated 3Q14
average balance sheet Total earning assets up 1% linked
quarter and 11% YoY despite $1.0
billion decrease from Chicago
Divestiture; underlying up 1.9% linked
quarter
—
Commercial loans up $719 million
from 2Q14, driven by strength in
Asset Finance, Mid-Corporate,
Commercial Real Estate, and
Franchise Finance lines of
businesses
—
Retail loans up $912 million driven
by growth in auto and mortgage
partially offset by a reduction in
non-core loans and the 2Q14 sale
of $398 million student loan
portfolio
Total deposits decreased 1% given $4.8
billion impact from Chicago Divestiture,
largely offset by organic growth
—
$1.1 billion increase in low-cost
core deposits
—
$3.0 billion increase in money
market and CDs driven by
commercial deposits
Borrowed funds up $1.8 billion driven
by balance sheet growth, sub-debt
issuance
9
Highlights
$117.2 billion
Interest-earning assets
$106.7 billion
Deposits/borrowed funds
Total
Consumer
42%
Total
Commercial
35%
1
Low-cost core deposits include demand, checking with interest, and regular savings.
2
Total deposits includes deposits held for sale.
CRE
Other
Comml
Residential
mortgage
Total home
equity
Automobile
Other
consumer
Investments
Retail /
Personal
Comml /
Municipal
Wholesale
3Q14 change from
$s in billions
3Q14
2Q14
3Q13
2Q14
3Q13
$
%
$
%
265
Investments and interest bearing
deposits
27.3
$
26.8
$
21.0
$
0.5
$
2 %
6.4
$
30 %
266
Total commercial loans
41.2
40.5
38.5
0.7
2 %
2.7
7 %
267
Total retail loans
48.5
47.5
46.0
0.9
2 %
2.4
5 %
268
Total loans and leases
89.7
88.0
84.5
1.6
2 %
5.2
6 %
269
Loans held for sale
0.2
1.2
0.4
(1.0)
(83) %
(0.2)
(46) %
270
Total interest-earning assets
117.2
116.0
105.9
1.2
1 %
11.3
11 %
271
Total noninterest-earning assets
11.5
11.2
11.5
0.3
3 %
(0.0)
(0) %
272
Total assets
128.7
$
127.1
$
117.4
$
1.5
$
1 %
11.3
$
10 %
273
Low-cost core deposits
1
48.7
47.6
47.6
1.1
2 %
1.1
2 %
274
Money market deposits
32.4
30.6
34.2
1.8
6 %
(1.9)
(5) %
275
Term deposits
10.6
9.4
11.3
1.2
13 %
(0.7)
(6) %
Held for sale
—
4.5
—
(4.5)
(100) %
—
NM
276
Total deposits
2
91.7
$
92.2
$
93.1
$
(0.5)
$
(1) %
(1.5)
$
(2) %
277
Total borrowed funds
15.0
13.2
2.4
1.8
14 %
12.6
532 %
278
Total liabilities
109.3
$
107.5
$
97.8
$
1.7
$
2 %
11.5
$
12 %
279
Total stockholders' equity
19.4
19.6
19.6
(0.2)
(1) %
(0.2)
(1) %
280
Total liabilities and equity
128.7
$
127.1
$
117.4
$
1.5
$
1 %
11.3
$
10 % |
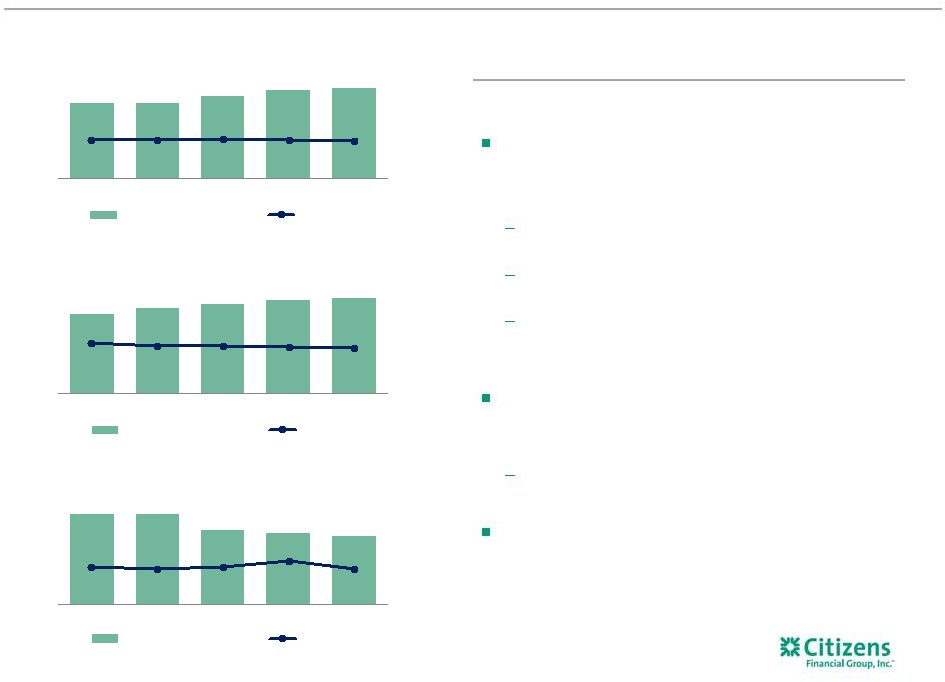 $44.8B
$46.2B
$47.4B
$47.8B
3.69%
3.68%
3.70%
3.69%
3.67%
3Q13
4Q13
1Q14
2Q14
3Q14
Total loans and leases
Loan yields
$34.5B
$35.7B
$36.6B
$37.4B
$37.8B
2.88%
2.74%
2.71%
2.67%
2.61%
3Q13
4Q13
1Q14
2Q14
3Q14
Total loans and leases
Loan yields
$5.6B
$5.6B
$4.6B
$4.4B
$4.2B
4.47%
4.28%
4.46%
4.99%
4.30%
3Q13
4Q13
1Q14
2Q14
3Q14
Total loans and leases
Loan yields
Total average loans and leases and LHFS
Linked Quarter:
Consumer Banking segment loans increased $480 million
despite $595 million decrease from Chicago Divestiture and
2Q14 sale of a $394 million student loan portfolio given
increases in auto and mortgage
Purchased $572 million and $395 million of residential
mortgages in 3Q14 and 2Q14, respectively
Purchased $503 million and $557 million in auto loans in
3Q14 and 2Q14, respectively
Consumer loan yields decreased 2 bps reflecting shift in
loan mix and the impact of the persistent low-rate
environment
Commercial Banking segment loans increased $398 million
on strength in Asset Finance, Mid-Corporate, Commercial
Real Estate, and Franchise Finance lines of businesses
Loan yields decreased 6 bps reflecting continued effect of
the low-rate environment and increased competition
Other loans decreased $216 million reflecting continued
runoff in the non-core portfolio
10
Highlights
2
Consumer Banking
Average loans
1
Commercial Banking
Average loans
1
Other
Average loans
1
1
Includes loans held for sale.
2
Excludes the impact of interest rate swaps. |
 $93.1B
$93.2B
$91.6B
$92.2B
$91.7B
0.25%
0.17%
0.16%
0.15%
0.18%
0.34%
0.24%
0.22%
0.22%
0.25%
3Q13
4Q13
1Q14
2Q14
3Q14
Term & time deposits
Checking with interest
Non int bearing deposits
Money market & savings
Int bearing HFS
Non-int bearing HFS
Total deposit costs
Int bearing deposit costs
Average deposits and rates
Total average deposits, including deposits held for sale,
decreased by $490 million as a $4.5 billion decrease related to
the Chicago Divestiture was largely offset by organic growth of
approximately 5%
Interest checking up $1.4 billion, money market & savings
up $1.7 billion and term deposits up $1.2 billion reflecting
particular strength in commercial
Total deposit costs increased three basis points to 0.18%
given this shift in mix
11
Highlights
1
1
Average deposits and
deposits held for sale |
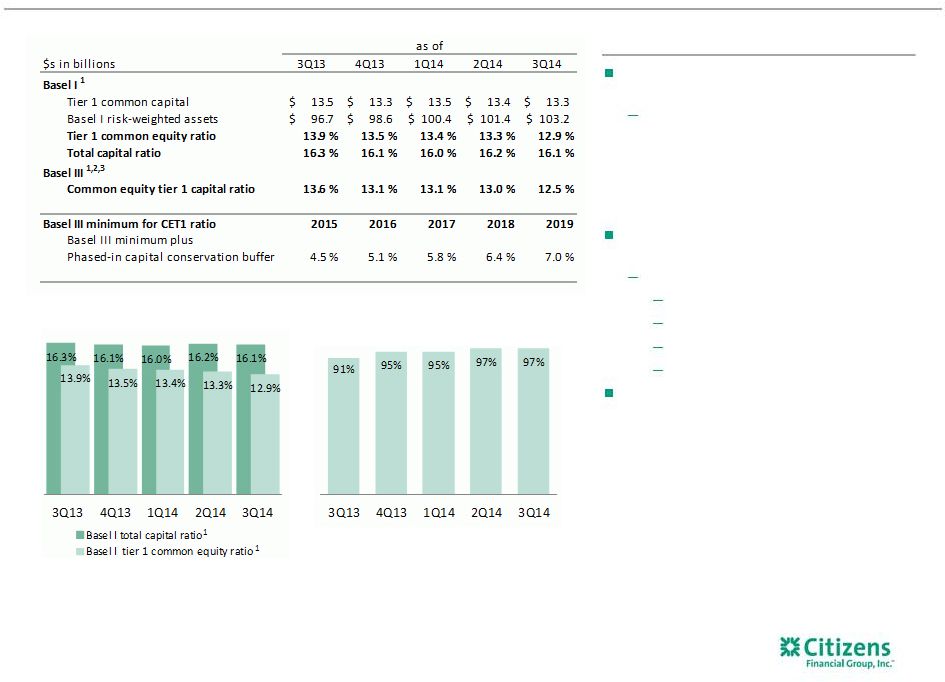 Capital and
liquidity remain strong 12
Highlights
Loan-to-deposit ratio
5
Capital levels remain well above regional
peers
As part of plan to adjust capital mix we
completed $333 million capital
exchange transaction on August 1, 2014
and $334 million sub-debt issuance/
14.3 million share repurchase on
October 8th with RBS
3Q14 Basel III common equity tier 1 down
approximately 50 basis points from 2Q14:
Impact to CET1:
Net income: 18 bps increase
RWA growth: 32 bps decrease
Capital exchange: 32 bps decrease
Dividend/other: 5 bps decrease
LDR remains stable post Chicago Divestiture.
Already meet initial LCR requirement
4
Capital ratio trend
1
Regulatory capital ratios are preliminary. 2
Pro forma Basel III ratios assume that certain definitions impacting qualifying
Basel III capital, which otherwise will phase in through 2018, are fully phased-in.
Ratios also reflect the required US Standardized methodology for calculating RWAs, effective
January 1, 2015.
3
Non-GAAP item. See important information on use of Non-GAAP items on pages
27-31. 4 Based on the September 2014 release of the U.S. version of the
Liquidity Coverage Ratio (LCR). Note that as a modified LCR company, CFG’s formal compliance
requirement of 90% does not begin until January 2016. 5
Includes held for sale. |
 $5
$18
($8)
($13)
$4
$100
$78
$80
$70
$75
$26
$19
$15
$11
$9
$131
$115
$87
$68
$88
0.61%
0.53%
0.41%
0.31%
0.38%
3Q13
4Q13
1Q14
2Q14
3Q14
Commercial
Retail
SBO
Net c/o ratio
$131
$115
$87
$68
$88
$145
$132
$121
$49
$77
$1.7B
$1.4B
$1.4B
$1.2B
$1.1B
3Q13
4Q13
1Q14
2Q14
3Q14
Net charge-offs
Provision
NPLs
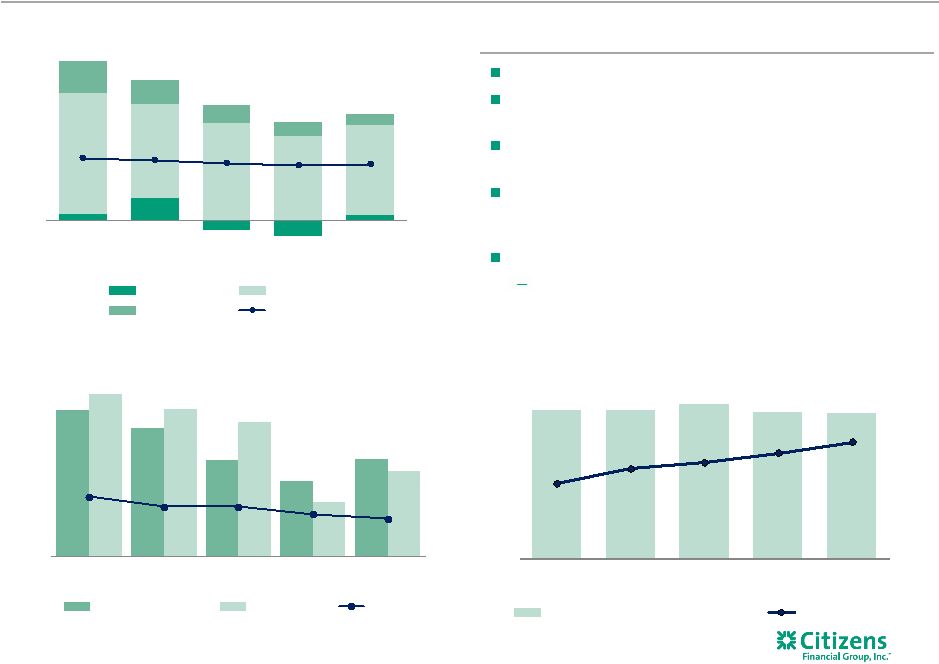
Credit quality continues to improve
Overall credit quality remains strong
Net charge-offs were $88 million, or 0.38% of average loans
and leases
Allowance coverage for NPLs improved to 111%, up from
101% in 2Q14
Provision for credit losses of $77 million increased $28 million
vs. 2Q14 which included $13 million in net commercial
recoveries
NPLs to total loans down 16 bps to 1.19% from 1.35% in 2Q14
Results reflect reserve release of $11 million vs. $19
million in 2Q14
13
Highlights
Net charge-offs (recoveries)
Provision for credit losses, charge-offs, NPLs
Allowance for loan and lease losses
$s in millions
1
For credit
losses
1 Allowance for loan and lease losses to nonperforming loans and
leases. $1,219
$1,221
$1,259
$1,210
$1,201
72%
86%
92%
101%
111%
3Q13
4Q13
1Q14
2Q14
3Q14
Allowance for loan and lease losses
Coverage Ratio |
 Execution of key
initiatives progressing well Consumer initiatives showing good traction
—
Mortgage, Business Banking and Wealth hiring meeting expectations
—
Auto loan volume very strong -
$1.9 billion organic originations; ~$500 million in flow purchases
—
Education finance launched leading and very attractive re-finance product
—
Net household growth in lending and checking accounts of 46,000 YTD
Commercial initiatives remain on track in spite of competitive environment
—
14 new key hires in the quarter, including new head of Treasury Solutions
—
Loan growth of $505 million
—
Strong
quarter
in
capital
and
global
markets,
including
strength
in
interest
rate
and
FX
products
Expense initiatives are tracking to all implementation dates
—
Expect to have 25% of $200 million program goal in run rate by end 2014
Capital conversions of $1 billion for 2014 completed as of October 8
—
Capital mix now 78% CET1/22% capital securities vs. goal of 70%/30%
Balance
sheet
positioning
remains
more
asset
sensitive
than
peer
group
—
6.3%
benefit
from
200
bps
gradual
ramp
in
rates
at
September
30
vs.
6.6%
at
June
30
14
th
th
th |
 Making progress
against key financial targets 15
Key Indicators
3Q13
3Q14
End 2016
targets
Adjusted return on average tangible common
equity
1
4.3%
6.2%
10%+
Adjusted return on average total tangible
assets
1
0.5%
0.7%
1.0%+
Adjusted efficiency ratio
1
68%
68%
~60%
Tier 1 common equity ratio
13.9%
12.9%
2
~11%
3
Delivering on our plan to improve returns
1
Non-GAAP item. Adjusted results exclude the effect of net restructuring charges and
special items associated with Chicago Divestiture, efficiency and effectiveness
programs and separation from RBS. See important information on use of Non-GAAP items on pages 27-31.
2
Regulatory capital ratio is preliminary.
3
Target represents fully phased in Basel III. |
 4Q14
outlook 16
Net interest
income, net
interest margin
Anticipate 4Q14 loan growth of 2-3% vs. linked quarter
Project stable net interest margin
Operating
leverage,
efficiency ratio
Credit trends
and cost
Restructuring
costs
Capital, liquidity
and funding
Expect
modest
operating
leverage
and
slight
improvement
in
operating
efficiency
ratio
Asset quality trends expected to be stable
Currently do not expect commercial recoveries nor reserve release in 4Q14
Restructuring costs of $35-$45 million projected for 4Q14; 1H15 balance estimated at
$30-$40 million
Year end Tier 1 common equity ratio projected at ~12.5%
Loan-to-deposit ratio at ~98% |
 Key
messages 17
Successful completion of the largest commercial bank IPO in U.S.
history
Underlying business performance continues to strengthen
2014 is a transition year, with Chicago region gain funding various
initiatives to drive better performance over 2015/2016
Tracking well on all strategic and regulatory initiatives, maintain intense
focus on execution
Asset quality and capital ratios remain strong |
 Appendix
18 |
 4.34%
6.22%
3Q13
3Q14
0.52%
0.66%
3Q13
3Q14
12.1%
10.9%
3Q13
3Q14
$144
$202
3Q13
3Q14
$365
$372
3Q13
3Q14
13.9%
12.9%
3Q13
3Q14
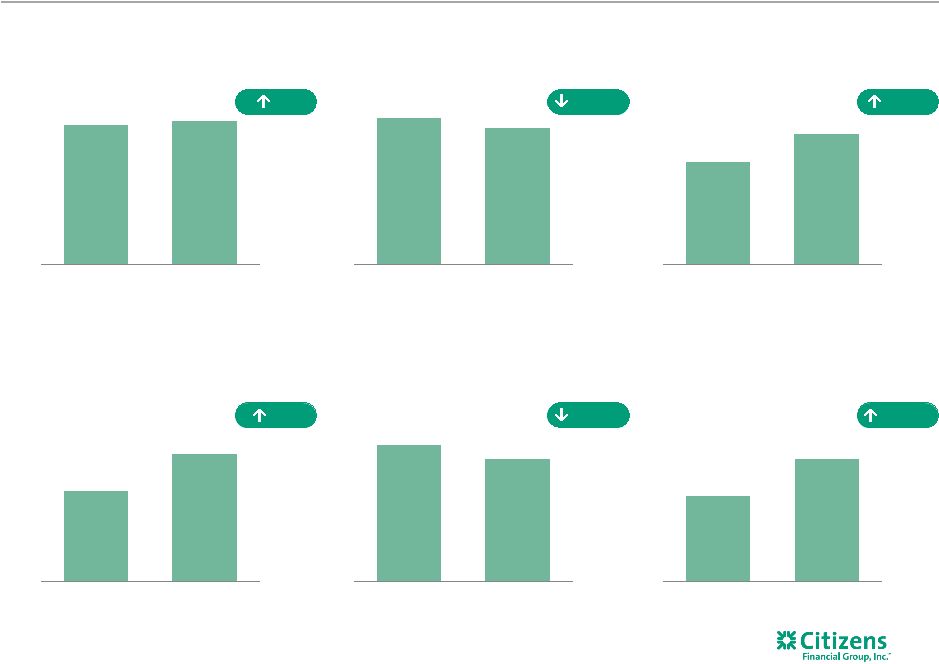
Prior year quarter results
19
Adjusted pre-provision profit
¹
$s in millions
Basel I tier 1 common equity
capital ratio
²
Adjusted return on average
tangible assets
¹
Adjusted net income
¹
$s in millions
Leverage ratio
²
120 bps
100 bps
2%
40%
14 bps
188 bps
Adjusted return on average
tangible
common
equity
¹
1
Adjusted results are non-GAAP items and exclude the effect of net restructuring charges
and special items associated with Chicago Divestiture, efficiency and effectiveness
programs and separation from RBS. See important information on use of Non-GAAP items on
pages 27-31. 2
Regulatory capital ratios are preliminary. |
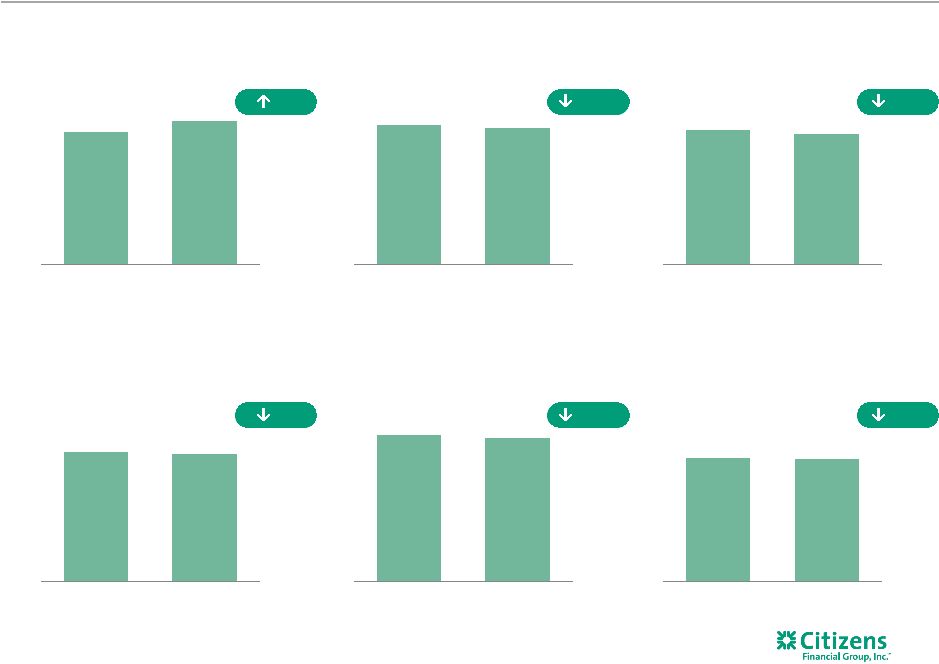 $352
$372
2Q14
3Q14
13.3%
12.9%
2Q14
3Q14
0.68%
0.66%
2Q14
3Q14
$205
$202
2Q14
3Q14
11.1%
10.9%
2Q14
3Q14
6.28%
6.22%
2Q14
3Q14
Linked quarter results
20
6 bps
2 bps
20 bps
40 bps
1%
6%
Adjusted pre-provision profit
¹
$s in millions
Basel I tier 1 common equity
capital ratio
²
Adjusted return on average
tangible assets
¹
Adjusted net income
¹
$s in millions
Leverage ratio
²
Adjusted return on average
tangible
common
equity
¹
1
Adjusted results are non-GAAP items and exclude the effect of net restructuring charges
and special items associated with Chicago Divestiture, efficiency and effectiveness
programs and separation from RBS. See important information on use of Non-GAAP items on
pages 27-31. 2
Regulatory capital ratios are preliminary. |
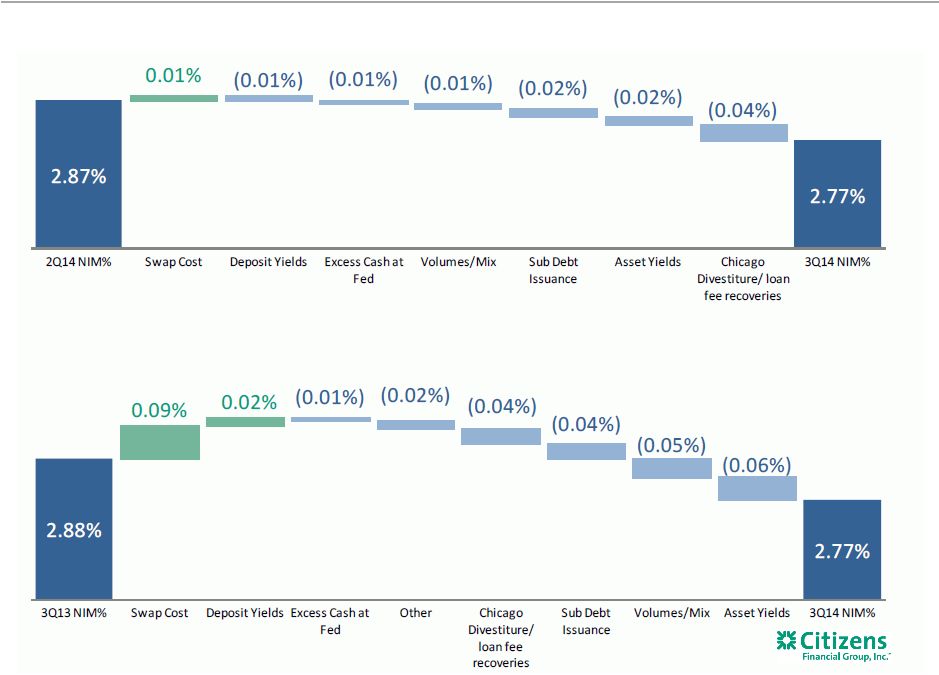 Net interest
margin NIM% walk 3Q13 to 3Q14
NIM% walk 2Q14 to 3Q14
21 |
 Consumer Banking
segment 22
Highlights
1
Non-GAAP item. Adjusted results exclude the effect of net restructuring charges and
special items associated with Chicago Divestiture, efficiency and effectiveness
programs and separation from RBS. See important information on use of Non-GAAP items on pages 27-31.
2
Includes held for sale.
3
Operating segments are allocated capital on a risk-adjusted basis considering economic and
regulatory capital requirements. We approximate that regulatory capital is equivalent
to a sustainable target level for common equity Tier 1 and then allocate that
approximation to the segments based on economic capital.
Consumer Banking net income up $10
million with pre-provision profit up $22
million
Net interest income decreased $14
million driven by an estimated $21
million decrease related to the Chicago
Divestiture.
–
Period-end loans up $1.6 billion on
higher mortgage and auto balances
–
Period-end deposits relatively flat as
strength in DDA and CDs was largely
offset by lower savings, interest
checking and money market
balances including seasonal
decrease
Noninterest income decreased $10
million from higher 2Q14 levels that
included $11 million tied to the Chicago
Divestiture and a $9 million student
loan portfolio sale gain
–
Mortgage originations up 13%
Noninterest expense decreased $46
million driven by an estimated $20
million decrease related to the Chicago
Divestiture, the impact of a reduction in
regulatory costs and the impact of
efficiency initiatives
3Q14 change from
$s in millions
3Q14
2Q14
3Q13
2Q14
3Q13
$
%
$
%
310
Net interest income
532
$
546
$
543
$
(14)
$
(3) %
(11)
$
(2) %
311
Noninterest income
226
236
246
(10)
(4) %
(20)
(8) %
312
Total revenue
758
782
789
(24)
(3) %
(31)
(4) %
313
Noninterest expense
609
655
622
(46)
(7) %
(13)
(2) %
314
Profit before provision for
credit losses
149
127
167
22
17 %
(18)
(11) %
315
Provision for credit losses
66
59
87
7
12 %
(21)
(24) %
316
Income before income tax
expense
83
68
80
15
22 %
3
4 %
317
Income tax expense
29
24
28
5
21 %
1
4 %
318
Net income
54
$
44
$
52
$
10
$
23 %
2
$
4 %
Average balances
319
Total
loans
and
leases
²
47.8B
$
47.4B
$
44.8B
$
0.5B
$
1 %
3.1B
$
7 %
320
Total
deposits
²
65.6B
$
70.2B
$
72.2B
$
(4.6B)
$
(7) %
(6.6B)
$
(9) %
Mortgage Banking Metrics
Originations
1,018
$
904
$
1,374
$
113
$
13 %
(356)
$
(26) %
Origination Pipeline
973
1,020
938
(47)
(5) %
35
4 %
Gain on sale of secondary
originations
1.69%
1.91%
0.59%
(22)
bps
110
bps
Performance metrics
321
ROTCE
¹
,
³
4.57%
3.87%
4.69%
70
bps
(12)
bps
322
Efficiency
ratio
¹
80%
84%
79%
(319)
bps
159
bps |
 Commercial
Banking segment Commercial Banking net income
decreased modestly from 2Q14 which
included the benefit of a $2 million net
recovery on prior period charge-offs
and reversal of prior period loss
reserves
Revenues up $3 million with net
interest income up $6 million on a 1%
increase in loans and 14% increase in
deposits
–
Strength in Asset Finance, Mid-
Corporate, Commercial Real Estate,
and Franchise Finance lines of
businesses
–
Deposits up $2.6 billion, or 14%
Noninterest income down $3 million as
growth in foreign exchange and trade
fees was more than offset by lower
leasing and capital markets fees from
relatively high 2Q14 levels
Noninterest expense up $5 million from
unusually low 2Q14 levels as well as
continued investments to drive growth
23
Highlights
1
Non-GAAP item. Adjusted results exclude the effect of net restructuring charges and
special items associated with Chicago Divestiture, efficiency and effectiveness
programs and separation from RBS. See important information on use of Non-GAAP items on pages 27-31.
2
Includes held for sale.
3
Operating segments are allocated capital on a risk-adjusted basis considering economic and
regulatory capital requirements. We approximate that regulatory capital is equivalent
to a sustainable target level for common equity Tier 1 and then allocate that approximation to the segments
based on economic capital.
3Q14 change from
$s in millions
3Q14
2Q14
3Q13
2Q14
3Q13
$
%
$
%
323
Net interest income
270
$
264
$
263
$
6
$
2 %
7
$
3 %
324
Noninterest income
104
107
93
(3)
(3) %
11
12 %
325
Total revenue
374
371
356
3
1 %
18
5 %
326
Noninterest expense
162
157
156
5
3 %
6
4 %
327
Profit before provision for
credit losses
212
214
200
(2)
(1) %
12
6 %
328
Provision for credit losses
—
(2)
3
2
NM
(3)
NM
329
Income before income tax
expense
212
216
197
(4)
(2) %
15
8 %
330
Income tax expense
73
75
70
(2)
(3) %
3
4 %
331
Net income
139
$
141
$
127
$
(2)
$
(1) %
12
$
9 %
Average balances
37.8B
$
37.4B
$
34.5B
$
0.4B
$
1 %
3.3B
$
9 %
21.0B
$
18.4B
$
17.8B
$
2.6B
$
14 %
3.2B
$
18 %
Performance metrics
13.10%
13.78%
13.24%
(68)
bps
(14)
bps
43%
42%
44%
99
bps
(34)
bps
Total
loans
and
leases
²
Total
deposits
²
ROTCE
¹
,
³
Efficiency
ratio
¹ |
 3Q14 change
from $s in millions
3Q14
2Q14
3Q13
2Q14
3Q13
$
%
$
%
336
Net interest income (expense
18
$
23
$
(36)
$
(5)
$
(22) %
54
$
150 %
337
Noninterest income
11
297
44
(286)
(96) %
(33)
(75) %
338
Total revenue
29
320
8
(291)
(91) %
21
263 %
339
Noninterest expense
39
136
10
(97)
(71) %
29
290 %
340
Profit (loss) before provision
for credit losses
(10)
184
(2)
(194)
(105) %
(8)
(400) %
341
Provision for credit losses
11
(8)
55
19
238 %
(44)
(80) %
342
Income (loss) before income
tax expense
(21)
192
(57)
(213)
(111) %
36
63 %
343
Income tax expense (benefit)
(17)
64
(22)
(81)
(127) %
5
23 %
344
Net income (loss)
(4)
$
128
$
(35)
$
(132)
$
(103) %
31
$
89 %
Average balances
345
Total loans and leases¹
4.2B
$
4.4B
$
5.6B
$
(0.2B)
$
(5) %
(1.4B)
$
(25) %
346
Total deposits¹
5.1B
$
3.6B
$
3.1B
$
1.5B
$
40 %
1.9B
$
61 %
Other
Other net income down $132
million from 2Q14
Noninterest income
decreased $286 million driven
by a $288 million net gain on
sale of the Chicago
Divestiture in 2Q14
Noninterest expense
decreased $97 million from
2Q14 driven by a $94 million
reduction in restructuring
charges and special items
24
Highlights
1
Includes held for sale.
—
—
) |
 Restructuring
charges and special items 25
3Q14 results included restructuring charges and special items related to enhancing
efficiencies and improving processes across the organization and separation from The
Royal Bank of Scotland Group plc (“RBS”). This table shows impacts on expense
categories. Expect to utilize the balance of the gain to continue to reinvest to drive
future growth, and to fund an additional $35-$45 million of further restructuring
charges and special expense items in 4Q14, and $30-$40 million in 1H15. As of and for
the three months ended Restructuring charges and special items
($s in millions, except per share data)
pretax
after tax
pretax
after tax
pre-tax
after-tax
Noninterest income special items:
Other income
Net Gain on Chicago Divestiture
—
$
—
$
288
$
180
$
(288)
$
(180)
$
Total noninterest income restructuring charges and special items
—
—
288
180
(288)
(180)
Noninterest expense restructuring charges and special items:
Salaries and employee benefits
—
—
43
27
(43)
(27)
Outside services
19
12
41
25
(22)
(13)
Occupancy
2
1
9
6
(7)
(5)
Equipment expense
—
—
3
2
(3)
(2)
Other operating expense
—
—
19
12
(19)
(12)
Total noninterest expense restructuring charges and special items
21
$
13
$
115
$
72
$
(94)
$
(59)
$
Net restructuring charges and special items
(21)
$
(13)
$
173
$
108
$
(194)
$
(121)
$
EPS impact
(0.02)
$
0.19
$
(0.21)
$
September 30, 2014
June 30, 2014
increase/decrease |
 $4.1B
$3.8B
$3.6B
$3.4B
$3.2B
3Q13
4Q13
1Q14
2Q14
3Q14
Retail
Commercial
SBO
$2.3B
$2.2B
$2.1B
$2.0B
$1.9B
4.25%
3.37%
2.78%
2.11%
2.04%
3Q13
4Q13
1Q14
2Q14
3Q14
SBO balance
Charge-offs
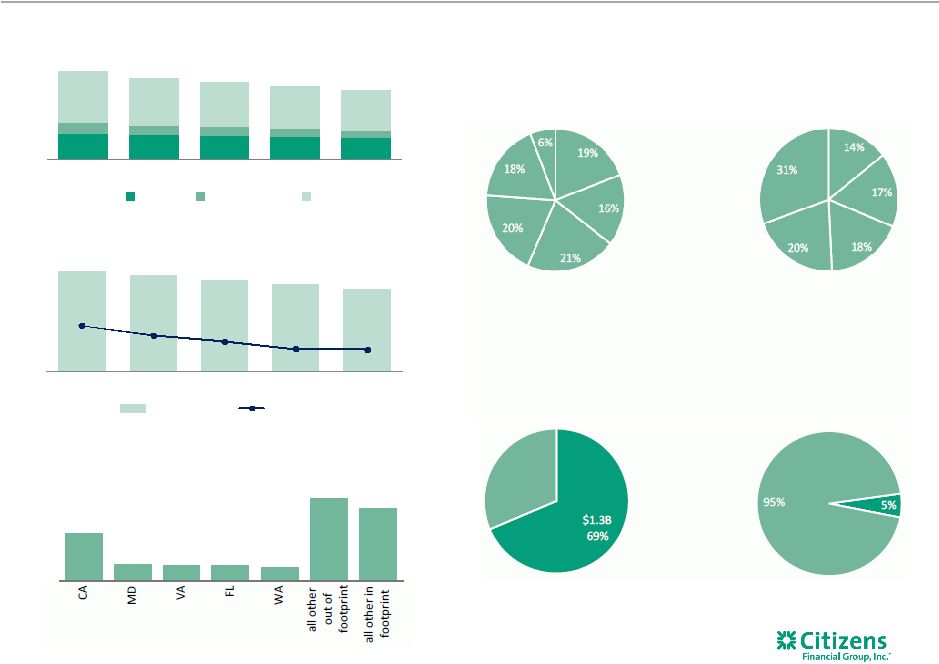
Non-core
home
equity
portfolio
serviced
by
others
(SBO)
1
SBO balances by FICO
SBO balances by LTV
SBO balances and charge-offs
Top 5 SBO balances by state
Non-core period-end loans
SBO balances by product
SBO Lien Position
1st Lien
2nd Lien
< 69
70-79
80-89
90-99
100-119
120+
< 619
620-679
680-719
720-759
760+
HE Loan
HELOC
26
$s in millions
SBO gross balance distribution as of September 30, 2014. FICO scores updated quarterly.
1
a portion of the serviced by others portfolio is serviced by CFG.
$354
$121
$116
$115
$100
$615
$541
$0.6B
31% |
 Non-GAAP
Financial Measures 27
This document contains non-GAAP financial measures. The table below presents
reconciliations of certain non-GAAP measures. These reconciliations exclude goodwill
impairment, restructuring charges and/or special items, which are usually included, where
applicable, in the financial results presented in accordance with GAAP. Special
items include regulatory expenses and expenses relating to our initial public offering. The
non-GAAP measures set forth below include “total revenue”, “noninterest income”, “ noninterest expense”, “income tax expense (benefit)”, “net income (loss)”, “salaries
and employee benefits”, “outside services”, “occupancy”,
“equipment expense”, “other operating expense”, “return of average common equity” and “return on average total
assets”. In addition, we present computations for “return on average tangible common
equity”, “return on average total tangible assets” and “efficiency ratio” as part of our
non-GAAP measures. We believe
these non-GAAP measures provide useful information to investors because these are among the measures used by our management team to evaluate our
operating performance and make day-to-day operating decisions. In addition, we believe
goodwill impairment, restructuring charges and special items in any period do not
reflect the operational performance of the business in that period and, accordingly, it is
useful to consider these line items with and without goodwill impairment, restructuring
charges and special items. We believe this presentation also increases comparability of period-to-period results.
We also consider pro forma capital ratios defined by banking regulators but not effective at
each period end to be non-GAAP financial measures. Since analysts and banking
regulators may assess our capital adequacy using these pro forma ratios, we believe they are
useful to provide investors the ability to assess our capital adequacy on the same
basis. Other companies may use similarly titled non-GAAP financial measures that
are calculated differently from the way we calculate such measures. Accordingly, our non-GAAP
financial measures may not be comparable to similar measures used by other companies. We
caution investors not to place undue reliance on such non-GAAP measures, but
instead to consider them with the most directly comparable GAAP measure. Non-GAAP
financial measures have limitations as analytical tools, and should not be considered in
isolation, or as a substitute for our results as reported under GAAP.
|
 Non-GAAP
Reconciliation Table 28
(Excluding restructuring charges and special items)
$s in millions, except per share data
3Q14
2Q14
1Q14
4Q13
3Q13
Noninterest income, excluding special items:
Noninterest income (GAAP)
A
$341
$640
$358
$379
$383
Less: Special items - Chicago gain
—
288
—
—
—
Noninterest income, excluding special items (non-GAAP)
B
$341
$352
$358
$379
$383
Total revenue, excluding special items:
Total revenue (GAAP)
C
$1,161
$1,473
$1,166
$1,158
$1,153
Less: Special items - Chicago gain
—
288
—
—
—
Total revenue, excluding special items (non-GAAP)
D
$1,161
$1,185
$1,166
$1,158
$1,153
Noninterest expense, excluding restructuring charges and
special items:
Noninterest expense (GAAP)
E
$810
$948
$810
$818
$788
Less: Restructuring charges and special expense items
HH
21
115
—
26
—
Noninterest expense, excluding restructuring charges and
special items (non-GAAP)
F
$789
$833
$810
$792
$788
Net income (loss), excluding restructuring charges and special
Net income (loss) (GAAP)
G
$189
$313
$166
$152
$144
Add: Restructuring charges and special items, net of income
13
(108)
—
17
—
Net income (loss), excluding restructuring charges and special
items (non-GAAP)
H
$202
$205
$166
$169
$144
Return on average common equity, excluding restructuring
charges and special items:
Average common equity (GAAP)
I
$19,411
$19,607
$19,370
$19,364
$19,627
Return on average common equity, excluding restructuring
charges and special items (non-GAAP)
H/I
4.14 %
4.19 %
3.48 %
3.47 %
2.91 %
Return on average tangible common equity and return on
average tangible common equity, excluding restructuring
charges and special items:
Average common equity (GAAP)
I
$19,411
$19,607
$19,370
$19,364
$19,627
Less: Average goodwill (GAAP)
6,876
6,876
6,876
6,876
6,876
Less: Average other intangibles (GAAP)
6
7
7
8
9
Add: Average deferred tax liabilities related to goodwill
384
369
351
342
325
Average tangible common equity (non-GAAP)
J
$12,913
$13,093
$12,838
$12,822
$13,067
Return on average tangible common equity (non-GAAP)
G/J
5.81 %
9.59 %
5.24 %
4.71 %
4.34 %
Return on average tangible common equity, excluding
restructuring charges and special items (non-GAAP)
H/J
6.22 %
6.28 %
5.24 %
5.24 %
4.34 %
Return on average total assets, excluding restructuring charges
and special items:
Average total assets (GAAP)
K
$128,691
$127,148
$123,904
$120,393
$117,386
Return on average total assets, excluding restructuring charges
and special items (non-GAAP)
H/K
0.62 %
0.65 %
0.54 %
0.56 %
0.49 %
Return on average total tangible assets and return on average
total tangible assets, excluding restructuring charges and
Average total assets (GAAP)
K
$128,691
$127,148
$123,904
$120,393
$117,386
Less: Average goodwill (GAAP)
6,876
6,876
6,876
6,876
6,876
Less: Average other intangibles (GAAP)
6
7
7
8
9
Add: Average deferred tax liabilities related to goodwill
384
369
351
342
325
Average tangible assets (non-GAAP)
L
$122,193
$120,634
$117,372
$113,851
$110,826
Return on average total tangible assets (non-GAAP)
G/L
0.61 %
1.04 %
0.57 %
0.53 %
0.52 %
Return on average total tangible assets, excluding restructuring
charges and special items (non-GAAP)
H/L
0.66 %
0.68 %
0.57 %
0.59 %
0.52 %
QUARTERLY TRENDS |
 Non-GAAP
Reconciliation Table 29
(Excluding restructuring charges and special items)
$s in millions, except per share data
3Q14
2Q14
1Q14
4Q13
3Q13
Efficiency ratio and efficiency ratio, excluding restructuring
charges and special items:
Net interest income (GAAP)
$820
$833
$808
$779
$770
Add: Noninterest income (GAAP)
341
640
358
379
383
Total revenue (GAAP)
C
$1,161
$1,473
$1,166
$1,158
$1,153
Efficiency ratio (non-GAAP)
E/C
69.84 %
64.33 %
69.43 %
70.62 %
68.49 %
Efficiency ratio, excluding restructuring charges and special
items (non-GAAP)
F/D
68.02 %
70.23 %
69.43 %
68.35 %
68.49 %
Net income (loss) per average common share - basic and
diluted, excluding restructuring charges and special items:
Average common shares outstanding - basic (GAAP)
M
559,998,324
559,998,324
559,998,324
559,998,324
559,998,324
Average common shares outstanding - diluted (GAAP)
N
560,243,747
559,998,324
559,998,324
559,998,324
559,998,324
Net income (loss) applicable to common stockholders (GAAP)
O
189
313
166
152
144
Net income (loss) per average common share - basic (GAAP)
O/M
0.34
0.56
0.30
0.27
0.26
Net income (loss) per average common share - diluted (GAAP)
O/N
0.34
0.56
0.30
0.27
0.26
Net income (loss) applicable to common stockholders,
excluding restructuring charges and special items (non-GAAP)
P
202
205
166
169
144
Net income per average common share - basic, excluding
restructuring charges and special items (non-GAAP)
P/M
0.36
0.37
0.30
0.30
0.26
Net income per average common share - diluted, excluding
restructuring charges and special items (non-GAAP)
P/N
0.36
0.37
0.30
0.30
0.26
Pro forma Basel III common equity Tier 1 capital ratio:
Tier 1 common capital (regulatory)
$13,330
$13,448
$13,460
$13,301
$13,489
Add: Change in DTA and other threshold deductions (GAAP)
(5)
(7)
(7)
6
—
Basel III common equity Tier 1 (non-GAAP)
Q
$13,335
$13,455
$13,467
$13,295
$13,489
Risk-weighted assets (regulatory general risk weight approach)
103,207
101,397
100,368
98,634
96,735
Net change in credit and other risk-weighted assets (GAAP)
3,207
2,383
2,450
2,687
2,768
Basel III standardized approach risk-weighted assets (non-
GAAP)
R
$106,414
$103,780
$102,818
$101,321
$99,503
Pro forma Basel III common equity Tier 1 capital ratio (non-
GAAP)
Q/R
12.5 %
13.0 %
13.1 %
13.1 %
13.6 %
Salaries and employee benefits, excluding restructuring
charges and special items:
Salaries and employee benefits (GAAP)
S
$409
$467
$405
$391
$403
Less: Restructuring charges and special items
—
43
—
5
—
Salaries and employee benefits, excluding restructuring
charges and special items (non-GAAP)
T
$409
$424
$405
$386
$403
Outside services, excluding restructuring charges and special
Outside services (GAAP)
U
$106
$125
$83
$101
$87
Less: Restructuring charges and special items
19
41
—
—
—
Outside services, excluding restructuring charges and special
items (non-GAAP)
V
$87
$84
$83
$101
$87
Occupancy, excluding restructuring charges and special items:
Occupancy (GAAP)
W
$77
$87
$81
$83
$80
Less: Restructuring charges and special items
2
9
—
11
—
Occupancy, excluding restructuring charges and special items
(non-GAAP)
X
$75
$78
$81
$72
$80
Equipment expense, excluding restructuring charges and
special items:
Equipment expense (GAAP)
Y
$58
$65
$64
$68
$69
Less: Restructuring charges and special items
—
3
—
7
—
Equipment expense, excluding restructuring charges and
special items (non-GAAP)
Z
$58
$62
$64
$61
$69
QUARTERLY TRENDS |
 Non-GAAP
Reconciliation Table 30
(Excluding restructuring charges and special items)
$s in millions, except per share data
3Q14
2Q14
1Q14
4Q13
3Q13
Other operating expense, excluding restructuring charges
and special items:
Other operating expense (GAAP)
AA
$122
$171
$146
$143
$123
Less: Restructuring charges and special items
—
19
—
3
—
Other operating expense, excluding restructuring charges
and special items (non-GAAP)
BB
$122
$152
$146
$140
$123
Pre-provision profit, excluding restructuring charges and
Special items:
Total revenue, excluding restructuring charges and special
items (non-GAAP)
D
$1,161
$1,185
$1,166
$1,158
$1,153
Less: Noninterest expense, excluding restructuring charges
and special items (non-GAAP)
F
789
833
810
792
788
Pre-provision profit, excluding restructuring charges and
special items (non-GAAP)
CC
$372
$352
$356
$366
$365
Income before income tax expense (benefit), excluding
restructuring charges and special items
Income before income tax expense (benefit) (GAAP)
DD
$274
$476
$235
$208
$220
Less: Income before income tax expense (benefit) related to
restructuring charges and special items (GAAP)
(21)
173
—
(26)
—
Income before income tax expense (benefit), excluding
restructuring charges and special items (non-GAAP)
EE
$295
$303
$235
$234
$220
Income tax expense (benefit), excluding restructuring charges
and special items:
Income tax expense (benefit) (GAAP)
FF
$85
$163
$69
$56
$76
Less: Income tax (benefit) related to restructuring charges
and special items (GAAP)
(8)
65
—
(9)
—
Income tax expense (benefit), excluding restructuring
charges and special items (non-GAAP)
GG
$93
$98
$69
$65
$76
Restructuring charges and special expense items include:
Goodwill impairment
-
-
-
-
-
Restructuring charges
1
103
—
26
—
Special items
20
12
—
—
—
Restructuring charges and special expense items
HH
$21
$115
-
$26
-
Tangible Common Equity (period-end):
Stockholders' equity
$19,383
$19,597
$19,442
$19,196
$19,413
Less: Goodwill
(6,876)
(6,876)
(6,876)
(6,876)
(6,876)
Less: Other intangible assets
(6)
(7)
(7)
(8)
(9)
Add: Deferred tax liabilities
399
384
366
350
333
Total tangible common equity
II
$12,900
$13,098
$12,925
$12,662
$12,861
QUARTERLY TRENDS |
 Non-GAAP
Reconciliation Table 31
Consumer
Banking
Commercial
Banking
Other
Consolidated
Consumer
Banking
Commercial
Banking
Other
Consolidated
Consumer
Banking
Commercial
Banking
Other
Consolidated
Net income (loss) (GAAP)
A
$54
$139
($4)
$189
$44
$141
$128
$313
$32
$141
($7)
$166
Return on average tangible common equity
Average common equity (GAAP)
B
$4,685
$4,205
$10,521
$19,411
$4,640
$4,129
$10,838
$19,607
$4,568
$4,023
$10,779
$19,370
Less: Average goodwill (GAAP)
—
—
6,876
6,876
—
—
6,876
6,876
—
—
6,876
6,876
Average other intangibles (GAAP)
—
—
6
6
—
—
7
7
—
—
7
7
Add: Average deferred tax liabilities
related to goodwill (GAAP)
—
—
384
384
—
—
369
369
—
—
351
351
Average tangible common equity (non-
GAAP)
C
$4,685
$4,205
$4,023
$12,913
$4,640
$4,129
$4,324
$13,093
$4,568
$4,023
$4,247
$12,838
Return on average tangible common
equity (non-GAAP)
A/C
4.57
%
13.10
%
NM
5.81
%
3.87
%
13.78
%
NM
9.59
%
2.81
%
14.17
%
NM
5.24
%
Efficiency ratio
Noninterest expense (GAAP)
D
$609
$162
$39
$810
$655
$157
$136
$948
$638
$153
$19
$810
Net interest income (GAAP)
532
270
18
820
546
264
23
833
537
256
15
808
Noninterest income (GAAP)
226
104
11
341
236
107
297
640
219
107
32
358
Total revenue
E
$758
$374
$29
$1,161
$782
$371
$320
$1,473
$756
$363
$47
$1,166
Efficiency ratio (non-GAAP)
D/E
80.42
%
43.35
%
NM
69.84
%
83.61
%
42.36
%
NM
64.33
%
84.39
%
42.13
%
NM
69.43
%
Consumer
Banking
Commercial
Banking
Other
Consolidated
Consumer
Banking
Commercial
Banking
Other
Consolidated
Net income (loss) (GAAP)
A
$50
$123
($21)
$152
$52
$127
($35)
$144
Return on average tangible common equity
Average common equity (GAAP)
B
$4,448
$3,978
$10,938
$19,364
$4,403
$3,855
$11,369
$19,627
Less: Average goodwill (GAAP)
—
—
6,876
6,876
—
—
6,876
6,876
Average other intangibles (GAAP)
—
—
8
8
—
—
9
9
Add: Average deferred tax liabilities
related to goodwill (GAAP)
—
—
342
342
—
—
325
325
Average tangible common equity (non-
GAAP)
C
$4,448
$3,978
$4,396
$12,822
$4,403
$3,855
$4,809
$13,067
Return on average tangible common
equity (non-GAAP)
A/C
4.40
%
12.10
%
NM
4.71
%
4.69
%
13.24
%
NM
4.34
%
Efficiency ratio
Noninterest expense (GAAP)
D
$638
$164
$16
$818
$622
$156
$10
$788
Net interest income (GAAP)
543
260
(24)
779
543
263
(36)
770
Noninterest income (GAAP)
235
105
39
379
246
93
44
383
Total revenue
E
$778
$365
$15
$1,158
$789
$356
$8
$1,153
Efficiency ratio (non-GAAP)
D/E
81.84
%
44.73
%
NM
70.62
%
78.83
%
43.69
%
NM
68.49
%
Three Months Ended September 30, 2013
Three Months Ended September 30, 2014
Three Months Ended June 30, 2014
Three Months Ended March 31, 2014
Three Months Ended December 31, 2013
Non-GAAP
Reconciliation
–
Segments
$s
in
millions |
 32 |