Attached files
| file | filename |
|---|---|
| 8-K - SWN FORM 8K Q3 2014 EARNINGS RELEASE - SOUTHWESTERN ENERGY CO | swn102314form8k.htm |

NEWS RELEASE
SOUTHWESTERN ENERGY ANNOUNCES THIRD QUARTER
2014 FINANCIAL AND OPERATING RESULTS
Houston, Texas – October 23, 2014...Southwestern Energy Company (NYSE: SWN) today announced its financial and operating results for the quarter and nine months ended September 30, 2014. Third quarter highlights include:
| · | Record gas and oil production of 196 Bcfe, up 14% compared to year-ago levels, including 47% growth in Marcellus Shale production and our highest production ever in the Fayetteville Shale; |
| · | Adjusted net income of $178 million, or $0.50 per diluted share, when excluding gains and losses on derivative contracts that have not been settled (a non-GAAP measure reconciled below) compared to $180 million, or $0.51 per diluted share, in 2013; |
| · | Net cash provided by operating activities before changes in operating assets and liabilities for the quarter of approximately $504 million, compared to $528 million in 2013 (a non-GAAP measure reconciled below) and for the first nine months of 2014 and 2013 of approximately $1.7 billion and $1.4 billion, respectively; and |
| · | Delineation of Marcellus acreage and Upper Fayetteville development provide encouraging results |
“The strength of the portfolio continues to demonstrate our ability to generate record production and attractive returns,” commented Steve Mueller, President and Chief Executive Officer of Southwestern Energy. “Our Marcellus and Fayetteville areas each set new production records and both have encouraging results extending the producing area and testing new zones. This performance and the drive of the organization to continue to deliver better wells at lower cost provides a clear path to more records in the future.
In addition to delivering another outstanding quarter, last week we announced the signing of an agreement to potentially acquire another world class asset where we can apply what we have learned to deliver even more value for our shareholders.”
Third Quarter of 2014 Financial Results
For the third quarter of 2014, Southwestern reported adjusted net income of $178 million, or $0.50 per diluted share (reconciled below), when excluding a $54 million ($33 million net of taxes) gain on derivative contracts that have not been settled. For the third quarter of 2013, Southwestern reported adjusted net income of $180 million, or $0.51 per diluted share (reconciled below), when excluding a $10 million ($6 million net of taxes) gain on derivative contracts that have not been settled.
- MORE -
Net cash provided by operating activities before changes in operating assets and liabilities (reconciled below) was $504 million for the third quarter of 2014, down 5% compared to $528 million for the same period in 2013. This decrease was primarily due to current income tax expense of $32 million in 2014 compared to a current income tax benefit of $16 million in 2013.
E&P Segment – Operating income from the company’s E&P segment was $189 million for the third quarter of 2014, compared to $223 million for the same period in 2013. The decrease was due to lower realized natural gas prices and higher operating costs and expenses due to increased activity levels, partially offset by the revenue impact of increased production.
Gas and oil production totaled 196 Bcfe in the third quarter of 2014, up 14% from 172 Bcfe in the third quarter of 2013, and included 126 Bcf from the Fayetteville Shale, up from 123 Bcf in the third quarter of 2013. Gas production from the Marcellus Shale was 66 Bcf in the third quarter of 2014, a 47% increase from its production of 45 Bcf in the third quarter of 2013.
Including the effect of hedges, Southwestern’s average realized gas price in the third quarter of 2014 was $3.43 per Mcf, down from $3.61 per Mcf in the third quarter of 2013. The company’s commodity hedging activities increased its average realized gas price by $0.22 per Mcf during the third quarter of 2014, compared to an increase of $0.55 per Mcf during the same period in 2013. As of September 30, 2014, the company had approximately 117 Bcf of its remaining 2014 forecasted gas production hedged at an average price of $4.35 per Mcf and approximately 240 Bcf of its 2015 forecasted gas production hedged at an average price of $4.40 per Mcf.
Like most producers, the company typically sells its natural gas at a discount to NYMEX settlement prices. This discount includes a basis differential, third-party transportation charges and fuel charges. Disregarding the impact of hedges, the company’s average price received for its gas production during the third quarter of 2014 was approximately $0.85 per Mcf lower than average NYMEX settlement prices, compared to approximately $0.52 per Mcf lower during the third quarter of 2013. As of September 30, 2014, the company had protected approximately 101 Bcf of its remaining 2014 forecasted gas production from the potential of widening basis differentials through hedging activities and sales arrangements at an average positive basis differential to NYMEX gas prices of approximately $0.01 per Mcf, excluding transportation and fuel charges.
Lease operating expenses per unit of production for the company’s E&P segment were $0.91 per Mcfe in the third quarter of 2014, compared to $0.87 per Mcfe in the third quarter of 2013. The increase was primarily due to an increase in gathering costs in the Marcellus Shale and an increase in compression costs.
General and administrative expenses per unit of production were $0.23 per Mcfe in the third quarter of 2014, compared to $0.24 per Mcfe in the third quarter of 2013, down due to a larger increase in production volumes compared to the increase in personnel costs.
- MORE -
Taxes other than income taxes were $0.10 per Mcfe in the third quarter of 2014, compared to $0.09 per Mcfe in the third quarter of 2013. Taxes other than income taxes per Mcfe vary from period to period due to changes in severance and ad valorem taxes that result from the mix of the company’s production volumes and fluctuations in commodity prices.
The company’s full cost pool amortization rate was $1.09 per Mcfe in the third quarter of 2014, compared to $1.07 per Mcfe in the third quarter of 2013. The amortization rate is impacted by the timing and amount of reserve additions and the costs associated with those additions, revisions of previous reserve estimates due to both price and well performance, write-downs that result from full cost ceiling tests, proceeds from the sale of properties that reduce the full cost pool and the levels of costs subject to amortization. The company cannot predict its future full cost pool amortization rate with accuracy due to the variability of each of the factors discussed above, as well as other factors.
Midstream Services – Operating income for the company’s Midstream Services segment, which is comprised of natural gas gathering and marketing activities, was $97 million for the third quarter of 2014, up 13% from $86 million for the same period in 2013. Adjusted EBITDA for the segment was $111 million in the third quarter of 2014, up from $99 million in the same period in 2013 (a non-GAAP measure reconciled below). The growth in operating income and adjusted EBITDA was primarily due to increases in gas volumes gathered and marketing margins.
At September 30, 2014, the company’s midstream segment was gathering approximately 2.3 Bcf per day through 1,999 miles of gathering lines in the Fayetteville Shale and approximately 0.4 Bcf per day from 63 miles of owned gathering lines in the Marcellus Shale.
First Nine Months of 2014 Financial Results
For the first nine months of 2014, Southwestern reported adjusted net income of $616 million, or $1.75 per diluted share (reconciled below), when excluding a $7 million ($4 million net of taxes) loss on derivative contracts that have not been settled. For the first nine months of 2013, the company reported adjusted net income of $516 million, or $1.47 per diluted share (reconciled below), when excluding a $72 million ($43 million net of taxes) gain on derivative contracts that have not been settled.
Net cash provided by operating activities before changes in operating assets and liabilities (reconciled below) was $1.7 billion for the first nine months of 2014, up 18% from $1.4 billion for the same period in 2013.
- MORE -
E&P Segment – Operating income from the company’s E&P segment was $817 million for the nine months ended September 30, 2014, compared to $651 million for the same period in 2013. The increase was primarily due to higher production volumes and higher realized natural gas prices, offset by increased operating costs and expenses primarily associated with the expansion of our E&P operations due to the continued development of our Fayetteville Shale and Marcellus Shale assets.
Gas and oil production was 567 Bcfe in the first nine months of 2014, up 18% compared to 480 Bcfe in the first nine months of 2013, and included 369 Bcf from the Fayetteville Shale, up from 363 Bcf in the first nine months of 2013. Production from the Marcellus Shale was 185 Bcf in the first nine months of 2014, an 81% increase from 102 Bcf in the first nine months of 2013.
Southwestern’s average realized gas price was $3.79 per Mcf, including the effect of hedges, in the first nine months of 2014 compared to $3.64 per Mcf in the first nine months of 2013. The company’s hedging activities decreased the average gas price realized during the first nine months of 2014 by $0.12 per Mcf, compared to an increase of $0.46 per Mcf during the first nine months of 2013. Disregarding the impact of hedges, the average price received for the company’s gas production during the first nine months of 2014 was approximately $0.64 per Mcf lower than average monthly NYMEX settlement prices, compared to approximately $0.49 per Mcf during the first nine months of 2013.
Lease operating expenses for the company’s E&P segment were $0.91 per Mcfe in the first nine months of 2014, compared to $0.85 per Mcfe in the first nine months of 2013. The increase was primarily due to an increase in gathering costs in the Marcellus Shale and an increase in compression costs.
General and administrative expenses were $0.24 per Mcfe in the first nine months of 2014, compared to $0.23 per Mcfe in the first nine months of 2013. The increase was primarily due to higher personnel costs.
Taxes other than income taxes were $0.11 per Mcfe during the first nine months of 2014, compared to $0.10 per Mcfe in the first nine months of 2013. Taxes other than income taxes per Mcfe vary from period to period due to changes in severance and ad valorem taxes that result from the mix of production volumes and fluctuations in commodity prices.
The company’s full cost pool amortization rate increased to $1.10 per Mcfe in the first nine months of 2014, compared to $1.07 per Mcfe in the first nine months of 2013.
- MORE -
Midstream Services - Operating income for the company’s midstream activities was $272 million in the first nine months of 2014, up 16% compared to $235 million in the first nine months of 2013. Adjusted EBITDA for the segment was $315 million for the first nine months of 2014, up from $273 million in the same period in 2013 (a non-GAAP measure reconciled below). The increase in operating income and adjusted EBITDA was primarily due to increases in gas volumes gathered and marketing margins.
Capital Structure and Investments – At September 30, 2014, the company had approximately $1.8 billion in total debt, including approximately $139 million borrowed on its revolving credit facility, which was down from the $171 million borrowed at the end of the second quarter. The company’s debt-to-total capitalization ratio was 30% as of September 30, 2014.
During the first nine months of both 2014 and 2013, Southwestern invested a total of $1.8 billion. The 2014 investments included approximately $1.7 billion invested in its E&P business, $109 million invested in its Midstream Services segment and $22 million invested for corporate and other purposes.
E&P Operations Review
During the first nine months of 2014, Southwestern invested a total of approximately $1.7 billion in its E&P business, including $705 million in the Fayetteville Shale, $502 million in the Marcellus Shale, $247 million in the Niobrara, $97 million in the Brown Dense, $82 million for Drilling Rigs, $64 million in New Ventures, $7 million in E&P Services and $3 million in its Ark-La-Tex division.
Marcellus Shale – In the third quarter of 2014, Southwestern placed 18 new wells on production in the Marcellus Shale and had net gas production from the Marcellus Shale of 66 Bcf, up approximately 47% from 45 Bcf in the third quarter of 2013. Gross operated production in the Marcellus Shale was approximately 840 MMcf per day at September 30, 2014.
As of September 30, 2014, Southwestern had 234 operated wells on production and 102 wells in progress. Of the operated wells on production, 233 were horizontal wells of which 109 were located in Susquehanna County, 103 were located in Bradford County and 21 were located in Lycoming County. Of the 102 wells in progress, 36 were either waiting on completion or waiting to be placed to sales, including 19 in Susquehanna County, 16 in Bradford County and 1 in Wyoming County.
- MORE -
Results from the company’s drilling activities since the third quarter of 2010 are shown below.
| Time Frame | 30th-Day Avg Rate (# of wells) | Average Completed Lateral Length* | Average RE-RE (Rig Days) | Average Completed Well Cost ($MM) |
| 3rd Qtr 2010 | 1,405 (1) | 2,927 | 22.6 | $5.8 |
| 4th Qtr 2010 | 5,584 (6) | 3,805 | 19.8 | $7.1 |
| 1st Qtr 2011 | 5,052 (3) | 3,864 | 18.1 | $6.6 |
| 2nd Qtr 2011 | 6,114 (7) | 4,780 | 13.4 | $6.7 |
| 4th Qtr 2011 | 5,284 (5) | 4,129 | 18.8 | $6.0 |
| 1st Qtr 2012 | 7,327 (2) | 4,009 | 13.2 | $6.0 |
| 2nd Qtr 2012 | 3,859 (17) | 3,934 | 12.9 | $6.0 |
| 3rd Qtr 2012 | 4,493 (8) | 4,380 | 13.2 | $5.7 |
| 4th Qtr 2012 | 4,606 (22) | 3,830 | 15.9 | $7.0 |
| 1st Qtr 2013 | 5,356 (21) | 4,712 | 11.0 | $7.0 |
| 2nd Qtr 2013 | 5,530 (37) | 4,371 | 11.6 | $6.6 |
| 3rd Qtr 2013 | 4,470 (22) | 4,740 | 11.5 | $7.3 |
| 4th Qtr 2013 | 7,589 (20) | 6,116 | 10.2 | $7.1 |
| 1st Qtr 2014 | 7,009 (21) | 3,859 | 10.5 | $6.2 |
| 2nd Qtr 2014 | 6,772 (23) | 4,982 | 10.3 | $6.7 |
| 3rd Qtr 2014 | 6,068 (14) | 5,100 | 10.2 | $6.7 |
*Average CLAT of wells that have produced for 30 days.
Southwestern continues to test the Upper Marcellus formation where 3 wells have been drilled to date and are expected to be completed in the fourth quarter of 2014. One additional well is scheduled to be drilled in the fourth quarter of 2014 and completed in the first quarter of 2015. Additionally, testing continues on the acreage in Wyoming, Sullivan and Tioga Counties that was acquired in 2013, including the Dimmig 2H, the company’s first horizontal well in Wyoming County. That well is currently testing and the initial results are encouraging. We also recently began drilling our first well in Tioga County.
Two wells have also been drilled near the New York border in Susquehanna County. Early results are positive and work has begun to build a gathering system for future development in this area.
- MORE -
The graph below provides normalized average daily production data through September 30, 2014, for the company’s horizontal wells in the Marcellus Shale. The “pink curve” indicates results for 59 wells with more than 18 fracture stimulation stages, the “purple curve” indicates results for 104 wells with 13 to 18 fracture stimulation stages, the “orange curve” indicates results for 65 wells with 9 to 12 fracture stimulation stages and the “green curve” indicates results for 5 wells with less than 9 fracture stimulation stages. The normalized production curves are intended to provide a qualitative indication of the company’s Marcellus Shale wells’ performance and should not be used to estimate an individual well’s estimated ultimate recovery. The 4, 8, 12 and 16 Bcf type curves are shown solely for reference purposes and are not intended to be projections of the performance of the company’s wells.
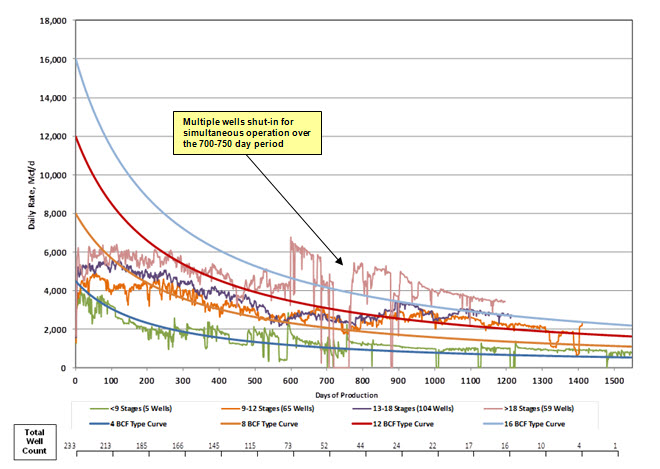
Note: Data as of September 30, 2014
Fayetteville Shale – In the third quarter of 2014, Southwestern placed 106 new wells on production in the Fayetteville Shale and had net gas production from the Fayetteville Shale of 126 Bcf in the third quarter of 2014, compared to 123 Bcf in the third quarter of 2013. Gross operated gas production in the Fayetteville Shale was approximately 2,058 MMcf per day at September 30, 2014.
- MORE -
During the third quarter of 2014, the company’s horizontal wells in the Fayetteville Shale had an average completed well cost of $2.4 million per well, average horizontal lateral length of 5,202 feet and average time to drill to total depth of 6.5 days from re-entry to re-entry. This compares to an average horizontal lateral length of 5,382 feet and average time to drill to total depth of 6.7 days from re-entry to re-entry for an average completed well cost of $2.5 million per well in the second quarter of 2014. In the third quarter of 2014, the company had 23 operated wells placed on production which had average times to drill to total depth of 5 days or less from re-entry to re-entry. Since inception, the company has drilled 334 wells to total depth in 5 days or less from re-entry to re-entry in the Fayetteville Shale.
In the third quarter of 2014, the company placed 36 operated wells on production with initial production rates that exceeded 5,000 Mcf per day, and 13 wells that exceeded 6,000 Mcf per day. To date, the company has placed a total of 466 wells on production with initial production rates greater than 5,000 Mcf per day, of which 145 wells have been in the past year. The company’s wells placed on production during the third quarter of 2014 averaged initial production rates of 4,303 Mcf per day. Results from the company’s drilling activities since the first quarter of 2007 are shown below.
| Time Frame | Wells Placed on Production | Average IP Rate (Mcf/d) | 30th-Day Avg Rate (# of wells) | 60th-Day Avg Rate (# of wells) | Average Lateral Length |
| 1st Qtr 2007 | 58 | 1,261 | 1,066 (58) | 958 (58) | 2,104 |
| 2nd Qtr 2007 | 46 | 1,497 | 1,254 (46) | 1,034 (46) | 2,512 |
| 3rd Qtr 2007 | 74 | 1,769 | 1,510 (72) | 1,334 (72) | 2,622 |
| 4th Qtr 2007 | 77 | 2,027 | 1,690 (77) | 1,481 (77) | 3,193 |
| 1st Qtr 2008 | 75 | 2,343 | 2,147 (75) | 1,943 (74) | 3,301 |
| 2nd Qtr 2008 | 83 | 2,541 | 2,155 (83) | 1,886 (83) | 3,562 |
| 3rd Qtr 2008 | 97 | 2,882 | 2,560 (97) | 2,349 (97) | 3,736 |
| 4th Qtr 2008(1) | 74 | 3,350(1) | 2,722 (74) | 2,386 (74) | 3,850 |
| 1st Qtr 2009(1) | 120 | 2,992(1) | 2,537 (120) | 2,293 (120) | 3,874 |
| 2nd Qtr 2009 | 111 | 3,611 | 2,833 (111) | 2,556 (111) | 4,123 |
| 3rd Qtr 2009 | 93 | 3,604 | 2,624 (93) | 2,255 (93) | 4,100 |
| 4th Qtr 2009 | 122 | 3,727 | 2,674 (122) | 2,360 (120) | 4,303 |
| 1st Qtr 2010(2) | 106 | 3,197(2) | 2,388 (106) | 2,123 (106) | 4,348 |
| 2nd Qtr 2010 | 143 | 3,449 | 2,554 (143) | 2,321 (142) | 4,532 |
| 3rd Qtr 2010 | 145 | 3,281 | 2,448 (145) | 2,202 (144) | 4,503 |
| 4th Qtr 2010 | 159 | 3,472 | 2,678 (159) | 2,294 (159) | 4,667 |
| 1st Qtr 2011 | 137 | 3,231 | 2,604 (137) | 2,238 (137) | 4,985 |
| 2nd Qtr 2011 | 149 | 3,014 | 2,328 (149) | 1,991 (149) | 4,839 |
| 3rd Qtr 2011 | 132 | 3,443 | 2,666 (132) | 2,372 (132) | 4,847 |
| 4th Qtr 2011 | 142 | 3,646 | 2,606 (142) | 2,243 (142) | 4,703 |
| 1st Qtr 2012 | 146 | 3,319 | 2,421 (146) | 2,131 (146) | 4,743 |
| 2nd Qtr 2012 | 131 | 3,500 | 2,515 (131) | 2,225 (131) | 4,840 |
| 3rd Qtr 2012 | 105 | 3,857 | 2,816 (105) | 2,447 (105) | 4,974 |
| 4th Qtr 2012 | 111 | 3,962 | 2,815 (111) | 2,405 (111) | 4,784 |
| 1st Qtr 2013 | 102 | 3,301 | 2,366 (102) | 2,069 (102) | 4,942 |
| 2nd Qtr 2013 | 126 | 3,625 | 2,233 (126) | 1,975 (126) | 5,165 |
| 3rd Qtr 2013 | 89 | 4,597 | 2,696 (89) | 2,391 (89) | 5,490 |
| 4th Qtr 2013 | 97 | 4,901 | 2,798 (97) | 2,553 (97) | 5,976 |
| 1st Qtr 2014 | 105 | 4,272 | 2,616 (105) | 2,205 (105) | 5,680 |
| 2nd Qtr 2014 | 148 | 4,369 | 2,718 (148) | 2,191 (117) | 5,382 |
| 3rd Qtr 2014 | 106 | 4,303 | 2,780 (90) | 2,466 (50) | 5,202 |
Note: Results as of September 30, 2014.
| (1) | The significant increase in the average initial production rate for the fourth quarter of 2008 and the subsequent decrease for the first quarter of 2009 is primarily due to an operational delay of the Boardwalk Pipeline. |
| (2) | In the first quarter of 2010, the company’s results were impacted by the shift of all wells to “green completions” and the mix of wells, as a large percentage of wells were placed on production in the shallower northern and far eastern borders of the company’s acreage. |
- MORE -
In the Upper Fayetteville formation, the company has placed 15 wells on production to date with an average initial production rate of 3.4 million cubic feet of gas per day. Three of these wells had an average initial production rate over 5.0 million cubic feet of gas per day, with the highest initial production rate being 6.6 million cubic feet of gas per day. The company plans to drill five additional Upper Fayetteville wells in the fourth quarter and complete them in early 2015.
Ark-La-Tex – Total net production from the company’s East Texas and conventional Arkoma Basin assets was 12.0 Bcfe in the first nine months of 2014, compared to 14.1 Bcfe in the first nine months of 2013.
New Ventures – Through the end of the third quarter, the company has acquired or leased a total of 380,000 net acres in northwest Colorado. Testing of this acreage is progressing as the company has drilled three vertical wells to date that are in various stages of testing. The first horizontal well is currently drilling and an additional vertical well is planned for the fourth quarter.
Explanation and Reconciliation of Non-GAAP Financial Measures
The company reports its financial results in accordance with accounting principles generally accepted in the United States of America (“GAAP”). However, management believes certain non-GAAP performance measures may provide financial statement users with additional meaningful comparisons between current results and the results of its peers and of prior periods.
One such non-GAAP financial measure is net cash provided by operating activities before changes in operating assets and liabilities. Management presents this measure because (i) it is accepted as an indicator of an oil and gas exploration and production company’s ability to internally fund exploration and development activities and to service or incur additional debt, (ii) changes in operating assets and liabilities relate to the timing of cash receipts and disbursements which the company may not control and (iii) changes in operating assets and liabilities may not relate to the period in which the operating activities occurred.
Additional non-GAAP financial measures the company may present from time to time are adjusted net income, adjusted diluted earnings per share, adjusted EBITDA and its E&P segment operating income, all which exclude certain charges or amounts. Management presents these measures because (i) they are consistent with the manner in which the company’s performance is measured relative to the performance of its peers, (ii) these measures are more comparable to earnings estimates provided by securities analysts, and (iii) charges or amounts excluded cannot be reasonably estimated and guidance provided by the company excludes information regarding these types of items. These adjusted amounts are not a measure of financial performance under GAAP.
- MORE -
See the reconciliations below of GAAP financial measures to non-GAAP financial measures for the three and nine months ended September 30, 2014 and September 30, 2013, respectively. Non-GAAP financial measures should not be considered in isolation or as a substitute for the company's reported results prepared in accordance with GAAP.
|
| 3 Months Ended September 30, | ||
|
| 2014 |
| 2013 |
|
| (in millions) | ||
| Net income: |
|
|
|
| Net income | $ 211 |
| $ 186 |
| Add back (deduct): |
|
|
|
| Loss (gain) on derivatives excluding derivatives, settled (net of taxes) | (33) |
| (6) |
| Adjusted net income | $ 178 | $ 180 | |
|
| 9 Months Ended September 30, | ||
|
| 2014 |
| 2013 |
|
| (in millions) | ||
| Net income: |
|
|
|
| Net income | $ 612 |
| $ 559 |
| Add back (deduct): |
|
|
|
| Loss (gain) on derivatives excluding derivatives, settled (net of taxes) | 4 |
| (43) |
| Adjusted net income | $ 616 | $ 516 | |
|
| 3 Months Ended September 30, | ||
|
| 2014 |
| 2013 |
|
|
| ||
| Diluted earnings per share: |
|
|
|
| Diluted earnings per share | $ 0.60 |
| $ 0.53 |
| Add back (deduct): |
|
|
|
| Loss (gain) on derivatives excluding derivatives, settled (net of taxes) | (0.10) |
| (0.02) |
| Adjusted diluted earnings per share | $ 0.50 | $ 0.51 | |
|
| 9 Months Ended September 30, | ||
|
| 2014 |
| 2013 |
|
|
| ||
| Diluted earnings per share: |
|
|
|
| Diluted earnings per share | $ 1.74 |
| $ 1.59 |
| Add back (deduct): |
|
|
|
| Loss (gain) on derivatives excluding derivatives, settled (net of taxes) | 0.01 |
| (0.12) |
| Adjusted diluted earnings per share | $ 1.75 | $ 1.47 | |
- MORE -
|
| 3 Months Ended September 30, | ||
|
| 2014 |
| 2013 |
|
| (in millions) | ||
| Cash flow from operating activities: |
|
|
|
| Net cash provided by operating activities | $ 580 |
| $ 500 |
| Add back (deduct): |
|
|
|
| Change in operating assets and liabilities | (76) |
| 28 |
| Net cash provided by operating activities before changes in operating assets and liabilities | $ 504 | $ 528 | |
|
| 9 Months Ended September 30, | ||
|
| 2014 |
| 2013 |
|
| (in millions) | ||
| Cash flow from operating activities: |
|
|
|
| Net cash provided by operating activities | $ 1,774 |
| $ 1,378 |
| Add back (deduct): |
|
|
|
| Change in operating assets and liabilities | (74) |
| 68 |
| Net cash provided by operating activities before changes in operating assets and liabilities | $ 1,700 | $ 1,446 | |
|
| 3 Months Ended September 30, | ||
|
| 2014 |
| 2013 |
|
| (in millions) | ||
| Midstream Services adjusted EBITDA(1): |
|
|
|
| Net income | $ 60 |
| $ 49 |
| Add back (deduct): |
|
|
|
| Loss (gain) on derivatives excluding derivatives, settled | – |
| (1) |
| Net interest expense | 2 | 2 | |
| Provision for income taxes | 34 | 36 | |
| Depreciation, depletion and amortization expense | 15 | 13 | |
| Adjusted EBITDA | $ 111 | $ 99 | |
|
| 9 Months Ended September 30, | ||
|
| 2014 |
| 2013 |
|
| (in millions) | ||
| Midstream Services adjusted EBITDA(1): |
|
|
|
| Net income | $ 161 |
| $ 138 |
| Add back (deduct): |
|
|
|
| Loss (gain) on derivatives excluding derivatives, settled | 1 | (1) | |
| Net interest expense | 9 | 8 | |
| Provision for income taxes | 101 | 91 | |
| Depreciation, depletion and amortization expense | 43 | 37 | |
| Adjusted EBITDA | $ 315 | $ 273 | |
| (1) | Adjusted EBITDA is defined as net income plus interest, income tax expense, loss (gain) on derivatives excluding derivatives, settled and depreciation, depletion and amortization. |
- MORE -
Southwestern management will host a teleconference call on Friday, October 24, 2014 at 10:00 a.m. EDT to discuss its third quarter 2014 results. The toll-free number to call is 877-407-8035 and the international dial-in number is 201-689-8035. The teleconference can also be heard “live” on the Internet at http://www.swn.com.
Southwestern Energy Company is an independent energy company whose wholly-owned subsidiaries are engaged in natural gas and oil exploration and production and natural gas gathering and marketing. Additional information about the company can be found on the internet at http://www.swn.com.
| Contacts: | R. Craig Owen | Michael Hancock |
|
| Senior Vice President | Director, Investor Relations |
|
| and Chief Financial Officer | (281) 618-7367 |
|
| (281) 618-2808 |
|
All statements, other than historical facts and financial information, may be deemed to be forward-looking statements within the meaning of Section 27A of the Securities Act of 1933, as amended, and Section 21E of the Securities Exchange Act of 1934, as amended. All statements that address activities, outcomes and other matters that should or may occur in the future, including, without limitation, statements regarding the financial position, business strategy, production and reserve growth and other plans and objectives for the company’s future operations, are forward-looking statements. Although the company believes the expectations expressed in such forward-looking statements are based on reasonable assumptions, such statements are not guarantees of future performance and actual results or developments may differ materially from those in the forward-looking statements. The company has no obligation and makes no undertaking to publicly update or revise any forward-looking statements, other than to the extent set forth below. You should not place undue reliance on forward-looking statements. They are subject to known and unknown risks, uncertainties and other factors that may affect the company’s operations, markets, products, services and prices and cause its actual results, performance or achievements to be materially different from any future results, performance or achievements expressed or implied by the forward-looking statements. In addition to any assumptions and other factors referred to specifically in connection with forward-looking statements, risks, uncertainties and factors that could cause the company’s actual results to differ materially from those indicated in any forward-looking statement include, but are not limited to: the timing and extent of changes in market conditions and prices for natural gas and oil (including regional basis differentials); the company’s ability to transport its production to the most favorable markets or at all; the timing and extent of the company’s success in discovering, developing, producing and estimating reserves; the economic viability of, and the company’s success in drilling, the company’s large acreage position in the Fayetteville Shale, overall as well as relative to other productive shale gas areas; the company’s ability to fund the company’s planned capital investments; the impact of federal, state and local government regulation, including any legislation relating to hydraulic fracturing, the climate or over the counter derivatives; the company’s ability to determine the most effective and economic fracture stimulation for the Fayetteville Shale and the Marcellus Shale; the costs and availability of oil field personnel services and drilling supplies, raw materials, and equipment and services; the company’s future property acquisition or divestiture activities; increased competition; the financial impact of accounting regulations and critical accounting policies; the comparative cost of alternative fuels; conditions in capital markets, changes in interest rates and the ability of the company’s lenders to provide it with funds as agreed; credit risk relating to the risk of loss as a result of non-performance by the company’s counterparties and any other factors listed in the reports the company has filed and may file with the Securities and Exchange Commission (SEC). For additional information with respect to certain of these and other factors, see the reports filed by the company with the SEC. The company disclaims any intention or obligation to update or revise any forward-looking statements, whether as a result of new information, future events or otherwise.
Financial Summary Follows
# # #
| OPERATING STATISTICS (Unaudited) | Page 1 of 5 | |||||||||||
| Southwestern Energy Company and Subsidiaries | ||||||||||||
| Three Months | Nine Months | |||||||||||
| Periods Ended September 30, | 2014 | 2013 | 2014 | 2013 | ||||||||
| Exploration & Production | ||||||||||||
| Production | ||||||||||||
| Gas Production ( Bcf) | 196 | 172 | 566 | 479 | ||||||||
| Oil Production (MBbls) | 51 | 37 | 114 | 102 | ||||||||
| NGL production (MBbls) | 11 | 12 | 27 | 40 | ||||||||
| Total equivalent production (Bcfe) | 196 | 172 | 567 | 480 | ||||||||
| Commodity Prices | ||||||||||||
| Average realized gas price per Mcf, including hedges | $ | 3.43 | $ | 3.61 | $ | 3.79 | $ | 3.64 | ||||
| Average realized gas price per Mcf, excluding hedges | $ | 3.21 | $ | 3.06 | $ | 3.91 | $ | 3.18 | ||||
| Average oil price per Bbl | $ | 97.71 | $ | 106.72 | $ | 100.39 | $ | 105.05 | ||||
| Average NGL price per Bbl | $ | 35.57 | $ | 42.05 | $ | 40.73 | $ | 44.20 | ||||
| Summary of Derivatives Activity in the Statement of Operations | ||||||||||||
| Settled Commodity Amounts included in "Operating Revenues" | $ | 18 | $ | 93 | $ | (48) | $ | 218 | ||||
| Settled Commodity Amounts included in "Gain (Loss) on Derivatives" |
| $ | 24 |
| $ | 2 |
| $ | (22) |
| $ | 3 |
| Unsettled Commodity Amounts included in "Gain (Loss) on Derivatives" |
| $ | 54 |
| $ | 10 |
| $ | (7) |
| $ | 72 |
| Operating Expenses per Mcfe | ||||||||||||
| Lease operating expenses | $ | 0.91 | $ | 0.87 | $ | 0.91 | $ | 0.85 | ||||
| General & administrative expenses | $ | 0.23 | $ | 0.24 | $ | 0.24 | $ | 0.23 | ||||
| Taxes, other than income taxes | $ | 0.10 | $ | 0.09 | $ | 0.11 | $ | 0.10 | ||||
| Full cost pool amortization | $ | 1.09 | $ | 1.07 | $ | 1.10 | $ | 1.07 | ||||
| Midstream | ||||||||||||
| Gas volumes marketed (Bcf) | 229 | 206 | 670 | 575 | ||||||||
| Gas volumes gathered (Bcf) | 247 | 230 | 719 | 667 | ||||||||
| STATEMENTS OF OPERATIONS (Unaudited) | Page 2 of 5 | |||||||||||
| Southwestern Energy Company and Subsidiaries | ||||||||||||
| Three Months | Nine Months | |||||||||||
| Periods Ended September 30, | 2014 | 2013 | 2014 | 2013 | ||||||||
| (in millions, except share/per amounts) | ||||||||||||
| Operating Revenues | ||||||||||||
| Gas sales | $ | 645 | $ | 617 | $ | 2,155 | $ | 1,736 | ||||
| Gas marketing | 227 | 201 | 765 | 582 | ||||||||
| Oil sales | 6 | 4 | 13 | 12 | ||||||||
| Gas gathering | 50 | 46 | 143 | 134 | ||||||||
| 928 | 868 | 3,076 | 2,464 | |||||||||
| Operating Costs and Expenses | ||||||||||||
| Gas purchases - midstream services | 220 | 195 | 752 | 575 | ||||||||
| Operating expenses | 108 | 90 | 309 | 237 | ||||||||
| General and administrative expenses | 54 | 51 | 162 | 136 | ||||||||
| Depreciation, depletion and amortization | 238 | 205 | 693 | 571 | ||||||||
| Taxes, other than income taxes | 22 | 18 | 72 | 59 | ||||||||
| 642 | 559 | 1,988 | 1,578 | |||||||||
| Operating Income | 286 | 309 | 1,088 | 886 | ||||||||
| Interest Expense | ||||||||||||
| Interest on debt | 25 | 25 | 75 | 74 | ||||||||
| Other interest charges | 2 | 1 | 4 | 3 | ||||||||
| Interest capitalized | (14) | (15) | (40) | (48) | ||||||||
| 13 | 11 | 39 | 29 | |||||||||
| Other Gain, Net | – | – | 1 | – | ||||||||
| Gain (Loss) on Derivatives | 78 | 12 | (29) | 75 | ||||||||
| Income Before Income Taxes | 351 | 310 | 1,021 | 932 | ||||||||
| Provision for Income Taxes | ||||||||||||
| Current | 32 | (16) | 34 | – | ||||||||
| Deferred | 108 | 140 | 375 | 373 | ||||||||
| 140 | 124 | 409 | 373 | |||||||||
| Net Income | $ | 211 | $ | 186 | $ | 612 | $ | 559 | ||||
| Earnings Per Share | ||||||||||||
| Basic | $ | 0.60 | $ | 0.53 | $ | 1.74 | $ | 1.60 | ||||
| Diluted | $ | 0.60 | $ | 0.53 | $ | 1.74 | $ | 1.59 | ||||
| Weighted Average Common Shares Outstanding | ||||||||||||
| Basic | 351,457,043 | 350,517,337 | 351,357,913 | 350,334,634 | ||||||||
| Diluted | 352,327,250 | 351,222,830 | 352,334,546 | 351,014,974 | ||||||||
| BALANCE SHEETS (Unaudited) | Page 3 of 5 | |||||
| Southwestern Energy Company and Subsidiaries | ||||||
| September 30, | December 31, | |||||
| (in millions) | ||||||
| ASSETS | ||||||
| Current Assets | $ | 660 | $ | 644 | ||
| Property and Equipment | 17,045 | 15,303 | ||||
| Less: Accumulated depreciation, depletion and amortization | (8,652) | (8,006) | ||||
| 8,393 | 7,297 | |||||
| Other Long-Term Assets | 124 | 107 | ||||
| 9,177 | 8,048 | |||||
| LIABILITIES AND EQUITY | ||||||
| Current Liabilities | 888 | 688 | ||||
| Long-Term Debt | 1,806 | 1,950 | ||||
| Deferred Income Taxes | 1,913 | 1,532 | ||||
| Other Long-Term Liabilities | 277 | 256 | ||||
| Commitments and Contingencies | ||||||
| Equity | ||||||
| Common stock, $0.01 par value; authorized 1,250,000,000 | 4 | 4 | ||||
| Additional paid-in capital | 1,005 | 969 | ||||
| Retained earnings | 3,265 | 2,653 | ||||
| Accumulated other comprehensive income | 19 | (4) | ||||
| Total Equity | 4,293 | 3,622 | ||||
| $ | 9,177 | $ | 8,048 | |||
| STATEMENTS OF CASH FLOWS (Unaudited) | Page 4 of 5 | |||||
| Southwestern Energy Company and Subsidiaries | ||||||
| Nine Months | ||||||
| Periods Ended September 30, | 2014 | 2013 | ||||
| (in millions) | ||||||
| Cash Flows From Operating Activities | ||||||
| Net Income | $ | 612 | $ | 559 | ||
| Adjustment to reconcile net income to net cash provided by operating | ||||||
| Depreciation, depletion and amortization | 693 | 571 | ||||
| Amortization of debt expense | 3 | 3 | ||||
| Deferred income taxes | 375 | 373 | ||||
| (Gain) loss on derivatives excluding derivatives, settled | 7 | (72) | ||||
| Stock-based compensation | 13 | 9 | ||||
| Other | (3) | 3 | ||||
| Change in assets and liabilities | 74 | (68) | ||||
| Net cash provided by operating activities | 1,774 | 1,378 | ||||
| Cash Flows From Investing Activities | ||||||
| Capital investments | (1,713) | (1,728) | ||||
| Proceeds from sale of property and equipment | 20 | 3 | ||||
| Transfers from restricted cash | – | 9 | ||||
| Other | 6 | 4 | ||||
| Net cash used in investing activities | (1,687) | (1,712) | ||||
| Cash Flows From Financing Activities | ||||||
| Payments on current portion of long-term debt | (1) | (1) | ||||
| Payments on revolving long-term debt | (3,573) | (2,135) | ||||
| Borrowings under revolving long-term debt | 3,429 | 2,378 | ||||
| Change in bank drafts outstanding | 45 | 50 | ||||
| Proceeds from exercise of common stock options | 10 | 7 | ||||
| Net cash (used in) provided by financing activities | (90) | 299 | ||||
| Decrease in cash and cash equivalents | (3) | (35) | ||||
| Cash and cash equivalents at beginning of year | 23 | 54 | ||||
| Cash and cash equivalents at end of period | $ | 20 | $ | 19 | ||
| SEGMENT INFORMATION (Unaudited) | Page 5 of 5 | ||||||||||||||
| Southwestern Energy Company and Subsidiaries | Exploration | ||||||||||||||
| and | Midstream | ||||||||||||||
| Production | Services | Other | Eliminations | Total | |||||||||||
| (in millions) | |||||||||||||||
| Three months ending September 30, 2014 | |||||||||||||||
| Revenues | $ | 655 | 983 | – | (710) | 928 | |||||||||
| Gas purchases | – | 822 | – | (602) | 220 | ||||||||||
| Operating expenses | 178 | 38 | – | (108) | 108 | ||||||||||
| General & administrative expenses | 45 | 9 | – | – | 54 | ||||||||||
| Depreciation, depletion & amortization |
|
| 223 |
|
| 15 |
|
| – |
|
| – |
|
| 238 |
| Taxes, other than income taxes | 20 | 2 | – | – | 22 | ||||||||||
| Operating income | 189 | 97 | – | – | 286 | ||||||||||
| Capital investments(1) | 531 | 34 | 9 | – | 574 | ||||||||||
| Three months ending September 30, 2013 |
|
|
|
|
|
|
|
|
|
|
|
|
|
|
|
| Revenues | $ | 623 | 847 | $ | – | $ | (602) | $ | 868 | ||||||
| Gas purchases | – | 701 | – | (506) | 195 | ||||||||||
| Operating expenses | 151 | 35 | – | (96) | 90 | ||||||||||
| General & administrative expenses | 42 | 9 | – | – | 51 | ||||||||||
| Depreciation, depletion & amortization | 192 | 13 | – | – | 205 | ||||||||||
| Taxes, other than income taxes | 15 | 3 | – | – | 18 | ||||||||||
| Operating income | 223 | 86 | – | – | 309 | ||||||||||
| Capital investments(1) | 496 | 40 | 6 | – | 542 | ||||||||||
| Nine months ending September 30, 2014 | |||||||||||||||
| Revenues | $ | 2,182 | $ | 3,344 | $ | – | $ | (2,450) | $ | 3,076 | |||||
| Gas purchases | – | 2,883 | – | (2,131) | 752 | ||||||||||
| Operating expenses | 517 | 111 | – | (319) | 309 | ||||||||||
| General & administrative expenses | 134 | 28 | – | – | 162 | ||||||||||
| Depreciation, depletion & amortization |
|
| 650 |
|
| 43 |
|
| – |
|
| – |
|
| 693 |
| Taxes, other than income taxes | 64 | 7 | 1 | – | 72 | ||||||||||
| Operating income (loss) | 817 | 272 | (1) | – | 1,088 | ||||||||||
| Capital investments(1) | 1,706 | 109 | 22 | – | 1,837 | ||||||||||
| Nine months ending September 30, 2013 | |||||||||||||||
| Revenues | $ | 1,753 | $ | 2,455 | $ | – | $ | (1,744) | $ | 2,464 | |||||
| Gas purchases | – | 2,043 | – | (1,468) | 575 | ||||||||||
| Operating expenses | 406 | 107 | – | (276) | 237 | ||||||||||
| General & administrative expenses | 112 | 24 | – | – | 136 | ||||||||||
| Depreciation, depletion & amortization | 534 | 37 | – | – | 571 | ||||||||||
| Taxes, other than income taxes | 50 | 9 | – | – | 59 | ||||||||||
| Operating income | 651 | 235 | – | – | 886 | ||||||||||
| Capital investments(1) | 1,603 | 135 | 17 | – | 1,755 | ||||||||||
|
| |||||||||||||||
| (1) Capital investments includes increases of $53 million and decreases of $15 million for the three month periods ended September 30, 2014 and 2013, respectively, and increases of $114 million and $26 million for the nine month periods ended September 30, 2014 and 2013, respectively, relating to the change in accrued expenditures between periods. | |||||||||||||||