Attached files
| file | filename |
|---|---|
| 8-K - 8-K - IBERIABANK CORP | d809272d8k.htm |
| EX-99.1 - EX-99.1 - IBERIABANK CORP | d809272dex991.htm |
 MAKING
THE MOST OF IT 3Q14 Earnings Conference Call
Supplemental Presentation
October 22, 2014
Exhibit 99.2 |
 Safe
Harbor And Legend 2
To the extent that statements in this press release and the accompanying PowerPoint presentation
relate to future plans, objectives, financial results or performance of IBERIABANK Corporation,
these statements are deemed to be forward-looking statements within the meaning of the
Private Securities Litigation Reform Act of 1995. Such statements, which are based on
management’s current information, estimates and assumptions and the current economic
environment, are generally identified by the use of the words “plan”,
“believe”, “expect”, “intend”, “anticipate”, “estimate”, “project” or similar expressions. The
Company’s actual strategies, results and financial condition in future periods may differ
materially from those currently expected due to various risks and uncertainties.
Forward-looking statements are subject to numerous assumptions, risks and uncertainties
that change over time and could cause actual results or financial condition to differ
materially from those expressed in or implied by such statements. Consequently, no
forward-looking statement can be guaranteed.
In connection with the proposed merger with Florida Bank Group, Inc., IBERIABANK Corporation
intends to file a Registration Statement on Form S-4 that will contain a proxy statement /
prospectus. INVESTORS AND SECURITY HOLDERS ARE URGED TO CAREFULLY READ THE PROXY
STATEMENT / PROSPECTUS REGARDING THE PROPOSED TRANSACTION, BECAUSE IT
CONTAINS IMPORTANT INFORMATION. Investors and security holders may obtain a free copy of the
proxy statement / prospectus and other documents containing information about IBERIABANK
Corporation and Florida Bank Group, Inc., without charge, at the SEC’s website at
http://www.sec.gov. Copies of the proxy statement / prospectus and the SEC filings that will be
incorporated by reference in the proxy statement / prospectus may also be obtained for free
from the IBERIABANK Corporation website, www.iberiabank.com, under the heading “Investor
Information”.
This communication is not a solicitation of any vote or approval, is not an offer to purchase shares
of common stock of Florida Bank Group, Inc., nor is it an offer to sell shares of IBERIABANK
Corporation common stock which may be issued in the proposed merger. The issuance of
IBERIABANK Corporation common stock in any proposed merger would have to be registered under
the Securities Act of 1933, as amended, and such IBERIABANK Corporation common stock would be
offered only by means of a prospectus complying with the Act. |
 3
•
Reported EPS of $0.89 and non-GAAP operating EPS of $1.00
•
Tax equivalent net interest income increased $12.0 million, or 11% from 2Q14, while
average earning assets increased $1.3 billion, or 10%
•
Acquisition
of
Florida
Bank
Group,
Inc.
announced
on
October
3,
2014
–
anticipate
closing
the transaction in the first quarter of 2015
•
Branch and systems conversion of First Private Bank completed over the weekend of
September 6-7, 2014
•
Legacy loan growth:
•
Legacy deposit growth:
•
Net interest margin decreased one bp to 3.47% from June 30, 2014, due mainly to a
one bp increase
in
the
yield
on
earning
assets
offset
by
a
three
bp
increase
in
cost
of
funds
--
within
previously disclosed guidance range of 3.45% to 3.50%
•
Operating tangible efficiency ratio improved from 68.3% to 66.4%
•
Tax-equivalent operating revenues increased $9.1 million, or 6%, on a linked
quarter basis while operating expenses increased $3.4 million, or 3%,
resulting in improved operating leverage
Overview
Introductory Comments
$348 million since June 30, 2014 (+16% annualized), including $146 million
of Commercial and $202 million of Small Business and Consumer
Growth in the loan portfolio was balanced with 58% Retail and Small
Business and 42% Commercial
$397 million since June 30, 2014 (+13% annualized)
$110 million increase in non-interest bearing deposits (+14% annualized)
|
 4
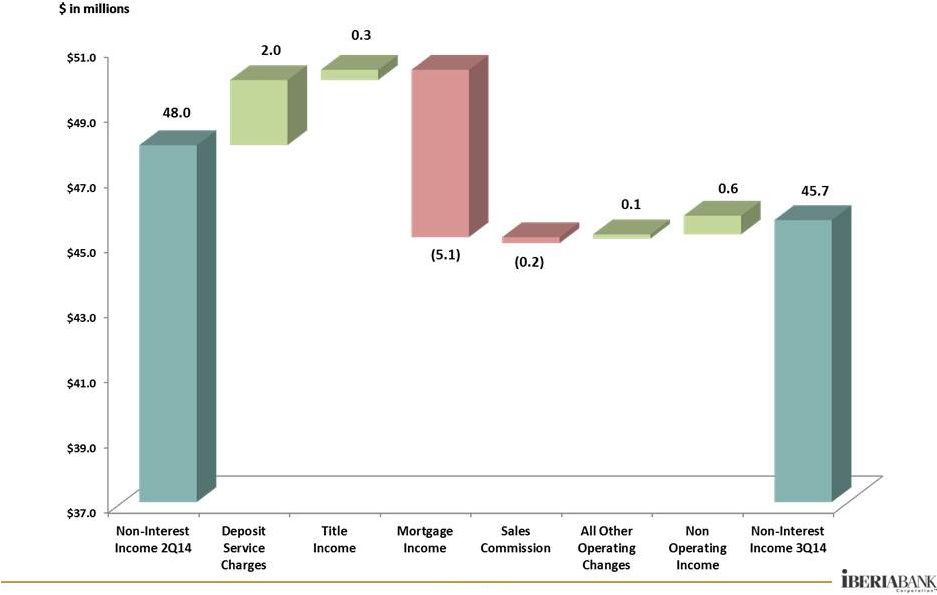
Overview
Non-Interest Income –
3Q14 Components
•
Operating non-interest income
decreased $2.9 million, or -6%,
on a linked quarter basis |
 5
•
Non-operating
non-interest
expense of $6.4
million before-tax,
or $4.2 million
after-tax or $0.12
per share
•
Operating non-
interest expense
increased $3.4
million, or 3%, on
a linked-quarter
basis
•
$1.7 million of the
operating expense
increase was due
to the full quarter
impact of Teche
and First Private
Overview
Non-Interest Expense –
3Q14 Components |
| 6
Overview
Small Business and Retail –
3Q14 Progress
Excludes acquired loans and deposits
•
Small Business loan growth of $87 million, or +12%, on a linked-quarter basis
•
Indirect loan growth of $3 million, or +1%, on a linked-quarter basis
•
Consumer Direct & Mortgage loan growth of $128 million, or +7%, on a linked
quarter basis
•
Credit Card loan growth of $3 million, or +5%, on a linked quarter basis
•
Checking account growth:
•
Small Business checking accounts increased 13% year-over-year
and an annualized 9% on a linked quarter basis
•
Consumer checking accounts increased slightly year-over-year but
decreased an annualized 6% on a linked quarter basis due to
expected attrition from recently converted Teche portfolio
•
Continued focus on productivity and efficiency of the delivery network –
opened one branch in 3Q14, did not close any branches in 3Q14, and two
additional branch openings targeted by year-end 2014
•
Acceptance and usage of digital delivery continues to increase among our
client base |
 7
Overview
Non-Interest Bearing Deposits
% of Total
Deposits
•
$110 million of
incremental non-
interest-bearing
deposit growth or +4%
(+14% annualized) in
3Q14
•
Top 3Q14 non-
interest-bearing
deposit growth
markets include
Houston, Baton
Rouge, New Orleans,
Birmingham and
Sarasota
Non-interest-bearing deposits at period-end
$ in billions |
 8
Overview
Non-Performing Assets Trends
$ in millions
NPA determination based on regulatory guidance for Acquired portfolios
3Q14 includes $13 million of Bank-related properties reclassified to OREO
|
 9
Overview
Legacy Portfolio
Asset Quality Summary
(Excludes FDIC covered assets and all acquired loans)
($ thousands)
9/30/2013
6/30/2014
9/30/2014
Non-accrual Loans
43,838
$
34,187
$
38,060
$
-13%
11%
OREO
30,607
34,794
23,477
-23%
-33%
Accruing Loans 90+ Days Past Due
1,418
20
4
-100%
-78%
Non-performing Assets
75,863
69,001
61,542
-19%
-11%
Note: NPAs excluding Former Bank Properties
65,345
50,415
48,808
-25%
-3%
Past Due Loans
57,662
48,189
50,505
-12%
5%
Classified Loans
78,059
67,796
67,462
-14%
0%
Non-performing Assets/Assets
0.66%
0.53%
0.46%
(20)
bps
(7)
bps
NPAs/(Loans + OREO)
0.98%
0.78%
0.67%
(31)
bps
(11)
bps
Classified Assets/Total Assets
0.66%
0.52%
0.50%
(16)
bps
(2)
bps
(Past Dues & Nonaccruals)/Loans
0.75%
0.55%
0.55%
(20)
bps
0
bps
Provision For Loan Losses
2,868
$
3,004
$
4,022
$
40%
34%
Net Charge-Offs/(Recoveries)
303
759
2,131
604%
181%
Provision Less Net Charge-Offs
2,565
$
2,245
$
1,891
$
-26%
-16%
Net Charge-Offs/Average Loans
0.02%
0.04%
0.09%
7
bps
5
bps
Allowance For Loan Losses/Loans
0.83%
0.80%
0.79%
(4)
bps
(1)
bps
Allowance For Credit Losses/Loans
0.99%
0.93%
0.92%
(7)
bps
(1)
bps
For Quarter Ended:
% or Basis Point Change
Year/Year
Qtr/Qtr
•
NPAs equated to
0.46% of total assets,
down 7 bps compared
to 2Q14. Includes
$13 million of bank-
related properties
•
$67 million in
classified assets
(down $0.3 million
from 2Q14)
•
Legacy net charge-
offs of $2.1 million, or
an annualized rate of
0.09% of average
loans
•
$4 million provision
for legacy franchise in
3Q14 |
 10
Overview
Allowance Coverage To NPAs –
Legacy IBKC
•
3Q14 Allowance for
loan losses of $72.5
million
•
3Q14 Reserve for
unfunded lending
commitments of $12.1
million
•
Legacy NPAs of $61.5
million; including
approximately $13
million of OREO bank-
related properties
•
Excluding former bank-
related properties,
ACL/NPAs equals
173.4%
Excludes all covered and acquired assets |
  11
Overview
Capital Ratios
•
Change in Tier 1
Leverage ratio due to
impact of acquisitions on
average total assets
used in calculations
Estimated Future Impacts:
•
Anticipated 50% phase-
out of trust preferred
securities beginning in
2015
•
Expiration of loss share
coverage on three FDIC-
assisted transactions
•
Commencing in 2015, the Company will experience a 50% phase-out of Tier 1
capital treatment for its trust preferred securities with no commensurate
change in total regulatory capital
•
In addition, by year-end 2014, the Company will experience the expiration of
FDIC loss share protection on non-single family loans associated with
three FDIC–assisted transactions Q2 2014
Q3 2014
Well
Capitalized
Minimum
Tier 1 Leverage
10.03%
9.22%
(81)
bps
5.00%
Tier 1 Risk Based
11.23%
11.23%
0
bps
6.00%
Tier 1 Common Risk Based
10.33%
10.34%
1
bps
3.00%
Total Risk Based
12.43%
12.42%
(1)
bps
10.00%
Tangible Common Equity / Tangible Assets
8.46%
8.47%
1
bps
N/A
IBERIABANK Corporation Capital Ratios
Change
•
The decline in Tier 1 leverage ratio in 3Q14 was due to the manner in which the
leverage ratio is calculated using capital in the numerator at
period-end and average total assets in the denominator
Estimated Proforma Impact on 3Q 2014 Capital Ratios
Phase out of Trust Preferred Securites (50% Phase Out)
(36)
bps
(45)
bps
-
bps
End of Loss Share -
certain covered assets
-
bps
(14)
bps
(17)
bps
Total Impact
(36)
bps
(59)
bps
(17)
bps
Total Risk Based
Tier 1 Risk Based
Tier 1 Leverage |
 12
Acquisition Update |
 Florida Bank
Group, Inc.
13
•
Announced October 3, 2014
•
In market and new-market acquisition of a Florida-based
commercial bank based in Tampa, Florida
•
Adds
13
branches
in
Florida
–
eight
offices
in
Tampa,
three
in
Jacksonville, one in Sarasota and one in Tallahassee
As of September 30, 2014:
•
Total Loans:
$324 million
•
Total Assets:
$518 million
•
Total Deposits:
$393 million
•
Total Equity:
$37 million common stock and $25
million in convertible preferred equity
•
Combination cash and common stock with aggregate cash
consideration not to exceed 50% of total consideration
•
$7.81 in cash per Florida Bank Group common share, and
•
Fixed exchange ratio of 0.149 of a share of IBKC common
stock for each Florida Bank Group share within price collars
and
floating
exchange
ratios
outside
of
the
collars
(1)
,
•
$87 million(1) for common stock outstanding based on IBKC
closing price of $62.61 on October 2, 2014
•
$17.14
per
Florida
Bank
Group
share
outstanding
(1)
•
$3.5 million in cash liquidation value of options
•
Neutral to 2015 EPS and accretive thereafter
•
Slightly dilutive to TVBS (less than 1%)
•
IRR in excess of 20%
•
Price / Total Book:
142%
126%
•
Price / Tangible Book:
142%
126%
(1)
If
the
weighted
average
trading
price
of
IBERIABANK
common
stock
were
to
go
below
$56.79
per
share,
or
to
exceed
$76.83 per share, over a specified period, the value of the common stock portion of
the transaction would become fixed and the exchange ratio would float
(2)
Assumes the impact of cash liquidation for options, reversal of $23.4 million of
deferred tax asset valuation allowance, credit loss assumptions, interest rate
adjustments and fair value marks to facilities Common and
Preferred
With All Other
Adjustments
(2) |
 14
•
Gross loss estimate of $6.6 million on a pre-tax basis
(2% of gross loan portfolio)
•
Loss estimate is less than current allowance for loan
losses of $8.0 million
•
Neutral to 2015 EPS and accretive thereafter
•
Tangible book value dilution of less than 1% excluding one-time acquisition
and conversion related costs on a pro forma basis at June 30, 2014
•
Tangible book value breakeven, including one-time acquisition and
conversion related costs, in approximately two years
•
Strong pro forma capital ratios:
•
Tangible common equity ratio = 8.4%
•
Total risk based capital ratio = 12.6%
•
Internal rate of return over 20%; well in excess of our cost of capital
Conservative
Financial
Assumptions
Attractive
Financial
Impact
Other Marks:
Cost Savings:
Merger Related Costs:
•
Aggregate negative $1.2 million in other marks, including
securities portfolio, loan rate, allowance for loss reversal,
OREO, fixed assets, FHLB marks
•
Annual run-rate cost savings of approximately $5 million
on a pre-tax basis
•
Represents approximately 31% of Florida Bank’s
anticipated 2014 non-interest expenses
•
Savings expected to be achieved within six months
of closing
•
Approximately $20 million on a pre-tax basis
Credit Mark:
Florida Bank Group, Inc.
Financial Assumptions & Impact |
 15
Seasonal Influences |
 16
Seasonal Influences
Quarterly Organic Loan Growth
•
First quarter of each year tends to
exhibit slower loan growth than other
quarters
•
3Q14 organic loan growth of $348
million, down $34 million, or 10%,
compared to 2Q14 growth |
 17
Seasonal Influences
Mortgage Income
•
Mortgage 3Q14 Non-Interest Income of $12.8
million is $5.1 million lower than 2Q14 driven by
•
$7.0 million lower market value adjustment
gains (-$4.5 million recognized in 3Q14 versus
+$2.5 million in 2Q14)
•
$1.8 million higher gains on increased sales
volume (+24%) and higher sales margins (+6%)
•
$62,000 higher servicing income
•
Loan originations were up $20 million in 3Q14 to
$456 million from $436 million in 2Q14 (+5%)
•
The Pipeline plus Loans HFS at September 30th
was 11% lower than at June 30, 2014 |
 18
Seasonal Influences
Weekly Locked Mortgage Pipeline Trends
•
Significant pipeline
declines in winter
months
•
Seasonal rebound
commences at the
start of each year
through spring
months into early
summer
•
Most recent decline
was 40% since
start of October
2013
•
2014 trending is
consistent with
prior years
•
Weekly locked
pipeline was $194
million at October
10, 2014, up 8%
since September
30, 2014 |
 19
Seasonal Influences
Capital Markets and Wealth Management
•
ICP revenues of $2.7
million, or -9%,
compared to 2Q14
•
IWA revenues of $1.5
million, or -4%,
compared to 2Q14
•
IFS revenues of $2.6
million, or +4%,
compared to 2Q14
•
ICP currently
provides research
coverage on 77 public
energy companies
•
IWA assets under
management
increased $5 million
to $1.2 billion on
September 30, 2014, |
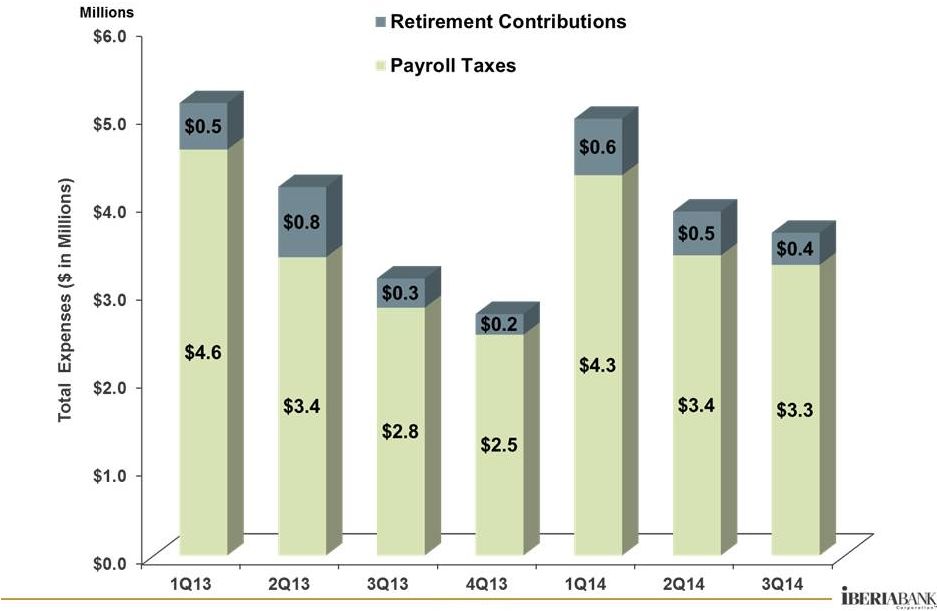 20
Seasonal Influences
Payroll Taxes and Retirement Contributions
3Q14 includes full quarter of Teche and First Private results
|
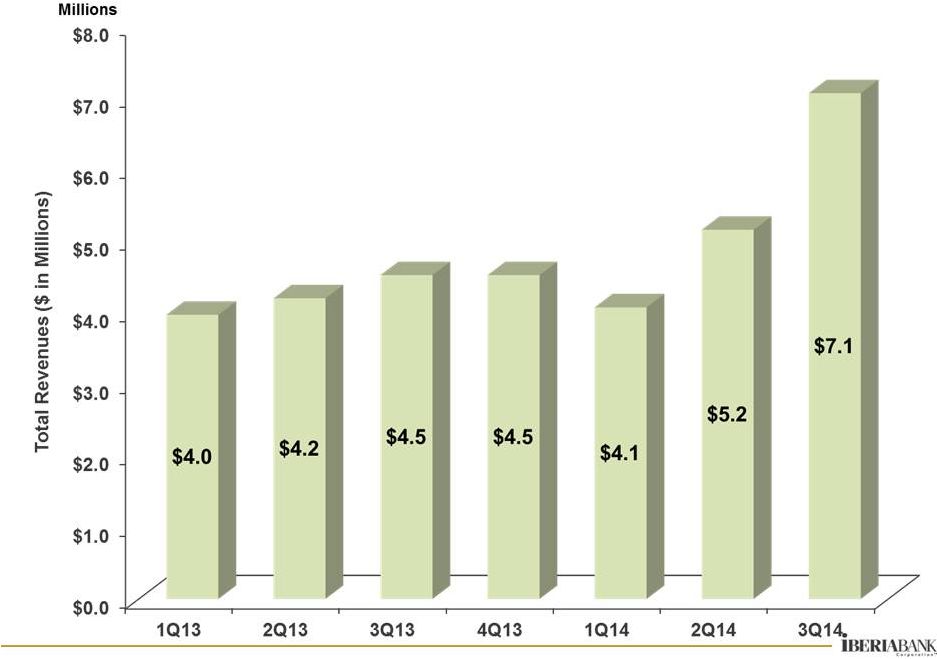 Seasonal Influences
Checking NSF Related Charges
3Q14 includes full quarter of Teche and First Private results
21 |
 Appendix
22 |
 23
Appendix
Performance Metrics –
Quarterly Trends
•
Average earning
assets up $1.3
billion (+10%)
•
T/E net interest
income up $12
million (+11%)
•
Provision for loan
losses of $6 million:
•
Legacy net charge-
offs: $2.1 million
(0.09% annualized
rate)
•
Covered and
acquired net
charge offs: $0.1
million (0.02%
annualized rate)
•
Legacy provision
for loan losses:
$4.0 million
9/30/2013
12/31/2013
3/31/2014
6/30/2014
9/30/2014
Net Income ($ in thousands)
23,192
$
25,604
$
22,395
$
18,548
$
29,744
$
60%
Per Share Data:
Fully Diluted Earnings
0.78
$
0.86
$
0.75
$
0.60
$
0.89
$
48%
Operating Earnings (Non-GAAP)
0.83
0.87
0.73
0.96
1.00
4%
Pre-provision Operating Earnings (Non-GAAP)
0.89
0.97
0.78
1.06
1.11
5%
Tangible Book Value
37.00
37.17
37.59
37.41
37.91
1%
Key Ratios:
Return on Average Assets
0.71%
0.77%
0.68%
0.53%
0.76%
23
bps
Return on Average Common Equity
6.08%
6.62%
5.83%
4.56%
6.52%
196
bps
Return on Average Tangible Common Equity (Non-GAAP)
8.74%
9.43%
8.36%
6.62%
9.68%
306
bps
Net Interest Margin (TE)
(1)
3.37%
3.52%
3.54%
3.48%
3.47%
(1)
bps
Tangible Operating Efficiency Ratio (TE)
(1)
(Non-GAAP)
73.0%
69.9%
73.6%
68.3%
66.4%
(182)
bps
Tangible Common Equity Ratio (Non-GAAP)
8.64%
8.55%
8.61%
8.46%
8.47%
1
bps
Tier 1 Leverage Ratio
9.65%
9.70%
9.61%
10.03%
9.22%
(81)
bps
Tier 1 Common Ratio (Non-GAAP)
10.95%
10.55%
10.44%
10.33%
10.34%
1
bps
Total Risk Based Capital Ratio
13.28%
12.82%
12.69%
12.43%
12.42%
(1)
bps
Net Charge-Offs to Average Loans
(2)
0.02%
0.07%
0.05%
0.04%
0.09%
5
bps
Non-performing Assets to Total Assets
(2)
0.66%
0.61%
0.49%
0.53%
0.46%
(7)
bps
(1)
Fully taxable equivalent basis.
(2)
Excluding FDIC Covered Assets and Acquired Assets.
For Quarter Ended:
Linked Quarter
%/Basis Point
Change |
 24
Appendix
Non-Interest Income Trends
•
Deposit service charge income increased $2.0 million or 24%
•
ATM/Debit card fee income increased $0.4 million or 12%
•
Title revenue increased $0.3 million, or 6%
•
Mortgage income decreased $5.1 million or 29%
•
Decreased broker commissions income of $0.2 million or -3%
•
Gains on sale of investments increased $0.6 million
3Q14 originations up 5% from 2Q14
Refinancings were 25% of production,
up from 13% in 2Q14
Sales up 24% in 3Q14
Margins 6% higher in 3Q14
Pipeline of $170 million at quarter-end,
down 6% as compared to June 30,
2014. At October 10, 2014, the locked
pipeline was $194 million or +8% over
September 30, 2014
Non-interest Income ($000s)
3Q13
4Q13
1Q14
2Q14
3Q14
$ Change
% Change
Service Charges on Deposit Accounts
7,512
$
7,455
$
7,012
$
8,203
$
10,205
$
2,002
$
24%
ATM / Debit Card Fee Income
2,476
2,493
2,467
2,937
3,287
350
12%
BOLI Proceeds and CSV Income
908
900
934
934
1,047
113
12%
Mortgage Income
15,202
12,356
10,133
17,957
12,814
(5,143)
-29%
Title Revenue
5,482
4,327
4,167
5,262
5,577
315
6%
Broker Commissions
3,950
4,986
4,048
5,479
5,297
(182)
-3%
Other Noninterest Income
7,720
6,179
5,129
7,182
6,854
(328)
-5%
Noninterest income excluding non-operating income
43,250
38,696
33,890
47,954
45,081
(2,873)
-6%
Gain (Loss) on Sale of Investments, Net
13
19
19
8
582
574
6797%
Other Non-operating income
-
-
1,772
1
-
(1)
-100%
Total Non-interest Income
43,263
$
38,715
$
35,681
$
47,963
$
45,663
$
(2,300)
$
-5%
3Q14 vs. 2Q14
3Q14 includes full quarter of Teche and First Private results
|
 25
Appendix
Non-Interest Expense Trends
•
Non-interest expenses excluding non-operating items up
$3.4 million, or 3%, as compared to 2Q14
•
Total expenses down $7.3 million, or -6%, in 3Q14
•
Severance expense down $4.2 million, mostly related to
Teche acquisition
•
Impairment of long-lived assets up $3.0 million
•
Merger-related expense decreased $8.7 million
•
Operating Tangible Efficiency Ratio of 66.4%, down 190 bps
Linked quarter increases/decreases of:
2Q14 includes one month of Teche results
Non-interest Expense ($000s)
3Q13
4Q13
1Q14
2Q14
3Q14
$ Change
% Change
Mortgage Commissions
4,238
$
3,169
$
2,215
$
3,481
$
3,912
$
431
$
12%
Hospitalization Expense
4,303
3,899
3,944
3,661
4,611
950
26%
Other Salaries and Benefits
50,140
52,108
53,582
55,921
54,898
(1,023)
-2%
Salaries and Employee Benefits
58,681
$
59,176
$
59,741
$
63,063
$
63,421
$
358
$
1%
Credit/Loan Related
5,248
2,776
3,560
3,093
4,569
1,476
48%
Occupancy and Equipment
13,863
13,971
13,775
13,918
14,580
662
5%
Amortization of Acquisition Intangibles
1,179
1,177
1,218
1,244
1,493
249
20%
All Other Non-interest Expense
26,933
25,328
27,328
28,913
29,602
689
2%
Nonint. Exp. (Ex-Non-Operating Exp.)
105,904
$
102,428
$
105,622
$
110,231
$
113,666
$
3,435
$
3%
Severance
554
216
119
5,466
1,226
(4,240)
-78%
Occupancy and Branch Closure Costs
594
-
17
14
-
(14)
-100%
Storm-related expenses
-
-
184
4
1
(3)
-78%
Impairment of Long-lived Assets, net of gains on sales
977
(225)
541
1,241
4,213
2,972
239%
Provision for FDIC clawback liability
667
-
-
-
(797)
(797)
100%
Debt Prepayment
-
-
-
-
-
-
0%
Termination of Debit Card Rewards Program
-
(311)
(22)
-
-
-
0%
Consulting and Professional
(630)
-
-
-
-
-
0%
Merger-Related Expenses
85
566
967
10,419
1,752
(8,667)
-83%
Total Non-interest Expense
108,152
$
102,674
$
107,428
$
127,375
$
120,060
$
(7,315)
$
-6%
Tangible Efficiency Ratio - excl Nonop-Exp
73.0%
69.9%
73.6%
68.3%
66.4%
3Q14 vs. 2Q14
Salary and benefits expense
$0.4 mil
Credit/Loan related expense
1.5
Hospitalization expense
1.0
Other incentives
1.6
Increased due to the timing and consummation of Teche
and First Private added approximately $1.7 million in
operating expenses in 3Q14 |
 26
Appendix
Deposits Costs
•
Our deposit
costs declined
greater than
peers
•
A portion of the
lower costs were
due to improved
mix of deposits
•
Non-interest-
bearing deposits
grew from 11%
of total deposits
in 2010 to 26%
of total deposits
in 3Q14 |
 27
Appendix
Loan Growth Since Year-End 2008
December 31, 2008
$3.7 Billion
September 30, 2014
$11.1 Billion
Acquired loans, net of discount
+$4.0 billion
Acquired loan pay downs
($2.1 billion)
Legacy loan growth
+$5.4 billion
Total net growth
+$7.3 billion |
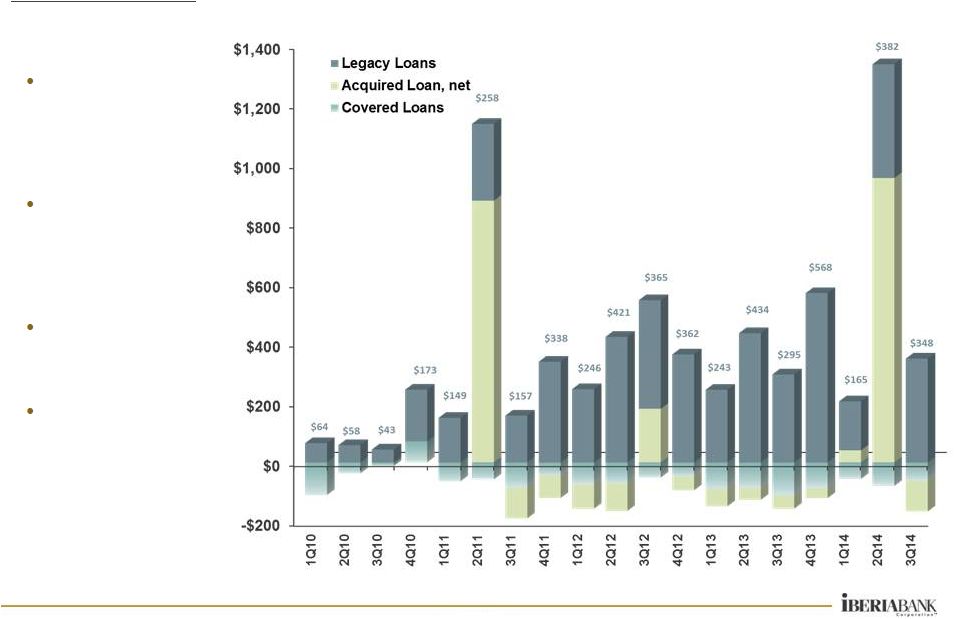 28
Appendix
Loan Growth
Legacy Loan Growth
$ in millions
The FDIC
covered loan
portfolio declined
69%, or $1.2
billion (14%
annualized rate)
$5.1 billion, or
+123% (+26%
annualized)
Since YE 2009:
$3.8 billion, or
+71% (+26%
annualized)
Since YE 2011:
$348 million, or
+4% (+16%
annualized)
3
rd
Quarter 2014: |
 29
Appendix
Loan Originations 3Q14 –Top Markets
$ in millions
•
$1.2 billion in total
funded loans and
unfunded loan
commitments
originated in 3Q14
•
Significant growth in
Houston, New
Orleans, Lafayette,
Birmingham, and
Baton Rouge
•
Continued growth in
other markets in which
we have invested
heavily
Loan commitments and originations include renewals |
 30
Appendix
Deposit Growth Since Year-End 2008
December 31, 2008
$4.0 Billion
September
30,
2014
$12.4 Billion
•
$8.4 billion growth in total
deposits or +210% (+36%
annualized) |
 31
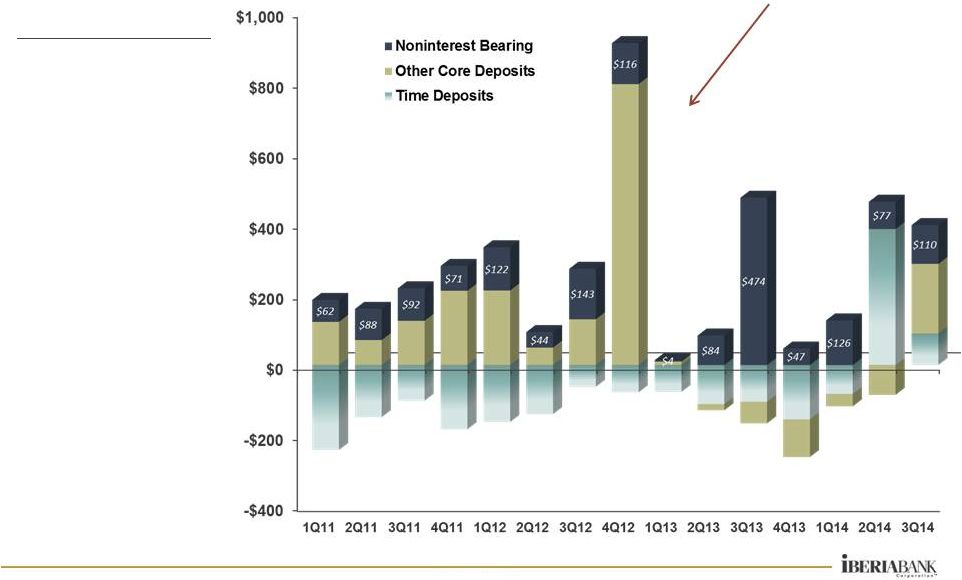
Excludes acquired deposits
Appendix
Deposit Growth
$ in millions
•
Increase of $397
million, or 3% in
3Q14 (+13%
Annualized)
•
$110 million (+4%)
growth in NIB
deposits for 3Q14
Total Deposit Growth
Very strong
transaction account
growth in 4Q12 |
| 32
Appendix
Market Highlights For 3Q14
•
Competitive pressure remains strong for high quality commercial and
business banking clients in terms of both pricing and structure
•
Houston, New Orleans, Baton Rouge, Birmingham, and Huntsville
showed strong commercial loan originations
•
Total commitments originated during 3Q14 of $1.2 billion with 34%
fixed rate and 66% floating rate
•
Commercial loans originated and funded in 3Q14 totaled $445 million
with a mix of 23% fixed and 77% floating ($775 million in commercial
loan commitments during the quarter)
•
Strong commercial pipeline in excess of $629 million at quarter-end
•
Small Business loan growth of $66 million, or +6%, on a linked-quarter
basis
•
Period-end core deposit increase of $307 million, with non-interest
bearing deposits up $110 million (up $309 million linked quarter
growth
on
an
average
balance
basis)
–
mainly
as
a
result
of
the
Teche
and First Private acquisitions |
 33
Appendix
Asset Quality Portfolio Trends
($thousands)
Non-accruals
341,691
$
208,673
$
195,680
$
-43%
-6%
OREO & Foreclosed
128,987
84,479
63,386
-51%
-25%
90+ Days Past Due
10,844
1,095
190
-98%
-83%
Non-performing Assets
481,522
$
294,247
$
259,256
$
-46%
-12%
NPAs/Assets
3.66%
1.92%
1.67%
(199)
bps
(25)
bps
NPAs/(Loans + OREO)
5.25%
2.68%
2.32%
(293)
bps
(36)
bps
LLR/Loans
1.64%
1.23%
1.21%
(43)
bps
(2)
bps
ACL/Loans
1.77%
1.33%
1.32%
(45)
bps
(1)
bps
Net Charge-Offs/Loans
0.01%
0.03%
0.08%
7
bps
5
bps
Past Dues:
30-89 Days Past Due
26,445
$
31,875
$
23,784
$
-10%
-25%
90+ days Past Due
10,844
1,095
190
-98%
-83%
Non-accual Loans
341,691
208,673
195,680
-43%
-6%
Total 30+ Past Dues
378,979
$
241,642
$
219,654
$
-42%
-9%
% Loans
4.19%
2.22%
1.98%
(221)
bps
(24)
bps
Total Portfolio
% or Basis Point Change
3Q13
2Q14
3Q14
Year/Year
Qtr/Qtr |
 34
Appendix
Non-Operating Items (Non-GAAP)
Non-operating adjustments equal to $5.8 million pre-tax or $0.11 EPS after-tax:
•
3Q14 Merger related expense of $1.8 million pre-tax or $0.04 EPS after-tax
•
3Q14 Severance expense of $1.2 million pre-tax or $0.02 EPS after-tax
•
Net impairment expense of $4.2 million pre-tax or $0.08 EPS after-tax
•
Reversal of provisioning for FDIC clawback liability of $0.7 million pre-tax or $0.02 after
tax Pre-tax
After-tax
(2)
Per share
Pre-tax
After-tax
(2)
Per share
Pre-tax
After-tax
(2)
Per share
Net Income (Loss) (GAAP)
30,549
$
23,192
$
0.78
$
24,819
$
18,548
$
0.60
$
40,930
$
29,744
$
0.89
$
Non-interest income adjustments
Gain on sale of investments and other non-interest income
(13)
(8)
(0.00)
(9)
(6)
(0.00)
(582)
(378)
(0.01)
Non-interest expense adjustments
Merger-related expenses
85
55
0.00
10,419
6,840
0.22
1,752
1,139
0.04
Severance expenses
554
360
0.01
5,466
3,553
0.11
1,226
797
0.02
(Gain) Loss on sale of long-lived assets, net of impairment
977
635
0.02
1,241
807
0.03
4,213
2,738
0.08
(Reversal of) Provision for FDIC clawback liability
667
434
0.01
-
-
-
(797)
(518)
(0.02)
Other non-operating non-interest expense
(36)
(23)
(0.00)
18
12
0.00
1
1
(0.00)
Operating earnings (Non-GAAP)
(3)
32,783
24,644
0.83
41,954
29,754
0.96
46,743
33,523
1.00
Covered and acquired impaired (reversal of) provision for loan losses
(854)
(555)
(0.02)
1,744
1,134
0.04
1,692
1,100
0.03
Other (reversal of) provision for loan losses
2,868
1,864
0.07
3,004
1,953
0.06
4,022
2,614
0.08
Pre-provision operating earnings (Non-GAAP)
(3)
34,797
$
25,954
$
0.89
$
46,702
$
32,841
$
1.06
$
52,457
$
37,237
$
1.11
$
(1) Per share amounts may not appear to foot due to rounding.
(2) After-tax amounts estimated based on a 35% marginal tax rate.
RECONCILIATION OF NON-GAAP FINANCIAL MEASURES
(1)
(dollars in thousands)
For The Quarter Ended
September 30, 2013
June 30, 2014
September 30, 2014
Dollar Amount
Dollar Amount
Dollar Amount |
 35
•
Investment yield
decreased 4 bps
•
Non-covered loan yield
increased 7 bps from
2Q14
•
Net covered loan yield
decreased 9 bps
•
Average non-interest-
bearing deposits up $309
million (+11% linked
quarter basis)
•
Interest-bearing deposit
costs increased 5 bps
•
Margin declined 1 bps to
3.47%
Appendix
Performance Metrics –
Yields and Costs
6/30/2014
9/30/2014
Investment Securities
2.24%
2.20%
(4)
bps
Covered Loans, net of loss share receivable
3.16%
3.07%
(9)
bps
Non-covered Loans
4.30%
4.37%
7
bps
Loans & Loss Share Receivable
4.22%
4.29%
7
bps
Mortgage Loans Held For Sale
4.21%
3.84%
(37)
bps
Other Earning Assets
0.82%
0.60%
(22)
bps
Total Earning Assets
3.80%
3.81%
1
bps
Interest-bearing Deposits
0.35%
0.40%
5
bps
Short-Term Borrowings
0.16%
0.17%
1
bps
Long-Term Borrowings
3.34%
2.75%
(59)
bps
Total Interest-bearing Liabilities
0.43%
0.46%
3
bps
Net Interest Spread
3.38%
3.36%
(2)
bps
Net Interest Margin
3.48%
3.47%
(1)
bps
(1)
Earning asset yields are shown on a fully taxable-equivalent basis.
For Quarter Ended:
Linked Quarter
Basis Point
Change |
 36
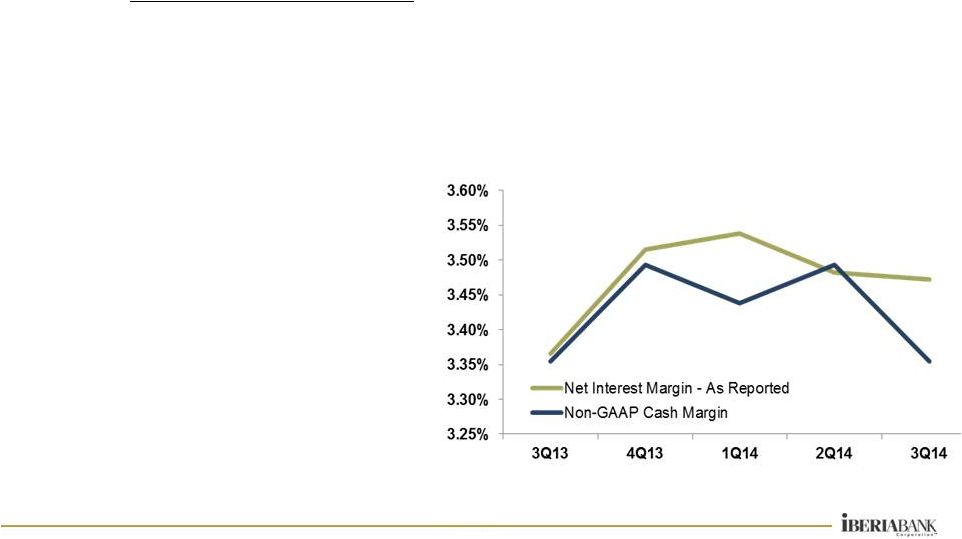
Appendix
Non-GAAP Cash Margin
•
Adjustments represent accounting
impacts of purchase discounts on
acquired loans and related accretion
as well as the I/A and related
amortization on the covered portfolio
Balances as
Reported
Adjustments
As Adjusted
3Q13
Average Balance
11,674,648
(199,543.31)
11,475,104
Income
97,452
101
97,554
Rate
3.37%
-0.01%
3.35%
4Q13
Average Balance
11,853,895
(192,574.05)
11,661,322
Income
103,438
(2,061)
101,377
Rate
3.52%
-0.02%
3.49%
1Q14
Average Balance
12,088,182
(171,440.32)
11,916,741
Income
104,408
(2,517)
101,890
Rate
3.54%
-0.10%
3.44%
2Q14
Average Balance
12,693,217
(156,606)
12,536,611
Income
108,979
687
109,665
Rate
3.48%
0.01%
3.49%
3Q14
Average Balance
13,990,968
(157,213)
13,833,755
Income
121,041
(3,544)
117,497
Rate
3.47%
-0.12%
3.35% |
 37
Appendix
Expected Quarterly Re-pricing Schedule
$ in millions
Note: Amounts exclude re-pricing of assets and liabilities from prior
quarters Excludes FDIC loans and receivable, non-accrual loans and market value
adjustments 4Q14
1Q15
2Q15
3Q15
4Q15
Cash Equivalents
Balance
481.1
$
-
$
-
$
-
$
-
$
Rate
0.69%
0.00%
0.00%
0.00%
0.00%
Investments
Balance
68.6
$
60.9
$
77.1
$
84.1
$
82.9
$
Rate
3.02%
2.97%
2.92%
2.75%
2.82%
Fixed Rate Loans
Balance
200.2
$
145.0
$
158.9
$
177.3
$
150.6
$
Rate
4.94%
4.95%
5.05%
4.96%
4.91%
Variable Rate Loans
Balance
4,840.3
$
35.4
$
40.4
$
44.4
$
17.5
$
Rate
3.28%
3.02%
3.11%
3.54%
3.36%
Held for Sale Loans
Balance
148.5
$
-
$
-
$
-
$
-
$
Rate
3.52%
0.00%
0.00%
0.00%
0.00%
Time Deposits
Balance
702.8
$
314.2
$
321.9
$
256.4
$
104.6
$
Rate
0.38%
0.62%
0.70%
0.80%
0.84%
Repos/ST Debt
Balance
504.8
$
180.0
$
125.0
$
-
$
-
$
Rate
0.15%
0.19%
0.20%
0.00%
0.00%
Borrowed Funds
Balance
126.5
$
2.1
$
10.1
$
3.3
$
1.9
$
Rate
3.11%
3.20%
3.49%
3.95%
3.60% |
 38
Appendix
Interest Rate Risk Simulation
Source: Bancware model, as of September 30, 2014
* Assumes instantaneous and parallel shift in interest rates based on static
balance sheet •
Asset sensitive from an interest rate risk position
•
The degree of asset sensitivity is a function of the reaction of
competitors to changes in deposit pricing
•
Forward curve has a positive impact over 12 months
Base
Blue
Forward
Change In:
-200 bp*
-100 bp*
Case
+100 bp*
+200 bp*
Chip
Curve
Net Interest
Income
-4.6%
-2.0%
0.0%
4.9%
9.8%
1.1%
1.0%
Economic
Value of
Equity
-12.1%
-17.7%
0.0%
2.7%
7.8%
-0.1%
-0.1% |
 39
Appendix
Performance Compared To Peers Since Year-End 1999
Measurement
Measure
Period
Total Asset Growth
Period-End CAGR
6.8%
9.4%
16.4%
Return on Average Assets
Annual Average
0.46%
0.98%
0.98%
Return on Average Tangible Common Equity
Annual Average
7.30%
14.16%
15.44%
Nonperforming Assets-to-Total Assets
Average of Year-Ends
1.65%
1.12%
0.59%
Net Charge-Offs-to-Average Loans
Annual Average
0.48%
0.56%
0.25%
Operating EPS Growth
Annual Average
18.1%
15.7%
19.5%
Tangible Book Value Per Share Growth
(3)
Period-End CAGR
3.8%
6.6%
10.5%
Cumulative Shareholder Return
(4)
Period-End Growth
139.9%
233.6%
690.3%
(1)
U.S. publicly-traded bank holding companies at year-end 2013. Does not include
entities that failed or were acquired. (2)
U.S. publicly-traded bank holding companies at year-end 2013 with total assets between
$10 billion and $30 billion. Does not include entities that failed or were
acquired. (3)
Excludes bank holding companies with tangible book value per share less than zero at
12/31/13. (4)
Assuming common stock price appreciation and the reinvestment of dividends since year-end
1999. Average Over Period 2000-2013
BHC Peers
(2)
U.S. Publicly-
Traded BHCs
(1)
Publicly-Traded
IBERIABANK
Corporation |
 40
Appendix
Expected Amortization
Projected average balance includes the balance of the IA
2.00%
3.00%
4.00%
5.00%
6.00%
7.00%
8.00%
$0
$300
$600
$900
$1,200
$1,500
Q1 2013
Q2 2013
Q3 2013
Q4 2013
Q1 2014
Q2 2014
Q3 2014
Q4 2014
Q1 2015
Projected Average Balances and Net Yields
Projected Average Balance
Projected Net Yield
$ in Millions
Q1 2013
Q2 2013
Q3 2013
Q4 2013
2013
Q1 2014
Q2 2014
Q3 2014
Q4 2014
2014
Q1 2015
Revenues
41.6
$
30.3
$
30.9
$
37.1
$
139.9
$
25.9
$
23.0
$
30.2
$
13.9
$
93.1
$
11.9
$
Amortization
(27.7)
$
(18.1)
$
(22.9)
$
(29.1)
$
(97.8)
$
(19.3)
$
(17.0)
$
(25.1)
$
(8.7)
$
(70.1)
$
(4.0)
$
Net covered Income
13.9
$
12.2
$
8.0
$
8.0
$
42.1
$
6.7
$
6.0
$
5.1
$
5.3
$
23.0
$
7.9
$
Balance
1,424
$
1,224
$
1,100
$
941
$
1,171
$
846
$
756
$
670
$
573
$
711
$
504
$ |