Attached files
| file | filename |
|---|---|
| 8-K - 8-K - California Resources Corp | a14-22833_28k.htm |
Exhibit 99.1
|
|
0 Investor Presentation October 2014 |
|
|
1 Forward-Looking / Cautionary Statements This presentation contains forward-looking statements within the meaning of Section 27A of the Securities Act of 1933 and Section 21E of the Securities Exchange Act of 1934. All statements, other than statements of historical fact, included in this presentation that address activities, events or developments that California Resources Corporation (the “Company” or “CRC”) assumes, plans, expects, believes or anticipates will or may occur in the future are forward-looking statements. The words “believe,” “expect,” “may,” “estimate,” “will,” “anticipate,” “plan,” “intend,” “foresee,” “should,” “would,” “could,” or other similar expressions are intended to identify forward-looking statements, which are generally not historical in nature. However, the absence of these words does not mean that the statements are not forward-looking. Without limiting the generality of the foregoing, forward-looking statements contained in this presentation specifically include the expectations of plans, strategies, objectives and anticipated financial and operating results of the Company, including as to the Company’s drilling program, production, hedging activities, capital expenditure levels and other guidance included in this presentation. These statements are based on certain assumptions made by the Company based on management’s expectations and perception of historical trends, current conditions, anticipated future developments and other factors believed to be appropriate. Such statements are subject to a number of assumptions, risks and uncertainties, many of which are beyond the control of the Company, which may cause actual results to differ materially from those implied or expressed by the forward-looking statements. These include, but are not limited to, compliance with regulations or changes in regulations and the ability to get government permits and approvals; commodity pricing; risks of drilling; regulatory initiatives relating to hydraulic fracturing and other well stimulation techniques; tax law changes; competition for oilfield equipment, services, qualified personnel and acquisitions; risks related to our acquisition activities; the subjective nature of estimates of proved reserves and related future net cash flows; vulnerability to economic downturns and adverse developments in our business due to our debt; insufficiency of our operating cash flow to fund planned capital expenditures; inability to implement our capital investment program profitably or at all; concentration of operations in a single geographic area; any need to impair the value of our oil and natural gas properties; compliance with laws and regulations, including those pertaining to land use and environmental protection; restrictions on our ability to obtain, use, manage or dispose of water; inability to operate outside of California; inability to drill identified locations when planned or at all; concerns about climate change and other air quality issues; catastrophic events for which we may be uninsured or underinsured; cyber attacks; operational issues that restrict production or market access; and uncertainties related to the spin-off, the agreements related thereto and the anticipated effects of restructuring or reorganizing our business. Any forward-looking statement speaks only as of the date on which such statement is made and the Company undertakes no obligation to correct or update any forward-looking statement, whether as a result of new information, future events or otherwise, except as required by applicable law. This presentation includes financial measures that are not in accordance with generally accepted accounting principles (“GAAP”), including EBITDAX. While management believes that such measures are useful for investors, they should not be used as a replacement for financial measures that are in accordance with GAAP. For a reconciliation of EBITDAX to the nearest comparable measure in accordance with GAAP, please see the Appendix. |

|
|
2 Cautionary Statements Regarding Hydrocarbon Quantities CRC has provided internally generated estimates for proved reserves and aggregated proved, probable and possible reserves (“3P Reserves”) as of December 31, 2013 in this presentation, with each category of reserves estimated in accordance with SEC guidelines and definitions, though it has not reported all such estimates with the SEC. As used in this presentation: • Probable reserves. We use deterministic methods to estimate probable reserve quantities, and when deterministic methods are used, it is as likely as not that actual remaining quantities recovered will exceed the sum of estimated proved plus probable reserves. • Possible reserves. We use deterministic methods to estimate possible reserve quantities, and when deterministic methods are used to estimate possible reserve quantities, the total quantities ultimately recovered from a project have a low probability of exceeding proved plus probable plus possible reserves. The SEC prohibits companies from aggregating proved, probable and possible reserves estimated using deterministic estimation methods in filings with the SEC due to the different levels of certainty associated with each reserve category. Actual quantities that may be ultimately recovered from CRC’s interests may differ substantially from the estimates in this presentation. Factors affecting ultimate recovery include the scope of CRC’s ongoing drilling program, which will be directly affected by commodity prices, the availability of capital, regulatory approvals, drilling and production costs, availability of drilling services and equipment, drilling results, lease expirations, transportation constraints and other factors; actual drilling results, including geological and mechanical factors affecting recovery rates; and budgets based upon our future evaluation of risk, returns and the availability of capital. In this presentation, the Company may use the terms “oil-in-place” or descriptions of resource potential which the SEC guidelines restrict from being included in filings with the SEC. These have been estimated internally by the Company without review by independent engineers. The Company uses the term “oil-in-place” in this presentation to describe estimates of potentially recoverable hydrocarbons remaining in the applicable reservoir. Actual recovery of these resource potential volumes is inherently more speculative than recovery of estimated reserves and any such recovery will be dependent upon future design and implementation of a successful development plan. Management’s estimate of original hydrocarbons in place includes historical production plus estimates of proved, probable and possible reserves and a gross resource estimate that has not been reduced by appropriate factors for potential recovery and as a result differs significantly from estimates of hydrocarbons that can be potentially be recovered. Ultimate recoveries will be dependent upon numerous factors including those noted above. In addition, the Company’s production forecasts and expectations for future periods are dependent upon many assumptions, including estimates of production decline rates from existing wells and the undertaking and outcome of future drilling activity, which may be affected by significant commodity price declines or drilling cost increases. |
|
|
3 Summary of the Spin-Off Distributing Company: Occidental Petroleum Corporation (“OXY”) Distributed Company: California Resources Corporation (“CRC” or the “Company”) Distributed Securities: OXY will distribute at least 80.1% of the outstanding common shares of CRC common stock Retained Securities: Following the spin-off, OXY expects to offer to exchange up to 19.9% of CRC’s shares OXY retains for OXY common stock; any remaining securities will be distributed pro rata no later than 18 months after the spin-off Record Date: November 17, 2014 Distribution Date: November 30, 2014 When-Issued Trading Date: Beginning on or shortly before Record Date and continuing up to and including the Distribution Date Distribution Ratio: 0.4 of a CRC share per 1 OXY share outstanding on the Record Date Fractional Shares: Cash settlement from net cash proceeds received following aggregation and sale to the public market by the distribution agent Distribution Method: Book-entry form |
|
|
4 Separation Overview • Creates industry leading California focused E&P • Allows CRC to reinvest substantially all cash flow after debt service to grow its business • Enables CRC’s management team to focus on and accelerate on the development and execution of its business in its core areas of operation • Enables application of its technical expertise in specific, under-exploited and under-invested reservoirs and fields • Enhances CRC’s market recognition with investors because of its status as an industry leader in California AUG SEP Bond financing closed 10/1 Rationale • CRC will own and operate the California business as an independent publicly traded company with the requisite technical expertise • OXY stockholders will receive at least 80.1% of CRC shares and keep their shares in OXY • OXY will retain approximately 19.9% of CRC common stock > Retained shares to be disposed of or distributed within 18 months • CRC ticker to trade on NYSE Structure Process OCT NOV DEC Regular Way Trading 12/1 Record Date 11/17 When Issued Trading 11/13 Credit Agreement signed 9/24 |
|
|
5 Management Presenters Todd Stevens • President and Chief Executive Officer Mark Smith • Senior EVP and Chief Financial Officer Shawn Kerns • EVP — Corporate Development Charlie Weiss • EVP — Public Affairs Scott Espenshade • VP — Investor Relations |

|
|
6 California Resources Corporation Introduction |

|
|
7 Key Investment Highlights World Class Resource Base •Interests in 4 of the 12 largest fields in the lower 48 states •744 MMBoe proved reserves •Largest producer in California on a gross operated basis with significant exploration and development potential California Heritage •Strong track record of operations since 1950s •Longstanding community and state relationships •Actively involved in communities with CRC operations Management Expertise •Successful operations exclusively in California •Assembled largest privately-held land position in California •Operator of choice in sensitive environments Portfolio of Lower-Risk, High- Growth Opportunities •Oil weighted reserves •Increase exploration and development program •30%-100%+ rates of return on individual projects Shareholder Value Focus •Internally funded capital expenditure program •Optimized capital allocation •Unlocking under-exploited resource potential utilizing modern technology |
|
|
8 Disciplined Capital Allocation Focused Business Strategy • Grow NAV per share through exploration and development of under-exploited resources • Self-funding capital program eliminates reliance on external capital • Rigorously review projects to allocate capital most efficiently • Drive down costs to enhance project returns and ROE • Aggressively apply modern technologies to develop assets in responsible manner • Utilize legacy knowledge and data to accelerate successful exploration program • Capitalize on management team’s local expertise with assets Proactive and Collaborative Approach to Safety, Environmental Protection and Community Relations Unlock Resource Potential Through Increased Exploration and Development • Seek to benefit communities in which CRC operates • Maintain frequent, constructive dialogue with local, regional and state representatives • Be the operator of choice for California |
|
|
9 12,836 73% 1,537 9% 2,310 13% 1,008 5% San Joaquin Basin Los Angeles Basin Sacramento Basin Ventura Basin San Joaquin Basin Los Angeles Basin Sacramento Basin Ventura Basin 744, 68% 79% liquids 235, 21% 99% liquids 96, 9% 89% liquids 22, 2% 1% liquids Overview of California Resources Corporation California Pure-Play Net Resource Overview • CRC will be an independent E&P company focused on high-return assets in California • Largest privately-held acreage-holder with 2.3 million net acres • ~60% of total position is held in fee • Conventional and unconventional opportunities • Primary production • Waterfloods & gas injection • Steam / EOR • Substantial base of Proved Reserves (12/31/13) • 744 MMBoe (69% PD, 72% oil, 81% liquids) • PV-10 of $14 billion (SEC 5 year rule to PUDs) • 3P Reserves1 • 1,098 MMBoe (83% liquids) • PV-10 of $21 billion as of December 2013 Avg. net production by basin (1H’14) San Joaquin Basin 69% 68% PD Los Angeles Basin 21% 70% PD Ventura Basin 7% 64% PD Sacramento Basin 3% 100% PD San Joaquin Basin 70% 57% Oil Los Angeles Basin 18% 100% Oil Ventura Basin 6% 67% Oil Sacramento Basin 6% 0% Oil 1Refer to Endnote reference 1 in the Appendix for detail on 3P Reserves. 217,691 locations in known formations as of 12/31/13. Does not include 6,400 prospective resource locations. Total proved reserves by basin (12/31/2013) Total identified gross drilling locations by basin2 17,691 total gross locations2 744 MMBoe, 69% PD, 72% oil 155 MBoe/d, 62% oil Total 3P Reserves by basin (12/31/2013) 1,098 MMBoe; 83% liquids |
|
|
10 California is a World Class Oil Province *Gross operated production from DOGGR data for 2013 full year average. 0 50 100 150 200 250 300 Gross Operated MBoe/d Top California Producers in 2013* Growth of Top California Producers* 188 166 147 38 25 - 20 40 60 80 100 120 140 160 180 200 CRC Chevron USA Aera Energy Freeport McMoRan LINN Energy Gross Operated MBoe/d Chevron AERA CRC More than 35Bn Boe Produced in CA* San Francisco Los Angeles Bakersfield Sacramento CRC Fee/Lease CRC Fee/Lease 2 billion Boe 19 billion Boe 4 billion Boe 10 billion Boe |
|
|
11 Substantial Opportunity and Resource Rich Asset Base Total California 2013 Reserves Net Proved Reserves (MMBoe) 744 % Liquids – Net Proved 81% Pre-Tax Proved PV-10 ($ millions)1 $14,018 Net 3P Reserves MMBoe 1,098 % Liquids – Net 3P 83% Pre-Tax 3P PV-10 ($ millions) $20,995 1H’14 Avg. Net Production (MBoe/d) 155 % Oil 62% Net Acreage (‘000 acres) 2,296 Identified Gross Locations 17,691 Additional Potential Locations 6,400 Note: Reserves as of 12/31/13. 1 PV-10 shown as of 12/31/13 based on SEC five-year rule applied to PUDs using SEC price deck of WTI at $97.97/Bbl and $3.66/Mcf. 2 Basin-level PV-10s include $180MM associated with fuel gas, which is excluded from PV-10 of $14,018MM disclosed in Form 10 filing. 3 Refer to Endnote reference 3 in the Appendix for further information. San Joaquin Basin Los Angeles Basin Ventura Basin Sacramento Basin Net Proved Reserves (MMBoe) 511 159 55 19 % Liquids – Net Proved 78% 98% 89% 0% Pre-Tax Proved PV-10 ($ million) 2 $10,130 $2,331 $1,631 $106 Net 3P Reserves MMBoe 3 744 235 96 22 % Liquids – Net 3P 3 79% 98% 89% 1% Pre-Tax 3P PV-10 ($ millions) 3 $14,983 $3,343 $2,556 $113 1H’14 Avg. Net Production (MBoe/d) 109 28 9 9 % Oil 57% 100% 67% 0% Net Acreage (‘000 acres) 1,485 21 257 533 Identified Gross Locations 12,836 1,537 2,310 1,008 Sacramento Basin San Joaquin Basin Ventura Basin Los Angeles Basin |
|
|
12 Conventional Waterflood Steamflood Unconventional Total Net Proved Reserves (MMBoe) 112 238 178 216 744 % Liquids - Net Proved 68% 95% 100% 57% 81% Pre-Tax Proved PV-10 ($ millions) $959 $4,216 $4,917 $4,105 $14,1982 Net 3P Reserves (MMBoe)3 187 373 227 312 1,098 % Liquids - Net 3P3 77% 94% 100% 60% 83% Pre-Tax 3P PV-10 ($ millions)3 $2,719 $6,342 $5,906 $6,029 $20,995 1H’14 Avg. Net Production (MBoe/d) 33 36 29 57 155 % Oil 44% 94% 100% 36% 62% Identified Gross Locations 6,455 3,540 3,014 4,682 17,691 Additional Potential Locations - - - 6,400 6,400 Conventional Waterflood Steamflood Unconventional 50%+ per pattern 50%+ per pattern 80%-100%+ per well 30%-50% per well Single Well/Pattern Economics by Drive Mechanism: Before Tax IRR1 Total California 2013 Reserves Note: Reserves as of 12/31/13. PV-10 shown as of 12/31/13 using SEC price deck of WTI at $97.97/Bbl and $3.66/Mcf. 1Assumes $100/Bbl and $4.50/Mcf. 2 Drive-mechanism-level PV-10s include PV-10 of $180MM associated with fuel gas excluded from PV-10 of $14,018MM disclosed in Form 10 filing. 3 Refer to Endnote reference 4 in the Appendix for further information. Robust Returns Across Multiple Drive Mechanisms |
|
|
13 Strong Returns Through the Commodity Cycle Oil Prices / Gas Prices • Invest in steam floods (above 5x Oil/Gas ratio) • Conventional, waterflood and unconventional oil opportunities • Gas used at the Elk Hills power plant (electricity) Oil Prices / Gas Prices • Invest in steam floods (above 5x Oil/Gas ratio) • Oil projects down to $25.60/barrel • Gas projects down to ~$2.10/Mcf Oil Prices / Gas Prices • Gas price is a cost for steam floods. Invest in steam floods above 5x Oil/Gas ratio • Many projects commercial in CRC’s hi-graded portfolio • Conventional and unconventional oil and gas opportunities Oil Prices / Gas Prices • Invest in steam floods (above 5x Oil/Gas ratio) • Invest in Sacramento gas projects, take advantage of dominant position in the basin • Oil projects down to $25.60/barrel |

|
|
14 CRC has a significant portfolio of conventional and unconventional opportunities to generate double-digit production growth over the longer term 155 1581 - - 50 100 150 200 250 1H'14 2014 2015 2016 Longer term MBoe/d (Net) Oil NGLs Gas Application of Technology Driving High Margin Growth 1 Based on 4Q’14 guidance for net production of 162 – 165 MBoe/d and 2014 capital budget of $2.1 billion, as disclosed in the Form 10, assuming commodity prices of $100/Bbl for crude oil and $4.50/Mcf for natural gas. |
|
|
15 CRC ($1,200) ($800) ($400) $0 $400 $800 $10.00 $20.00 $30.00 $40.00 $50.00 $60.00 Significant Free Cash Flow ($ in millions) Note: Market data as of 10/1/14 and SEC filings. Comparables consist of CLR, CXO, DNR, DVN, EOG, PXD, WLL and XEC. (1) Refer to Endnote reference 6 in the Appendix for detail on the calculation of free cash flow. Devon Energy excludes the acquisition of GeoSouthern Energy Corp. and Whiting Petroleum Corp. excludes pending acquisition of Kodiak Oil & Gas Corp. (2) Source: 2014E analyst estimates from BMO, KLR Group, Stephens, SunTrust Robinson Humphrey, Wells Fargo Securities and Wunderlich Securities; CRC 2014E. (3) Refer to Endnote reference 5 in the Appendix for detail on the calculation of cash margins. For CRC shown as 2013A. 2014E Cash Margins ($/Boe ex-hedges)(2)(3) LTM 6/30/14 Free Cash Flow (1) • Positive free cash flow gives opportunity to accelerate growth without impairing credit metrics • Cash margin on par with or exceeds peer group • Disciplined capital program provides ability to withstand commodity price volatility |
|
|
16 CRC Achieves Premium Pricing and Recycle Ratio $49.66 $0.00 $10.00 $20.00 $30.00 $40.00 $50.00 $60.00 $70.00 A B C D CRC E F G H Cash Margins for FY 2013 ($/Boe) Source: Company 2013 SEC filings. Comparables consist of CLR, CXO, DNR, DVN, EOG, PXD, WLL and XEC. Note: Cash margin calculated as oil and gas revenue less operating expenses, general and administrative expenses and taxes other than on income. 1 Refer to Endnote reference 5 in the Appendix for detail on the calculation of cash margins and CRC’s recycle ratio. Recycle ratio: 2.4x 1 |
|
|
17 CRC – Price Realizations $95.12 $94.21 $97.97 $99.61 $103.80 $104.02 $104.16 $100.94 $110.90 $111.70 $108.76 $109.02 $80 $90 $100 $110 $120 2011 2012 2013 9 Months 2014 $/Bbl WTI Realizations Brent $4.11 $2.81 $3.66 $4.53 $4.31 $2.94 $3.73 $4.61 0.0 0.5 1.0 1.5 2.0 2.5 3.0 3.5 4.0 4.5 5.0 2011 2012 2013 9 Months 2014 $/Mcf NYMEX Realizations NGL Price Realization - % of WTI Realization % of WTI 109% 110% 106 % 101% Realization % of NYMEX 105% 105 % 102 % 102% Oil Price Realization Gas Price Realization • Since California imports a significant percentage of its crude oil requirements, California refiners typically purchase crude oil at international index-based prices for comparable grades 74% 56% 51% 51% 0% 10% 20% 30% 40% 50% 60% 70% 80% 2011 2012 2013 9 Months 2014 % of WTI |

|
|
18 Captive Infrastructure Integral to Operations Gas Processing Transport Electricity Gathering Pipelines • The Elk Hills 200 MMScf/d Cryogenic gas plant is part of the largest gas processing complex in California, with a combined capacity of 540 MMScf/d • CRC also owns and operates a system of gas processing facilities in the Ventura Basin that is capable of processing equity wellhead gas from the surrounding areas • The gas processing facilities are interconnected via pipelines to nearby third-party rail and trucking facilities, with access to certain North American NGL markets > CRC has truck rack facilities coupled with a battery of pressurized storage tanks at its Elk Hills gas processing facility for NGL sales to third parties • CRC sources all of its electricity needs at its Elk Hills operations, which run at about 120 megawatts, through the wholly-owned 550 megawatt combined cycle power plant located adjacent to its Elk Hills processing facilities, and sells the excess to the state’s power grid • Within the Long Beach operations, CRC operates a 45 megawatt power generating facility that provides almost 40% of the Long Beach operation's electricity requirements, reducing operating costs • CRC owns an extensive network of over 20,000 miles of oil and gas gathering lines • Virtually all of CRCs natural gas production in California is connected via these facilities, which interconnect with the major third-party natural gas pipeline systems |

|
|
19 San Joaquin Basin • Oil and gas discovered in the late 1800’s • Currently accounts for ~70% of CRC production • 25 billion barrels OOIP in CRC fields1 • Cretaceous to Pleistocene sedimentary section (>25,000 feet) • Source rocks are organic rich shales from Moreno, Kreyenhagen, Tumey, and Monterey Formations • Thermal techniques applied since 1960s • 1H’14 avg. of 109 MBoe/d (57% oil) • Elk Hills is the flagship asset (~62% of CRC San Joaquin production) • Two core steamfloods - Kern Front and Lost Hills • Early stage waterfloods at Buena Vista and Mount Poso Overview Key Assets Basin Map 1Internal estimates; includes shales which are not considered in most older publicly available estimates. Buena Vista Pleito Ranch Elk Hills Kettleman Lost Hills Kern Front Mt Poso CRC Land |
|
|
20 0 20 40 60 80 100 120 140 1998 2000 2002 2004 2006 2008 2010 2012 2014 Net MBoe/d Elk Hills Field – Overview • CRC’s flagship asset, a 103-year old field with exploration opportunities1 • Large fee property with multiple stacked reservoirs • Light oil from conventional and unconventional production • Largest gas and NGL producing field in CA, one of the largest fields in the continental U.S.1, >3,000 producing wells • 7.8 billion barrels OOIP2 and cumulative production of 1.6 billion Boe1 • In 2013, produced 68 MBoe/d (44% of total production), including 46 MBoe/d of unconventional production from the upper Monterey Shale • 540 MMScf/d processing capacity • 2 CO2 removal plants • Over 4,200 miles of gas gathering lines • 3 gas plants (including California’s largest) • 46 MW cogeneration plant • 550 MW power plant Overview Comprehensive Infrastructure Field Map Production History 1DOGGR data and U.S. Energy Information Administration. 2Internal estimates; includes shales which are not considered in most older publicly available estimates. Elk Hills Buena Vista RR Gap GS |

|
|
21 Elk Hills Field – Stacked Pay Zones 987-25R 1978 Carneros Zone 1941 Stevens Zone 1941 Shallow Oil Zone 1919 Dry Gas Zone 1910 2512’ TD 6700’ TD Age PLEISTOCENE PLIOCENE MIOCENE EOCENE CRETACEOUS Producing Formations Tulare Dry Gas Zone Shallow Oil Zone Antelope / Stevens Carneros Basement Point of Rocks Oceanic Santos / Wygal OLIGOCENE 934-29R 1988 954-4G 1977 1610’ TD 12,850’ TD 18,270’ TD 18,761’ TD 24,426 TD Deep Exploratory Wells Discovery Well 2009 11,460’ TD |
|
|
22 Elk Hills Field – Identified Projects Primary 29R Waterflood 31S Waterflood Gas Injection Mid Flank Water Injection Crestal Waterflood Expansion Tianshan Area Goliath Area Lower Carneros Waterflood Monterey and Carneros Formations Shallow Oil Zone Waterflood Steamflood Submulinia Steamflood Light Oil Steamflood Alkaline Surfactant Polymer Flood CO2 Flood - 10.0 20.0 30.0 40.0 50.0 60.0 70.0 80.0 90.0 100.0 2009 2010 2011 2012 2013 2014E MBoe/d Shale Waterf lood/Gas injection Primary/Conventional Net Production C4D Shale Asphalto, Railroad Gap, & N. Midway-Sunset Opal CT Compression Expansion |
|
|
23 0 20 40 60 80 100 -6 0 6 12 18 24 2012 2013 2014 ROR Sensitivity – Pattern Waterflood Project Type Avg Pattern cost ($MM) $0.6 % Oil 100% DPI10 4.85 DPI15 4.45 Locations 180 Net F&D ($ / Boe)1 $8.92 WF EUR (Gross) MBoe Oil Prices (WTI $ / Bbl) 43 65 87 109 131 $100 102% 169% 238% 311% 388% $90 89% 147% 208% 272% 337% $80 75% 125% 178% 233% 289% Key Assumptions & Outputs • Improving recovery from primary reservoirs • Redeveloping existing asset base > Wells already drilled > Expand waterflood facilities • Already understand reservoir characteristics from prior production performance Average Waterflood Pattern Production Response Type Curve Average Curve Boe/d Months 1 Refer to Endnote reference 2 in the Appendix for detail on the calculation of F&D costs. |
|
|
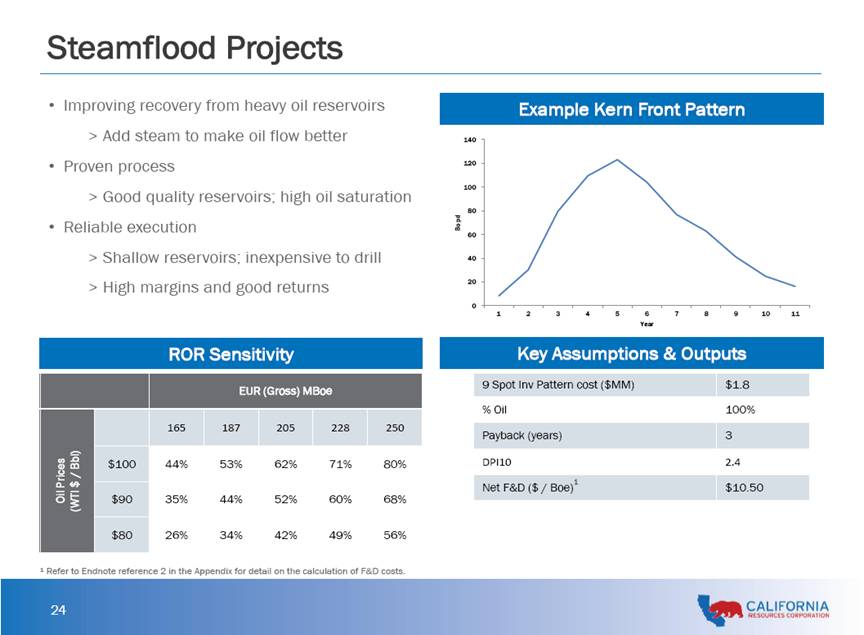
Steamflood Projects Improving recovery from heavy oil reservoirs Add steam to make oil flow better Proven process Good quality reservoirs; high oil saturation Reliable execution Shallow reservoirs; inexpensive to drill High margins and good returns Example Kern Front Pattern ROR Sensitivity Key Assumptions & Outputs 9 Spot Inv Pattern cost ($MM) $1.8 % Oil 100% Payback (years) 3 DPI10 2.4 Net F&D ($ / Boe)1 $10.50 1 Refer to Endnote reference 2 in the Appendix for detail on the calculation of F&D costs. |
|
|
25 Los Angeles Basin • Large, world class basin with thick deposits • Kitchen is the entire basin, hydrocarbons did not migrate laterally; basin depth (>30,000 ft) • 10.5 billion barrels OOIP in CRC fields1 • Most significant discoveries date to the 1920s – past exploration focused on seeps & surface expressions • Very few deep wells (> 10,000 ft) ever drilled • Focus on urban, mature waterfloods, with generally low technical risk and proven repeatable technology across huge OOIP fields • 1H’14 avg. net production of 28 MBoe/d • Over 20,000 net acres • Active coastal development program underway – seven rigs and 143 wells drilled year to date • Major properties are world class coastal developments of Wilmington and Huntington Beach Overview Key Assets Basin Map 1Internal estimates; includes shales which are not considered in most older publicly available estimates. |
|
|
26 - 50 100 150 200 250 2000 2001 2002 2003 2004 2005 2006 2007 2008 2009 2010 2011 2012 2013 MMBoe Net Proved Reserves Production to Date Wilmington Field – Overview Overview Field Map Proved Reserves & Cumulative Production Structure Map & Acquisition History * • CRC’s flagship coastal asset: acquired in 2000 • Field discovered in 1932; 3rd largest field in the U.S. • Over 7 billion barrels OOIP (34% recovered to date)1 • Depths 2,000’ – 10,000’ (TVDSS) • 1H’14 avg. production of 36 MBoe/d (gross) • Over 8,000 wells drilled to date • PSC (Working Interest and NRI vary by contract) • CRC partnering with State and City of Long Beach 1Internal estimates; includes shales which are not considered in most older publicly available estimates. *Proved reserves prior to 2009 represent previously effective SEC methodology. Proved reserves for 2009. – 2013 are based on current SEC reserve methodology and SEC pricing. Tidelands Acquired: 2006 Belmont Offshore Acquired: 2003 Long Beach Unit Acquired: 2000 Pico Properties Acquired: 2008 |
|
|
27 Wilmington Field – Geology & Technology Geosteering Technology Stratigraphic Column 237 Zone reservoirs Shallow Gas reservoirs Upper Fan Middle Fan Middle Fan Lower Fan Deep marine Siliclastics Ranger reservoirs Terminal reservoirs UP-Ford reservoirs |
|
|
28 Wilmington Field Project Well cost ($MM) $1.6 MM DPI-10 1.30 DPI-15 1.20 % Oil 97% Payback (years) 3.0 Net F&D ($ / Boe)1 $16.85 EUR (Gross) MBoe Oil Prices (WTI $ / Bbl) 80 90 100 110 120 $100 26% 31% 37% 43% 48% $90 21% 26% 30% 35% 40% $80 16% 20% 24% 28% 32% 0 20 40 60 M-1 M-13 M-25 M-37 M-49 M-60 Boepd Vertical Producer • Successful Redevelopment > Increasing waterflood performance > Over 8,000 wells drilled since inception • Continue to find new opportunities > Inventory of over 1,000 wells > Production sharing contract • Solid reputation in urban area developments Example Pattern ROR Sensitivity Key Assumptions & Outputs 1 Refer to Endnote reference 2 in the Appendix for detail on the calculation of F&D costs. |
|
|
29 Ventura Basin • Estimated ~3.5 billion barrels OOIP in CRC fields1 • Operate 25 fields (about 40% of basin) • 300,000 acres • Multiple source rocks: Miocene (Monterey and Rincon Formations), Eocene (Anita and Cozy Dell Formations) • 1H’14 average net production of 9 MBoe/d • In 2013, shot 10 mi2 of 3D Seismic > First 3D seismic acquired by any company in the basin Overview Key Assets Basin Map 1Internal estimates; includes shales which are not considered in most older publicly available estimates. • CRC has 4 early stage waterfloods • Ventura Avenue Field is analog with >30% RF • CRC fields have ~3.5 Bn barrels OOIP with a current RF at 14% Waterflood Potential |
|
|
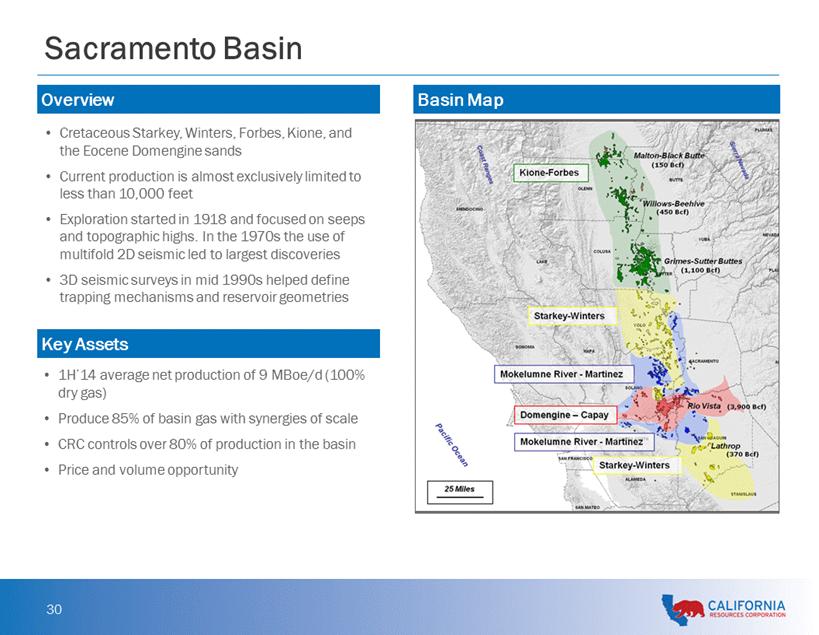
Overview Cretaceous Starkey, Winters, Forbes, Kione, and the Eocene Domengine sands Current production is almost exclusively limited to less than 10,000 feet Exploration started in 1918 and focused on seeps and topographic highs. In the 1970s the use of multifold 2D seismic led to largest discoveries 3D seismic surveys in mid 1990s helped define trapping mechanisms and reservoir geometries Key Assets 1H’14 average net production of 9 MBoe/d (100% dry gas) Produce 85% of basin gas with synergies of scale CRC controls over 80% of production in the basin Price and volume opportunity Basin Map |
|
|
31 Shale Geological Overview Major U.S. Shale Plays California Unconventional Potential • Successful in upper Monterey using precise development approach • Expanding efforts into lower Monterey and other shales Play Depth (ft) Thickness (gross ft) Porosity (%) Permeability (mD) Total Organic Carbon (%) Upper Monterey(1) 3,500' – 12,000' 250' – 3,500' 5 – 30 <0.0001 – 2 1 – 12 Lower Monterey(1) 9,000' – 16,000' 200' – 500' 5 – 12 <0.001 – 0.05 2 – 18 Kreyenhagen(1) 8,000' – 16,000' 200' – 350' 5 – 15 <0.001 – 0.1 1 – 6 Moreno(1) 8,000' – 16,000' 200' – 300' 5 – 10 <0.001 – 0.1 2 – 6 Bakken 3,000' – 11,000' 6' – 145' 2 – 12 0.05 8 – 21 Barnett 5,400' – 9,500' 100' – 500' 4.0 – 9.6 <0.0001 – 0.1 4 – 8 Eagle Ford 5,000' – 12,000' 100' – 250' 3.4 – 14.6 0.13 2 – 9 CRC Current Production CRC Areas of Future Development 1Reservoir characteristics were internally generated based on regional 2D seismic data, 3D seismic data, open hole and mud log data, cores and other reservoir engineering data. |

|
|
32 CRC’s Regulatory Program • Demonstrate CRC’s strong commitment to safety and environmental responsibility • Proactively engage in transparent and constructive dialogue with communities and regulators • Serve as an active community partner to build mutually beneficial relationships • Senior CRC leaders and dedicated teams collaborate with regulatory agencies and community organizations |
|
|
33 Proven Track Record in Sensitive Environments • Operator of choice in coastal environments • Proven coexistence with sensitive environmental receptors • Excellence in safety and mechanical integrity |
|
|
34 CRC’s Unique Regulatory Flexibility Long and distinguished regulatory track record Leading acreage position and diversity of opportunities • Core operations in longstanding oil & gas fields • Primary production, IOR and EOR • All grades of oil, NGLs and natural gas • Government-operated fields and private land • Coastal / inland and urban / rural Extensive network of production assets, gas plants, pipelines and utilities • Reliable supplier of in-state energy resources (62% of oil and 90% of natural gas in California is imported) • Net supplier of water to agriculture |

|
|
35 Financial Strength Provides Flexibility to Drive Growth • Capital program: Invest within cash flow • Growth strategy based on re-investment in opportunity rich portfolio of projects and disciplined allocation of capital • Maintain strong liquidity profile • Target debt / EBITDAX of 2.2x or less • Funds from operations / debt: 30% - 40% • Selective commodity hedging to support capital program or M&A • Opportunistic M&A to increase asset base where attractive • Corporate family and senior unsecured credit ratings of Ba1 and BB+ from Moody’s and S&P, respectively Capitalization as of 10/1/14 ($MM) $2.0Bn Senior Unsecured RC F1 $65 Senior Unsecured Term Loan 1,000 Senior Unsecured Notes 5,000 T otal Debt $6,065 Equity 4,869 Total C apitalization $10,934 C redit Statistics: Total Debt / C apitalization 55% Total Debt / LTM EBITDAX 2.2x Asset C ov erage: PV-102 / T otal Debt 2.3x Total Debt / P roved Reserves ($/Boe) $8.15 Total Debt / PD R eserves ($/Boe) $11.80 1 CRC expects to borrow an additional $300 – 350 million, including (i) $200 million to repay a short term loan from OXY used to fund the acquisition of oil and gas properties and (ii) $100 – 150 million concurrently with, or shortly after, the Spin-Off to fund working capital requirements as a stand-alone company. 2 PV-10 shown as of 12/31/13 based on SEC five-year rule applied to PUDs using SEC price deck. |
|
|
36 Drilling ~$1,390 ~66% Dev. Facility ~$280 ~13% Workover ~$200 ~9% Exploration ~$95 ~5% Other ~$145 ~7% Self-Funded Capital Investment Program Commentary 2014 Drilling Capital Budget – By Basin 2014 Total Capital Budget 2014 Capital Budget – By Drive San Joaquin $942 68% Los Angeles $384 28% Ventura $56 4% Sacramento $8 1% • 2014 capital budget of $2.1 billion is an increase of 24% from 2013 • CRC plans to reinvest excess free cash flow that prior to spin was sent to Occidental Total: $2.1 billion Total: $1,390 million Primary $342 16% Unconventional $543 26% Waterflood $787 37% Steamflood $343 16% Exploration $95 5% 1Other includes land, seismic, infrastructure and other investments. 1 |
|
|
37 The CRC Opportunity World Class Resource Base Portfolio of Lower-Risk, High-Growth Opportunities Management Expertise California Heritage Shareholder Value Focus |
|
|
38 Q & A |

|
|
39 Appendix |

|
|
40 CRC’s Strong, Highly Experienced Management Team Name Position Prior Experience Todd Stevens President and Chief Executive Officer VP Corporate Development OXY; VP California Operations OXY Bill Albrecht Executive Chairman President O&G Americas; President OXY Oil and Gas USA; VP California Operations OXY Mark Smith Senior EVP - Chief Financial Officer Senior VP and CFO Ultra Petroleum; VP Upstream Business Development Constellation Energy Robert Barnes EVP - Northern Operations President and General Manager Elk Hills; General Manger Argentina; VP Operations Permian Shawn Kerns EVP - Corporate Development President and General Manager Vintage; President and General Manager Elk Hills Frank Komin EVP - Southern Operations President and General Manager Long Beach and LA Basin Roy Pineci EVP - Finance VP and Controller; Senior VP of Finance OXY Michael Preston EVP - General Counsel VP and General Counsel of OXY Oil & Gas Darren Williams EVP - Exploration Africa Exploration Manager Marathon Oil; President, Marathon Upstream Gabon Limited Charlie Weiss EVP - Public Affairs VP Health, Environment, and Safety OXY; VP and General Counsel OXY Inc. Scott Espenshade VP - Investor Relations VP Investor Relations BHP Billiton; Director Corporate Development and Investor Relations Swift Energy • Investing behind a highly experienced management team with a strong track record • Management team and technical staff have previous experience at OXY / CRC, and prior focus on California operations |
|
|
41 CRC’s Board of Directors (Effective 12/1/14) Name Position Experience Bill Albrecht Executive Chairman Former President O&G Americas; President OXY Oil and Gas USA; VP California Operations OXY Todd Stevens Director, President and Chief Executive Officer Former VP Corporate Development OXY; VP California Operations OXY Justin Gannon Director Independent Consultant, private investor and former Managing Partner with Grant Thornton and audit partner with Arthur Andersen Ron Havner Director Current Chairman, President and CEO of Public Storage Harold Korell Director Former Chairman and CEO of Southwestern Energy Co. Richard Moncrief Director Founding principal and current President and Chairman of Moncrief Oil International Avedick Poladian Director Current Executive Vice President of Lowe Enterprises, Inc. and Director of Occidental Petroleum Robert Sinnott Director Current President, CEO and Chief Investment Officer of Kayne Anderson Capital Advisors, L.P. |
|
|
42 Non-GAAP Reconciliation for EBITDAX For the Year Ended December 31, 9 Months Ended, Last Twelve Months Ended, 2011 2012 2013 9/30/2013 9/30/2014 9/30/2014 Net Income $971 $699 $869 $657 $657 $869 Interest Expense - - - - - - Provision for income taxes 670 482 578 438 444 584 Depreciation, depletion and amortization 675 926 1,144 853 886 1,177 Exploration expense 114 148 116 81 71 106 EBITDAX $2,430 $2,255 $2,707 $2,029 $2,058 $2,736 Net cash provided by operating activities $2,456 $2,223 $2,476 $1,903 $1,891 $2,464 Interest expense - - - - - - Cash income taxes 84 (121) 318 241 182 259 Cash exploration expenses 40 20 44 30 19 33 Changes in operating assets and liabilities (123) 202 (102) (103) (12) (11) Asset impairments and related items - (41) - - - - Other, net (27) (28) (29) (42) (22) (9) EBITDAX $2,430 $2,255 $2,707 $2,029 $2,058 $2,736 $ millions |

|
|
43 CRC Exploration Characteristics Conventional • Complex California geology provides unique opportunities below existing fields and along trend • 3D seismic is helpful, but may not clearly define traps • In house regional experience and horizontal well technology improve our ability to explore for these structures Unconventional Sand • Little exploration in California by industry since 1970s; much has been missed • Benefit today from: extensive 3D coverage, modern logs and updated geologic models • Hydraulic fracturing generates major productivity gains in unconventional sands Unconventional Shale • Oil is present, but variability is high where there is no structure • Many tools available today to commercialize this resource • Modern logs • Vertical completion techniques used on Elk Hills Shales • Horizontals and fracturing |

|
|
44 Largest CRC Fields Have World Class Oil-in-Place and Stacked Pay Potential Pico Fm. U. Jones L. Jones U. Main L. Main AA TM C D Repetto Fm. Puente Fm. Topanga Fm. Repetto Fm. Puente Fm. Topanga Fm. Pico Fm. U. Bolsa M. Bolsa U. Ashton L. Ashton Miocene C L. Bolsa 0 1000 2000 3000 4000 5000 6000 7000 8000 9000 10000 11000 12000 Tar Ranger 237 Catalina Schist U. Terminal Union Pacific Ford San Pedro Pico L. Terminal Puente Fm. Pliocene Cret. M I O C E N E Pleis. Pliocene. Miocene Oligocene Eocene Etchegoin/ Jacalitos Reef Ridge Vaqueros Mc Adams McLure Temblor Kreyenhagen Reservoir/Formation Gas Pay Zone Oil Pay Zone Additional Potential Fields with 3D Seismic Monterey Temblor Pliocene. Pleis. M I O C E N E San Joaquin Reef Ridge Devilwater Santos Antelope McDonald Gould Tulare Etchegoin P4 Carneros Monterey Temblor Pliocene. Pleis. M I O C E N E Oligoc. San Joaquin Reef Ridge Devilwater Santos Antelope McDonald Gould Tulare Etchegoin Carneros Media Agua D/PG Depth *Internal estimates; includes shales which are not considered in most older publicly available estimates. Offshore Onshore Elk Hills Buena Vista Kettleman Wilmington Huntington Beach OOIP*: 8 billion Boe 7 billion Boe 4 billion Boe 7 billion Boe 2 billion Boe Proven pay zones: 6 4 6 8 8 5 Potential pay zones: 2 6 2 1 1 1 |
|
|
45 CRC Highlights – Unconventional Opportunities • Over the long-term, expect substantial production growth to come from unconventional reservoirs • CRC has mineral interests in ~1.1 million net acres with unconventional potential and 4,682 identified drilling locations, primarily targeting the San Joaquin Basin • Exploiting seven discrete stacked pay horizons within the Monterey formation, primarily the upper Monterey • Over the last five years, CRC has drilled and completed over 570 unconventional development wells with nearly 100% commercial success rate • Applying knowledge acquired from recent successes to operations in other unconventional reservoirs, such as the Kreyenhagen and Moreno shale formations • Similar reservoir characteristics with multiple potentially productive zones Sacramento San Francisco Los Angeles Bakersfield CRC Acreage Unconventional Production Unconventional Production Unconventional Potential |
|
|
46 3D Seismic Coverage • Experienced technical staff, leading acreage position and extensive 3D seismic library, covering over 2.7 million acres, including 47% of CRC’s acreage, results in a strong competitive advantage • Interpretation of this seismic data and extensive knowledge of California geology and producing fields have resulted in a large inventory of exploratory projects CRC 3D Surveys CRC Acreage Legend |
|
|
47 Exploration Discoveries • Conventional Discovery > New fault block in south San Joaquin Valley > Running room on trend • Unconventional Sand > Overlooked thin sand near Buena Vista Hills > Multiple additional prospects identified • Unconventional Shale > Re-tested shales with modern completions > Encouraged to extensively test giant North Dome structure ! ! THUMS Sacramento Basin LA Basin Ventura Basin Elk Hills California San Joaquin Basin CRC Acreage Discovery Examples 2013: Conventional 2012: Unconventional sand 2013: Unconventional shale |
|
|
48 Historical Costs Incurred 1,704 2,069 1,574 185 159 131 1,531 406 53 300 150 $3,720 $2,784 $1,758 0 1,000 2,000 3,000 4,000 5,000 2011 2012 2013 $ in millions Development Exploration Acquisitions Infrastructure • CRC has increased capital expenditure efficiency • In 2013, development costs decreased by nearly $500 million primarily related to a ~20% decline from 2012 drilling costs • As a result of recent investments in infrastructure, CRC does not anticipate substantial infrastructure investment during the next several years • Completed the Elk Hills cryogenic gas plant in 2012, which had capital expenditures of ~$300 million and ~$150 million in 2011 and 2012, respectively Source: Costs incurred include capital expenditures, exploration (whether expensed of capitalized), acquisitions and asset retirement obligations as disclosed in the Form 10. 1 Development costs exclude infrastructure investment of ~$300 million and ~$150 million in 2011 and 2012, respectively. 1 |

|
|
49 Stable Leasehold Position 41,757 67,556 130,102 937 579 6,471 9,626 13,701 16,225 0 20,000 40,000 60,000 80,000 100,000 120,000 140,000 160,000 180,000 2014 2015 2016 Net Acres San Joaquin Basin Los Angeles Basin Ventura Basin Sacramento Basin Note: Los Angeles Basin has no net undeveloped acreage lease expirations through 2016. Undeveloped acreage lease expirations, net San Joaquin Basin Los Angeles Basin Ventura Basin Sacramento Basin Total CRC Held in fee acreage, net (000s) 943 13 212 195 1,363 % net acreage held in fee 63% 45% 83% 36% 60% Undeveloped acreage, net (000s) 1,110 10 196 288 1,604 Total acreage, net (000s) 1,485 30 257 533 2,305 % undeveloped 75% 32% 77% 54% 70% |

|
|
50 Wilmington Field – Production Sharing Contracts • Over 90% of CRC’s Long Beach production is covered under Production Sharing Contracts (PSCs) with the State and City of Long Beach • CRC’s net production decreases when prices rise and increases when prices decline • “Base” rate/profit are defined in contracts • State/City receive most of base profit • CRC receives remainder • “Incremental” rate/profit is everything greater than base Tidelands PSC LBU PSC - 10,000 20,000 30,000 40,000 50,000 1992 1994 1996 1998 2000 2002 2004 2006 2008 2010 2012 2014 Boe/d Base Incremental Base Profit Split: 4% CRC / 96% State Incremental profit split: 49% CRC / 51% State - 2,000 4,000 6,000 8,000 10,000 2006 2008 2010 2012 2014 Boe/d Base Incremental Base Profit Split: 4% CRC / 96% State (average) 49% CRC / 51% State & City First of 3 new PSC’s executed |
|
|
51 Endnotes 1) As of 12/31/13, CRC’s probable reserves were 218 MMBoe (87% liquids) with a PV-10 of $4 billion and possible reserves were 136 MMBoe (83% liquids) with a PV-10 of $3 billion, each based on SEC pricing. 2) CRC's recycle ratio is equal to cash margin per barrel divided by F&D costs. CRC's cash margin per barrel is calculated as revenue less operating expenses, general and administrative expenses and taxes other than on income for 2013 divided by PDP and PDNP volumes additions for 2013 after adding back production for the period. Includes all drilling and completion costs but excludes land and acquisition costs. CRC's F&D costs are calculated as total exploration, development and acquisition costs for the period divided by total reserves additions for the period from all sources, including acquisitions. CRC's F&D costs were $20.60 / Boe for 2013. F&D costs may not include all the costs associated with exploration and development related to reserves added for the period, or may include costs related to reserves added or to be added in other periods, and may differ from calculations used by other companies. 3) As of 12/31/13, CRC’s probable reserves in the San Joaquin, Los Angeles, Ventura and Sacramento basins were 124 MMBoe (82% liquids), 65 MMBoe (95% liquids), 28 MMBoe (89% liquids) and 1 MMBoe (0% liquids), respectively, with a PV-10 of $2.5 billion, $0.9 billion, $0.6 billion and $0.0 billion, respectively, and CRC’s possible reserves were 109 MMBoe (82% liquids), 12 MMBoe (100% liquids), 14 MMBoe (86% liquids) and 1 MMBoe (0% liquids), respectively, with a PV-10 of $2.4 billion, $0.1 billion, $0.4 billion and $0.0 billion, respectively, each based on SEC pricing. 4) As of 12/31/13, CRC’s probable reserves associated with conventional, waterflood, steamflood and unconventional drive mechanisms were 32 MMBoe (91% liquids), 101 MMBoe (94% liquids), 41 MMBoe (100% liquids) and 44 MMBoe (59% liquids), respectively, with a PV-10 of $0.8 billion, $1.6 billion, $0.9 billion and $0.6 billion, respectively, and CRC’s possible reserves were 42 MMBoe (90% liquids), 35 MMBoe (86% liquids), 8 MMBoe (100% liquids) and 51 MMBoe (75% liquids), respectively, with a PV-10 of $0.9 billion, $0.5 billion, $0.1 billion and $1.3 billion, respectively, each based on SEC pricing. 5) Cash margin per barrel for each producer is calculated as revenue less operating expenses, general and administrative expenses and taxes other than on income for 2013 divided by production for 2013 and derived from publicly available information. CRC’s recycle ratio is equal to CRC’s cash margin per barrel divided by F&D costs. 6) Free cash flow is calculated as cash flows from operations minus capital expenditures, excluding corporate transactions. |
