Attached files
| file | filename |
|---|---|
| 8-K - CHINA FUND INC | fp0011956_8k.htm |

Data as of 9/30/14
Manager’s Commentary
Market Review
In September, the Chinese/Hong Kong equity market suffered a sharp sell-off across the board. This was a result of the lackluster macroeconomic data in China and towards the end of the month, the uncertainty created by the “Occupy Central” protests in Hong Kong. HSBC’s China Purchasing Managers’ Index (“PMI”) remained at 50.2 in September, unchanged from the prior month. The breakdown was mixed, with the new order and new export order figures improving while the employment and price sub-indices declined further. During September, economic activity stabilized in the manufacturing sector and overall data still points to a modest expansion. Also, the People’s Bank of China has formally relaxed mortgage restrictions after continued lackluster transaction volumes in the physical property market.
In Taiwan, the TWSE Index consolidated in September given limited market catalysts. Taiwan’s exportorder growth slowed from 5.7% year-on-year in July to 5.2% year-on-year in August, which was lower than the Bloomberg consensus forecast of 7% year-on-year. Despite some headwinds, we believe that strong demand for consumer electronics will help support Taiwan’s exports.
Fund Review
The China Fund, Inc. (the “Fund”) outperformed the MSCI Global Dragon Index (the “benchmark index”)for the month. Stock selection in the consumer discretionary sector contributed the most to relative returns, while the overweight in consumer discretionary detracted.
The high level of cash is mainly attributable to the pending regulatory approval of the repatriation of the proceeds of our sale of Hand, a former China A Share holding. The repatriation has been delayed because of the long and complex process. This has recently been complicated by the need to demonstrate to the tax authorities in China the details of the re-capitalization that Hand went through in connection with its re-listing from the Stock Exchange of Singapore to the Shanghai Stock Exchange.
Our current expectation is that the sales proceeds of approximately US$40 million will be repatriated by the end of this year, although there may be further delays.
Two of the main contributors for the month were SMIC and Beijing Enterprise. For SMIC, the share price was lifted by favorable Chinese government policies intended to grow the domestic semiconductor industry. With respect to Beijing Enterprise, the stock price changed little over the month and, in a declining market, contributed to the relative outperformance.
Conversely, the main detractors for the month were China Mobile and Primax Electronics. As the Fund narrowed its underweight to China Mobile during the month, the stock underperformed the broader MSCI Golden Dragon Index. Primax Electronics toned down its second half outlook, triggering profit taking and strong selling pressure. We remain positive towards the company because of the undemanding valuation, attractive yield and potential improvement in sales momentum from the first quarter of 2015.
Key Transaction
The key transaction for the month was to narrow the underweight exposure to the Chinese telecom sector. The Chinese telecom sector is likely to benefit from a reduction in marketing expenses, including lower handset subsidies.
Outlook
The Chinese and Hong Kong equity markets are likely to consolidate as the sluggish Chinese economy,coupled with a moderation in Hong Kong’s domestic sector, will undermine the performance of Chinese and Hong Kong equities in the short-term. While sentiment has been positive towards the HK-Shanghai Stock Connect scheme, investors are likely to stay on the side lines in the short-term awaiting its expected implementation towards the end of October.
In Taiwan, strong corporate earnings growth is the major support for the stock market. The strengthening of exports and Apple’s new product sales, in line with market expectations, are also positives for the Taiwan stock market. However, the upcoming local election at the end of November is a risk and may cap the upside potential in the short-term.
The China Fund, Inc.
In Brief
Fund Data
|
Description
|
Seeks to achieve long-term capital appreciation through investments in China companies.
|
|
Listing Date (NYSE)
|
July 10, 1992
|
|
Total Fund Assets (millions)
|
$368.2
|
|
Median Market Cap (in billions)
|
$6.0
|
|
Distribution Frequency
|
Annual
|
|
Management Firm
|
Allianz Global Investors U.S. LLC
|
|
Portfolio Management
|
Christina Chung, CFA Lead Portfolio Manager
|
Performance (US$ Returns)
(as of 9/30/14)
|
Fund
|
Benchmark¹
|
|
|
One Month
|
-5.25%
|
-6.74%
|
|
Three Months
|
-1.55%
|
-1.55%
|
|
One Year
|
10.04%
|
7.23%
|
|
Three Years % pa
|
10.62%
|
12.58%
|
|
Net Asset Value / Market Price
|
|
|
Net Asset Value (NAV) / Market Price at Inception
|
$13.15 / $14.26
|
|
NAV / Market Price (as of 9/30/14)
|
$23.48 / $20.82
|
|
High / Low Ranges (52-Week)
|
|
|
High / Low NAV
|
$26.60 / $21.65
|
|
High / Low Market Price
|
$23.61 / $19.20
|
|
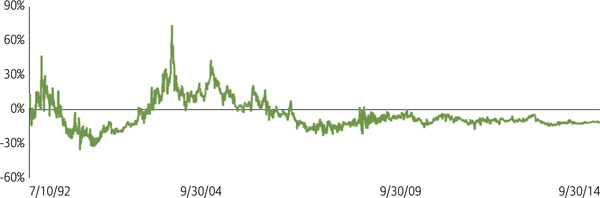
Premium/Discount to NAV (as of 9/30/14)
|
-11.33%
|
|
Fund Data (Common Shares)
|
|
|
Shares Outstanding
|
15,682,028
|
|
Average Daily Volume
|
43,881
|
|
Expense Ratio
|
1.30%
|
Fund Managers

Christina Chung, CFA
Lead Portfolio
Manager

The China Fund, Inc.
Investment Objective
The investment objective of the Fund is to achieve long-term capital appreciation. The Fund seeks to achieve its objective through investment in the equity securities of companies and other entities with significant assets, investments, production activities, trading or other business interests in China or which derive a significant part of their revenue from China.
The Fund has an operating policy that the Fund will invest at least 80% of its assets in China companies. For this purpose, ‘China companies’ are (i) companies for which the principal securities trading market is in China; (ii) companies for which the principal securities trading market is outside of China or in companies organized outside of China, that in both cases derive at least 50% of their revenues from goods or services sold or produced, or have a least 50% of their assets in China; or (iii) companies organized in China. Under the policy, China means the People’s Republic of China, including Hong Kong, and Taiwan. The Fund will provide its stockholders with at least 60 days’ prior notice of any change to this policy.
Average Annual Returns
|
1 Month
|
3 Month
|
YTD
|
1 Year
|
3 Year
|
5 Year
|
10 Year
|
Inception
|
|
|
NAV
|
-5.25%
|
-1.55%
|
1.91%
|
10.04%
|
10.62%
|
8.67%
|
14.38%
|
10.80%
|
|
Market Price
|
-6.09%
|
-1.65%
|
0.05%
|
11.19%
|
11.65%
|
7.50%
|
11.56%
|
9.80%
|
|
MSCI Golden Dragon Index
|
-6.74%
|
-0.83%
|
3.28%
|
7.23%
|
12.58%
|
6.31%
|
9.63%
|
—
|
Calendar Year Returns
|
2006
|
2007
|
2008
|
2009
|
2010
|
2011
|
2012
|
2013
|
|
|
NAV
|
57.10%
|
86.20%
|
-46.95%
|
72.83%
|
27.26%
|
-24.37%
|
12.12%
|
18.31%
|
|
Market Price
|
65.68%
|
50.24%
|
-40.65%
|
72.19%
|
23.60%
|
-27.51%
|
20.52%
|
12.70%
|
|
MSCI Golden Dragon Index
|
39.50%
|
37.97%
|
-49.37%
|
67.12%
|
13.60%
|
-18.35%
|
22.65%
|
7.25%
|
Past performance is not a guide to future returns.
Returns are annualized, except for periods or less than one year.
Source: State Street Bank and Trust Company. Source for index data: MSCI as at September 30, 2014. Investment returns are historical and do not guarantee future results. Investment returns reflect changes in net asset value and market price per share during each period and assumes that dividends and capital gains distributions, if any, were reinvested. The net asset value (NAV) percentages are not an indication of the performance of a shareholder’s investment in the Fund, which is based on market price. NAV performance includes the deduction of management fees and other expenses. Market price performance does not include the deduction of brokerage commissions and other expenses of trading shares and would be lower had such commissions and expenses been deducted. It is not possible to invest directly in an index.
Premium/Discount
The China Fund, Inc.
Sector Allocation
|
Fund
|
Benchmark¹
|
|
|
Information Technology
|
29.41%
|
23.15%
|
|
Financials
|
21.33%
|
36.72%
|
|
Consumer Discretionary
|
11.35%
|
6.98%
|
|
Industrials
|
10.57%
|
6.14%
|
|
Energy
|
5.61%
|
6.68%
|
|
Consumer Staples
|
4.43%
|
3.14%
|
|
Telecom Services
|
3.52%
|
7.16%
|
|
Materials
|
1.17%
|
4.25%
|
|
Health Care
|
1.14%
|
1.05%
|
|
Utilities
|
0.00%
|
4.66%
|
|
Other assets & liabilities
|
11.48%
|
0.00%
|
Country Allocation
|
Fund
|
Benchmark¹
|
|
|
China
|
64.23%
|
70.62%
|
|
Hong Kong Red Chips
|
13.20%
|
13.16%
|
|
Hong Kong 'H' shares
|
18.90%
|
23.89%
|
|
Equity linked securities ('A' shares)
|
8.33%
|
0.00%
|
|
China 'A' & 'B' shares
|
0.00%
|
0.22%
|
|
Other Hong Kong securities
|
23.80%
|
33.30%
|
|
Singapore
|
0.00%
|
0.00%
|
|
Taiwan
|
24.40%
|
29.38%
|
|
Direct
|
0.00%
|
0.00%
|
|
Other assets & liabilities
|
11.37%
|
0.00%
|
Top 10 Holdings
|
CHINA MINSHENG BK (China)
|
4.61%
|
|
BEIJING ENTERPRISES HLDG (China)
|
3.67%
|
|
CHINA MOBILE LTD (China)
|
3.51%
|
|
HONG KONG EXCHANGES AND CLEARING LTD (H.K.)
|
3.37%
|
|
PETROCHINA CO LTD (China)
|
3.32%
|
|
HERMES MICROVISION INC (Taiwan)
|
3.04%
|
|
SUN HUNG KAI PROPERTIES LTD (H.K.)
|
3.03%
|
|
DELTA ELECTRONICS INC (Taiwan)
|
2.95%
|
|
LI & FUNG LTD (H.K.)
|
2.86%
|
|
TAIWAN SEMIC CO LTD (Taiwan)
|
2.83%
|
Portfolio Characteristics
|
Fund
|
Benchmark¹
|
|
|
P/E Ratio
|
12.06
|
10.89
|
|
P/B Ratio
|
1.70
|
1.34
|
|
Issues in Portfolio
|
46
|
281
|
|
Foreign Holdings (%)
|
88.52
|
100.00
|
|
Cash (%)
|
11.48
|
0.00
|
|
Yield (%)
|
2.72
|
3.07
|
|
1.
|
MSCI Golden Dragon Index.
|
The China Fund, Inc.
Distribution History (10 Year)
|
Declaration Date
|
Ex-dividend Date
|
Record Date
|
Payable Date
|
Distribution/
Share
|
Income
|
Long-term
Capital Gain
|
Short-term
Capital Gain
|
|
12/13/04
|
12/20/04
|
12/22/04
|
1/7/05
|
$3.57010
|
$0.19630
|
$3.26640
|
$0.10740
|
|
12/9/05
|
12/19/05
|
12/21/05
|
12/29/05
|
$2.51190
|
$0.21720
|
$2.29470
|
—
|
|
12/8/06
|
12/19/06
|
12/21/06
|
12/29/06
|
$4.01170
|
$0.29960
|
$2.73090
|
$0.98120
|
|
12/7/07
|
12/19/07
|
12/21/07
|
1/25/08
|
$12.12000
|
$0.28000
|
$9.00000
|
$2.84000
|
|
12/8/08
|
12/22/08
|
12/24/08
|
1/23/09
|
$5.81740
|
$0.48130
|
$5.33610
|
—
|
|
12/9/09
|
12/22/09
|
12/24/09
|
12/29/09
|
$0.25570
|
$0.25570
|
—
|
—
|
|
12/8/10
|
12/21/10
|
12/24/10
|
12/29/10
|
$2.27420
|
$0.37460
|
$1.89960
|
—
|
|
12/8/11
|
12/21/11
|
12/23/11
|
12/29/11
|
$2.99640
|
$0.17420
|
$2.82220
|
—
|
|
12/10/12
|
12/20/12
|
12/24/12
|
12/28/12
|
$3.25170
|
$0.34730
|
$2.90440
|
—
|
|
12/13/13
|
12/19/13
|
12/23/13
|
12/27/13
|
$3.31400
|
$0.43870
|
$2.87530
|
—
|
Distribution/Share includes Income, Long-term Capital gains and Short-term Capital gains.
The China Fund NAV Performance of $10,000 since inception (with dividends reinvested at NAV price)
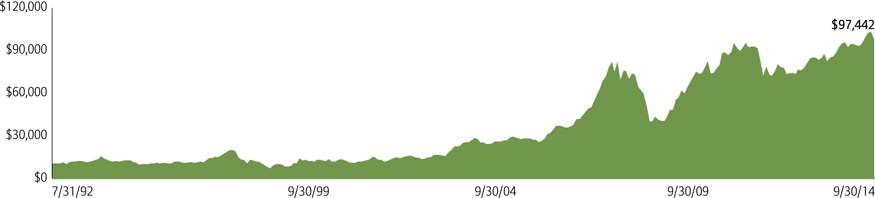
Past performance is not a guide to future returns.
Index Description
MSCI Golden Dragon Index
The MSCI Golden Dragon Index captures the equity market performance of large and mid cap China securities (H shares, B shares, Red-Chips and P-Chips) and non-domestic China securities listed in Hong Kong and Taiwan.
It is not possible to invest directly in an index.
The China Fund, Inc.
Portfolio in Full
|
Sector
|
Company
(exchange ticker)
|
Price
|
Holding
|
Value US
|
$% of
net assets
|
|
Information Technology
|
29.39
|
||||
|
HERMES MICROVISION INC
|
3658
|
1,270
|
269,000
|
11,230,625
|
3.04
|
|
DELTA ELECTRONICS INC
|
2308
|
192
|
1,723,000
|
10,875,129
|
2.95
|
|
TAIWAN SEMIC CO LTD
|
2330
|
120
|
2,647,000
|
10,441,986
|
2.83
|
|
TENCENT HOLDINGS LTD
|
700
|
115
|
625,500
|
9,287,909
|
2.52
|
|
TONG HSING ELECTRONIC INDUS
|
6271
|
134
|
2,067,000
|
9,071,303
|
2.46
|
|
SEMICOND MANUF INT
|
981
|
1
|
86,779,000
|
8,828,828
|
2.39
|
|
DIGITAL CHINA HOLDINGS LTD
|
861
|
7
|
8,865,000
|
7,923,180
|
2.15
|
|
ASM PACIFIC TECHNOLOGY LTD
|
522
|
77
|
717,000
|
7,096,176
|
1.92
|
|
LARGAN PRECISION CO LTD
|
3008
|
2,180
|
96,000
|
6,879,798
|
1.86
|
|
COMBA TELECOM SYST HLDG
|
2342
|
4
|
11,150,000
|
5,040,148
|
1.37
|
|
ADVANTECH CO LTD
|
2395
|
215
|
694,841
|
4,911,021
|
1.33
|
|
PRIMAX ELECTRONICS LTD
|
4915
|
35
|
3,174,000
|
3,683,236
|
1.00
|
|
EPISTAR CORP
|
2448
|
57
|
1,812,000
|
3,389,365
|
0.92
|
|
MEDIATEK INC
|
2454
|
451
|
227,000
|
3,361,775
|
0.91
|
|
CITIGROUP GLOBAL MARKETS HLDG (exch. for HANGZHOU HIKVISION DIGI)
|
N/A
|
3
|
1,071,208
|
3,355,023
|
0.91
|
|
HERMES MICROVISION INC (GDR)
|
97457816
|
42
|
46,900
|
1,958,075
|
0.53
|
|
GOLDPAC GROUP LTD
|
3315
|
7
|
1,244,000
|
1,105,429
|
0.30
|
|
Financials
|
21.34
|
||||
|
CHINA MINSHENG BK
|
1988
|
7
|
18,621,100
|
17,026,486
|
4.61
|
|
HONG KONG EXCHANGES AND CLEARING LTD
|
388
|
167
|
576,300
|
12,416,692
|
3.37
|
|
SUN HUNG KAI PROPERTIES LTD
|
16
|
110
|
788,000
|
11,173,131
|
3.03
|
|
ICBC LTD
|
1398
|
5
|
14,319,000
|
8,906,789
|
2.41
|
|
CATHAY FINANCIAL HLDG
|
2882
|
50
|
5,117,000
|
8,335,027
|
2.26
|
|
PING AN INSURANCE
|
2318
|
58
|
1,015,500
|
7,637,551
|
2.07
|
|
CHAILEASE HOLDING CO LTD
|
5871
|
74
|
2,711,200
|
6,586,488
|
1.79
|
|
CLSA FINANCIAL PRODUCTS LTD (exch. for PING AN INSURANCE(GROUP)
|
N/A
|
7
|
541,933
|
3,641,356
|
0.99
|
|
SHUI ON LAND LTD
|
272
|
2
|
13,467,000
|
3,017,737
|
0.82
|
|
Consumer Discretionary
|
11.35
|
||||
|
LI & FUNG LTD
|
494
|
9
|
9,282,000
|
10,543,177
|
2.86
|
|
MERIDA INDUSTRY CO LTD
|
9914
|
212
|
1,323,000
|
9,220,270
|
2.50
|
|
QINGLING MOTORS CO LTD
|
1122
|
2
|
28,960,000
|
8,540,738
|
2.31
|
|
CLSA FINANCIAL PRODUCTS LTD (exch. for CHINA INTL TRAVEL SERVI)
|
N/A
|
6
|
626,632
|
3,857,045
|
1.05
|
|
DONGFENG MOTOR GROUP CO LTD
|
489
|
13
|
2,108,000
|
3,464,038
|
0.94
|
|
ZHONGSHENG GROUP HOLDINGS LTD
|
881
|
8
|
2,996,500
|
3,195,258
|
0.87
|
|
CITIGROUP GLOBAL MARKETS WTS (exch. for GREE ELECTRICAL APP INC)
|
N/A
|
5
|
676,267
|
3,047,935
|
0.83
|
|
Industrials
|
10.58
|
||||
|
BEIJING ENTERPRISES HLDG
|
392
|
67
|
1,578,000
|
13,544,672
|
3.67
|
|
HUTCHISON WHAMPOA LTD
|
13
|
94
|
736,000
|
8,909,780
|
2.41
|
|
CSR CORP LTD
|
1766
|
7
|
9,765,000
|
8,589,231
|
2.33
|
|
CHINA EVERBRIGHT INTL
|
257
|
10
|
6,048,000
|
7,991,356
|
2.17
|
|
Energy
|
5.61
|
||||
|
PETROCHINA CO LTD
|
857
|
10
|
9,564,000
|
12,255,301
|
3.32
|
|
CNOOC LTD
|
883
|
13
|
3,075,000
|
5,266,937
|
1.43
|
|
CHINA SUNTIEN GREEN ENERGY
|
956
|
2
|
12,785,000
|
3,194,212
|
0.87
|
|
Consumer Staples
|
4.43
|
||||
|
CLSA FINANCIAL PRODUCTS LTD WT (exch. for KWEICHOW MOUTAI)
|
N/A
|
26
|
262,090
|
6,906,569
|
1.87
|
|
NATURAL BEAUTY BIO-TEC
|
157
|
1
|
50,320,000
|
3,758,633
|
1.02
|
|
CITIGROUP GLOBAL MARKETS HOLD (exch. for SHANGHAI JAHWA UNITED)
|
N/A
|
6
|
513,350
|
2,997,964
|
0.81
|
|
CLSA FINANCIAL PRODUCTS WTS (exch. for SHANGHAI JAHWA UNITED)
|
N/A
|
6
|
460,100
|
2,684,684
|
0.73
|
|
Telecom Services
|
3.51
|
||||
|
CHINA MOBILE LTD
|
941
|
90
|
1,123,000
|
12,965,563
|
3.51
|
The China Fund, Inc.
Portfolio in Full
|
Sector
|
Company
(exchange
ticker)
|
Price
|
Holding
|
Value US
|
$% of net assets
|
|
Materials
|
1.17
|
||||
|
TIANGONG INTERNATIONAL CO LTD
|
826
|
2
|
18,480,000
|
4,307,665
|
1.17
|
|
Health Care
|
1.14
|
||||
|
CITI ACCESS (exch. for JIANGSU HENGRUI MEDICAL)
|
N/A
|
6
|
696,350
|
4,194,812
|
1.14
|
Important Information:
Source: State Street Bank and Trust Company, IDS GmbH-Analysis and Reporting Services, a subsidiary of Allianz SE.
Holdings are subject to change daily. The Fund seeks to achieve its objective through investment in the equity securities of companies and other entities with significant assets, investments, production activities, trading or other business interests in China or which derive a significant part of their revenue from China. Investing in non-U.S. securities entails additional risks, including political and economic risk and the risk of currency fluctuations, as well as lower liquidity. These risks, which can result in greater price volatility, will generally be enhanced in less diversified funds that concentrate investments in a particular geographic region.
The information contained herein has been obtained from sources believed to be reliable but Allianz Global Investors U.S. LLC and its affiliates do not warrant the information to be accurate, complete or reliable. The opinions expressed herein are subject to change at any time and without notice. Past performance is not indicative of future results. This material is not intended as an offer or solicitation for the purchase or sale of any financial instrument. Investors should consider the investment objectives, risks, charges and expenses of any mutual fund carefully before investing. This and other information is contained in the fund's annual and semiannual reports, proxy statement and other fund information, which may be obtained by contacting your financial advisor or visiting the fund's website at www.chinafundinc.com. This information is unaudited and is intended for informational purposes only. It is presented only to provide information on the Fund's holdings, performance and strategies. The Fund is a closed-end exchange traded management investment company. This material is presented only to provide information and is not intended for trading purposes. Closed-end funds, unlike open-end funds, are not continuously offered. After the initial public offering by a closed-end fund, its shares can be purchased and sold on the open market through a stock exchange, where shares may trade at a premium or a discount. The market price of holdings is subject to change daily.
P/E is a ratio of security price to earnings per share. Typically, an undervalued security is characterized by a low P/E ratio, while an overvalued security is characterized by a high P/E ratio. P/B is a ratio of the current stock price to the book value. This is used to identify undervalued stocks. Dividend yield is the annual percentage of return earned by an investor on a common or preferred stock. The average dividend yield is the dividend rate divided by current share price.
©2014 Allianz Global Investors Distributors LLC.
|
Investment Products: Not FDIC Insured | May Lose Value | Not Bank Guaranteed
|
AGI-2014-10-14-10766 | FS-CHN-0914
|