Attached files
| file | filename |
|---|---|
| 8-K - FORM 8-K - ALLERGAN INC | d806607d8k.htm |
 October 2014
Allergan
An Assessment of Valeant Pharmaceuticals
International, Inc. Performance
Exhibit 99.1 |
 Important Information
Certain information contained in this presentation regarding Valeant
Pharmaceuticals International, Inc. (“Valeant”) is taken directly
from information publicly disclosed by Valeant and we do not make any representations or warranties,
either express or implied, with respect to such information’s accuracy or
completeness. In addition, certain other information contained in this
presentation is based on publicly available sources as of the date of this presentation,
and while we have no reason to believe that such information is not accurate, we
can provide no such assurances with respect thereto. The information in this
presentation represents the opinions of Allergan and investors and
stockholders
should
make
their
own
independent
investigations
of
the
matters
referenced
in
this
presentation
and
draw their own conclusions.
2 |
 When
Analyzing Valeant’s Q3’14 Performance, We Believe Investors Should
Question: •
Organic growth rates and the quality and thoroughness of the data that Valeant
presents •
The lack of comprehensive product level disclosure including impact of alternative
fulfillment channels
•
Why do many of Valeant’s products appear to lose market share?
•
The sustainability of Valeant’s price increases, which by their own
admission, account for a significant portion of the company’s
growth •
Are Valeant’s stated Q3’14 growth rates positively affected by a weak
Q3’13 and are they reflective of the company’s true performance
going forward? •
Is Valeant’s B&L reporting (for comparison purposes) consistent with
B&L’s historical filings? •
Are post B&L acquisitions reported in B&L results?
•
Does the seeming decrease in value of the Medicis business in Valeant’s hands
raise concerns for other acquired businesses?
•
Can
Valeant
cut
more
costs
at
Allergan
than
it
has
done
in
prior
acquisitions
and
still
maintain
the
growth of the Allergan business?
What is the sustainability of Valeant’s business?
3 |
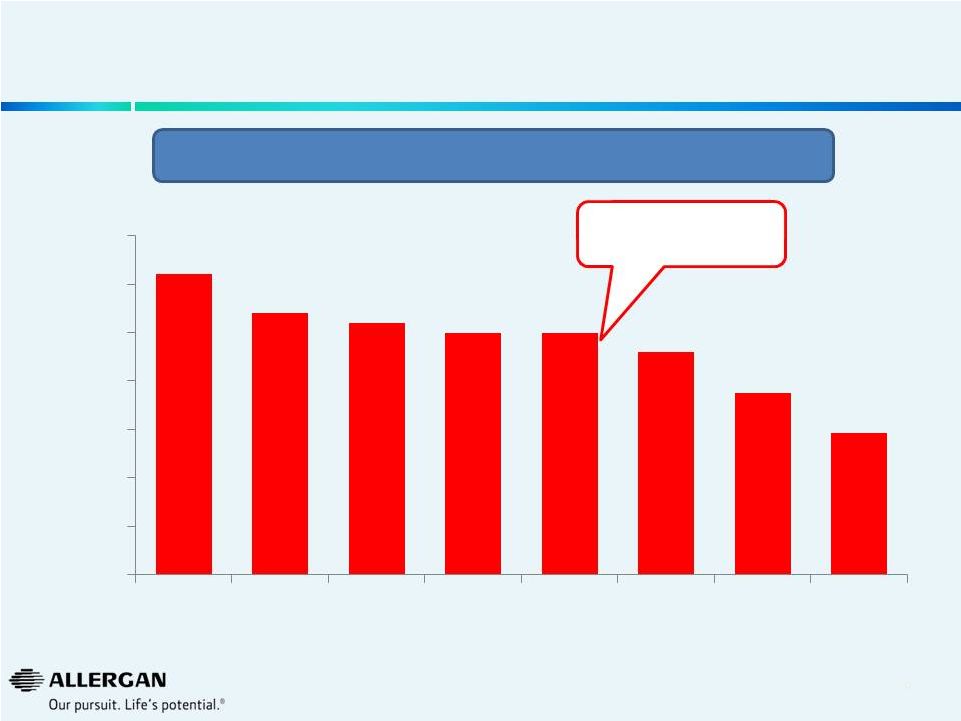
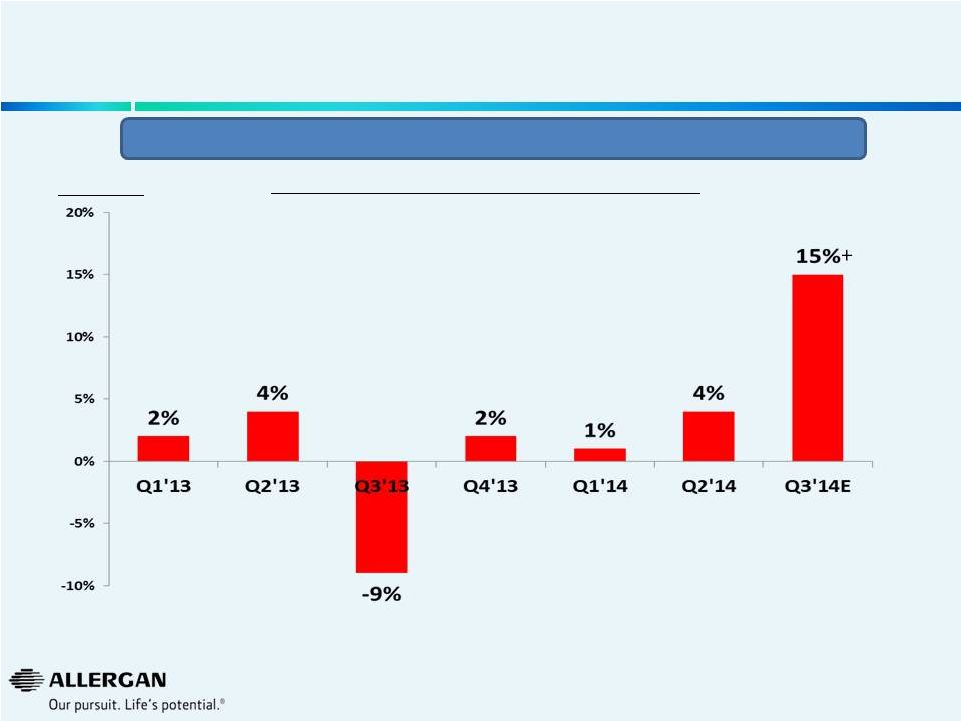 Valeant Quarterly Sales Growth
(as reported by Valeant)
4
We
believe
Q3’14
growth
is
positively
affected
by
a
weak
Q3’13
(B&L
acquisition
on
August
6,
2013)
Source: Valeant public filing on September 30, 2014.
Valeant
Same
Store
Organic
Growth
with
Impact
of
Gx
% Growth Y/Y
+ |
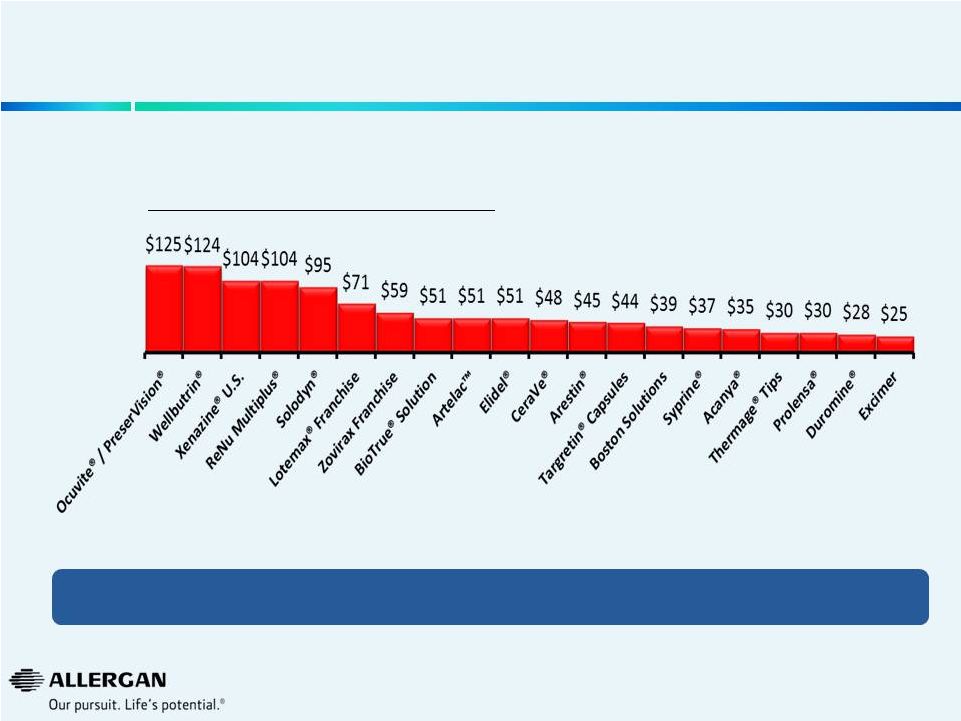 We
Believe Valeant Has No Experience Managing Large, Sophisticated Brands
1
Valeant July 31, 2014 Second Quarter 2014 Financial Results Conference Call
Presentation We believe Valeant does not have experience with large, global
scale products and the requirements to ensure successful
commercialization Q2 2014 YTD
Sales as Reported by Valeant
1
$ in Millions, excludes products divested to Galderma
5 |
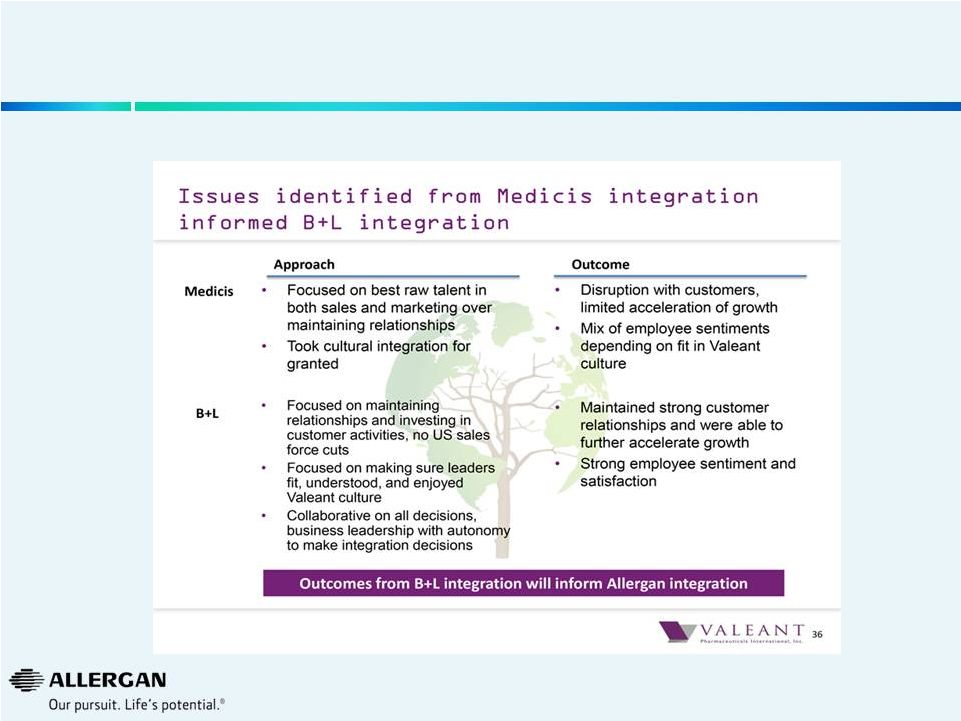
 An
Assessment of Valeant’s Performance with Medicis and Bausch & Lomb
Businesses 6
Medicis Acquisition -
December 2012
36%
Bausch & Lomb Acquisition -
August 2013
49%
Synergies
Extracted
1
Company Filings, Wall Street research, the Wall Street Journal and FactSet as of
05/02/14. Bausch & Lomb is based on 2012A Operating expenditures per
B&L filings and announced synergies of $800M. Represents OPEX as a % of Sales.
1
1 |
 We
Believe Medicis Performance Has
Deteriorated
Post Valeant Acquisition
7
Source: Valeant SEC Filing, September 2014
•
Valeant’s own assessment of Medicis acquisition |
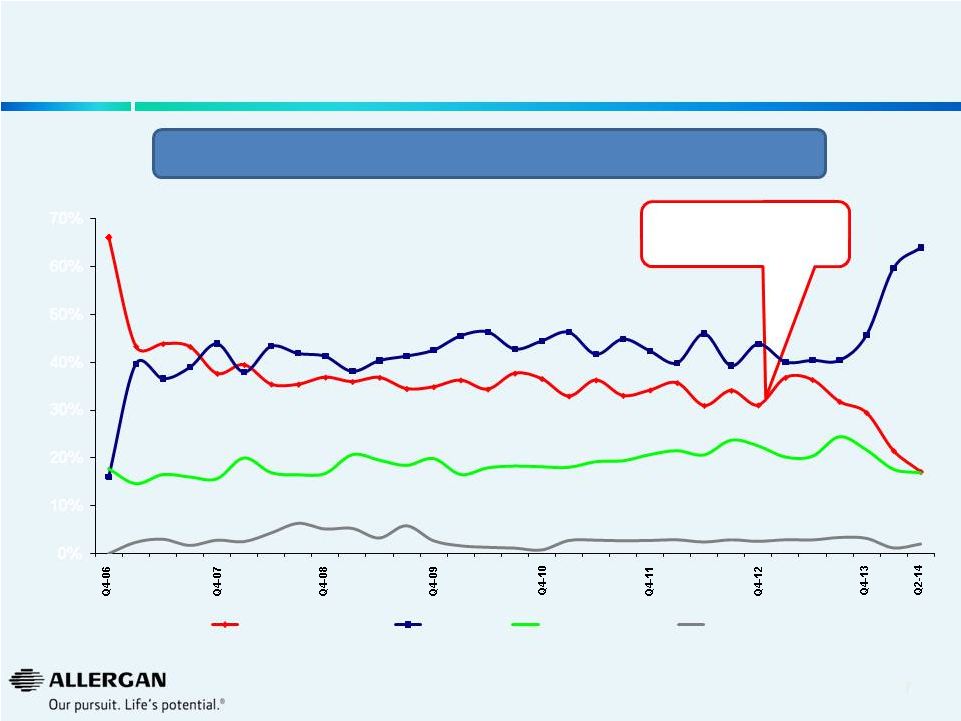 8
U.S. Dermal Facial Fillers Quarterly Market Share
Sources: Mixture of public information (earnings releases, earnings calls,
10K’s, 10Q’s), AGN internal data, syndicated marketing research
reports, analyst reports, GuidePoint Global. Note: Valeant completed the
sale of it’s facial injectable businesses to Galderma in July 2014.
Our
analysis
suggests
there
has
been
a
rapid
erosion
of
purported
“durable”
Medicis
U.S.
Dermal
Filler
business
following
acquisition
&
implementation
of
Valeant
business
model.
8
Valeant’s acquisition of
Medicis in December 2012
66%
38%
37%
35%
37%
34%
31%
29%
17%
16%
44%
41%
43%
45%
42%
44%
46%
0%
10%
20%
30%
40%
50%
60%
70%
Valeant / Medicis
Allergan
Merz / Bioform
others
64% |
 9
U.S. Dermal Facial Fillers Market Overview
9
All Numbers are Approximate
Q2’14
Sales ($M)
YOY
Growth
Market
Share
Q2’13
Market
Share
Q2’14
Total Market
$142
+7%
100%
100%
Allergan
$91
+69%
40%
64%
Valeant / Medicis
$24
-50%
36%
17%
Merz
$24
-11%
20%
17%
All Others
$3
-25%
4%
2%
Sources: Mixture of public information (earnings releases, earnings calls,
10K’s, 10Q’s), AGN internal data, syndicated marketing research
reports, analyst reports , GuidePoint Global.
•
Includes hyaluronic acids, collagens and particle polymer fillers. Does not
include silicone, investigational or minor miscellaneous products.
Valeant completed the sale of it’s facial injectable businesses to Galderma
in July 2014. |
 10
Valeant / Medicis U.S. Topical Acne Market Share*
Source: IMS Class D10A + Tazorac, of which the vast majority is used for acne. IMS D10A
includes topical anti-acne preparations which includes branded and generic
products; this includes topical antibiotics, retinoids, combinations and others.
Excludes sales through alternative fulfillment channels not captured by IMS.
* Represents dollar market share
10
Valeant’s acquisition of
Medicis
in
December
2012
31%
27%
26%
25%
25%
23%
19%
15%
0%
5%
10%
15%
20%
25%
30%
35%
2008
2009
2010
2011
2012
2013
Q1'14
Q2'14
Our analysis suggests there has been a rapid erosion of purported “durable” Medicis’
U.S. Topical Acne business following acquisition & implementation of Valeant business
model. |
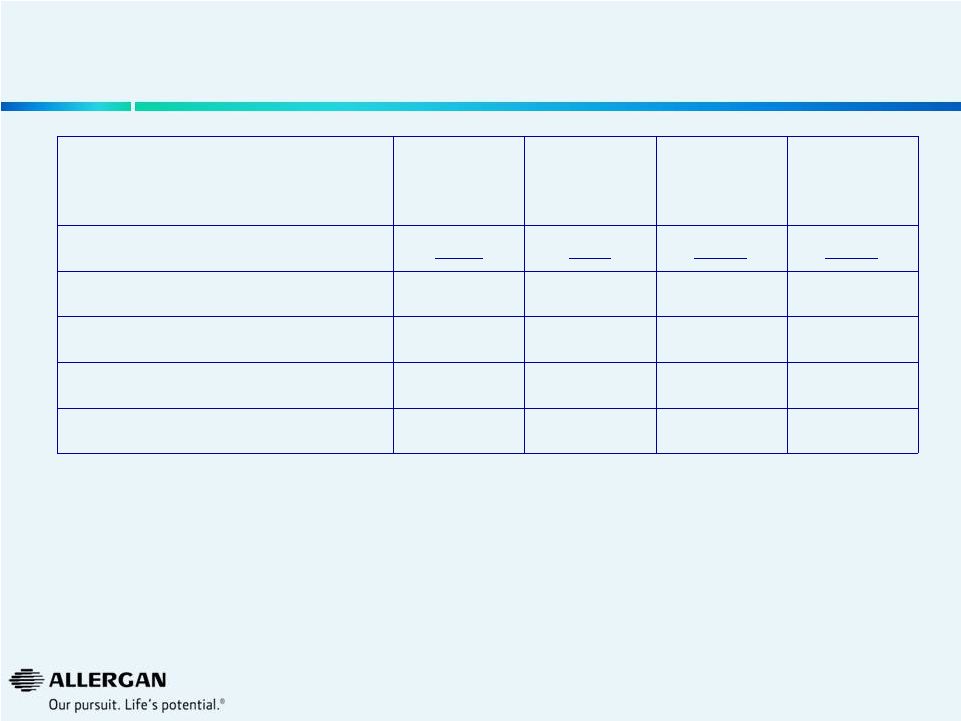
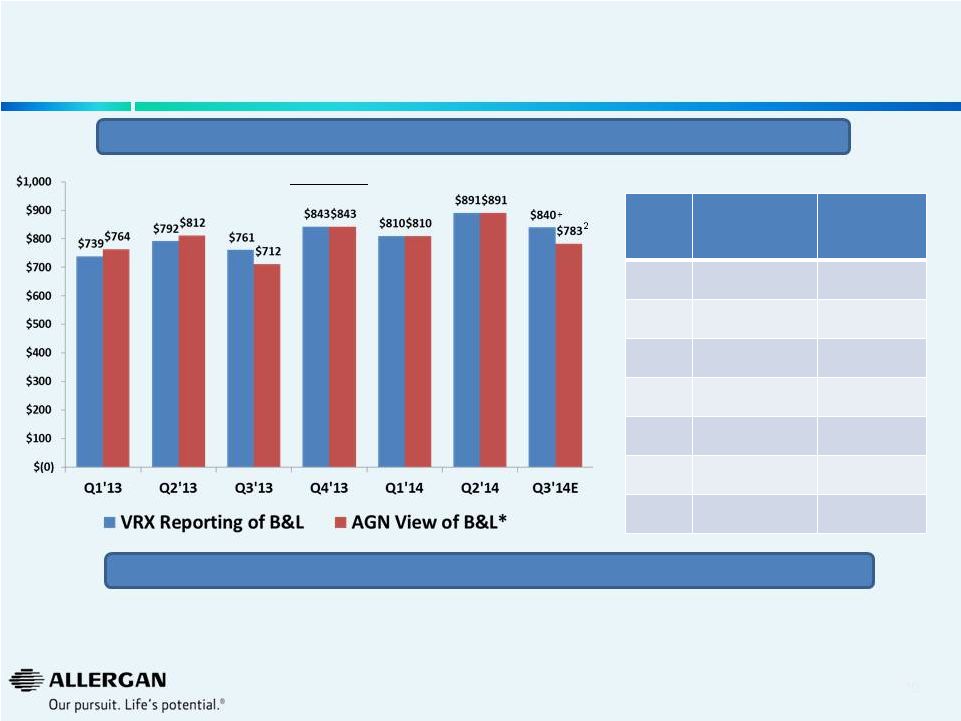 11
Is Valeant Incorporating Sales of Acquired Products in B&L
Sales Reporting?
11
2
Sales Growth
VRX Reporting
of B&L
Sales Growth
AGN View
of B&L
Q1’13
5%
Q2’13
5%
Q3’13
-7%
Q4’13
9%
9%
Q1’14
10%
6%
Q2’14
13%
10%
Q3’14E
10%+
10%1
Are acquisitions (e.g. Croma, Beskon, Visudyne®, Macugen®) included in VRX view of
B&L? Sales $M
+
VRX Reporting of B&L: Product Sales used in Pro Forma Organic Growth as
disclosed in SEC filing on Sept. 30, 2014. * All data from Valeant public
filings. Bausch & Lomb Q1’12, Q2’12, Q1’13, Q2’13 from Bausch & Lomb financial statements included in VRX 6/10/13 and 10/21/13
8Ks. Q3’13 amount derived from subtracting other three quarters from FY13
amount per slide 150 of Valeant 5/28/14 presentation. Q3’12 amount derived from
subtracting other three quarters from FY12 amount per Bausch & Lomb audited
financial statements. Figures not adjusted for currency or divestitures. 1 Based on Sept. 24,
2014 Valeant press release 2
Calculated using 10% Q3’14 Bausch & Lomb update as provided by Valeant on Sept. 24, 2014 over
Q3’13 actual sales dollars based on AGN view of B&L We believe Q3’14
growth is positively affected by a weak Q3’13 (B&L acquisition on August 6, 2013)
|
 With
Even Greater Reduction of Expenses at B&L Relative to Medicis, What is the
Long-Term Growth Capacity for B&L? Q2 YTD 2014
1
Valeant
investor
presentations
&
public
filings,
IMS
and
Market
Scope
LLC
Quarterly
cataract
report
2
IMS & internal Allergan estimates.
3
Novartis / Alcon, J&J, Cooper public data triangulated with internal Allergan
estimates. 4
Estimates based upon Market Scope LLC Quarterly Cataract Report.
2
2
3
4
4
Global
In our view:
12
B&L
Product
Mix
1
Market
Growth
Weighted
Average
Pharmaceuticals
42%
9%
4%
Contact Lens Care
16%
-5%
-1%
Contact Lenses
24%
5%
1%
Refractive
3%
4%
0%
Cataract & Vitreoretinal
15%
6%
1%
Our Estimated Growth of B&L @ Constant Share
5%
•
If B&L were to maintain constant share at current market growth rates, growth potential
would be ~5%
•
Introduction of line extensions in surgical & consumer businesses will likely lead to
short- term acceleration of growth
•
In-market and ex-factory sales do not necessarily correlate
|
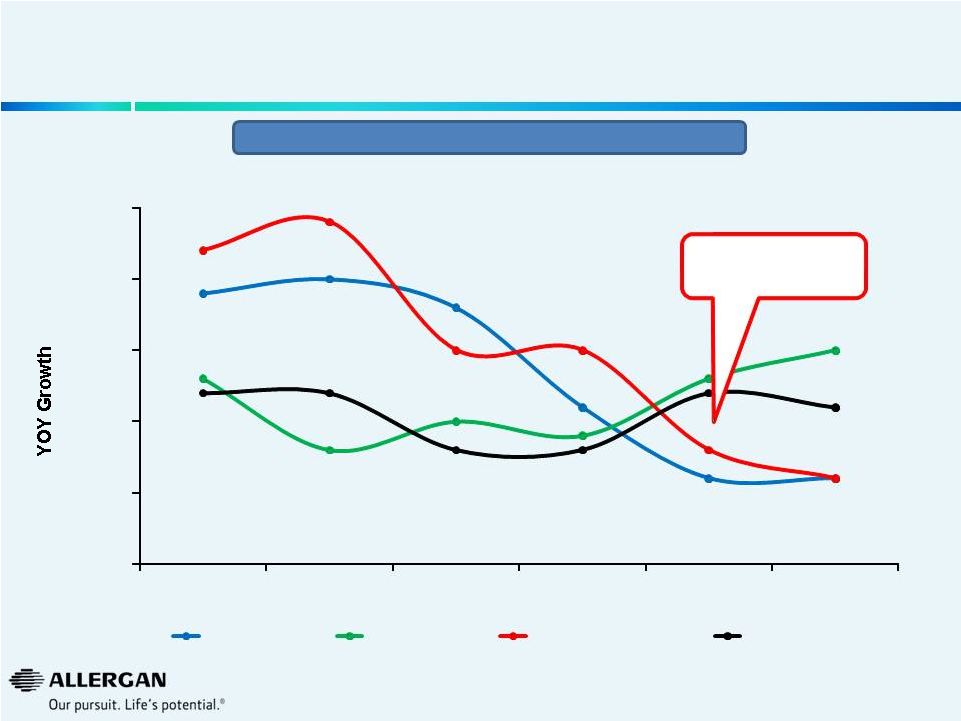 Global Rx Ophthalmics
Major Companies -
YOY Growth
13
Sources: IMS Global (53 countries) at Q2’14 constant exchange rates +
publicly available U.S. retina sales data Deceleration of Valeant / B&L
Growth 22%
24%
15%
15%
8%
6%
0%
5%
10%
15%
20%
25%
2009
2010
2011
2012
2013
YTD Q2'14
Novartis
Allergan
Valeant / B&L
Market
Valeant Acquisition
of B&L in August 2013 |
 Source: Analysis based upon US IMS NPA Combined Retail Acquisition Dollars.
Excludes sales through alternative fulfillment channels not captured by
IMS. 1
Represents acquisition $ growth
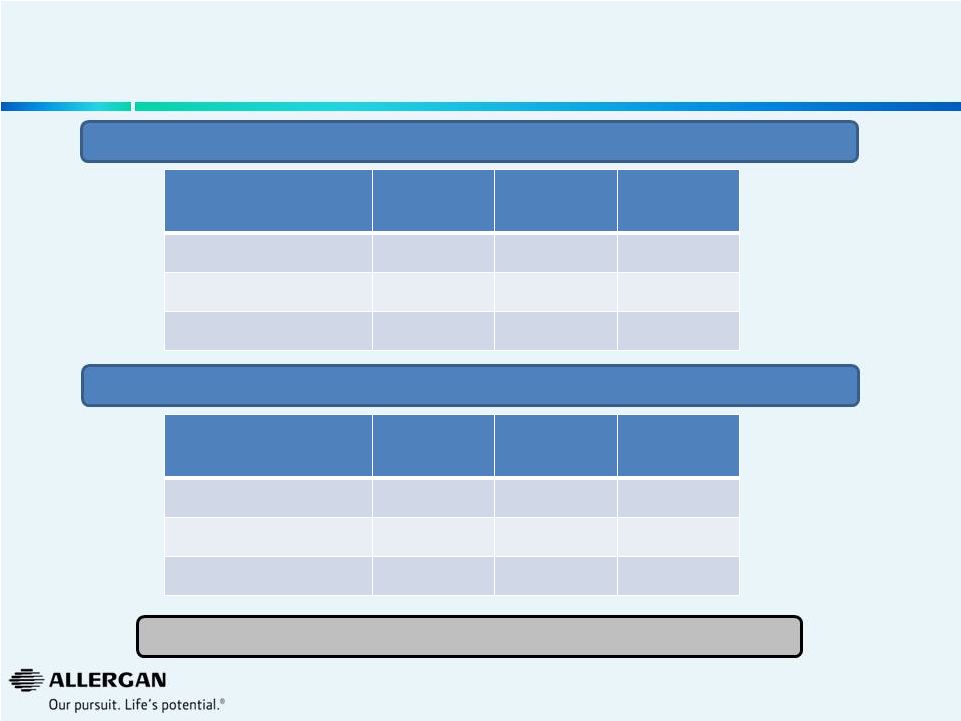
We Believe Price is a Large Driver of Growth for
Select Valeant U.S. Pharmaceutical Businesses
Q2’14 YTD
Volume
Growth
Price
Growth
Total
Growth
1
Total U.S. B&L
3%
8%
11%
Branded U.S. B&L
(3%)
12%
9%
Generic U.S. B&L
11%
3%
14%
Q2’14 YTD
Volume
Growth
Price
Growth
Total
Growth
1
Total U.S.
(43%)
24%
(19%)
Branded U.S.
(50%)
26%
(24%)
Generic U.S.
93%
(5%)
88%
14
Our Analysis of Bausch & Lomb U.S. Rx In-Market Pharmaceutical Growth
Our Analysis of Valeant U.S. Rx In-Market Skin Care Growth
Sustainability of large price increases? |
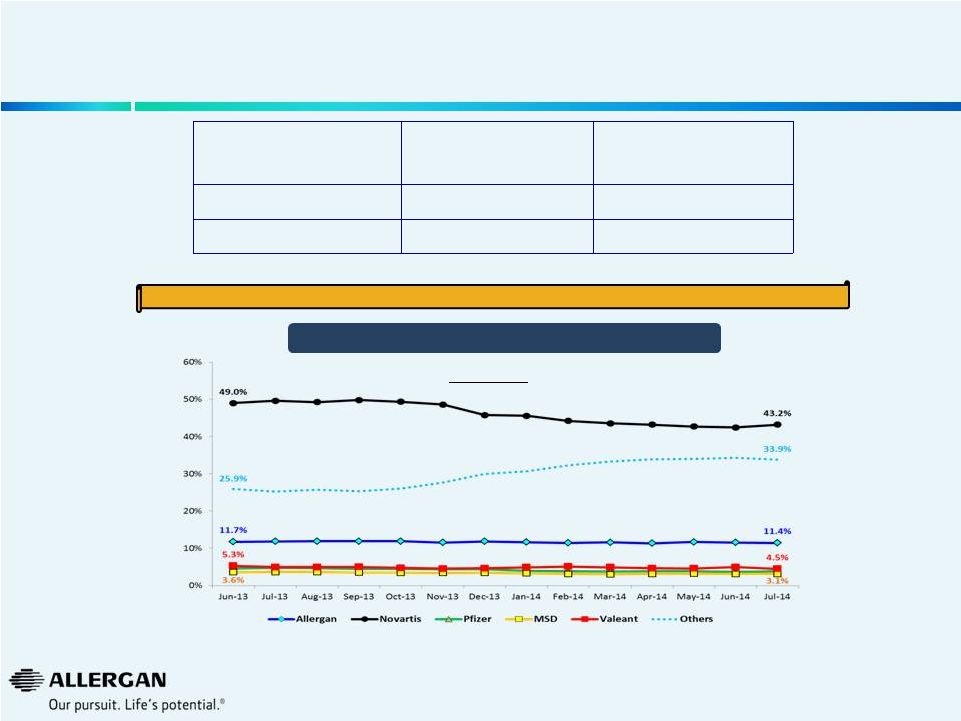 We
Believe B&L in Europe is Struggling Post Valeant Acquisition Rx
Ophthalmics Rx Ophthalmics
YOY Growth
Pre Valeant
Takeover
Post Valeant
Takeover
Europe 28
8.3%
3.3%
Europe 5
8.0%
1.0%
Europe Rx Ophthalmic Market Share
15
Europe 28
We believe Valeant has lost share over the last twelve months in the Rx Ophthalmics
Market Source: IMS, US$ ‘000 @ constant currency,
Ex-Manufacturer Prices Pre Valeant Takeover: MAT growth August 2013 vs.
August 2012 Post Valeant Takeover:: MAT growth August 2014 vs. August
2013 Europe 5: Germany, France, UK, Italy & Spain
Europe 28: Europe 5, Turkey, South Africa, Poland, Greece, Egypt, Saudi Arabia,
Czech Republic, Hungary, Romania, Croatia, Sweden,
Finland,
Norway,
Denmark,
Belgium,
Netherlands,
Austria,
Switzerland
,
Portugal,
Ireland,
Russia,
Slovakia
&
Slovenia |
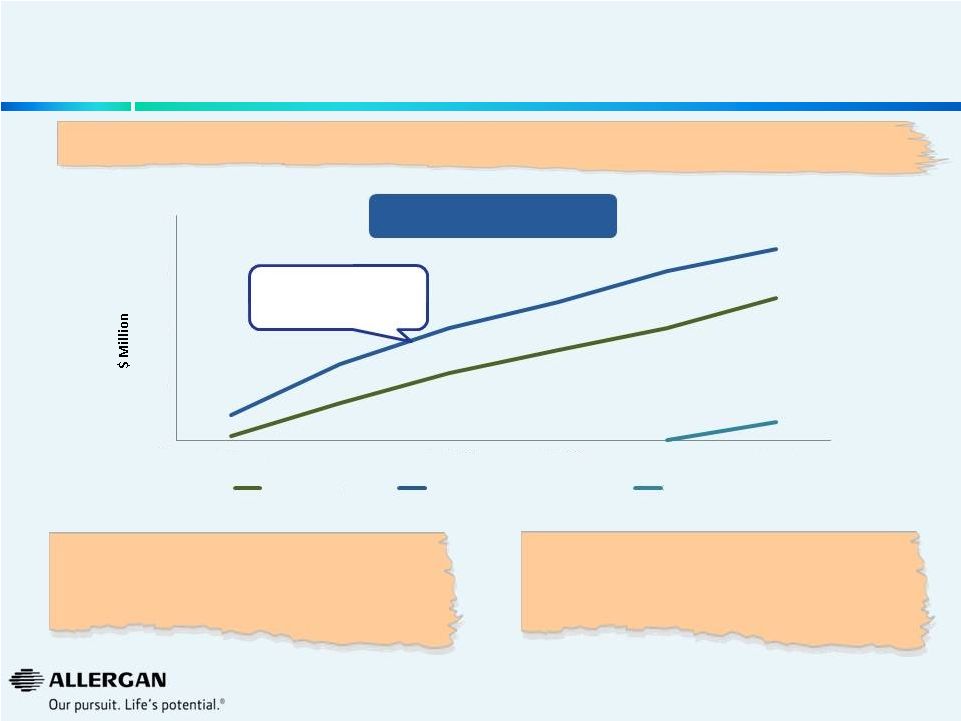
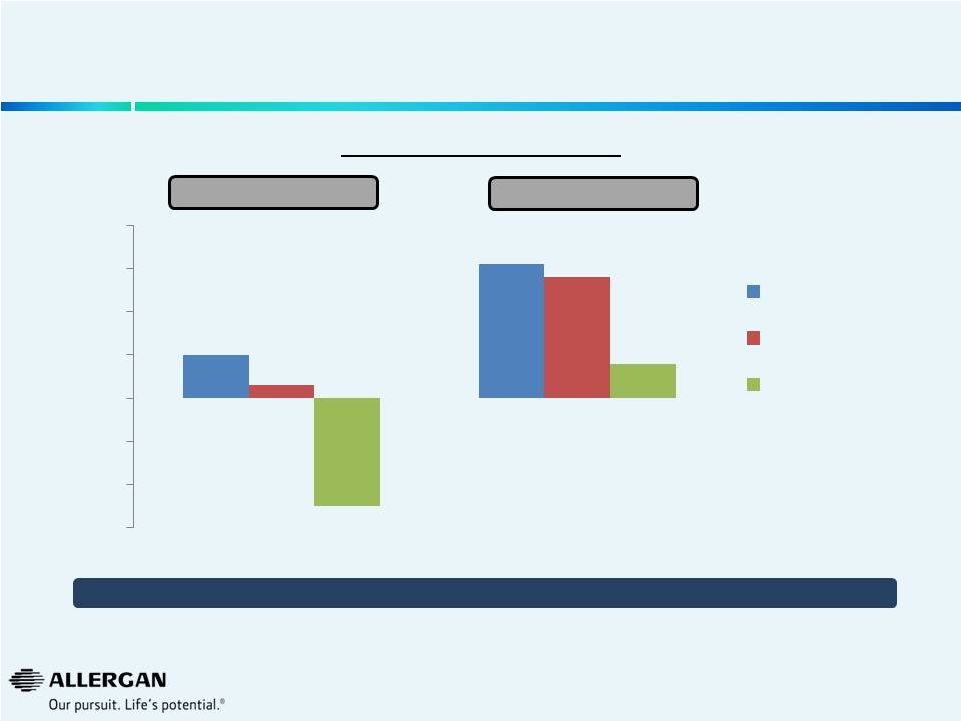 Valeant Europe Sales Weakness
Rx Ophthalmics
Source: IMS, at constant currency, Ex-Manufacturer Prices
We believe Valeant Sales Growth in Europe Rx Ophthalmics Continues to Show Negative
Trends 16
Valeant Europe 5
Valeant Europe 28
Europe 5: Germany, France, UK, Italy & Spain
Europe 28: Europe 5, Turkey, South Africa, Poland, Greece, Egypt, Saudi Arabia,
Czech Republic, Hungary, Romania, Croatia, Sweden,
Finland,
Norway,
Denmark,
Belgium,
Netherlands,
Austria,
Switzerland
,
Portugal,
Ireland,
Russia,
Slovakia
&
Slovenia
1.0%
3.1%
0.3%
2.8%
-2.5%
0.8%
-3.0%
-2.0%
-1.0%
0.0%
1.0%
2.0%
3.0%
4.0%
YOY Growth (July 2014)
MAT
YTD
Last 3 Months |
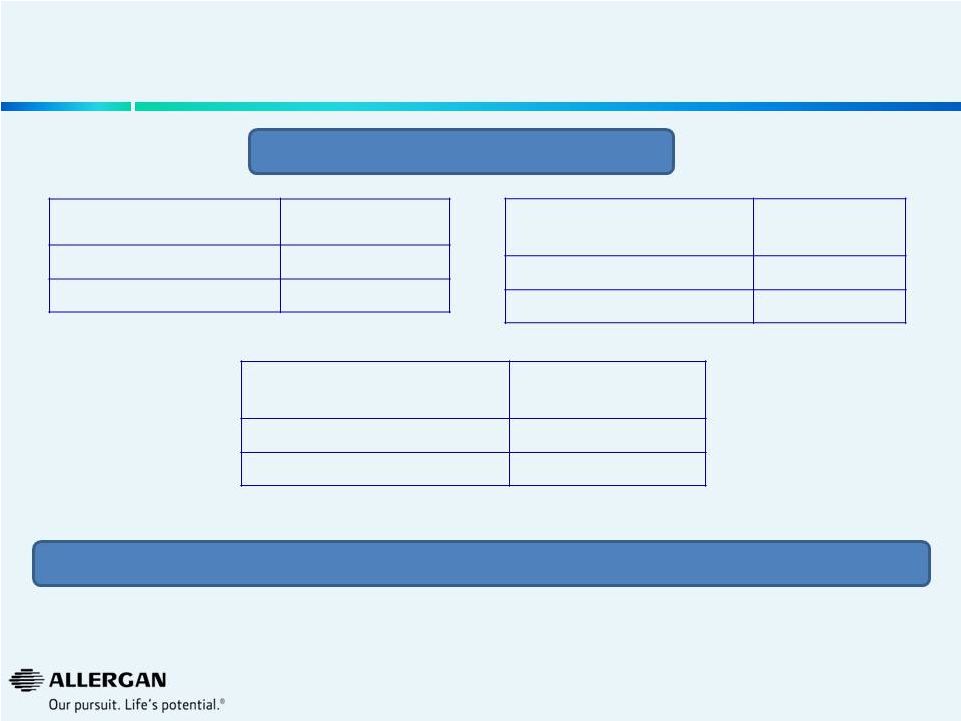 We
Believe Long-Term Performance of B&L Device Businesses Lag Market
Growth Source: Market Scope LLC Quarterly Cataract Report. In-Market
Growth. Back-up information contained in Appendix. U.S. IOL
Procedures Q3’12 to Q2’14
Market Growth
7%
VRX Growth
-2%
U.S. Phacoemulsification
Procedures
Q3’12 to Q2’14
Market Growth
7%
VRX Growth
-8%
U.S. Viscoelastic
Procedures
Q3’12 to Q2’14
Market Growth
-8%
VRX Growth
-22%
We
Believe
Valeant
has
a
weak
market
share
position
(ranks
#3
in
procedural
share)
in
each
of
these
categories
Valeant Acquisition of B&L in August 2013
17 |
 What
is the True Underlying Performance of B&L U.S. Surgical Business in
Q3’14? 18
“U.S.
Ophthalmic
Surgical
business
is
currently
on
a
pace
to
show
approximately
15% growth from the third quarter of 2013 to the upcoming third quarter of
2014. This includes:
•
Greater than 70% growth for the cataract refractive business
•
Greater than 50% growth for Stellaris and Stellaris PC
•
Data showing that the U.S. surgical business is the fastest growing IOL
(intraocular lens) company when comparing first–quarter 2014 results
versus first–quarter 2013 (Data from Market Scope, an ophthalmic market
research firm)
•
In
the
second
quarter,
our
growth
has
more
than
doubled
that
of
the
market
in
procedures”
-
Valeant Voice, September 22, 2014 8K SEC Filing
|
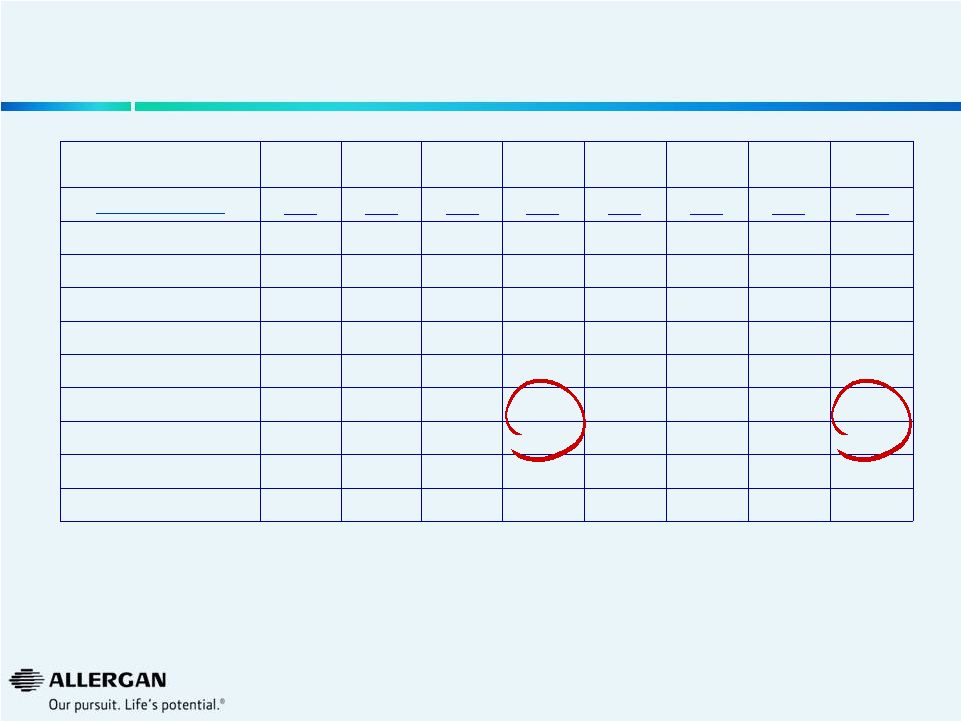 U.S.
IOL Procedure Trends Source: Market Scope LLC Quarterly Cataract
Report Q3-12
Q4-12
Q1-13
Q2-13
Q3-13
Q4-13
Q1-14
Q2-14
Market (000s)
889
951
869
909
916
964
879
954
Alcon
512
548
503
549
547
567
495
555
AMO
205
229
195
207
210
233
209
225
Valeant
113
113
104
100
116
125
128
111
others
60
60
66
54
43
39
47
64
Market Growth
3%
11%
1%
2%
3%
1%
1%
5%
Valeant Growth
-9%
3%
-1%
-19%
3%
10%
24%
11%
Valeant Share
12.7%
11.9%
11.9%
11.0%
12.7%
13.0%
14.6%
11.6%
19 |
 We
Believe Valeant’s Forecasting Approach Raises Questions on Future Growth
Example: Glaucoma
No new products are
tracking to more than
$250MM globally
“We believe mgt's forecasts of $500M in the US and
~$1B globally are very aggressive and we don’t
understand how they get to these forecasts.”
(UBS, 9/26/14)
“I model ~$150M peak sales for this drug in my base
case. For me to raise my estimates on latanoprostene
bunod, I'd like to see clear differentiation vs
prostaglandins.”
(ISI, 9/25/14)
Global Sales (IMS)
Most Recent Glaucoma Launches
“This
product
[latanoprostene
bunod]
has
peak
sales
potential
of
~$500
million+
in
the
U.S.
alone
and
~$1
billion+
globally.”
(Valeant,
9/25/14)
20
Permission to use quotes was neither sought nor received.
(Alcon)
(Alcon)
(Santen)
0
50
100
150
200
MAT Q2/09
MAT Q2/10
MAT Q2/11
MAT Q2/12
MAT Q2/13
MAT Q2/14
AZARGA (2008)
TAFLOTAN/ SAFLUTAN (2008)
SIMBRINZA (2013) |
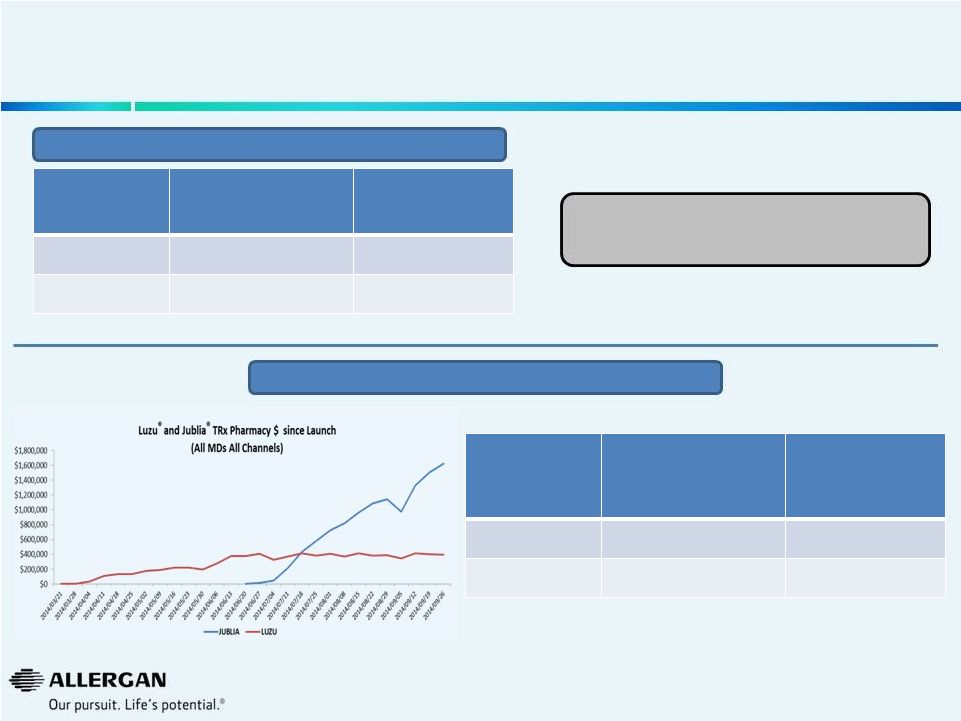 We
Believe Valeant’s Forecasting Approach Raises Questions on Future Growth
Example: Jublia
®
& Luzu
®
Valeant
Evaluate
Pharma
2
Jublia
®
$300 -
$800M
$300M
Luzu
®
$50 -
$75M
$88M
Peak Sales Estimates
All MD’s
All Channels
YTD TRx
Pharmacy $
(Sept. 26, 2104)
Annual Run
Rate
Jublia
®
$11.5M
$34.5M
Luzu
®
$7.9M
$15.8M
1
IMS, excludes sales through alternative fulfillment channels not captured by
IMS. 2
EvaluatePharma Worldwide sales estimates for 2020
3
IMS. 2003.
Prescription Trends
1
21
Prior market leader (Penlac Nail Lacquer)
pre-genericization
peaked
at
~$143M
3 |
 Appendix |
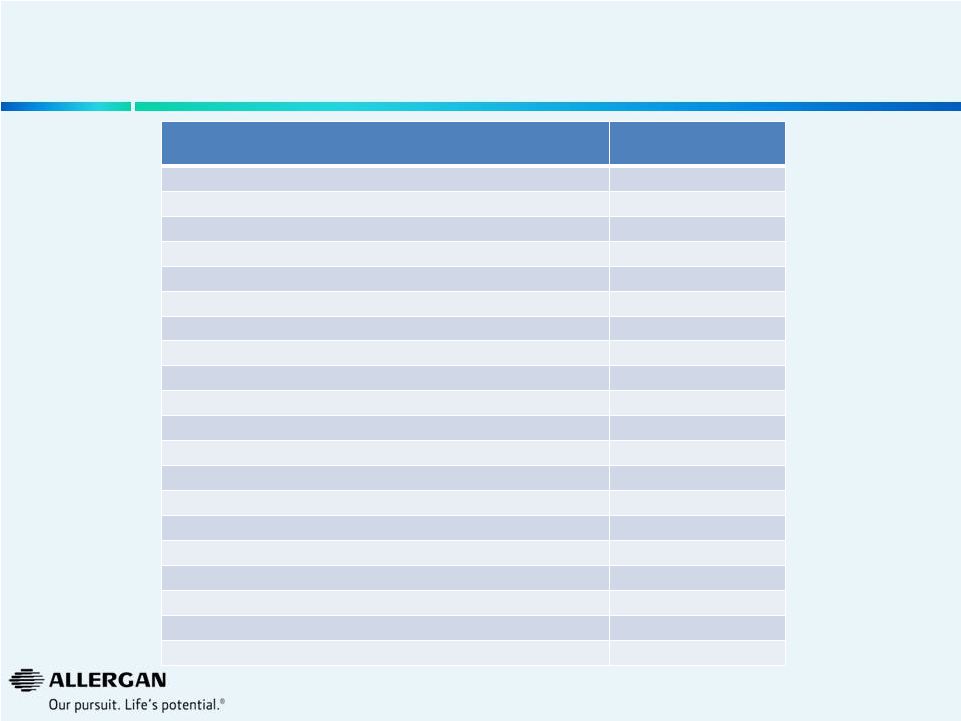 Valeant has Taken Substantial Price Increases Over the Past Year
Product
Price Increases
Oct’13 to Oct’14
Timolol Maleate Ophthalmic Gel Forming Solution 0.25 %
146%
Targretin
142%
Syprine Oral Capsule 250 MG
88%
Wellbutrin XL Oral Tablet Extended Release 24 Hour 150 MG
72%
Arestin Dental Miscellaneous 1 MG
55%
Zovirax
33%
Elidel External Cream 1 %
26%
Istalol Ophthalmic Solution 0.5 %
25%
Lotemax
24%
Zirgan Ophthalmic Gel 0.15 %
17%
Alrex Ophthalmic Suspension 0.2 %
17%
Bepreve Ophthalmic Solution 1.5 %
16%
Zylet Ophthalmic Suspension 0.5-0.3 %
14%
Besivance Ophthalmic Suspension 0.6 %
14%
Xenazine Oral Tablet 12.5 MG
14%
Prolensa Ophthalmic Solution 0.07 %
13%
Solodyn Oral Tablet Extended Release 24 Hour 105 MG
9%
Lacrisert Ophthalmic Insert 5 MG
9%
Acanya External Gel 1.2-2.5 %
9%
Timoptic
6%
Source: Wolters Kluwer Price Rx®
Pro
All products are registered trademarks of Valeant
23 |
 U.S.
Phacoemulsification Procedure Trends Q3-12
Q4-12
Q1-13
Q2-13
Q3-13
Q4-13
Q1-14
Q2-14
Market (000s)
889
951
848
915
912
954
879
954
Alcon
625
670
620
693
683
727
625
707
AMO
136
149
107
118
121
127
121
130
Valeant
128
131
121
104
108
100
133
118
Others
0
1
1
0
0
0
0
0
Valeant Growth
1%
12%
13%
-9%
-16%
-24%
10%
13%
Valeant Share
14.4%
13.8%
14.2%
11.4%
11.9%
10.5%
15.1%
12.3%
Source: Market Scope LLC Quarterly Cataract Report
24 |
 U.S.
Phaco Machine Installed Base Trends Q3-12
Q4-12
Q1-13
Q2-13
Q3-13
Q4-13
Q1-14
Q2-14
Market (000s)
11.5
11.7
11.7
10.3
10.2
10.2
10.6
9.7
Alcon
8.3
8.6
8.7
7.6
7.4
7.2
7.3
6.6
AMO
2.0
1.8
1.8
1.6
1.8
2.0
2.1
1.9
Valeant
1.2
1.3
1.1
1.0
1.0
1.0
1.2
1.3
Others
0.0
0.0
0.0
0.0
0.0
0.0
0.0
0.0
Valeant Growth
-13%
-7%
-25%
-19%
-21%
-17%
7%
21%
Valeant Share
10.8%
10.7%
9.8%
10.0%
9.7%
10.2%
11.5%
12.9%
Source: Market Scope LLC Quarterly Cataract Report
25 |
 U.S.
Viscoelastic Procedure Trends Q3-12
Q4-12
Q1-13
Q2-13
Q3-13
Q4-13
Q1-14
Q2-14
Market (000s)
1,156
1,236
1,118
1,182
1,136
1,229
1,065
1,069
Alcon
800
787
712
792
783
845
718
740
AMO
180
220
192
217
210
233
207
174
Valeant
156
194
173
160
123
128
119
121
Others
20
36
41
13
21
22
21
34
Valeant Growth
2%
27%
7%
-4%
-22%
-34%
-31%
-24%
Valeant Share
13.5%
15.7%
15.5%
13.5%
10.8%
10.5%
11.2%
11.3%
Source: Market Scope LLC Quarterly Cataract Report
26 |
 U.S.
Refractive Laser Procedure Trends Q3-12
Q4-12
Q1-13
Q2-13
Q3-13
Q4-13
Q1-14
Q2-14
Market (000s)
141
141
158
157
137
139
159
155
AMO
80
81
91
85
76
77
87
83
Alcon
55
53
61
64
58
58
68
60
Valeant
5
6
6
6
2
2
1
5
others
1
1
1
1
1
1
3
7
Valeant Growth
2%
79%
39%
47%
-57%
-62%
-86%
-19%
Valeant Share
3.2%
4.3%
3.8%
4.0%
1.4%
1.7%
0.5%
3.2%
Source: Market Scope LLC Quarterly Cataract Report
27 |
 U.S.
Refractive Keratome Procedure Trends Q3-12
Q4-12
Q1-13
Q2-13
Q3-13
Q4-13
Q1-14
Q2-14
Market (000s)
117
120
145
130
119
122
130
126
AMO
63
65
78
68
62
60
70
68
Alcon
15
13
14
13
19
24
11
13
Valeant
6
10
15
15
9
11
11
12
others
32
32
39
34
28
28
38
34
Valeant Growth
-29%
5%
68%
130%
39%
6%
-21%
-20%
Valeant Share
5.4%
8.2%
10.1%
11.2%
7.4%
8.7%
8.8%
9.2%
Source: Market Scope LLC Quarterly Cataract Report
28 |
 U.S.
Vitrectomy Machine Procedure Trends Q3-12
Q4-12
Q1-13
Q2-13
Q3-13
Q4-13
Q1-14
Q2-14
Market (000s)
80
83
82
78
81
80
73
84
Alcon
63
64
61
60
61
61
57
62
Valeant
13
17
14
12
14
13
12
14
others
4
2
7
7
7
6
4
7
Valeant Growth
63%
59%
22%
-3%
7%
-24%
-9%
20%
Valeant Share
16.1%
20.1%
16.6%
14.7%
16.8%
15.8%
16.9%
16.6%
Source: Market Scope LLC Quarterly Cataract Report
29 |
 Important Information
Allergan, its directors and certain of its officers and employees are participants
in solicitations of Allergan stockholders. Information regarding the names
of Allergan's directors and executive officers and their respective
interests in Allergan by security holdings or otherwise is set forth in Allergan's
proxy statement for its 2014 annual meeting of stockholders, filed with the
SEC on March 26, 2014, as supplemented by the proxy information filed with
the SEC on April 22, 2014. Additional information can be found in Allergan's Annual
Report on Form 10-K for the year ended December 31, 2013, filed
with
the
SEC
on
February
25,
2014
and
its
Quarterly
Report
on
Form
10-Q
for
the
quarter
ended
June
30,
2014, filed with the SEC on August 5, 2014. To the extent holdings of
Allergan's securities have changed since the amounts printed in the proxy statement
for the 2014 annual meeting of stockholders, such changes have been
reflected on Initial Statements of Beneficial Ownership on Form 3 or
Statements of Change in Ownership on Form 4 filed with the SEC. These documents are
available free of charge at the
SEC’s
website
at
www.sec.gov.
STOCKHOLDERS
ARE
ENCOURAGED
TO
READ
ANY
ALLERGAN
PROXY
STATEMENT
(INCLUDING
ANY
SUPPLEMENTS THERETO) AND ANY OTHER RELEVANT DOCUMENTS THAT ALLERGAN MAY FILE WITH
THE SEC CAREFULLY AND IN THEIR ENTIRETY BECAUSE THEY WILL CONTAIN IMPORTANT
INFORMATION. Stockholders will be able to obtain, free of charge, copies of
any proxy statement and any other documents filed by Allergan
with
the
SEC
at
the
SEC's
website
at
www.sec.gov.
In
addition,
copies
will
also
be
available
at
no
charge
at
the
Investors
section
of
Allergan's
website
at
www.allergan.com.
30 |
 October 2014
Allergan
An Assessment of Valeant Pharmaceuticals
International, Inc. Performance |