Attached files
| file | filename |
|---|---|
| 8-K - HAMPDEN BANCORP, INC. 8-K - Hampden Bancorp, Inc. | a8-kinvestorpresenation100.htm |

Glenn S. Welch President/Chief Executive Officer October 2014
This material may be deemed to be solicitation material in respect of the solicitation of proxies from Hampden Bancorp, Inc.’s (the “Company”) stockholders in connection with the Company’s 2014 Annual Meeting of Stockholders (the “Annual Meeting”) to be held on November 4, 2014. On September 26, 2014, the Company filed with the Securities and Exchange Commission (the “SEC”) and mailed to its stockholders a definitive proxy statement and form of BLUE proxy card in connection with the Annual Meeting. HAMPDEN BANCORP STOCKHOLDERS ARE STRONGLY ENCOURAGED TO READ THE PROXY STATEMENT (INCLUDING ANY AMENDMENTS AND SUPPLEMENTS) AND ACCOMPANYING BLUE PROXY CARD BECAUSE THEY CONTAIN IMPORTANT INFORMATION. Stockholders may obtain a free copy of the proxy statement, any amendments or supplements to the proxy statement and other documents that the Company files with the SEC at the SEC’s website at www.sec.gov. The proxy statement, any amendments or supplements to the proxy statement, and other documents may also be obtained from the Company’s website at www.hampdenbank.com or upon request addressed to Hampden Bancorp, Inc., Attn: Tara Corthell, 19 Harrison Avenue, Springfield, MA 01103. 2 IMPORTANT STOCKHOLDER INFORMATION The Company, its directors and its executive officers are deemed to be participants in the solicitation of the Company’s stockholders in connection with the Annual Meeting. Information regarding the Company’s directors and executive officers, including a description of their affiliations and interests by security holdings, is contained in the proxy statement and other materials filed with the SEC.

Certain statements contained herein constitute “forward-looking statements” within the meaning of the Private Securities Litigation Reform Act of 1995. These statements are based on the beliefs and expectations of management, as well as the assumptions made using information currently available to management. Because these statements reflect the views of management concerning future events, these statements involve risks, uncertainties and assumptions. As a result, actual results may differ from those contemplated by these statements. Forward-looking statements can be identified by words such as “believe”, “expect”, “anticipate”, “estimate”, and “intend”. Risks and uncertainties include, but are not limited to, increased competitive pressure among financial service companies; continued weakness or further deterioration in national and regional economic conditions; changes in interest rates; changes in consumer spending, borrowing and savings habits; legislative and regulatory changes; adverse changes in the securities markets; the soundness of other financial institutions; and changes in relevant accounting principles and guidelines. Additionally, other risks and uncertainties are described in Hampden Bancorp, Inc.’s Annual Report on Form 10-K filed with the Securities and Exchange Commission (the “SEC”), as updated by subsequent filings, which are available at www.sec.gov. These risks and uncertainties should be considered in evaluating forward-looking statements and undue reliance should not be placed on such statements. You are cautioned not to place undue reliance on these forward-looking statements, which speak only as of the date that they are made. The company disclaims any intent or obligation to update any forward-looking statements, whether in response to new information, future events or otherwise. 3 FORWARD LOOKING STATEMENTS
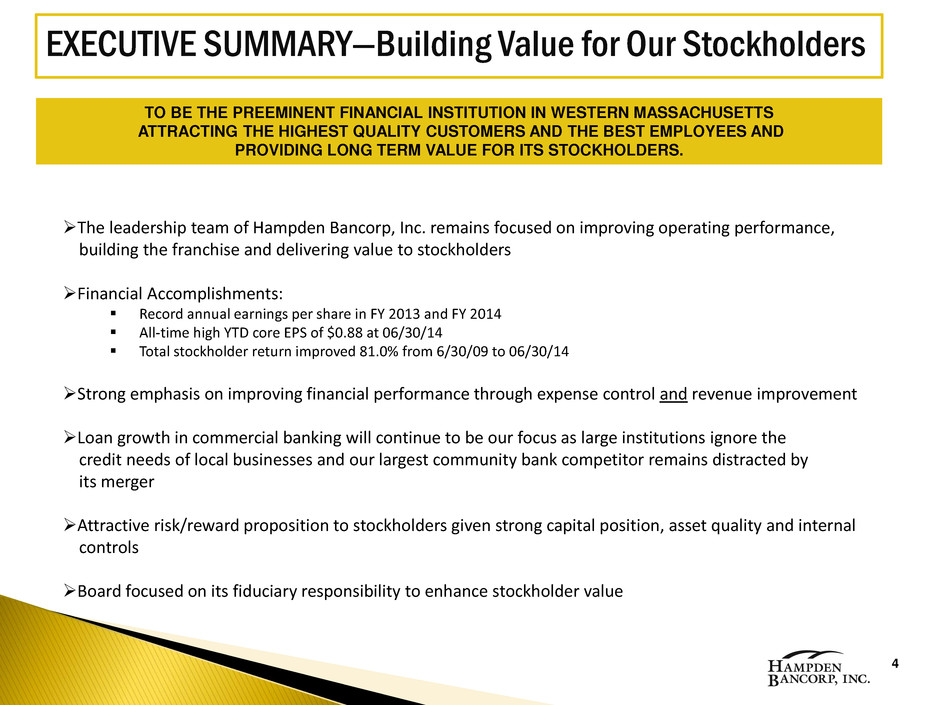
The leadership team of Hampden Bancorp, Inc. remains focused on improving operating performance, building the franchise and delivering value to stockholders Financial Accomplishments: Record annual earnings per share in FY 2013 and FY 2014 All-time high YTD core EPS of $0.88 at 06/30/14 Total stockholder return improved 81.0% from 6/30/09 to 06/30/14 Strong emphasis on improving financial performance through expense control and revenue improvement Loan growth in commercial banking will continue to be our focus as large institutions ignore the credit needs of local businesses and our largest community bank competitor remains distracted by its merger Attractive risk/reward proposition to stockholders given strong capital position, asset quality and internal controls Board focused on its fiduciary responsibility to enhance stockholder value 4 EXECUTIVE SUMMARY—Building Value for Our Stockholders TO BE THE PREEMINENT FINANCIAL INSTITUTION IN WESTERN MASSACHUSETTS ATTRACTING THE HIGHEST QUALITY CUSTOMERS AND THE BEST EMPLOYEES AND PROVIDING LONG TERM VALUE FOR ITS STOCKHOLDERS.

FISCAL YEAR ENDED JUNE 30, 2014 FISCAL YEAR ENDED JUNE 30, 2013 Record YTD profitability and earnings per share(1) - Core diluted EPS of $0.88 - Core net income of $4.8 million Record earnings per share - Diluted EPS of $0.54 Strong balance sheet growth - Commercial loan growth of 25.6% - Overall loan growth of 12.7% - Total average deposit growth of 7.2% Strong balance sheet growth - Commercial loan growth of 21.6% - Overall loan growth of 10.8% - Total average deposit growth of 9.2% Capital management - Equity/Assets = 12.4% - 20% quarterly dividend per share increase in FY 2014 to $0.06 per share and an annualized payout ratio of 30% as of 06/30/14. - Dividend increased to $0.08 per share as of August 5, 2014. - Since going public in 2007, investors have received a total of $1.31 in dividends on a per share basis (as of August 2014). Capital management - Equity/Assets = 12.8% - Dividend payout ratio = 34.3% FY 2014 performance ratios - Core ROAA = 0.69% - Core ROAE = 5.61% - NIM = 3.10% - Core Efficiency ratio = 66.56% FY 2013 performance ratios - Management restructure costs in June 2013 of $310,000, or $0.03 per fully diluted share - ROAA = 0.46% - ROAE = 3.41% - NIM = 3.14% - Efficiency ratio = 76.48% Risk management/Asset quality - Non-performing loans/Loans = 1.01% - Non-performing assets/Total assets = 0.78% - Allowance for loan losses/Total loans = 1.11% - Allowance for loan losses/Non-performing loans = 109.11% 1 Core net income is defined as net income excluding non-recurring contested stockholder meeting costs on a tax effected basis. Please see the appendix to this document for a reconciliation of non-GAAP financial measures to GAAP financial measures. Risk management/Asset quality - Non-performing loans/Loans = 0.88% - Non-performing assets/Total assets = 0.80% - Allowance for loan losses/Total loans = 1.20% - Allowance for loan losses/Non-performing loans = 136.06% 5 FINANCIAL HIGHLIGHTS
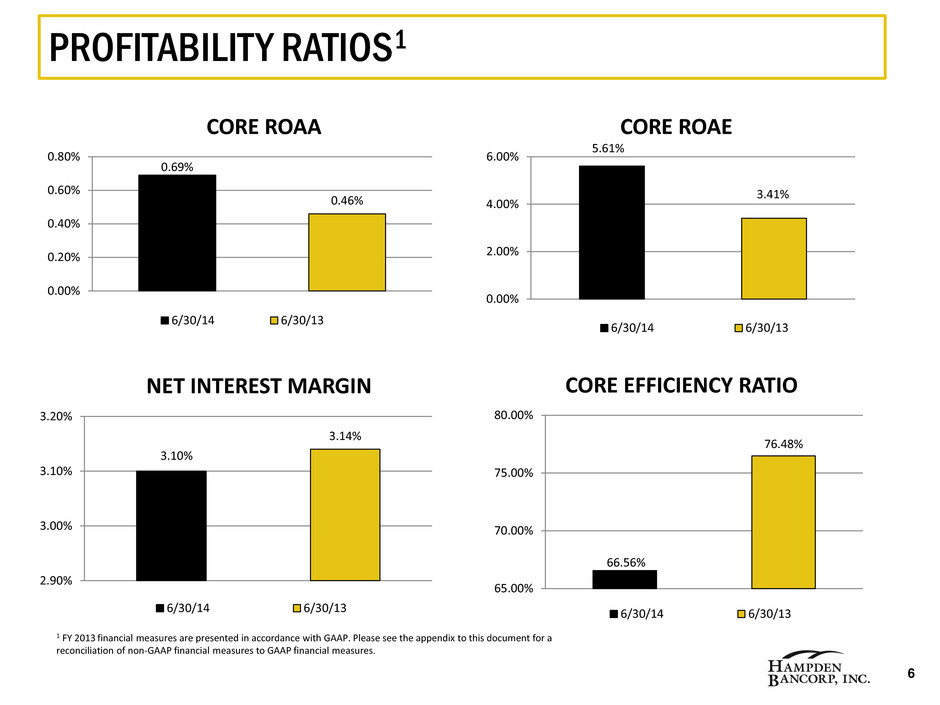
1 FY 2013 financial measures are presented in accordance with GAAP. Please see the appendix to this document for a reconciliation of non-GAAP financial measures to GAAP financial measures. 6 PROFITABILITY RATIOS1 0.69% 0.46% 0.00% 0.20% 0.40% 0.60% 0.80% CORE ROAA 6/30/14 6/30/13 5.61% 3.41% 0.00% 2.00% 4.00% 6.00% CORE ROAE 6/30/14 6/30/13 3.10% 3.14% 2.90% 3.00% 3.10% 3.20% NET INTEREST MARGIN 6/30/14 6/30/13 66.56% 76.48% 65.00% 70.00% 75.00% 80.00% CORE EFFICIENCY RATIO 6/30/14 6/30/13
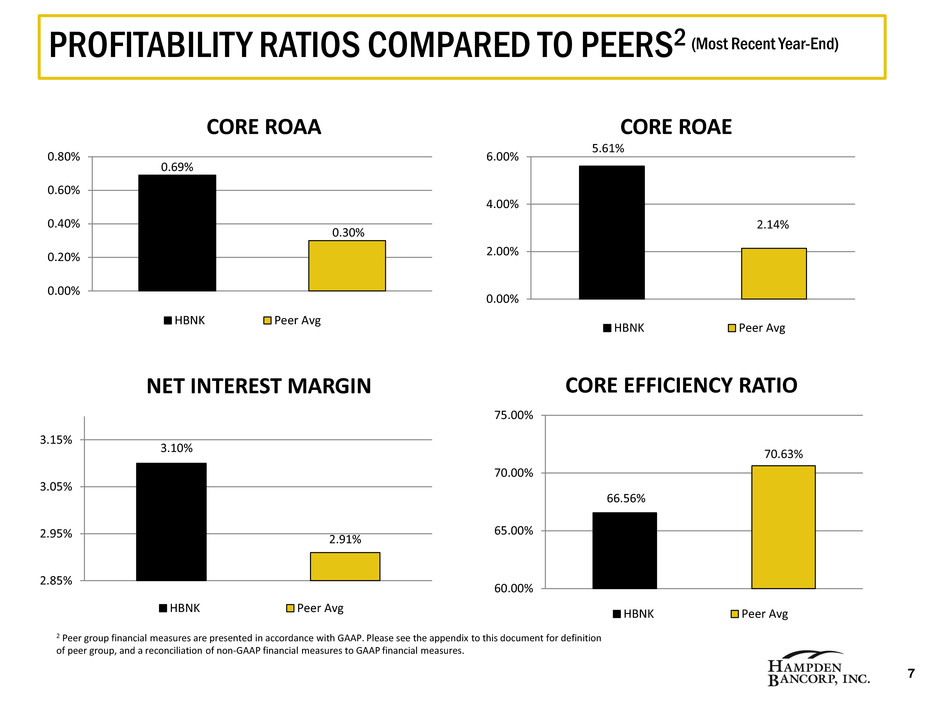
2 Peer group financial measures are presented in accordance with GAAP. Please see the appendix to this document for definition of peer group, and a reconciliation of non-GAAP financial measures to GAAP financial measures. 7 PROFITABILITY RATIOS COMPARED TO PEERS2 (Most Recent Year-End) 0.69% 0.30% 0.00% 0.20% 0.40% 0.60% 0.80% CORE ROAA HBNK Peer Avg 5.61% 2.14% 0.00% 2.00% 4.00% 6.00% CORE ROAE HBNK Peer Avg 3.10% 2.91% 2.85% 2.95% 3.05% 3.15% NET INTEREST MARGIN HBNK Peer Avg 66.56% 70.63% 60.00% 65.00% 70.00% 75.00% CORE EFFICIENCY RATIO HBNK Peer Avg

2 Please see the appendix to this document for definition of peer group. All ratios have been obtained from SNL Financial. 8 ASSET QUALITY RATIOS COMPARED TO PEERS2 (Most Recent Year-End) 0.06% 0.27% 0.00% 0.10% 0.20% 0.30% NET CHARGE-OFFS/AVERAGE LOANS HBNK Peer Avg 0.78% 0.89% 0.70% 0.75% 0.80% 0.85% 0.90% 0.95% NON-ACCRUAL + OREO/TOTAL ASSETS HBNK Peer Avg 1.01% 1.03% 0.95% 1.00% 1.05% NON-ACCRUAL LOANS/LOANS HBNK Peer Avg 1.10% 1.10% 1.00% 1.10% 1.20% 1.30% LOAN LOSS RESERVES/GROSS LOANS HBNK Peer Avg
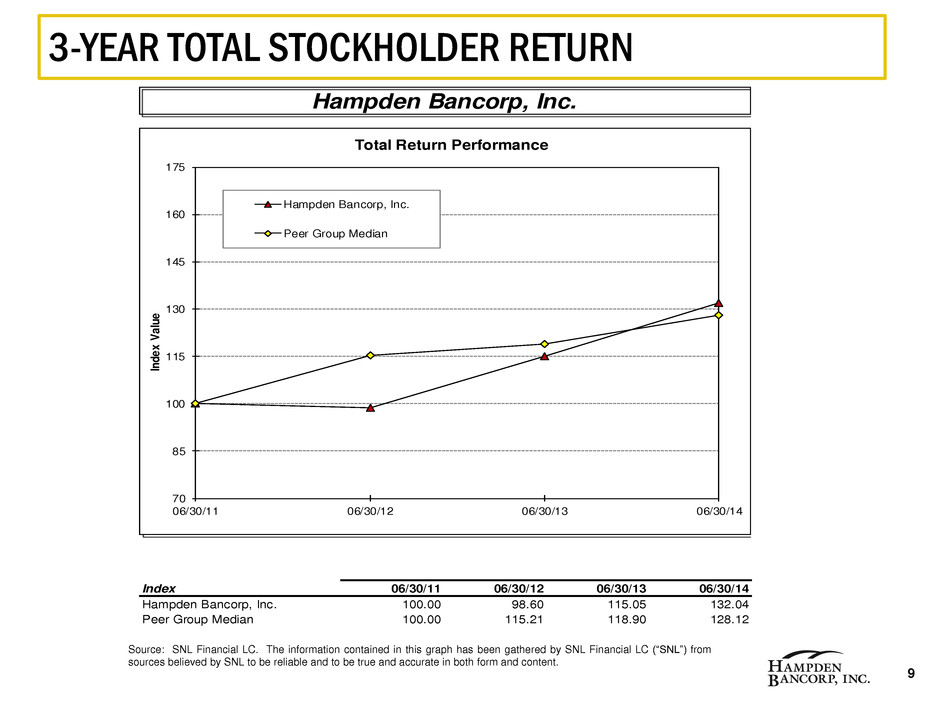
9 3-YEAR TOTAL STOCKHOLDER RETURN Hampden Bancorp, Inc. Index 06/30/11 06/30/12 06/30/13 06/30/14 Hampden Bancorp, Inc. 100.00 98.60 115.05 132.04 Peer Group Median 100.00 115.21 118.90 128.12 70 85 100 115 130 145 160 175 06/30/11 06/30/12 06/30/13 06/30/14 In d e x V a lu e Total Return Performance Hampden Bancorp, Inc. Peer Group Median Source: SNL Financial LC. The information contained in this graph has been gathered by SNL Financial LC (“SNL”) from sources believed by SNL to be reliable and to be true and accurate in both form and content.

Advising the Board of Directors on various strategies to create or enhance stockholder value Provided advice and guidance on capital management strategies Provided an assessment of the current banking M&A environment, and the valuation of public financial institutions in Massachusetts and New England Your Board has explored and will continue to explore all alternatives to enhance stockholder value 10 LISTENING TO STOCKHOLDERS ENGAGED STERNE AGEE IN NOVEMBER 2013

Hampden Bancorp, Inc. – NASDAQ: HBNK Hampden Bank – wholly owned subsidiary Headquarters located in Springfield, MA, with branches in surrounding suburbs 10 branch offices; average branch size $49 million as of June 30, 2014 Strategic plan in place to increase market share of each branch Strong credit culture throughout the organization 11 FRANCHISE OVERVIEW – WHO WE ARE

Initiatives Accomplishments TARGET LARGE COMMERCIAL COMPETITORS IN OUR MARKET • For the fiscal year ended 6/30/14, the Bank originated $103 million in new loans, of which $74 million (71%) was from new borrowers • $8.8 million (9% of new loans) were generated through loan participations with area banks • As of 6/30/14, the commercial loan pipeline was strong at over $85 million DRIVE RESIDENTIAL MORTGAGE AND CONSUMER LENDING GROWTH • Historical three-year average loan production of $64 million • Mortgage originators averaging $12.5 million per year • Branch originated referrals average 31% of production volume CONTINUED EMPHASIS ON RETAIL BANKING • Five-year growth in core deposits • Five-year reduction in time deposits • Proven strategy to attract deposits from municipalities and non-profits DELIVERED SIGNIFICANT EXPENSE SAVINGS • Reviewed/reviewing vendor contracts, branch hours, and employee cost-saving suggestions • Reduction in FTEs and costs related to 2008 Equity Incentive Plan; decrease of approximately $827,000 in salary and employee benefits expense for the year ended June 30, 2014 compared to the prior fiscal year • Core efficiency ratio improved to 66.56% at June 30, 2014 from 83.95% at June 30, 2008 12 STRATEGIC INITIATIVES/ACCOMPLISHMENTS
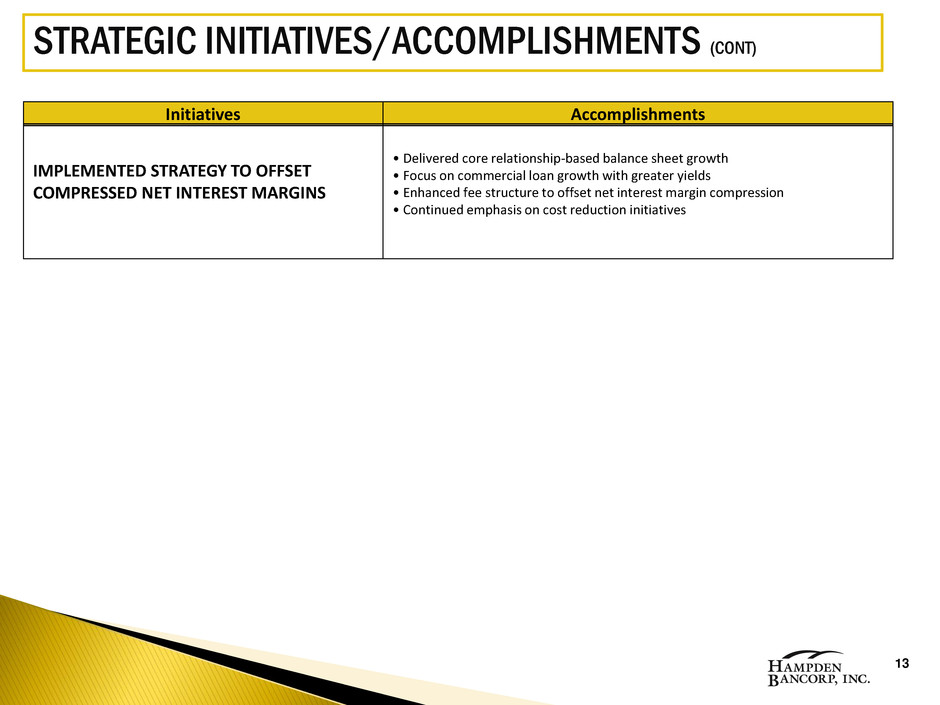
Initiatives Accomplishments IMPLEMENTED STRATEGY TO OFFSET COMPRESSED NET INTEREST MARGINS • Delivered core relationship-based balance sheet growth • Focus on commercial loan growth with greater yields • Enhanced fee structure to offset net interest margin compression • Continued emphasis on cost reduction initiatives 13 STRATEGIC INITIATIVES/ACCOMPLISHMENTS (CONT)

STRONG COMMERCIAL LOAN GROWTH (In thousands) • Commercial loans as a percentage of the total portfolio have increased to 57.1% at 6/30/14 from 43.4% at 6/30/2008 14 156 ,71 7 181 ,98 3 191 ,01 5 188 ,76 4 190 ,93 6 232 ,18 4 291 ,69 5 0 50,000 100,000 150,000 200,000 250,000 300,000 350,000 6/30/08 6/30/09 6/30/10 6/30/11 6/30/12 6/30/13 06/30/14

LOAN MIX 15 3 3 .7 5 % 3 2 .5 8 % 1 6 .0 1 % 1 .3 1 % 1 .8 2 % 9 .0 0 % 3 .5 2 % 2 .0 1 % 2 1 .0 5 % 3 9 .3 1 % 1 4 .9 1 % 0 .7 5 % 7 .0 9 % 1 0 .7 2 % 4 .2 6 % 1 .9 1 % 0.00% 5.00% 10.00% 15.00% 20.00% 25.00% 30.00% 35.00% 40.00% 1-4 Family Residential Comm'l RE Home Equity Residential Construction Comm'l Construction Comm'l C&I Manufactured Homes Other LOAN PRODUCT MIX AS A PERCENT OF PORTFOLIO 6/30/2008 6/30/2014
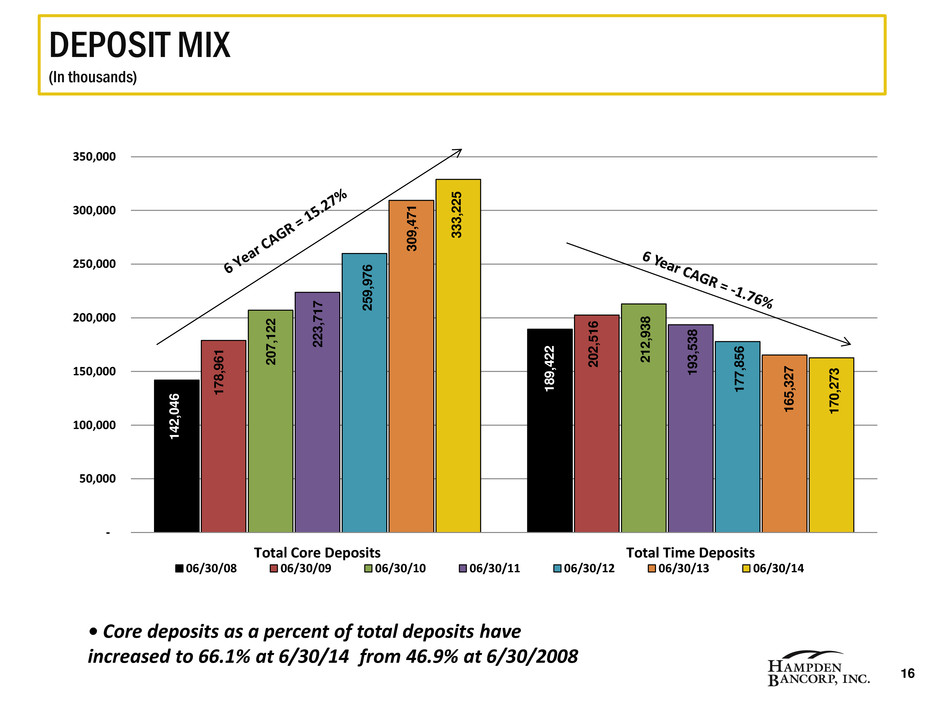
DEPOSIT MIX (In thousands) • Core deposits as a percent of total deposits have increased to 66.1% at 6/30/14 from 46.9% at 6/30/2008 16 1 7 8 ,9 6 1 2 0 2 ,5 1 6 2 0 7 ,1 2 2 2 1 2 ,9 3 8 2 2 3 ,7 1 7 1 9 3 ,5 3 8 2 5 9 ,9 7 6 1 7 7 ,8 5 6 3 0 9 ,4 7 1 1 6 5 ,3 2 7 - 50,000 100,000 150,000 200,000 250,000 300,000 350,000 Total Core Deposits Total Time Deposits 06/30/08 06/30/09 06/30/10 06/30/11 06/30/12 06/30/13 06/30/14 1 4 2 ,0 4 6 3 3 3 ,2 2 5 1 8 9 ,4 2 2 1 7 0 ,2 7 3
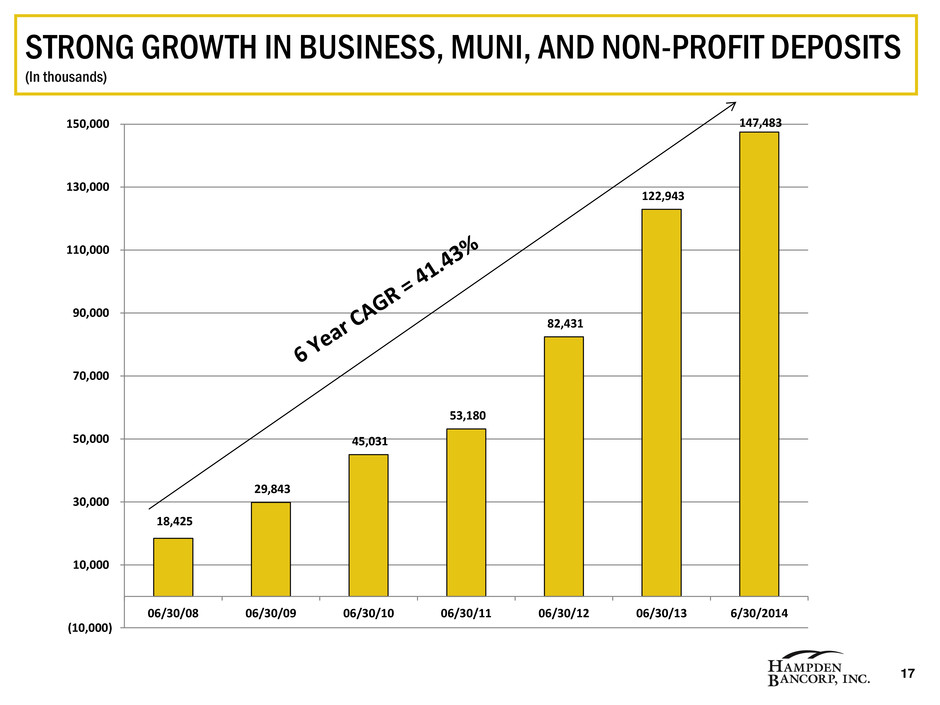
STRONG GROWTH IN BUSINESS, MUNI, AND NON-PROFIT DEPOSITS (In thousands) 17 18,425 29,843 45,031 53,180 82,431 122,943 147,483 (10,000) 10,000 30,000 50,000 70,000 90,000 110,000 130,000 150,000 06/30/08 06/30/09 06/30/10 06/30/11 06/30/12 06/30/13 6/30/2014

18 COMMON STOCK REPURCHASE PLANS 5% Stock Repurchase Plan Approval Date Completion Date No. of Shares Approved No. of Shares Purchased Average Price per Share Initial Plan May 29, 2008 December 15, 2008 397,493 397,493 10.03$ Second Plan January 27, 2009 February 18, 2010 377,619 377,619 10.70$ Third Plan June 2, 2010 August 29, 2011 357,573 357,573 10.31$ Fourth Plan December 22, 2010 November 7, 2011 339,170 339,170 13.01$ Fifth Plan November 1, 2011 December 21, 2011 321,255 321,255 11.81$ Sixth Plan February 7, 2012 December 12, 2012 304,280 304,280 13.16$ Seventh Plan August 7, 2012 September 10, 2014 289,106 289,106 15.75$ Eighth Plan June 4, 2013 - 275,525 38,961 17.05$ The following table summarizes the Company’s stock repurchases as of October 2, 2014:

Strategically positioned franchise Energized management team committed to strong operating performance Scalable platform built for long-term growth Successfully executing Strategic Plan Disciplined capital management Focused on delivering value for our stockholders 19 WHY INVEST IN US

20 APPENDIX HBNK’s peer group, as utilized by ISS in its analysis of the company’s FY 2013 performance, is defined as follows: Company Name Ticker Chicopee Bancorp Inc. CBNK Naugatuck Valley Financial NVSL Westfield Financial Inc. WFD SI Financial Group Inc. SIFI New Hampshire Thrift Bancshares NHTB BSB Bancorp Inc. BLMT Wellesley Bancorp WEBK Hingham Institute for Savings HIFS Peoples Federal Bancshares Inc. PEOP

21 APPENDIX NON-U.S. GAAP FINANCIAL MEASURES This document contains certain non-U.S. GAAP financial measures in addition to results presented in accordance with U.S. GAAP. A non-GAAP financial measure is one that includes or excludes amounts that would be presented in the most directly comparable measure calculated in accordance with U.S. GAAP. These non-U.S. GAAP measures provide supplemental perspectives on operating results, performance trends, and financial condition. Non-U.S. GAAP financial measures may have limitations as analytical tools. They are not a substitute for U.S. GAAP measures; they should be read and used in conjunction with our U.S. GAAP financial information. Further, these measures may differ from the non-GAAP information, even where similarly titled, used by other companies and therefore should not be used to compare our performance to that of other companies. A reconciliation of non-U.S. GAAP financial measures to U.S. GAAP measures is included in the accompanying financial tables. In all cases, it should be understood that non-U.S. GAAP per share measures do not depict amounts that accrue directly to the benefit of stockholders. We utilize the non-U.S. GAAP measure of core net income in evaluating operating trends, including components for core revenue and expense. We define core net income as net income excluding non-recurring income and expense. This measure excludes amounts that we view as unrelated to our normalized operations, including contested stockholder meeting costs on a tax effected basis. Similarly, the efficiency ratio, return on average assets, return on average equity, basic earnings per share and fully diluted earnings per share are presented on a net income and core net income basis due to the importance of these measures to the investment community.

22 APPENDIX For The Year Ended June 30, 2014 Reconciliation of Non-U.S. GAAP Financial Measures: (In thousands, except share data) Net income 4,515$ Plus: Non-recurring contested stockholder meeting expenses (1) 262 Total core net income 4,777$ Total non-interest expense 16,371$ Less: Non-recurring contested stockholder meeting expenses (410) Core non-interest expense 15,961$ Total average assets 694,888$ Total average equity 85,207$ Basic weighted average shares outstanding 5,304,151 Diluted weighted average shares outstanding 5,435,761 Core return (annualized) on average assets 0.69% Core return (annualized) on average equity 5.61% Core efficiency ratio (2) 66.56% Core basic earnings per share 0.90$ Core diluted earnings per share 0.88$ (2) The core efficiency ratio represents core non-interest expense for the period divided by the sum of net interest income (before the loan loss provision) plus non-interest income. (1) Non-recurring contested stockholder proxy expenses are tax effected using an effective tax rate of 36%.
