Attached files
| file | filename |
|---|---|
| 8-K - 8-K - SPARTON CORP | d802677d8k.htm |
 Investor
Day October 8, 2014
Exhibit 99.1 |
 Welcome
Mike Osborne
Senior
Vice
President
–
Corporate
Development |
 Safe Harbor
Statement 3
Certain statements herein constitute forward-looking statements within the meaning of the
Securities Act of 1933, as amended and the Securities
Exchange
Act
of
1934,
as
amended.
When
used
herein,
words
such
as
“believe,”
“expect,”
“anticipate,”
“project,”
“plan,”
“estimate,”
“will”
or “intend”
and similar words or expressions as they relate to the Company or its management constitute
forward- looking statements. These forward-looking statements reflect our
current views with respect to future events and are based on currently available
financial, economic and competitive data and our current business plans. The Company is under no obligation to, and expressly
disclaims any obligation to, update or alter its forward-looking statements whether as a
result of such changes, new information, subsequent events or otherwise. Actual results
could vary materially depending on risks and uncertainties that may affect our
operations,
markets,
prices
and
other
factors.
Important
factors
that
could
cause
actual
results
to
differ
materially
from
those
forward-
looking statements include those contained under the heading of risk factors and in the
management’s discussion and analysis contained from time-to-time in the
Company’s filings with the Securities and Exchange Commission. Adjusted EBITDA and
related reconciliation presented here represents earnings before interest, taxes, depreciation and amortization as
adjusted for restructuring/impairment charges, gross profit effects of capitalized profit in
inventory from acquisition and acquisition contingency settlement, and gain on sale of
investment. The Company believes Adjusted EBITDA is commonly used by financial analysts
and
others
in
the
industries
in
which
the
Company
operates
and,
thus,
provides
useful
information
to
investors.
The
Company
does
not
intend, nor should the reader consider, Adjusted EBITDA an alternative to net income, net cash
provided by operating activities or any other items calculated in accordance with GAAP.
The Company's definition of Adjusted EBITDA may not be comparable with Adjusted EBITDA
as defined by other companies. Accordingly, the measurement has limitations depending on its use. |
 Agenda
4
11:00 am
Welcome
Business Overview
Performance Highlights
2020 Vision
Strategies & Imperatives
Closing Remarks
12:30 pm
Q&A Session
1:00 pm
Lunch / Transportation to Facility
2:00 pm
Facility Tour
4:00 pm
Transportation from Facility
6:00 pm
Cocktail Reception & Dinner |
 Presenters
Cary Wood
President and CEO
5
Don Pearson
Chief Financial Officer
Mike Osborne
Senior Vice President, Corporate Development |
 Business
Overview Cary Wood
President & CEO |
 Key
Messages 7
Established,
Longstanding
Customer
Relationships
Attractive Platform
for Growth
Proven &
Experienced
Management Team
Diversified
Revenue
Mix
Strong Free Cash
Flow Generation &
Financial Condition
Highly Skilled &
Industry Leading
Manufacturing
Capabilities |
 The Simple Choice
for Complex Needs Sparton is the simple choice for complex, contract design &
manufacturing needs 8
$336 million
Fiscal 2014
Revenue
9 + 4
Manufacturing &
Design Facilities
1500+
Employees
Worldwide
1900 A.D.
Founded in
Michigan
Total focus on our customers’
vision
Service for every step of a product’s lifecycle, from design and manufacturing
to logistics and service
Decades of experience
Our unique expertise and capabilities make Sparton a premier partner for the
contract design and manufacture of low-to-medium volume highly complex
electromechanical devices |
 Investment
Considerations 9
Continued EPS
Growth
Established & Growing
Business
Expanded
EBITDA Margins
Solid
Balance Sheet
Repositioned the
Company for Growth
114 year old business with market leadership in defense and medical sectors;
27% sales increase in fiscal 2014; 52% year-over-year adjusted EBITDA increase
in fiscal 2014
As of June 30, 2014, Debt-to-EBITDA coverage of 1.2x with $8 million of cash and $41
million borrowed, $59 million unused on the line of credit. On September 11,
2014, the line of credit was increased to $200 million with a $100 million accordion
feature. Fiscal 2014:
9.9%
Fiscal 2011:
7.4%
Fiscal 2013:
8.1%
Fiscal 2010:
4.5%
Fiscal 2012:
7.6%
Fiscal 2009:
-4.5%
Fiscal 2014:
$ 1.58
Fiscal 2011:
$ (0.64)
Fiscal 2013:
$ 1.17
Fiscal 2010:
$ (0.40)
Fiscal 2012:
$ 0.91
Fiscal 2009:
$ (1.61)
FY11
FY12
FY13
FY14
New Programs
26
40
71
89
New Customers
11
20
12
26
Potential Annualized Revenue
$17.7
$23.8
$39.4
$38.8 |
 Sparton is in
one single line of business called Electromechanical Devices Sparton
is
currently
segmented
into
three
financial
reporting
business
units
Current Business Model
10
Sparton
currently
serves
three
electronics
markets
Military & Aerospace
Medical
Industrial & Instrumentation
Commonly referred to within legacy Sparton as EMS, but
currently consists of circuit card assembly and box build
(contract manufacturing and assembly) outside of the
medical and defense markets
Complex Systems
Medical Device
Contract Design, Manufacturing, and Assembly
Defense & Security
Design and Manufacturing (both as a contractor and OEM) |
 Defense &
Security Systems (DSS) •
Develop, design, and manufacture security products,
primarily anti-submarine warfare detection devices for the
U.S. and other free-world governments
•
Develop and manufacture ruggedized flat-panel monitors
and systems
•
Commercially develop spin-off technology for existing and
alternate markets (Navigation & Exploration)
•
FY2014 Sales: $109 million, consistently profitable business
•
Visible Backlog: $32 million as of 6/30/14
•
Key Customers:
Sonobuoys
Navigation
Sensors
Ruggedized Flat
Panel Displays
11 |
 DSS Market
Outlook 12
•
Anti-Submarine Warfare budget line item < $250 mil
•
Budget is a small fraction of the cost of a single ship
•
Continued military actions by North Korea & China should
impact the use of sonobuoys in that region
•
Increased territorial disputes in the Pacific Rim and tensions
in the Middle East continue to drive strong demand from our
foreign customers
•
U.S. Navy plans to buy 117 P-8A aircraft to replace existing
P-3 fleet: operational capability started 2014
•
Indian navy signed a contract for eight P-8I aircraft in
January 2009; full delivery expected by the end of 2015
Limited risk of a negative impact of sonobuoy sales to the
U.S. Navy if sequestration occurs
Foreign sales are still somewhat unpredictable
The Boeing P-8 Poseidon aircraft to become the new
launch vehicle for sonobuoys
Won new 5-year Indefinite Delivery Indefinite Quantity
(ID/IQ) contract in July 2014 valued at $810 million; year 1
total spend to be $166 million
•
ERAPSCO joint venture will split revenue 50/50 over the
course of the contract
•
Year 1 split: $91 million to Sparton, $75 million to USSI
$53.7
$40.9
$42.3
$49.3
$53.0
$91.0
0
20
40
60
80
100
120
140
160
180
200
GFY 2008
GFY 2009
GFY 2010
GFY 2011
GFY 2012
GFY 2013
GFY 2014
GFY
2015E
GFY
2016E
GFY
2017E
GFY
2018E
GFY
2019E
GFY
2020E
DoD Estimated ASW Budgets / SPA Historical Spend
Source: Navy Budget (Actual/Estimate)
Navy Spend on Buoys (Actual)
Navy Spend on Buoys (Estimate)
Sparton Awards (Actual)
$5
$6
$10
$11
$11
$8
$10
$11
$11
$12
$12
$13
$13
$-
$2
$4
$6
$8
$10
$12
$14
$16
0
20
40
60
80
100
120
140
FY2008
FY2009
FY2010
FY2011
FY2012
FY2013
FY2014
FY2015E
FY2016E
FY2017E
FY2018E
FY2019E
FY2020E
DSS Engineering Activity
Engineers (FTE)
Engineering
Project
Spend
-
Gov't
&
IR&D
($in
mil)
$31.1 |
 Medical
Device •
Design and manufacture medical devices and instruments
for the In Vitro Diagnostics and Therapeutics Device markets
•
Work with OEMs and biomedical companies to interface
their core technology into a complex medical laboratory
instrument or point of care device
•
Manufacturer
of
The
NeuroStar®
TMS
Therapy
System,
the
first and only Transcranial Magnetic Stimulation (TMS)
device cleared by the FDA for the treatment of depression
•
Recurring revenue due to highly regulated medical industry
•
FY2014 Sales: $163 million of consistently profitable
business
•
Visible Backlog: $80 million as of 6/30/14
•
Key Customers:
Analyzers
Neurology
Blood Separation
13 |
 Complex
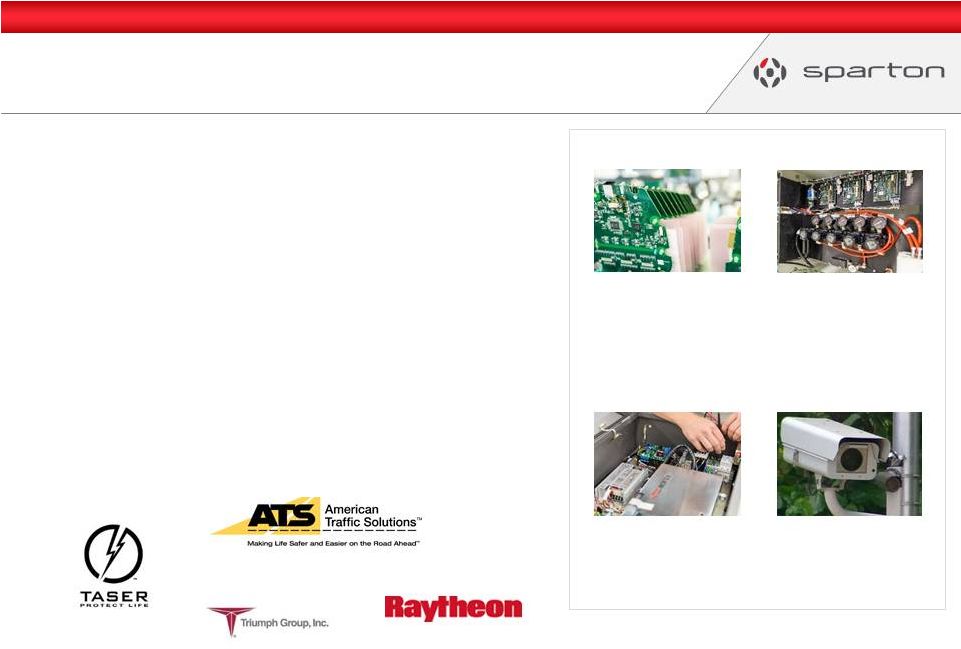
Systems •
Manufacturer of circuit card assemblies and electronic
based box build products primarily for the military and
commercial aerospace markets
•
New prototyping capabilities to shorten development and
introduction lead times for customers
•
Consolidated business from old and inefficient sites to state-
of-the-art and technologically advanced facilities in Florida
and Viet Nam for improved efficiencies and capacity
utilization
•
FY2014 External Sales: $64 million
•
Visible Backlog: $34 million as of 6/30/14
•
Key Customers:
14
Circuit Board Assembly
Sub Assembly
Complete System
Box Build |
 Primary Market
Dynamics 15
X
X
X
X
Medical
Industrial &
Instrumentation
Military &
Aerospace
Computer
Automotive
Consumer
Communication
Total Electronics Market from 2013 to 2016 = $1.3 trillion to $1.5 trillion
Total 2013 EMS/ODM Outsourced Market:
$293 billion
2012 –
2016 Projected Outsourcing Growth:
7.9% CAGR
Defense & Security
Navigation & Exploration
Medical
Highly regulated
market (FDA)
High growth
Blue chip customers
New to outsourcing
Contract design, mfg,
and assembly roll-up
opportunity
Highly regulated
market (ITAR,
COMSEC)
Moderate growth
Blue chip customers
Preferred supplier
status
Contract design, mfg,
and assembly roll-up
opportunity
Moderate growth
Blue chip customers
Preferred supplier
status
New to outsourcing
Contract design, mfg,
and assembly roll-up
opportunity
Highest growth sector
No current customers
Volume & commodity
pricing resulting in low
margins
OEMs are experts at
outsourcing
High growth
High volume
production drives
lower margins
Outsourcing mostly in
low cost country
regions
Complexity is general
low
Moderate growth
High volume
production drives
lower margins
Outsourcing mostly in
low cost country
regions
OEMs are experts at
outsourcing
Moderate growth
High volume
production drives
lower margins
Outsourcing mostly in
low cost country
regions
OEMs are experts at
outsourcing
Source:
New Venture Research 2014 Worldwide Report
Growth based on 2012-2013 results.
Market: $16B
Growth:
6.3%
Market: $6B
Growth:
7.8%
Market: $21B
Growth:
4.7%
Market: $11B
Growth:
12.9%
Market: $47B
Growth:
3.8%
Market: $90B
Growth:
6.8%
Market: $101B
Growth:
2.0%
Complex Systems |
 16
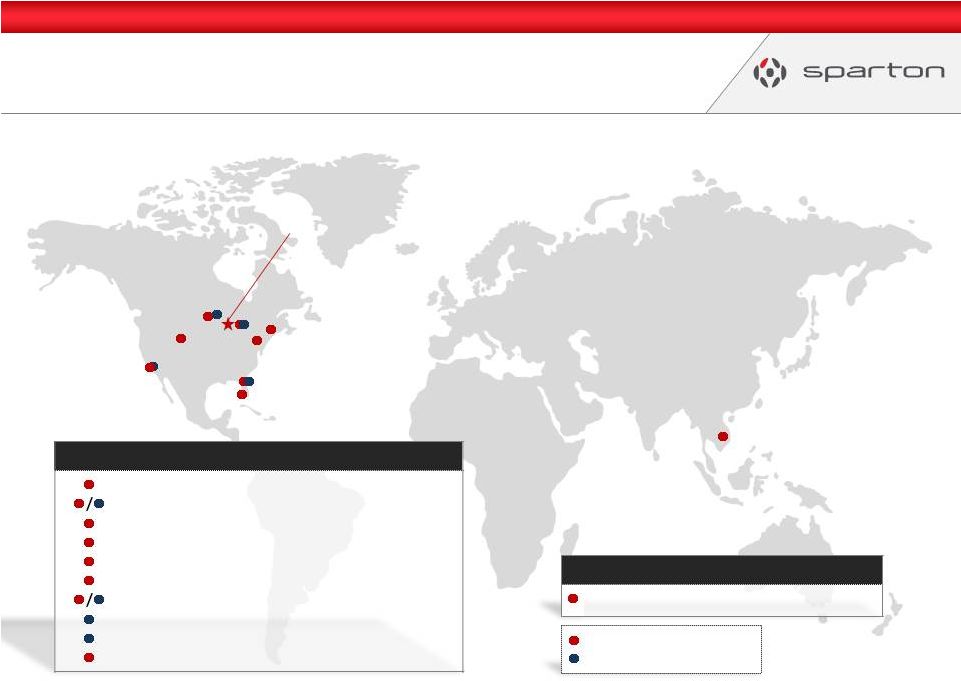
World-Class Facilities
Headquarters
Chicago, IL
Frederick, CO –
65,000 sq. ft.
Strongsville, OH –
60,000 sq. ft.
Watertown,
SD –
130,000 sq. ft.
Brooksville, FL -
80,000 sq. ft.
Birdsboro, PA –
42,000 sq. ft.
Plaistow, NH –
20,000 sq. ft.
De Leon Springs, FL –
120,000 ft.²
Plymouth, MN –
10,000 sq. ft.
Irvine, CA (Design Center) -
31,500 sq. ft.
Irvine, CA (Mfg
Center) –
29,000 sq. ft.
Ho Chi Minh City, Viet Nam –
60,000 ft.
2
Manufacturing Facility
Sales & Design
Center
North America
North America
Asia
Asia |
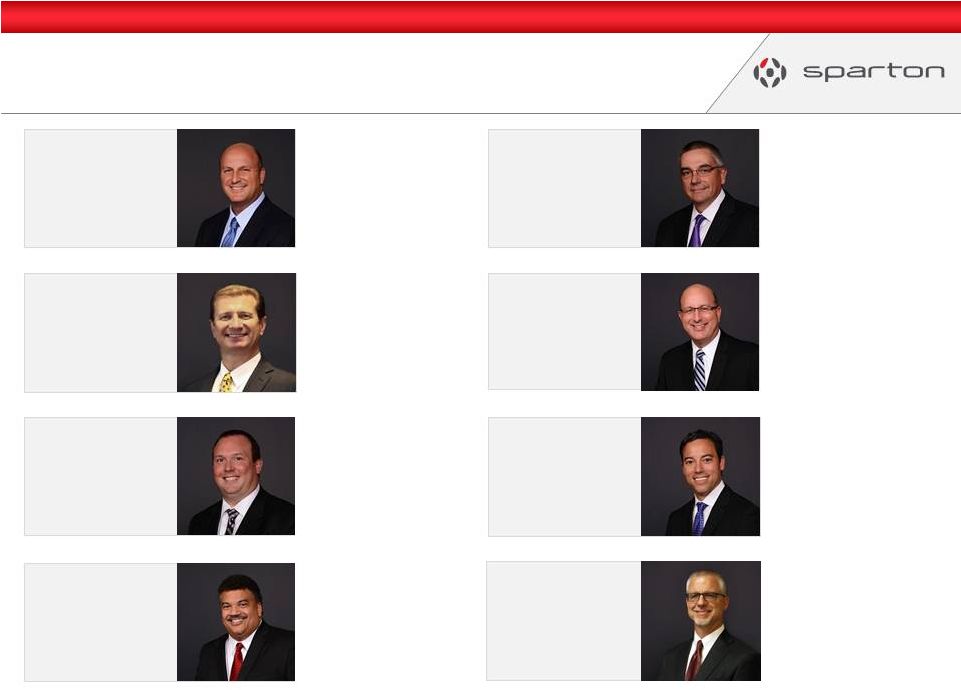 Chris
Ratliff Vice President –
Information Technology
Jake Rost
Vice President –
Business
Development
Senior Management Team
17
Responsible for developing
and implementing the
Company’s strategies,
managing the overall
operations and resources of a
company, and liaison to the
Board of Directors.
Cary Wood
President &
Chief Executive Officer
Don Pearson
Chief Financial Officer
Gordon Madlock
Senior Vice President –
Operations
Mike Osborne
Senior Vice President –
Corporate Development
Steve Korwin
Senior Vice President –
Quality &
Engineering
Larry Brand
Vice President –
Corporate
Human Resources
Drives corporate and business
unit strategic planning and
development, M&A activity,
business development &
customer retention, and
investor relations.
Management of the financial
risks of the corporation
including financial planning
and record-keeping, as well as
financial reporting to higher
management.
Responsible for executing the
strategic plan and overseeing
the day-to-day operations as
well as driving improved
manufacturing quality and
productivity using
contemporary, lean tools.
Leads enterprise-wide quality
and engineering initiatives to
improve business processes
that increase profitability and
sales.
Provides strategic direction
and leadership of the
company’s Information
Technology organization.
Successfully led numerous
enterprise wide
implementations.
Responsible for the business
development and marketing
efforts ensuring best practices
are being standardized and
optimized while continuing to
strengthen our brand image in
the various markets we serve.
Provides strategic leadership
and tactical direction for the
overall Human Resources
function to senior
management and company
leadership teams |
 Improved
Corporate Governance 18
Reduced
Board Size
Board size reduced from 11 to 7 members
(6 independent, 1 non-independent)
De-staggered
Board
All directors required a majority vote threshold in order to be elected at
each annual meeting
Implemented
Annual Say-on-Pay
Implemented “say-on-pay”
vote on executive compensation ahead of
requirement
Aligned
Incentive Plans
Established Short Term Incentive Plan based on annual performance
objectives and Long Term Incentive Plan based on long term financial
metrics aligned with shareholder interests
Updated
Governing Documents
Update the Articles of Incorporation, Code of Regulations and
Committee Charters to reflect today’s business environment and
streamlined proxy statement to make it easier to read for investors
|
 Performance
Highlights Don Pearson
Chief Financial Officer |
 20
32.50
30.00
27.50
25.00
22.50
20.00
17.50
15.00
12.50
10.00
7.50
5.00
2.50
0.00
27%
Net Sales
52%
Adjusted EBITDA
36%
Adjusted EPS
89
89
New Business Programs
3
3
Strategic Acquisitions
2014
2009
Fiscal 2014 Highlights
Year-Over-Year
Increases of: |
 Fiscal 2014
Highlights 21
•
Annual revenue growth of 27% to $336 million
•
Annual adjusted EBITDA of $33.3 million or an increase of 52% from the
prior year
•
Organic growth, net of acquisition impacts, was 5%
•
89 new business programs were awarded with potential annualized
sales of $38.8 million
•
Completed three acquisitions
–
Aydin Displays
–
Beckwood Services
–
Aubrey Group |
 2014
Consolidated Financial Results 22
2014
2013
2014
2013
Net Sales
$ 336,139
$ 264,627
$ 336,139
$ 264,627
$ 71,512
27%
Gross Profit
64,453
45,435
64,790
46,001
18,789
41%
19.2%
17.2%
19.3%
17.4%
Selling and Administrative Expense
35,698
26,451
35,698
26,451
(9,247)
10.6%
10.0%
10.6%
10.0%
Internal R&D Expense
1,169
1,300
1,169
1,300
131
Amortization of intangible assets
3,287
1,575
3,287
1,575
(1,712)
EPA related - net environmental remediation
4,238
-
-
-
-
Restructuring/impairment charges
188
55
-
-
-
Other operating expense, net
(16)
13
(16)
13
29
Operating Income
19,889
16,041
24,652
16,662
7,990
48%
5.9%
6.1%
7.3%
6.3%
Income Before Provision For Income Tax
19,602
16,172
24,365
16,793
7,572
Provision For Income Taxes
6,615
2,702
8,352
4,976
(3,376)
Net Income
$ 12,987
$ 13,470
$ 16,013
$ 11,817
$ 4,196
36%
3.9%
5.1%
4.8%
4.5%
Income per Share (Basic)
$ 1.28
$ 1.32
$ 1.58
$ 1.16
$ 0.42
36%
Income per Share (Diluted)
$ 1.28
$ 1.32
$ 1.58
$ 1.16
$ 0.42
36%
($ in 000’s, except per share)
(adjusted removes certain gains and charges)
(Reported)
(Adjusted)
Year ended June 30,
Year ended June 30,
Total YoY
Variance ($)
Total YoY
Variance (%)
(Adjusted) |
 Adjusted
EBITDA 23
2014
2013
2014
2013
Variance
Net Income
$ 2,971
$ 5,636
$ 12,987
$ 13,470
$ (483)
Interest expense
291
128
838
518
320
Interest income
(7)
(3)
(9)
(102)
93
Provision for income taxes
1,758
1,871
6,615
2,702
3,913
Depreciation and amortization
2,213
1,725
8,123
4,761
3,362
Restructuring/impairment charges
-
55
188
55
133
EPA
related -
net
environmental
remediation
4,238
-
4,238
-
4,238
Capitalized profit in inventory from acquisition
81
-
337
566
(229)
Adjusted EBITDA
$ 11,545
$ 9,412
$ 33,317
$ 21,970
$ 11,347
12.4%
11.6%
9.9%
8.3%
3 months ended June 30,
Year ended June 30, |
 Liquidity &
Capital Resources ($ in '000)
Jun-13
Sep-13
Dec-13
Mar-14
Jun-14
Cash and equivalents
6,085
2,719
1,009
7,502
8,028
LOC Availability
55,000
36,000
40,000
30,000
59,000
Total
61,085
38,719
41,009
37,502
67,028
($ in '000)
Jun-13
Sep-13
Dec-13
Mar-14
Jun-14
Credit Revolver
10,000
28,500
25,000
35,000
41,000
IRB (Ohio)
1,539
1,506
1,472
1,437
-
Total
11,539
30,006
26,472
36,437
41,000
($ in '000)
Jun-13
Sep-13
Dec-13
Mar-14
Jun-14
Net Inventory
46,334
55,658
52,393
51,466
53,372
Cash Availability
Debt
Inventory
24 |
 Shifting Sales
Mix To Higher Margin Business 25
FY2014
(Revenue of $336 million)
FY2009
(Revenue of $221 million)
FY2014
(Revenue of $336 million)
Medical
29%
DSS
19%
EMS
52%
Reporting Segments
Markets
Medical
48%
DSS
32%
Complex
Systems
19%
Industrial
11%
Medical
46%
MilAero
43% |
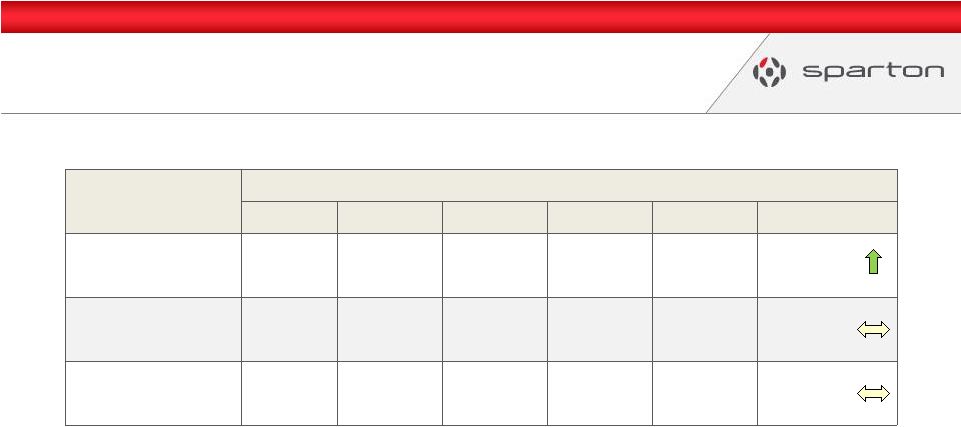 Target Gross
Margin by Segment by Year FY 2010
FY 2011
FY 2012
FY 2013
FY 2014
FY 2015
DSS
15%-18%
20%-25%
20%-25%
20%-25%
20%-25%
25%-30%
Medical
13%-16%
13%-16%
13%-16%
13%-16%
13%-16%
13%-16%
Complex Systems
3%-6%
5%-8%
7%-10%
7%-10%
9%-12%
9%-12%
Improving Gross Margin Performance
26
Target Gross Margins:
•
•
•
DSS guided upward to 25%-30% for FY 2015
Medical has been maintained at 13-16%
Complex Systems improved steadily from 3%-6% in FY 2010 to 9%-12% FY
2014-15 |
 Backlog
27
Backlog is defined as firm purchase orders with product not yet shipped. Customer
forecasts are not taken into consideration.
Estimated increase in FY2015 Q1 is a result of Sparton’s $91 million portion of the $166
million ERAPSCO year 1 sonobuoy order.
0
50
100
150
200
250
300
* Estimate |
 2015 Strategy
Summary 28
Fiscal 2014 Results:
27% revenue growth, including 5% organic growth in the legacy business
52% adjusted EBITDA growth
36% adjusted earnings per share growth
Supported by market research
& go-to-market programs
New Programs
New Customers
Potential Annualized Revenue
17.7
$
23.8
$
39.4
$
38.8
$
Aubrey Group
GEDC-6
Fiscal 2012
AHRS-8
Temperature compensated attitude heading reference system
Fiscal 2014
Aydin
Various new ruggedized displays
IMU-10
Harsh environment inertial sensing system
26
40
71
89
11
PHOD-1
Aydin Displays
Beckwood Services
Fiscal 2013
Onyx EMS
Creonix
Internal Research & Development
Fiscal 2011
Gyro-enhanced digital compass
Hydrophone
Fiscal 2015
eMT
Fiscal 2014
FY11
FY12
FY13
FY14
20
12
26
Acquisitions
New Business Awards
Delphi Medical
Byers Peak
Fiscal 2011 |
 2015 Vision
Update Cary Wood
President & CEO |
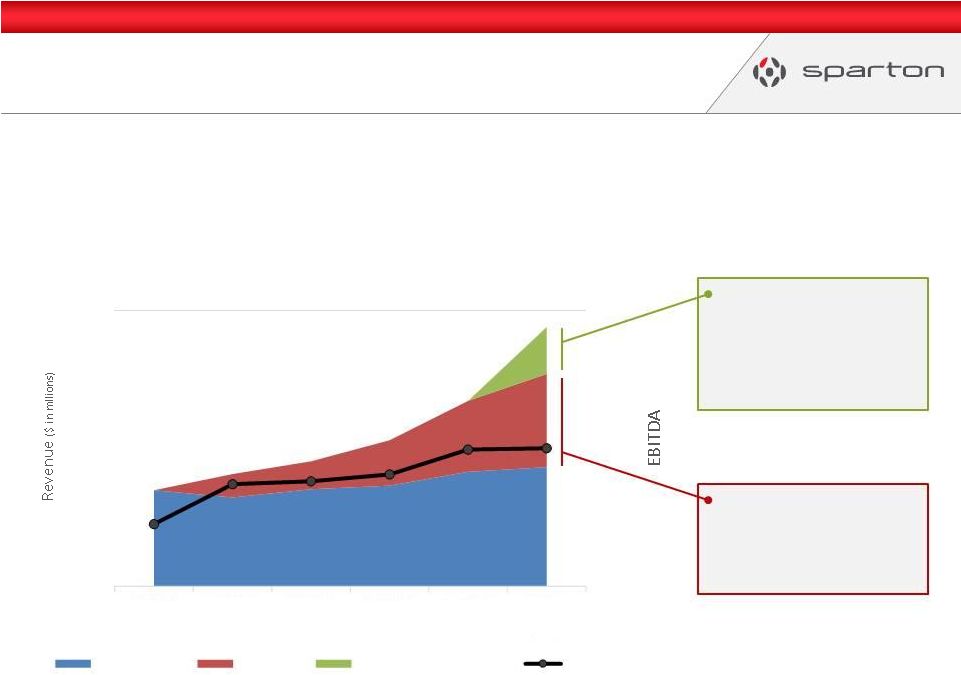 2015 Vision
Update 30
$380-400 million; full
effect of completed
acquisitions + organic
growth
$460-480 million run
rate with full effect of
completed acquisitions +
organic growth + 2015
potential acquisitions
0%
10%
20%
500
FY2010
FY2011
FY2012
FY2013
FY2014
FY2015
(est.)
Legacy Revenue
Acquisitions
2015 Potential Acquisitions
EBITDA (as %)
2015 Vision:
Sparton will become a $500 million revenue entity by attaining key market
positions in our primary lines of business and through complementary and
compatible acquisitions and will consistently rank in the top half of our peer
group in return on shareholder equity and return on net assets.
- |
 2020
Vision |
 Today
•
Sparton has a strong foundation in engineered
products and is a trusted contract manufacturing
partner
•
We have achieved success in the medical and
mil/aero segments by meeting technical
requirements and clearing compliance hurdles
•
We are very good at managing and improving the
performance of manufacturing operations with a
track record to prove it
•
But…we currently control a limited amount of IP
and other differentiated content
32 |
 Landscape of
Business Models 33
Engineered Components & Products
Manufacturing & Design Services
Small, Regional Design Engineering
& Contract Manufacturing Firms
“Area of Margin Expansion”
OEMs
OEMs
IDEX
IDEX
Flextronics
Flextronics
Sanmina
Sanmina
Benchmark
Benchmark
Plexus
Plexus
Barco
Barco
Ultra
Ultra
[USSI]
[USSI] |
 Going
Forward… By 2020 Sparton will achieve significant growth (revenue in excess of $1
billion) and increased profitability (EBITDA at or above 12%)
Three strategies will be executed to achieve the Vision:
34
Assess
Assess
SBS
Optimize
Optimize
Standardize
Standardize
Track
Track
I.
Maintain focus on regulated and demanding environments
II.
Pivot our business model to include a higher concentration of differentiated offerings
III.
Apply the Sparton Business System (SBS) to unlock value |
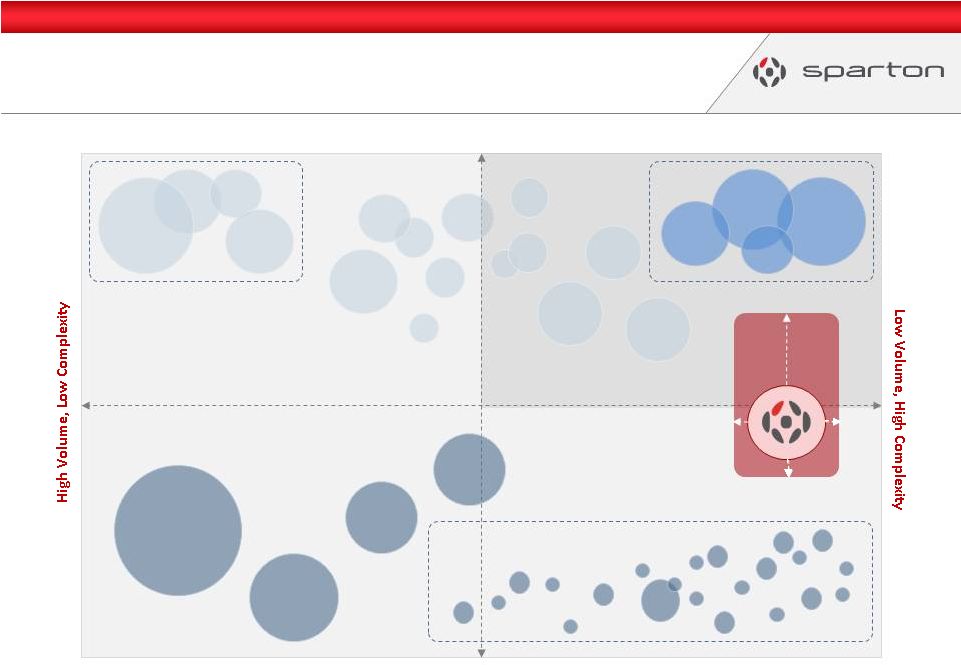 Expanding Our
Offerings: 2020 Vision 35
Engineered Components & Products
Manufacturing & Design Services
Plexus
Plexus
Benchmark
Benchmark
Sanmina
Sanmina
Small, Regional Design Engineering
& Contract Manufacturing Firms
OEMs
Ultra
Ultra
[USSI]
[USSI]
“Area of Margin Expansion”
Barco
Barco
OEMs
Flextronics
Flextronics
IDEX
IDEX |
 36
“Reach $1 billion by 2020,
expanding our manufacturing and
design services while providing
more engineered components and
products to meet the needs of our
customers and markets” |
 Mission &
2020 Vision 37
Mission:
Sparton provides engineered products and related
services to businesses, governments, and institutions
serving regulated and demanding environments.
2020 Vision:
Sparton will exceed $1 billion of revenue by fiscal year
2020 and deliver above average shareholder returns by
significantly expanding our differentiated product and
service offerings and applying our business systems,
resources, and talents to address the unique needs of
our customers and markets. |
 38
Our Values |
 $200
$400
$600
$800
$1,000
$1,200
Revenue Bridge: Fiscals 2014 to 2020
39
FY 2014
$336 mil
Manufacturing & Design
Services Expansion
Acquisitions
Organic
Growth
Engineered Components
& Products Expansion
Acquisitions
Organic
Growth
2020
Vision
$1 billion
Based on our analysis, growth to $1 billion will not
require a debt or equity offering: Net Debt to
EBITDA leverage peaks at 2.6x in 2019
FY 2015
$380-$400 |
 Organizational
Alignment Our goals as we evolve our structure
1.
Provide a flexible and evolutionary structure to enable scalability given
the organization’s projected future growth
2.
Leverage operational and administrative strength in the M&A process to
enhance due diligence and integration
3.
Address the leadership required to create and implement the Sparton
Business System
4.
Evolve into two operating groups with the ability to flex the
organizational design based upon pace and focus of Vision
2020 strategy
•
Manufacturing & Design Services
•
Engineered Components & Products
40 |
 Operating Group
Vice Presidents Jamie Shaddix
Group Vice President
Manufacturing & Design Services
Mike Gaul
Group Vice President
Manufacturing & Design Services
Jim Lackemacher
Group Vice President
Engineered Components & Products
Oversight of a significant portion
of the Company’s manufacturing
& design service locations
including operations,
engineering, quality and supply
chain strategies and activities.
Oversight of a significant portion
of the Company’s manufacturing
& design service locations
including operations,
engineering, quality and supply
chain strategies and activities.
Oversight of the Company’s
engineered products segment
providing multiple products into
the defense and commercial
channels.
Group Vice President positions were created in January 2014, staffed with internal
resources 41 |
 Evolving Our
Financial Reporting A.
As our strategy evolves, we will reconfigure our reporting internally and
manage the businesses along two lines:
•
Manufacturing & Design Services
•
Engineered Components & Products
B.
Therefore, the SEC segment reporting requirements will necessitate a
reporting change as reporting must align with how we manage the
business
C.
Proposed structure is detailed on the following slide
42 |
 Revenue
Reporting: Fiscals 2012 to 2014 •
Revenue figures above are net sales
•
Manufacturing & Design Services consists of Medical and Complex
Systems
•
Engineered Components & Products consists of DSS and Aydin
Legacy
Beginning
Q1 FY 2015
Reporting Segments
FY2012
FY2013
FY2014
Medical
110,894
146,873
162,648
Complex Systems
38,581
42,324
64,357
DSS
76,980
75,430
109,134
Totals
226,455
264,627
336,139
Manufacturing & Design Services
149,475
189,197
227,005
Engineered Components & Products
76,980
75,430
109,134
Totals
226,455
264,627
336,139
Revenue (Net Sales)
43 |
 Shifting Revenue
Mix 44
FY
2014
2020 Vision |
 Shifting
End-Market Mix 45
FY 2014
2020 Vision |
 Strategies
& Key Imperatives Mike Osborne
Senior Vice President –
Corporate Development
46 |
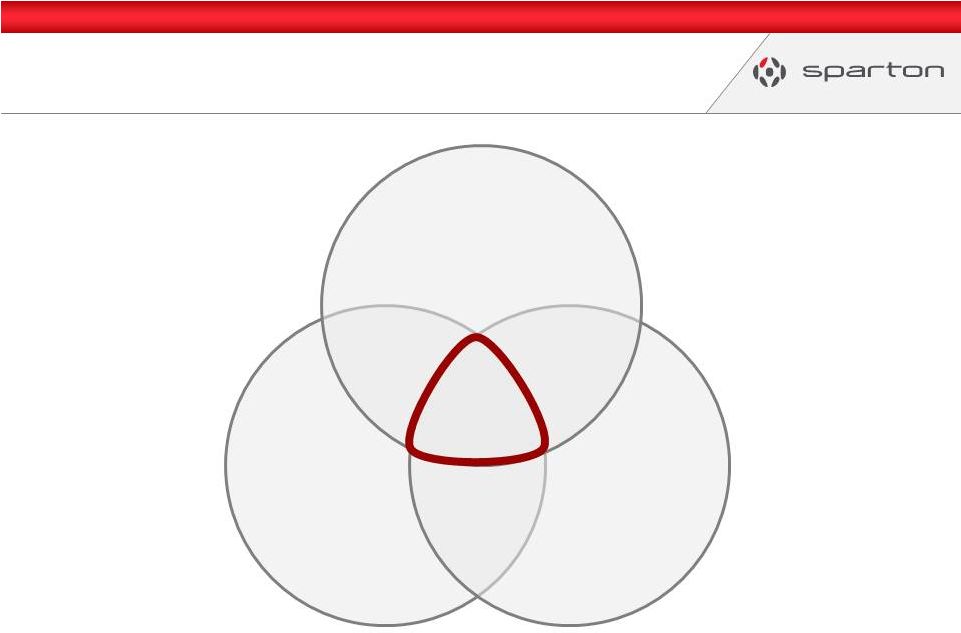 Our
Strategies Differentiated
Products &
Services
Sparton
Business
System
Regulated &
Demanding
Environments
Vision
2020
47 |
 Regulated &
Demanding Environments Strategy I:
Maintain focus on regulated and demanding environments
A.
Continue to scale in medical & mil/aero
B.
Target low-volume, high-mix needs in demanding segments of the
commercial and industrial markets
C.
Grow contract manufacturing services at acceptable margins
48 |
 “Regulated
and Demanding” A.
Regulated and demanding environments require specialized solutions that comply
with standards or that deliver one or more performance attributes that cannot be
found in traditional commercial off-the-shelf products
B.
Offerings for these environments may be fully custom solutions or highly modified
versions of standard offerings; in either case, they are inherently differentiated from
existing, mainstream alternatives
49
Regulated Environments
Monitored by a government-appointed body
•
Aerospace & Commercial Aviation
•
Defense
•
Healthcare / Biotechnology
•
Utilities & Energy
•
Telecommunications Infrastructure
Demanding Environments
Governed by industry standards or specific,
market-driven requirements
•
Automation & Precision Motion Control
•
Food Processing
•
Mining & Drilling
•
Security & Fire Control
•
Unmanned Vehicles |
 50
Geographic Expansion
Facilities Strategy
•
Rationalize and optimize utilization of manufacturing facilities
•
Establish a network of strategically-located sales & design centers
Manufacturing Facility
Sales & Design Center
= Priority regions |
 Pivot the
Business Model Strategy II:
Pivot the business model to include a higher concentration of
differentiated offerings
A.
Acquire and grow engineered component & product companies
B.
Expand the breadth and depth of design & engineering services;
promote & grow offerings
C.
Expand U.S. footprint to cover major product development corridors
51 |
 “Differentiated Offerings”
52
Differentiated (or Engineered) Components and
Products are “sticky”
due to one or more of:
Differentiated Services require specialized
skills and/or intimate knowledge of markets
or applications and may include:
Differentiated products and services as those generally available from a limited number of
suppliers and not easily substituted.
Engineered components and products may
include raw materials, components, sub-
assemblies, and finished goods.
•
Proprietary design
•
Proprietary materials
•
Form factor
•
Build quality
•
Performance & reliability
•
Energy consumption
•
Life span
•
Sales, marketing, & distribution support
Sparton’s breadth of service offerings and
depth of experience with regulated and
demanding environments are differentiators.
•
Product design and engineering
•
Software and application design
•
Rapid prototyping
•
Contract manufacturing
•
Testing, regulatory, & compliance
•
Field service |
 Value Chain
Expansion 53
Engineered
Components
Wiring Harness
& Cables
Circuit Card
Assembly
Sub-Assemblies
Box Build
Complete
Systems
Expanding internal engineering capability (product development, design,
and systems integration) enhances and supports the entire value stream.
|
 Value Chain
Expansion – Medical Example
54
Microfluidic
Valves
Displays
Pumps
Wiring
Harnesses
Electronic
Circuit Cards
Acquire engineered component & product companies, optimize and scale
|
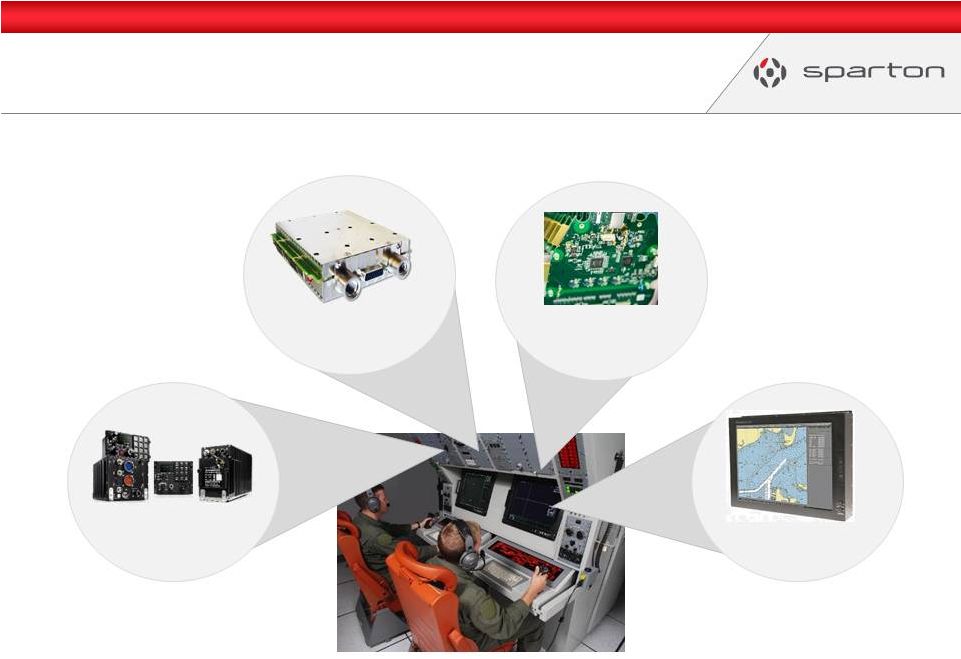 Value Chain
Expansion – Mil/Aero Example
55
RF Receivers
Ruggedized
Displays
Sensors
Electronic
Circuit Cards
Acquire engineered component & product companies, optimize and scale
|
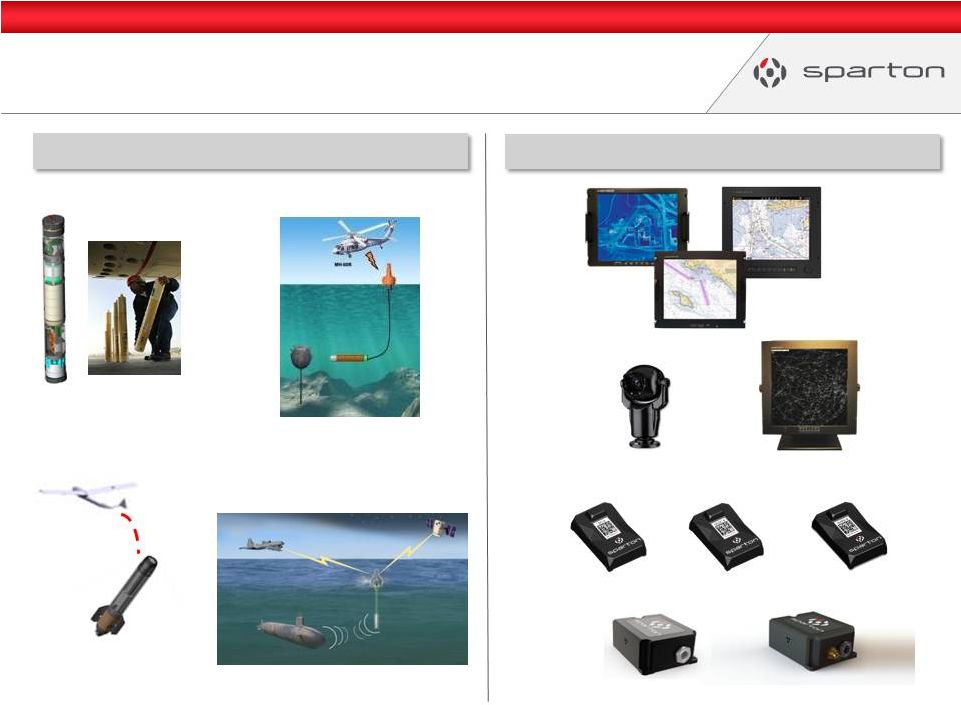 Value Chain
Expansion – R&D
56
Government Funded R&D
Sonobuoys
Payload Delivery
Undersea Communication
Remote Mine-hunting
DC-4E
GEDC-6E
AHRS-8
IMU-10
GAINS-10
Displays
& Cameras
Civil Marine
Rugged
Cameras
Military
Industrial
Air Traffic
Control
Inertial Sensors
Internally Funded R&D |
 Sparton Business
System Strategy III:
Apply the Sparton Business System (SBS) to unlock value
A.
Expand the Sparton Production System to more comprehensive business
system, including acquired tools, practices, and resources
B.
Deploy best practice processes & analytical tools
C.
Provide access to financial resources & human capital
57 |
 Sparton Business
System (SBS) Overview SBS is Sparton’s proprietary engine for
value creation, with applications that:
•
Reduce cost
•
Improve efficiency
•
Ensure quality
•
Foster innovation
•
Support growth
•
Enable a predictable performance path
The Sparton Business System (SBS) is a proprietary set of practices, tools and
principles which are strategically applied to core business processes to drive
performance excellence across the enterprise.
58
Assess
SBS
Optimize
Standardize
Track |
 FY 2015 Key
Imperatives 59
A.
Deliver sustainable, profitable growth
Evaluate, prioritize and pursue attractive opportunities for acquisitions, new business
development, program expansion and internal R&D to deliver 15-20% annual
growth. B.
Advance an engaged, performance-driven culture
Attract, retain, and develop resources at all levels in the organization; motivate and
empower our people and teams to continuously expand capabilities & improve
performance. C.
Enrich our innovation capabilities
Establish clear innovation objectives, foster applied creativity, develop, and acquire talent
in a full range of design, engineering, product development, and commercialization
disciplines. D.
Maximize our customer relationships
Engage customers to understand business / program goals, identify needs, and pursue
mutually-beneficial opportunities to deepen the relationship.
E.
Deploy the Sparton Business System
Develop and optimize a comprehensive set of best practices, deploy processes and tools, and
provide accesses to resources to unlock value across the enterprise.
|
 Closing
Remarks Cary Wood, President & CEO |
 Key
Messages 61
Proven &
Experienced
Management Team
Diversified
Revenue
Mix
Strong Free Cash
Flow Generation &
Financial Condition
Highly Skilled &
Industry Leading
Manufacturing
Capabilities
Established,
Longstanding
Customer
Relationships
Attractive Platform
for Growth |
 Mission, Vision
& Strategies 62
“Reach
$1
billion
by
2020,
expanding
our
manufacturing
and
design
services
while
providing
more
engineered components and products to meet the needs of our customers and markets”
Mission:
Sparton provides engineered products and related services
to businesses, governments, and institutions
serving regulated and demanding environments.
Vision:
Sparton will exceed $1 billion of revenue by fiscal year 2020 and deliver above average
shareholder returns by significantly expanding our differentiated product and service
offerings and applying our business systems, resources, and talents to address
the unique needs of our customers and markets.
Strategy I:
Maintain focus on regulated
& demanding environments
Strategy II:
Pivot the business model to
include a higher
concentration of
differentiated offerings
Strategy III:
Apply the Sparton Business
System (SBS) to unlock value |
 Why is this the
right direction? We have a strong foundation in engineered products and are a trusted
contract manufacturing partner
We are very good at fixing manufacturing operations; most of our
improvement
efforts flow through as cost savings for our customers
We have a track record of success in the medical and mil/aero segments; we can
leverage those strengths to capture more of the value chain via product
companies serving regulated and demanding environments
We have a strong foundation of design and engineering resources;
expanding
those offerings will help us capture more of the value chain
Expanding our proprietary Sparton Production System to a more comprehensive
Business System will allow us to build out a wider set of best practices, tools,
and resources
63 |
 64
“Reach $1 billion by 2020,
expanding our manufacturing and
design services while providing
more engineered components and
products to meet the needs of our
customers and markets” |
 Question
& Answer 65 |
