Attached files
| file | filename |
|---|---|
| EX-23.1 - EX-23.1 - OneMain Financial Holdings, Inc. | d793139dex231.htm |
Table of Contents
As filed with the Securities and Exchange Commission on October 8, 2014
Registration No. 333-
SECURITIES AND EXCHANGE COMMISSION
Washington, D.C. 20549
FORM S-1
REGISTRATION STATEMENT
UNDER
THE SECURITIES ACT OF 1933
ONEMAIN FINANCIAL HOLDINGS, INC.
(Exact Name of Registrant as Specified in Its Charter)
| Delaware | 6141 | 27-4393679 | ||
| (State or Other Jurisdiction of Incorporation or Organization) |
(Primary Standard Industrial Classification Code Number) |
(I.R.S. Employer Identification Number) |
300 Saint Paul Place
Baltimore, MD 21202
(410) 332-3000
(Address, Including Zip Code, and Telephone Number, Including Area Code, of Registrant’s Principal Executive Offices)
April O. Park
General Counsel
OneMain Financial Holdings, Inc.
300 Saint Paul Place
Baltimore, MD 21202
(410) 332-3000
(Name, Address, Including Zip Code, and Telephone Number, Including Area Code, of Agent For Service)
Copies to:
| Richard D. Truesdell, Jr. Sophia Hudson Davis Polk & Wardwell LLP 450 Lexington Avenue New York, New York 10017 (212) 450-4000 |
Jeffrey D. Karpf Cleary Gottlieb Steen & Hamilton LLP One Liberty Plaza New York, New York 10006 (212) 225-2000 |
Approximate date of commencement of proposed sale to the public: As soon as practicable after the effective date of this Registration Statement.
If any of the securities being registered on this form are to be offered on a delayed or continuous basis pursuant to Rule 415 under the Securities Act of 1933, check the following box. ¨
If this form is filed to register additional securities for an offering pursuant to Rule 462(b) under the Securities Act, check the following box and list the Securities Act registration statement number of the earlier effective registration statement for the same offering. ¨
If this form is a post-effective amendment filed pursuant to Rule 462(c) under the Securities Act, check the following box and list the Securities Act registration statement number of the earlier effective registration statement for the same offering. ¨
If this form is a post-effective amendment filed pursuant to Rule 462(d) under the Securities Act, check the following box and list the Securities Act registration statement number of the earlier effective registration statement for the same offering. ¨
Indicate by check mark whether the Registrant is a large accelerated filer, an accelerated filer, a non-accelerated filer, or a smaller reporting company. See the definitions of “large accelerated filer,” “accelerated filer” and “smaller reporting company” in Rule 12b-2 of the Exchange Act.
| Large accelerated filer | ¨ | Accelerated filer ¨ | ||
| Non-accelerated filer | x (Do not check if a smaller reporting company) | Smaller reporting company ¨ |
CALCULATION OF REGISTRATION FEE
|
| ||||
| Title Of Each Class Of Securities To Be Registered |
Proposed Maximum Aggregate Offering Price(1)(2) |
Amount Of Registration Fee | ||
| Common Stock, without par value |
$50,000,000 | $5,810 | ||
|
| ||||
|
| ||||
| (1) | Includes shares which the underwriters have the right to purchase to cover over-allotments. |
| (2) | Estimated solely for the purpose of computing the amount of the registration fee pursuant to Rule 457(o) under the Securities Act of 1933. |
The Registrant hereby amends this Registration Statement on such date or dates as may be necessary to delay its effective date until the Registrant shall file a further amendment which specifically states that this Registration Statement shall thereafter become effective in accordance with Section 8(a) of the Securities Act of 1933 or until the Registration Statement shall become effective on such date as the Commission, acting pursuant to said Section 8(a), may determine.
Table of Contents
The information in this prospectus is not complete and may be changed. We may not sell these securities until the registration statement filed with the Securities and Exchange Commission is effective. This prospectus is not an offer to sell these securities and we are not soliciting offers to buy these securities in any state where the offer or sale is not permitted.
SUBJECT TO COMPLETION, DATED OCTOBER 8, 2014
PRELIMINARY PROSPECTUS

Shares Common Stock $ per share
This is the initial public offering of shares of our common stock. We currently expect the initial public offering price to be between $ and $ per share of common stock. See “Use of Proceeds.”
Immediately following the completion of this offering, Citigroup Inc. will beneficially own between approximately % and % of our shares of common stock, depending on whether and the extent to which the underwriters exercise their over-allotment option.
We intend to apply to have our common stock listed on the New York Stock Exchange under the trading symbol “ .”
Investing in our common stock involves risks. See “Risk Factors” beginning on page 15.
Neither the Securities and Exchange Commission nor any state securities commission has approved or disapproved of these securities or determined if this prospectus is truthful or complete. Any representation to the contrary is a criminal offense.
| Per Share | Total | |||||||
| Public Offering Price |
$ | $ | ||||||
| Underwriting Discounts and Commissions(1) |
$ | $ | ||||||
| Proceeds to OneMain (before expenses) |
$ | $ | ||||||
| (1) | See “Underwriting” for additional compensation to be paid to the underwriters. |
Citigroup Inc., or the selling stockholder, has granted the underwriters an option for a period of 30 days to purchase up to additional shares of common stock to cover over-allotments. Any proceeds resulting from the sale of shares by the selling stockholder, after deducting underwriting discounts, will be paid to the selling stockholder, and we will receive no proceeds from the exercise of the over-allotment option.
The underwriters expect to deliver the shares to purchasers on or about , 2014 through the book-entry facilities of The Depository Trust Company.
Sole Book-Running Manager
Citigroup
, 2014
Table of Contents
| Page | ||||
| ii | ||||
| 1 | ||||
| 9 | ||||
| 10 | ||||
| 15 | ||||
| 45 | ||||
| 47 | ||||
| 47 | ||||
| 48 | ||||
| 49 | ||||
| 51 | ||||
| 54 | ||||
| Management’s Discussion and Analysis of Financial Condition and Results of Operations |
60 | |||
| 85 | ||||
| 98 | ||||
| 102 | ||||
| 115 | ||||
| 120 | ||||
| 121 | ||||
| 122 | ||||
| Material U.S. Federal Tax Considerations for Non-U.S. Holders of Our Common Stock |
130 | |||
| 132 | ||||
| 134 | ||||
| 136 | ||||
| 140 | ||||
| 140 | ||||
| 140 | ||||
| 140 | ||||
| F-1 | ||||
We, the selling stockholder and the underwriters have not authorized anyone to provide any information other than that contained or incorporated by reference in this prospectus or in any free writing prospectus prepared by or on behalf of us. We, the selling stockholder and the underwriters take no responsibility for, and can provide no assurance as to the reliability of, any other information that others may give you. We and the selling stockholder are not, and the underwriters are not, making an offer to sell these securities in any jurisdiction where the offer or sale is not permitted. You should not assume that the information contained in this prospectus or any free writing prospectus is accurate as of any date other than the date of the relevant document. Our business, financial condition, results of operation or future growth prospectus may have changed since those dates.
i
Table of Contents
NON-GAAP FINANCIAL MEASURES AND OTHER INFORMATION
In this prospectus, we have included financial measures that are compiled in accordance with U.S. Generally Accepted Accounting Principles, or GAAP, as well as certain non-GAAP financial measures. These non-GAAP financial measures include:
| • | Adjusted pro forma net income from continuing operations is the pro forma net income from continuing operations giving effect to the Transactions (as defined in “Unaudited Pro Forma Combined Financial Information”) further adjusted for (i) the transfer of our real estate portfolio to an affiliate effective January 1, 2014 and (ii) the transfer of our servicing portfolio to an affiliate that occurred on January 6, 2014, in each case net of tax, as if each of the Transactions and the further adjustments had occurred on January 1, 2013. |
We refer to the (i) transfer of our real estate portfolio to an affiliate effective January 1, 2014 and (ii) transfer of our servicing portfolio to an affiliate on January 6, 2014 collectively as our 2014 exit from the real estate business. See “Management’s Discussion and Analysis of Financial Condition and Results of Operations—Segment Overview.”
| • | Adjusted pro forma return on assets is the ratio of Adjusted pro forma net income from continuing operations to Adjusted average pro forma total assets. |
| • | Adjusted average pro forma total assets is the average pro forma total assets, giving effect to the Transactions and adjusted for our 2014 exit from the real estate business, as if each of the Transactions and the further adjustments had occurred on January 1, 2013. |
| • | Adjusted pro forma return on equity is the ratio of Adjusted pro forma net income from continuing operations to pro forma equity. |
These non-GAAP financial measures are supplemental measures of our performance and are not required by, or presented in accordance with, GAAP. We use the non-GAAP measures to provide us and other interested third parties a basis to better understand our ongoing operating results on a consistent basis. Other companies in our industry may calculate these measures differently than we do, limiting their usefulness as comparative measures.
The non-GAAP financial measures used in this prospectus have limitations as analytical tools, and you should not consider them in isolation or as a substitute for the analysis of our results as reported under GAAP. You should be aware that in the future we may incur expenses that are the same as, or similar to, the adjustments used in this prospectus. Our presentation of adjusted pro forma net income from continuing operations should not be construed as an inference that our future results will be unaffected by unusual or non-recurring items.
Throughout this prospectus we also refer to the term “FICO score,” which means a credit score developed by Fair Isaac & Co. A FICO score is widely used as a means of evaluating the likelihood that credit users will pay their obligations. The range of FICO scores is 300-850, with a higher FICO score generally indicating a greater likelihood of repayment.
ii
Table of Contents
This summary highlights information contained elsewhere in this prospectus. This summary may not contain all of the information that you should consider before deciding to invest in our common stock. You should read this entire prospectus carefully, including the sections entitled “Risk Factors” and “Management’s Discussion and Analysis of Financial Condition and Results of Operations,” our combined financial statements, the notes to those statements and both our selected historical and pro forma combined financial data before making a decision to purchase our common stock. Some information in this prospectus contains forward-looking statements. See “Special Note Regarding Forward-Looking Statements.”
As used in this prospectus, all references in this prospectus to “OneMain,” the “Company,” “we,” “us,” “our,” “ours” or similar terms refer to OneMain Financial Holdings, Inc., a Delaware corporation, together with its consolidated subsidiaries. References to “Citi” refer to Citigroup Inc. and its subsidiaries other than OneMain.
OneMain Financial Overview
We are a leading consumer finance company in the United States, providing responsible solutions to credit-worthy individuals through our nationwide branch network and online channels. Our 100-plus year history and culture embodies our dedication to high-quality origination, underwriting and servicing of traditional, easily understood and transparent personal loans to primarily middle-income households. Our personal loans are fixed-rate, fixed-term and fixed-payment, which are attractive to our customers. We also offer optional products that protect customers in the event of unforeseen circumstances. We have been a stable and positive community presence using our industry-leading technology platform, proprietary underwriting process and data analytics to originate, price, manage, and monitor risk effectively through changing economic conditions. We have built a culture of compliance to anticipate, understand and embrace a changing regulatory environment. Our experienced management team, strong financial position, and adherence to our core values of customer advocacy, ethical leadership, ownership attitude, continuous improvement and personal development, position us well for future success and growth.
At the core of our business is a national, community-based network of 1,141 branches as of June 30, 2014, serving 1.3 million customer accounts across 43 states. This network is supported by our state-of-the-art technology platform that allows us to efficiently process applications and provide convenient self-service features for our customers. As of June 30, 2014, the network consists of a local, well-trained, front-end workforce of approximately 4,100 employees and is supported centrally by approximately 1,100 employees with additional functional support provided by Citi. Our captive insurance business, Citi Assurance Services, or CAS, is staffed by an additional workforce of approximately 215 employees. Our branch employees typically live in the communities they serve, and we believe our customers value the face-to-face interaction and the long-term relationships they build with our branch employees. This face-to-face interaction significantly enhances the value we provide to customers as we work together to assess their household budgets and ability to repay their loans. The knowledge gained and relationships built during the face-to-face interactions allow us to quickly service customers, while also improving our loan performance. Branches not only originate but also service loans through early-stage delinquency, which we view as a key aspect of our relationship-driven model. This relationship-driven model is further strengthened by our extensive and complementary centralized operations that deliver cost efficiencies and risk and compliance controls. Our experience suggests that combined, our branches and centralized operations are the most effective means for both serving our target customers and driving low default and delinquency rates in our loan portfolio.
Our customers are creditworthy and represent a unique segment of the middle-income market that is underserved by traditional banking institutions and can particularly benefit from our reationship-driven approach. Our customers typically come to us with a specific borrowing need. We believe our customers prefer and benefit
1
Table of Contents
from the face-to-face discussion of their household budgets and cash flow needs with our branch employees. Our customers value speed, convenience, service and funds availability as high priorities. Our customers have an average FICO score of 630 and an average income of $45,000.
During 2013, we advanced new funds totaling $3.2 billion, and at June 30, 2014, we had $8.2 billion of loans outstanding and 1.3 million customer accounts. For the year ended December 31, 2013, we had net income of $536 million, representing a return on assets of 5.4% and return on equity of 19.9%. For the six months ended June 30, 2014, we had net income of $287 million, representing a return on assets of 6.0% and a return on equity of 19.1%.
Our Strengths
Largest Consumer Finance Branch Network in the United States with Complementary Centralized Support Operations
Our business is large and well established with 1,141 branches as of June 30, 2014, serving 1.3 million customer accounts across 43 states. Our national, community-based branch network is the foundation of our relationship-driven business model and is the product of thoughtful market identifications and profitability analysis. Our centralized operations provide customer services, transaction processing and late-stage collection efforts, driving operating efficiencies and risk and compliance control. We believe the scale of our business, resulting operating efficiencies, proprietary industry knowledge and investment in regulatory compliance contribute significantly to our success and profitability.
Industry-Leading Technology Strategy and Platform
We believe that our technology platform is a strategic asset, and we maintain a well-defined technology strategy and investment plan to protect our competitive edge. Technology investments improve our speed of service and ability to respond to customer needs and help drive our efficiency, scale and stable operations. We use a centrally-run technology platform with proprietary applications for originations, servicing and collections to provide a seamless, real-time link between our branches and our centralized operations. The cornerstone of this platform is our internally developed, front-office processing platform that integrates our key business functions into a single, web-based solution. Additionally, our expanding digital capabilities are helping us service and grow our customer base.
Centralized Risk Analytics Supported by Our Proprietary, National Database
Our longevity and stability result from our focus on providing straightforward, traditional loan products and our conservative approach to originating loans. While our branches originate and service loans, our pricing, loan underwriting and approval decisions are made centrally through our risk management system. Our disciplined risk management model and advanced analytics effectively complement localized branch operations to drive low default and delinquency rates. We use a rigorous underwriting process that leverages industry and proprietary credit tools built using customer performance data from our national lending database. Our long-tenured and experienced branch staff complements our data-driven process.
Extensive Experience with Complex Regulatory Oversight and Strong Compliance Culture
We have extensive experience operating in a complex and highly regulated environment. We have built a robust compliance culture in the last decade and established processes and controls to monitor our legal and regulatory adherence. Our primary regulators are state regulators from whom we have state level licenses, the Board of Governors of the Federal Reserve System, or the Federal Reserve Board, and the Consumer Financial
2
Table of Contents
Protection Bureau, or the CFPB. In 2013, state regulators conducted exams of over 600 of our branches and centralized sites. In addition, as a subsidiary of a bank holding company, we have been closely examined a number of times by the Federal Reserve Board and continue to have regular interactions with them. We also have been examined several times by the CFPB, and we believe our business is well suited to address their requirements.
Robust Financial Performance
We increased our profitability in 2012 and 2013 with net income of $407 million and $536 million, a return on assets of 4.0% and 5.4% and an operating efficiency ratio of 34.8% and 32.5% in each of the two years, respectively. We believe our profitability can be attributed to our rigorous underwriting process, strong pricing and expense discipline, operational expertise and loyal customer base.
Seasoned Management with Extensive Industry Experience
We have highly experienced employees throughout all levels of our organization. Mary McDowell, our Chief Executive Officer and President, is an accomplished financial services executive with more than 30 years of experience in consumer finance and was the 2010-2011 Chair of the American Financial Services Association, the consumer credit industry’s trade organization. Senior leadership has an average of 24 years of experience in consumer finance and an average tenure of 18 years at OneMain and/or Citi. Our branch network employees and managers hold an average tenure of 11 and 14 years, respectively, and our district managers and area directors average 19 and 24 years of experience, respectively, when looking at their combined years of service at OneMain and Citi.
Our Business and Growth Strategy
We are a leading branch-based consumer finance business in the United States, and our strategy is to enhance stockholder value by (1) maintaining our attractive profitability profile and (2) growing our business through new origination channels, capabilities and products, as follows:
Maintain Our Attractive Profitability by Focusing on Fundamental Aspects of Our Business
| • | Customer-Centric Strategy: Our customer-centric strategy is to continue to deliver responsible solutions consistent with fair lending principles to our customers to grow our market and gain market share. Improving the customer experience is the primary motivation for our investments in digital, product and service innovations. |
| • | Data-Driven, Analytical Approach to Profit Optimization: Data analysis is the core of our business engine, and the multi-decade history of consumer behavior that forms the backbone of our analytics gives us a strong competitive advantage. Our ability to link marketing activity, branch incentives, financial return and risk analytics to drive profitability forms the foundation of our strategy. We continuously improve our data collection, management and analytical capabilities to further expand growth possibilities and focus on the most profitable opportunities. |
| • | Highly Efficient and Scalable Operations: We believe that we are an industry leader in operating efficiency, and we remain diligent by continuously leveraging digital advancements and other opportunities to optimize our expense base. We test new branch models, layouts, locations and centralized support and distribution options on a regular basis to optimize employee focus on customers while maintaining efficiency. We design technology platforms for our centralized operations and branches that are scalable so that we may grow efficiently. |
| • | Diverse Funding Sources: We have the proven ability to finance our business from a variety of funding sources, including cash flows from operations and the capital markets in the form of two personal loan securitizations. |
3
Table of Contents
Grow Our Business Through New Origination Channels, Capabilities and Products
| • | Increase Personal Loan Volume through New Channels: We are growing volume by expanding outreach to new customers through physical and digital channels. On the physical front, we are focusing on customer referrals and partnerships with retailers and other institutions that cater to our core customer base. We are also growing leads through digital channels by extending our network of over 40 online partners (for example, our relationship with a leading “peer-to-peer” online lending platform), increasing volume through our dedicated online portal and leveraging channels such as social media. |
| • | Digital Sales and Service Enablement: We are developing new capabilities as part of our digital strategy to increase loan applications through all channels. We have been testing centralized capabilities to onboard new borrowers that complement our local presence and increase the volume of loans we make. These capabilities allow us to provide rapid response times to customers from both physical and digital channels, for inquiries and pre-closing services. We have launched 20 fully operating “Discovery Branches” to test new technologies, operating models and processes that increase our productivity, improve the customer experience, accelerate learning and speed deployment across the network. Discovery Branch learnings, along with our investments in new account and data management systems and enhanced web capabilities, are helping us create the flexibility to originate, fund and service loans online. |
| • | Broaden Our Product Offering: We believe that we can successfully offer additional complementary financial products to our customers. In 2013, approximately 65% of our customer base purchased optional products in addition to receiving a personal loan. We may either develop additional complementary financial products ourselves or distribute them on behalf of partners. We have achieved success with these strategies in the past. Leveraging our risk expertise and extensive branch network with expanded solutions has the potential to both increase the products available to existing customers and attract new customers. |
4
Table of Contents
Industry and Market Overview
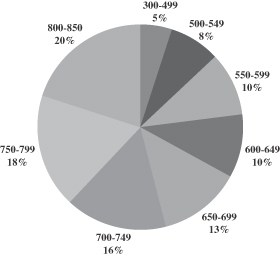
The U.S. consumer finance industry has approximately $3.1 trillion of outstanding borrowings and includes vehicle loans and leases, credit cards, student loans and personal loans. Our 1.3 million customer accounts represent a very small fraction of the approximately 115 million Americans that generally align with our customer base (FICO scores between 550 and 749). We believe that most of this population is underserved and provides an attractive market opportunity for our business.
| $3.1 Trillion Consumer Finance Industry | U.S. FICO Score Distribution | |
|
|
| |
| Sources: Federal Reserve Bank of New York; Federal Student Aid/U.S. Department of Education. As of March 2014. | Source: FICOTM Banking Analytics Blog. © Fair Issac Corporation. As of April 2014. | |
As a leading player in the highly-fragmented, non-prime consumer finance industry, we believe we are uniquely positioned to take advantage of this opportunity. Many existing consumer lenders operate at a regional level and typically have fewer than 200 branches and less than $2 billion in loans outstanding. With 1,141 branches and $8.2 billion loans outstanding as of June 30, 2014, our strategy is to maintain and expand our market share with our robust physical and online presence.
5
Table of Contents
Our History and Development
We have been operating since the founding of our predecessor, Commercial Credit Company, in 1912. Since our founding, we have grown both organically as well as through various acquisitions. Commercial Credit Company acquired Primerica in 1988, forming the Primerica Corporation, which acquired the Travelers Corporation in 1993. Following the merger of Travelers Group with Citicorp to form Citigroup Inc. in 1998, Commercial Credit was rebranded as CitiFinancial in 1999.
Prior to 2011, we were part of a larger business within Citi known as CitiFinancial North America, or CFNA, the U.S. business of which contained approximately $10 billion of personal loans and $15 billion of mortgage and real estate loans. In the middle of 2010, management decided to split the U.S. business of CFNA into two distinct business lines. OneMain, the go-forward business, retained the majority of U.S. personal loans and a portion of U.S. real estate loans. CitiFinancial Servicing was formed with the remaining portion that did not strategically align with OneMain’s go-forward origination and risk strategy. CitiFinancial Servicing was designed to support certain customers and loans that would benefit from expanded support, including loan modifications or restructurings, rather than originate loans. In effect, CitiFinancial Servicing became a liquidating business. For a discussion of the separation and how it and subsequent transactions are presented in our combined financial statements, see “Management’s Discussion and Analysis of Financial Condition and Results of Operations—Segment Overview.”
The Transactions and Our Separation from Citi
Citi currently indirectly owns 100% of our common stock. After the completion of this offering, Citi will beneficially own % of our outstanding common stock (or % if the underwriters exercise their over-allotment option in full). Prior to this offering, we expect to declare a dividend of a $ million note, which we refer to as the Dividend Note, and issue the Dividend Note to Citi. We intend to repay the Dividend Note in full (plus any accrued and unpaid interest thereon) with the proceeds of this offering.
Upon the consummation of this offering, we will enter into a number of agreements with Citi that will govern our relationship with Citi. We refer to this offering, our establishment of a fully independent capital structure and the various other transactions relating to our separation from Citi as the “Transactions.” For more information relating to the Transactions, see “Unaudited Pro Forma Combined Financial Information.” For a discussion of certain risks associated with our separation from Citi, see “Risk Factors—Risks Relating to Our Organization and Structure.”
Debt Financings
Historically, we have funded our operations through cash from our operations and funding provided by Citi. The weighted average interest rate on our historical debt was 3.7% per annum for the year ended December 31, 2013. In April 2014 and July 2014, we raised capital through two securitizations of our loan portfolio. We have started to establish a fully independent capital structure and to finance our liquidity needs from a variety of third-party debt sources. See “Management’s Discussion and Analysis of Financial Condition and Results of Operations—Liquidity and Capital Resources” and “Description of Certain Indebtedness.” As we establish a fully independent capital structure, existing debt in some cases may be replaced by higher-cost funding provided by third-party sources. Pro forma for the Transactions at June 30, 2014, our debt outstanding would have by approximately $ billion, and for the year ended December 31, 2013 and the six months ended June 30, 2014, our interest expense would have by $ million and $ million, respectively, and our cost of funds would have from % to % per annum, respectively. See “Unaudited Pro Forma Combined Financial Information,” “Management’s Discussion and Analysis of Financial Condition and Results of
6
Table of Contents
Operations—Business Trends and Conditions—Changing funding mix and increased funding costs” and “Management’s Discussion and Analysis of Financial Condition and Results of Operations—Our Separation from Citi.”
Corporate Information
Our executive offices are located at 300 St. Paul Place, Baltimore, Maryland 21202, and our telephone number is (410) 332-3000. Our website address is www.onemainfinancial.com. The information on our website is not a part of this prospectus.
Risks Affecting Us
As part of your evaluation of our company, you should consider the risks associated with our business, regulation of our business, our indebtedness, our organization and structure and this offering. These risks include:
| • | Risks relating to our business, including: (i) our ability to access adequate sources of liquidity to fund operational requirements and satisfy financial obligations; (ii) the impact of macroeconomic conditions; (iii) insufficient allowance for loan losses; (iv) our ability to successfully manage our credit risk; (v) the identification of material weaknesses and significant deficiencies in our internal control over financial reporting; (vi) historical charge-off rates that may not be predictive of future charge-off rates; (vii) the effectiveness of our risk management processes and procedures, and the accuracy of the assumptions or estimates used in our models and in preparing our financial statements; (viii) the competition in the consumer finance industry; (ix) risks and uncertainties associated with our insurance operations; (x) failures or security breaches in our or third parties’ information systems or Internet platform or disruptions in the operations of our computer systems and data centers; (xi) our transition to, and quality of, new technology platforms; (xii) our ability to protect our intellectual property; (xiii) litigation and regulatory actions; (xiv) damage to our reputation; (xv) our ability to attract, retain and motivate key officers and employees; (xvi) misconduct by our employees or third parties that we employ; (xvii) potential future geographic concentrations of our loan portfolio; (xviii) requirements to repurchase loans from purchasers of loans that we sell or securitize; (xix) our ability to implement our growth strategy and realize the value of strategic investments; (xx) our ability to successfully develop new or enhanced products; and (xxi) natural disasters, acts of war or terrorism or other external events. |
| • | Risks relating to regulation, including: (i) significant and extensive regulation, supervision and examination of, and enforcement relating to, our business by governmental authorities; (ii) impact of the Dodd-Frank Wall Street Reform and Consumer Protection Act, or the Dodd-Frank Act, and the impact of the CFPB’s regulation of our business; (iii) regulations and supervision by the Federal Reserve Board for as long as we are controlled by Citi for bank regulatory purposes; (iv) regulatory scrutiny resulting from selling loans, including charged off loans and loans where the borrower is in default; (v) the impact of state regulations in the states in which we conduct our business; (vi) regulations relating to privacy, information security and data protection; (vii) use of third-party vendors and ongoing third-party business relationships; and (viii) banking regulations that limit our business activities. |
| • | Risks relating to our indebtedness, including: (i) the size of our indebtedness, which could affect our ability to meet our obligations under our debt instruments and could impact our business; (ii) the impact of covenants in our debt instruments that may restrict our operations; (iii) the accuracy of the judgments and estimates used in assessing our liquidity; (iv) the potential impact to our funding and business resulting from a change in our credit ratings; (v) the impact of our securitizations and ability to access the securitizations market in the future; and (vi) repayment of the Dividend Note and compliance with its covenants. |
7
Table of Contents
| • | Risks relating to our organization and structure, including: (i) the interests of Citi conflicting with our interests and with those of our public stockholders, including you; (ii) the sufficiency of assets and resources that we acquire from Citi in our separation from Citi and the difficulties in separating our assets and resources from Citi in our separation from Citi; (iii) loss of some of our arrangements with Citi that existed before this offering; (iv) the impact on our business resulting from competition with Citi after this offering; (v) loss of association with Citi’s strong brand and reputation; (vi) certain of our directors experiencing conflicts of interest because of their positions with Citi; (vii) the limited liability of Citi and its directors and officers for breach of fiduciary duty to us or to you; (xiii) our combined historical financial data and pro forma combined financial data do not necessarily reflect future results; (ix) charges in connection with this offering and incremental costs of operating as a stand-alone public company; (x) the allocation of liabilities between us and Citi; (xi) our exemption from certain corporate governance requirements due to our status as a “controlled company” within the meaning of the New York Stock Exchange rules; (xii) Citi potentially selling a controlling interest in our company to a third party in a private transaction; (xiii) our reliance on our operating subsidiaries to provide us with the funds that are necessary to meet our financial obligations; (xiv) our intention to not pay dividends on our common stock in the foreseeable future; (xv) the insurance laws and regulations that may delay or impede purchases of our common stock; and (xvi) immediate dilution as a result of this offering. |
| • | Risks relating to this offering, including: (i) future sales of a substantial number of shares of our common stock; (ii) the development of an active trading market for our common stock; (iii) volatility of the price and trading volume of our common stock; (iv) resources and management attention required to meet the obligations associated with being a public company; and (v) our common stock is and will be subordinate to all of our existing and future indebtedness. |
For a discussion of these and other risks, see “Risk Factors.”
Prior to this offering, all of our outstanding common stock is indirectly owned by Citi. Citi will continue to own a majority of our outstanding common stock immediately following completion of this offering and we expect will receive $ million in connection with our repayment of the full amount due to Citi under the Dividend Note using the proceeds of this offering. If the underwriters exercise the over-allotment option, Citi will also receive all of the net proceeds from such exercise. In addition, prior to this offering we have had, and after this offering we will continue to have, numerous commercial and contractual arrangements with affiliates of Citi.
Citigroup Global Markets Inc., the sole book-running manager of this offering, is a wholly owned subsidiary of Citigroup Inc. Because Citigroup Global Markets Inc. is under common control with us and the selling stockholder, and because the selling stockholder, an affiliate of Citigroup Global Markets Inc., will receive at least 5% of the proceeds of this offering, a conflict of interest under Financial Industry Regulatory Authority, Inc., or FINRA, Rule 5121 is deemed to exist. This offering will be conducted in accordance with that rule. As required by FINRA Rule 5121, has agreed to act as the “qualified independent underwriter” for this offering and has participated in the preparation of, and has exercised the usual standards of “due diligence” in respect of, this prospectus.
See “Risk Factors—Risks Relating to Our Organization and Structure,” “Use of Proceeds” and “Underwriting—Conflicts of Interest.”
8
Table of Contents
| Common stock offered by us |
shares |
| Over-allotment option offered by Citigroup Inc. |
shares |
| Common stock to be outstanding after this offering |
shares ( shares if the underwriters exercise their over-allotment option in full) |
| Voting rights |
One vote per share |
| Use of proceeds |
We estimate that the net proceeds to us from this offering will be approximately $ million, based on an assumed public offering price of $ per share (the midpoint of the price range on the front cover of this prospectus), after deducting underwriting discounts and commissions and estimated offering expenses payable by us. We intend to use the net proceeds from this offering to repay the Dividend Note in full (plus any accrued and unpaid interest thereon). Any proceeds resulting from the exercise of the over-allotment option will be paid to Citigroup Inc., and we will receive no proceeds from the exercise of the over-allotment option. See “Use of Proceeds.” |
| Dividend policy |
We do not intend to pay dividends on our common stock. |
| New York Stock Exchange (“NYSE”) symbol |
We intend to apply to have our shares of common stock listed on the NYSE under the trading symbol “ .” |
| Risk factors |
See “Risk Factors” beginning on page 15 of this prospectus and the other information included in this prospectus for a discussion of the factors you should consider carefully before deciding to invest in shares of our common stock. |
| Controlling stockholder |
Citigroup Inc. |
Unless we specifically state otherwise, all information in this prospectus, including information regarding the number of shares of our common stock outstanding:
| • | gives effect to our Amended and Restated Certificate of Incorporation that we intend to file prior to the consummation of this offering; |
| • | assumes an initial public offering price of $ per share (the midpoint of the price range set forth on the front cover of this prospectus); and |
| • | assumes the underwriters’ option to purchase additional shares of common stock from Citi has not been exercised. |
9
Table of Contents
SUMMARY COMBINED FINANCIAL AND OTHER DATA
The following table sets forth summary combined historical financial data as of and for the six months ended June 30, 2014 and 2013 and for the years ended December 31, 2013 and 2012. The summary combined historical statement of income data for the six months ended June 30, 2014 and 2013, and the summary combined historical statement of financial position data as of June 30, 2014 presented below has been derived from our unaudited condensed combined financial statements included elsewhere in this prospectus. The summary combined historical statement of income data for the years ended December 31, 2013 and 2012 and the summary combined historical statement of financial position data as of December 31, 2013 and 2012 presented below have been derived from our audited combined financial statements included elsewhere in this prospectus.
The following table sets forth the unaudited summary pro forma combined statement of income data for the six months ended June 30, 2014 that is derived from our unaudited condensed combined financial statements included elsewhere in this prospectus and gives effect to the Transactions (as defined in “Unaudited Pro Forma Combined Financial Information”) as if each had occurred on January 1, 2013. The unaudited summary pro forma combined statement of financial position data as of June 30, 2014 is derived from our unaudited condensed combined financial statements included in this prospectus and gives effect to the Transactions as if each had occurred on June 30, 2014. The following table also sets forth unaudited summary pro forma combined statement of income data for the year ended December 31, 2013 that is derived from our audited combined financial statements included elsewhere in this prospectus and gives effect to the Transactions as if each had occurred on January 1, 2013.
The unaudited summary pro forma combined financial data below is based upon available information and assumptions that we believe are reasonable. The unaudited summary pro forma combined financial data is for illustrative and informational purposes only and is not intended to represent the actual results that would have been achieved had the Transactions each occurred on the dates indicated. The unaudited summary pro forma combined financial data should not be considered representative of our future financial condition or results of operations.
Our separation from Citi and the establishment of a fully independent capital structure will result in financial results that are materially different from those reflected in the combined historical financial data that appears in this prospectus. For an understanding of how these changes will affect our results of operations, see “Management’s Discussion and Analysis of Financial Condition and Results of Operations—Our Separation from Citi” and “Unaudited Pro Forma Combined Financial Information.”
10
Table of Contents
You should read the following summary information in conjunction with the information under “Selected Combined Historical Financial Data,” “Unaudited Pro Forma Combined Financial Information,” “Management’s Discussion and Analysis of Financial Condition and Results of Operations” and our combined financial statements and the related notes included elsewhere in this prospectus.
Condensed Combined Statements of Income Information
| Pro Forma | Historical | Pro Forma | Historical | |||||||||||||||||||||
| Six
Months Ended June 30, |
Six Months Ended June 30, |
Year Ended December 31, |
Year Ended December 31, |
|||||||||||||||||||||
| 2014 | 2014 | 2013 | 2013 | 2013 | 2012 | |||||||||||||||||||
| (in millions of dollars, except share data) | ||||||||||||||||||||||||
| Interest revenue |
$ | $ | 1,015 | $ | 986 | $ | $ | 2,019 | $ | 1,982 | ||||||||||||||
| Interest expense |
114 | 116 | 228 | 264 | ||||||||||||||||||||
|
|
|
|
|
|
|
|
|
|
|
|
|
|||||||||||||
| Net interest revenue |
901 | 870 | 1,791 | 1,718 | ||||||||||||||||||||
| Non-interest revenue |
195 | 252 | 498 | 553 | ||||||||||||||||||||
|
|
|
|
|
|
|
|
|
|
|
|
|
|||||||||||||
| Total revenue, net of interest expense |
1,096 | 1,122 | 2,289 | 2,271 | ||||||||||||||||||||
| Provision for credit losses and for benefits and claims |
294 | 352 | 701 | 850 | ||||||||||||||||||||
| Operating expenses |
355 | 378 | 743 | 790 | ||||||||||||||||||||
|
|
|
|
|
|
|
|
|
|
|
|
|
|||||||||||||
| Income from continuing operations before income taxes |
447 | 392 | 845 | 631 | ||||||||||||||||||||
| Provision for income taxes |
160 | 144 | 309 | 224 | ||||||||||||||||||||
| Net income from continuing operations |
287 | 248 | 536 | 407 | ||||||||||||||||||||
|
|
|
|
|
|
|
|
|
|
|
|
|
|||||||||||||
| Loss from discontinued operations, net of taxes |
— | — | — | — | ||||||||||||||||||||
|
|
|
|
|
|
|
|
|
|
|
|
|
|||||||||||||
| Net income |
$ | $ | 287 | $ | 248 | $ | $ | 536 | $ | 407 | ||||||||||||||
|
|
|
|
|
|
|
|
|
|
|
|
|
|||||||||||||
| Adjusted pro forma net income from continuing operations(1) |
N/A | N/A | N/A | N/A | ||||||||||||||||||||
| Weighted average shares outstanding (in thousands)(2) |
||||||||||||||||||||||||
| Basic |
N/A | N/A | N/A | N/A | ||||||||||||||||||||
| Diluted |
N/A | N/A | N/A | N/A | ||||||||||||||||||||
| Earnings per share(2) |
||||||||||||||||||||||||
| Basic |
N/A | N/A | N/A | N/A | ||||||||||||||||||||
| Diluted |
N/A | N/A | N/A | N/A | ||||||||||||||||||||
11
Table of Contents
Condensed Combined Statements of Financial Position Information
| Pro Forma | Historical | |||||||||||||||
| As of June 30, |
As of June 30, |
As of December 31, |
||||||||||||||
| 2014 | 2014 | 2013 | 2012 | |||||||||||||
| (in millions of dollars) | ||||||||||||||||
| Assets |
||||||||||||||||
| Cash and cash equivalents |
$ | $ | 291 | $ | 319 | $ | 369 | |||||||||
| Investments (at fair value) |
1,504 | 1,431 | 1,507 | |||||||||||||
| Loan receivables, net of unearned revenue and deferred cost |
8,156 | 8,575 | 8,447 | |||||||||||||
| Unearned premium and claims reserves |
(408 | ) | (416 | ) | (394 | ) | ||||||||||
| Accrued interest receivable |
84 | 92 | 114 | |||||||||||||
| Allowance for loan losses |
(604 | ) | (676 | ) | (686 | ) | ||||||||||
|
|
|
|
|
|
|
|
|
|||||||||
| Net consumer finance receivables |
7,228 | 7,575 | 7,481 | |||||||||||||
| Deferred tax assets, net |
260 | 256 | 221 | |||||||||||||
| Premises and equipment, net |
19 | 21 | 28 | |||||||||||||
| Other assets |
231 | 234 | 257 | |||||||||||||
|
|
|
|
|
|
|
|
|
|||||||||
| Total assets |
$ | $ | 9,533 | $ | 9,836 | $ | 9,863 | |||||||||
|
|
|
|
|
|
|
|
|
|||||||||
| Liabilities and Parent Equity |
||||||||||||||||
| Related-party debt |
$ | $ | 4,619 | $ | 5,894 | $ | 6,037 | |||||||||
| Long-term debt |
760 | — | — | |||||||||||||
| Insurance policy and claim reserves |
471 | 483 | 505 | |||||||||||||
| Accounts payable, accrued expenses and other liabilities |
463 | 612 | 795 | |||||||||||||
|
|
|
|
|
|
|
|
|
|||||||||
| Total liabilities |
6,313 | 6,989 | 7,337 | |||||||||||||
| Total Parent equity |
3,220 | 2,847 | 2,526 | |||||||||||||
|
|
|
|
|
|
|
|
|
|||||||||
| Total liabilities and Parent equity |
$ | $ | 9,533 | $ | 9,836 | $ | 9,863 | |||||||||
|
|
|
|
|
|
|
|
|
|||||||||
12
Table of Contents
Other Financial and Statistical Data
| Pro Forma | Historical | Pro Forma | Historical | |||||||||||||||||||||
| At and for the Six Months Ended June 30, |
At and for the Six Months Ended June 30, |
At and for the Year Ended December 31, |
At and for the Years Ended December 31, |
|||||||||||||||||||||
| 2014 | 2014 | 2013 | 2013 | 2013 | 2012 | |||||||||||||||||||
| (in millions of dollars, except ratio, share and other data) | ||||||||||||||||||||||||
| Financial Position Data |
||||||||||||||||||||||||
| Personal loan receivables |
$ | $ | 8,156 | $ | 7,792 | $ | $ | 8,112 | $ | 7,890 | ||||||||||||||
| Average personal loan receivables |
8,023 | 7,719 | 7,837 | 7,836 | ||||||||||||||||||||
| Total assets |
9,533 | 9,762 | 9,836 | 9,863 | ||||||||||||||||||||
| Average assets(3) |
9,685 | 9,813 | 9,850 | 10,231 | ||||||||||||||||||||
| Total Parent equity |
3,220 | 2,742 | 2,847 | 2,526 | ||||||||||||||||||||
| Average equity(3) |
3,034 | 2,634 | 2,687 | 2,512 | ||||||||||||||||||||
| Equity to assets(4) |
33.78 | % | 28.09 | % | 28.94 | % | 25.61 | % | ||||||||||||||||
| Debt to equity(5) |
1.67x | 2.04x | 2.07x | 2.39x | ||||||||||||||||||||
| Selected Performance Data |
||||||||||||||||||||||||
| Net income |
287 | 248 | 536 | 407 | ||||||||||||||||||||
| Net interest margin |
901 | 870 | 1,791 | 1,718 | ||||||||||||||||||||
| Efficiency ratio(6) |
32.39 | % | 33.69 | % | 32.46 | % | 34.79 | % | ||||||||||||||||
| Personal loan performance |
||||||||||||||||||||||||
| Loan yield(7) |
24.75 | % | 24.04 | % | 24.13 | % | 23.38 | % | ||||||||||||||||
| Risk-adjusted yield(8) |
18.29 | % | 17.11 | % | 17.83 | % | 17.14 | % | ||||||||||||||||
| Net charge offs |
6.46 | % | 6.92 | % | 6.30 | % | 6.24 | % | ||||||||||||||||
| 30+ days past due as a % of personal loan receivables, end of period |
3.78 | % | 3.44 | % | 4.10 | % | 4.05 | % | ||||||||||||||||
| 90+ days past due as a % of personal loan receivables, end of period |
2.12 | % | 2.00 | % | 2.42 | % | 2.42 | % | ||||||||||||||||
| Return on assets(9) |
5.98 | % | 5.10 | % | 5.44 | % | 3.98 | % | ||||||||||||||||
| Return on equity(10) |
19.08 | % | 18.99 | % | 19.95 | % | 16.20 | % | ||||||||||||||||
| Adjusted pro forma net income from continuing operations(1)(11) |
N/A | N/A | N/A | N/A | ||||||||||||||||||||
| Adjusted pro forma return on assets(1)(11)(12) |
N/A | N/A | N/A | N/A | ||||||||||||||||||||
| Adjusted pro forma return on equity(1)(11)(13) |
N/A | N/A | N/A | N/A | ||||||||||||||||||||
| Other Data |
||||||||||||||||||||||||
| Active personal loan customer accounts |
1,318,678 | 1,321,089 | 1,343,538 | 1,365,986 | ||||||||||||||||||||
| Number of branches |
1,141 | 1,158 | 1,155 | 1,222 | ||||||||||||||||||||
| (1) | We present Adjusted pro forma net income from continuing operations as a supplemental measure of our performance. This measure provides us and other interested third parties a basis to better understand our ongoing operating results on a consistent basis. We define Adjusted pro forma net income from continuing operations as pro forma net income from continuing operations giving effect to the Transactions (as defined in “Unaudited Pro Forma Combined Financial Information”) adjusted for our 2014 exit from the real estate business, as if each of the Transactions and our 2014 exit from the real estate business had occurred on January 1, 2013. We refer to (i) the transfer of our real estate portfolio to an affiliate effective January 1, 2014 and (ii) the transfer of our servicing portfolio to an affiliate on January 6, 2014 collectively as our 2014 exit from the real estate business. Adjusted pro forma net income from continuing operations should not be considered in isolation or as a substitute for net income or other income statement data prepared in accordance with GAAP. Our presentation of Adjusted pro forma net income from continuing operations below should not be construed as an inference that our future results will be unaffected by unusual or non-recurring items. The following table provides the reconciliation of our Pro forma net income from continuing operations under “Unaudited Pro Forma Combined Financial Information” to Adjusted pro forma net income from continuing operations for the periods presented: |
| Pro Forma | ||||||||
| Six Months
Ended June 30, 2014 |
Year Ended December 31, 2013 |
|||||||
| (unaudited) | ||||||||
| (in millions of dollars) | ||||||||
| Pro forma net income from continuing operations |
$ | $ | ||||||
| Adjustments: |
||||||||
| Transfer of real estate portfolio |
||||||||
| Transfer of real estate servicing portfolio |
||||||||
|
|
|
|
|
|||||
| Adjusted pro forma net income from continuing operations |
$ | $ | ||||||
|
|
|
|
|
|||||
13
Table of Contents
| (2) | Weighted average shares outstanding gives effect to our Amended and Restated Certificate of Incorporation that we intend to file prior to the consummation of this offering. |
| (3) | Average pro forma financial data gives effect to the Transactions as if they had occurred on January 1, 2013. |
| (4) | Equity to assets is the Total Parent equity divided by Total assets. |
| (5) | Debt to equity is the sum of Related-party debt, Short-term borrowings and Long-term debt divided by Total Parent equity. |
| (6) | Efficiency ratio is Operating expenses divided by Total revenue, net of interest expense. |
| (7) | Loan yield is personal loan finance charges divided by Average personal loan receivables. For six-month amounts, personal loan finance charges for the six months ended June 30, 2014 and 2013, respectively, are annualized by dividing the personal loan finance charges for such periods by the number of days elapsed in the year, and then multiplying by the number of days in the year. |
| (8) | Risk-adjusted yield is the Loan yield less Net charge offs. |
| (9) | Return on assets is Net income divided by Average total assets. For six-month amounts, Net income for the six months ended June 30, 2014 and 2013, respectively, is annualized by dividing Net income for such periods by the number of days elapsed in the year, and then multiplying by the number of days in the year. |
| (10) | Return on equity is Net income divided by Average equity. For six-month amounts, Net income for the six months ended June 30, 2014 and 2013, respectively, is annualized by dividing Net income for such periods by the number of days elapsed in the year, and then multiplying by the number of days in the year. |
| (11) | Adjusted pro forma combined financial data give effect to the Transactions and our 2014 exit from the real estate business as if each of the Transactions and the further adjustments had occurred on January 1, 2013 for amounts calculated using average financial position data. |
| (12) | Adjusted pro forma return on assets is defined as the ratio of Adjusted pro forma net income from continuing operations to Adjusted average pro forma total assets. We define Adjusted average pro forma total assets as the average pro forma total assets, adjusted for our 2014 exit from the real estate business as if each of the Transactions and the further adjustments had occurred on January 1, 2013. The following table provides the reconciliation of Average pro forma total assets to Adjusted average pro forma total assets for the periods presented. See also “Unaudited Pro Forma Combined Financial Information” for the pro forma combined statements of financial position information. |
| Pro Forma | ||||||||
| Six Months
Ended June 30, 2014 |
Year Ended December 31, 2013 |
|||||||
| (unaudited) | ||||||||
| (in millions of dollars) | ||||||||
| Average pro forma total assets |
$ | $ | ||||||
| Adjustment: |
||||||||
| Transfer of real estate portfolio |
||||||||
|
|
|
|
|
|||||
| Adjusted average pro forma total assets |
$ | $ | ||||||
|
|
|
|
|
|||||
| (13) | Adjusted pro forma return on equity is defined as the ratio of Adjusted pro forma net income from continuing operations to pro forma equity. |
14
Table of Contents
Investing in our common stock involves substantial risks. You should carefully consider the following risk factors that may affect our business, future operating results and financial condition, as well as the other information set forth in this prospectus before making a decision to invest in our common stock. If any of the following risks actually occurs, our business, financial condition or results of operations would likely be materially adversely affected. In such case, the trading price of our common stock would likely decline, and you may lose all or part of your investment.
Risks Relating to Our Business
An inability to access adequate sources of liquidity, or to do so on favorable terms, may adversely affect our capital structure and our ability to fund operational requirements and satisfy financial obligations.
We have historically funded our operations through cash from our operations and funding provided by Citi. We intend to establish a fully independent capital structure and finance our liquidity needs through various sources of third-party debt. In April 2014 and July 2014 we successfully executed two securitization transactions. As we establish an independent capital structure, existing funding from Citi in some cases may be replaced by higher-cost funding provided by third-party sources.
While financial market conditions have stabilized and, in many cases, improved since the financial crisis that began in 2008, there can be no assurance that significant disruptions, uncertainties and volatility will not occur in the future. If we do not have sufficient liquidity because we are unable to obtain access to credit or complete additional securitizations on favorable terms and in a timely manner, we may not be able to meet our obligations. If we maintain or are required to maintain too much liquidity, our business, results of operations and financial condition could be adversely affected.
The availability of financing will depend on a variety of factors such as financial market conditions generally, including the availability of credit to the financial services industry, our performance and credit ratings and the performance of our securitized portfolios. Disruptions, uncertainty or volatility in the capital or credit markets may limit our ability to obtain additional financing or refinance maturing liabilities on desired terms in a timely manner or at all. It may also be more difficult or costly for us to obtain funds when we are no longer a wholly owned subsidiary of Citi. As a result, we may be forced to delay obtaining funding or be forced to issue or raise funding on undesirable terms, which could significantly reduce our financial flexibility and cause us to contract or restrict our business growth, all of which could have a material adverse effect on our results of operations and financial conditions.
There can be no assurances that we will be able to complete additional securitizations. The extent to which we will securitize our loans in the future will depend in part upon the conditions in the securities markets in general and the consumer loan asset-backed securities market in particular, the overall credit quality of our loans, the conformity of the loans and our securitization program to rating agency requirements, the costs of securitizing our loans and the legal, regulatory, accounting and tax requirements governing securitization transactions. In the event we are unable to refinance existing asset-backed securities with new securities or there are structural and regulatory constraints on our ability to refinance these asset-backed securities with other funding, we would be required to rely on different sources for funding. A prolonged inability to securitize our loans or to refinance our asset-backed securities would have a material adverse effect on our business, liquidity, cost of funds and financial condition. In addition, following completion of this offering, it may be more difficult for us to securitize our loans if investors view us as a weaker sponsor once we are no longer wholly owned by Citi. To compensate, our future issuances of asset-backed securities may need to provide for a higher interest rate or provide additional credit enhancements. These factors may increase the costs of securitizing our loans relative to our historical costs.
15
Table of Contents
Macroeconomic conditions could have a material adverse effect on our business, our customers, results of operations, financial condition and stock price.
Key macroeconomic conditions historically have affected our business, our results of operations and financial condition and our customers and are likely to affect them in the future. While certain economic conditions in the United States have shown signs of improvement, economic growth has been slow and uneven as consumers continue to be affected by high unemployment rates, slowly recovering housing values and continuing concerns about the level of U.S. government debt and fiscal actions that may be taken to address this. A prolonged period of slow economic growth, significant deterioration in economic conditions or elevated unemployment levels would likely affect the ability of customers to pay amounts owed to us, and could have a material adverse effect on our business, results of operations and financial condition.
A substantial majority of our customers are subprime or non-prime borrowers, each of which has lower collection rates and is subject to higher loss rates than prime borrowers. Subprime and non-prime borrowers have historically been, and may in the future become, more likely to be affected, or more severely affected, by adverse macroeconomic conditions, particularly unemployment. If our borrowers default under an unsecured loan, we will bear a risk of loss of principal and if under a secured loan, we will bear this risk to the extent of any deficiency between the value of the collateral and the outstanding principal and accrued but unpaid interest of the loan, which could adversely affect our cash flow from operations. Additionally, under certain circumstances, we may be required to repurchase those loans we have securitized. See “—If our loans fail to meet certain criteria or characteristics or under other circumstances, we may be required to repurchase the loans that we sell or securitize, which could adversely affect our results of operations, financial condition and liquidity” below. The cost to service our loans may also increase without a corresponding increase in our interest income.
Macroeconomic conditions may also cause net income to fluctuate and diverge from expectations of securities analysts and investors, who may have differing assumptions regarding the impact of these conditions on our business, and this may adversely impact the trading price of our common stock.
If aspects of our business, including the quality of our borrowers, are significantly affected by economic changes or any other conditions in the future, we cannot be certain that our policies and procedures for underwriting, processing and servicing loans will adequately adapt to such changes. If we fail to adapt to changing economic conditions or other factors, or if such changes affect our borrowers’ capacity to repay their loans, our results of operations, financial condition and liquidity would be materially adversely affected.
Our risk management processes and procedures may not be effective in mitigating our risks.
We have established processes and procedures intended to identify, measure, monitor and control the types of risk to which we are subject, including credit risk, market risk, liquidity risk, strategic risk and operational risk. Credit risk is the risk of loss that arises when a borrower fails to meet the terms of a loan. Market risk is the risk of loss due to changes in external market factors such as interest rates and prepayment rates. Liquidity risk is the risk that a company’s financial condition or overall safety and soundness are adversely affected by an inability, or perceived inability, to meet funding obligations and support business growth. Strategic risk is the risk from changes in the business environment, improper implementation of decisions or inadequate responsiveness to changes in the business environment. Operational risk is the risk of loss arising from inadequate or failed processes, people or systems, external events (for example, natural disasters) or compliance, reputational or legal matters and includes those risks as they relate directly to our company as well as to third parties with whom we contract or otherwise do business. See “Management’s Discussion and Analysis of Financial Condition and Results of Operations—Quantitative and Qualitative Disclosure about Market Risk,” “Business—Credit” and “Business—Operational Controls” for additional information on the types of risks that affect our business.
16
Table of Contents
We seek to monitor and control our risk exposure through a framework that includes our risk appetite, enterprise risk assessment process, risk policies, procedures and controls, reporting requirements, credit risk culture and governance structure. Management of our risks in some cases depends upon the use of analytical and/or forecasting models, including the proprietary scoring we use to supplement FICO scores when evaluating potential borrowers. If the models that we use to manage risk are ineffective at predicting future losses or are otherwise inadequate, we may incur unexpected losses or otherwise be adversely affected. In addition, the information we use in managing our credit and other risk may be inaccurate or incomplete as a result of error or fraud, both of which may be difficult to detect and avoid. There may also be risks that exist, or that develop in the future, that we have not appropriately anticipated, identified or mitigated including when processes are changed or new products and services are introduced. If our risk management framework does not effectively identify and control our risks, we could suffer unexpected losses or be adversely affected, and that could have a material adverse effect on our business, results of operations and financial condition.
We rely extensively on models to manage many aspects of our business, and if they are not accurate or are misinterpreted, it could have a material adverse effect on our business, results of operations and financial condition.
We rely extensively on models to manage many aspects of our business, including liquidity and capital planning, customer selection, credit and other risk management, pricing, reserving and collections management. Our models, including the proprietary scoring we use to supplement FICO scores when evaluating potential borrowers, may prove in practice to be less predictive than we expect for a variety of reasons, including as a result of errors in constructing, interpreting or using the models or the use of inaccurate assumptions (including failures to update assumptions appropriately or in a timely manner). Our assumptions may be inaccurate for many reasons including that they often involve matters that are inherently difficult to predict and beyond our control (for example, macroeconomic conditions and their impact on customer behavior) and they often involve complex interactions between a number of dependent and independent variables, factors and other assumptions. The errors or inaccuracies in our models may be material and could lead us to make incorrect or sub-optimal decisions in managing our business, and this could have a material adverse effect on our business, results of operations and financial condition.
Our business depends on our ability to successfully manage our credit risk, and failing to do so may result in higher charge-off rates.
Our success depends on our ability to manage our credit risk. The models and approaches we use to manage our credit risk may not accurately predict future charge offs for various reasons discussed in the preceding risk factor.
We remain subject to conditions in the consumer finance environment, and our ability to manage credit risk and avoid higher charge-off rates also may be adversely affected by economic conditions that may be difficult to predict, such as the recent financial crisis. Although delinquencies and charge offs remained stable in 2012 and 2013, they both may increase in the future and are likely to increase materially if economic conditions deteriorate. There can be no assurance that our credit underwriting and risk management strategies will enable us to avoid higher charge-off rates, or that our allowance for loan losses will be sufficient to cover actual losses.
A customer’s ability to repay us can be negatively impacted by increases in their payment obligations to other lenders under mortgage, credit card and other loans. In addition, a customer’s ability to repay us can be negatively impacted by a restricted availability of credit to consumers generally, including reduced and closed lines of credit. Customers with insufficient cash flow to fund daily living expenses and lack of access to other sources of credit may be more likely to default on their payment obligations to us, resulting in higher losses in our portfolio. Our collection operations may not compete effectively to secure more of customers’ diminished cash flow than other competing creditors.
17
Table of Contents
Our ability to manage credit risk also may be adversely affected by legal or regulatory changes (such as bankruptcy laws and collection regulations), competitors’ actions and consumer behavior, as well as inadequate collection operations staffing, techniques, models and performance of vendors such as collection agencies.
Our allowance for loan losses may prove to be insufficient to cover losses on our loans.
We maintain an allowance for loan losses (a reserve established through a provision for losses charged to expense) that we believe is adequate to cover losses inherent in our existing portfolio. The process for establishing an allowance for loan losses is critical to our results of operations and financial condition and requires complex models and judgments, including forecasts of economic conditions. Changes in economic conditions affecting borrowers, new information regarding our loans and other factors, both within and outside of our control, may require an increase in the allowance for loan losses. We may underestimate or miscalculate our incurred losses and fail to maintain an allowance for loan losses sufficient to account for these losses. In cases where we modify a loan, if the modified loans do not perform as anticipated, we may be required to establish additional allowances on these loans.
Moreover, our regulators and independent auditors, as part of their supervisory or review and independent audit functions, periodically review our methodology, models and the underlying assumptions, estimates and assessments we use for calculating, and the adequacy of, our allowance for loan losses. For more information relating to the findings of our independent auditors, see “—If we are unable to achieve and maintain effective internal control over financial reporting, this could have a material adverse effect on our business” below. Our regulators and independent auditors, based on their judgment, may conclude that we should modify our methodology or models, increase our allowance for loan losses and/or recognize further losses.
We periodically review and update our methodology, models and the underlying assumptions, estimates and assessments we use to establish our allowance for loan losses to reflect our view of current conditions. We cannot assure you that our loan loss reserves will be sufficient to cover actual losses. Future increases in the allowance for loan losses or recognized losses (as a result of any internal review or update, regulatory guidance or otherwise) will result in a decrease in net income and capital and could have a material adverse effect on our business, results of operations and financial condition.
If we are unable to achieve and maintain effective internal control over financial reporting, this could have a material adverse effect on our business.
Effective internal controls over financial reporting are necessary for us to provide reliable financial reports and, together with adequate disclosure controls and procedures, are designed to prevent fraud or material error. Any failure to implement current internal controls or required new or improved controls, or difficulties encountered in their implementation could cause us to fail to meet our reporting obligations. Section 404 of the Sarbanes-Oxley Act of 2002, or the Sarbanes-Oxley Act, requires management of public companies to develop and implement internal controls over financial reporting and evaluate the effectiveness thereof. A material weakness is a deficiency, or a combination of deficiencies, in internal control over financial reporting such that there is a reasonable possibility that a material misstatement of our financial statements will not be prevented or detected on a timely basis. A significant deficiency is a deficiency, or a combination of deficiencies, in internal control over financial reporting that is less severe than a material weakness, yet important enough to merit attention by those responsible for oversight of our financial reporting.
In our 2011 and 2012 audits, our independent auditors identified a material weakness in the internal controls related to the methodology, accounting and management of loan loss reserves. In particular, the material weakness related to the lack of review over reserve models that showed data input errors, incorrect application of updated methodologies, inaccurate forecasting and calculation errors. The 2012 audit also identified a significant deficiency in the internal controls related to intercompany accounts not being properly reviewed and reconciled, resulting in a single accounting error where retained earnings were unintentionally recorded as a liability when OneMain and CitiFinancial Servicing were a combined entity under CFNA in 2011.
18
Table of Contents
In our 2013 audit, our independent auditors determined that progress had been made to enhance our controls and as a result, the material weakness relating to the loan loss reserves from the 2012 audit was reduced to a significant deficiency at December 31, 2013. The significant deficiency related to the documented level of precision in our process used to calculate the allowance for loan losses. We are taking action to remediate this issue and improve our loan loss methodologies and procedures, but we cannot assure you that our management of our loan loss reserves will continue to improve.
The discovery of a material weakness and the disclosure of that fact, even if quickly remedied, could reduce the market value of shares of our common stock. Additionally, the existence of any material weakness or significant deficiency requires management to devote significant time and incur significant expense to remediate any such material weaknesses or significant deficiency and management may not be able to remediate any such material weaknesses or significant deficiency in a timely manner. Undetected material weaknesses in our internal controls could lead to financial statement restatements, which could have a material adverse effect on our business, financial condition and results of operation.
Our historical charge-off rates may not be predictive of our future charge-off rates.
Our historical net charge-off and delinquency rates may not be predictive of our future net charge-off and delinquency rates. Prior to 2011, we were part of a larger business within Citi known as CFNA. CitiFinancial Servicing, a business designed to support certain customers and loans that would benefit from expanded support, including loan modifications or restructurings rather than originate loans, was split from us and is reflected in discontinued operations in our combined financial statements for the year ended December 31, 2011. Therefore, our financial results do not reflect the CitiFinancial Servicing charge-off rates.
In addition, approximately 84%, or $6.9 billion, of our loans as of June 30, 2014, were originated since the start of 2012. In general, loans do not begin to show signs of credit deterioration or default until they have been outstanding for some period of time, a process we refer to as “seasoning.” As a result, a portfolio of older loans will usually behave more predictably than a portfolio of newer loans. Furthermore, we have experienced extremely favorable credit conditions over the past three years.
As we seek to originate personal loans that maximize profitability in each state in which we operate, from time to time we will adjust our risk and loss tolerance to achieve our profitability goals. We believe that our net charge-off rates and 30+ day delinquency rates may increase in the near to mid-term as we increase our risk and loss tolerance in geographies where we have had additional pricing opportunities. If we have been or are unable to appropriately price risk or adjust for the factors described above or other factors that could affect the performance of our loan portfolio, our net charge-off and delinquency rates may increase at a rate that is not offset by higher finance charges and interest, in which case our results of operation and financial condition may be adversely affected.
If assumptions or estimates we use in preparing our financial statements are incorrect or are required to change, our reported results of operations and financial condition may be adversely affected.
We are required to use certain assumptions and estimates in preparing our financial statements under U.S. Generally Accepted Accounting Principles, or GAAP, including in determining allowances for loan losses, fair value of financial instruments, asset impairment, reserves related to litigation and other legal matters, valuation of income and other taxes and regulatory exposures. In addition, significant assumptions and estimates are involved in determining certain disclosures required under GAAP, including those involving the fair value of our financial instruments. If the assumptions or estimates underlying our financial statements are incorrect, the actual amounts realized on transactions and balances subject to those estimates will be different, and this could have a material adverse effect on our results of operations and financial condition.
In addition, the Financial Accounting Standards Board, or FASB, is currently reviewing or proposing changes to several financial accounting and reporting standards that govern key aspects of our financial
19
Table of Contents
statements, including areas where assumptions or estimates are required. As a result of changes to financial accounting or reporting standards, whether promulgated or required by the FASB or other regulators, we could be required to change certain of the assumptions or estimates we previously used in preparing our financial statements, which could negatively impact how we record and report our results of operations and financial condition generally. For additional information on the key areas for which assumptions and estimates are used in preparing our financial statements, see “Management’s Discussion and Analysis of Financial Condition and Results of Operations—Critical Accounting Policies and Estimates” and Note 2 (Summary of Significant Accounting Policies) of our audited combined financial statements.
Competition in the consumer finance industry may adversely affect our ability to originate new loans.
The consumer finance industry is fragmented but also highly competitive. We compete with other consumer finance companies as well as other types of financial institutions such as national, regional and community banks, credit unions and online lending platforms that offer products similar to those that we offer. Some of these competitors may have considerably greater financial, technical and marketing resources than we do. Some competitors may also have a lower cost of funds, greater access to funding sources or other competitive advantages relative to us. These competitive pressures may adversely affect our ability to originate new loans and that could have a material adverse effect on our business, results of operations and financial condition.
Our decentralized branch system, and in particular our need to staff each of our branches with qualified personnel, may pose risks to our underwriting, servicing and collections processes.
We conduct significant operations through our branch offices, including key parts of the underwriting process. In processing a customer’s request for a loan, we rely on certain inputs and verifications in the underwriting process to be performed by individual personnel at the branch level. There can be no assurance that we will be able to attract and retain qualified personnel to perform these tasks. Limited staffing, and the resulting need to validate data elements remotely, may result in scenarios where fraud is not as readily detected, and also may result in heightened exposure to the possibility of employee misconduct. All approved loan applications require an in-person meeting at one of our branch offices to close on a loan. Our typical branch model averages 3.5 employees per branch, however in certain regions and under certain circumstances, there may be fewer employees present in the branch office. As a result of these staffing limitations, it may not always be possible for two of our employees to be present at the closing of a loan. If only a single employee is present at any such closing, this could result in heightened vulnerability to fraud risk.
In addition, our branches serve as an important component of our ongoing servicing and collections processes. Primary responsibility for servicing and collections processes resides with local branches until a loan is 60 days delinquent. Loan servicing is performed at the branch level and therefore requires a certain minimal level of staffing and accurate data inputs, such as ensuring accurate payment application, recognizing and recording customers’ requests for no further contact, keeping records of collection activities and, to the extent applicable, maintaining servicing-related documents (for example, deferments, adjustments of terms and customer correspondence). Consequently, the decentralized servicing model is vulnerable to errors that could affect any or all of the tasks required to service a loan. Furthermore, we seek to contact customers with delinquent loan balances soon after the loan becomes delinquent because historically, when collection efforts begin at an earlier stage of delinquency, there is a greater likelihood that the applicable loan will not be charged off (though there is no assurance that such historical trend will continue). Consequently, during periods of increased delinquencies, it becomes extremely important that our branches are properly staffed and trained to take appropriate action in an effort to bring the delinquent balance current and ultimately avoid the loan becoming charged off. If we are unable to attract and retain qualified credit and collection personnel, and maintain workloads for our collections personnel at a manageable level, it could result in increased delinquencies and charge offs on our loans.
20
Table of Contents
Our insurance operations are subject to a number of risks and uncertainties, including claims, underwriting risks and dependence on a primary distribution channel.
Insurance claims and policyholder liabilities are difficult to predict and may exceed the related reserves set aside for claims (losses) and associated expenses for claims adjudication (loss adjustment expenses). Additionally, events such as pandemic disease and prolonged economic downturns could adversely affect our financial condition or results of operations. Other risks relating to our insurance operations include changes to laws and regulations applicable to us, as well as changes to the regulatory environment. Examples include changes to laws or regulations affecting capital and reserve requirements; frequency and type of regulatory monitoring and reporting; consumer privacy, use of customer data and data security; benefits or loss ratio requirements; insurance producer licensing or appointment requirements; and required disclosures to consumers. Moreover, our insurance companies are highly dependent on our lending operations for their source of business and product distribution. If our lending operations discontinue offering insurance products, including as a result of regulatory requirements, our insurance operations would have significantly reduced distribution opportunity for their products.
Failures or security breaches in our information systems or Internet platform, in the information systems of third parties or in our branches or destruction of physical records could adversely affect our reputation and could subject us to significant costs and regulatory penalties.
Our operations rely heavily on the secure processing, storage and transmission of confidential customer and other information in our computer systems and networks. Each branch office and our Internet application portal is part of an electronic information network that is designed to permit us to originate, service and trace collections and perform other tasks that are part of our everyday operations. Our computer systems, software and networks may be vulnerable to breaches, unauthorized access, misuse, computer viruses or other malicious code that could result in disruption to our business or the loss or theft of confidential information, including customer information. Any failure, interruption or breach in our cyber security, including any failure of our back-up systems or failure to maintain adequate security surrounding customer information, could result in reputational harm, disruption in the management of our customer relationships or the inability to originate, process and service our loans. Further, any of these cyber security and operational risks could result in a loss of customer business, subject us to additional regulatory scrutiny or expose us to lawsuits by customers for identity theft or other damages resulting from the misuse of their personal information and possible financial liability, any of which could have a material adverse effect on our results of operations, financial condition and liquidity. Regulators may also impose penalties or require remedial action if they identify weaknesses in our security systems, and we may be required to incur significant costs to increase our cyber security to address any vulnerabilities that may be discovered or to remediate the harm caused by any security breaches.
As part of our business, and pursuant to applicable law, we may share confidential customer information and proprietary information with customers, vendors, service providers and business partners. The information systems of these third parties may be vulnerable to security breaches and we may not be able to ensure that these third parties have appropriate security controls in place to protect the information we share with them. If our proprietary or confidential customer information is intercepted, stolen, misused or mishandled while in possession of a third party, it could result in reputational harm to us, loss of customer business and additional regulatory scrutiny, and it could expose us to civil litigation and possible financial liability, any of which could have a material adverse effect on our results of operations, financial condition and liquidity. Although we have insurance that is intended to cover certain losses from such events, there can be no assurance that such insurance will be adequate or available.
Our branch offices have physical customer records necessary for day-to-day operations that contain extensive confidential information about our customers, including financial and personally identifiable information. We also retain physical and electronic records in various storage locations outside of our branch offices. The loss or theft of customer information and data from our branch offices or other storage locations could subject us to additional regulatory scrutiny and penalties, and could expose us to civil litigation and
21
Table of Contents
possible financial liability, which could have a material adverse effect on our results of operations, financial condition and liquidity. In addition, if we cannot locate original documents (or copies, in some cases), we may not be able to collect on the loans for which we do not have documents.
Our credit insurance operations share the same security and privacy concerns as our lending operations. In addition, our insurance operations are subject to compliance with state insurance privacy regulations and federal law in the form of the Health Insurance Portability and Accountability Act of 1996, or HIPAA. Among other things, HIPAA establishes strict privacy standards for the use and disclosure of individuals’ health information. One of the goals of HIPAA is to assure individuals’ health information is properly protected. The insurance operation has implemented the necessary systemic controls, policies and procedures to ensure compliance with HIPAA, and does not share any individual’s health information collected during the claims process. The Office for Civil Rights within the Health and Human Services Department is responsible for implementing and enforcing the HIPAA privacy rules and should violations be found, we may be subject to civil monetary penalties and may have to incur remediation costs.
Disruptions in the operation of our computer systems and data centers could have a material adverse effect on our business.
Our technology systems are a critical component of our business. Our ability to deliver products and services to our customers and operate our business in compliance with applicable laws depends on the efficient and uninterrupted operation of our computer systems and data centers, as well as those of our third-party service network providers. These computer systems and data centers may encounter service interruptions at any time due to system, network or software failure, operator negligence or improper operation by employees, physical or electronic loss of data or security breaches, computer viruses, natural disasters or other reasons. In particular, given that we currently maintain records of loans by hard copy only, our employees may inadvertently lose records that could ultimately result in the potential breach of our customers private information. In addition, the implementation of technology changes and upgrades to maintain current and integrate new systems may also cause service interruptions, transaction processing errors and system conversion delays and may cause our failure to comply with applicable laws. Any failure of our systems due to any of these causes, if not supported by our disaster recovery plan, could cause an interruption in operations and could have a material adverse effect on our business.
Following this offering, we will migrate, and in some cases, establish with third parties, key parts of our technology infrastructure. These infrastructure changes may cause disruptions, systems interruptions, transaction processing errors and system conversion delays. For the duration of the transition services agreement with Citi or until we complete our transition to our own system, whichever is earlier, Citi will provide certain services to us relating to technology and business processes. The complexities of these arrangements, the services provided and the transition to independent operations could result in unanticipated expenses, disruptions to our operations and other adverse consequences, all of which could have a material adverse effect on our business.
Our transition to, and quality of, new technology platforms may not meet expectations and may hinder us from making technological improvements as quickly as some of our competitors, which could harm our ability to compete with our competitors and adversely affect our results of operations, financial condition and liquidity.
The financial services industry is undergoing rapid technological changes, with frequent introductions of new technology-driven products and services. The effective use of technology increases efficiency and enables financial and lending institutions to better serve customers and reduce costs.
We intend to consolidate customer data from our current origination system and account management platform into a hosted third-party consolidated repository to be used by our finance, marketing and risk management reporting teams. Given the complexity and significance of this proposed transition, including the
22
Table of Contents
large volume of customer data within our systems that will need to be accessed, consolidated and migrated, our customer relationships, reputation and overall business could be severely damaged if the consolidation and migration is poorly executed. Furthermore, we will partner with third parties to coordinate the consolidation and migration of the customer data and to manage our new technology platform going forward, therefore exposing us to a risk that such third parties do not successfully perform the tasks necessary for a successful consolidation and migration of customer data and management of the platform thereafter. In addition, we expect to incur additional expenses as a result of our near-term plans to run dual technology platforms as we implement our new technology platform while maintaining our existing technology platform, and if we experience any delay or technical problems as a result of moving, we may incur greater expenses than anticipated.
Our future success will depend, in part, upon our ability to address the needs of our customers by using technology to provide products and services that will satisfy customer demands for convenience, as well as to create additional efficiencies in our operations. We expect that new technologies and business processes applicable to the consumer finance industry will continue to emerge, and these new technologies and business processes may be better than those we currently use. We cannot assure you that we will be able to sustain our investment in new technology, and we may not be able to effectively implement new technology-driven products and services as quickly as some of our competitors or be successful in marketing these products and services to our customers. Failure to successfully keep pace with technological change affecting the financial services industry could cause disruptions in our operations, harm our ability to compete with our competitors and adversely affect our results of operations, financial condition and liquidity.
If we are alleged to have infringed upon the intellectual property rights owned by others or are not able to manage and protect our intellectual property, our business and results of operations could be adversely affected.
Competitors or other third parties may allege that we, or consultants or other third parties retained or indemnified by us, infringe on their intellectual property rights. We also may face allegations that our employees have misappropriated intellectual property of their former employers or other third parties. Given the complex, rapidly changing and competitive technological and business environment in which we operate, and the potential risks and uncertainties of intellectual property-related litigation, an assertion of an infringement claim against us may cause us to spend significant amounts to defend the claim (even if we ultimately prevail), pay significant money damages, lose significant revenues, be prohibited from using the relevant systems, processes, technologies or other intellectual property, cease offering certain products or services, or incur significant license, royalty or technology development expenses. Moreover, it has become common in recent years for individuals and groups to purchase intellectual property assets for the sole purpose of making claims of infringement and attempting to extract settlements from companies like ours. Even in instances where we believe that claims and allegations of intellectual property infringement against us are without merit, defending against such claims is time consuming and expensive and could result in the diversion of time and attention of our management and employees. In addition, although in some cases a third party may have agreed to indemnify us for such costs, such indemnifying party may refuse or be unable to uphold its contractual obligations.
Moreover, we rely on a variety of measures to protect our intellectual property and proprietary information, including copyrights, trademarks, trade secrets and controls on access and distribution. These measures may not prevent misappropriation or infringement of our intellectual property or proprietary information and a resulting loss of competitive advantage, and in any event, we may be required to litigate to protect our intellectual property and proprietary information from misappropriation or infringement by others, which is expensive, could cause a diversion of resources and may not be successful. Third parties may challenge, invalidate or circumvent our intellectual property, or our intellectual property may not be sufficient to provide us with competitive advantages. For example, words contained in our trademarks and trade names (including the phrase “One Main”) are also found in the trade names and trademarks of a significant number of third parties. This has resulted in, and may in the future result in, challenges to our ability to use our trademarks and trade names in particular geographical areas or lines of business. Such challenges could impede our future expansion into new geographic areas or lines
23
Table of Contents
of business and could limit our ability to realize the full value of our trademarks and trade names. We may have to litigate to enforce or determine the scope and enforceability of our intellectual property rights, which is expensive, could cause a diversion of resources and may not prove successful. Existing use by others of trademarks and trade names that are similar to ours could limit our ability to challenge third parties when their use of such marks or names may cause consumer confusion, negatively affect consumers’ perception of our brand and products or dilute our brand identity.
Our competitors or other third parties may also independently design or develop similar technology, or otherwise duplicate our services or products such that we could not assert our intellectual property rights against them. In addition, our contractual arrangements may not effectively prevent disclosure of our intellectual property or confidential and proprietary information or provide an adequate remedy in the event of an unauthorized disclosure. The loss or diminution of our intellectual property protection or the inability to obtain third-party intellectual property could harm our business and ability to compete.
Litigation and regulatory actions could subject us to significant fines, penalties, judgments and/or requirements resulting in increased expenses.
In the normal course of business, from time to time, we have been named as a defendant in various legal actions, including arbitrations, class actions and other litigation, arising in connection with our business activities. Certain of the legal actions include claims for substantial compensatory and/or punitive damages, or claims for indeterminate amounts of damages. In addition, while the arbitration provision in our customer agreements historically has limited our exposure to consumer class action litigation, there can be no assurance that we will be successful in enforcing our arbitration clause in the future. There may also be legislative, administrative or regulatory efforts to directly or indirectly prohibit the use of pre-dispute arbitration clauses, including by the Consumer Financial Protection Bureau, or the CFPB, or we may be compelled as a result of competitive pressure or reputational concerns to voluntarily eliminate pre-dispute arbitration clauses. Recently, the Department of Justice has brought actions against financial institutions under the Financial Institutions Reform, Recovery and Enforcement Act of 1989, or FIRREA. Under FIRREA, the Department of Justice may obtain civil penalties for fraudulent conduct.
We are also involved, from time to time, in reviews, investigations and proceedings (both formal and informal) by governmental agencies regarding our business, or collectively, regulatory matters, which could subject us to significant fines, penalties, obligations to change our business practices or other requirements resulting in increased expenses, diminished income and damage to our reputation. The current environment of additional regulation, increased regulatory compliance efforts and enhanced regulatory enforcement has resulted in significant operational and compliance costs and may prevent or make it less attractive for us to continue providing certain products and services. There is no assurance that these governmental actions will not, in the future, affect how we conduct our business and in turn have a material adverse effect on our business, results of operations and financial condition.
We contest liability and/or the amount of damages as appropriate in each pending matter. The outcome of pending and future matters could be material to our results of operations, financial condition and cash flows depending on, among other factors, the level of our earnings for that period, and could adversely affect our business and reputation. For a discussion of certain legal proceedings, see Note 16 (Contingencies) to our audited combined financial statements.
Damage to our reputation could negatively impact our business.
Recently, financial services companies have been experiencing increased reputational risk as consumers take issue with certain of their practices or judgments. Maintaining a positive reputation is critical to our attracting and retaining customers, investors and employees. Harm to our reputation can arise from many sources, including employee misconduct, misconduct by outsourced service providers or other counterparties,
24
Table of Contents
litigation or regulatory actions, failure by us to meet minimum standards of service and quality, inadequate protection of customer information, and compliance failures. Negative publicity regarding us (or others engaged in a similar business or activities) or Citi, whether or not accurate, may damage our reputation, which could have a material adverse effect on our business, results of operations and financial condition.
Our business could be adversely affected if we are unable to attract, retain and motivate key officers and employees.
Our success depends, in large part, on our ability to retain, recruit and motivate key officers and employees. Our senior management team has significant industry experience and would be difficult to replace. We may not be able to attract and retain qualified personnel to replace or succeed members of our senior management team or other key personnel following the completion of this offering or at any other time. Rules implementing the executive compensation provisions of the Dodd-Frank Wall Street Reform and Consumer Protection Act, or the Dodd-Frank Act, may limit the type and structure of compensation arrangements that we may enter into with our most senior executives. These restrictions could negatively impact our ability to compete with other companies in recruiting, retaining and motivating key personnel. Failure to retain talented senior leadership could have a material adverse effect on our business, results of operations and financial condition.
Employee misconduct or misconduct by third parties we employ could harm us by subjecting us to monetary loss, significant legal liability, regulatory scrutiny and reputational harm.
Our reputation is critical to maintaining and developing relationships with our existing and potential customers and third parties with whom we do business. There is a risk that our employees or third parties that we employ could engage in misconduct that adversely affects our business. For example, if an employee or a third party that we employ were to engage in, or be accused of engaging in, illegal or suspicious activities including fraud or theft, we could suffer direct losses from the activity, and in addition we could be subject to regulatory sanctions and suffer serious harm to our reputation, financial condition, customer relationships, and ability to attract future customers. Employee or third-party misconduct could prompt regulators to allege or to determine based upon such misconduct that we have not established adequate supervisory systems and procedures to inform employees of applicable rules or to detect and deter violations of such rules. Our branches have experienced employee fraud from time to time, and it is not always possible to deter employee or third-party misconduct. The precautions we take to detect and prevent misconduct may not be effective in all cases. Misconduct by our employees or by third parties that we employ, or even unsubstantiated allegations of misconduct, could result in a material adverse effect on our reputation and our business.
The geographic distribution of our loan portfolio may increase the risk of delinquencies and charge-offs on our loans.
Certain geographic concentrations of our loan portfolio may increase as we adjust our risk and loss tolerance and strategy to achieve our profitability goals. Any geographic concentration may expose us to an increased risk of loss if that geographic region experiences low employment rates, natural disasters or weak economic conditions. Certain regions of the United States from time to time will experience weaker economic conditions and higher unemployment and, consequently, loans originated in such regions will experience higher rates of delinquency and loss than on similar loans nationally. In addition, natural disasters in specific geographic regions may result in higher rates of delinquency and loss in those areas. In the event that a significant portion of our loans are originated in states where weak economic conditions, low employment rates or natural disasters affect such states in particular, it could adversely impact the delinquency and default rates of our loan pool.
We are more susceptible to fluctuations and risks particular to U.S. consumer credit than a more diversified company. For example, our business is particularly sensitive to macroeconomic conditions that affect the U.S. economy, consumer spending and consumer credit, as well as risks associated with increased regulations and legal and other regulatory actions targeted at consumer credit or the specific products that we offer.
25
Table of Contents
If our loans fail to meet certain criteria or characteristics or under other circumstances, we may be required to repurchase the loans that we sell or securitize, which could adversely affect our results of operations, financial condition and liquidity.
To date, we have completed two securitizations of our personal loan portfolio. The documents governing our securitizations contain provisions that require us to repurchase loans under certain circumstances. While our securitization documents vary, they contain customary provisions that require us to repurchase loans if our representations and warranties concerning loan quality, originations, underwriting and servicing techniques and circumstances are inaccurate or not complied with. We believe that many holders of our loans are particularly aware of the conditions under which originators must repurchase loans and would likely enforce any repurchase remedies that they may have.
We face significant risks in implementing our growth strategy, some of which are outside our control.
We intend to grow our business through new origination channels, capabilities and products. Our ability to execute this growth strategy is subject to significant risks, some of which are beyond our control, including:
| • | the inherent uncertainty regarding general economic conditions; |
| • | our ability to obtain adequate financing for our expansion plans; |
| • | the prevailing laws and regulatory environment of each state in which we operate or seek to operate, and, to the extent applicable, federal laws and regulations, which are subject to change at any time; |
| • | the degree of competition in new markets and its effect on our ability to attract new customers; |
| • | our ability to recruit qualified personnel, in particular in areas where we face a great deal of competition; and |
| • | our ability to obtain and maintain approvals from Citi under the stockholder’s agreement that we will enter into with Citi prior to this offering, or the Stockholder’s Agreement, or any regulatory approvals, government permits, or licenses that may be required on a timely basis. |
As part of our strategy to grow our business, we may also execute strategic acquisitions or partnerships or make other strategic investments in businesses, products, technologies or platforms to enhance or grow our business. These strategic investments may also present integration, technical, legal, regulatory or other challenges that we may not be able to manage effectively. The planning and integration of an acquisition, partnership or investment may divert employee time and other resources which could impair our ability to focus on our business.
We may not be able to execute our growth strategy due to lack of acceptance by partners, customers or employees, higher than forecasted costs, lengthy transition periods, synergies or savings not being realized and a variety of other factors. This may result in a delay or unrealized benefit, or in some cases, increased costs or other unforeseen risks to our business.
We may be unable to successfully develop and commercialize new or enhanced products.
A key part of our strategy is to broaden our product offerings, but realizing benefits from this strategy is uncertain. We may not be permitted to broaden our product offerings due to regulatory or other constraints. We may not assign the appropriate level of resources, priority or expertise to the development and commercialization of new products. Our success will be dependent on factors such as partner and customer acceptance, adoption and usage, competition, the effectiveness of marketing programs, the availability of appropriate technologies and business processes and regulatory approvals. Success of a new product, service or enhancement also may depend upon our ability to deliver it on a large scale, which may require a significant investment. In any event, we may not realize the benefit of new products for many years or competitors may introduce more compelling products,
26
Table of Contents
services or enhancements. Our failure to successfully develop and commercialize new or enhanced products could have a material adverse effect on our business, results of operations and financial condition.
Natural disasters, acts of war or terrorism or other external events could significantly impact our business.
A significant natural disaster, such as an earthquake, fire, power outage, flood or other catastrophic event, widespread disease or pandemics, acts of war or terrorism or other adverse external events could have a significant impact on our ability to conduct business. In addition, such events could impair the ability of borrowers to repay outstanding loans, cause significant property damage, result in loss of revenue, impair our portfolio performance and ability to service and collect receivables, or cause us to incur additional expenses. The occurrence of such events in the United States and the political and/or military response to any such events may have an adverse effect on general economic conditions, consumer and business confidence and general market liquidity. The occurrence of any of these events in the future could have a material adverse effect on our business, financial condition or results of operations.
Risks Relating to Regulation
Our business is subject to extensive government regulation, supervision, examination and enforcement, which could adversely affect our business, results of operations and financial condition.
Our business, including our relationships with our customers and certain third-party vendors, is subject to extensive regulation, supervision and examination under U.S. federal and state laws and regulations. These laws and regulations cover all aspects of our business, including lending practices, treatment of our customers, customer privacy and information security, transactions with affiliates and conduct and qualifications of personnel. As a subsidiary of a bank holding company, we are subject to extensive regulation, supervision and examination by the Board of Governors of the Federal Reserve System, or the Federal Reserve Board. We are also currently and in the future may be regulated by the CFPB.
New laws or regulations or policy changes in enforcement practices of existing laws or regulations applicable to our businesses may be imposed, which could adversely impact our profitability, limit our ability to continue existing or pursue new business activities, require us to change certain of our business practices or alter our relationships with customers, affect retention of our key personnel, or expose us to additional costs (including increased compliance costs). These changes may also require us to invest significant management attention and resources to make any necessary changes and could adversely affect our business, results of operations and financial condition. For example, the CFPB has broad authority over the businesses in which we engage, including authority over the actions taken by third parties that we hire. In the past, when third parties that we have contracted with did not adequately perform their contractual obligations for us, we experienced administrative difficulty, negative press and increased scrutiny from the CFPB. See “—The CFPB is a new agency, and there continues to be uncertainty as to how the agency’s actions will impact our business” below.
Loans must comply with applicable federal and state consumer protection laws. If any of our loans do not comply with such laws, those loans may be invalid or unenforceable. Therefore, any violation of such laws or any allegations of such a violation with respect to a loan could result in our modifying our methods of doing business which would impair our ability to make loans and could adversely affect our business, results of operations and financial condition.
We are also subject to potential enforcement, supervisions and other actions that may be brought by state attorneys general or other state enforcement authorities and other governmental agencies. Any such actions could subject us to civil money penalties, customer remediation and increased compliance costs, as well as damage our reputation and brand and could limit or prohibit our ability to offer certain products and services or engage in certain business practices. For a discussion of risks related to actions or proceedings brought by regulatory agencies, see “Risks Relating to Our Business—Litigation and regulatory actions could subject us to significant fines, penalties, judgments and/or requirements resulting in increased expenses.”
27
Table of Contents
The CFPB is a new agency, and there continues to be uncertainty as to how the agency’s actions will impact our business.
The CFPB, which commenced operations in July 2011, has broad authority over the businesses in which we engage to prevent “unfair, deceptive or abusive acts or practices” through its regulatory, supervisory and enforcement authority. This includes authority to write regulations under federal consumer financial protection laws, to examine certain financial institutions, including us, for compliance with such laws and to enforce those laws. The CFPB is authorized to remediate violations of consumer protection laws in a number of ways, including collecting civil money penalties and fines and providing for customer restitution.
There continues to be uncertainty as to how the CFPB’s strategies and priorities, including in both its examination and enforcement processes, will impact our businesses and our results of operations going forward. Actions by the CFPB could result in requirements to alter or cease offering affected products and services, making them less accessible to our customers and restricting our ability to offer them.
If the CFPB changes regulations that were adopted in the past by other regulators and then transferred to the CFPB by the Dodd-Frank Act, modifies through supervision or enforcement past related regulatory guidance or interprets existing regulations in a different or stricter manner than they have been interpreted in the past by us, the industry or other regulators, our compliance costs, risk of additional enforcement actions, fines, penalties and litigation exposure could increase. If future regulatory or legislative restrictions or prohibitions are imposed that affect our ability to offer certain of our products or require us to make significant changes to our business practices, and we are unable to develop compliant alternatives with acceptable returns, these restrictions could have a material adverse impact on our financial condition and results of operations.
The Dodd-Frank Act authorizes state officials to enforce regulations issued by the CFPB and to enforce the Dodd-Frank Act’s general prohibition against unfair, deceptive or abusive practices. This could make it more difficult than in the past for federal financial regulators to declare state laws that differ from federal standards to be preempted. To the extent that states enact requirements that differ from federal standards or state officials and courts adopt interpretations of federal consumer laws that differ from those adopted by the CFPB, we may be required to alter or cease offering products or services in some jurisdictions, which would increase compliance costs, we may be subject to a higher risk of state enforcement actions.
To date, the CFPB has indicated a strong interest in debt collection practices, sales of ancillary products and servicing transfers and customer complaints, which may impact our ability to originate and collect loans. The CFPB and other regulators recently have brought enforcement actions against lenders for the sale of certain ancillary products, such as debt protection products that cancel or suspend a borrower’s monthly payment or total indebtedness if certain life events occur. Regulators have questioned such products’ value and the tactics used by the lender to sell these bundled products. The optional credit insurance products that we offer have some similar benefits as debt protection products and are largely subject to state regulation such as state mandated loss ratios, premium rates, sales disclosures and free look periods. Although we have established sales practices that typically go beyond current state law requirements, the CFPB or other regulators may challenge our sales practices in regard to optional credit insurance or some other ancillary products.
As a result of the creation of the CFPB, and other changes occurring in the regulatory environment, the amount of fees and interest we collect, the number of optional products we sell and the number of new loans we originate could decrease, which could have a material adverse effect on our results of operations and financial condition.
The Dodd-Frank Act has had, and may continue to have, a significant impact on our business, financial condition and results of operations.
The Dodd-Frank Act, which, among other provisions, established the CFPB, was enacted on July 21, 2010. While certain provisions in the Dodd-Frank Act were effective immediately, many of the provisions require
28
Table of Contents
implementing regulations to be effective. The Dodd-Frank Act and regulations promulgated thereunder have had, and may continue to have, a significant adverse impact on our business, results of operations and financial condition. For example, the Dodd-Frank Act and related regulations restrict certain business practices, impose additional costs on us (including increased compliance costs and increased costs of funding raised through the issuance of asset-backed securities), limit the fees we can charge for services and affect the value of our assets. The Dodd-Frank Act also may adversely affect the securitization market because it requires, among other things, that a securitizer generally retain not less than 5% of the credit risk for certain types of securitized assets that are transferred, sold, or conveyed through issuance of asset-backed securities. These changes could result in additional costs or limit our ability to securitize loans. For a description of certain other provisions of the Dodd-Frank Act and other legislative and regulatory developments see “Business—Regulation.” Federal agencies continue to promulgate regulations to implement the Dodd-Frank Act, and these regulations may continue to have a significant adverse impact on our business, financial condition and results of operations.
Many provisions of the Dodd-Frank Act require the adoption of additional rules to implement. In addition, the Dodd-Frank Act mandated multiple studies, many of which resulted in additional legislative or regulatory action, and the CFPB has also been mandated to execute further studies. For example, in December 2013 the CFPB published preliminary research on the use of pre-dispute arbitration clauses and it is in the process of preparing a statutorily mandated report to be delivered to Congress. As a result, the ultimate impact of the Dodd-Frank Act and its implementing regulations remains unclear and could have a material adverse effect on our business, results of operations and financial condition.
Because we are controlled by Citi we are subject to banking regulations and additional regulatory scrutiny.
Citi’s relationship and good standing with its regulators are important to the conduct of our business. Citi is a bank holding company and a “financial holding company” regulated by the Federal Reserve Board under the Bank Holding Company Act of 1956, or the BHC Act. The BHC Act imposes regulations and requirements on Citi and on any company that the Federal Reserve Board deems to be controlled by Citi. Because we are controlled by Citi, we are currently subject to regulation, supervision, examination and potential enforcement action by the Federal Reserve Board. Following this offering, we will continue to be controlled by Citi for bank regulatory purposes and, therefore, we will continue to be subject to regulation by the Federal Reserve Board and to most banking laws, regulations and orders that apply to Citi. The regulation of Citi and its controlled companies under applicable banking laws is intended primarily for the protection of Citi’s banking subsidiaries, their depositors, the deposit insurance fund of the Federal Deposit Insurance Corporation, or the FDIC, and the banking system as a whole, rather than for the protection of stockholders or creditors of Citi or us. For example, for as long as we are controlled by Citi, regulations will limit the ability of bank subsidiaries of Citi to extend credit to, or conduct other transactions with, us.
We will remain subject to this regulatory regime until Citi is no longer deemed to control us for bank regulatory purposes, which may not occur until Citi has significantly reduced its ownership interest in us. The ownership level at which the Federal Reserve Board would consider us no longer controlled by Citi will depend on the circumstances at that time (such as the extent of our relationships with Citi) and could be less than 5%.
Citi and its subsidiaries are also subject to examination by various banking regulators, which results in examination reports and ratings that may adversely impact the conduct and growth of our businesses. In the United States, Citi is regulated by the Federal Reserve Board, the Office of the Comptroller of the Currency and the FDIC, and we are regulated by the Federal Reserve Board. The Federal Reserve Board has broad enforcement authority over us, including the power to prohibit us from conducting any activity that, in the Federal Reserve Board’s opinion, is unauthorized or constitutes an unsafe or unsound practice in conducting our business. The Federal Reserve Board may also impose substantial fines and other penalties for violations of applicable banking laws, regulations and orders. The failure of Citi to maintain its status as a financial holding company could result in substantial limitations on certain of our activities and our growth. In addition, pursuant to the Stockholder’s Agreement, we will agree not to take any action or fail to take any action that would result in Citi being in non-
29
Table of Contents
compliance with the BHC Act or any other applicable bank regulatory law, rule, regulation, guidance, order or directive.
As a controlled subsidiary of Citi, we are subject to the Dodd-Frank Act’s “Volcker Rule” prohibitions on investing in or sponsoring “covered funds,” which means that by July 21, 2015 our securitizations of loans will need to be structured to qualify for an exclusion from the definition of an investment company under the Investment Company Act of 1940, or the Investment Company Act, such as the Investment Company Act Rule 3a-7 exclusion for certain issuers of asset-backed securities or, if we intend to depend upon another exclusion, will need to comply with the provisions of the Volcker Rule regulations. Even after we are no longer a controlled subsidiary of Citi, we expect that we will still want to structure our loan securitizations so as to not be covered funds under the Volcker Rule in order for us to sell interests to banking entities. Currently, neither of our securitizations would be considered a covered fund.
We sell loans, including charged off loans and loans where the borrower is in default. This practice could subject us to heightened regulatory scrutiny, which may expose us to legal action, cause us to incur losses and/or limit or impede our collection activity.
As part of our business model, we sell loans, including those that may have been charged off as uncollectible. The CFPB and other regulators recently have significantly increased their scrutiny of debt sales, especially delinquent and charged-off debt. The CFPB has criticized sellers of debt for insufficient documentation to support and verify the validity or amount of the debt. It has also criticized debt collectors for, among other things, collection tactics, attempting to collect debts that are no longer valid, misrepresenting the amount of the debt and not having sufficient documentation to verify the validity or amount of the debt. Our loan sales could expose us to lawsuits or fines by regulators if we do not have sufficient documentation to support and verify the validity and amount of the loans underlying these transactions, or if we or purchasers of our loans use collection methods that are viewed as unfair or abusive. In addition, our collections could suffer and we may incur additional expenses if we are required to change collection practices or stop collecting on certain debts as a result of a lawsuit or action on the part of regulators. For more information with respect to the regulatory framework affecting our businesses, see “Business—Regulation.”
Our businesses are subject to extensive regulation in each of the states in which we conduct our business.
Our businesses are subject to numerous state and local laws and regulations. The extent of state regulation of our lending business varies by jurisdiction but relates primarily to the following: limits on the term of a loan, amounts, interest rates and charges on the loan; whether and under what circumstances insurance and other ancillary products may be offered to consumers in connection with a lending transaction; the manner in which we use personal data; collections efforts; and other consumer protections. The extent of state regulation of our insurance business varies by product and by jurisdiction, but relates primarily to the following: licensing; conduct of business; periodic examination of the affairs of insurers; form and content of required financial reports; standards of solvency; limitations on dividend payments and other related party transactions; types of products offered; approval of policy forms and premium rates; permissible investments; deposits of securities for the benefit of policyholders; reserve requirements for unearned premiums, losses and other purposes; and claims processing.
All of our operations are subject to regular examination by state regulators, and as a whole, our entities are subject to several hundred regulatory examinations in a given year. These examinations may result in requirements to change our policies or practices, and in some cases, we are required to pay monetary fines or make reimbursements to customers. Many state regulators and some federal regulators have indicated an intention to pool their resources in order to conduct examinations of licensed entities, including us, at the same time (referred to as a “multi-state” examination). This could result in more in-depth examinations, which could be more costly and lead to more significant enforcement actions.
States also have various loan servicing or debt collection licensing and regulatory requirements. To the extent that they exist, we must comply with state licensing and various operational compliance requirements in
30
Table of Contents
all of the states in which we offer our services. These requirements include, among others, the form and content of contracts and other documentation, controls and limitations on marketing and solicitation practices, collection practices, disclosures and record keeping. We are sensitive to regulatory changes that may increase our costs through stricter licensing laws, disclosure laws or increased fees. The failure to satisfy these regulatory requirements could have a material adverse effect on our operations. In addition, changes in laws or regulations applicable to us could subject us to additional licensing, registration and other regulatory requirements in the future or could adversely affect our ability to operate or the manner in which we conduct business.
A material failure to comply with applicable laws and regulations could result in regulatory actions, lawsuits and damage to our reputation, which could have a material adverse effect on our results of operations, financial condition and liquidity. For more information with respect to the regulatory framework affecting our businesses, see “Business—Regulation.”
Regulations relating to privacy, information security and data protection could increase our costs, affect or limit how we collect and use personal information and adversely affect our business opportunities.
We are subject to various privacy, information security and data protection laws, including requirements concerning security breach notification, and we could be negatively impacted by them. For example, for so long as we are an affiliate of Citi, we are subject to the Gramm-Leach-Bliley Act, or the GLBA, and implementing regulations and guidance. Among other things, the GLBA: (i) imposes certain limitations on the ability of financial institutions to share consumers’ nonpublic personal information with nonaffiliated third parties, (ii) requires that financial institutions provide certain disclosures to consumers about their information collection, sharing and security practices and affords customers the right to “opt out” of the institution’s disclosure of their personal financial information to nonaffiliated third parties (with certain exceptions) and (iii) requires financial institutions to develop, implement and maintain a written comprehensive information security program containing safeguards that are appropriate to the financial institution’s size and complexity, the nature and scope of the financial institution’s activities, and the sensitivity of customer information processed by the financial institution as well as plans for responding to data security breaches.
Moreover, various federal banking regulatory agencies and states have enacted data security breach notification requirements with varying levels of individual, consumer, regulatory and/or law enforcement notification in certain circumstances in the event of a security breach.
Furthermore, legislators and/or regulators are increasingly adopting or revising privacy, information security and data protection laws that potentially could have a significant impact on our current and planned privacy, data protection and information security-related practices, our collection, use, sharing, retention and safeguarding of consumer and/or employee information, and some of our current or planned business activities. This includes increased privacy-related enforcement activity at the federal level, by the Federal Trade Commission, as well as at the state level, such as with regard to mobile applications. This could also increase our costs of compliance and business operations and could reduce income from certain business initiatives.
Compliance with current or future privacy, data protection and information security laws (including those regarding security breach notification) affecting customer and/or employee data to which we are subject could result in higher compliance and technology costs. Our failure to comply with privacy, data protection and information security laws could result in potentially significant regulatory and/or governmental investigations and/or actions, litigation, fines, sanctions and damage to our reputation and our brand.
Our use of third-party vendors and our other ongoing third-party business relationships are subject to increasing regulatory requirements and attention.
We regularly use third-party vendors and subcontractors as part of our business. These types of third-party relationships are subject to increasingly demanding regulatory requirements and attention by our federal
31
Table of Contents
regulators (the Federal Reserve Board and the CFPB). Regulation requires us to enhance our due diligence, ongoing monitoring and control over our third-party vendors and subcontractors and other ongoing third-party business relationships. In certain cases we may be required to renegotiate our agreements with these vendors and/or their subcontractors to meet these enhanced requirements, which could increase our costs. We expect that our regulators will hold us responsible for deficiencies in our oversight and control of our third-party relationships and for the performance of the parties with which we have these relationships. As a result, if our regulators conclude that we have not exercised adequate oversight and control over our third-party vendors and subcontractors or other ongoing third-party business relationships, or that such third parties have not performed appropriately, we could be subject to enforcement actions.
We are subject to certain banking regulations that limit our business activities, including our ability to pay dividends and enter into certain business transactions without the approval of the Federal Reserve Board.
Because our controlling stockholder, Citi, is a bank holding company, we are subject to certain banking regulations, including oversight by the Federal Reserve Board and the CFPB. Such banking regulations could limit the activities and the types of businesses that we may conduct. The Federal Reserve Board has broad enforcement authority over bank holding companies and their subsidiaries. The Federal Reserve Board could exercise its power to restrict Citi from having a non-bank subsidiary that is engaged in any activity that, in the Federal Reserve Board’s opinion, is unauthorized or constitutes an unsafe or unsound business practice, and could exercise its power to restrict us from engaging in any such activity. This power includes the authority to prohibit or limit the payment of dividends if, in the Federal Reserve Board’s opinion, such payment would constitute an unsafe or unsound practice. Moreover, certain banks and bank holding companies, including Citi, are required to perform a stress test and submit a capital plan to the Federal Reserve Board on an annual basis, and to receive a notice of non-objection to the plan from the Federal Reserve Board before taking capital actions, such as paying dividends, implementing common equity repurchase programs or redeeming or repurchasing capital instruments. In March 2014, the Federal Reserve Board rejected Citi’s capital plan, and for as long as we are controlled by Citi for bank regulatory purposes, approval of the Federal Reserve Board may be required before we may pay a dividend. There can be no assurance whether the Federal Reserve Board will accept Citi’s next capital plan, and even if it does, there can be no assurance that the Federal Reserve Board will not impose restrictions on our ability to pay dividends. The Federal Reserve Board may also impose substantial fines and other penalties for violations that we may commit, and has the authority to approve or disallow acquisitions or other activities we may contemplate, which may limit our future growth plans. To the extent that we are subject to banking regulation, we could be at a competitive disadvantage because some of our competitors are not subject to these limitations.
Risks Relating to Our Indebtedness
Our indebtedness is significant, which could affect our ability to meet our obligations under our debt instruments and could materially and adversely affect our business and ability to react to changes in the economy or our industry.
We currently have a significant amount of indebtedness. As of June 30, 2014, we had $5.4 billion of indebtedness outstanding (including securitizations and unsecured borrowings from Citi). Interest expense on our indebtedness was $228 million in 2013. There can be no assurance that we will be able to repay or refinance our debt in the future.
The amount of indebtedness could have important consequences, including the following:
| • | it may require us to dedicate a significant portion of our cash flow from operations to the payment of the principal of, and interest on, our indebtedness, which reduces the funds available for other purposes, including loan originations; |
| • | it could limit our ability to withstand competitive pressures and reduce our flexibility in responding to changing regulatory, business and economic conditions; |
32
Table of Contents
| • | it may limit our ability to incur additional borrowings or securitizations for working capital, capital expenditures, business development, debt service requirements, acquisitions or general corporate or other purposes, or to refinance our indebtedness; |
| • | it may require us to seek to change the maturity, interest rate and other terms of our existing debt; |
| • | it may cause a downgrade of our debt and long-term corporate ratings if and after those ratings are obtained; and |
| • | it may cause us to be more vulnerable to periods of negative or slow growth in the general economy or in our business. |
In addition, meeting our anticipated liquidity requirements is contingent upon our continued compliance with our existing debt agreements. An event of default or declaration of acceleration under one of our existing debt agreements could also result in an event of default and declaration of acceleration under certain of our other existing debt agreements. Such an acceleration of our debt would have a material adverse effect on our liquidity and our ability to continue as a going concern. Furthermore, our existing debt agreements do not restrict us from incurring significant additional indebtedness. If our debt obligations increase, whether due to the increased cost of existing indebtedness or the incurrence of additional indebtedness, the consequences described above could be magnified.
To establish a fully independent capital structure, we expect to enter into other transactions prior to, and after, this offering that could further exacerbate the risks to our financial condition described above.
In order to establish a fully independent capital structure and finance our liquidity needs after this offering, we plan to incur third-party indebtedness prior to, and after, this offering. Although the agreements governing such indebtedness may contain restrictions on the incurrence of additional indebtedness, such restrictions may be subject to a number of qualifications and exceptions that would allow us to incur substantial additional indebtedness while remaining in compliance with the restrictions. Future restrictions on indebtedness also would not prevent us from incurring additional obligations, such as trade payables, that may not constitute indebtedness as defined under the applicable agreements.
The agreements that will govern our future indebtedness may contain covenants customary for such financings, such as limiting our ability to sell or dispose of assets, incur additional indebtedness or liens, make certain restricted payments, make certain investments, consummate mergers, consolidations or other business combinations or engage in other lines of business. These restrictions may interfere with our ability to engage in other necessary or desirable business activities, which could materially affect our business, financial condition or results of operations.
The assessment of our liquidity is based upon significant judgments or estimates that could prove to be materially incorrect.
In assessing our current financial position and developing operating plans for the future, management has made significant judgments and estimates with respect to our liquidity, including but not limited to:
| • | our ability to generate sufficient cash to service all of our outstanding debt; |
| • | our ability to complete, as needed, additional borrowings, securitizations, loan portfolio sales, or other transactions to support liquidity, and the costs associated with these funding sources, including sales at less than carrying value and limits on the types of assets that can be securitized or sold, which would affect profitability; |
| • | if and after a corporate debt rating is obtained, the potential for downgrade of our debt by rating agencies, which would have a negative impact on our cost of, and access to, capital; |
33
Table of Contents
| • | our ability to comply with our debt covenants; |
| • | the amount of cash expected to be received from our loan portfolio through collections (including prepayments) and receipt of fees we collect, which could be materially different than our estimates; |
| • | the amortization rate of our securitization facilities, which could be materially different than our estimates and result in an early amortization event, which could have a materially adverse effect on our liquidity and cost of funds; |
| • | the potential for declining financial flexibility and reduced income should we use more of our assets for securitizations and loan portfolio sales; and |
| • | the potential for reduced income due to the possible deterioration of the credit quality of our loan portfolios. |
Additionally, there are numerous risks to our financial results, liquidity, and capital raising and debt refinancing plans that are not quantified in our current liquidity forecasts. These risks include, but are not limited, to the following:
| • | our inability to grow or maintain our consumer finance portfolio with adequate profitability to fund operations, loan losses and other expenses; |
| • | our inability to monetize assets including, but not limited to, our access to debt and securitization markets; |
| • | the effect of federal, state and local laws, regulations, or regulatory policies and practices, including the Dodd-Frank Act (which, among other things, established the CFPB), on our ability to conduct business or the manner in which we conduct business, or restrictions on the method of offering products, as well as changes that may result from increased regulatory scrutiny of the non-prime lending industry; |
| • | the potential for increasing costs and difficulty in servicing our loan portfolio as a result of heightened nationwide regulatory scrutiny of loan servicing in the industry generally; |
| • | potential liability relating to consumer financial products which we have sold or may sell in the future, or relating to securitized loans, if it is determined that there was a non-curable breach of a warranty made in connection with the transaction; |
| • | the potential for additional unforeseen cash demands or accelerations of obligations; |
| • | reduced income due to loan modifications where the borrower’s interest rate is reduced, principal payments are deferred, or other concessions are made; |
| • | the potential for declines in bond and equity markets; and |
| • | the potential effect on us if the capital levels of our regulated and unregulated subsidiaries prove inadequate to support current business plans. |
We intend to support our liquidity position by managing originations and maintaining disciplined underwriting standards. We intend to support operations and repay indebtedness with one or more of the following activities, among others: loan collections, cash on hand, additional debt financings (particularly new securitizations and possible new issuances and/or debt refinancing transactions), loan portfolio sales, or a combination of the foregoing. There can be no assurance that we will be successful in undertaking any of these activities to support our operations and repay our obligations.
However, the actual outcome of one or more of our plans could be materially different than expected or one or more of our significant judgments or estimates about the potential effects of these risks and uncertainties could prove to be materially incorrect. In the event of such an occurrence, if third-party financing is not available, our liquidity could be substantially and materially affected, and as a result, substantial doubt could exist about our ability to continue as a going concern.
34
Table of Contents
Our securitizations may expose us to financing and other risks, and there can be no assurance that we will be able to access the securitization market in the future, which may require us to seek more costly financing.
In 2014, we completed two securitizations of, and may in the future securitize, our loans to generate cash to originate new loans or pay our outstanding indebtedness. In each such transaction, we convey a pool of loans to a special purpose entity, which, in turn, conveys the loans to a trust (the issuing entity). Concurrently, the trust issues non-recourse notes or certificates pursuant to the terms of an indenture or pooling and servicing agreement, respectively, which then are transferred to the special purpose entity in exchange for the loans. The securities issued by the trust are secured by the pool of loans. In exchange for the transfer of loans to the issuing entity, we receive the cash proceeds from the sale of the trust securities, all residual interests, if any, in the cash flows from the loans after payment of the trust securities, and a 100% beneficial interest in the issuing entity. During periods of challenging credit and liquidity conditions, the value of the residual interests we may retain in our securitizations could be reduced or, in some cases, eliminated.
We currently act as servicer with respect to our securitization trusts and their related series of asset-backed securities. If we default in our servicing obligations, an early amortization event could occur with respect to the relevant asset-backed securities and we could be replaced as servicer. Servicer defaults include, for example, the failure of the servicer to make any payment, transfer or deposit in accordance with the securitization documents, a breach of representations, warranties or agreements made by the servicer under the securitization documents, the delegation of the servicer’s duties contrary to the securitization documents and the occurrence of certain insolvency events with respect to the servicer. Such an early amortization event could have materially adverse consequences on our liquidity and cost of funds. Although we were able to complete two securitizations in 2014, the securitization market remains constrained, and we can give no assurances that we will be able to complete additional securitizations.
Rating agencies may also affect our ability to execute a securitization transaction, or increase the costs we expect to incur from executing securitization transactions, not only by deciding not to issue ratings for our securitization transactions, but also by altering the criteria and process they follow in issuing ratings. Rating agencies could alter their ratings processes or criteria after we have accumulated loans for securitization in a manner that effectively reduces the value of those loans by increasing our financing costs or otherwise requiring that we incur additional costs to comply with those processes and criteria. We have no ability to control or predict what actions the rating agencies may take.
Further, other matters, such as (i) accounting standards applicable to securitization transactions and (ii) capital and leverage requirements applicable to banks and other regulated financial institutions holding asset-backed securities, could result in decreased investor demand for securities issued through our securitization transactions, or increased competition from other institutions that undertake securitization transactions. In addition, compliance with certain regulatory requirements, including the Dodd-Frank Act and the Investment Company Act, may affect the type of securitizations that we are able to complete and the cost of securitization transactions.
If it is not possible or economical for us to securitize our loans in the future, we would need to seek alternative financing to support our operations and to meet our existing debt obligations, which may be less efficient and more expensive than raising capital via securitizations and may have a material adverse effect on our results of operations, financial condition and liquidity.
Our non-compliance with the covenants of the Dividend Note could result in a reduction in our liquidity.
Prior to this offering, we expect to declare a dividend of a $ million note, which we refer to as the Dividend Note, and issue the Dividend Note to Citi. We will be obligated to comply with customary covenants contained in the Dividend Note. Although we expect to repay the full amount of the Dividend Note with the
35
Table of Contents
proceeds of this offering, our failure to pay the amount due under the Dividend Note or comply with its covenants would restrict our liquidity and, consequently, could have a material adverse effect on our business, financial condition and results of operations.
Risks Relating to Our Organization and Structure
Citi owns a controlling interest in our company, and the interests of Citi may conflict with our interests and with those of our public stockholders, including you.
After this offering, Citi will own approximately % of the outstanding shares of our common stock ( % if the underwriters exercise their over-allotment option in full).
For so long as Citi owns shares of our common stock representing more than 50% of the voting power of our outstanding voting securities, Citi will generally be able to determine the outcome of all corporate actions requiring stockholder approval, including the election of all of the members of our Board of Directors who will determine our strategic plans, approve major financing decisions and appoint top management. In addition, as a holder of a majority of our common stock, Citi may seek to cause us to take courses of action that, in its judgment, could enhance its investment in us, but which might involve risks to the non-Citi holders of our common stock or adversely affect us or our public investors, including you. See “Description of Capital Stock.” Because Citi’s interests as our controlling stockholder may differ from your interests, actions taken by Citi with respect to us may not be favorable to you.
Prior to the completion of this offering, we also will enter into the Stockholder’s Agreement and a number of other agreements with Citi setting forth various matters governing our relationship with Citi while it remains a significant stockholder. In addition, our Amended and Restated Certificate of Incorporation will provide Citi with certain rights. For a description of these agreements and our Amended and Restated Certificate of Incorporation, see “Certain Relationships and Related Party Transactions—Relationship with Citi” and “Description of Capital Stock.” These agreements will govern our relationship with Citi after this offering and the provision of various services to us and certain provisions of these agreements are likely to affect our ability to make certain acquisitions or to merge or consolidate or to sell all or substantially all our assets without Citi’s consent.
Citi’s rights under these agreements may allow Citi to delay or prevent an acquisition of us or prevent a redemption or repurchase of our common stock that our public stockholders, including you, may consider favorable. These anti-takeover provisions could substantially impede the ability of public stockholders to benefit from a change in control or change our management and Board of Directors and, as a result, may adversely affect the market price of our common stock and your ability to realize any potential change of control premium. We will not be able to terminate these agreements with Citi or amend them in a manner we deem more favorable, except in accordance with their terms. In addition, a supermajority stockholder vote is required to amend Citi’s rights as set forth in our Amended and Restated Certificate of Incorporation. See “Description of Capital Stock.”
The assets and resources that we acquire in our separation from Citi may not be sufficient for us to operate as a stand-alone company, and we may experience difficulty in separating our assets and resources from Citi.
Because we have not operated as a stand-alone company in the recent past, we may have difficulty doing so after this offering. We may need to acquire assets and resources in addition to those provided to us by and in connection with our separation from Citi and may also face difficulty in separating our assets from Citi’s assets and integrating newly acquired assets into our business. Our business, financial condition and results of operations could be harmed if we have difficulty operating as a stand-alone company, fail to acquire assets that prove to be important to our operations or incur unexpected costs in separating our assets from Citi’s assets or integrating newly acquired assets.
36
Table of Contents
Some of our arrangements with Citi may not be sustained at the same levels as when we were wholly owned by Citi.
We have, and after this offering will continue to have, contractual arrangements which require Citi and its affiliates to provide certain services to us. Following this offering, many of these services will be governed by a transition services agreement between Citi and us. There is no assurance that upon termination or expiration of the transition services agreement, these services will be sustained at the same levels as they were when we received such services from Citi or that we will obtain the same benefits. We may not be able to replace services and arrangements in a timely manner or on terms and conditions, including cost, as favorable as those we have previously received from Citi. In addition, we anticipate that we will be obligated to provide certain services to Citi under the Transition Services Agreement, and performing such services may distract our management and employees from conducting our business. The agreements with Citi and its affiliates were entered into in the context of a parent/wholly owned subsidiary relationship, and we may have to pay higher prices for similar services from Citi or unaffiliated third parties in the future. See “Certain Relationships and Related Party Transactions—Relationship with Citi—Transition Services Agreement.”
If Citi engages in the same type of business we conduct, our ability to successfully operate and expand our business may be impaired.
Because Citi may engage in the same activities in which we engage (subject to the terms of the Stockholder’s Agreement), there is a risk that we may be in direct competition with Citi with respect to lending or insurance. Due to Citi’s significant resources, including financial resources and name recognition, Citi could have a significant competitive advantage over us should it decide to engage in the type of business we conduct, which may cause our business to be materially adversely affected.
This offering and future sales of our common stock by Citi could adversely affect our business and profitability due to our loss of Citi’s strong brand, reputation and capital base.
We believe the association with Citi has provided us with preferred status among our customers, vendors and other persons due to Citi’s globally recognized brand, perceived high-quality products and services, and strong capital base and financial strength. This offering and future sales of our common stock by Citi could adversely affect our ability to attract and retain customers, which could result in reduced volumes of loans. The loss of the Citi brand may also prompt some third parties to reprice, modify or terminate their relationships with us. We cannot predict with certainty the effect that this offering will have on our business, our customers, vendors or other persons.
Certain of our directors may have actual or potential conflicts of interest because of their positions with Citi.
Following this offering, will serve on our Board of Directors and retain their positions with Citi. In addition, such directors may own Citi common stock, options to purchase Citi common stock or other Citi equity awards. These individuals’ holdings of Citi common stock, options to purchase common stock of Citi or other equity awards may be significant for some of these persons compared to these persons’ total assets. Their positions at Citi and the ownership of any Citi equity or equity awards create, or may create the appearance of, conflicts of interest when these directors are faced with decisions that could have different implications for Citi than the decisions have for us or our public stockholders, including you.
37
Table of Contents
Citi and its directors and officers will have limited liability to us or you for breach of fiduciary duty.
Our Amended and Restated Certificate of Incorporation will provide that, subject to any contractual provision to the contrary (including the Stockholder’s Agreement), Citi will have no obligation to refrain from:
| • | engaging in the same or similar business activities or lines of business as we do; |
| • | doing business with any of our customers; or |
| • | employing or otherwise engaging any of our officers or employees. |
Under our Amended and Restated Certificate of Incorporation, neither Citi nor any officer or director of Citi, except as provided in our Amended and Restated Certificate of Incorporation, will be liable to us or to our stockholders for breach of any fiduciary duty by reason of any of these activities. See “Description of Capital Stock—General—Amended and Restated Certificate of Incorporation Provision Relating to Corporate Opportunities and Interested Directors.”
Our combined historical and pro forma financial data are not necessarily representative of the results we would have achieved as a stand-alone company and may not be a reliable indicator of our future results.
Our combined historical financial data included in this prospectus do not reflect the financial condition, results of operations or cash flows we would have achieved as a stand-alone company during the periods presented or those we will achieve in the future. This is primarily the result of the following factors:
| • | our combined historical financial data reflect allocations of corporate expenses from Citi associated with information technology, human resources, corporate governance, regulatory, capital planning, treasury, accounting, compliance, internal audit and other control operations and infrastructure costs that may be lower than the comparable expenses we would have actually incurred as a stand-alone company; |
| • | our cost of debt and our capitalization will be different from that reflected in our combined financial statements; |
| • | significant increases may occur in our cost structure as a result of this offering, including costs related to public company reporting, investor relations and compliance with the Sarbanes-Oxley Act; and |
| • | this offering may have a material effect on our customers and other business relationships, including supplier relationships, and may result in the loss of preferred pricing available by virtue of our relationship with Citi. |
Our financial condition and future results of operations, after giving effect to our separation from Citi and the Transactions, will be materially different from amounts reflected in our combined financial statements that appear elsewhere in this prospectus. As a result of the Transactions, it may be difficult for investors to compare our future results to historical results or to evaluate our relative performance or trends in our business.
We expect to incur charges in connection with this offering and incremental costs as a stand-alone public company.
We will need to replicate or replace certain functions, systems and infrastructure to which we will no longer have the same access after this offering. For instance, we currently use certain Citi systems and infrastructure that we will need to replace prior to the expiration or termination of the transition services agreement, including its investment management, legal, compliance, regulatory reporting, risk management, taxation, accounting, marketing, strategy, management and human resources functions. We will also need to make investments to operate without the same access to Citi’s existing operational and administrative infrastructure. These initiatives may be costly to implement. In addition, pursuant to the transition services agreement, we will agree to indemnify Citi for certain past, present and future liabilities related to our business. We also expect to incur significant non-cash compensation charges associated with the grant of equity awards to our employees. Due to
38
Table of Contents
the scope and complexity of the underlying projects relative to these efforts, the amount of total costs could be materially higher than our estimate, and the timing of the incurrence of these costs is subject to change.
Following this offering, many of these services will be governed by a transition services agreement with Citi. There is no assurance that upon termination or expiration of the transition services agreement, the services that Citi currently performs for us will be sustained at the same levels as when we were receiving such services from Citi or that we will obtain the same benefits. When we begin to operate these functions independently, if we do not have our own adequate systems and business functions in place, or are unable to obtain them from other providers, we may not be able to operate our business effectively or at comparable costs, and our profitability may decline. In addition, our business has benefited from Citi’s purchasing power when procuring goods and services, including office supplies and equipment, employee benefit platforms, travel services and computer software licenses. As a stand-alone company, we may be unable to obtain such goods and services at comparable prices or on terms as favorable as those obtained prior to this offering, which could decrease our overall profitability.
For more information regarding transition services, see “Certain Relationships and Related Party Transactions” and “Management’s Discussion and Analysis of Financial Condition and Results of Operations—Our Separation from Citi.”
We will owe obligations, including indemnification obligations, to Citi under the Stockholder’s Agreement that will be executed as part of our separation from Citi. These obligations could be materially disruptive to our business or subject us to substantial liabilities, including contingent liabilities and liabilities that are presently unknown or are difficult to quantify.
Prior to the completion of this offering, we will enter into the Stockholder’s Agreement with Citi that sets forth our relationship with Citi and its affiliates after this offering. The Stockholder’s Agreement will provide for, among other things, indemnification obligations designed to make us financially responsible for the debts, obligations and liabilities of any kind relating to or arising from the business, assets, contracts, properties, activities or practices now, hereafter or previously conducted, owned, entered into or operated by us or our legacy entities or businesses, including legacy entities, businesses or assets retained by Citi in CFNA (or retained elsewhere in Citi), or previously divested by us or Citi. As part of the foregoing indemnity, we will indemnify Citi for all liabilities arising from activities, practices (including origination and servicing), transactions and claims relating to or arising from our current or legacy businesses, branches, portfolios and assets, whether now part of our business or part of CFNA, CitiFinancial Servicing or Citi Holdings, including any liabilities relating to or arising from any of our business practices that are continued by Citi or from any sale by Citi or us of any such assets. We will not indemnify Citi for liabilities arising out of servicing or other activities by Citi after January 1, 2014 with respect to the CFNA mortgage portfolio that do not constitute a continuation of our business practices, any financial loss in the value of any assets held by Citi due to the performance of such assets or market conditions, or liabilities related to or arising from the Canada and Puerto Rico businesses within CFNA.
If we are required to indemnify Citi under the circumstances set forth in the Stockholder’s Agreement, we may be subject to substantial liabilities including liabilities that are accrued, contingent or otherwise and regardless of whether the liabilities are known or unknown at the time of our separation from Citi. Specifically, originations and servicing of various loans or insurance products are, or could become, subject to various claims, litigation or legal, regulatory or other proceedings resulting from business activities relating to current or legacy businesses or operations, even though they are no longer considered a part of our present-day business, and may result in liability due to future or changed laws, rules, interpretations or court decisions which purport to have retroactive effect. Such liabilities could be significant.
39
Table of Contents
It is inherently difficult, and in some cases impossible, to estimate the probable losses associated with contingent and unknown liabilities of this nature, but future losses may be substantial and will be borne by us in accordance with the terms of the Stockholder’s Agreement.
We will be a “controlled company” within the meaning of the New York Stock Exchange rules and, as a result, are exempt from certain corporate governance requirements.
Upon completion of this offering, Citi will continue to control a majority of the voting power of our outstanding common stock. As a result, we will be a “controlled company” within the meaning of the New York Stock Exchange corporate governance standards. Under the New York Stock Exchange rules, a company of which more than 50% of the voting power is held by another company is a “controlled company” and need not comply with certain requirements, including (1) the requirement that a majority of the board of directors consist of independent directors, (2) the requirement that the nominating/corporate governance committee be composed entirely of independent directors with a written charter addressing the committee’s purpose and responsibilities, (3) the requirement that the compensation committee be composed entirely of independent directors with a written charter addressing the committee’s purpose and responsibilities and (4) the requirement for an annual performance evaluation of the nominating/corporate governance and compensation committees. Following this offering, we intend to utilize these exemptions. As a result, we will not have a majority of independent directors nor will our Nominating and Corporate Governance and Compensation Committees consist entirely of independent directors. Accordingly, you will not have the same protections afforded to stockholders of companies that are subject to all of the New York Stock Exchange corporate governance requirements.
If Citi sells a controlling interest in our company to a third party in a private transaction, you may not realize any change-of-control premium on shares of our common stock and we may become subject to the control of a presently unknown third party.
Following the completion of this offering, Citi will own a % equity interest in our company. Citi will have the ability, should it choose to do so, to sell some or all of its shares of our common stock in a privately negotiated transaction, which, if sufficient in size, could result in a change of control of our company. The ability of Citi to privately sell its shares of our common stock, with no requirement for a concurrent offer to be made to acquire all of the shares of our common stock that will be publicly traded hereafter, could prevent you from realizing any change-of-control premium on your shares of our common stock that may otherwise accrue to Citi upon its private sale of our common stock. Additionally, if Citi privately sells its significant equity interest in our company, we may become subject to the control of a presently unknown third party. Such third party may have conflicts of interest with those of public stockholders, including you. However, Citi has agreed, subject to certain exceptions, not to dispose of or hedge any shares of our common stock for a period of 180 days from the date of this prospectus.
We are a holding company with no operations and will rely on our operating subsidiaries to provide us with funds necessary to meet our financial obligations and to pay dividends.
We are a holding company with no material direct operations. Our principal assets are the equity interests we directly or indirectly hold in our operating subsidiaries, which own our operating assets. As a result, we will be dependent on loans, dividends and other payments from our subsidiaries to generate the funds necessary to meet our financial obligations on our common stock. Our subsidiaries are legally distinct from us and may be prohibited or restricted from paying dividends or otherwise making funds available to us under certain conditions. For example, our insurance subsidiaries are subject to regulations that limit their ability to pay dividends or make loans or advances to us, principally to protect policyholders. See “Description of Certain Indebtedness.” If the cash we receive from our subsidiaries pursuant to dividend payments is insufficient for us to fund our obligations, or if a subsidiary is unable to pay dividends to us, we may be required to raise cash through the incurrence of debt, the issuance of equity or the sale of assets. However, there is no assurance that we would be able to raise cash by these means.
40
Table of Contents
If the ability of any of our subsidiaries to pay dividends or make other distributions or payments to us is materially restricted by regulatory requirements, bankruptcy or insolvency, or our need to maintain our financial strength ratings, or is limited due to operating results or other factors, it could materially adversely affect our ability to pay our operating costs and other corporate expenses.
We do not anticipate paying any dividends on our common stock in the foreseeable future.
We have no plans to pay regular dividends on our common stock, and we anticipate that a significant amount of any free cash flow generated from our operations will be utilized to redeem or prepay outstanding indebtedness and accordingly would not be available for dividends. Any declaration and payment of future dividends to holders of our common stock will be at the sole discretion of our Board of Directors and will depend on many factors, including our financial condition, earnings, capital requirements, level of indebtedness, statutory and contractual restrictions applying to the payment of dividends and other considerations that our Board of Directors deems relevant. Until such time that we pay a dividend, our investors must rely on sales of their common stock after price appreciation, which may never occur, as the only way to realize any future gains on their investment.
Insurance laws and regulations may delay or impede purchases of our common stock.
The insurance laws and regulations of the jurisdiction in which our insurance subsidiaries are domiciled generally provide that no person may acquire control, directly or indirectly, of a domiciled insurer, unless the person has provided required information to, and the acquisition is approved or not disapproved by, the applicable Department of Insurance. Generally, any person acquiring beneficial ownership of 10% or more of our voting securities would be presumed to have acquired indirect control of our insurance subsidiaries unless the applicable Department of Insurance, upon application, determines otherwise. Certain purchasers of our common stock could be subject to similar approvals which could significantly delay or otherwise impede their ability to complete such purchase.
Risks Relating to this Offering
Future sales of a substantial number of shares of common stock may adversely affect the market price of our shares.
If Citi sells or otherwise disposes of a large number of shares of our common stock, or if we issue a large number of shares of our common stock in connection with future acquisitions, financings or other circumstances, the market price of shares of our common stock could decline significantly. Moreover, Citi’s intention to divest of its remaining shares of our common stock or the perception in the public market that other stockholders might sell shares of our common stock could depress the market price of our common stock. However, Citi has agreed, subject to certain exceptions, not to dispose of or hedge any shares of our common stock for a period of 180 days from the date of this prospectus.
All the shares of our common stock sold in this offering will be freely tradable without restriction, except for shares of our common stock owned by any of our affiliates, including Citi. Immediately after this offering, the public market for our common stock will include only the million shares of our common stock that are being sold in this offering, or million shares of our common stock if the underwriters exercise the over-allotment option in full. After this offering, we intend to register million shares of our common stock, which are reserved for issuance under our employee benefit plans. Once we register these shares, they can be sold in the public market upon issuance, subject to restrictions under the securities laws applicable to resales by affiliates. In addition, we have granted Citi demand and “piggyback” registration rights with respect to the shares of our common stock it will continue to hold upon the completion of this offering. Citi may exercise its demand and piggyback registration rights, and any shares of our common stock so registered will be freely tradable in the public market, except for shares acquired by any of our affiliates. See “Certain Relationships and Related Party Transactions—Relationship with Citi—Registration Rights Agreement” and “Shares Eligible for Future Sale.”
41
Table of Contents
In the future, we may attempt to obtain financing or to further increase our capital resources by issuing additional shares of our common stock or offering debt or other equity securities, including commercial paper, medium-term notes, senior or subordinated notes, debt securities convertible into equity or shares of preferred stock. In particular, we intend to continue to seek opportunities to acquire consumer finance portfolios and/or businesses that engage in consumer finance loan servicing and/or consumer finance loan originations. Future acquisitions could require substantial additional capital in excess of cash from operations. We would expect to finance the capital required for acquisitions through a combination of additional issuances of equity, corporate indebtedness, asset-backed acquisition financing and/or cash from operations.
Issuing additional shares of our common stock or other equity securities or securities convertible into equity may dilute the economic and voting rights of our stockholders at the time of such issuance or reduce the market price of our common stock or both. Upon liquidation, holders of debt securities and preferred shares, if issued, and lenders with respect to other borrowings would receive a distribution of our available assets prior to the holders of our common stock. Debt securities convertible into equity could be subject to adjustments in the conversion ratio pursuant to which certain events may increase the number of equity securities issuable upon conversion. Preferred shares, if issued, could have a preference with respect to liquidating distributions or a preference with respect to dividend payments that could limit our ability to pay dividends to the holders of our common stock. Our decision to issue securities in any future offering will depend on market conditions and other factors beyond our control, which may adversely affect the amount, timing or nature of our future offerings. Thus, holders of our common stock bear the risk that our future offerings may reduce the market price of our common stock and dilute their stockholdings in us. See “Description of Capital Stock.”
An active trading market for our common stock may never develop or be sustained.
Before this offering, there has been no established public market for our common stock. An active, liquid trading market for our common stock may not develop or be sustained following this offering. If an active trading market does not develop, you may have difficulty selling your shares of common stock at an attractive price, or at all. An inactive market may also impair our ability to raise capital by selling our common stock and may impair our ability to acquire other companies, products or technologies by using our common stock as consideration. In addition, the liquidity of any market that may develop or the price that our stockholders may obtain for their shares of common stock cannot be predicted. The initial public offering price for our common stock will be determined by negotiations between us, the selling stockholders, and the representative of the underwriters and may not be indicative of prices that will prevail in the open market following this offering. See “Underwriting.” Consequently, you may not be able to sell your common stock at or above the initial public offering price or at any other price or at the time that you would like to sell.
The market price and trading volume of our common stock may be volatile, which could result in rapid and substantial losses for our stockholders.
Even if an active trading market develops, the market price of our common stock may be highly volatile and could be subject to wide fluctuations. In addition, the trading volume in our common stock may fluctuate and cause significant price variations to occur. The initial public offering price of our common stock will be determined by negotiation between us, the representatives of the underwriters and the selling stockholder based on a number of factors and may not be indicative of prices that will prevail in the open market following completion of this offering. If the market price of our common stock declines significantly, you may be unable to resell your shares at or above your purchase price, if at all. The market price of our common stock may fluctuate or decline significantly in the future. Some of the factors that could negatively affect our share price or result in fluctuations in the price or trading volume of our common stock include:
| • | variations in our quarterly or annual operating results; |
| • | changes in our earnings estimates (if provided) or differences between our actual financial and operating results and those expected by investors and analysts; |
42
Table of Contents
| • | the contents of published research reports about us or our industry or the failure of securities analysts to cover our common stock after this offering; |
| • | additions to, or departures of, key management personnel; |
| • | any increased indebtedness we may incur in the future; |
| • | announcements by us or others and developments affecting us; |
| • | actions by institutional stockholders; |
| • | litigation and governmental investigations; |
| • | changes in market valuations of similar companies; |
| • | speculation or reports by the press or investment community with respect to us or our industry in general; |
| • | increases in market interest rates that may lead purchasers of our shares to demand a higher yield; |
| • | announcements by us or our competitors of significant contracts, acquisitions, dispositions, strategic relationships, joint ventures or capital commitments; and |
| • | general market, political and economic conditions, including any such conditions and local conditions in the markets in which our borrowers are located. |
These broad market and industry factors may decrease the market price of our common stock, regardless of our actual operating performance. The stock market has generally, from time to time, experienced extreme price and volume fluctuations, including in recent months. In addition, in the past, following periods of volatility in the overall market and the market price of a company’s securities, securities class action litigation has often been instituted against these companies. This litigation, if instituted against us, could result in substantial costs and a diversion of our management’s attention and resources.
The obligations associated with being a public company will require significant resources and management attention.
As a result of this offering, we will become subject to the reporting requirements of the Exchange Act and the Sarbanes-Oxley Act. The Exchange Act requires that we file annual, quarterly and current reports with respect to our business and financial condition. The Sarbanes-Oxley Act requires, among other things, that we establish and maintain effective internal controls and procedures for financial reporting. All of the procedures and practices required as a majority-owned subsidiary of Citi were previously established, but we will have additional procedures and practices to establish as a stand-alone public company. As a result, we will incur significant legal, accounting and other expenses that we did not previously incur. Once established, these controls may not achieve their intended objectives. Control processes that involve human diligence and compliance, such as our disclosure controls and procedures and internal control over financial reporting, are subject to lapses in judgment and breakdowns resulting from human failures. Controls can also be circumvented by collusion or improper management override. Because of such limitations, there are risks that material misstatements due to error or fraud may not be prevented or detected and that information may not be reported on a timely basis. If our controls are not effective, it could have a material adverse effect on our financial condition, results of operations, and market for our common stock, and could subject us to regulatory scrutiny.
Furthermore, the need to establish the corporate infrastructure demanded of a public company may divert management’s attention from implementing our growth strategy, which could prevent us from improving our business, results of operations and financial condition. We have made, and will continue to make, changes to our internal controls and procedures for financial reporting and accounting systems to meet our reporting obligations as a stand-alone public company. However, the measures we take may not be sufficient to satisfy our obligations as a public company. In addition, we cannot predict or estimate the amount of additional costs we may incur in order to comply with these requirements.
43
Table of Contents
Section 404 of the Sarbanes-Oxley Act requires annual management assessments of the effectiveness of our internal control over financial reporting, starting with the second annual report that we file with the SEC, and will likely require in the same report, a report by our independent registered public accounting firm on the effectiveness of our internal control over financial reporting. In connection with the implementation of the necessary procedures and practices related to internal control over financial reporting, we may identify deficiencies that we may not be able to remediate in time to meet the deadline imposed by the Sarbanes-Oxley Act for compliance with the requirements of Section 404. We will be unable to issue securities in the public markets through the use of a shelf registration statement if we are not in compliance with Section 404. In addition, failure to achieve and maintain an effective internal control environment could have a material adverse effect on our business and stock price.
Our common stock is and will be subordinate to all of our existing and future indebtedness and any preferred stock, and effectively subordinated to all indebtedness and preferred equity claims against our subsidiaries.
Shares of our common stock are common equity interests in us and, as such, will rank junior to all of our existing and future indebtedness and other liabilities. Additionally, holders of our common stock may become subject to the prior dividend and liquidation rights of holders of any classes or series of preferred stock that our Board of Directors may designate and issue without any action on the part of the holders of our common stock. Furthermore, our right to participate in a distribution of assets upon any of our subsidiaries’ liquidation or reorganization is subject to the prior claims of that subsidiary’s creditors and preferred stockholders.
You will incur immediate dilution as a result of this offering.
If you purchase common stock in this offering, you will pay more for your shares than the pro forma net tangible book value of your shares. As a result, you will incur immediate dilution of $ per share, assuming an initial public offering price of $ per share, the midpoint of the price range set forth on the front cover page of this prospectus, after deducting estimated underwriting discounts and commissions and estimated offering expenses, and based on our net tangible book value per share as of June 30, 2014 of $ , representing the difference between such assumed offering price and our net tangible book value per share. Accordingly, should we be liquidated at our book value, you would not receive the full amount of your investment. See “Dilution.”
44
Table of Contents
SPECIAL NOTE REGARDING FORWARD-LOOKING STATEMENTS
We have made statements in the sections “Summary,” “Risk Factors,” “Management’s Discussion and Analysis of Financial Condition and Results of Operations,” “Business” and in other sections of this prospectus that are forward-looking statements. You can identify these statements by forward-looking words such as “may,” “might,” “will,” “should,” “expects,” “plans,” “anticipates,” “believes,” “estimates,” “predicts,” “potential,” “intends,” “targets” or “continue,” the negative of these terms and other comparable words. These forward-looking statements are subject to risks, uncertainties and assumptions and may include projections of our future financial performance, anticipated growth strategies and anticipated trends in our business. These statements are only predictions based on our current expectations and projections about future events and are subject to risks, uncertainties and assumptions. There are important factors that could cause our actual results, level of activity, performance or achievements to differ materially from the results, level of activity, performance or achievements expressed or implied by the forward-looking statements, including, but not limited to, those factors discussed under “Risk Factors” and factors relating to:
| • | changes in general economic conditions, including unemployment, the interest rate environment in which we conduct business and the financial markets through which we can access capital; |
| • | the effectiveness of our risk management processes and procedures in mitigating our risks; |
| • | the effectiveness of the models we use to manage our business, including liquidity and capital planning, customer selection, risk management, pricing, reserving and collections management; |
| • | the sufficiency of our allowance for loan losses to cover losses on our loans; |
| • | the identification of material weaknesses or significant deficiencies in our internal control over financial reporting; |
| • | the possibility that our historical charge-off rates may not be predictive of our future charge-off rates; |
| • | the impact on our reported results of operations and financial condition if assumptions or estimates we use in preparing our financial statements are incorrect or are required to change; |
| • | the ability to originate new loans due to competition in the consumer finance industry; |
| • | the effectiveness of our lending and insurance operations; |
| • | our use of technology in conducting our business, including disruptions in our computer systems and data centers and our transition to, and quality of, new technology platforms; |
| • | the impact on our business and results of operations if we are alleged to have infringed upon the intellectual property rights owned by others or are not able to protect our intellectual property; |
| • | the costs and effects of any litigation or regulatory actions involving us; |
| • | our ability to maintain a positive reputation; |
| • | changes in our ability to attract, retain and motivate employees or key executives, as well as the costs and effects of employee misconduct or misconduct by third parties we employ; |
| • | our ability to realize the value of strategic investments that we pursue and the potential for such investments to divert resources or introduce unforeseen risks to our business; |
| • | the potential concentration of the geographic distribution of our loan portfolio; |
| • | the costs and effects of repurchasing the loans that we sell or securitize if our loans fail to meet certain criteria or characteristics or under other circumstances; |
| • | our ability to effectively implement our growth strategy; |
| • | the costs and effects of the extensive federal and state government regulation, supervision, examination and enforcement to which our business is subject; |
45
Table of Contents
| • | our substantial indebtedness, which could prevent us from meeting our obligations under our debt instruments or restrict our ability to incur additional borrowings; |
| • | the accuracy of our judgments and estimates we use to assess our liquidity; |
| • | the costs and effects relating to our securitizations, including exposure to financing and other risks, as well as the potential inability to access the securitization market in the future; |
| • | the possibility that Citi, as a controlling stockholder, and certain of our directors, as employees of Citi, may have interests that conflict with ours and those of our other stockholders; |
| • | the possibility that the assets and resources that we acquire upon our separation from Citi may not be sufficient to sustain our business or adequately separated from Citi; |
| • | the fact that our combined historical and pro forma financial data are not necessarily representative of the results we would have achieved as a stand-alone company and may not be a reliable indicator of our future results; |
| • | the costs we expect to incur in connection with this offering and incremental costs as a stand-alone public company; |
| • | the impact on you of our utilization of “controlled company” status within the meaning of the New York Stock Exchange rules; |
| • | the costs to you if Citi sells a controlling interest in our company to a third party in a private transaction; |
| • | our reliance on our operating subsidiaries to provide us with funds; and |
| • | the impact of insurance laws and regulations on purchases and sales of a substantial number of shares of our common stock. |
These factors should not be construed as exhaustive and should be read in conjunction with the other cautionary statements that are included in this prospectus, including in the section “Risk Factors.” Moreover, neither we, Citi, the underwriters, nor any other person assumes responsibility for the accuracy and completeness of any of these forward-looking statements. We are under no duty to update any of these forward-looking statements after the date of this prospectus to conform our prior statements to actual results or revised expectations, except as required by law.
46
Table of Contents
We estimate that the net proceeds to us from this offering will be approximately $ million, based on an assumed public offering price of $ per share (the midpoint of the price range on the front cover of this prospectus), after deducting underwriting discounts and commissions and estimated offering expenses payable by us. We intend to use all of the net proceeds of this offering to repay the full amount due under the Dividend Note, which matures on and bears interest at .
If the underwriters exercise their over-allotment option in whole or in part, Citi will receive all of the net proceeds from the sale of those shares.
We do not currently anticipate paying any dividends on the shares of our common stock in the foreseeable future and anticipate that we will retain all available funds for use in the operation and expansion of our business.
47
Table of Contents
The following table sets forth our cash and cash equivalents and capitalization as of June 30, 2014:
| • | on a combined historical basis; |
| • | on a pro forma basis to give effect to the Pre-IPO Transactions, as described in more detail in “Unaudited Pro Forma Combined Financial Information;” and |
| • | on a pro forma as adjusted basis to give effect to the Transactions, including the issuance and sale of shares of common stock in this offering and the repayment in full of the Dividend Note with the net proceeds of this offering. |
This table should be read in conjunction with “Selected Combined Historical Financial Data,” “Unaudited Pro Forma Combined Financial Information,” “Management’s Discussion and Analysis of Financial Condition and Results of Operations” and our combined financial statements and notes thereto included elsewhere in this prospectus.
| As of June 30, 2014 | ||||||||||||
| (in millions of dollars) | ||||||||||||
| Actual | Pro Forma | Pro Forma as Adjusted |
||||||||||
| Cash and cash equivalents (including restricted cash of $90) |
$ | 291 | $ | $ | ||||||||
|
|
|
|
|
|
|
|||||||
| Debt: |
||||||||||||
| Long-term debt(1) |
760 | |||||||||||
| Equity: |
||||||||||||
| Parent’s net investment(2) |
3,159 | |||||||||||
| Common stock(2) |
— | |||||||||||
| Additional paid-in capital(2) |
— | |||||||||||
| Accumulated other comprehensive income |
61 | |||||||||||
| Total stockholder’s equity |
3,220 | |||||||||||
|
|
|
|
|
|
|
|||||||
| Total capitalization |
$ | 3,980 | $ | $ | ||||||||
|
|
|
|
|
|
|
|||||||
| (1) | Our long-term debt does not reflect $4,619 million of related-party debt outstanding, which we characterize as short-term debt, as of June 30, 2014. |
| (2) | Pro forma and pro forma as adjusted information reflects the reclassification of Citi’s net investment in us, which is recorded in Parent’s net investment, into Common stock and Additional paid-in capital. |
48
Table of Contents
If you invest in our common stock in this offering, your ownership interest will be immediately diluted.
Dilution per share represents the difference between the price per share to be paid by new investors for the shares of common stock sold in this offering and the net tangible book value per share after this offering. The price per share to the public of the shares of common stock in this offering substantially exceeds the net tangible book value per share prior to the offering. Our net tangible book value at June 30, 2014 would have been approximately $ , or $ per share of our common stock based on shares of our common stock issued and outstanding after giving effect to the Transactions, including the sale of shares of our common stock by us at an assumed initial public offering price of $ per share, the midpoint of the price range set forth on the front cover page of this prospectus, after deducting estimated underwriting discounts and commissions and estimated offering expenses. Therefore, purchasers of shares of common stock in this offering will realize immediate and substantial dilution in the net tangible book value of $ per share. Net tangible book value per share represents total tangible assets, less total liabilities, divided by the number of shares of common stock outstanding.
The following table illustrates this per share dilution after giving pro forma effect to the Transactions:
| Assumed initial public offering price (the midpoint of the price range on the front cover of this prospectus) |
$ | |||||||
| Net tangible book value per share as of June 30, 2014 |
$ | |||||||
| Increase in net tangible book value per share attributable to the Transactions (excluding this offering and the repayment in full of the Dividend Note) |
$ | |||||||
|
|
|
|||||||
| Increase in net tangible book value per share attributable to this offering and the repayment in full of the Dividend Note |
$ | |||||||
|
|
|
|||||||
| Net tangible book value per share of common stock after this offering |
$ | |||||||
| Dilution per share to new investors |
$ | |||||||
|
|
|
A $1.00 increase (decrease) in the assumed initial public offering price of $ per share would increase (decrease) the net tangible book value at June 30, 2014 by approximately $ , or approximately $ per share and the dilution per share to new investors by $ , in each case assuming the number of shares offered, as set forth on the front cover of this prospectus, remains the same and after deducting the estimated underwriting discounts and commissions and estimated offering expenses payable by us.
We may also increase or decrease the number of shares we are offering. An increase of one million shares in the number of shares offered by us would result in net tangible book value at June 30, 2014 of approximately $ , or $ per share, and the dilution per share to investors in this offering would be $ per share, assuming the public offering price per share remains the same. Similarly, a decrease of one million shares in the number of shares of common stock offered by us would result in net tangible book value at June 30, 2014 of approximately $ , or $ per share, and the dilution per share to investors in this offering would be $ per share. The information discussed above is illustrative only and will adjust based on the actual public offering price and other terms of this offering determined at pricing.
49
Table of Contents
The following table sets forth the difference between the existing stockholder and new investors with respect to the number of shares of common stock purchased from us, the total consideration paid to us, or to be paid for these shares, and the average price per share paid, or to be paid, by the existing stockholder and by the new investors, at an assumed initial public offering price of $ per share before deducting estimated underwriting discounts and commissions and offering expenses payable by us, as of June 30, 2014:
| Shares Purchased | Total Consideration | Average Price Per Share |
||||||||||||||||
| Number | Percent | Amount | Percent | |||||||||||||||
| Existing stockholders |
% | $ | % | $ | ||||||||||||||
| New investors |
||||||||||||||||||
|
|
|
|
|
|
|
|
|
|
||||||||||
| Total |
100 | % | $ | 100 | % | $ | ||||||||||||
Each $1.00 increase (decrease) in the assumed initial offering price of $ per share of common stock would increase (decrease) the total consideration paid by new investors by approximately $ , or the percent of total consideration paid by new investors by approximately %, assuming that the number of shares offered by us, as set forth on the cover page of this prospectus, remains the same and after deducting the underwriting discounts and commissions and estimated offering expenses payable by us. We may also increase or decrease the number of shares we are offering. An increase (decrease) of shares in the number of shares offered by us increase (decrease) the total consideration paid by new investors by approximately $ , or the percent of total consideration paid by new investors by approximately %, assuming the public offering price per share remains the same. The information discussed above is illustrative only and will adjust based on the actual public offering price and other terms of this offering determined at pricing.
Sales in this offering will reduce the number of shares held by the existing stockholder to or approximately % of the total shares of common stock outstanding after the offering if the over-allotment option is exercised in full, and will increase the number of shares to be purchased by new investors to or approximately % of the total shares of common stock outstanding after the offering if the over-allotment option is exercised in full.
50
Table of Contents
SELECTED COMBINED HISTORICAL FINANCIAL DATA
The following tables set forth our selected combined historical financial data. You should read the following summary information in conjunction with the information under “Management’s Discussion and Analysis of Financial Condition and Results of Operations” and our combined financial statements and the related notes included elsewhere in this prospectus.
The selected combined historical statement of income data for the six months ended June 30, 2014 and 2013, and the selected combined historical statement of financial position data as of June 30, 2014 are derived from the unaudited condensed combined financial statements included elsewhere in this prospectus and should be read in conjunction with those condensed combined financial statements and notes thereto. The selected combined historical statement of income data for the years ended December 31, 2013, 2012 and 2011, and the selected combined historical statement of financial position data as of December 31, 2013 and 2012 are derived from the combined historical financial statements, which have been audited by KPMG LLP and are included elsewhere in this prospectus and should be read in conjunction with those combined financial statements and notes thereto. The selected combined historical statement of financial position data as of December 31, 2011 are derived from unaudited combined historical financial statements not included in this prospectus. The selected combined historical statement of income data for the years ended December 31, 2010 and 2009 and the combined statement of financial position data as of December 31, 2010 and 2009 are unaudited and have been derived from the historical audited financial information of the U.S. business of CFNA prior to the split of OneMain and CitiFinancial Servicing not included in this prospectus and as such are not directly comparable to the subsequent years.
Our separation from Citi and the establishment of a capital structure fully independent from Citi will result in financial results that are materially different from those reflected in the combined historical financial data that appears in this prospectus. For an understanding of how these changes will affect our results of operations, see “Management’s Discussion and Analysis of Financial Condition and Results of Operations—Our Separation from Citi” and “Unaudited Pro Forma Combined Financial Information.”
Combined Statement of Income
| Six Months Ended June 30, |
Year Ended December 31, |
|||||||||||||||||||||||||||
| 2014 | 2013 | 2013 | 2012 | 2011 | 2010 | 2009 | ||||||||||||||||||||||
| (unaudited) | (unaudited) | (unaudited) | (unaudited) | |||||||||||||||||||||||||
| (in millions of dollars) | ||||||||||||||||||||||||||||
| Interest revenue |
$ | 1,015 | $ | 986 | $ | 2,019 | $ | 1,982 | $ | 2,339 | $ | 3,716 | $ | 4,366 | ||||||||||||||
| Interest expense |
114 | 116 | 228 | 264 | 676 | 1,707 | 1,947 | |||||||||||||||||||||
|
|
|
|
|
|
|
|
|
|
|
|
|
|
|
|||||||||||||||
| Net interest revenue |
901 | 870 | 1,791 | 1,718 | 1,663 | 2,009 | 2,419 | |||||||||||||||||||||
| Non-interest revenue |
195 | 252 | 498 | 553 | 500 | 485 | 481 | |||||||||||||||||||||
|
|
|
|
|
|
|
|
|
|
|
|
|
|
|
|||||||||||||||
| Total revenue, net of interest expense |
1,096 | 1,122 | 2,289 | 2,271 | 2,163 | 2,494 | 2,900 | |||||||||||||||||||||
| Provision for credit losses and for benefits and claims |
294 | 352 | 701 | 850 | 665 | 1,858 | 2,850 | |||||||||||||||||||||
| Operating expenses(1) |
355 | 378 | 743 | 790 | 806 | 3,803 | 1,342 | |||||||||||||||||||||
|
|
|
|
|
|
|
|
|
|
|
|
|
|
|
|||||||||||||||
| Income from continuing operations before income taxes |
447 | 392 | 845 | 631 | 692 | (3,167 | ) | (1,292 | ) | |||||||||||||||||||
| Provision for income taxes |
160 | 144 | 309 | 224 | 234 | (1,126 | ) | (453 | ) | |||||||||||||||||||
| Net income from continuing operations |
287 | 248 | 536 | 407 | 458 | (2,041 | ) | (839 | ) | |||||||||||||||||||
|
|
|
|
|
|
|
|
|
|
|
|
|
|
|
|||||||||||||||
| Loss from discontinued operations, net of taxes |
— | — | — | — | (140 | ) | — | — | ||||||||||||||||||||
|
|
|
|
|
|
|
|
|
|
|
|
|
|
|
|||||||||||||||
| Net income |
$ | 287 | $ | 248 | $ | 536 | $ | 407 | $ | 318 | $ | (2,041 | ) | $ | (839 | ) | ||||||||||||
|
|
|
|
|
|
|
|
|
|
|
|
|
|
|
|||||||||||||||
51
Table of Contents
Combined Statement of Financial Position
| As of June 30, |
As of December 31, | |||||||||||||||||||||||
| 2014 | 2013 | 2012 | 2011 | 2010 | 2009 | |||||||||||||||||||
| (unaudited) | (unaudited) | (unaudited) | (unaudited) | |||||||||||||||||||||
| (in millions of dollars) | ||||||||||||||||||||||||
| Assets |
||||||||||||||||||||||||
| Cash and cash equivalents |
$ | 291 | $ | 319 | $ | 369 | $ | 449 | $ | 150 | $ | 141 | ||||||||||||
| Investments (at fair value) |
1,504 | 1,431 | 1,507 | 1,759 | 1,571 | 1,838 | ||||||||||||||||||
| Loans receivables net of unearned revenue and deferred costs |
8,156 | 8,575 | 8,447 | 8,757 | 25,725 | 29,123 | ||||||||||||||||||
| Unearned premium and claims reserves |
(408 | ) | (416 | ) | (394 | ) | (380 | ) | (427 | ) | (496 | ) | ||||||||||||
| Accrued interest receivable |
84 | 92 | 114 | 116 | 563 | 517 | ||||||||||||||||||
| Allowance for loan losses |
(604 | ) | (676 | ) | (686 | ) | (545 | ) | (2,652 | ) | (2,708 | ) | ||||||||||||
|
|
|
|
|
|
|
|
|
|
|
|
|
|||||||||||||
| Net consumer finance receivables |
7,228 | 7,575 | 7,481 | 7,948 | 23,209 | 26,436 | ||||||||||||||||||
| Deferred tax assets, net |
260 | 256 | 221 | 132 | 1,639 | 801 | ||||||||||||||||||
| Premises and equipment, net |
19 | 21 | 28 | 15 | 183 | 195 | ||||||||||||||||||
| Other assets |
231 | 234 | 257 | 296 | 277 | 2,690 | ||||||||||||||||||
|
|
|
|
|
|
|
|
|
|
|
|
|
|||||||||||||
| Total assets |
$ | 9,533 | $ | 9,836 | $ | 9,863 | $ | 10,599 | $ | 27,029 | $ | 32,101 | ||||||||||||
|
|
|
|
|
|
|
|
|
|
|
|
|
|||||||||||||
| Liabilities and Parent Equity |
||||||||||||||||||||||||
| Related-party debt |
4,619 | 5,894 | 6,037 | 3,638 | 20,469 | 28,220 | ||||||||||||||||||
| Short-term borrowings |
— | — | — | 750 | 750 | — | ||||||||||||||||||
| Long-term debt |
760 | — | — | 2,500 | 2,500 | — | ||||||||||||||||||
| Insurance policy and claim reserves |
471 | 483 | 505 | 532 | 222 | 68 | ||||||||||||||||||
| Accounts payable, accrued expenses and other liabilities |
463 | 612 | 795 | 681 | 398 | 404 | ||||||||||||||||||
|
|
|
|
|
|
|
|
|
|
|
|
|
|||||||||||||
| Total liabilities |
6,313 | 6,989 | 7,337 | 8,101 | 24,339 | 28,692 | ||||||||||||||||||
| Total Parent equity |
3,220 | 2,847 | 2,526 | 2,498 | 2,690 | 3,409 | ||||||||||||||||||
|
|
|
|
|
|
|
|
|
|
|
|
|
|||||||||||||
| Total liabilities and Parent equity |
$ | 9,533 | $ | 9,836 | $ | 9,863 | $ | 10,599 | $ | 27,029 | $ | 32,101 | ||||||||||||
|
|
|
|
|
|
|
|
|
|
|
|
|
|||||||||||||
52
Table of Contents
Other Financial and Statistical Data
| At and for the Six Months Ended June 30, |
At and for the Years Ended December 31, |
|||||||||||||||
| 2014 | 2013 | 2013 | 2012 | |||||||||||||
| (in millions of dollars, except ratio, share and other data) | ||||||||||||||||
| Financial Position Data |
||||||||||||||||
| Personal loan receivables |
$ | 8,156 | $ | 7,792 | $ | 8,112 | $ | 7,890 | ||||||||
| Average personal loan receivables |
8,023 | 7,719 | 7,837 | 7,836 | ||||||||||||
| Total assets |
9,533 | 9,762 | 9,836 | 9,863 | ||||||||||||
| Average assets |
9,685 | 9,813 | 9,850 | 10,231 | ||||||||||||
| Total Parent equity |
3,220 | 2,742 | 2,847 | 2,526 | ||||||||||||
| Average equity |
3,034 | 2,634 | 2,687 | 2,512 | ||||||||||||
| Equity to assets(2) |
33.78 | % | 28.09 | % | 28.94 | % | 25.61 | % | ||||||||
| Debt to equity(3) |
1.67x | 2.04x | 2.07x | 2.39x | ||||||||||||
| Selected Performance Data |
||||||||||||||||
| Net income |
287 | 248 | 536 | 407 | ||||||||||||
| Net interest margin |
901 | 870 | 1,791 | 1,718 | ||||||||||||
| Efficiency ratio(4) |
32.39 | % | 33.69 | % | 32.46 | % | 34.79 | % | ||||||||
| Personal loan performance |
||||||||||||||||
| Loan yield(5) |
24.75 | % | 24.04 | % | 24.13 | % | 23.38 | % | ||||||||
| Risk-adjusted yield(6) |
18.29 | % | 17.11 | % | 17.83 | % | 17.14 | % | ||||||||
| Net charge offs |
6.46 | % | 6.92 | % | 6.30 | % | 6.24 | % | ||||||||
| 30+ days past due as a % of personal loan receivables, end of period |
3.78 | % | 3.44 | % | 4.10 | % | 4.05 | % | ||||||||
| 90+ days past due as a % of personal loan receivables, end of period |
2.12 | % | 2.00 | % | 2.42 | % | 2.42 | % | ||||||||
| Return on assets(7) |
5.98 | % | 5.10 | % | 5.44 | % | 3.98 | % | ||||||||
| Return on equity(8) |
19.08 | % | 18.99 | % | 19.95 | % | 16.20 | % | ||||||||
| Other Data |
||||||||||||||||
| Active personal loan customer accounts |
1,318,678 | 1,321,089 | 1,343,538 | 1,365,986 | ||||||||||||
| Number of branches |
1,141 | 1,158 | 1,155 | 1,222 | ||||||||||||
| (1) | The U.S. business of CFNA recorded a goodwill impairment charge of $2.4 billion in 2010. |
| (2) | Equity to assets is the Total Parent equity divided by Total assets. |
| (3) | Debt to equity is the sum of Related-party debt, Short-term borrowings and Long-term debt divided by Total Parent equity. |
| (4) | Efficiency ratio is Operating expenses divided by Total revenue, net of interest expense. |
| (5) | Loan yield is the annualized personal loan finance charges divided by Average personal loan receivables. For six-month amounts, personal loan finance charges for the six months ended June 30, 2014 and 2013, respectively, are annualized by dividing the personal loan finance charges for such periods by the number of days elapsed in the year, and then multiplying by the number of days in the year. |
| (6) | Risk-adjusted yield is the Loan yield less Net charge offs. |
| (7) | Return on assets is the Net income divided by Average assets. |
| (8) | Return on equity is the Net income divided by Average equity. |
53
Table of Contents
UNAUDITED PRO FORMA COMBINED FINANCIAL INFORMATION
The following unaudited pro forma combined financial statements are intended to provide you with information as to how the transactions described in this section might affect our combined financial statements. The pro forma combined financial statements do not necessarily reflect what our actual financial position or results of operations will be if the transactions described in this section occur as of the dates indicated, nor should they be taken as necessarily indicative of our future financial position or results of operations.
Prior to, and concurrent with, the completion of this offering, we expect the following transactions to have occurred and refer to these transactions collectively as the “Transactions.” The unaudited pro forma information in this section gives effect to the Transactions as if each had occurred at January 1, 2013 in the case of statements of income information, and at June 30, 2014 in the case of statement of financial position information. For purposes of presentation in this section, we separate the Transactions into “Pre-IPO Transactions” and “This Offering and the Use of Proceeds” as follows:
Pre-IPO Transactions
| • | completion of a 144A/Reg S securitization in April 2014 for $760 million (for pro forma condensed combined statement of income only); |
| • | completion of a 144A/Reg S securitization in July 2014 for $1,184 million; |
| • | anticipated declaration of a $ million dividend to Citi, which we refer to as the Dividend Recapitalization; |
| • | anticipated issuance of a $ million dividend to Citi in the form of a note, which we refer to as the Dividend Note; and |
| • | anticipated $ billion of incurred debt from third-party lenders and related expenses. |
This Offering and the Use of Proceeds
| • | issuance of million shares of our common stock at an estimated offering price of $ per share (the midpoint of the price range set forth on the front cover of this prospectus), after giving effect to our Amended and Restated Certificate of Incorporation that we intend to file prior to the consummation of this offering; and |
| • | anticipated repayment of the Dividend Note in full using the proceeds of this offering. |
The unaudited historical pro forma combined statement of income data for the six months ended June 30, 2014 is derived from our unaudited condensed combined financial statements included elsewhere in this prospectus and gives effect to the Transactions as if each had occurred on January 1, 2013. Our unaudited historical pro forma combined statement of income data for the year ended December 31, 2013 is derived from our audited combined financial statements included elsewhere in this prospectus and gives effect to the Transactions as if each had occurred on January 1, 2013. The unaudited historical pro forma combined statement of financial position data as of June 30, 2014 is derived from our unaudited condensed combined financial statements included in this prospectus and gives effect to the Transactions as if each had occurred on June 30, 2014 (other than our 144A/Reg S securitization in April 2014, which occurred prior to June 30, 2014).
The unaudited pro forma information below is based upon available information and assumptions that we believe are reasonable, that reflect the expected impacts of events that are directly attributable to the Transactions, that are factually supportable and that are expected to have a continuing impact on us.
You should read the following pro forma combined financial statements in conjunction with the information under “Management’s Discussion and Analysis of Financial Condition and Results of Operations,” “Business” and “Selected Combined Historical Financial Data” and our combined financial statements and related notes thereto included elsewhere in this prospectus.
54
Table of Contents
Pro Forma Condensed Combined Statements of Income Information
| Six Months Ended June 30, 2014 | ||||||||||||||||||||
| Historical | Adjustments for the Pre-IPO Transactions |
As Adjusted before this Offering |
Adjustments for this Offering and the Use of Proceeds |
Pro Forma | ||||||||||||||||
| (dollars in millions, except share data) | ||||||||||||||||||||
| Interest revenue |
$ | 1,015 | $ | $ | $ | $ | ||||||||||||||
| Interest expense(a) |
114 | |||||||||||||||||||
|
|
|
|
|
|
|
|
|
|
|
|||||||||||
| Net interest revenue |
901 | |||||||||||||||||||
| Non-interest revenue |
195 | |||||||||||||||||||
|
|
|
|
|
|
|
|
|
|
|
|||||||||||
| Total revenue, net of interest expense |
1,096 | |||||||||||||||||||
| Provision for credit losses and for benefits and claims |
294 | |||||||||||||||||||
| Operating expenses |
355 | |||||||||||||||||||
|
|
|
|
|
|
|
|
|
|
|
|||||||||||
| Income from continuing operations |
447 | |||||||||||||||||||
| Provision for income taxes(d) |
160 | |||||||||||||||||||
|
|
|
|
|
|
|
|
|
|
|
|||||||||||
| Net income |
$ | 287 | $ | $ | $ | $ | ||||||||||||||
|
|
|
|
|
|
|
|
|
|
|
|||||||||||
| Weighted average shares outstanding (in thousands) |
||||||||||||||||||||
| Basic(e) |
N/A | |||||||||||||||||||
| Diluted(e) |
N/A | |||||||||||||||||||
| Earnings per share |
||||||||||||||||||||
| Basic(e) |
N/A | |||||||||||||||||||
| Diluted(e) |
N/A | |||||||||||||||||||
55
Table of Contents
| Year Ended December 31, 2013 | ||||||||||||||||||||
| Historical | Adjustments for the Pre-IPO Transactions |
As Adjusted before this Offering |
Adjustments for this Offering and the Use of Proceeds |
Pro Forma | ||||||||||||||||
| (dollars in millions, except share data) | ||||||||||||||||||||
| Interest revenue |
$ | 2,019 | $ | $ | $ | $ | ||||||||||||||
| Interest expense(a) |
228 | |||||||||||||||||||
|
|
|
|
|
|
|
|
|
|
|
|||||||||||
| Net interest revenue |
1,791 | |||||||||||||||||||
| Non-interest revenue |
498 | |||||||||||||||||||
|
|
|
|
|
|
|
|
|
|
|
|||||||||||
| Total revenue, net of interest expense |
2,289 | |||||||||||||||||||
| Provision for credit losses and for benefits and claims |
701 | |||||||||||||||||||
| Operating expenses |
743 | |||||||||||||||||||
|
|
|
|
|
|
|
|
|
|
|
|||||||||||
| Income from continuing operations |
845 | |||||||||||||||||||
| Provision for income taxes(d) |
309 | |||||||||||||||||||
|
|
|
|
|
|
|
|
|
|
|
|||||||||||
| Net income |
$ | 536 | $ | $ | $ | $ | ||||||||||||||
|
|
|
|
|
|
|
|
|
|
|
|||||||||||
| Weighted average shares outstanding (in thousands) |
||||||||||||||||||||
| Basic(e) |
N/A | |||||||||||||||||||
| Diluted(e) |
N/A | |||||||||||||||||||
| Earnings per share |
||||||||||||||||||||
| Basic(e) |
N/A | |||||||||||||||||||
| Diluted(e) |
N/A | |||||||||||||||||||
56
Table of Contents
Pro Forma Condensed Combined Statements of Financial Position Information
| As of June 30, 2014 | ||||||||||||||||||||
| Historical | Adjustments for the Pre-IPO Transactions |
As Adjusted before this Offering |
Adjustments for this Offering and the Use of Proceeds |
Pro Forma | ||||||||||||||||
| (dollars in millions) | ||||||||||||||||||||
| Assets |
||||||||||||||||||||
| Cash and cash equivalents |
$ | 291 | $ | $ | $ | $ | ||||||||||||||
| Investments (at fair value) |
1,504 | |||||||||||||||||||
| Loans receivables net of unearned revenue and deferred costs |
8,156 | |||||||||||||||||||
| Unearned premium and claims reserves |
(408 | ) | ||||||||||||||||||
| Accrued interest receivable |
84 | |||||||||||||||||||
| Allowance for loan losses |
(604 | ) | ||||||||||||||||||
| Net consumer finance receivables |
7,228 | |||||||||||||||||||
| Deferred tax assets, net |
260 | |||||||||||||||||||
| Intangible assets |
76 | |||||||||||||||||||
| Premises and equipment, net |
19 | |||||||||||||||||||
| Other assets(a) |
155 | |||||||||||||||||||
|
|
|
|
|
|
|
|
|
|
|
|||||||||||
| Total assets |
$ | 9,533 | $ | $ | $ | $ | ||||||||||||||
|
|
|
|
|
|
|
|
|
|
|
|||||||||||
| Liabilities and Parent Equity |
||||||||||||||||||||
| Related-party debt(c) |
$ | 4,619 | ||||||||||||||||||
| Short-term borrowings |
— | |||||||||||||||||||
| Long-term debt(a) |
760 | |||||||||||||||||||
| Insurance policy and claim reserves |
471 | |||||||||||||||||||
| Accounts payable, accrued expenses and other liabilities |
463 | |||||||||||||||||||
|
|
|
|
|
|
|
|
|
|
|
|||||||||||
| Total liabilities |
6,313 | |||||||||||||||||||
|
|
|
|
|
|
|
|
|
|
|
|||||||||||
| Common stock, par value(c) |
||||||||||||||||||||
| Additional paid-in capital(c) |
||||||||||||||||||||
| Accumulated other comprehensive income |
||||||||||||||||||||
| Parent equity(b)(c) |
||||||||||||||||||||
| Total equity |
3,220 | |||||||||||||||||||
|
|
|
|
|
|
|
|
|
|
|
|||||||||||
| Total liabilities and equity |
$ | 9,533 | $ | $ | $ | $ | ||||||||||||||
|
|
|
|
|
|
|
|
|
|
|
|||||||||||
57
Table of Contents
NOTES TO UNAUDITED PRO FORMA CONDENSED COMBINED FINANCIAL STATEMENTS
| (a) | Reflects an adjustment to record $ billion of borrowings in connection with our Pre-IPO Transactions described above. The additional borrowing commitments and related interest expense at an estimated weighted average interest rate of % per annum, reflect the following: |
| 1) | completion of a 144A/Reg S securitization in April 2014 for $760 million; |
| 2) | completion of a 144A/Reg S securitization in July 2014 for $1,184 million; and |
| 3) | the issuance of $ billion of debt to third-party lenders. |
| The unaudited pro forma combined financial information also includes an adjustment to record $ million of deferred financing costs related to the borrowings described above. The proceeds of the new borrowings were used to repay related-party debt. |
| An increase (decrease) in the weighted average interest rate of 0.125% per annum would increase (decrease) pro forma interest expense related to our borrowings described above by $ million for the six months ended June 30, 2014 and $ million for the year ended December 31, 2013. |
| (b) | On , 2014, we declared and paid a special cash dividend of $ per share, or approximately $ million in the aggregate, to our Parent and sole stockholder, which we refer to as the Dividend Recapitalization. |
| (c) | Reflects that we declared and paid to Citi a dividend of a $ million note on , 2014, which we refer to as the Dividend Note. We intend to repay the Dividend Note in full (plus any accrued and unpaid interest thereon) with the proceeds of this offering. Also reflects the conversion of our Parent’s net investment in us from “Parent equity” to “Common stock” and “Additional paid-in capital” as a result of this offering and the sale of shares of common stock in this offering based on an assumed initial public offering price of $ per share (the midpoint of the price range set forth on the front cover of this prospectus), less assumed underwriting discounts and commissions and estimated offering expenses. |
| The following adjustments are reflected in our pro forma results to reflect the impact of the Transactions on “Parent equity,” “Common stock,” “Additional paid-in capital” and “Accumulated other comprehensive income.” See “Use of Proceeds.” |
| As of June 30, 2014 | ||||||||
| Issuance of Dividend Note |
Proceeds from This Offering / Use of Proceeds |
Conversion of Parent Equity to Additional Paid-in Capital |
Adjustments for This Offering / Use of Proceeds | |||||
| Dividend Note |
||||||||
| Parent equity |
||||||||
| Common stock |
||||||||
| Additional paid-in capital |
||||||||
| Accumulated other comprehensive income |
||||||||
| (d) | Reflects an adjustment to record the tax impact of pro forma earnings adjustments at an estimated statutory tax rate of 36%. We expect our tax rate in future years, however, to vary from this percentage. |
| (e) | Pro forma basic earnings (loss) per common share is computed by dividing earnings (loss) available to common stockholders by the weighted average number of common shares outstanding during the period. Pro forma diluted earnings per common share is computed by dividing earnings (loss) available to common stockholders by the sum of weighted average common shares outstanding plus dilutive common shares for the period. Pro forma basic and diluted common shares also include the number of shares issued in this offering. |
58
Table of Contents
The following table sets forth the computation of pro forma basic and diluted net income (loss) per share (in millions, except share amounts):
| Six Months Ended June 30, 2014 |
Year Ended December 31, 2013 |
|||||||
| Basic and diluted pro forma net loss per common share |
||||||||
| Numerator: |
||||||||
| Net income |
$ | $ | ||||||
| Denominator: |
||||||||
| Weighted average common shares outstanding |
||||||||
| Add: |
||||||||
| Shares from this offering, the proceeds of which will be used for the repayment of the Dividend Note |
||||||||
| Pro forma weighted average common shares outstanding—basic |
||||||||
| Add: |
||||||||
| Dilutive effect of stock options |
||||||||
| Pro forma weighted average common shares outstanding—diluted |
||||||||
| Pro forma net earnings per share—basic |
||||||||
| Pro forma net earnings per share—diluted |
||||||||
59
Table of Contents
MANAGEMENT’S DISCUSSION AND ANALYSIS OF FINANCIAL CONDITION AND RESULTS OF OPERATIONS
The following discussion and analysis of our financial condition and results of operations should be read in conjunction with our combined financial statements and related notes. This discussion contains forward-looking statements that reflect our plans, estimates and beliefs. Actual results may differ materially from those contained in any forward-looking statements. These forward-looking statements involve numerous risks and uncertainties, including those discussed below and elsewhere in this prospectus including the sections entitled “Risk Factors” and “Special Note Regarding Forward-Looking Statements.” All references in this discussion to “OneMain,” the “Company,” “we,” “us,” “our,” “ours” or similar terms refer to OneMain Financial Holdings, Inc., a Delaware corporation, together with its consolidated subsidiaries. References to “Citi” refer to Citigroup Inc. and its subsidiaries other than OneMain.
Overview
We are a leading consumer finance company in the United States, providing responsible solutions to credit-worthy individuals through our nationwide branch network and online channels. Our 100 plus year history and culture embodies our dedication to high-quality origination, underwriting and servicing of traditional, easily understood and transparent personal loans to primarily middle-income households. Our personal loans are fixed-rate, fixed-term and fixed-payment, which are attractive to our customers. We also offer optional products that protect customers in the event of unforeseen circumstances. At June 30, 2014, we had $8.2 billion of loans outstanding and 1.3 million customer accounts. Our customer base is geographically diverse and has an average FICO score of 630. For the year ended December 31, 2013, we had net income of $536 million representing a return on assets of 5.4% and a return on equity of 19.9%, and for the six months ended June 30, 2014, we had net income of $287 million representing a return on assets of 6.0% and a return on equity of 19.1%.
The core of our business is a national, community-based network of 1,141 branches, serving 1.3 million customer accounts across 43 states as of June 30, 2014, supported by our online platform that allows us to efficiently process applications and provide convenient self-service features for our customers. As of June 30, 2014, the network consists of a local, well-trained, front-end workforce of approximately 4,100 employees and is supported centrally by approximately 1,100 employees with additional functional support provided by Citi. Our captive insurance business, Citi Assurance Services, or CAS, is staffed by an additional workforce of approximately 215 employees.
Segment Overview
Our business consists of two reportable segments: Lending and Insurance.
Lending Segment. We originate and service both unsecured and auto-secured personal loans through a national, community-based network of branches. We have consistently maintained a conservative approach to lending and only offer loans to customers that meet a minimum documented ability to pay, ensuring that individuals receive a responsible and appropriate product for their household budget. Our customer sourcing strategy is built on efficiently acquiring new customers while also retaining and growing relationships with profitable existing customers. The primary source for acquiring new customers is through targeted direct mail offers. Online application sourcing is increasingly providing another source for acquiring new customers, with Internet searches, partnerships, affiliates and our branded website accounting for 46% of all new borrower applications in 2013, up from 34% in 2011. Regardless of the channel from which personal loan originations are sourced, all of our loans require a face-to-face meeting with the customer and in-person closing at a branch.
We have executed a number of restructuring activities since 2011 that are reflected in “—Results of Operations—December 31, 2013, 2012 and 2011” below. Prior to 2011, we were part of a larger business within
60
Table of Contents
Citi known as CitiFinancial North America, or CFNA, which contained approximately $10 billion of personal loans and $15 billion of mortgage and real estate loans in the United States. In the middle of 2010, management decided to split the U.S. business of CFNA into two distinct business lines. OneMain, the go-forward business, retained the majority of U.S. personal loans and a portion of U.S. real estate loans. CitiFinancial Servicing was formed with the remaining portion that did not strategically align with OneMain’s go-forward origination and risk strategy. CitiFinancial Servicing was designed to support certain customers and loans that would benefit from expanded support, including loan modifications or restructurings, rather than originate loans. In effect, CitiFinancial Servicing became a liquidating business. CitiFinancial Servicing is reflected in discontinued operations in our combined financial statements for the year ended December 31, 2011 as a distribution to our parent company CitiFinancial Credit Company, or CCC, in our combined statement of income for the year ended December 31, 2011.
On July 1, 2011, we also began to service certain real estate loans for CitiFinancial Servicing for which we received a servicing fee. This real estate servicing arrangement ceased as of January 6, 2014, and we no longer receive a servicing fee from CitiFinancial Servicing. On January 1, 2014, we also transferred all real estate loans that we owned to CitiFinancial Servicing. Therefore, all of the originations and servicings that are currently in our Lending Segment are related to personal loans only. As a result of these restructuring activities since 2011, the combined financial statements as of and for the year ended December 31, 2011 are not comparable to subsequent years.
Insurance Segment. We write, reinsure and administer various optional products for our customers and Citi affiliates, including credit life, disability, involuntary unemployment and collateral protection insurance. These products are distributed in the branches through a robust and highly-structured sales process to ensure that customers understand the benefits, costs and optional nature of the products. Credit insurance products are underwritten and administered by American Health and Life Insurance Company and Triton Insurance Company, members of a group of insurance entities within CAS. In 2013, approximately 65% of our personal loan customers purchased at least one optional product from CAS. Our Insurance Segment also provides fee-based services to Citi affiliates, including the administration of debt protection products. Debt protection products are non-insurance products offered as an extension of a lending agreement. We expect to continue to provide these fee-based services to Citi after the separation. Our results of operations for the Insurance Segment also include “closed blocks” of insurance business that are not actively being marketed or sold to new customers and in some cases were acquired from third parties or an affiliate.
See Note 4 (Business Segments) to our audited combined financial statements for certain additional information regarding our operating segments.
Business Trends and Conditions
We believe our business and results of operations will be affected in the future by various trends and conditions, including the following:
| • | Growth in loan portfolio and interest income. We believe that continuing improvement in the U.S. economy and employment rates will contribute to an increase in consumer spending. In addition, we expect the volume of personal loans to continue to increase as consumers increase spending levels. We anticipate that these trends, combined with our marketing efforts and online and branch-based engagement strategies, will contribute to growth in our loan portfolio. In the near-to-medium term, we expect our total interest revenue to continue to grow, driven by the expected growth of our loan portfolio. We do not currently anticipate any significant changes to personal loan pricing in the near term and therefore expect that yields generated from interest and fees on interest-earning assets will remain relatively stable. |
| • | Changing funding mix and increased funding costs. Our primary funding sources have historically included cash from operations and funding provided by Citi. In April 2014 and July 2014, we successfully executed two securitization transactions, demonstrating our ability to attract independent capital markets |
61
Table of Contents
| funding. Both of these securitizations were structured with a twenty-four month revolving period and are redeemable two years after closing. We expect to continue securitizing loans to achieve cost-effective funding. We also expect to enter into various third-party debt agreements to achieve a debt capital structure that is fully independent of Citi. We expect the following factors to affect our funding costs: |
| • | the changing mix in our funding costs, as existing debt, in some cases, may be replaced by higher-cost funding provided by third-party sources; and |
| • | a rising interest rate environment. |
As a result of these factors, we expect our aggregate funding costs to increase following this offering. For the year ended December 31, 2013, if we had in place for the entire year the funding sources that we expect to have upon the closing of this offering, our interest expense would have increased by $ million, and our cost of funds would have increased from % to % per annum. See “Unaudited Pro Forma Combined Financial Information.”
| • | Elimination of real estate lending and servicing. On June 1, 2012, we ceased originating real estate loans but continued to service our existing portfolio and a larger portfolio of real estate loans owned by CCC. Real estate loans are comprised of residential first mortgages and home equity loans. In January 2014, we transferred our remaining real estate portfolio to an affiliate and also stopped servicing our affiliate’s real estate loan portfolio. The transfer of our real estate loan portfolio in 2014 did not materially change our expense profile because the resources previously dedicated to servicing the real estate loan portfolio were redeployed to originate and service personal loans. The following table sets forth the revenue, credit costs and income before provision for income taxes from our owned and serviced real estate loan portfolios for the years ended December 31, 2013, 2012 and 2011. |
| Year Ended December 31, | ||||||||||||
| 2013 | 2012 | 2011 | ||||||||||
| (in millions of dollars) | ||||||||||||
| Real Estate Portfolio Revenue |
||||||||||||
| Interest revenue |
$ | 62 | $ | 75 | $ | 435 | ||||||
| Interest expense |
(14 | ) | (19 | ) | (241 | ) | ||||||
|
|
|
|
|
|
|
|||||||
| Net interest revenue |
48 | 56 | 194 | |||||||||
| Non-interest revenue |
101 | 127 | 71 | |||||||||
|
|
|
|
|
|
|
|||||||
| Total real estate revenue, net of interest expense |
149 | 183 | 265 | |||||||||
| Net credit losses |
40 | 43 | 70 | |||||||||
| Credit reserve build (release) |
(15 | ) | 15 | 57 | ||||||||
|
|
|
|
|
|
|
|||||||
| Provisions for credit losses |
25 | 58 | 127 | |||||||||
|
|
|
|
|
|
|
|||||||
| Income before provision for income taxes |
$ | 124 | $ | 125 | $ | 138 | ||||||
|
|
|
|
|
|
|
|||||||
| • | Stable asset quality. Our personal loan credit performance remained stable through 2013, with a net charge-off rate of 6.30% for the year ended December 31, 2013 and 30+ day delinquency rate of 4.10% for the year ended December 31, 2013, compared to a net charge-off rate of 6.24% for the year ended December 31, 2012 and 30+ day delinquency rate of 4.05% for the year ended December 31, 2012. We continue to strive to originate personal loans that maximize profitability in each state in which we operate and from time to time will adjust our risk and loss tolerance to achieve our profitability goals. We believe that our net charge-off rates and 30+ day delinquency rates may increase in the near-to-mid term reflecting our risk and loss tolerance in geographies where we have had pricing opportunities. We expect that additional finance charges and interest will offset any resulting increases in our provision for loan losses. |
| • | Entrance into related-party revenue agreements. As part of our separation from Citi, we will enter into agreements to extend the duration of several strategic commercial relationships with certain Citi affiliates. We expect these relationships to continue to provide important revenue sources that leverage our existing |
62
Table of Contents
| infrastructure and expense base. First, we will enter into two five-year agreements with Citi’s credit cards businesses, or Citi Cards, to continue to provide administration services for Citi’s debt protection product portfolios. Our Citi Assurance Services operations team will service this product from Fort Worth, Texas. We expect that this servicing agreement will generate non-lending fee-based revenues of approximately $ million per year. We will also enter into an agreement with Citi’s branded cards business to underwrite and administer selected insurance benefits provided complimentary with the credit card. We expect to generate approximately $ million in premium and other fee income annually. Lastly, we will enter into a five-year insurance distribution agreement with CitiFinancial Canada whereby we will continue to be the sole underwriter for all the credit insurance products sold by CitiFinancial Canada to its customers. We will pay CitiFinancial Canada a customary distribution fee and a participation in the underwriting profits on all new policies written after separation. We expect to generate revenues greater than $ million per year from this arrangement with CitiFinancial Canada. |
| • | Investments in technology. In 2012, we completed the roll-out of Symphony, our proprietary underwriting, originating, servicing and payment processing platform, to all of our branches. In 2014, we started a project to migrate our current account management system to a third-party provider, a project that is expected to create additional operational and product flexibility, a stronger technology model and improved operational efficiency. Additionally, we are expecting to migrate data from the origination system, account management system and third-party partners into a consolidated repository where we can leverage the information for business, finance, marketing and risk management reporting and analysis. While we expect this account management system migration to add incremental expense in the short term, we expect a long-term benefit of cost savings from our current level of expense. |
Description of Key Statement of Income Line Items
Below is a summary of the key line items included in our Combined Statements of Income.
Interest Revenue. Interest revenue consists of finance interest and other charges and investment revenue. Finance interest and other charges are comprised of interest earned on our loans, amortization of loan origination fees and certain direct origination costs. Investment revenue consists of interest income from our investment portfolio in the insurance segment.
We analyze finance interest and other charges as a function of two principal components: average net receivables and yield-on-average net receivables. The key drivers of average net receivables include loan volumes, payment rates, early pay-off rates and charge offs. Loan volumes are influenced by a number of factors including macroeconomic conditions and customer demand. Payment rates and early pay-off rates reflect the extent to which customers maintain a balance. Charge offs on loans occur when principal is deemed uncollectible. The key drivers of yield-on-average net receivables include pricing, changes to our mix of loans (for example, differing rate structures by state), credit and delinquency performance, frequency of late fees and accrual status of our loans.
Investment revenue strategy includes analyzing and matching of assets and liabilities to determine strategic asset allocations intended to optimize investment revenue and adequately provide for the anticipated cash flow requirements, while remaining within the strict constraints of our investment guidelines. In 2013, the average duration of our investment portfolio was four years, as compared to a three-year average duration of liabilities.
Interest Expense. Interest expense is incurred on our interest-bearing liabilities, which consist of funding from Citi and debt of our consolidated securitization entities. Key drivers of interest expense include the amounts outstanding of our borrowings and other funding sources, the interest rate environment and its effect on interest rates paid on our funding sources and the changing mix of our funding from Citi, securitizations and other third-party funding.
Net Interest Revenue. Net interest revenue represents the difference between interest revenue and interest expense. We expect net interest revenue, as a percentage of interest-earning assets, to be influenced by changes
63
Table of Contents
in the interest rate environment, changes in our mix of products, credit performance of our loans and changes in the amount and composition of our interest-bearing liabilities. We track the spread between the interest revenue earned on our assets and the interest expense incurred on our debt and continually monitor the components of our yield and our cost of funds.
Insurance Premiums. Insurance premiums consists of earned premiums in our insurance segment for insurance coverage sold by our branches and other affiliates, as well as several closed blocks of business acquired through reinsurance transactions. The premium for an insurance policy sold to our lending segment customers is included in the principal amount of a customer’s personal loan, which is repaid by the customer over the term of the loan and earned over the same period.
Other Revenue. Other revenue consists of servicing fees, debt protection administration fees, commissions and other fees. Servicing fees were earned historically for servicing CCC’s real estate loan portfolio for loans that were less than 90+ days past due. As of January 6, 2014, we transferred the responsibility for servicing this real estate loan portfolio to an affiliate, and therefore we have not earned any meaningful servicing fee revenue since January 6, 2014. Debt protection fees consist of administration fees earned from CAS’ role as a vendor for Citi Cards. Additionally, fee income and investment gains/losses on our investment portfolio are also earned in our insurance segment. Lastly, we also earn commissions and a variety of ancillary fees in our Lending Segment.
Operating Expenses. Operating expenses consist of Compensation and benefits, Advertising and marketing and Other operating expenses. Compensation and benefits expense primarily consists of employee salaries, incentive compensation and benefit costs. Advertising and marketing expense includes spending that directly drives our loan volume and spending on sponsorships and branding initiatives. Other operating expenses primarily consist of premises costs, technology and communications expense and other general and administrative expense. As discussed below under “—Our Separation from Citi,” Citi provides us with certain services that are indirectly allocated to us as corporate overhead unless the costs associated with such services are directly charged and included in the appropriate cost categories (for example, employee benefits costs charged to us and included in Compensation and benefits expense).
We assess our operational efficiency using various metrics and conduct extensive operating expense analysis to determine whether fluctuations in cost and expense levels indicate trends that need to be addressed. Our operating expense analysis also includes a review of origination and servicing costs to assist us in assessing profitability by portfolio and by branch.
Provision for Credit Losses. Provision for credit losses is the expense related to our net credit losses (gross charge-offs less recoveries) and maintenance of the allowance for loan losses. The allowance for loan losses is maintained at a level to absorb the estimated probable losses of the loan portfolio, including expected future losses on troubled debt restructurings, or TDR loans, at each period-end date. We continuously review and evaluate our loan loss reserve methodology and models and implement further enhancements or changes to them, as needed.
Each of our loans is assessed using our proprietary, risk-based underwriting models that take into account an applicant’s credit profile, as well as their ability to repay the proposed loan. Because the profitability of our loan portfolio is directly affected by net credit losses, we closely analyze credit performance on an ongoing basis. We also monitor recovery rates because of their impact on the charge offs. Additionally, because delinquencies are an early indicator of future credit losses, we analyze delinquency trends, adjusting for seasonality, to determine whether or not our loans are performing in line with our expectations. For more information, see “—Credit Quality” below.
Policyholder Benefits and Claims. Policyholder benefits and claims is the expense related to claims payments to our insurance policyholders, plus changes to the claims reserves at each period-end date.
64
Table of Contents
Provision for Income Taxes. We are included in the consolidated U.S. federal and state income tax returns of Citi, where applicable, but also file certain separate state and foreign income tax returns. The tax provision and current and deferred tax balances have been presented on a separate company basis as if we were a separate filer. The effects of tax adjustments and settlements from taxing authorities are presented in our combined financial statements in the period to which they relate as if we were a separate filer. Our current tax obligations are settled with CCC on an estimated basis and adjusted in later periods as appropriate and reflected in our combined financial statements in the periods in which those settlements occur. We recognize the current and deferred tax consequences of all transactions that have been recognized in the combined financial statements using the provisions of the enacted tax laws. Deferred tax assets and liabilities are determined based on differences between the financial reporting and tax basis of assets and liabilities and are measured using the enacted tax laws and rates that will be in effect when the differences are expected to reverse. We record valuation allowances to reduce deferred tax assets to the amount that is more likely than not to be realized. See Note 11 (Income Taxes) to our audited combined financial statements for additional detail.
Results of Operations
| Six Months Ended June 30, | Year Ended December 31, | |||||||||||||||||||
| 2014 | 2013 | 2013 | 2012 | 2011 | ||||||||||||||||
| (in millions of dollars) | ||||||||||||||||||||
| Interest revenue |
||||||||||||||||||||
| Finance interest and other charges |
$ | 985 | $ | 953 | $ | 1,953 | $ | 1,907 | $ | 2,251 | ||||||||||
| Investment revenue |
30 | 33 | 66 | 75 | 88 | |||||||||||||||
|
|
|
|
|
|
|
|
|
|
|
|||||||||||
| Interest revenue total |
1,015 | 986 | 2,019 | 1,982 | 2,339 | |||||||||||||||
| Interest expense |
114 | 116 | 228 | 264 | 676 | |||||||||||||||
|
|
|
|
|
|
|
|
|
|
|
|||||||||||
| Net interest revenue |
901 | 870 | 1,791 | 1,718 | 1,663 | |||||||||||||||
|
|
|
|
|
|
|
|
|
|
|
|||||||||||
| Other non-interest revenue |
||||||||||||||||||||
| Insurance premiums |
171 | 176 | 353 | 379 | 400 | |||||||||||||||
| Other revenue |
24 | 76 | 145 | 174 | 100 | |||||||||||||||
|
|
|
|
|
|
|
|
|
|
|
|||||||||||
| Non-interest revenue total |
195 | 252 | 498 | 553 | 500 | |||||||||||||||
|
|
|
|
|
|
|
|
|
|
|
|||||||||||
| Total revenue, net of interest expense |
1,096 | 1,122 | 2,289 | 2,271 | 2,163 | |||||||||||||||
|
|
|
|
|
|
|
|
|
|
|
|||||||||||
| Provision for losses |
||||||||||||||||||||
| Net credit losses |
257 | 288 | 534 | 532 | 574 | |||||||||||||||
| Credit reserve build (release) |
(27 | ) | (13 | ) | 16 | 151 | (102 | ) | ||||||||||||
|
|
|
|
|
|
|
|
|
|
|
|||||||||||
| Total provision for credit losses |
230 | 275 | 550 | 683 | 472 | |||||||||||||||
| Policyholder benefits and claims |
64 | 77 | 151 | 167 | 193 | |||||||||||||||
|
|
|
|
|
|
|
|
|
|
|
|||||||||||
| Provision for credit losses, benefits and claims |
294 | 352 | 701 | 850 | 665 | |||||||||||||||
|
|
|
|
|
|
|
|
|
|
|
|||||||||||
| Operating expenses |
||||||||||||||||||||
| Compensation and benefits |
146 | 150 | 294 | 264 | 342 | |||||||||||||||
| Advertising and marketing |
34 | 29 | 66 | 67 | 83 | |||||||||||||||
| Other operating expenses |
175 | 199 | 383 | 459 | 381 | |||||||||||||||
|
|
|
|
|
|
|
|
|
|
|
|||||||||||
| Total operating expenses |
355 | 378 | 743 | 790 | 806 | |||||||||||||||
|
|
|
|
|
|
|
|
|
|
|
|||||||||||
| Income for continuing operations before provision for income taxes |
447 | 392 | 845 | 631 | 692 | |||||||||||||||
| Provision for income taxes |
160 | 144 | 309 | 224 | 234 | |||||||||||||||
|
|
|
|
|
|
|
|
|
|
|
|||||||||||
| Net income from continuing operations |
287 | 248 | 536 | 407 | 458 | |||||||||||||||
|
|
|
|
|
|
|
|
|
|
|
|||||||||||
| Discontinued operations |
||||||||||||||||||||
| Loss from discontinued operations |
— | — | — | — | (230 | ) | ||||||||||||||
| Benefit for income taxes |
— | — | — | — | 90 | |||||||||||||||
|
|
|
|
|
|
|
|
|
|
|
|||||||||||
| Loss from discontinued operations |
— | — | — | — | (140 | ) | ||||||||||||||
|
|
|
|
|
|
|
|
|
|
|
|||||||||||
| Net income |
$ | 287 | $ | 248 | $ | 536 | $ | 407 | $ | 318 | ||||||||||
|
|
|
|
|
|
|
|
|
|
|
|||||||||||
65
Table of Contents
Results of Operations—Six Months Ended June 30, 2014 Compared to Six Months Ended June 30, 2013
Interest Revenue. Total interest revenue increased by $29 million as of the six months ended June 30, 2014 when compared to the six months ended June 30, 2013, which was primarily due to increases in our personal loan volumes and yields. That growth was partially offset by the transfer of our real estate portfolio to an affiliate on January 1, 2014.
| Six Months Ended June 30, | ||||||||
| 2014 | 2013 | |||||||
| (in millions of dollars) | ||||||||
| Lending Segment |
||||||||
| Personal loan finance charges |
$ | 985 | $ | 920 | ||||
| Real estate finance charges |
— | 33 | ||||||
|
|
|
|
|
|||||
| Total Lending Segment interest revenue |
985 | 953 | ||||||
|
|
|
|
|
|||||
| Insurance Segment |
||||||||
| Investment revenue |
30 | 33 | ||||||
|
|
|
|
|
|||||
| Total interest revenue |
$ | 1,015 | $ | 986 | ||||
|
|
|
|
|
|||||
The following table sets forth the changes in our finance charges due to yield and volume for the six months ended June 30, 2014 when compared to the same period in 2013.
| Six Months Ended June 30, | ||||
| 2014 v. 2013 | ||||
| (in millions of dollars) | ||||
| Changes in Finance Charges |
||||
| Increase in personal loan finance charges due to yield |
$ | 28 | ||
| Increase in personal loan finance charges due to volume |
37 | |||
| Decrease in real estate finance charges |
(33 | ) | ||
|
|
|
|||
| Total |
$ | 32 | ||
|
|
|
|||
For the Lending Segment for the six months ended June 30, 2014, finance interest and other charges increased by $32 million when compared to the six months ended June 30, 2013. This was due primarily to an increase of $65 million in our personal loan finance charges, which was partially offset by a $33 million decrease in real estate finance charges due to the transfer of our real estate loan portfolio to an affiliate in January 2014. Our continued focus on originating loans with higher profitability, as well as the impact of pricing increases in several states, positively impacted our personal loan yields, which increased from 24.04% in the six months ended June 30, 2013 to 24.75% in the same period in 2014. Personal loan average net receivables increased by $304 million in the six months ended June 30, 2014 when compared to the six months ended June 30, 2013 due primarily to our branches being able to solely focus on personal loans following the transfer of our real estate portfolio and servicing in January 2014.
For the Insurance Segment for the six months ended June 30, 2014, investment revenue decreased by $3 million for the six months ended June 30, 2014 when compared to the six months ended June 30, 2013 primarily due to a reduction in the insurance investment portfolio as a result of ordinary dividends paid to CCC in 2013.
Interest Expense. For the six months ended June 30, 2014, interest expense decreased by $2 million when compared to the six months ended June 30, 2013 due to an overall decrease in average debt of $464 million, which was partially offset by an increase in the weighted average interest rate of 0.23%. Our average related-party debt (which we characterize as short-term debt) decreased by $777 million for the six months ended June 30, 2014, but was partially offset by an increase in long-term (third-party) debt of $760 million from our April 2014 securitization of personal loans, which brought our average long-term debt to $312 million for the period.
66
Table of Contents
Non-Interest Revenue. Non-interest revenue decreased by $57 million in the six months ended June 30, 2014 when compared to the six months ended June 30, 2013. The following table summarizes non-interest revenue, by segment, for the six months ended June 30, 2014 and 2013.
| Six Months Ended June 30, | ||||||||
| 2014 | 2013 | |||||||
| (in millions of dollars) | ||||||||
| Lending Segment |
||||||||
| Lending revenue |
$ | 37 | $ | 88 | ||||
| Insurance Segment |
||||||||
| Insurance premiums |
171 | 176 | ||||||
| Other insurance revenue |
7 | 8 | ||||||
|
|
|
|
|
|||||
| Total |
178 | 184 | ||||||
| Inter-segment elimination(1) |
(20 | ) | (20 | ) | ||||
|
|
|
|
|
|||||
| Total non-interest revenue |
$ | 195 | $ | 252 | ||||
|
|
|
|
|
|||||
| (1) | Represents payments made by the Insurance Segment to the Lending Segment for selling insurance products through the Lending Segment branch network. |
For the Lending Segment, non-interest revenue decreased by $51 million in the six months ended June 30, 2014 when compared to the same period in 2013 primarily due to the cessation of servicing our affiliate’s portfolio of real estate loans in January 2014.
For the Insurance Segment, Insurance premiums decreased by $5 million in the six months ended June 30, 2014 when compared to the same period in 2013. This decrease was driven primarily by the run off of the closed blocks of insurance business. Premiums earned related to our personal loans in the six months ended June 30, 2014 and 2013 were $81 million and $79 million, respectively. Premiums related to the closed blocks of insurance business for the same periods were $64 million and $69 million, respectively. Other non-interest revenue decreased by $1 million in the six months ended June 30, 2014 when compared to the same period for 2013, primarily due to higher capital gains on the insurance investment portfolio in the six months ended June 30, 2013.
Operating Expenses. Operating expenses decreased by $23 million as of the six months ended June 30, 2014 when compared to the six months ended June 30, 2013. The following table summarizes the components of operating expenses, by segment, for the six months ended June 30, 2014 and 2013.
| Six Months Ended June 30, | ||||||||
| 2014 | 2013 | |||||||
| (in millions of dollars) | ||||||||
| Lending Segment |
||||||||
| Compensation and benefits |
$ | 135 | $ | 140 | ||||
| Advertising and marketing |
34 | 29 | ||||||
| Other operating expenses |
146 | 169 | ||||||
|
|
|
|
|
|||||
| Total Lending Segment operating expenses |
315 | 338 | ||||||
|
|
|
|
|
|||||
| Insurance Segment |
||||||||
| Compensation and benefits |
11 | 10 | ||||||
| Advertising and marketing |
— | — | ||||||
| Other operating expenses |
49 | 50 | ||||||
|
|
|
|
|
|||||
| Total Insurance Segment operating expenses |
60 | 60 | ||||||
|
|
|
|
|
|||||
| Inter-segment elimination(1) |
(20 | ) | (20 | ) | ||||
|
|
|
|
|
|||||
| Total operating expenses |
$ | 355 | $ | 378 | ||||
|
|
|
|
|
|||||
| (1) | Represents payments made by the Insurance Segment to the Lending Segment for selling insurance products through the Lending Segment branch network. |
67
Table of Contents
For the Lending Segment, Compensation and benefit expenses decreased by $5 million in the six months ended June 30, 2014 when compared to the same period in 2013 primarily due to a reduction in the rate we were charged for employee benefits and lower salaries due to lower headcount. Advertising and marketing expenses increased by $5 million in the six months ended June 30, 2014 when compared to the same period in 2013 primarily due to planned spending increases in our direct mail and Internet channels to support our loan growth objectives. Other operating expenses decreased by $23 million in the six months ended June 30, 2014 when compared to the same period in 2013 primarily due to a reduction in indirectly allocated costs from Citi.
For the Insurance Segment, Compensation and benefit expenses increased by $1 million in the six months ended June 30, 2014 when compared to the same period in 2013, primarily due to an increase in headcount and deferred compensation. Advertising and marketing expenses were essentially zero. Other operating expenses decreased by $1 million in the six months ended June 30, 2014 when compared to the same period in 2013 due to lower expenses related to the closed blocks of insurance business.
Provision for Credit Losses. Net credit losses decreased by $31 million in the six months ended June 30, 2014 when compared to the same period in 2013 due primarily to the transfer of our real estate loan portfolio to an affiliate in January 2014, while our credit reserve build/(release) decreased by $14 million in the six months ended June 30, 2014 when compared to the same period in 2013. The decrease in our credit reserve build/(release) was primarily due to liquidation in our TDR loan portfolio.
Policyholder Benefits and Claims. Policyholder benefits and claims in the six months ended June 30, 2014 decreased by $13 million when compared to the same period in 2013, primarily due to the run-off of closed blocks of insurance business and a reduction in disability claims. The policyholder benefits and claims related to the closed blocks of insurance business in the six months ended June 30, 2014 and 2013 were $29 million and $36 million, respectively.
Provision for Income Taxes. Our effective tax rate was 35.8% and 36.7% for the six months ended June 30, 2014 and 2013, respectively. The effective tax rate differs from the U.S. federal statutory tax rate of 35% due to state and local income taxes and the business and geographic mix of earnings.
Net Income from Continuing Operations. Net income from continuing operations of $287 million increased by $39 million, in the six months ended June 30, 2014 when compared to the same period in 2013. The increase in net income was driven primarily by a decrease in our Provision for credit losses, benefits and claims, which was $58 million lower in the six months ended June 30, 2014 when compared to the same period in 2013. We also had a decrease of $23 million in Operating expenses in the six months ended June 30, 2014 when compared to the same period in 2013 that contributed to the increase in Net income. These were partially offset by a $26 million decrease in Revenue related to the transfer of our real estate portfolio and an increase of $16 million in our Provision for income taxes for the same period.
Results of Operations—Years Ended December 31, 2013, 2012 and 2011
As discussed above in “—Segment Overview,” the results of operations for the Lending Segment in 2011 are not directly comparable to those in 2012 and 2013 due to a number of restructuring activities.
68
Table of Contents
Interest Revenue. Total interest revenue increased by $37 million in 2013 when compared to 2012, which was primarily due to increases in our personal loan yields. Total interest revenue decreased by $357 million in 2012 when compared to 2011, which was primarily due to our split from CitiFinancial Servicing in 2011.
| Year Ended December 31, | ||||||||||||
| 2013 | 2012 | 2011 | ||||||||||
| (in millions of dollars) | ||||||||||||
| Lending Segment |
||||||||||||
| Personal loan finance charges |
$ | 1,891 | $ | 1,832 | $ | 1,816 | ||||||
| Real estate finance charges |
62 | 75 | 435 | |||||||||
|
|
|
|
|
|
|
|||||||
| Total Lending Segment interest revenue |
1,953 | 1,907 | 2,251 | |||||||||
|
|
|
|
|
|
|
|||||||
| Insurance Segment |
||||||||||||
| Investment revenue |
66 | 75 | 88 | |||||||||
|
|
|
|
|
|
|
|||||||
| Total interest revenue |
$ | 2,019 | $ | 1,982 | $ | 2,339 | ||||||
|
|
|
|
|
|
|
|||||||
The following table sets forth the changes in our finance charges due to yield and volume in the years ended December 31, 2013, 2012 and 2011.
| Year Ended December 31, | ||||||||
| 2013 v. 2012 | 2012 v. 2011 | |||||||
| (in millions of dollars) | ||||||||
| Changes in Finance Charges |
||||||||
| Increase in personal loan finance charges due to yield |
$ | 59 | $ | 44 | ||||
| Decrease in personal loan finance charges due to volume |
— | (28 | ) | |||||
| Decrease in real estate finance charges |
(13 | ) | (360 | ) | ||||
|
|
|
|
|
|||||
| Total |
$ | 46 | $ | (344 | ) | |||
|
|
|
|
|
|||||
For the Lending Segment in 2013, finance interest and other charges increased by $46 million when compared to 2012. This was primarily due to our focus on originating loans with higher profitability and pricing increases in several states, which increased our personal loan yield from 23.38% in 2012 to 24.13% in 2013. Personal loan average net receivables remained relatively flat in 2013 when compared to 2012 at $7.8 billion. The reduction in real estate finance charges was driven by the continued liquidation of our run-off real estate loan portfolio in 2013. Excluding a decrease of $360 million in real estate finance charges that was driven by the split of OneMain and CitiFinancial Servicing in 2011 and continued liquidation of the real estate portfolio, finance charges were up $16 million in 2012 as compared to 2011 as a $28 million decrease from lower volumes was offset by an increase of personal loan yield from 22.82% in 2011 to 23.38% in 2012.
For the Insurance Segment in 2013, investment revenue decreased by $9 million when compared to 2012 and by $13 million in 2012 when compared to 2011, primarily due to a reduction in the insurance investment portfolio as a result of dividends of excess capital paid to CCC each year.
Interest Expense. For 2013, interest expense decreased by $36 million when compared to 2012 due to a decrease in average debt of $779 million and a decrease in the weighted average interest rate of 0.10%. Average debt decreased in 2013 when compared to 2012 primarily because we reduced our borrowings through cash payments of $725 million in December 2012 and $2.1 billion during 2013.
For 2012, interest expense decreased by $412 million when compared to 2011 due to a decrease in average debt of $8.35 billion and a decrease in the weighted average interest rate of 0.63%. Average debt decreased in 2012 when compared to 2011 due to the repayment of a large amount of related-party debt relating to our split from CitiFinancial Servicing in 2011.
69
Table of Contents
Non-Interest Revenue. Non-interest revenue decreased by $55 million in 2013 when compared to 2012 and increased by $53 million in 2012 when compared to 2011. The following table summarizes non-interest revenue, by segment, for the years ended December 31, 2013, 2012 and 2011.
| Year Ended December 31, | ||||||||||||
| 2013 | 2012 | 2011 | ||||||||||
| (in millions of dollars) | ||||||||||||
| Lending Segment |
||||||||||||
| Lending revenue |
$ | 170 | $ | 186 | $ | 103 | ||||||
| Insurance Segment |
||||||||||||
| Insurance premiums |
353 | 379 | 400 | |||||||||
| Other insurance revenue |
15 | 28 | 18 | |||||||||
|
|
|
|
|
|
|
|||||||
| Total |
368 | 407 | 418 | |||||||||
| Inter-segment elimination(1) |
(40 | ) | (40 | ) | (21 | ) | ||||||
|
|
|
|
|
|
|
|||||||
| Total non-interest revenue |
$ | 498 | $ | 553 | $ | 500 | ||||||
|
|
|
|
|
|
|
|||||||
| (1) | Represents payments made by the Insurance Segment to the Lending Segment for selling insurance products through the Lending Segment branch network. |
For the Lending Segment in 2013, non-interest revenue decreased by $16 million when compared to 2012, primarily due to a decrease in the revenue received from servicing our affiliate’s liquidating real estate loan portfolio. Non-interest revenue increased by $83 million in 2012 when compared to 2011, largely due to our split from CitiFinancial Servicing in 2011, after which we continued to service the real estate loan portfolio, therefore increasing our servicing fee revenue in 2012 relative to 2011.
For the Insurance Segment in 2013, Insurance premiums decreased by $26 million when compared to 2012. This decrease was driven primarily by the run-off of the closed blocks of insurance business. Insurance premiums decreased $21 million when comparing 2012 to 2011, also driven by the run-off of the closed blocks of business. Premiums earned related to our personal loans in 2013, 2012 and 2011 were $161 million, $162 million and $163 million, respectively. Premiums related to the closed blocks of insurance business in 2013, 2012 and 2011 were $137 million, $158 million and $179 million, respectively. Other insurance revenue decreased by $13 million in 2013 when compared to 2012, primarily due to lower capital gains on our investment portfolio. Other insurance revenue increased by $10 million in 2012 when compared to 2011, primarily due to higher capital gains on the insurance investment portfolio in 2012.
70
Table of Contents
Operating Expenses. Operating expenses decreased by $47 million and $16 million in 2013 and 2012, respectively, when compared to the prior year. The following table summarizes the components of Operating expenses, by segment, for the years ended December 31, 2013, 2012 and 2011.
| Year Ended December 31, | ||||||||||||
| 2013 | 2012 | 2011 | ||||||||||
| (in millions of dollars) | ||||||||||||
| Lending Segment |
||||||||||||
| Compensation and benefits |
$ | 273 | $ | 242 | $ | 319 | ||||||
| Advertising and marketing |
66 | 66 | 81 | |||||||||
| Other operating expenses |
324 | 395 | 303 | |||||||||
|
|
|
|
|
|
|
|||||||
| Total Lending Segment operating expenses |
663 | 703 | 703 | |||||||||
| Insurance Segment |
||||||||||||
| Compensation and benefits |
21 | 22 | 23 | |||||||||
| Advertising and marketing |
— | 1 | 2 | |||||||||
| Other operating expenses |
99 | 104 | 99 | |||||||||
|
|
|
|
|
|
|
|||||||
| Total Insurance Segment operating expenses |
120 | 127 | 124 | |||||||||
| Inter-segment elimination(1) |
(40 | ) | (40 | ) | (21 | ) | ||||||
|
|
|
|
|
|
|
|||||||
| Total operating expenses |
$ | 743 | $ | 790 | $ | 806 | ||||||
|
|
|
|
|
|
|
|||||||
| (1) | Represents payments made by the Insurance Segment to the Lending Segment for selling insurance products through the Lending Segment branch network. |
For the Lending Segment in 2013, Compensation and benefits increased by $31 million when compared to 2012, primarily due to a shift of expenses from Other operating expenses in 2012 to Compensation and benefits. This shift of expenses was due to an affiliate’s transfer of certain employees to us in 2013; prior to this transfer, the expense for these employees had been allocated to us and reported in Other operating expenses. Advertising and marketing remained stable in 2013 when compared to 2012. Other operating expenses decreased by $71 million in 2013 when compared to 2012 due to the transfer of employees explained above and a decrease in indirectly allocated costs from Citi.
For the Lending Segment in 2012, Compensation and benefit expenses decreased by $77 million when compared to 2011 primarily due to a shift of expenses from Compensation and benefits to Other operating expenses due to our transferring of certain employees to an affiliate; prior to this transfer, the expense for these employees had been directly incurred by us and reported in Compensation and benefits. Advertising and marketing expenses decreased by $15 million in 2012 when compared to 2011 primarily due to the increased advertising expenditures to support our rebranding efforts during 2011. Other operating expenses increased by $92 million in 2012 when compared to 2011 due primarily to the above-referenced transfer of employees and an increase in our technology expense of $19 million.
For the Insurance Segment, Compensation and benefits decreased by $1 million and $1 million in 2013 and 2012, respectively, primarily due to reductions in headcount. Other operating expenses decreased by $5 million in 2013 when compared to 2012, primarily due to lower expenses related to the closed blocks of insurance business. In 2012, other operating expenses increased by $5 million when compared to 2011, primarily due to an increase in the payment made by the Insurance Segment to the Lending Segment for selling insurance products through the Lending Segment branch network, partially offset by a reduction in the expense related to the closed blocks of insurance business.
Provision for Credit Losses. While net credit losses in 2013 increased by $2 million when compared to 2012, our credit reserve build/(release) decreased by $135 million primarily due to the absence of a credit reserve build for TDR loans. While net credit losses in 2012 decreased by $42 million when compared to 2011, our credit
71
Table of Contents
reserve build/(release) increased by $253 million primarily due to a credit reserve build for TDR loans related to a revised outlook on the future performance of our TDR loans after a release in 2011 that was driven by improving performance of the portfolio and several macroeconomic factors.
Policyholder Benefits and Claims. Policyholder benefits and claims decreased by $16 million when comparing 2013 to 2012 and by $26 million when comparing 2012 to 2011, primarily due to the run-off of closed blocks of insurance business and improved loss performance. The policyholder benefits and claims related to the closed blocks of insurance business in 2013, 2012 and 2011 were $73 million, $80 million and $93 million, respectively.
Provision for Income Taxes. Our effective tax rate was 36.6%, 35.5% and 33.8% for the years ended December 31, 2013, 2012 and 2011, respectively. In 2013, 2012 and 2011, the effective tax rate differs from the U.S. federal statutory tax rate of 35% due to state and local income taxes and the business and geographic mix of earnings.
Net Income from Continuing Operations. Net income from continuing operations of $536 million increased by $129 million in 2013 when compared to 2012. The increase in net income from continuing operations was driven primarily by a decrease in our Provision for credit losses and Policyholder benefits and claims, which was $149 million lower in 2013 than in 2012. We also had a decrease of $47 million in Operating expenses and an increase of $18 million in revenue in 2013 when compared to 2012 that were offset by an increase of $85 million in our Provision for income taxes.
Net income from continuing operations of $407 million decreased by $51 million in 2012 when compared to 2011. The decrease in net income from continuing operations was driven primarily by an increase in our Provision for credit losses and Policyholder benefits and claims, which was $185 million higher in 2012 than in 2011. We also had an increase in revenue of $108 million and a decrease in Operating expenses of $16 million in 2012 when compared to 2011 that were offset by a decrease of $10 million in our Provision for income taxes.
Credit Quality
Loan Portfolio. Our largest category of assets and primary source of revenue is our loan portfolio. The following table sets forth the composition of our loan portfolio by product type, as of the dates indicated.
| At or for the Six Months Ended June 30, | At or for the Year Ended December 31, | |||||||||||||||||||||||||||||||
| 2014 | 2013 | 2013 | 2012 | |||||||||||||||||||||||||||||
| $ | % | $ | % | $ | % | $ | % | |||||||||||||||||||||||||
| (in millions of dollars) | ||||||||||||||||||||||||||||||||
| End of Period Loan Receivables |
||||||||||||||||||||||||||||||||
| Personal loans |
$ | 8,156 | 100 | % | $ | 7,792 | 94 | % | $ | 8,112 | 95 | % | $ | 7,890 | 93 | % | ||||||||||||||||
| Real estate loans |
— | — | 509 | 6 | % | 463 | 5 | % | 557 | 7 | % | |||||||||||||||||||||
|
|
|
|
|
|
|
|
|
|
|
|
|
|
|
|
|
|||||||||||||||||
| Total end of period loan receivables |
$ | 8,156 | 100 | % | $ | 8,301 | 100 | % | $ | 8,575 | 100 | % | $ | 8,447 | 100 | % | ||||||||||||||||
|
|
|
|
|
|
|
|
|
|
|
|
|
|
|
|
|
|||||||||||||||||
| Average Loan Receivables |
||||||||||||||||||||||||||||||||
| Personal loans |
$ | 8,023 | 100 | % | $ | 7,719 | 94 | % | $ | 7,837 | 94 | % | $ | 7,836 | 93 | % | ||||||||||||||||
| Real estate loans |
— | — | 533 | 6 | % | 510 | 6 | % | 600 | 7 | % | |||||||||||||||||||||
|
|
|
|
|
|
|
|
|
|
|
|
|
|
|
|
|
|||||||||||||||||
| Total average loan receivables |
$ | 8,023 | 100 | % | $ | 8,252 | 100 | % | $ | 8,347 | 100 | % | $ | 8,436 | 100 | % | ||||||||||||||||
|
|
|
|
|
|
|
|
|
|
|
|
|
|
|
|
|
|||||||||||||||||
72
Table of Contents
Our personal loan portfolio had the following geographic concentration as of June 30, 2014 and December 31, 2013. The table below shows our five largest states, none of which are more than 10% of our total personal loan portfolio.
| As of June 30, 2014 | As of December 31, 2013 | |||||||||||||||
| Personal Loans Outstanding |
% of Total Personal Loans Outstanding |
Personal Loans Outstanding |
% of Total Personal Loans Outstanding |
|||||||||||||
| (in millions of dollars) | ||||||||||||||||
| State |
||||||||||||||||
| Texas |
$ | 786 | 9.6 | % | $ | 788 | 9.7 | % | ||||||||
| North Carolina |
710 | 8.7 | % | 686 | 8.5 | % | ||||||||||
| Pennsylvania |
538 | 6.6 | % | 531 | 6.5 | % | ||||||||||
| California |
465 | 5.7 | % | 464 | 5.7 | % | ||||||||||
| Ohio |
395 | 4.8 | % | 391 | 4.8 | % | ||||||||||
Delinquency. We consider the delinquency status of our personal loan portfolio as a key credit quality indicator and we monitor delinquency trends to assist in managing our exposure to credit risk. Interest income accrual ceases for personal loans when payments are 90 days contractually past due. Contractual delinquency status is determined by the number of payments that have elapsed since the paid-to-date of a loan, which is the date after which an account is deemed past due. When payments are applied to an account, the number of months the paid-to-date is advanced is determined by taking the number of all scheduled payments that have become due, and comparing it to the number of all payments satisfied after the payments have been applied, rounded to the nearest whole number. As long as the total number of rounded payments made is greater than or equal to the total number of payments due as of the then-current paid-to-date, the paid-to-date will advance. The following is a summary of net personal loans by the number of days delinquent as of the dates indicated:
| At or for the Six Months Ended June 30, |
At or for the Year Ended December 31, | |||||||||||||||||||||||
| 2014 | 2013 | 2012 | ||||||||||||||||||||||
| $ | % | $ | % | $ | % | |||||||||||||||||||
| (in millions of dollars) | ||||||||||||||||||||||||
| Personal loan receivables: |
||||||||||||||||||||||||
| Current |
$ | 7,848 | 96.22 | % | $ | 7,780 | 95.90 | % | $ | 7,570 | 95.95 | % | ||||||||||||
| 30-89 days past due |
135 | 1.66 | % | 136 | 1.68 | % | 129 | 1.63 | % | |||||||||||||||
| 90+ days past due |
173 | 2.12 | % | 196 | 2.42 | % | 191 | 2.42 | % | |||||||||||||||
|
|
|
|
|
|
|
|
|
|
|
|
|
|||||||||||||
| Total personal loan receivables |
8,156 | 100.00 | % | 8,112 | 100.00 | % | 7,890 | 100.00 | % | |||||||||||||||
|
|
|
|
|
|
|
|
|
|
|
|
|
|||||||||||||
| Total real estate loan receivables |
— | 463 | 557 | |||||||||||||||||||||
|
|
|
|
|
|
|
|||||||||||||||||||
| Total end of period loan receivables |
$ | 8,156 | $ | 8,575 | $ | 8,447 | ||||||||||||||||||
|
|
|
|
|
|
|
|||||||||||||||||||
Credit Loss. Net credit losses consist of the unpaid principal balance of loans, net of the related deferred fees and costs that we determine are uncollectible, net of recovered amounts. Net credit losses are recorded as a reduction to the allowance for loan losses and subsequent recoveries of previously charged off amounts are credited to the allowance for loan losses.
Personal loans net credit losses totaled $494 million, $489 million and $504 million for the years ended December 31, 2013, 2012 and 2011, respectively. The increase of $5 million from 2012 to 2013 was primarily attributable to the slight growth of the portfolio. The decrease of $15 million from 2011 to 2012 was primarily due to tightening credit during the recession.
73
Table of Contents
Personal loans net credit losses totaled $257 million and $265 million for the six months ended June 30, 2014 and 2013, respectively. The decrease of $8 million from 2014 to 2013 was primarily attributable to increased recoveries.
| Six Months Ended June 30, | Year Ended December 31, | |||||||||||||||||||
| 2014 | 2013 | 2013 | 2012 | 2011 | ||||||||||||||||
| (in millions of dollars) | ||||||||||||||||||||
| Personal loan: |
||||||||||||||||||||
| Gross credit losses |
$ | 286 | $ | 285 | $ | 535 | $ | 517 | $ | 526 | ||||||||||
| Credit recoveries |
29 | 20 | 41 | 28 | 22 | |||||||||||||||
|
|
|
|
|
|
|
|
|
|
|
|||||||||||
| Personal loan net credit losses |
257 | 265 | 494 | 489 | 504 | |||||||||||||||
|
|
|
|
|
|
|
|
|
|
|
|||||||||||
| Real estate net credit losses |
— | 23 | 40 | 43 | 70 | |||||||||||||||
|
|
|
|
|
|
|
|
|
|
|
|||||||||||
| Total net credit losses |
$ | 257 | $ | 288 | $ | 534 | $ | 532 | $ | 574 | ||||||||||
|
|
|
|
|
|
|
|
|
|
|
|||||||||||
| Personal loan credit losses as % of average personal loan receivables |
6.46 | % | 6.92 | % | 6.30 | % | 6.24 | % | 6.33 | % | ||||||||||
Allowance for Loan Losses. The allowance for loan losses is established by direct charges to income in amounts sufficient to maintain the allowance at a level management determines to be adequate to cover probable losses inherent in our existing portfolio. The allowance may fluctuate based upon continual review of the loan portfolio and changes in economic conditions.
The allowance for personal loan losses totaled $631 million at December 31, 2013 compared with $623 million at December 31, 2012. The increase of $8 million was primarily attributable to portfolio growth during 2013.
The allowance for personal loan losses totaled $604 million at June 30, 2014 compared with $631 million at December 31, 2013. The decrease of $27 million was primarily attributable to the seasonality of our delinquency.
| At June 30, | At December 31, | |||||||||||||||||||||||
| 2014 | 2013 | 2012 | ||||||||||||||||||||||
| $ | % | $ | % | $ | % | |||||||||||||||||||
| (in millions of dollars) | ||||||||||||||||||||||||
| Allowance for loan losses, ending balance |
||||||||||||||||||||||||
| Personal loans |
$ | 604 | 100 | % | $ | 631 | 93 | % | $ | 623 | 91 | % | ||||||||||||
| Real estate loans |
— | — | 45 | 7 | % | 63 | 9 | % | ||||||||||||||||
|
|
|
|
|
|
|
|
|
|
|
|
|
|||||||||||||
| Total allowance for loan losses, ending balance |
$ | 604 | 100 | % | $ | 676 | 100 | % | $ | 686 | 100 | % | ||||||||||||
|
|
|
|
|
|
|
|
|
|
|
|
|
|||||||||||||
| Personal loan allowance as % of end of period personal loan receivables |
7.41 | % | 7.78 | % | 7.90 | % | ||||||||||||||||||
| Personal loan allowance, months of concurrent coverage |
14.1 | 15.3 | 15.3 | |||||||||||||||||||||
Troubled Debt Restructuring (TDR) Loans. When we determine that a customer no longer has the ability to satisfy the original payment obligations on their loan and would have the ability and willingness to satisfy modified payment obligations, we can grant them a concession through a temporary or permanent modification of loan terms. These concessions can include a reduced interest rate, deferred loan principal, contingent principal forgiveness and/or an extension of the loan amortization schedule. Permanent modification programs are primarily used in cases such as bankruptcy, as well as in permanent hardship situations where a customer suffers from the death of a spouse or permanent disability. Temporary modification programs are primarily used for temporary hardship situations such as unemployment for a five-to-eleven month period, and revert back to the original loan terms at the expiration of the temporary modification. Prior to granting a modification program to a customer, full income and employment verification is required, and this verification process is substantially
74
Table of Contents
similar to the process for a newly underwritten loan. Loans whose terms have been modified as described above are reported as TDR loans. The following table is a summary of the recorded investment of TDR loans for the dates indicated:
| At June 30, | At December 31, | |||||||||||||||||||||||
| 2014 | 2013 | 2012 | ||||||||||||||||||||||
| Personal Loans |
Real Estate Loans |
Personal Loans |
Real Estate Loans |
Personal Loans |
Real Estate Loans |
|||||||||||||||||||
| (in millions of dollars) | ||||||||||||||||||||||||
| Total TDR loan principal(1) |
$ | 481 | $ | — | $ | 476 | $ | 63 | $ | 488 | $ | 64 | ||||||||||||
| Net origination costs & fees |
1 | — | — | — | — | — | ||||||||||||||||||
|
|
|
|
|
|
|
|
|
|
|
|
|
|||||||||||||
| Outstanding recorded investment |
480 | — | 476 | 63 | 488 | 64 | ||||||||||||||||||
| Allowance for TDR loan losses |
(211 | ) | — | (212 | ) | (23 | ) | (213 | ) | (28 | ) | |||||||||||||
|
|
|
|
|
|
|
|
|
|
|
|
|
|||||||||||||
| Outstanding recorded investment, net of allowance |
$ | 269 | $ | — | $ | 264 | $ | 40 | $ | 275 | $ | 36 | ||||||||||||
|
|
|
|
|
|
|
|
|
|
|
|
|
|||||||||||||
| (1) | Total TDR loan principal represents contractual principal amounts due from borrowers net of principal charged off. |
Our Separation from Citi
Citi and its subsidiaries have historically provided us with centralized support related to employee benefits, technology, operations and other shared services. Prior to the completion of this offering, we will enter into an employee matters agreement with Citi, or the Employee Matters Agreement, and a transition services agreement with Citi, or the Transition Services Agreement, that will govern the provision of, and costs associated with, such services to us after this offering. As a result of our separation from Citi and transition to a stand-alone public company, we expect to incur some short-term expenses and modest increased costs of approximately $ million to $ million per year to build our capabilities as a public company and replace services previously provided by Citi.
Citi has also historically provided funding to us. In conjunction with this offering, we intend to establish an independent capital structure. To this end, we have completed two separate securitizations of our loan portfolios in 2014, and we also expect to incur $ billion of third-party debt prior to the completion of this offering.
The historical costs related to these services and the interest related to the funding provided by Citi include directly charged costs associated with services provided directly to us, indirectly allocated costs related to general corporate services and interest expense, as described below.
| Six Months Ended June 30, | Year Ended December 31, | |||||||||||||||
| 2014 | 2013 | 2013 | 2012 | |||||||||||||
| (in millions of dollars) | ||||||||||||||||
| Directly charged costs(1) |
$ | 104 | $ | 112 | $ | 224 | $ | 254 | ||||||||
| Indirectly allocated costs(2) |
22 | 40 | 76 | 101 | ||||||||||||
| Interest expense(3) |
109 | 116 | 228 | 173 | ||||||||||||
|
|
|
|
|
|
|
|
|
|||||||||
| Total expenses for services and funding provided by Citi |
$ | 235 | $ | 268 | $ | 528 | $ | 528 | ||||||||
|
|
|
|
|
|
|
|
|
|||||||||
| (1) | Included in the Compensation and benefits, Advertising and marketing and Other operating expenses line items in our Combined Statements of Income. |
| (2) | Included in the Other operating expenses line item in our Combined Statements of Income. |
| (3) | Included in the Interest expense line item in our Combined Statements of Income. |
After the completion of this offering, indirectly allocated costs will become directly charged costs and will be charged to us under the Employee Matters Agreement and Transition Services Agreement in accordance with
75
Table of Contents
the terms of those agreements. Other than services provided under the Employee Matters Agreement (as described below), we expect that the majority of the services currently provided by Citi will be replaced within twelve to twenty-four months of this offering.
Directly Charged Costs. Certain functions and services, such as employee benefits, technology, office space and operations and shared services, are centralized at Citi. In addition, Citi enters into certain third-party contracts for goods and services from which we benefit, such as software licenses or desktop operating systems. Citi charges us for these goods and services using methodologies based on our actual use (for example, the number of software licenses that we use). For these services from Citi, we incurred costs of $104 million and $112 million for the six months ended June 30, 2014 and 2013, respectively, and $224 million and $254 million for the years ended December 31, 2013 and 2012, respectively. Below is a description of the services resulting in the most significant direct costs.
| • | Employee benefits. We reimburse Citi for payroll taxes and benefits provided to our employees under various Citi employee benefit plans, including Citi’s retirement plans and active health and life insurance plans. These costs are charged to us based on our employees’ wages. For these plans, we incurred costs of $37 million and $40 million for the six months ended June 30, 2014 and 2013, respectively, and $80 million and $70 million for the years ended December 31, 2013 and 2012, respectively. Under the contemplated Employee Matters Agreement, we expect that Citi will generally continue to provide these benefits to our employees at our expense for as long as Citi owns a significant amount of our outstanding common stock. See “Certain Relationships and Related Party Transactions—Relationship with Citi—Employee Matters Agreement.” |
| • | Technology. Citi provides us with certain technology infrastructure, applications and support services that are charged to us based on individual employee consumption and our use of information technology infrastructure. For these services, we incurred costs of $36 million and $38 million for the six months ended June 30, 2014 and 2013, respectively, and $75 million and $78 million for the years ended December 31, 2013 and 2012, respectively. |
| • | Occupancy. Citi provides us with certain shared premises and related services primarily located in Baltimore, Maryland, that are charged to us based primarily on the square footage that we use. We have incurred related costs of $3 million and $2 million for the six months ended June 30, 2014 and 2013, respectively, and $5 million for the year ended December 31, 2013. For the year ended December 31, 2012, these costs were included in other shared support costs discussed in “—Other direct costs” below. |
| • | Other direct costs. Citi provides us with various services including payment processing, customer statement preparation and centralized default management services. The cost for these services are charged to us based on the number of transactions completed, customer statements produced and accounts that are serviced. We incurred costs related to these services of $24 million and $26 million for the six months ended June 30, 2014 and 2013, respectively, and $53 million and $40 million for the years ended December 31, 2013 and 2012, respectively. |
In 2012 and 2011, Citi also provided us with local executive and administrative support services, for which we incurred costs of $52 million for the year ended December 31, 2012. Following a transfer of employees to us in 2013, we now incur the local executive and administrative support costs directly and then allocate any costs for services that we perform on behalf of affiliates to such affiliates. Additionally, we paid CitiFinancial Canada for marketing and distributing our credit insurance products and Citi Cards for billing and collecting periodic premium on other products and programs. The costs associated with these services were $4 million and $6 million for the six months ended June 30, 2014 and 2013, respectively, and $11 million and $14 million for the years ended December 31, 2013 and 2012, respectively.
Indirectly Allocated Costs. We incur indirectly allocated costs for general corporate services provided to us, including finance, human resources, compliance, risk, legal, communications, treasury, audit, administration and security services. We also incur indirectly allocated costs for operations and technology management and other shared administrative costs. These indirectly allocated costs are calculated on a pro rata basis among
76
Table of Contents
certain of Citi’s subsidiaries using a three-month rolling average of the costs associated with assets, direct staff, direct expenses and, in certain cases, on the basis of the amount of time a service was used. We incurred indirectly allocated costs of $22 million and $40 million for the six months ended June 30, 2014 and 2013, respectively, and $76 million and $101 million for the years ended December 31, 2013 and 2012, respectively.
Interest Expense. Historically, we have relied on funding provided by Citi to meet our funding requirements. We incurred borrowing costs for such funding of $109 million and $116 million for the six months ended June 30, 2014 and 2013, respectively, and $228 million and $173 million, for the years ended December 31, 2013 and 2012, respectively. Our weighted average interest rate for the funding from Citi was 4.04% and 3.76% for the six months ended June 30, 2014 and 2013, respectively, and 3.69% and 4.36% for the years ended December 31, 2013 and 2012, respectively.
For a discussion of the aggregate impact of the expected changes relating to these costs, see “—Business Trends and Conditions—Changing funding mix and increased funding costs” above.
Revenue Allocations. We have provided administrative support related to debt protection products to Citi Cards, recording revenue of approximately $6 million and $5 million for the six months ended June 30, 2014 and 2013, respectively, and $11 million for each of the years ended December 31, 2013 and 2012. Separately, we also provided other shared support to an affiliate in connection with a transfer of employees from an affiliate to us in 2013 and recorded revenue of approximately $4 million and $3 million for the six months ended June 30, 2014 and 2013, respectively, and $5 million for the year ended December 31, 2013. Historically, we have earned revenue from these activities based on an allocation determined by Citi. Going forward, we will earn revenue based on the contractual terms of our agreements with these affiliates. See “—Business Trends and Conditions—Entrance into related-party revenue agreements” above.
Liquidity and Capital Resources
Our primary financing needs relate to the funding of our lending operations in extending personal loans to borrowers. Our operating expenses are funded through the revenues generated by our business and debt financing. Historically, as a wholly-owned subsidiary of Citi, our financing was primarily provided by Citi. The balance of our funding from Citi, which we characterize as short-term debt, was $5.9 billion and $6.0 billion as of December 31, 2013 and 2012, respectively. The aggregate interest and fees paid to Citi with respect to funding were $228 million and $173 in 2013 and 2012, respectively.
In 2014, we began establishing a fully independent capital structure. It is our intention to finance our capital and liquidity needs through a variety of third-party debt sources.
At the completion of this offering, we anticipate that $ billion of financing, representing % of our total debt capital, will be provided by third-party sources, and $ billion of financing, representing % of total debt capital, will be provided by Citi.
Securitization Financings. On April 17, 2014, we completed our initial Reg 144A/Reg S securitization transaction, or the 2014-1 Securitization, in which OneMain Financial Issuance Trust 2014-1, a wholly owned special purpose entity, issued fixed-rate funding notes with an initial principal balance of $760 million that are securitized by our personal loans. The transaction consisted of a Class A note and a Class B note, rated A and BBB by S&P, respectively, and AA and A by DBRS, respectively. The notes mature in June 2024 and have a twenty-four month revolving period.
On July 30, 2014, we completed the second Reg 144A/Reg S securitization transaction, or the 2014-2 Securitization, in which the OneMain Financial Issuance Trust 2014-2, a wholly owned special purpose entity,
77
Table of Contents
issued fixed-rate funding notes with an initial principal balance of $1,184 million that are securitized by our personal loans. The transaction consisted of a Class A note, a Class B note, a Class C note and a Class D note. The notes were rated A, BBB, BB and B by S&P, respectively, and AA, A, BBB and BB by DBRS, respectively. The notes mature in September 2024 and have a twenty-four month revolving period.
We believe that term securitizations offer a very attractive source of funding due to the depth of the investor base and the cost efficiency of the market. In addition, given that the coupon on both the underlying loans and the securitization debt obligations is fixed, this source of funding does not result in earnings volatility due to increased interest rate risk. Currently, all of our securitizations feature a twenty-four month revolving period followed by an amortization period that matches the amortization profile of the assets. During the revolving period, we are required to contribute additional assets into the securitization trust to replace maturing loans. In addition, we retained an option to redeem the securitization debt obligations after the revolving period, which gives us additional flexibility in optimizing our financing and liquidity sources.
Our securitizations have several classes of notes, with principal paid sequentially based on seniority and any excess spread distributed to the residual note holder. All of our securitizations are on-balance sheet transactions. We retain the residual interest in each securitization. The following table summarizes the balances of the securitization financings as of the date of each respective issuance.
| Initial Note Amounts Issued |
Weighted Average Life to Expected Maturity(1) |
Current Note Amounts Outstanding |
Initial Collateral Balance |
Required Collateral Balance |
Coupon | Yield | ||||||||||||||||||||||
| (in millions of dollars) | ||||||||||||||||||||||||||||
| 2014-1 Securitization |
||||||||||||||||||||||||||||
| Class A |
$ | 658 | 2.57 | $ | 658 | N/A | N/A | 2.43 | % | 2.44 | % | |||||||||||||||||
| Class B |
102 | 3.50 | 102 | N/A | N/A | 3.24 | % | 3.27 | % | |||||||||||||||||||
|
|
|
|
|
|
|
|
|
|
|
|
|
|
|
|||||||||||||||
| Total |
760 | 2.70 | 760 | 1,004 | 1,000 | 2.57 | % | 2.59 | % | |||||||||||||||||||
| 2014-2 Securitization |
||||||||||||||||||||||||||||
| Class A |
875 | 2.55 | 875 | N/A | N/A | 2.47 | % | 2.49 | % | |||||||||||||||||||
| Class B |
118 | 3.49 | 118 | N/A | N/A | 3.02 | % | 3.04 | % | |||||||||||||||||||
| Class C |
69 | 3.73 | 69 | N/A | N/A | 4.33 | % | 4.38 | % | |||||||||||||||||||
| Class D |
122 | 4.06 | 122 | N/A | N/A | 5.31 | % | 5.38 | % | |||||||||||||||||||
|
|
|
|
|
|
|
|
|
|
|
|
|
|
|
|||||||||||||||
| Total |
1,184 | 2.87 | 1,184 | 1,325 | 1,316 | 3.09 | % | 3.12 | % | |||||||||||||||||||
| Total secured structured financings |
$ | 1,944 | $ | 1,944 | $ | 2,329 | $ | 2,316 | 2.89 | % | ||||||||||||||||||
|
|
|
|
|
|
|
|
|
|
|
|||||||||||||||||||
| (1) | Assumes a 30% conditional prepayment rate and that the optional call is not exercised on or after the revolving period or at 10% of the initial note balance remaining. |
Cash Flow Comparison—Six Months Ended June 30, 2014 Compared to Six Months Ended June 30, 2013
Operating Activities
Net cash provided by operating activities of $376 million decreased by $312 million for the six months ended June 30, 2014 when compared to the same period in 2013 primarily due to an increase in cash paid for income taxes.
Investing Activities
Net cash used in investing activities of $281 million increased $53 million for the six months ended June 30, 2014 when compared to the same period in 2013 primarily due to an increase in net originations of consumer finance receivables, partially offset by a decrease in restricted cash associated with our April 2014-1 securitization.
78
Table of Contents
Financing Activities
Net cash used in financing activities of $25 million decreased $428 million for the six months ended June 30, 2014 when compared to the same period in 2013 as the issuance of long term debt and contribution from CCC was partially offset by an additional repayment of related-party debt.
Cash Flow Comparison—Years Ended December 31, 2013, 2012 and 2011
Operating Activities
Net cash provided by operating activities of $995 million decreased $163 million in 2013 when compared to 2012 primarily due to an increase in cash paid for income taxes, partially offset by a decrease in operating expenses and interest paid in 2013.
Net cash provided by operating activities of $1,158 million decreased $77 million in 2012 when compared to 2011 primarily due to an increase in cash paid for income taxes and a decrease in net interest revenue, primarily due to our separation from CFNA in 2011.
Investing Activities
Net cash used in investing activities of $701 million increased $784 million in 2013 when compared to 2012 due to an increase in personal loan originations, a decrease in proceeds from the sales and maturities of investments and the purchase of loans from an affiliate in 2012.
Net cash provided by investing activities of $83 million increased $419 million in 2012 when compared to 2011 due to an increase in proceeds from sales of investments and a decrease in restricted cash, which was partially offset by an increase in net originations of consumer finance receivables.
Financing Activities
Net cash used in financing activities of $326 million decreased $919 million in 2013 when compared to 2012 primarily due to a decrease in dividends paid to CCC in 2013, coupled with the redemption of $3.3 billion of third-party debt in 2012, which was partially offset by the borrowing of $2.4 billion from Citi.
Net cash used in financing activities of $1,245 million increased $331 million in 2012 when compared to 2011 primarily due to the retirement of intercompany loans as a result of our split from CitiFinancial Servicing and higher dividends paid to CCC in 2012.
We believe that our existing cash, cash equivalents and investment securities balances, our cash flow generating capabilities, our borrowing capacity and access to capital resources are sufficient to satisfy our future operating cash needs, capital asset purchases, outstanding commitments and other liquidity needs for our existing operations and potential future obligations.
79
Table of Contents
Contractual Obligations, Commitments and Contingencies
In the normal course of business, we enter into various contractual obligations that require future cash payments. Our future cash payments associated with our contractual obligations as of December 31, 2013 are summarized below:
| 2014 | 2015 | 2016-2017 | 2018+ | Total | ||||||||||||||||
| (in millions of dollars) | ||||||||||||||||||||
| Long-term debt obligations (principal)(1) |
$ | — | $ | — | $ | — | $ | — | $ | — | ||||||||||
| Long-term debt obligations (interest payments)(1) |
— | — | — | — | — | |||||||||||||||
| Operating and capital lease obligations |
33 | 26 | 29 | 3 | 91 | |||||||||||||||
| Purchase obligations |
6 | — | — | — | 6 | |||||||||||||||
|
|
|
|
|
|
|
|
|
|
|
|||||||||||
| Total |
$ | 39 | $ | 26 | $ | 29 | $ | 3 | $ | 97 | ||||||||||
|
|
|
|
|
|
|
|
|
|
|
|||||||||||
| (1) | A large portion of our current outstanding debt is considered short-term debt and therefore is not reflected in the table above. For more information relating to our outstanding indebtedness, see “—Liquidity and Capital Resources” above and “Description of Indebtedness.” |
Subsequent to December 31, 2013, we have completed the following transactions:
2014-1 Securitization. On April 17, 2014, we completed our initial Reg 144A/Reg S securitization transaction in which the One Main Financial Issuance Trust 2014-1 issued fixed-rate funding notes with an initial principal balance of $760 million at a 2.587% weighted average yield. We received proceeds of $755 million from the 2014-1 Securitization. The notes mature in June 2024 and have a twenty-four month revolving period.
2014-2 Securitization. On July 30, 2014, we completed a second Reg 144A/Reg S securitization transaction in which the One Main Financial Issuance Trust 2014-2 issued fixed-rate funding notes with an initial principal balance of $1,184 million at a 3.119% weighted average yield. We received proceeds of $1,178 million from the 2014-2 Securitization. The notes mature in September 2024 and have a twenty-four month revolving period.
Back-Office Account Management System. A Citi affiliate has entered into a contract to obtain a new back-office account management system for us and will allocate approximately $5.7 million of the costs to us. We have entered into a separate but similar contract that will be effective once the new account management system is online. Starting in the fourth quarter of 2015, we will be obligated to pay a minimum of approximately $6.8 million per year for a five-year initial term. At our option, we may terminate the contract at any time prior to the expiration of the five-year initial term in exchange for an early termination fee of approximately $26.3 million less any fees already paid.
Corporate Headquarters. We expect to enter into agreements to lease a new corporate headquarters in Baltimore, Maryland, under which we expect to incur an aggregate of $34 million in expense over ten years commencing in March 2015, which we anticipate will be less, on an annual basis, than our current arrangements.
Off-Balance Sheet Arrangements
We do not engage in any off-balance sheet financing arrangements that have, or are reasonably likely to have, a current or future effect on our financial condition, changes in financial condition, revenues or expenses, results of operations, liquidity, capital expenditures or capital resources.
Seasonality and Fluctuations in Quarterly Operation Results
Our loan volume is generally highest during the months of May and November, primarily due to marketing around our customer appreciation days and the holidays. Demand for our loans is usually lower in January and
80
Table of Contents
February after the holiday season and preceding tax season. Delinquencies on our loans tend to peak in the fourth quarter, and higher net charge-offs on these loans usually occur in the first and second quarter of the following year. These seasonal trends contribute to fluctuations in our operating results and cash needs throughout the year.
Quantitative and Qualitative Disclosure about Market Risk
Market risk represents the risk of loss that may affect our financial position due to adverse change in financial market prices and rates. In the course of our normal operations, we are exposed to market risks, including interest rate risk, liquidity risk and credit risk.
Interest Rate Risk. Net interest revenue is the difference between the interest earned on our consumer loans and the rate paid on our interest bearing liabilities. Net interest revenue is affected by changes in the level of interest rates, as well as the amounts of assets and liabilities, and the timing of repricing of assets and liabilities to reflect market rates.
Currently, as all of our consumer loans are fixed-rate loans funded through fixed-rate liabilities, the potential economic impact to net interest revenue due to changes in market interest rates is immaterial. To the extent that our future capital structure will include floating-rate liabilities (normally with LIBOR as benchmark), our net earnings could be adversely be affected if we are unable to effectively match the interest rates on our assets and liabilities (including, in the future, potentially through the use of derivatives).
For purposes of presenting the possible earnings effect of a hypothetical, adverse change in interest rates over the twelve-month period from June 30, 2014, we assume that all interest rate sensitive assets and liabilities will be impacted by a hypothetical, immediate 100 basis point increase in interest rates at the beginning of the period. The sensitivity is based upon the hypothetical assumption that all relevant types of interest rates that affect our results would increase instantaneously, simultaneously and to the same degree. Assuming an immediate 100 basis point increase in the interest rates affecting all interest rate-sensitive assets and liabilities at June 30, 2014, we estimate that net interest revenue over the following twelve-month period would increase by approximately $10.5 million.
Changes in interest rates could materially adversely affect our funding costs and ability to successfully complete securitizations, which could in turn affect liquidity. Competitive factors, state limits and future regulatory reform may limit or restrict our ability to raise interest rates on our loans. If interest rates were to rise materially over a sustained period of time, and we are unable to sufficiently raise interest rates on our loans, our net interest margin could be adversely impacted, which could have a material adverse effect on our net earnings.
We do not enter into interest rate-sensitive financial instruments for trading or speculative purposes.
Readers should exercise care in drawing conclusions based on the above analysis. There are inherent limitations in any methodology used to estimate the exposure to changes in market interest rates. The sensitivity analysis provided above contemplates only certain movements in interest rates at a particular point in time based on the existing balance sheet. It does not attempt to estimate the effect of a more significant interest rate increase over a sustained period of time. It also assumes an immediate change in interest rates, without regard to the impact of certain business decisions or initiatives that we would likely undertake to mitigate or eliminate some or all of the adverse effects of the modeled scenarios.
Liquidity Risks and Strategies. Adequate liquidity and sources of funding are essential to our business. Funding and liquidity risks arise from several factors, many of which we cannot control, such as disruptions in
81
Table of Contents
the financial markets, changes in key funding sources, credit spreads, changes in future credit ratings and political and economic conditions.
We expect that our future credit ratings will be non-investment grade, which could have a significant impact on our cost of, and access to, capital. This, in turn, could negatively affect our ability to manage our liquidity and our ability and cost to refinance our indebtedness.
There are numerous risks to our financial results and to our liquidity, capital raising and debt refinancing plans. These risks include, but are not limited to, our inability to grow our personal loan portfolio with adequate profitability; the effect of federal, state and local laws, regulations, or regulatory policies and practices; potential liability relating to loans that we have sold or may sell in the future, or relating to securitized loans; and the potential for disruptions in bond and equity markets.
The principal factors that could impact our liquidity are customer delinquencies and defaults, and prolonged inability to adequately access capital market funding. We intend to support our liquidity position by:
| (1) | managing and maintaining disciplined underwriting standards and pricing for that loans we originate, and |
| (2) | pursuing additional debt financings (including new securitizations). |
However, it is possible that the actual outcome of one or more of our plans could be materially different than expected or that one or more of our significant judgments or estimates could prove to be materially incorrect.
Credit Risk. The risk inherent in our personal loan portfolio is driven by credit quality and is affected by borrower-specific and macroeconomic factors such as changes in employment. We manage this risk through our underwriting and credit approval guidelines, servicing policies and practices, as well as third-party and proprietary credit tools used to underwrite loans.
Our underwriting process utilizes both third-party and proprietary credit tools to evaluate an applicant’s credit standing, repayment ability and the value and adequacy of collateral, if any. We calculate and assign each applicant a OneMain Financial Credit Score that is used to generate an applicant’s risk rank. Once the risk rank is generated, we determine the applicant’s ability to repay a loan based on the adequacy of their residual income under our underwriting standards, including the payment on the proposed loan.
Origination and underwriting processes are systemically and centrally controlled with key inputs from the branch, with such branch inputs subject to post-closing quality reviews. The underwriting process requires that each applicant provide full documentation and verification of information provided in the loan application.
Currently all loan closings require an in-person meeting at a branch office, enabling us to verify customer identity and all required documentation, and further ensure that customers and branch employees form a personal connection that serves as the basis for a long-term customer relationship.
Furthermore, we have historically tightened our underwriting standards in times of greater economic uncertainty (including during the recent financial crisis) to compete in the market at loss rates acceptable for meeting our required returns. See additional discussion of our approach to credit risk in “Business.”
Critical Accounting Policies and Estimates
Note 2 (Summary of Significant Accounting Policies) to the audited combined financial statements contains a summary of our significant accounting policies, as well as a discussion of recently issued accounting pronouncements. These policies, as well as estimates made by management, are integral to the presentation of
82
Table of Contents
our results of operations and financial condition. While all these policies require a certain level of management judgment and estimates, this section highlights and discusses the significant accounting policies that require management to make highly difficult, complex or subjective judgments and estimates at times regarding matters that are inherently uncertain and susceptible to change. See also “Risk Factors.” Additional information about these policies can be found in Note 2 (Summary of Significant Accounting Policies) to our audited combined financial statements.
Allowance for Loan Losses. Management provides reserves for an estimate of probable losses inherent in the existing net receivables portfolio in the form of an allowance for loan losses. These reserves are established in accordance with the Company’s credit reserve policies. Our Chief Risk Officer and Chief Financial Officer review the adequacy of the credit loss reserves each quarter. The allowance for loan losses for non-TDR loans is based upon leading credit indicators, including loan delinquencies, changes in portfolio size and composition. Additionally, changes in economic trends, particularly changes in housing prices and/or unemployment, any recent changes in lending policies and procedures, or any operational changes, which could have a material impact to performance of the portfolio are assessed for potentially requiring increased reserves in cases where the impact of these changes is deemed to not be fully reflected in the changes to delinquency or portfolio size and composition.
Separate valuation allowances are determined for impaired loans whose terms have been modified in a TDR loan. The allowance for loan losses for TDR loans is determined by considering all available evidence, including, as appropriate, the present value of the expected future cash flows of the loans discounted at the loans’ original effective interest rates or the estimated fair value of the collateral less disposal costs. These expected cash flows incorporate modification program default rate assumptions. Changes in these estimates could have a direct impact on our credit costs in any period and could result in a change in the allowance. Changes to the allowance are recorded in Provision for credit losses.
Fair Value Measurements. We hold investments in debt and equity securities that are classified as available-for-sale, or AFS, and reflected at fair value on the Combined Statements of Financial Position. We primarily utilize third-party service valuation providers to assist us in deriving fair values based on various methodologies, including market quotes where available, external non-binding broker quotes and proprietary valuation models. We assess the reasonableness of these security values through various analytical techniques such as comparing the information obtained from the valuation service providers to other third-party valuation sources for selected securities. When available, quoted market prices are used to determine the fair value and such items are classified as Level 1 of the fair value hierarchy established under ASC 820-10, Fair Value Measurement. If quoted market prices are not available, fair value is based upon valuation models. Items valued using such model-based valuation techniques are classified according to the lowest level input or value driver that is significant to the valuation. For additional information on our fair value analysis, see Note 14 (Fair Value Measurements) to the audited combined financial statements.
Recognition of Changes in Fair Value. Changes in the valuation of the AFS investments, other than write-offs and credit impairments, generally are recorded in Accumulated other comprehensive income (loss), or AOCI, which is a component of Parent equity on the Combined Statements of Financial Position. A description of our policies and procedures relating to recognition of changes in fair value can be found in Note 2(d) (Summary of Significant Accounting Policies—Investments) to our audited combined financial statements.
Evaluation of Other-than-Temporary-Impairment. We conduct periodic reviews of securities with unrealized losses to evaluate whether the impairment is other-than-temporary. Under the guidance for debt securities, other-than-temporary impairment, or OTTI, is recognized in earnings in the Combined Statements of Operations for debt securities that we intend to sell or that we expect to be required to sell prior to recovery of the amortized cost basis. For those securities that we do not intend to sell, nor expect to be required to sell, credit-related impairment is recognized in earnings, with the non-credit-related impairment recorded in AOCI. An
83
Table of Contents
unrealized loss exists when the current fair value of an individual security is less than its amortized cost basis. Unrealized losses deemed temporary in nature are recorded net of tax in AOCI.
Asset Impairment. In addition to OTTI on investments described above, intangible assets subject to amortization are reviewed for impairment annually or whenever events or changes in circumstances indicate that the carrying amount may not be recoverable. Impairment is recognized if the carrying amount is not recoverable and exceeds the fair value of the intangible asset. For additional information regarding intangible assets, see Note 2(g) (Summary of Significant Accounting Policies—Intangible Assets) and Note 8 (Intangible Assets) to our audited combined financial statements.
Income Taxes. We are subject to the income tax laws of the United States, its states and local municipalities and the Canadian jurisdictions in which we operate. These tax laws are complex and are subject to differing interpretations by the taxpayer and the relevant governmental taxing authorities. Disputes over interpretations of the tax laws may be subject to review and adjudication by the court systems of the various tax jurisdictions or may be settled with the taxing authority upon audit. We are included in the consolidated federal and state income tax returns of Citi, where applicable, but also file certain separate state and foreign income tax returns. The tax provision is presented on a “separate company basis” as if we were a separate filer. The current tax liabilities for income taxes are settled with Citi on a periodic basis.
In establishing a provision for income tax expense, we must make judgments and interpretations about the application of these inherently complex tax laws. We must also make estimates about when in the future certain items will affect taxable income in the various tax jurisdictions, both domestic and foreign. Deferred taxes are recorded for the future consequences of events that have been recognized in the financial statements or tax returns, based upon enacted tax laws and rates. Deferred tax assets and liabilities relate to temporary differences between the financial reporting and income tax bases of our assets and liabilities. Deferred income tax expense or benefit represents the expected increase or decrease to future tax payments as these temporary differences reverse over time. Deferred tax assets are recognized subject to management’s judgment that realization is more likely than not. See Note 11 (Income Taxes) to our audited combined financial statements for a further discussion of our tax provision and related income tax assets and liabilities.
Insurance Policy and Claim Reserves. The liabilities for future policy benefits for long-duration policies are calculated using mortality, morbidity, lapse and yield assumptions that were set at the time of issue for each issue year of business and are not changed in future valuation periods.
The policy reserves for credit life, credit disability, credit IUI and collateral protection insurance equal related unearned premiums.
Claim reserves for losses are based on claims experience, actual claims reported and estimates of claims incurred but not reported. Assumptions are based on historical experience, adjusted to provide for possible adverse deviation. These estimates are periodically reviewed and compared with actual experience and industry standards, and revised if it is determined that future experience will differ substantially from that previously assumed. Since the reserves are based on estimates, the ultimate liability may be more or less than such reserves.
Legal and Regulatory Contingencies. See the discussion in Note 16 (Contingencies) to our audited combined financial statements for information regarding our policies on establishing accruals for litigation and regulatory contingencies.
84
Table of Contents
Overview
We are a leading consumer finance company in the United States, providing responsible solutions to credit-worthy individuals through our nationwide branch network and online channels. Our 100-plus year history and culture embodies our dedication to high-quality origination, underwriting and servicing of traditional, easily understood and transparent personal loans to primarily middle-income households. Our personal loans are fixed-rate, fixed-term and fixed-payment, which are attractive to our customers. We also offer optional products that protect customers in the event of unforeseen circumstances. We have been a stable and positive community presence using our industry-leading technology platform, proprietary underwriting process and data analytics to originate, price, manage, and monitor risk effectively through changing economic conditions. We have built a culture of compliance to anticipate, understand and embrace a changing regulatory environment. Our experienced management team, strong financial position, and adherence to our core values of customer advocacy, ethical leadership, ownership attitude, continuous improvement and personal development, position us well for future success and growth.
At the core of our business is a national, community-based network of 1,141 branches as of June 30, 2014, serving 1.3 million customer accounts across 43 states. This network is supported by our state-of-the-art technology platform that allows us to efficiently process applications and provide convenient self-service features for our customers. As of June 30, 2014, the network consists of a local, well-trained, front-end workforce of approximately 4,100 employees and is supported centrally by approximately 1,100 employees with additional functional support provided by Citi. Our captive insurance business, Citi Assurance Services, or CAS, is staffed by an additional workforce of approximately 215 employees. Our branch employees typically live in the communities they serve, and we believe our customers value the face-to-face interaction and the long-term relationships they build with our branch employees. This face-to-face interaction significantly enhances the value we provide to customers as we work together to assess their household budgets and ability to repay their loans. The knowledge gained and relationships built during the face-to-face interactions allow us to quickly service customers, while also improving our loan performance. Branches not only originate but also service loans through early-stage delinquency, which we view as a key aspect of our relationship-driven model. This relationship-driven model is further strengthened by our extensive and complementary centralized operations that deliver cost efficiencies and risk and compliance controls. Our experience suggests that combined, our branches and centralized operations are the most effective means for both serving our target customers and driving low default and delinquency rates in our loan portfolio.
Our customers are credit worthy and represent a unique segment of the middle-income market that is underserved by traditional banking institutions and can particularly benefit from our relationship-driven approach. Our customers typically come to us with a specific borrowing need. We believe our customers prefer and benefit from the face-to-face discussion of their household budgets and cash flow needs with our branch employees. Our customers value speed, convenience, service and funds availability as high priorities. Our customers have an average FICO score of 630 and an average income of $45,000.
During 2013, we advanced new funds totaling $3.2 billion, and at June 30, 2014, we had $8.2 billion of loans outstanding and 1.3 million customer accounts. For the year ended December 31, 2013, we had net income of $536 million, representing a return on assets of 5.4% and return on equity of 19.9%. For the six months ended June 30, 2014, we had net income of $287 million, representing a return on assets of 6.0% and a return on equity of 19.1%.
Industry and Market Overview
The U.S. consumer finance industry has approximately $3.1 trillion of outstanding borrowings and includes vehicle loans and leases, credit cards, student loans and personal loans. Our 1.3 million customer accounts
85
Table of Contents
represent a very small fraction of the approximately 115 million Americans that generally align with our customer base (FICO scores between 550 and 749). We believe that most of this population is underserved and provides an attractive market opportunity for our business.
| $3.1 Trillion Consumer Finance Industry | U.S. FICO Score Distribution | |
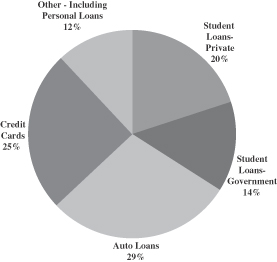
|
| |
| Sources: Federal Reserve Bank of New York; Federal Student Aid/U.S. Department of Education. As of March 2014. | Source: FICOTM Banking Analytics Blog. © Fair Issac Corporation. As of April 2014. | |
As a leading player in the highly-fragmented, non-prime consumer finance industry, we believe we are uniquely positioned to take advantage of this opportunity. Many existing consumer lenders operate at a regional level and typically have fewer than 200 branches and less than $2 billion in loans outstanding. With 1,141 branches and $8.2 billion loans outstanding as of June 30, 2014, we believe we are well positioned to maintain and expand our market share with our robust physical and online presence.
Our Strengths
Largest Consumer Finance Branch Network in the United States with Complementary Centralized Support Operations
Our business is large and well established with 1,141 branches as of June 30, 2014, serving 1.3 million customer accounts across 43 states. Our national, community-based branch network is the foundation of our relationship-driven business model and is the product of thoughtful market identifications and profitability analysis. Our centralized operations provide customer services, transaction processing and late-stage collection efforts, driving operating efficiencies and risk and compliance control. We believe the scale of our business, resulting operating efficiencies, proprietary industry knowledge and investment in regulatory compliance contribute significantly to our success and profitability.
Industry-Leading Technology Strategy and Platform
We believe that our technology platform is a strategic asset compared to our competitors’ capabilities and we maintain a well-defined technology strategy and investment plan to protect our competitive edge. Technology investments improve our speed of service and ability to respond to customer needs and help drive our efficiency, scale and stable operations. We use a centrally-run technology platform with proprietary applications for
86
Table of Contents
originations, servicing and collections to provide a seamless, real-time link between our branches and our centralized operations. The cornerstone of this platform is our internally developed, front-office processing platform that integrates our key business functions into a single, web-based solution. Additionally, our expanding digital capabilities are helping us service and grow our customer base.
Centralized Risk Analytics Supported by Our Proprietary, National Database
Our longevity and stability results from our focus on providing straightforward, traditional loan products and our conservative approach to originating loans. While our branches originate and service loans, our pricing, loan underwriting and approval decisions are made centrally through our risk management system. Our disciplined risk management model and advanced analytics effectively complement localized branch operations to drive low default and delinquency rates. We use a rigorous underwriting process that leverages standard and proprietary credit tools built using customer performance data from our national lending database. Our long-tenured and experienced branch staff complements our data-driven process.
Extensive Experience with Complex Regulatory Oversight and Strong Compliance Culture
We have extensive experience operating in a complex and highly regulated environment. We have built a robust compliance culture in the last decade and established processes and controls to monitor our legal and regulatory adherence. Our primary regulators are state regulators from whom we have state level licenses, the Board of Governors of the Federal Reserve System, or the Federal Reserve Board, and the Consumer Financial Protection Bureau, or the CFPB. In 2013, state regulators conducted exams of over 600 of our branches and centralized sites. In addition, as a subsidiary of a bank holding company, we have been closely examined a number of times by the Federal Reserve Board and continue to have regular interactions with them. We also have been examined several times by the CFPB, and we believe our business is well suited to address their requirements.
Robust Financial Performance
Since the most recent economic downturn, we continued to increase our profitability in 2012 and 2013 with net income of $407 million and $536 million, a return on assets of 4.0% and 5.4% and an operating efficiency ratio of 34.8% and 32.5% in each of the two years, respectively. We believe our consistent profitability can be attributed to our rigorous underwriting process, strong pricing and expense discipline, operational expertise and loyal customer base.
Seasoned Management with Extensive Industry Experience
We have highly experienced employees throughout all levels of our organization. Mary McDowell, our Chief Executive Officer and President, is an accomplished financial services executive with more than 30 years of experience in consumer finance and was the 2010-2011 Chair of the American Financial Services Association, the consumer credit industry’s trade organization. Senior leadership has an average of 24 years of experience in consumer finance and an average tenure of 18 years at OneMain and/or Citi. Our branch network employees and managers hold an average tenure of 11 and 14 years, respectively, and our district managers and area directors average 19 and 24 years of experience, respectively, when looking at their combined years of service at OneMain and Citi.
87
Table of Contents
Our Business and Growth Strategy
We are a leading branch-based consumer finance business in the United States, and our two-prong strategy is to enhance stockholder value by (1) maintaining our attractive profitability profile and (2) growing our business through new origination channels, capabilities and new products, as follows:
Maintain Our Attractive Profitability by Focusing on Fundamental Aspects of Our Business
| • | Customer-Centric Strategy: Our customer-centric strategy is to continue to deliver responsible solutions consistent with fair lending principles to our customers to grow our market and gain market share. Improving the customer experience is the primary motivation for our investments in digital, product and service innovations. |
| • | Data-Driven, Analytical Approach to Profit Optimization: Data analysis is the core of our business engine, and the multi-decade history of consumer behavior that forms the backbone of our analytics gives us a strong competitive advantage. Our ability to link marketing activity, branch incentives, financial return and risk analytics to drive profitability forms the foundation of our strategy. We continuously improve our data collection, management and analytical capabilities to further expand growth possibilities and focus on the most profitable opportunities. |
| • | Highly Efficient and Scalable Operations: We believe that we are an industry leader in operating efficiency, and we remain diligent by continuously leveraging digital advancements and other opportunities to optimize our expense base. We test new branch models, layouts, locations and centralized support and distribution options on a regular basis to optimize employee focus on customers while maintaining efficiency. We design technology platforms for our centralized operations and branches that are scalable so that we may grow efficiently. |
| • | Diverse Funding Sources: We have the proven ability to finance our business from a variety of funding sources, including cash flows from operations and the capital markets in the form of two personal loan securitizations. |
Grow Our Business Through New Origination Channels, Capabilities and Products
| • | Increase Personal Loan Volume through New Channels: We are growing volume by expanding outreach to new customers through physical and digital channels. On the physical front, we are focusing on customer referrals and our partnerships with retailers and other institutions that cater to our core customer base. We are also growing leads through digital channels by extending our network of over 40 online partners (for example, our relationship with a leading “peer-to-peer” online lending platform), increasing volume through our dedicated online portal and leveraging channels such as social media. |
| • | Digital Sales and Service Enablement: We are developing new capabilities as part of our digital strategy to enhance our response to personal loan applications through all channels. We have been testing centralized capabilities to onboard new borrowers that complement our local presence and increase the volume of loans we make. These capabilities allow us to provide rapid response times to customers from both physical and digital channels, for inquiries and pre-closing services. We have launched 20 fully operating “Discovery Branches” to test new technologies, operating models and processes that increase our productivity, improve the customer experience, accelerate learning and speed deployment across the network. Discovery Branch learnings, along with our investments in new account and data management systems and enhanced web capabilities, are helping us create the flexibility to originate, fund and service loans online. |
| • | Broaden Our Product Offering: We believe that we can successfully offer additional complementary financial products to our customers. In 2013, approximately 65% of our customer base purchased optional products in addition to receiving a personal loan. We may either develop additional |
88
Table of Contents
| complementary financial products ourselves or distribute them on behalf of partners. We have achieved success with these strategies in the past. Leveraging our risk expertise and extensive branch network with expanded solutions has the potential to both increase the products available to existing customers and attract new customers. |
Our History and Development
We have been operating since the founding of our predecessor, Commercial Credit Company, in 1912. Since our founding, we have grown both organically as well as through various acquisitions. Commercial Credit Company acquired Primerica in 1988, forming the Primerica Corporation, which acquired the Travelers Corporation in 1993. Following the merger of Travelers Group with Citicorp to form Citigroup Inc., in 1998, Commercial Credit was rebranded as CitiFinancial in 1999.
Prior to 2011, we were part of a larger business within Citi known as CitiFinancial North America, or CFNA, the U.S. business of which contained approximately $10 billion of personal loans and $15 billion of mortgage and real estate loans. In the middle of 2010, management decided to split the U.S. business of CFNA into two distinct business lines. OneMain, the go-forward business, retained the majority of U.S. personal loans and a portion of U.S. real estate loans. CitiFinancial Servicing was formed with the remaining portion that did not strategically align with OneMain’s go-forward origination and risk strategy. The CitiFinancial Servicing business was designed to support certain customers and loans that would benefit from expanded support, including loan modifications or restructurings, rather than originate loans. For a discussion of the separation and how it and subsequent transactions are presented in our combined financial statements, see “Management’s Discussion and Analysis of Financial Condition and Results of Operations—Segment Overview.”
Upon the consummation of this offering, we will enter into a number of agreements with Citi that will govern the relationship between Citi and us. We currently expect to incur additional expenses to operate as a fully independent public company. For a discussion of these expenses, see “Management’s Discussion and Analysis of Financial Condition and Results of Operations—Our Separation from Citi.” For a discussion of certain risks associated with our separation from Citi, see “Risk Factors—Risks Relating to Our Organization and Structure.”
Business Operations
Customers
Our customers do not neatly align with the traditional categorizations of prime and non-prime credit. While many of our customers have FICO scores within the non-prime range, they also exhibit a number of positive attributes that make them more credit-worthy candidates than many non-prime borrowers. Our typical customer is employed full-time with an average income of approximately $45,000 per year, has demonstrated stable employment (68% have been in their current job for more than five years), and is a homeowner with an average tenure of over 11 years in his or her home (62% of customers are homeowners). The average FICO score of our customers is 630 as of June 30, 2014. These customers represent a unique slice of the middle-income market that has been overlooked by traditional banking institutions. Our customers typically come to us with a specific borrowing situation. We believe our customers prefer and benefit from the face-to-face discussion of their household budgets and cash flow needs with our branch employees. Our customers value speed, convenience, service and funds availability as high priorities.
Our customers return to us when they have a subsequent credit need. Since 2009, existing and former customers have consistently accounted for over 70% of originations. We believe that our target customer base represents an attractive and high-potential market whose financial needs can be best serviced and managed through our branch network and relationship-driven servicing approach.
89
Table of Contents
Products and Services: Lending
We offer unsecured and auto-secured personal loans. We have consistently maintained a conservative approach to lending and only offer fixed-rate, fixed-term, fixed-payment loans requiring a documented ability to pay, ensuring individuals receive a responsible and appropriate product for their household budgets. All of our loans are self-originated through our branch network and require a face-to-face meeting with the customer prior to closure.
As of June 30, 2014, our portfolio consisted of approximately 79% unsecured loans, with the remaining loans secured by a customer’s automobile. Our weighted average loan balance as of June 30, 2014 was $6,189, and our average loan term was 5.1 years. Due to our geographically dispersed branch network, our portfolio benefits from broad state diversification, with no single state comprising more than 10% of the portfolio. Primary drivers of pricing include borrower credit profile (including homeownership), state-based regulations, loan size and security underlying the loan. Baseline pricing is generally set at the state regulatory cap level or 36%, whichever is lower, with downward adjustments to prices made for better credit profiles and availability of a qualifying automobile. Our customers report consistently strong customer satisfaction scores of over 85%, and 75% of the loans in our portfolio as of June 30, 2014 were made to repeat customers (60% renewals, 15% former borrowers).
Products and Services: Insurance
In addition to personal loans, we offer optional protection products, including credit life, credit disability and credit involuntary unemployment insurance and collateral protection insurance, along with a home and auto membership product. These products are distributed in the branches through a robust and highly structured sales process to ensure that customers understand the benefits, costs and optional nature of the products. Credit insurance products are underwritten and administered by American Health and Life Insurance Company and Triton Insurance Company, members of a group of insurance entities within Citi Assurance Services, or CAS. CAS is a leading credit insurance franchise and debt protection administrator. Although CAS is currently only a captive underwriter, it ranks third in the United States based on 2013 credit insurance premium writings, and based on our estimation we are one of the top two debt protection administration providers.
In addition, CAS also earns revenue from its relationship with Citi’s affiliates. In 2014, CAS will enter into two five-year agreements with Citi to continue providing administration services for Citi’s debt protection product portfolios. CAS will also enter into a five-year insurance distribution agreement with CitiFinancial Canada whereby we will continue to be the sole underwriter for all the credit insurance products sold by CitiFinancial Canada to its customers. Headquartered in Fort Worth, Texas, CAS has the authority to offer products in all 50 states and Canada, and possesses a flexible operating infrastructure with the ability to increase scale and improve efficiencies. CAS has historically provided a number of benefits to us, including: incremental returns derived from underwriting and investment income, incremental loss mitigation as a result of claims paid and back-up liquidity in the event of an adverse situation through utilization of excess surplus in the insurance companies.
Customer Acquisition
We use a variety of channels to drive applications to our branches. Our customer sourcing strategy is built on efficiently acquiring new customers while also retaining and growing relationships with profitable existing customers. The primary sources for new customer acquisitions are targeted direct mail offers and various web-sourced origination channels. Our prospect mail program employs a dynamic, state-based strategy that considers return on assets targets and acceptable risk thresholds and is highly responsive to changing realities in the marketplace, allowing us to quickly align solicitations with current market conditions and underwriting parameters. Prospect mailings are prioritized and selected based on customer returns in order to optimize the efficiency and profitability of loans sourced through the campaigns. We predict profitability based on a series of
90
Table of Contents
frequently updated models derived from historical performance, proprietary internal analytics, market conditions and third-party data sources.
Online application sourcing increasingly provides another significant source of new customers with online sourcing through Internet search, partnerships and affiliates accounting for 46% of all new borrower applications in 2013, up from 33% in 2010. We are aggressively expanding our existing capabilities to better attract and serve online customers. Our marketing strategy also includes seasonal marketing campaigns, community outreach and national/regional sponsorships to increase overall brand loyalty and awareness.
Renewals are primarily generated through our branch lead management system and supported by marketing campaigns. Renewals enable us to expand our relationship with well performing customers. Renewals are fully re-evaluated through the standard underwriting process as if they were new loans. Our direct experience with the customer becomes an additional input into the underwriting model. Renewals generate incremental loan volume for us at highly attractive customer acquisition costs, leveraging significant insight into the customer’s underlying creditworthiness.
The following map depicts the locations of our branch network at June 30, 2014:
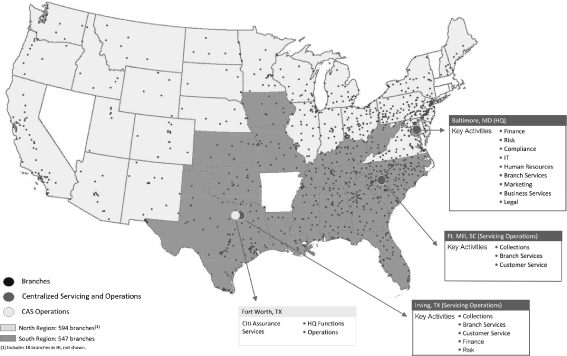
Credit Risk
We have always originated and underwritten loans for our own portfolio. As we hold the performance risk on the portfolio, we are very focused on the quality of loans that we originate. We employ an underwriting process that utilizes both industry-wide and proprietary credit tools to underwrite loans. These underwriting standards are intended to evaluate an applicant’s credit standing, repayment ability and the value and adequacy of collateral, if any. Origination and underwriting processes are systemically and centrally controlled with key inputs from the branch, with such branch inputs subject to post-closing quality reviews. The underwriting process requires that each applicant provide full documentation and verification of information provided in the loan application. Potential customers may apply for loans in person, via phone or on our website, but currently all
91
Table of Contents
approved applications require an in-person meeting at one of the branch offices for the closing of a loan. The in-person meeting enables us to verify customer identity and all required documentation, further ensuring that customers and branch employees form a personal connection that serves as the basis for a longer-term customer relationship.
We closely monitor how changes in our underwriting strategy and standards affect the underlying performance and loss profile of our outstanding loans.
Account Servicing
Loans are serviced in the local branches until later stages of delinquency. Our experience with our customer base suggests that the needs of our consumers can be best serviced through a high-touch, relationship-driven approach. Some customers choose to submit payments in person at our branches, and our branch employees are trained to identify issues early and use certain tools to mitigate potential credit losses.
Operational Controls
Compliance and control are central to our commitment to fair lending and fairness practices. We maintain comprehensive systems and operational controls to ensure compliance with applicable federal and state laws and regulations. Senior management sets the tone for effectively managing compliance risk and has established a culture of compliance in which every employee recognizes his or her compliance responsibility, including the responsibility to appropriately communicate and escalate issues. Senior management coordinates compliance efforts, ensures that there are sufficient resources to manage compliance risk and supports the independence of the compliance function. Our training focuses on consistent and strong compliance, and compliance is emphasized by the requirement that every employee, up to and including our chief executive officer, take annual compliance training. Various tools are used to assess and monitor our activities, including monthly branch self-assessments, semi-annual district manager reviews and management control assessments for centralized functions.
Our compliance control program includes monitoring and testing of compliance in connection with internal policies and procedures of various business functions (including marketing, risk and loss mitigation) and applicable external factors (including applicable regulatory requirements). Our internal audit group reviews our control programs to assess our compliance with internal policies and applicable regulatory requirements.
Training
Employee development is a key factor for our success. It begins at the time of hire and continues throughout an employee’s career and encompasses training in the core areas of technical skills, sales, professional development, loss mitigation, regulatory requirements and business initiatives. In 2013, we provided an average of 69 hours of training per employee. We develop and tailor 76% of our training curriculum ourselves and deploy it efficiently with our decentralized network of training resources, field resources and web-based training, including over 150 web-based courses.
Technology
Overview
We believe that our technology platform is a strategic asset, and we maintain a well-defined technology strategy and investment plan to protect our competitive edge. Our technology provides support for our stable operations by adding scale, control, flexibility and operating efficiencies. Our centrally-run technology platform with proprietary applications for originations, servicing and collections provides a seamless, real-time link between our branches and our centralized operations. Over the past six years, we have invested over 30% of our
92
Table of Contents
technology budget in innovation and systems lifecycle management. Through 2016, we expect to invest over $50 million in new technologies designed to enhance digital solutions, modernize back-office platforms and improve the customer experience. We anticipate that these investments will enhance our customer experience by offering more flexible payment and funding options, extending mobile/channel access capabilities, offering more customer self-service features and implementing full electronic document management. These investments will also provide an opportunity to reduce system development cycles and improve time-to-market product innovations.
Front and Back-Office Systems
Symphony, a $120 million technology investment launched in 2012, integrated our originating, underwriting, servicing and payment processing platforms into a single, web-based platform. Symphony has provided significant benefits by improving our solicitation and lead management capabilities, strengthening operating controls and improving the web-based, self-service customer experience. Additionally, our back-office systems for account management are highly integrated with Symphony. In 2014, we started the process of migrating our back-office systems to a third-party partner to create additional flexibility, a stronger technology model and improved operational efficiency.
Data Management and Analytics
Our data is a strategic corporate asset. We use business intelligence and analytics technologies to analyze portfolio performance and to optimize and measure marketing initiatives. Data from our origination system, account management platform and third-party providers is consolidated into a common repository used by the information tools for finance, marketing and risk. Branch staff have full access to an interactive performance measurement, incentive and operational reporting system that provides real-time positions for employee and branch key performance metrics.
Competition
The U.S. consumer finance industry has approximately $3.1 trillion of outstanding borrowings and includes vehicle loans and leases, credit cards, student loans and personal loans. Our 1.3 million customer accounts represent a very small fraction of the approximately 115 million Americans that generally align with our customer base (FICO scores between 550 and 749). We believe that most of this population is underserved and provides an attractive market opportunity for our business.
We believe our scale and national branch footprint are well positioned to provide our addressable market of customers a better and more efficient experience. Customers come to us based on the quality of the relationship that is established with customers, speed of funding, the flexibility of terms and servicing provided and the level of customer service delivered. We see our advantages as including:
| • | well-defined loan origination and servicing processes with strong compliance controls; |
| • | experienced, well-trained, branch-based sales force with strong community relationships; |
| • | efficient, scaled operations that increase sales productivity of the branch employees; |
| • | strong centralized controls for pricing, approvals and exceptions; and |
| • | integrated decision making that links marketing strategy, risk scoring and employee incentives to increase profitability. |
These advantages allow us to successfully drive profitable revenue growth while maintaining our strong loan performance.
93
Table of Contents
Regulation
The U.S. consumer lending industry is highly regulated under federal and state law. We are subject to examination, supervision and regulation by each state in which we are licensed. We are also currently and in the future may be regulated by the CFPB. In addition, as long as we continue to be a subsidiary of Citi, a bank holding company, we are subject to oversight by the Federal Reserve Board.
State Lending Regulation
Various state laws and regulations govern our consumer finance operations. In general, state statutes establish maximum loan amounts, terms, interest rates and fees that may be charged for lending. Specific allowable charges vary by state and by type of license maintained. In addition, state laws regulate the keeping of books and records and other aspects of the operations of consumer finance companies including collection practices.
We are separately licensed under the laws of each state in which we operate. Licenses granted by the regulatory agencies in these states are subject to renewal every year and may be revoked for failure to comply with applicable state and federal laws and regulations. We are also examined regularly by state regulators. In 2013, almost 600 of our branches were examined by state regulators. There is a clear trend of increased state regulation, as well as more detailed reporting requirements, more detailed examinations and increased coordination of examinations among the states. The Dodd-Frank Act empowers state attorneys general and state regulators to bring actions to remedy violations of such laws and regulations, and we are beginning to see some states exercise this authority.
State Insurance Regulation
State authorities regulate and supervise the insurance products and services we offer, such as credit insurance products. The extent of such regulation varies by product and by state, but relates primarily to licensing; conduct of business, including marketing and sales practices; periodic financial and market conduct examination of the affairs of insurers; form and content of required financial reports; solvency standards; limitations on the payment of dividends and on affiliate transactions; types of products offered; approval of policy forms and premium rates; permissible investments; reserve requirements for unearned premiums, losses and other purposes; and claims processing.
The CFPB
In 2010, Congress enacted the Dodd-Frank Act and created a new agency, the CFPB, which has significant authority to implement and enforce federal consumer financial protection laws and regulations. The CFPB also engages in consumer financial education, requests data and promotes the availability of financial services to underserved customers and communities. The CFPB also has the authority to identify and prohibit unfair, deceptive and abusive acts and practices. The CFPB has regulatory, supervisory, examination and enforcement powers over most providers of consumer financial products and services, including us. Since its establishment, the CFPB has conducted a number of exams of our business.
In addition to its regulatory, examination and supervisory powers, the CFPB has enforcement powers. In the event of violations of consumer financial laws or regulations, the CFPB can impose monetary penalties, mandate restitution, require remediation of practices and/or pursue administrative proceedings or litigation. The CFPB has actively used its enforcement authority against financial institutions and financial service providers for practices relating to the sale of additional products associated with the extension of credit, including the imposition of significant monetary penalties and orders for restitution and orders requiring mandatory changes to compliance policies and procedures, enhanced oversight and control over affiliate and third-party vendor agreements and services and mandatory reviews of business practices, policies and procedures by third-party auditors and
94
Table of Contents
consultants. If, as a result of an examination, the CFPB were to conclude that our loan origination, servicing activities or debt collection practices violate applicable law or regulations, we could be subject to a formal or informal enforcement action. Enforcement is often driven by an online complaint system that allows consumers to log complaints with respect to various consumer finance products, so general complaints regarding consumer lending, even if they are made with respect to other firms, could lead to CFPB investigation and review of us. Formal enforcement actions are generally made public, which carries reputational risk. Even when we are no longer part of Citi, we anticipate that we may be subject to CFPB oversight because of the size of our business, owing to the CFPB’s supervisory authority based on risk determination or its ability to define a “larger participant” in certain financial services markets.
The CFPB may limit the use of pre-dispute mandatory arbitration clauses in contracts for consumer financial products or services. In December 2013, the CFPB published preliminary research on the use of such clauses and it is in the process of preparing a statutorily mandated report to be delivered to Congress. If limits are placed on the use of pre-dispute mandatory arbitration clauses, we would bring our contracts into compliance with those limitations, and our litigation exposure could increase.
The Federal Reserve Board
Because we are controlled by Citi, a bank holding company and a “financial holding company” regulated by the Federal Reserve Board, we have been subject to certain regulations, supervision and examination by the Federal Reserve Board. We have been subject to exams by the Federal Reserve Board for many years and for as long as we are controlled by Citi for bank regulatory purposes, we will continue to be subject to regulation, supervision, examination and potential enforcement action by the Federal Reserve Board. For example, we are subject to restrictions on paying dividends or taking capital actions without prior approval of the Federal Reserve Board. Following this offering, we will continue to be controlled by Citi, however, once Citi is no longer deemed to control us for bank regulatory purposes, we will no longer be subject to such restrictions. The ownership level at which the Federal Reserve Board would consider us to no longer be controlled by Citi is a matter of facts and circumstances, including the extent of our total relationships with Citi.
Other Federal Laws and Regulations
In addition to the Dodd-Frank Act and state and local laws and regulations, numerous other federal laws and regulations affect our lending operations. These laws and their implementing regulations include, among others, anti-money laundering requirements (Bank Secrecy Act and USA PATRIOT Act), Equal Credit Opportunity Act, Fair Debt Collection Practices Act, Fair Credit Reporting Act, privacy regulations (Gramm-Leach-Bliley Act and Right to Financial Privacy Act), Electronic Funds Transfer Act, Servicemembers’ Civil Relief Act, Telephone Consumer Protection Act, Truth in Lending Act, Health Insurance Portability and Accountability Act of 1966 and requirements relating to unfair, deceptive, or abusive acts or practices. For example:
| • | Under the Fair Credit Reporting Act, we must provide certain information to customers whose credit applications are not approved on the basis of a report obtained from a consumer reporting agency, promptly update any credit information reported to a credit reporting agency about a customer and have a process by which customers may inquire about credit information furnished by us to a consumer reporting agency. |
| • | Under the Gramm-Leach-Bliley Act, we must protect the confidentiality of our customers’ nonpublic personal information and disclose information on our privacy policy and practices, including with regard to the sharing of customers’ nonpublic personal information with third parties. This disclosure must be made to customers at the time the customer relationship is established and, in some cases, at least annually thereafter. |
| • | Under the Truth in Lending Act and Regulation Z promulgated thereunder, we must disclose certain material terms related to a credit transaction, including, but not limited to, the APR, finance charge, amount financed, total number and amount of payments and payment due dates to repay the indebtedness. |
| • | Under the Equal Credit Opportunity Act and Regulation B promulgated thereunder, we cannot discriminate against any credit applicant on the basis of any protected category, such as race, color, |
95
Table of Contents
| religion, national origin, sex, marital status or age. We are also required to make certain disclosures regarding consumer rights and advise customers whose credit applications are not approved of the reasons for the rejection. |
| • | Under the Servicemembers Civil Relief Act, there are limits on interest rates chargeable to military personnel and civil judicial proceedings against them, and there may be limitations on our ability to collect on a loan originated with an obligor who is on active duty status and up to nine months thereafter. |
| • | Under the Health Insurance Portability and Accountability Act of 1996, implemented and enforced by the Office for Civil Rights within the Health and Human Services Department, our insurance operations must comply with strict privacy standards for the use and disclosure of individual’s health information. |
Securitization Rules
In 2014, we raised capital through securitization of our loan portfolio, and we intend to engage in similar financings in the future. The Dodd-Frank Act may adversely affect the securitization market due to proposed rules related to risk retention requirements for certain types of securitized assets. Certain lower-risk “qualifying” loans would be exempt from the risk-retention rules under the proposal, but we expect that any securitizations we may offer generally will not fit into the exempt categories. Once implemented, the risk retention requirement may result in higher costs of certain origination operations and limit our ability to securitize our consumer loans. The impact of the risk retention rule on the asset-backed securities market is uncertain.
In addition, as we are a controlled subsidiary of Citi, we are subject to the Volcker Rule prohibitions on investing in or sponsoring “covered funds,” which means that by July 21, 2015, if we are still a controlled subsidiary of Citi, our securitizations of loans will need to be structured to qualify for an exclusion from the definition of an investment company under the Investment Company Act of 1940, such as the Investment Company Act Rule 3a-7 exclusion for certain issuers of asset-backed securities or, if we intend to depend upon another exclusion, will need to comply with the provisions of the Volcker Rule regulations. After we are no longer a controlled subsidiary of Citi, we expect that we will still want to structure our loan securitizations so as to not be covered funds under the Volcker Rule in order for us to sell interests to banking entities. Currently, neither of our securitizations would be considered covered funds.
Segment Information
Our reportable segments include Lending and Insurance. See Note 4 (Business Segments) of the audited combined financial statements for the year ended December 31, 2013 and Note 3 (Business Segments) of the unaudited combined financial statements for the six months ended June 30, 2014, in each case, included elsewhere in this prospectus for certain financial information regarding our operating segments.
Seasonality
Our loan volume is generally highest during the months of May and November, primarily due to marketing around our customer appreciation days and the holidays. Demand for our loans is usually lower in January and February after the holiday season and preceding tax season. Delinquencies on our loans tend to peak in the fourth quarter, and higher net charge offs on these loans usually occur in the first and second quarter of the following year. These seasonal trends contribute to fluctuations in our operating results and cash needs throughout the year.
Properties
We generally conduct branch office operations, branch office administration, other operations and operational support in leased premises. All of our branches are leased, and branch lease terms generally range from three to five years. We currently share our executive offices and operational support and administrative facilities with other Citi entities. In addition, we have employees in several other Citi facilities throughout the
96
Table of Contents
country that are primarily staffed by other Citi entities and include both Citi owned and leased locations. We also expect to enter into agreements to lease a new corporate headquarters in Baltimore, Maryland, under which we expect to incur an aggregate of $34 million in expense over a term that will commence in March 2015, which we anticipate will be less, on an annual basis, than our current arrangements.
Employees
As of June 30, 2014, we had approximately 5,400 employees, including CAS, with additional functional support provided by Citi. Our employees are not represented by a union.
Registered Trademarks
We have a number of registered service marks, including “OneMain” and “OneMain Financial.”
Legal Proceedings
From time to time, we are party to legal proceedings that arise in the ordinary course of our business. We are not presently party to any legal proceedings the resolution of which we believe is reasonably likely to have a material adverse effect on our business, financial condition or results of operations.
Our affiliate, CitiFinancial, Inc., is party to a class action claim in West Virginia for allegedly selling insurance with inflated premiums and for allegedly taking impermissible security interests in household goods. Although we are not party to this lawsuit, we may be subject to liability under the Stockholder’s Agreement pursuant to which we will agree to indemnify Citi for liabilities of any kind arising from the business, assets, contracts, properties, activities or practices now, hereafter or previously conducted, owned or operated by us or our legacy entities, businesses or assets, including legacy entities, businesses or assets retained by Citi whether in CFNA or retained elsewhere, or previously divested by us or Citi. See “Certain Relationships and Related Party Transactions—Relationships with Citi—Stockholder’s Agreement.”
97
Table of Contents
Executive Officers and Directors
The following table sets forth information regarding our executive officers and directors as of the date of this prospectus:
| Name |
Age | Position | ||||
| Mary McDowell |
56 | Chief Executive Officer, President and Director | ||||
| Micah Conrad |
43 | Chief Financial Officer | ||||
| John Schachtel |
53 | Chief Operating Officer | ||||
| Dava Carson |
49 | President, Citi Assurance Services | ||||
| Stephen Wheeler |
46 | Chief Risk Officer | ||||
| Sean Bennett |
43 | Chief Strategy Officer | ||||
| April O. Park |
54 | General Counsel and Corporate Secretary | ||||
| William J. Mills |
59 | Director | ||||
| Francesco Vanni d’Archirafi |
54 | Director | ||||
The following sets forth certain biographical information with respect to our executive officers and directors.
Mary McDowell is Chief Executive Officer, President and Director of OneMain. Ms. McDowell joined Citi in 1991, and has served as Chief Financial Officer for businesses including our predecessor, CitiFinancial Mortgage Company, Citicorp Trust Bank and the insurance business now known as Citi Assurance Services. In 2003, Ms. McDowell was named President of CitiFinancial Auto. In July of 2006, Ms. McDowell joined CitiFinancial North America as the President and Chief Operating Officer, responsible for managing the operations of the entire branch network. Ms. McDowell was promoted to President and CEO of CitiFinancial Credit Company in 2007. Prior to joining Citigroup, she spent 11 years with Ernst and Young, serving clients in the financial services industry, through audit, tax and consulting services, including due diligence for acquisitions. Ms. McDowell currently serves on the Board of CitiFinancial Credit Company and is on the Board of Trustees and the Executive Committee of Living Classrooms in Baltimore. She also serves on the Board of Directors and the Executive Committee of American Financial Services Association and was a Chair in 2010-2011. Ms. McDowell earned a Bachelor of Business Administration in Accounting from Texas A&M University and graduated Summa Cum Laude. She is also a Certified Public Accountant. We believe Ms. McDowell is qualified to serve on our Board of Directors due to her extensive background in consumer finance and accounting and her experience as a leader in both financial and operational roles.
Micah Conrad is the Chief Financial Officer of OneMain. Mr. Conrad joined Citi in 2003 and has served in a variety of senior finance roles within Global Wealth Management, Citi Private Bank and Institutional Clients Group. Prior to joining OneMain in October 2013, Mr. Conrad served over three years as a Senior Finance Officer with Citi Holdings, the parent business of OneMain. Mr. Conrad was responsible for financial oversight of Brokerage & Asset Management, Citi Reinsurance, Student Loans and various consumer finance businesses. Mr. Conrad holds a Master of Science in Finance from Bentley University McCallum School of Business and is a CFA Charterholder.
John Schachtel is Chief Operating Officer, responsible for oversight of Sales and Field Operations, Chief Business Office, Marketing, and Centralized Collections. Prior to assuming the Chief Operating Officer role, Mr. Schachtel served 11 years as the Executive Vice President, Northeast & Midwest Division. Before beginning his role in the field, Mr. Schachtel started with the company in 1987 as an Operations Director and added additional roles including Director of Field Compensation, New Branch Development and Project Management before becoming Senior Vice President of Corporate Marketing in 1999. Mr. Schachtel also worked in related roles for two years at the affiliate Travelers company. He holds a Bachelor of Science degree from Northwestern University and an MBA in Finance from New York University.
98
Table of Contents
Dava Carson was named President of the insurance business, Citi Assurance Services in 2007. Previously, Ms. Carson was the Chief Financial Officer for Citi Assurance, where she was responsible for financial control, planning, actuarial services and oversight of Canadian operations. Prior to joining Citi Assurance in 2003, Ms. Carson was Senior Vice President, Planning and Analysis for CitiFinancial Mortgage Company. Prior to joining Citi in 2001, Ms. Carson held positions with Assurant Solutions and Ernst & Young, serving primarily in financial control capacities. Ms. Carson earned a Bachelor of Science degree in Accounting from Oklahoma State University where she graduated Summa Cum Laude. She is also a Certified Public Accountant.
Stephen Wheeler was named Chief Risk Officer in 2013. He was promoted to this role after serving four years as Senior Credit Officer for OneMain. Mr. Wheeler also served as a Credit Policy Sr. Manager within our CitiFinancial Auto business. Prior to joining Citi, he was Credit Policy Director at Bank First. Mr. Wheeler has been with Citi for 19 years holding various positions at The Associates and Arcadia Financial, Ltd. that Citi acquired. Mr. Wheeler earned a Bachelor of Arts degree from the University of Minnesota.
Sean Bennett assumed the role of Chief Strategy Officer for OneMain in 2013. Prior to this role, he served as the Head of Strategy for Citi Holdings, parent business of OneMain. Mr. Bennett joined Citi in 2007, working in senior strategy roles in our Global Wealth Management and Private Bank businesses. Before joining Citi, Mr. Bennett held positions at Marakon Associates and Lehrer McGovern Bovis (now Lend Lease). Mr. Bennett earned a Bachelor of Science degree in Industrial & Management Engineering from Rensselaer Polytechnic Institute, and both a Master of Science in Industrial Engineering and an MBA from Columbia University. Mr. Bennett also served as a Captain in the U.S. Army Reserve.
April O. Park is the General Counsel and Secretary of OneMain. Ms. Park joined OneMain’s predecessor company in 1997 as Associate General Counsel and became General Counsel in 2005. Prior to joining Citi, Ms. Park was a partner at Niles Barton & Wilmer. Ms. Park earned a Bachelor of Arts degree from McDaniel College and a Juris Doctorate from University of Maryland School of Law. Ms. Park serves on the Board of The Baltimore Urban Debate League.
William J. Mills joined our Board of Directors in 2014. Mr. Mills is the Chief Executive Officer of North America for Citi, a position in which he has served since 2012. He heads Citi Community Development and International Franchise Management in 101 countries around the globe and also has operating responsibility for Citi Holdings and Citi’s business in Japan. From 2008 to 2011, he was Chief Executive Officer of Citi Europe, Middle East and Africa, or EMEA, where he was responsible for the performance of all of Citi’s broad range of client segments across the region, including consumers, corporations, institutions and governments. Prior to his role as Chief Executive Officer of Citi EMEA, Mr. Mills was Chairman and Chief Executive Officer of Citi Markets & Banking for EMEA. Prior to his time at Citi, Mr. Mills was Chief Executive Officer of Salomon Smith Barney Asia Pacific and a member of the Salomon Smith Barney Management Committee. Mr. Mills is a board member of the Global Financial Markets Association and the Citi Foundation and was a Member of the Chancellor of the Exchequer’s Financial Services Global Competitiveness Group. He is a Fellow of The Foreign Policy Association and a Member of both the Advisory Board of Career Academies UK and the Board for The American Turkish Society. Mr. Mills received his undergraduate degree from Denison University. We believe Mr. Mills is qualified to serve on our Board of Directors due to his extensive background in finance and his experience as a leader in both financial and operational roles.
Francesco Vanni d’Archirafi joined our Board of Directors in 2014. Mr. Vanni d’Archirafi is the Chief Executive Officer of Citi Holdings, a position in which he has served since 2013. Prior to running Citi Holdings, in 2003 he joined Citi Transaction Services, or CTS, as the Region Head for EMEA, became the Global Head for Treasury and Trade Solutions in 2003 and became the Chief Executive Officer of CTS in April 2009. Prior to his positions at CTS, Mr. Vanni d’Archirafi served in a number of different roles within Citi since 1983, including as Global Co-Head for Citi’s Merger and Acquisitions group, Market Manager for Iberia responsible for the Corporate Bank and customer relationships in Spain and Portugal, Country Corporate Officer for Spain, Chairman and Chief Executive Officer of Citibank International plc and the European Customer Group
99
Table of Contents
Executive for Citi’s Corporate Bank. Mr. Vanni d’Archirafi is currently the Chairman of Citibank Holdings Ireland Ltd and Chair of Citibank Europe plc. He serves on the boards of the Citi Foundation, CitiFinancial Credit Company, Associates First Capital Corporation, Private Export Funding Corporation, Mapfre America S.A. and Business in the Community, or BiTC, where he is the Vice Chair of BiTC’s International Leadership Team. In addition, Mr. Vanni d’Archirafi serves on the International Advisory Board of IESE and the Advisory Council for The Kogod School of Business at American University. He is the Chairman of Junior Achievement Worldwide, a member of its Board of Governors and a Board member of Junior Achievement-Young Enterprise Europe. Mr. Vanni d’Archirafi received his undergraduate degree in finance from American University and an MBA in finance and international business from Columbia University. We believe Mr. Vanni d’Archirafi is qualified to serve on our Board of Directors due to his extensive background in finance and his experience as a leader in both financial and operational roles.
Board Composition
Our Board of Directors currently consists of three directors: Ms. McDowell, Mr. Mills and Mr. Vanni d’Archirafi. Upon the completion of this offering, we expect that our Board of Directors will consist of nine directors.
We have determined that each of , , and is an independent director within the meaning of the applicable rules of the SEC and the New York Stock Exchange and that each of , , and is also an independent director under Rule 10A-3 of the Securities Exchange Act of 1934, as amended, for the purpose of audit committee membership. In addition, our board has determined that is a financial expert within the meaning of the applicable rules of the SEC and the New York Stock Exchange.
Board Committees
The Audit Committee currently consists of , , and . Our Board of Directors has determined that is an independent director. The Audit Committee operates pursuant to a charter approved by the Board of Directors. The Audit Committee reviews and, as it deems appropriate, recommends to our Board of Directors our internal accounting and financial controls and the accounting principles and auditing practices and procedures to be employed in preparation and review of our financial statements. The Audit Committee also makes recommendations to the Board of Directors concerning the engagement of independent public auditors and the scope of the audit to be undertaken by such auditors.
The Compensation Committee currently consists of , , and . The Compensation Committee operates pursuant to a charter approved by the Board of Directors. The Compensation Committee reviews and, as it deems appropriate, recommends to the Board of Directors policies, practices and procedures relating to the compensation of the officers and other managerial employees and the establishment and administration of employee benefit plans. The Compensation Committee also exercises all authority under our employee equity incentive plans and advises and consults with our officers as may be requested regarding managerial personnel policies.
The Nominating and Corporate Governance Committee currently consists of , , and . The Nominating and Corporate Governance Committee operates pursuant to a charter approved by the Board of Directors. The Nominating and Corporate Governance Committee reviews and, as it deems appropriate, recommends to the Board of Directors policies and procedures relating to director and board committee nominations and corporate governance policies.
Compensation Committee Interlocks and Insider Participation
We do not anticipate any interlocking relationships between any member of our Compensation Committee and any of our executive officers that would require disclosure under the applicable rules promulgated under the U.S. federal securities laws.
100
Table of Contents
Code of Business Conduct and Ethics
In connection with this offering, we expect that our Board of Directors will adopt a code of business conduct and ethics applicable to our employees, directors and officers, in accordance with applicable U.S. federal securities laws and the corporate governance rules of the New York Stock Exchange. Any waiver of this code may be made only by our Board of Directors and will be promptly disclosed as required by applicable U.S. federal securities laws and the corporate governance rules of the New York Stock Exchange.
Corporate Governance Guidelines
In connection with this offering, we expect that our Board of Directors will adopt corporate governance guidelines in accordance with the corporate governance rules of the New York Stock Exchange.
101
Table of Contents
COMPENSATION DISCUSSION AND ANALYSIS
Executive Summary
As we have been a wholly owned subsidiary of Citi prior to this offering, Citi has been responsible for determining the framework for awarding incentive compensation to our executive officers named in the Summary Compensation Table below (the “named executive officers,” or “NEOs”). We expect that, at least for as long as Citi is a significant stockholder, our compensation strategy will continue to be governed by Citi’s comprehensive approach to incentive compensation.
Citi has developed a unique end-to-end incentive compensation program intended to align stockholder, customer and employee interests, as well as manage a broad range of risks. Central to its approach is an executive performance evaluation process that expressly considers risk taking behavior and risk outcomes in addition to business results. In addition, executive incentive compensation awards, including those made to the NEOs, are structured to balance and mitigate risk, in particular through the use of significant deferrals and clawbacks.
Citi’s Compensation Philosophy
Citi fully appreciates its responsibility to assume risks that are prudent and well-understood, and to effectively manage those risks to protect the franchise. The Compensation Philosophy, available on Citi’s website at www.citigroup.com/citi/investor/corporate_governance.html, has been approved by the Personnel and Compensation Committee of the Citigroup Inc. Board of Directors and articulates clear guiding principles. Executive compensation programs at Citi, which cover our NEOs, are intended to achieve four equally important major objectives:
| • | Align compensation programs, structures and decisions with stockholder and other stakeholder interests; |
| • | Manage risks to the firm by encouraging prudent decision-making; |
| • | Implement evolving regulatory guidance; and |
| • | Attract and retain the best talent to lead us to success. |
Our 2013 Executive Compensation Program
Summary. Compensation for 2013 was awarded to our NEOs under Citi’s discretionary incentive compensation program, which seeks to reward performance while balancing risks embedded in strategic business decisions. Citi Holdings senior management approved the NEOs’ awards based on our strong overall financial performance in 2013, which resulted from the contributions of the NEOs to advancing our strategic priorities. The NEOs’ individual achievements, including successes in managing controls and risks, as well as market compensation levels were also considered as part of the process of developing the NEO incentive compensation awards. Risk taking behaviors were central to the NEOs’ individual performance evaluations, which drove the discretionary compensation decisions.
In addition to being NEOs, Ms. McDowell, Ms. Carson and Mr. Schachtel are designated as “Covered Employees” for 2013 under the interagency Guidance on Sound Incentive Compensation Policies, which is generally applicable to U.S. banking organizations. Mr. Conrad, Mr. Bennett and Mr. Neaves were not designated as Covered Employees for the 2013 performance year, although they are NEOs. While the overall approach to awarding incentive compensation is broadly consistent for each NEO, some differences in the performance evaluation process and in the structure of compensation awards for Covered Employees will be described below; the special features are designed to balance Covered Employees’ authority to take material risk on behalf of the firm.
102
Table of Contents
OneMain business results. A principal factor in determining the incentive awards to the NEOs was our strong financial performance in 2013. As shown elsewhere in this prospectus, we demonstrated solid and improving profitability in 2012 and 2013 with net income of $407 million and $536 million, a return on assets of 4.0% and 5.4% and an operating efficiency ratio of 34.8% and 32.5% in each of the two years, respectively. This profitability can be attributed to the performance of our leadership team, including the NEOs. In 2013, we also maintained a stable asset base and leadership executed key strategic decisions, including those regarding real estate lending.
Individual performance evaluations. After the end of fiscal 2013, each NEO’s performance was assessed by Citi Holdings senior management and/or his or her manager. The performance evaluation was based on the following multiple inputs, as applicable:
| • | Multi-Perspective Feedback and Citi Manager of Managers Assessment (each as described below); |
| • | Manager’s review of qualitative risk behavior; |
| • | Independent review of qualitative risk behavior conducted by the control functions (Citi’s Compliance, Finance, Independent Audit, Independent Risk, and Legal functions) for NEOs who are Covered Employees; and |
| • | Assessment of success in achieving individualized key strategic objectives. |
MPF and CMOMA. Multi-Perspective Feedback, or MPF, and the Citi Manager of Managers Assessment, or CMOMA, are assessment tools designed to support the annual senior management performance appraisal process. These tools are intended to provide the executive’s manager with a more complete view of his or her performance by incorporating input from direct reports, peers, partners, and other colleagues with valuable perspectives. Through this process, senior managers receive feedback about perceptions of their overall performance, strengths and development needs, and their managers gain a better understanding of their direct reports’ performance to assist them in completing comprehensive year-end reviews.
Manager’s risk review. Managing risk is an important element of our NEOs’ performance assessments, with poor risk management outcomes or behavior potentially resulting in a reduction or the elimination of an executive’s incentive compensation. Managers of executives, including the NEOs, provide a qualitative assessment of risk management skills, and all the NEOs were positively assessed on risk measures. The risk assessment includes both a qualitative analysis and a review of quantitative measures such as branch audit results, net credit losses and loan loss reserves.
Independent control function review. In addition, Citi has established an annual independent control function review process in which Citi’s control functions provide an evaluation of each individual Covered Employee’s current behavior and attitudes toward risk. The results of the control function review process inform and influence the Covered Employee’s performance review. The control function review process analyzes the extent to which the executive:
| • | Considers broad risk-related implications of decisions on different functions and units; |
| • | Puts our long-term interests above short-term gains; |
| • | Responds proactively to risk issues; and |
| • | Addresses risk issues both on an individual transaction/assignment and a portfolio basis. |
Each NEO who was a Covered Employee for 2013 received a positive risk assessment through the independent control function review process.
103
Table of Contents
Individual strategic performance. Each NEO’s responsibilities during 2013 and their individual contributions to OneMain’s results were considered in awarding incentive compensation. An explanation of each NEO’s responsibilities and success in achieving individualized key strategic objectives is provided below.
| • | Ms. McDowell: Ms. McDowell has been the CEO of OneMain for seven years. Her contributions in 2013 included the following: |
| • | Ms. McDowell was evaluated on our strong financial performance as well as efforts to improve efficiencies and reduce expenses. |
| • | Ms. McDowell implemented strategies to make our business more viable in the future as well as to prepare for a reorganization. |
| • | Under Ms. McDowell’s leadership, employee satisfaction improved, as reflected in the improved scores from the Voice of the Employee survey that Citi conducts annually. |
| • | Ms. McDowell implemented customer service improvements in our branches, and made efforts to improve working relations with regulators. |
| • | Mr. Conrad: Mr. Conrad’s performance assessment was largely based on his performance as Chief Financial Officer of OneMain in 2013, as well as anticipated future contributions in that role. Mr. Conrad’s contributions in 2013 included the following: |
| • | Mr. Conrad exhibited very strong management of risk and control issues, and has taken a leadership role in facilitating and strengthening the Company’s control environment. |
| • | Mr. Conrad exhibited strong talent development skills by quickly reorganizing his team to better align existing skill sets with opportunities, and bring on needed new talent. |
| • | During Mr. Conrad’s tenure as our Chief Financial Officer, he has positively impacted our business by enabling a seamless transition from his predecessor and leading us through the 2014 planning process. |
| • | Mr. Bennett: Mr. Bennett’s performance assessment was largely based on his performance as our Chief Strategy Officer in 2013, as well as anticipated future contributions in that role. Mr. Bennett’s contributions in 2013 included the following: |
| • | Mr. Bennett exhibited strong people management, leadership and talent development skills. |
| • | Mr. Bennett provided strong analytical skills in support of our business decisions. |
| • | Mr. Bennett was instrumental in increasing our capability in the digital space. |
| • | Mr. Bennett continues to research new markets and business opportunities for us. |
| • | Ms. Carson: Ms. Carson is the head of Citi Assurance Services (CAS) and has held this position for seven years. Ms. Carson’s contributions in 2013 included the following: |
| • | Ms. Carson played a critical role in our financial performance through her leadership in the insurance business. Through her actions, CAS achieved higher returns, improved customer service scores and increased product acceptance rates. |
| • | Ms. Carson implemented strategic projects to eliminate redundancy and improve the customer experience. |
| • | Ms. Carson helped lead important initiatives supporting fairness to customers. |
| • | Mr. Schachtel: Until March 2014, Mr. Schachtel was the Executive Vice President, Northeast and Midwest Division. He has held that position for approximately 11 years. Mr. Schachtel’s contributions in 2013 included the following: |
| • | Mr. Schachtel contributed to our strong financial performance by increasing revenues at the branches while maintaining a low delinquency loan portfolio. |
104
Table of Contents
| • | Mr. Schachtel led initiatives to optimize the branch footprint of the business. |
| • | Mr. Schachtel had strong risk results, including improvements in net credit losses. |
| • | Mr. Schachtel was appointed to the position of Chief Operating Officer in March 2014 because of his strong contributions. |
Market comparisons. Each NEO may be eligible for a year-over-year market-based adjustment to total compensation, where compensation is below market for his or her role. We target the market median as our competitive data point, and use the information to frame (but not determine) incentive compensation decisions. The process that Citi uses to determine market median compensation is generally consistent all across all lines of business, although the competitors may vary according to the applicable market. Our market comparison analysis is based on a review of a third-party market survey covering 1,500 companies in the financial industry.
Awards for 2013
Based on this holistic assessment of our business results, individual performance (including risk results) and market compensation levels, the NEOs received the following total compensation awards (base salary plus incentive compensation) for performance in 2013:
| Name |
Base Salary ($) |
Cash Bonus ($) |
Deferred Stock ($) |
Deferred Cash ($) |
Total Compensation for 2013 ($) | |||||
| Mary McDowell |
||||||||||
| Micah Conrad |
||||||||||
| Sean Bennett |
||||||||||
| Dava Carson |
||||||||||
| John Schachtel |
||||||||||
| David Neaves |
The table above is not intended to be a substitute for the reporting of 2013 compensation in accordance with SEC rules as shown in the 2013 Summary Compensation Table below.
As disclosed in the table above, Mr. Neaves did not receive an incentive award for 2013 because he voluntarily resigned in August 2013.
Structure of Incentive Compensation
Citi’s incentive compensation is structured to balance and mitigate risk. All NEOs receive a portion of their incentive award in deferred awards that vest over four years subject to clawbacks; furthermore, the awards may be subject to additional performance-based vesting conditions, as described below. The deferral percentage increases for Covered Employees (as compared to other Citi employees) and as total incentive awards increase. Awards potentially consist of three components: (a) a cash bonus, (b) a deferred stock award and (c) for NEOs who are Covered Employees, a deferred cash award. These components are described below:
Immediate Cash Bonus. As is traditional in the financial services industry, each of our NEO’s total compensation generally includes a discretionary bonus opportunity. The immediate cash portion of the award rewards short-term performance while the deferred portion rewards sustained growth that is often linked to enhancement of stockholder value. Awards above a certain threshold (determined by Citi) are subject to mandatory deferral.
Deferred Stock Awards (CAP). All NEOs received awards of deferred stock under Citi’s Capital Accumulation Program, or CAP, which vest in four equal annual installments beginning on January 20 of
105
Table of Contents
the year following the year of grant. CAP awards are subject to the Citi Clawbacks (as described below) throughout the vesting period. In addition to the time-based vesting provision, CAP awards to the NEOs who are Covered Employees are subject to an additional performance-based vesting condition. If Citigroup has pre-tax losses in any year of the deferral period, the portion of the deferred stock award that is scheduled to vest in the year following the loss year will be reduced by 20%, or if greater, by a fraction, the numerator of which is the amount of the pre-tax loss, and the denominator of which is the highest level of annual
pre-tax profit for Citigroup in the three years immediately preceding the loss year. All deferred stock awards are subject to the provisions of CAP in the event of termination of employment, as described below (see text accompanying the Grant of Plan-Based Awards Table).
Deferred Cash Awards (DCAP). Half of the deferred portion of the annual incentive award for 2013 was awarded to the NEOs who were Covered Employees under the Deferred Cash Award Plan, or DCAP. DCAP awards vest in four equal annual installments beginning on January 20 of the year following the year of grant. The nonvested portion of the award granted for performance in 2013 earns notional interest at a rate of 4.20%, compounded annually. The treatment of DCAP awards upon termination of employment is the same as CAP awards.
DCAP awards also have a performance-based vesting provision. Under this provision, the DCAP award is subject to cancellation if the executive is determined to have significant responsibility for a material adverse outcome. This provision is intended to allow for cancellation of unearned DCAP awards in the event of serious financial or reputational harm to Citi and may apply to the employee directly responsible for the actions as well as one who fails to appropriately supervise such employee.
In addition, under Citi’s General Clawback that is applicable to DCAP awards only, Citi may cancel all or a portion of a nonvested DCAP award if it determines that an employee engaged in misconduct or exercised materially imprudent judgment that caused harm to any of Citi’s business operations, or that resulted or could result in regulatory sanctions. Citi may also cancel awards if an employee failed to supervise individuals who engaged in such behavior or failed to properly bring such behavior to the attention of the appropriate persons at Citi.
Citi Clawbacks Applicable to Both CAP and DCAP Awards. All CAP and DCAP awards are subject to the Citi Clawbacks. The Citi Clawbacks require the forfeiture or cancellation of nonvested incentive compensation when an employee (a) receives an award based on materially inaccurate publicly reported financial statements, (b) knowingly engages in providing materially inaccurate information relating to publicly reported financial statements, (c) materially violates any risk limits established or revised by senior management and/or risk management or (d) engages in gross misconduct. Citi may also seek to recover previously delivered compensation to the extent permitted by law.
Other Elements of Total Compensation
Base Salary. Providing base salary that is not directly linked to our performance is a necessary component of our competition for, and retention of, executive talent. Base salary is determined based on a review of market pay rates for people doing similar work in similar industries in the same region. Additional factors include individual experience, performance, position/role, an employee’s tenure with us, and internal pay equity. We believe that our NEO pay is competitive within the financial services and consumer finance industry.
Health and Welfare Benefits. Our NEOs are eligible to participate in Citi sponsored U.S. benefit programs on the same terms and conditions as those made available to Citi’s U.S. salaried employees generally. Basic medical, dental, prescription drug, vision, wellness, life insurance, and disability benefits are offered to ensure that our employees have access to healthcare as well as income protection for themselves and their family. Premiums are generally tied to an employee’s total compensation. Higher compensated employees generally pay higher healthcare insurance premiums than lower compensated employees.
401(k) Plan/Pension Plans. Certain of our NEOs participate in the Citigroup Pension Plan, which was closed to new entrants after December 31, 2006. The Citigroup Pension Plan ceased cash balance accruals for all
106
Table of Contents
eligible participants, including our participating NEOs, effective December 31, 2007. Our NEOs participate in Citi’s 401(k) Plan, a broad-based, tax-qualified retirement plan available to substantially all U.S. employees. The purpose of the program is to provide employees with tax-advantaged savings opportunities to assist in accumulating assets for their retirement. Company matching contributions are made on the participant’s before-tax contributions or Roth contributions (other than catch-up contributions) of up to 6% of the participant’s eligible pay.
2013 Summary Compensation Table and Compensation Information
The following table sets forth information concerning the compensation paid to our Chief Executive Officer, Chief Financial Officer and our three other most highly compensated executive officers during our fiscal year ended December 31, 2013.
| Name and Principal Position(1) |
Year | Salary (2)($) |
Bonus (3)($) |
Stock Awards (4)($) |
Option Awards ($) |
Non-Equity Incentive Plan Compensation (5)($) |
Change in Pension Value and Nonqualified Deferred Compensation Earnings (6)($) |
All Other Compensation (7)($) |
Total ($) | |||||||||
| Mary McDowell, |
||||||||||||||||||
| Micah Conrad, |
||||||||||||||||||
| Sean Bennett, |
||||||||||||||||||
| Dava Carson, |
||||||||||||||||||
| John Schachtel, |
||||||||||||||||||
| David Neaves, |
||||||||||||||||||
| (1) | The principal position for each NEO is the position that she/he held on December 31, 2013. Mr. Schachtel was appointed to the position of Chief Operating Officer in March 2014. Mr. Neaves voluntarily resigned from employment in August 2013. |
| (2) | Salary earned during 2013 calendar year including any earned unused vacation payout. Mr. Bennett’s annual base salary rate increased from $ to $ effective September 29, 2013. |
| (3) | Amounts represent discretionary cash bonuses paid in January 2014 for the 2013 performance year. |
| (4) | Amounts in this column are the aggregate grant date fair values of equity awards granted in February 2013 for performance in 2012. The values in this column represent the aggregate grant date fair values of the awards computed in accordance with the Financial Accounting Standards Board Accounting Standards Codification Topic 718. The assumptions made, if any, when calculating the amounts in this column for the awards are found in Footnote 7 to the Consolidated Financial Statements of Citigroup Inc. and its subsidiaries, as filed with the SEC on Form 10-K for 2013. Please see the disclosure following the Grants of Plan-Based Awards Table for additional discussion of the awards disclosed above. |
107
Table of Contents
| (5) | Set forth below is a breakdown of the amount reported as Non-Equity Incentive Plan Compensation for 2013. The amount includes: a portion of the DCAP award made in January 2012 for performance in 2011, notional interest on that DCAP award, a portion of the DCAP award made in February 2013 for performance in 2012 and notional interest on that DCAP award. |
| Name |
Reportable Portion of January 2012 Deferred Cash Award ($) |
Earnings on January 2012 Deferred Cash Award ($) |
Reportable Portion of February 2013 Deferred Cash Award ($) |
Earnings on February 2013 Deferred Cash Award ($) |
Total Non- Equity Incentive Plan Amount Shown in Summary Compensation Table ($) | |||||
| Mary McDowell |
||||||||||
| Micah Conrad |
||||||||||
| Sean Bennett |
||||||||||
| Dava Carson |
||||||||||
| John Schachtel |
||||||||||
| David Neaves |
| (6) | The amounts represent the increases in the present value of pension benefits, if any, as more fully described in the 2013 Pension Benefits Table. The NEOs did not earn or receive any above-market or preferential earnings on compensation that was deferred on a basis that was not tax-qualified. Mr. Bennett is not eligible for pension benefits as he was hired after The Citigroup Pension Plan was closed to new members. The value of Mr. Neaves’ benefit in The Citigroup Pension Plan was a negative amount of ($ ); this is primarily attributable to increases in the discount rate assumptions applicable to the Associates First Capital Corporation (“AFCC”) Pension Plan (which was merged into the Citigroup Pension Plan on December 31, 2001.) In accordance with the SEC rules, decreases are reflected in the Summary Compensation Table as $0 increases. |
| (7) | Set forth below is a breakdown of All Other Compensation for 2013 (including personal benefits): |
| Name |
Security Services/Systems ($) |
Aircraft ($) |
Ground Transportation ($) |
Financial and Tax Planning ($) |
Medical and Dental Benefits ($) |
401(k) Plan Matching Contributions(1) ($) |
Tax Reimbursement Amounts |
Total ($) | ||||||||
| Mary McDowell |
||||||||||||||||
| Micah Conrad |
||||||||||||||||
| Sean Bennett |
||||||||||||||||
| Dava Carson |
||||||||||||||||
| John Schachtel |
||||||||||||||||
| David Neaves |
| (1) | Each NEO received 401(k) Plan matching contributions pursuant to the formula applicable to all eligible U.S. employees. |
108
Table of Contents
2013 Grants of Plan-Based Awards
The following table sets forth information concerning grants of plan-based awards made to our NEOs during our fiscal year ended December 31, 2013. The values shown below for equity awards are each equity award’s grant date fair value as determined under applicable accounting standards.
| Name |
Grant Date |
Estimated Possible Payouts Under Non-Equity Incentive Plan Awards(1) |
Estimated Future Payouts Under Equity Incentive Plan Awards(2) |
All Other Stock Awards: Number of Shares of Stock or Units(3) (#) |
Grant Date Fair Value of Stock and Option Awards ($) | |||||||||||||
| Threshold ($) |
Target ($) |
Maximum ($) |
Threshold (#) |
Target (#) |
Maximum (#) |
|||||||||||||
| Mary McDowell |
||||||||||||||||||
| Micah Conrad |
||||||||||||||||||
| Sean Bennett |
||||||||||||||||||
| Dava Carson |
||||||||||||||||||
| John Schachtel |
||||||||||||||||||
| David Neaves |
||||||||||||||||||
| (1) | These awards were made under Citi’s Deferred Cash Award Plan for performance in 2012. The amounts reported are the notional principal amount of the awards, plus the maximum notional interest payable under the terms of the award. The notional amounts of awards shown under this heading are: for Ms. McDowell, $ ; for Ms. Carson, $ ; for Mr. Schachtel, $ ; and for Mr. Neaves, $ . |
| (2) | These deferred stock awards were made under the 2009 Stock Incentive Plan, as amended and restated January 1, 2013, as part of CAP. The February 19, 2013 CAP awards for Covered Employees have performance-based vesting conditions and are noted in the “Estimated Future Payouts Under Equity Incentive Plan Awards” column. |
| (3) | The February 19, 2013 CAP awards for NEOs who are not Covered Employees do not have performance-based vesting conditions, therefore such awards are noted in this column. |
Awards for 2012 performance are shown above in the Grants of Plan-Based Awards Table. The following additional information relates to those awards:
Capital Accumulation Program (CAP); Rule of 60. General CAP terms are described above in the Compensation Discussion and Analysis. In addition, CAP awards have special provisions applicable to employees who meet the “Rule of 60” at the time of termination of employment. A participant meets the Rule of 60 if his or her age plus full years of service equal at least 60 and he or she either (a) is at least age 50 with at least five full years of service, or (b) is under age 50 with at least 20 full years of service. Partial years of age and service are each rounded down to the nearest whole number. If a participant meets the Rule of 60 and voluntarily terminates his or her employment, the participant’s CAP shares will be distributed to the participant on the regularly scheduled vesting dates, provided that during the vesting period, he or she does not work for a “significant competitor” as defined under CAP terms. If a participant does not meet the Rule of 60 and voluntarily terminates his or her employment, the participant’s nonvested CAP shares are forfeited. CAP awards provide for accelerated vesting in the event of a participant’s death and vesting on schedule in the event of involuntary termination not for gross misconduct or in the event of disability. CAP awards are forfeited in the event of termination for gross misconduct. Ms. McDowell and Mr. Schachtel have satisfied the Rule of 60; the other NEOs have not satisfied the Rule of 60.
Deferred Cash Award Plan (DCAP). Half of the deferred portion of the annual incentive for 2012 awarded to Covered Employees was granted in February 2013 under the DCAP and as shown in the Grants of Plan-Based Awards Table. DCAP awards vest in four equal annual installments beginning on January 20 of the year following the year of grant and remain subject to the Citi Clawbacks during the vesting period. These awards are also subject to cancellation if the holder is a Covered Employee and is determined to have significant responsibility for a material adverse outcome, as described in more detail above in the Compensation Discussion and Analysis. The nonvested portion of the award for 2012 performance award earns notional interest at a rate of 2.84%, compounded annually. The treatment of DCAP awards upon termination of employment is the same as CAP awards.
109
Table of Contents
Outstanding Equity Awards at 2013 Fiscal Year-End
The following table sets forth information concerning unexercised options, stock that has not vested and equity incentive plan awards for the NEOs as of the end of our fiscal year ended December 31, 2013. The numbers of securities and values in this table have been adjusted for Citi’s reverse stock split effective May 6, 2011. SEC rules require the disclosure of all outstanding awards although they may have been granted under discontinued programs.
| Option Awards | Stock Awards(3) | |||||||||||||||||
| Name |
Grant Date |
Number of Securities Underlying Unexercised Options(1) Exercisable (#) |
Number of Securities Underlying Unexercised Options(2) Unexercisable (#) |
Option Exercise Price ($) |
Option Expiration Date |
Number of Shares or Units of Stock That Have Not Vested (#) |
Market Value of Shares or Units of Stock That Have Not Vested ($) |
Equity Incentive Plan Awards: Number of Unearned Shares, Units or Other Rights That Have Not Vested (#) |
Equity Incentive Plan Awards: Market or Payout Value of Unearned Shares, Units or Other Rights That Have Not Vested ($) | |||||||||
| Mary McDowell |
||||||||||||||||||
| Micah Conrad |
||||||||||||||||||
| Sean Bennett |
||||||||||||||||||
| Dava Carson |
||||||||||||||||||
| John Schachtel |
||||||||||||||||||
| David Neaves(4) |
||||||||||||||||||
| (1) | The options shown in this column are vested as of December 31, 2013. |
| (2) | No options were nonvested as of December 31, 2013. |
| (3) | The market values in this table were computed using the closing price of a share of Citi common stock on December 31, 2013, which was $52.11. |
| (4) | Mr. Neaves forfeited his outstanding nonvested awards upon his voluntary termination of employment in August 2013. |
Citi Employee Option Grant Program. Citi awarded stock options in October 2009 and April 2010 to certain employees, including the NEOs. Each grant is fully vested and will expire six years after the grant date to the extent not previously exercised. These awards were part of a broad-based global stock option grant that was intended to help retain employees. The options were awarded with an exercise price equal to the closing price of a share of Citigroup common stock on the NYSE on the day prior to the grant date, and vested in three annual installments beginning on October 29, 2010.
Treatment of Awards Subject to the Rule of 60. Certain stock awards that are subject to a Rule of 60 provision and that are held by NEOs who attained the Rule of 60 before December 31, 2013 are considered to be fully vested for purposes of these tables. Therefore, these awards are not shown as outstanding in the Outstanding Equity Awards at 2013 Fiscal Year-End Table because that table discloses only unvested stock awards. Instead, these awards are included in the Nonqualified Deferred Compensation Table below with other vested but undeliverable deferred compensation. For a full discussion of the Rule of 60, see “—2013 Grants of Plan-Based Awards—Capital Accumulation Program (CAP); Rule of 60” above.
110
Table of Contents
Option Exercises and Stock Vested in 2013
| Option Awards | Stock Awards | |||||||
| Name |
Number of Shares Acquired on Exercise (#) |
Value Realized on Exercise(1) ($) |
Number of Shares Acquired on Vesting (#) |
Value Realized on Vesting(2) ($) | ||||
| Mary McDowell |
||||||||
| Micah Conrad |
||||||||
| Sean Bennett |
||||||||
| Dava Carson |
||||||||
| John Schachtel |
||||||||
| David Neaves |
||||||||
| (1) | Amounts represent the fair market value of Citi common stock on the exercise date less the strike price, times the number of shares exercised. |
| (2) | Amounts represent the fair market value of Citi common stock on the vesting date, times the number of shares vested. |
The values shown above in the Stock Awards columns reflect the market price of Citi common stock as of the vesting date ($41.37). For purposes of this table, stock is considered vested before 2013 if the stock is not subject to a performance-based vesting condition, is subject to a Rule of 60 provision, and the NEO had met the Rule of 60 before the grant date. Ms. McDowell and Mr. Schachtel met the Rule of 60 prior to 2013.
2013 Pension Benefits
The following table sets forth information with respect to each plan that provides for payments or other benefits at, following, or in connection with retirement.
| Name |
Plan Name(1) | Number of Years Credited Service (#) |
Present Value of Accumulated Benefit(2) ($) |
Payment During Last Fiscal Year ($) | ||||
| Mary McDowell(3) |
||||||||
| Micah Conrad |
||||||||
| Sean Bennett |
||||||||
| Dava Carson |
||||||||
| John Schachtel(3) |
||||||||
| David Neaves |
| (1) | Pension benefits accruals for the Travelers Group Inc. Retirement Benefit Equalization Plan, or RBEP, were frozen as of December 31, 2001. Service under the Citigroup Pension Plan was frozen effective December 31, 2007 for all active participants. Mr. Bennett began his employment with Citi/OneMain in 2007, hence he was not eligible to participate in the Citigroup Pension Plan because he had not met the one-year service requirement by the time of the plan closure. |
| (2) | The material assumptions used in determining the present value of the Citigroup Pension Plan benefits are (a) the Internal Revenue Service 2014 annuitant mortality table, (b) a discount rate of 4.75% and (c) an interest crediting rate on cash balance plan benefits of 3.75%. The plan discount rates are the same as the year-ended 2013 rates used to prepare footnote 8 to the Consolidated Financial Statements of Citigroup Inc. and its Subsidiaries, as filed with the SEC on Form 10-K for 2013. The other assumptions are not required to be stated in that footnote 8. |
| (3) | Ms. McDowell and Mr. Schachtel have more years of credited service under the Citigroup Pension Plan than under the RBEP because benefit accruals under the RBEP ceased before benefit accruals ceased under the Citigroup Pension Plan. |
111
Table of Contents
The Citigroup Pension Plan
The purpose of this broad-based, tax-qualified retirement plan is to provide retirement income on a tax-deferred basis to all eligible U.S. employees of Citi, including OneMain employees. Effective as of January 1, 2002, this plan adopted a single cash balance benefit formula for most of the covered population, including our NEOs. The Citigroup Pension Plan cash balance benefit is expressed as a hypothetical account balance. Prior to January 1, 2008, the plan generally provided for the annual accrual of benefit credits for most of the covered population, including the covered named executive officers, at a rate between 1.5% and 6% of eligible compensation; the benefit credit rate increased with age and service.
Employees became eligible to participate in the Citigroup Pension Plan or one of its legacy plans after one year of service, and benefits generally vested after five years of service. Effective as of December 31, 2006, the Citigroup Pension Plan was closed to new members and effective December 31, 2007, future cash balance plan accruals ceased. All NEOs, with the exception of Mr. Bennett, are eligible for benefit accruals under this plan and continue to earn interest credits, like other participants.
Eligible compensation generally included base salary and incentive awards, but excluded compensation payable after termination of employment, certain non-recurring payments, and other benefits. Annual eligible compensation was limited by the U.S. Internal Revenue Code of 1986, as amended, or the Code, to $225,000 for 2007 (the final year of cash balance benefit accrual). Interest credits continue to be applied annually to each participant’s account balance; these credits are based on the yield on 30-year Treasury bonds (as published by the Internal Revenue Service).
Benefits under the Citigroup Pension Plan are payable in annuity form or in other optional forms. All optional forms of benefit under this formula available to our NEOs are generally actuarially equivalent to the normal form of benefit. The Citigroup Pension Plan’s normal retirement age is age 65.
A portion of Mr. Neaves’s benefit will be determined under the AFCC Pension Plan formula. The AFCC Pension Plan was merged into the Citigroup Pension Plan effective December 31, 2001, and uses a formula to determine the normal form of benefit, which is a monthly benefit payable for a participant’s lifetime beginning at age 65 (normal retirement age). The formula takes into account final average compensation, estimated Social Security Benefits, and benefit service through December 31, 2001, or the date of later retirement, for certain participants who met specified age and service criteria as of December 31, 2001. Benefits under the AFCC Pension Plan formula are payable in an annuity form or in other optional forms. All optional forms of benefit under this formula are generally actuarially equivalent to the normal form of benefit.
Mr. Neaves did not meet the applicable age and service criteria, so his lifetime annuity benefit under the AFCC Pension Plan formula was frozen at December 31, 2001, and he accrued future benefits under the Citigroup Pension Plan’s cash balance formula. Mr. Neaves terminated before attaining eligibility for early retirement benefits under the AFCC Pension Plan formula.
The Travelers Group Inc. Retirement Benefit Equalization Plan
The purpose of the Travelers Group Inc. Retirement Benefit Equalization Plan, or RBEP, a nonqualified retirement plan, was to provide retirement benefits using the applicable legacy Citigroup Pension Plan formula, but based on the legacy Citigroup Pension Plan’s definition of (a) compensation, in excess of the Code’s qualified plan compensation limit ($170,000 for 2001), or (b) benefits, in excess of the Code’s qualified plan benefit limit ($140,000 for 2001). In 1994, the RBEP was amended to limit qualifying compensation under the plan to $300,000. The RBEP was amended in 2001 to cease benefit accruals after 2001 for most participants (including the NEOs).
All other terms of the RBEP are the same as under the Citigroup Pension Plan. The optional forms of benefit available under the RBEP and their equivalent values are the same as those under the Citigroup Pension Plan.
112
Table of Contents
2013 Nonqualified Deferred Compensation
| Name |
Executive Contributions in Last FY ($) |
Registrant Contributions in Last FY ($) |
Aggregate Earnings in Last FY ($) |
Aggregate Withdrawal/ Distributions ($) |
Aggregate Balance at Last FYE ($) | |||||
| Mary McDowell |
||||||||||
| Micah Conrad |
||||||||||
| Sean Bennett |
||||||||||
| Dava Carson |
||||||||||
| John Schachtel |
||||||||||
| David Neaves |
All of the amounts shown above represent CAP awards granted before 2013. Under CAP rules in effect before 2013, shares were delivered in four equal annual installments beginning on January 20th of the year following the year of grant, but had no performance-based vesting provisions. Employees who meet the Rule of 60 (including Ms. McDowell and Mr. Schachtel) are considered to be vested in these CAP awards for purposes of the Nonqualified Deferred Compensation Table, and accordingly, these CAP awards are reported in the above table as “nonqualified deferred compensation.”
The table shows the aggregate realized or unrealized gains and losses on all such nonvested CAP shares they held in 2013 in the “Aggregate Earnings in Last FY” column. The “Aggregate Withdrawals/Distributions” column shows such nonvested CAP shares that were delivered to them during 2013. The “Aggregate Balance at Last FYE” column shows the year-end value of such nonvested CAP shares.
Potential Payments Upon Termination or Change-in-Control
Set forth in the table below is the estimated value of CAP and DCAP awards on December 31, 2013 that would have been delivered over time to each NEO, had the applicable event occurred on December 31, 2013, assuming that all vesting conditions and applicable performance conditions, were satisfied. In developing these estimates, the closing price of Citi’s common stock on December 31, 2013 ($52.11) was used.
All of the awards shown in the table generally vest on schedule following an involuntary termination of employment, and following a voluntary termination subject to the Rule of 60, only if the Rule of 60 is satisfied; there are no provisions for acceleration of the delivery of the awards except in the case of death. During the vesting period, the awards remain subject to clawbacks and applicable performance conditions, and in the case of a voluntary termination subject to the Rule of 60, the stock awards are subject to forfeiture if the executive works for a significant competitor.
Citi’s 2009 Stock Incentive Plan is the only plan from which equity awards to the NEOs shown in the table below were made. The 2009 Stock Incentive Plan has a “double trigger” requirement; it provides that an involuntary termination of employment must occur as a result of a change-in-control of Citi before any vesting of equity awards may occur in connection with the change-in-control.
113
Table of Contents
The intrinsic value of stock options that vested before December 31, 2013 is excluded from the table below. Each of the other awards reflected in this table is described in more detail in the Compensation Discussion and Analysis above and the discussion following the Grants of Plan-Based Awards Table above. Additional vested equity awards that may be delivered on schedule following termination of employment are disclosed in the “Aggregate Balance at Last Fiscal Year End” column in the Nonqualified Deferred Compensation Table above.
| Name |
Category of Compensation |
Termination for Gross Misconduct ($) |
Voluntary Resignation ($) |
Death or Disability ($) |
Change-in-Control of Citigroup ($) |
Involuntary Termination without Gross Misconduct ($) | ||||||
| Mary McDowell |
||||||||||||
| Micah Conrad |
||||||||||||
| Sean Bennett |
||||||||||||
| Dava Carson |
||||||||||||
| John Schachtel |
||||||||||||
| David Neaves |
114
Table of Contents
CERTAIN RELATIONSHIPS AND RELATED PARTY TRANSACTIONS
Citi currently indirectly beneficially owns 100% of our common stock. As a wholly owned subsidiary, we have historically relied on Citi to provide centralized support functions and services. These relationships are described below under “—Other Related Party Transactions.”
Relationship with Citi
Prior to the completion of this offering, we will enter into a stockholder’s agreement and a number of other agreements with Citi for the purpose of accomplishing our separation from Citi and setting forth various matters governing our relationship with Citi after the completion of this offering. These agreements will be filed as exhibits to the registration statement of which this prospectus forms a part. We will enter into these agreements with Citi while we are still a wholly owned subsidiary of Citi, and certain terms of these agreements are not necessarily the same as could have been obtained from a third party.
After this offering, Citi will own approximately % of the outstanding shares of our common stock ( % if the underwriters exercise their over-allotment option in full). As a result, Citi will be able to direct the election of all of the members of our Board of Directors, who will determine our strategic plans, approve major financing decisions and appoint top management. Similarly, Citi will have the power to determine or significantly influence the outcome of matters submitted to a vote of our stockholders, including the power to prevent an acquisition or any other change in control of us and could take other actions that might be favorable to Citi and potentially unfavorable to you. Citi also has various consent rights under the Stockholder’s Agreement, as described below. See “Description of Capital Stock” and “Risk Factors—Risks Relating to Our Organization and Structure—Citi owns a controlling interest in our company, and the interests of Citi may conflict with our interests and with those of our public stockholders, including you.”
Stockholder’s Agreement
Prior to the completion of this offering, we will enter into a stockholder’s agreement with Citi, or the Stockholder’s Agreement, that sets forth our agreements with Citi relating to our relationship with Citi and its affiliates after this offering. Among other things, we expect this agreement to provide for the following.
Governance. The Stockholder’s Agreement will grant Citi the right to nominate a certain number of designees to our Board of Directors and committees of our Board of Directors. Citi will have the right to designate a majority of the members of our Board of Directors for so long as Citi owns 50% or more of the outstanding shares of our common stock, and thereafter will have the right to designate a number of members of our Board of Directors that is proportionate to the percentage of the outstanding shares of our common stock that it owns.
In addition, for so long as Citi owns 20% or more of the outstanding shares of our common stock, certain actions may not be taken without the prior written consent of Citi, including:
| • | any consolidation or merger by us or any of our subsidiaries; |
| • | any disposition, acquisition or investment by us or any of our subsidiaries having a value in excess of a specified amount; |
| • | the entry into any joint venture, partnership or similar arrangement by us or any of our subsidiaries; |
| • | any increase or decrease in our authorized capital stock or the creation of any class or series of our capital stock; |
| • | any issuance or sale by us or any of our subsidiaries of any shares of our respective capital stock, any options, warrants or rights to acquire such capital stock or any securities convertible into or exchangeable for such capital stock, or the adoption or amendment by us or any of our subsidiaries of any equity incentive plan; |
| • | any dissolution, liquidation or winding up by us or any of our subsidiaries; |
115
Table of Contents
| • | certain amendments to our Amended and Restated Certificate of Incorporation and Bylaws, including amendments that affect the votes required by our Board of Directors or by our stockholders to amend these documents; |
| • | the declaration or payment of dividends, with certain exceptions; |
| • | any change to the number of our directors; |
| • | any appointment of our Chief Executive Officer, Chief Financial Officer, Chief Operating Officer and certain of our other executive officers; |
| • | the incurrence of any indebtedness or guarantees thereof by us or any of our subsidiaries, with certain exceptions; |
| • | the entry into any new line of business or the approval of any new product by us or any of our subsidiaries; |
| • | the approval of our annual business plan and operating budget; and |
| • | the settlement, compromise or resolution of certain litigation and regulatory claims by us or any of our subsidiaries. |
Right of First Offer. The Stockholder’s Agreement will grant Citi the right of first offer to be the lead provider of financial services, and to be the lead financial advisor for mergers and acquisitions, to us and our subsidiaries on market terms. Citi will have such right for two years following the completion of this initial public offering of the shares of our common stock, or until Citi no longer owns at least 20% of the outstanding shares of our common stock, whichever occurs later.
Committee Designation Rights. For as long as Citi beneficially owns more than 50% of our common stock, all members of our Nominating and Corporate Governance Committee and at least one member of our Compensation Committee will be designated by Citi.
Allocation of Assets and Liabilities. The Stockholder’s Agreement generally allocates assets and liabilities to us and Citi according to the business to which such assets or liabilities relate.
Under the agreement, Citi will agree to indemnify us for:
| • | debts, obligations and liabilities of any kind arising from the ownership or the operation of the assets or properties, or the operation or conduct of the business of, including contracts entered into by, Citi or any subsidiary or business of Citi, whether before, on or after the date of the Stockholder’s Agreement, other than those liabilities that are expressly allocated to us; and |
| • | any breach of the Stockholder’s Agreement or any other transaction agreement by Citi. |
Under the agreement, we will agree to indemnify Citi for:
| • | the debts, obligations and liabilities of any kind relating to or arising from the business, assets, contracts, properties, activities or practices now, hereafter or previously conducted, owned, entered into or operated by us or our legacy entities, businesses or assets, including legacy entities, businesses or assets retained by Citi in the CitiFinancial North America, or CFNA, business (or retained elsewhere in Citi), or previously divested by us or Citi. As part of the foregoing indemnity, we will indemnify Citi for all liabilities arising from activities, practices (including origination and servicing), transactions, or claims relating to or arising from our businesses, branches, portfolios and assets, whether now part of our business or part of CFNA, CitiFinancial Servicing or Citi Holdings, including any liabilities relating to or arising from any of our business practices that are continued by Citi or from any sale by Citi or us of any such assets; |
| • | any breach of the Stockholder’s Agreement or any other transaction agreement by us; |
116
Table of Contents
| • | any guarantee or keepwell by Citi or any of its affiliates (other than us and our subsidiaries) provided with respect to any of our or our subsidiaries’ obligations or any of our respective employees’ obligations; and |
| • | any liability arising from an alleged misstatement or omission in any registration statement or prospectus or other offering document of ours. |
We will not indemnify Citi for liabilities arising out of servicing or other activities by Citi after January 1, 2014 with respect to the CFNA mortgage portfolio that do not constitute a continuation of our business practices, any financial loss in the value of any assets held by Citi due to the performance of such assets or market conditions or liabilities related to or arising from the Canada and Puerto Rico businesses within CFNA.
Indemnification. Generally, each party will indemnify, defend and hold harmless the other party and its subsidiaries (and each of their affiliates) and their respective officers, employees and agents for the above liabilities. The Stockholder’s Agreement also specifies procedures with respect to claims subject to indemnification.
Transition Services Agreement
Prior to the completion of this offering, we will enter into a transition services agreement, or the Transition Services Agreement, with Citi for the receipt of certain shared services such as employee benefits, technology infrastructure, shared premises and various services including payment processing, customer statement preparation and centralized default management services. The Transition Services Agreement will take effect upon the closing of this offering. In general, pricing for services under the Transition Services Agreement will be charged or allocated to us in accordance with historic allocation methodologies, which allocation was typically calculated based on the use and cost of the service.
Tax Matters Agreement
Prior to the completion of this offering, we will enter into a tax matters agreement, or the Tax Matters Agreement, with Citi. Among other things, the Tax Matters Agreement will govern the allocation between Citi and us of the responsibility for taxes. The Tax Matters Agreement will also allocate rights, obligations and responsibilities in connection with certain administrative matters relating to the preparation of tax returns, the control of tax returns and other tax-related proceedings.
Employee Matters Agreement
Prior to the completion of this offering, we will enter into an agreement with Citi relating to certain employee, compensation and benefits matters. We refer to this agreement in this prospectus as the “Employee Matters Agreement.” Under the Employee Matters Agreement, we generally assume or retain liabilities relating to the employment or services of those persons in our business before or after the completion of this offering. We are only responsible for liabilities under the existing Citi benefit plans to the extent described in the Employee Matters Agreement.
Intellectual Property Matters Agreement
Prior to the completion of this offering, we will enter into an agreement with Citi relating to certain intellectual property matters. We refer to this agreement in this prospectus as the “Intellectual Property Matters Agreement.”
Registration Rights Agreement
In connection with this offering, we will enter into a registration rights agreement with Citi pursuant to which we will grant to Citi certain demand and piggyback registration rights with respect to the shares of
117
Table of Contents
common stock owned by it. Citi will have so-called “piggyback” registration rights, which means that Citi may include its shares of our common stock in any future registration of our common stock. The registration rights agreement will also provide for so called “demand” registration rights, which means that Citi can require us to file registration statements with the SEC for the public resale of shares of our common stock owned by Citi. The inclusion of shares in any demand registration is subject to cut-backs in priority for underwritten offerings upon the recommendation of the underwriters thereof. Citi will not have the right to require a demand registration, unless it proposes to sell at least 5% of our outstanding common stock in such offering, or such offering includes all of its remaining shares of our common stock that are subject to registration rights agreements. Citi will also have the right to require us to file a shelf registration statement to permit the public resale of shares of our common stock held by it from time to time. These registration rights are transferable by Citi.
We will agree to pay all costs and expenses in connection with each such registration, except underwriting fees, discounts and commissions applicable to the shares of common stock to be sold by Citi. The registration rights agreement will contain customary terms and provisions with respect to, among other things, registration procedures, including with respect to cooperation of management, timing of filings of registration statements and amendments, notifications regarding necessary changes to registration statements, entering into underwriting agreements and securities exchange listings. The registration rights agreement will also provide for customary indemnification by us of Citi in connection with third-party claims that arise out of untrue statements of material fact contained in any registration statement or prospectus filed pursuant to the registration rights agreement or omission of a material fact required to be stated in any registration statement or prospectus or necessary to make the statements in such registration statement or prospectus not misleading.
Citi Assurance Services Cards Agreement
As part of our separation from Citi, Citi Assurance Services, or CAS, will enter into two five-year agreements with Citi’s credit card businesses, or Citi Cards, to continue to provide administration services for Citi’s debt protection product portfolios. Our CAS operations team will service this product from Fort Worth, Texas. We expect that this servicing agreement will generate non-lending, fee-based revenues of approximately $ million per year. We will also enter into an agreement with Citi’s branded cards business to underwrite and administer selected insurance benefits provided complimentary with the credit card. We expect to generate approximately $ million per year in premium and other fee income.
Citi Assurance Services Canada Agreement
Prior to completion of this offering, the insurance companies within CAS will enter into a five-year insurance distribution agreement with CitiFinancial Canada whereby we will continue to be the sole underwriter for all the credit insurance products sold by CitiFinancial Canada to its customers. We will pay CitiFinancial Canada a customary distribution fee and a participation in the underwriting profits on all new policies written after separation. We expect to generate revenues greater than $ million per year from this arrangement with CitiFinancial Canada.
Back-Office Account Management System Agreement
A Citi affiliate has entered into a contract to obtain a new back-office account management system for us and will allocate approximately $5.7 million of the costs to us. We have entered into a separate but similar contract that will be effective once the new account management system is online. Starting in the fourth quarter of 2015, we will be obligated to pay approximately $6.8 million per year for a five-year initial term. At our option, we may terminate the contract at any time prior to the expiration of the five-year initial term in exchange for an early termination fee of approximately $26.3 million less any fees already paid.
118
Table of Contents
Indemnification Agreements
Prior to the completion of this offering, we expect to enter into indemnification agreements with each of our directors and executive officers. The indemnification agreements and our Amended and Restated Certificate of Incorporation will require us to indemnify our directors and executive officers to the fullest extent permitted by law. The indemnification agreement will provide our directors and executive officers with contractual rights to indemnification and expense advancement rights.
Other Related Party Transactions
Formation of OneMain and Separation from CitiFinancial Servicing
Prior to 2011, we were part of a larger business within Citi known as CFNA which contained approximately $10 billion of personal loans and $15 billion of mortgage and real estate loans in the United States. In the middle of 2010, management decided to split the U.S. business of CFNA into two distinct business lines. OneMain, the go-forward business, retained the majority of U.S. personal loans and a portion of U.S. real estate loans. CitiFinancial Servicing was formed with the remaining portion that did not strategically align with OneMain’s go-forward origination and risk strategy. CitiFinancial Servicing was designed to support certain customers and loans that would benefit from expanded support, including loan modifications or restructurings rather than originate loans. In effect, CitiFinancial Servicing became a liquidating business.
On July 1, 2011, we also began to service certain real estate loans for CitiFinancial Servicing for which we received a servicing fee. This real estate servicing arrangement ceased as of January 6, 2014 and we no longer receive a servicing fee from CitiFinancial Servicing. On January 1, 2014, we also transferred all real estate loans that we owned to CitiFinancial Servicing and therefore all of the originations and servicings that are currently in our Lending Segment are related to personal loans only.
Services Provided by Citi
Citi and its subsidiaries have historically provided us centralized support functions related to employee benefits, technology, operations, office space and other shared services. Citi has also historically provided funding to us. For a description of these arrangements, see “Management’s Discussion and Analysis of Results of Operations and Financial Condition—Our Separation from Citi.”
Securitizations
Citigroup Global Markets Inc. served as an initial purchaser in each of our securitization financings conducted in April 2014 and July 2014. Citigroup Global Markets Inc. received a market-standard underwriting fee for each securitization and may also conduct market-making activities in the secondary market for such securities.
119
Table of Contents
PRINCIPAL AND SELLING STOCKHOLDERS
Prior to the completion of this offering, all shares of our common stock are owned by CitiFinancial Credit Company, or CCC, an indirect subsidiary of Citi. Upon completion of this offering, we will have shares of common stock issued and outstanding, assuming the underwriters’ option to purchase additional shares of common stock from us is not exercised, and shares, if it is exercised in full. Upon the completion of this offering, Citi (through CCC) will beneficially own approximately % of our outstanding common stock, assuming the underwriters’ option to purchase additional shares of common stock from us is not exercised, and %, if it is exercised in full.
The following table sets forth information at October 8, 2014 regarding the beneficial ownership of our common stock by:
| • | each person whom we know to own beneficially more than 5% of our common stock; |
| • | each of our directors and named executive officers individually; and |
| • | all directors and executive officers as a group. |
In accordance with the rules of the SEC, beneficial ownership includes voting or investment power with respect to securities and includes the shares issuable pursuant to stock options that are exercisable within 60 days of October 8, 2014. Shares issuable pursuant to stock options are deemed outstanding for computing the percentage ownership of the person holding such options but are not outstanding for computing the percentage ownership of any other person. The percentage of beneficial ownership for the following table is based on shares of common stock outstanding as of October 8, 2014.
Unless otherwise indicated below, the address for each listed stockholder is: c/o OneMain Financial Holdings, Inc., 300 Saint Paul Place, Baltimore, Maryland 21202. To our knowledge, except as indicated in the footnotes to this table and pursuant to applicable community property laws, the persons named in the table have sole voting and investment power with respect to all shares of common stock.
| Shares Beneficially
Owned Before the Offering |
Shares
Beneficially Owned After the Offering(1) | |||||||||||
| Name of Beneficial Owner |
Number | Percent | Number | Percent | ||||||||
| Citigroup Inc.(2) |
100 | % | ||||||||||
| Mary McDowell |
— | — | ||||||||||
| Micah Conrad |
— | — | ||||||||||
| John Schachtel |
— | — | ||||||||||
| Dava Carson |
— | — | ||||||||||
| Stephen Wheeler |
— | — | ||||||||||
| Sean Bennett |
— | — | ||||||||||
| April O. Park |
— | — | ||||||||||
| David Neaves |
— | — | ||||||||||
| William J. Mills |
— | — | ||||||||||
| Francesco Vanni d’Archirafi |
— | — | ||||||||||
| All current directors and executive officers as a |
— | — | ||||||||||
| (1) | Assumes no exercise of the underwriters’ over-allotment option. See “Underwriting.” |
| (2) | The address for Citigroup Inc. is 399 Park Avenue, New York, New York 10022. |
120
Table of Contents
DESCRIPTION OF CERTAIN INDEBTEDNESS
Securitization Financings
On April 17, 2014, we completed our initial Reg 144A/Reg S securitization transaction in which OneMain Financial Issuance Trust 2014-1, a wholly owned special purpose entity of OneMain Financial Holdings, Inc., issued fixed-rate funding notes with an initial principal balance of $760 million. The transaction consisted of a Class A note and a Class B note, rated A and BBB by S&P, respectively, and AA and A by DBRS, respectively. The notes mature in June 2024 and have a twenty-four month revolving period.
On July 30, 2014, we completed the second Reg 144A/Reg S securitization transaction in which the OneMain Financial Issuance Trust 2014-2, a wholly owned special purpose vehicle of OneMain Financial Holdings, Inc., issued fixed-rate funding notes with an initial principal balance of $1,184 million. The transaction consisted of a Class A note, a Class B note, a Class C note and a Class D note. The notes were rated A, BBB, BB and B by S&P, respectively, and AA, A, BBB and BB by DBRS, respectively. The notes mature in September 2024 and have a twenty-four month revolving period.
Dividend Note
Prior to this offering, we expect to declare a dividend of a $ million note, which we refer to as the Dividend Note, and issue the Dividend Note to Citi. We intend to repay the Dividend Note in full (plus any accrued and unpaid interest thereon) with the proceeds of this offering.
121
Table of Contents
The following descriptions are summaries of the material terms of our Amended and Restated Certificate of Incorporation and Bylaws. Reference is made to the more detailed provisions of, and the descriptions are qualified in their entirety by reference to, the Amended and Restated Certificate of Incorporation and Bylaws, copies of which are filed with the SEC as exhibits to the registration statement of which this prospectus is a part, and applicable law.
General
Upon completion of this offering, our authorized capital stock will consist of shares of common stock, without par value and shares of preferred stock, without par value. Upon the completion of this offering, we will have shares of common stock outstanding and no shares of preferred stock outstanding.
Common Stock. Holders of our common stock will be entitled to one vote per share on all matters submitted to a vote of stockholders. Holders of our common stock will be entitled to receive dividends as may be declared by our Board of Directors out of funds legally available for the payment of those dividends. Upon the liquidation, dissolution or winding up of our company, the holders of our common stock will be entitled to receive their ratable share of our net assets available after payment of all debts and other liabilities, subject to the prior rights of any outstanding preferred stock. Holders of our common stock will have no preemptive, subscription or redemption rights. The outstanding shares of our common stock are fully paid and non-assessable.
Preferred Stock. Our Board of Directors will have the authority, without any further vote or action by the stockholders, to issue one or more series of preferred stock and to fix the designations, powers, preferences and relative, participating, optional or other rights, if any, and the qualifications, limitations or restrictions thereof, if any, with respect to each such class or series of Preferred Stock and the number of shares constituting each such class or series, and to increase or decrease the number of shares of any such class or series to the extent permitted by the Delaware General Corporation Law, or the DGCL.
Anti-Takeover Effects of Provisions of the DGCL and Our Amended and Restated Certificate of Incorporation and Bylaws
The DGCL, our Amended and Restated Certificate of Incorporation and Bylaws contain provisions that may delay, deter, prevent or render more difficult a takeover attempt that our stockholders might consider to be in their best interests. Even in the absence of a takeover attempt, these provisions may also adversely affect the prevailing market price for our common stock if they are viewed as limiting the liquidity of our common stock or discouraging takeover attempts in the future.
However, we believe that the anti-takeover provisions may give us the ability to negotiate with the proponent of an unsolicited proposal to acquire or restructure us and outweigh the disadvantage of discouraging those proposals because negotiation of the proposals could result in an improvement of their terms.
Classified Board of Directors
Our Amended and Restated Certificate of Incorporation will provide that as long as Citi beneficially owns 30% or more of the total voting power of all our outstanding securities generally entitled to vote in the election of directors, voting together as a single class, each director on our Board of Directors will be elected at each annual meeting of stockholders for a term expiring at the next succeeding annual meeting of stockholders. Thereafter, our Board of Directors will be classified with approximately one-third elected each year. The number of directors will be fixed from time to time by a majority of the total number of directors which we would have at the time such number is fixed if there were no vacancies. The directors will be divided into three classes, designated Class I, Class II and Class III. Each class will consist, as nearly as possible, of one-third of the total number of directors
122
Table of Contents
constituting the entire board. At each annual meeting of stockholders after Citi no longer beneficially owns 30% or more of the total voting power of all of our outstanding securities generally entitled to vote in the election of directors, voting together as a single class, successors to the class of directors whose term expires at that annual meeting will be elected for a three-year term. Any vacancy on the Board of Directors that results from an increase in the number of directors may be filled only by a majority of the Board of Directors then in office, provided that a quorum is present, and any other vacancy occurring on the Board of Directors may be filled only by a majority of the Board of Directors then in office, even if less than a quorum, or by a sole remaining director.
In the event that Citi beneficially owns 30% or more of the total voting power of all of our outstanding securities generally entitled to vote in the election of directors, voting together as a single class, the Board of Directors may be elected, removed or replaced at any time either with or without cause by the affirmative vote of a majority of the total voting power of all of our outstanding securities generally entitled to vote in the election of directors, voting together as a single class. After Citi no longer beneficially owns 30% or more of the total voting power of all of our outstanding securities generally entitled to vote in the election of directors, voting together as a single class, any or all of our Board of Directors may be removed from office at any time, but only for cause at a duly called meeting of stockholders at which a quorum is present and only by the affirmative vote of at least sixty-six and two thirds percent (66 2/3%) of the total voting power of all of our outstanding securities generally entitled to vote in the election of directors, voting together as a single class. In the event that Citi owns 30% or more of the total voting power of all of our outstanding securities generally entitled to vote in the election of directors, voting together as a single class, any amendment to the provisions of the Amended and Restated Certificate of Incorporation described in this and the preceding paragraph will require the affirmative vote of at least 80% of the votes entitled to be cast on such matter.
Stockholder Action by Written Consent; Special Meetings
Our Amended and Restated Certificate of Incorporation will permit stockholders to take action by the written consent of holders of a majority of our shares in lieu of an annual or special meeting, as long as Citi beneficially owns 30% or more of the total voting power of all of our outstanding securities generally entitled to vote in the election of directors, voting together as a single class. Otherwise, stockholders will only be able to take action at a stockholder meeting called in accordance with our Bylaws.
Our Amended and Restated Certificate of Incorporation and Bylaws will provide that as long as Citi beneficially owns 30% or more of the total voting power of all of our outstanding securities generally entitled to vote in the election of directors, voting together as a single class, special meetings of the stockholders may be called by any of (i) the Chairman of the Board of Directors, (ii) the Chief Executive Officer, (iii) the Board of Directors acting pursuant to a resolution adopted by a majority of the Board of Directors or (iv) our Secretary at the request of holders of record of 30% of the total voting power of all of our outstanding securities generally entitled to vote in the election of directors, voting together as a single class. Our Amended and Restated Certificate of Incorporation and Bylaws will provide that after Citi beneficially owns less than 30% of the total voting power of all of our outstanding securities generally entitled to vote in the election of directors, voting together as a single class, stockholders will no longer be able to request a special meeting.
In the event that Citi owns 30% or more of the total voting power of all of our outstanding securities generally entitled to vote in the election of directors, voting together as a single class, any amendment to the provisions of the Amended and Restated Certificate of Incorporation described in this and the preceding paragraph will require the affirmative vote of at least 80% of the votes entitled to be cast on such matter.
Advance Notice Requirements for Stockholder Proposals Related to Director Nominations
Our Bylaws will contain advance notice procedures with regard to stockholder proposals related to the nomination of candidates for election as directors. These procedures will provide that notice of stockholder
123
Table of Contents
proposals related to stockholder nominations for the election of directors must be received by our corporate secretary, in the case of an annual meeting, not less than 120 days nor more than 150 days prior to the anniversary date of the immediately preceding annual meeting of stockholders; provided, however, that in the event that the date of the annual meeting is advanced more than 30 days prior to such anniversary date or delayed more than 70 days after such anniversary date then to be timely such notice must be received by us no earlier than 120 days prior to such annual meeting and no later than the later of 70 days prior to the date of the meeting or the 10th day following the day on which public announcement of the date of the meeting was first made by us. Stockholder nominations for the election of directors at a special meeting at which directors are elected must be delivered to or mailed and received at our principal executive offices (i) not earlier than 150 days prior to the date of the special meeting nor (ii) later than the later of 120 days prior to the date of the special meeting or the 10th day following the day on which public announcement of the date of the special meeting was first made.
A stockholders’ notice to our corporate secretary must be in proper written form and must set forth certain information related to the stockholder giving the notice and to the beneficial owner, if any, on whose behalf the nomination is being made, including:
| • | the name and address of such stockholder (as it appears on our books) and any such beneficial owner; |
| • | for each class or series, the number of shares of our capital stock that are held of record or are beneficially owned by such stockholder and by any such beneficial owner; |
| • | a description of any agreement, arrangement or understanding between or among such stockholder and any such beneficial owner, any of their respective affiliates or associates, and any other person or persons (including their names) in connection with the proposal of such nomination or other business; |
| • | a description of any agreement, arrangement or understanding (including, regardless of the form of settlement, any derivative, long or short positions, profit interests, forwards, futures, swaps, options, warrants, convertible securities, stock appreciation or similar rights, hedging transactions and borrowed or loaned shares) that has been entered into by or on behalf of, or any other agreement, arrangement or understanding that has been made, the effect or intent of which is to create or mitigate loss to, manage risk or benefit of share price changes for, or increase or decrease the voting power of, such stockholder or any such beneficial owner or any such nominee with respect to our securities; |
| • | a representation that the stockholder is a holder of record of our stock entitled to vote at such meeting and intends to appear in person or by proxy at the meeting to bring such nomination or other business before the meeting; |
| • | a representation as to whether such stockholder or any such beneficial owner intends or is part of a group that intends to (i) deliver a proxy statement and/or form of proxy to holders of at least the percentage of the voting power of our outstanding capital stock required to approve or adopt the proposal or to elect each such nominee and/or (ii) otherwise to solicit proxies from stockholders in support of such proposal or nomination; |
| • | any other information relating to such stockholder, beneficial owner, if any, or director nominee or proposed business that would be required to be disclosed in a proxy statement or other filing required to be made in connection with the solicitation of proxies in support of such nominee or proposal pursuant to Section 14 of the Exchange Act; and |
| • | such other information relating to any proposed item of business may reasonably require to determine whether such proposed item of business is a proper matter for stockholder action. |
and, as to each person whom the stockholder proposes to nominate for election as a director:
| • | all information relating to such person that is required to be disclosed in solicitations of proxies for election of directors, or is otherwise required, in each case pursuant to Regulation 14A under the Exchange Act including such person’s written consent to being named in the proxy statement as a nominee and to serving as a director if elected; and |
124
Table of Contents
| • | a reasonably detailed description of any compensatory, payment or other financial agreement, arrangement or understanding that such person has with any other person or entity other than us including the amount of any payment or payments received or receivable thereunder, in each case in connection with candidacy or service as a director of OneMain. |
Advance Notice Requirements for Other Stockholder Proposals
Our Bylaws will contain advance notice procedures with regard to stockholder proposals not related to nominations. These notice procedures, in the case of an annual or special meeting of stockholders, will mirror the notice requirements for stockholder proposals related to director nominations discussed above.
A stockholders’ notice to our corporate secretary must be in proper written form and, in addition to the notice procedures described above, must set forth, as to each matter that the stockholder proposes to bring before the meeting:
| • | a brief description of the business desired to be brought before the meeting; |
| • | the text of the proposal or business (including the text of any resolutions proposed for consideration and in the event that such business includes a proposal to amend these Bylaws, the text of the proposed amendment); and |
| • | the reasons for conducting such business and any material interest in such business of such stockholder and the beneficial owner, if any, on whose behalf the proposal is made. |
Anti-Takeover Legislation
As a Delaware corporation, we will be subject to the restrictions under Section 203 of the DGCL regarding corporate takeovers. In general, Section 203 prohibits a publicly-held Delaware corporation from engaging, under certain circumstances, in a business combination with an interested stockholder for a period of three years following the date the person became an interested stockholder, unless:
| • | prior to the date of the transaction, the Board of Directors of the corporation approved either the business combination or the transaction which resulted in the stockholder becoming an interested stockholder; |
| • | upon completion of the transaction that resulted in the stockholder becoming an interested stockholder, the interested stockholder owned at least 85% of the voting stock of the corporation outstanding at the time such transaction commenced, excluding, for purposes of determining the number of shares outstanding, (1) shares owned by persons who are directors and also officers of the corporation and (2) shares owned by employee stock plans in which employee participants do not have the right to determine confidentially whether shares held subject to the plan will be tendered in a tender or exchange offer; or |
| • | on or subsequent to the date of the transaction, the business combination is approved by the Board of Directors of the corporation and authorized at an annual or special meeting of stockholders by the affirmative vote of at least 66 2/3% of the outstanding voting stock which is not wholly owned by the interested stockholder. |
In this context, a business combination includes a merger, asset or stock sale, or other transaction resulting in a financial benefit to the interested stockholder. An interested stockholder is a person who, together with affiliates and associates, owns or, within three years prior to the determination of interested stockholder status owned, 15% or more of a corporation’s outstanding voting stock.
A Delaware corporation may “opt out” of Section 203 with an express provision in its original certificate of incorporation or an express provision in its certificate of incorporation or Bylaws resulting from amendments approved by holders of at least a majority of the corporation’s outstanding voting shares. We will “opt out” of Section 203 until such time as Citi ceases to beneficially own 30% or more of the total voting power of all outstanding securities of OneMain generally entitled to vote in the election of directors, voting together as a single class. After such time, Section 203 will be applicable to us.
125
Table of Contents
Undesignated Preferred Stock
The issuance of preferred stock with voting or other rights or preferences could potentially discourage attempts by third parties to obtain control of us through a merger, tender offer, proxy contest or otherwise by making takeover attempts more difficult or more costly. The Board of Director’s authorization of preferred stock may defer hostile takeovers or delay changes of control of our management.
Insurance Regulations Concerning Change of Control
The insurance laws and regulations of the jurisdiction in which our insurance subsidiaries are domiciled generally provide that no person may acquire control, directly or indirectly, of a domiciled insurer, unless the person has provided required information to, and the acquisition is approved or not disapproved by, the applicable state department of insurance. Generally, any person acquiring beneficial ownership of 10% or more of our voting securities would be presumed to have acquired indirect control of our insurance subsidiaries unless the applicable state department of insurance, upon application, determines otherwise. Certain purchasers of shares of our common stock could be subject to similar approvals which could significantly delay or otherwise impede their ability to complete such purchase.
Certificate of Incorporation Provision Relating to Corporate Opportunities and Interested Directors
In order to address potential conflicts of interest between us and Citi, our Amended and Restated Certificate of Incorporation will regulate and define our affairs as they may involve Citi and its officers and directors, and our powers, rights, duties and liabilities and those of our officers, directors and stockholders in connection with our relationship with Citi. In general, these provisions recognize that we and Citi may engage in the same or similar business activities and lines of business, have an interest in the same areas of corporate opportunities and that we and Citi will continue to have contractual and business relations with each other, including certain officers and directors of Citi serving as our directors.
Our Amended and Restated Certificate of Incorporation will provide that, subject to any contractual provision to the contrary, Citi will have no duty to refrain from:
| • | engaging in the same or similar business activities or lines of business as us; |
| • | doing business with any of our clients; or |
| • | employing or otherwise engaging any of our officers or employees. |
Under our Amended and Restated Certificate of Incorporation, neither Citi nor any officer or director of Citi, except as described in the following paragraph, will be liable to us or our stockholders for breach of any fiduciary duty by reason of any such activities. Our Amended and Restated Certificate of Incorporation will provide that Citi is not under any duty to present any corporate opportunity to us which may be a corporate opportunity for Citi and us, and Citi will not be liable to us or our stockholders for breach of any fiduciary duty as our stockholder by reason of the fact that Citi pursues or acquires that corporate opportunity for itself, directs that corporate opportunity to another person or does not present that corporate opportunity to us.
When one of our directors or officers who is also a director or officer of Citi learns of a potential transaction or matter that may be a corporate opportunity for both us and Citi, the Amended and Restated Certificate of Incorporation will provide that the director or officer:
| • | will have fully satisfied his or her fiduciary duties to us and our stockholders with respect to that corporate opportunity; |
| • | will not be liable to us or our stockholders for breach of fiduciary duty by reason of Citi’s actions with respect to that corporate opportunity; |
| • | will be deemed to have acted in good faith and in a manner he or she believed to be in, and not opposed to, our best interests for purposes of our Amended and Restated Certificate of Incorporation; and |
126
Table of Contents
| • | will be deemed not to have breached his or her duty of loyalty to us or our stockholders and not to have derived an improper personal benefit therefrom for purposes of our Amended and Restated Certificate of Incorporation. |
After such time that Citi ceases to own 20% or more of the total voting power of all of our outstanding securities generally entitled to vote in the election of directors, voting together as a single class, the provisions of the Amended and Restated Certificate of Incorporation described in this paragraph shall become inoperative. Thereafter, the approval or allocation of corporate opportunities would depend on the facts and circumstances of the particular situation analyzed under the corporate opportunity doctrine. The Delaware courts have found that a director or officer “may not take a business opportunity for his own if: (1) the corporation is financially able to exploit the opportunity; (2) the opportunity is within the corporation’s line of business; (3) the corporation has an interest or expectancy in the opportunity; and (4) by taking the opportunity for his own, the director or officer will thereby be placed in a position inimical to his duties to the corporation.” On the other hand, a director or officer “may take a corporate opportunity if: (1) the opportunity is presented to the director or officer in his individual and not his corporate capacity; (2) the opportunity is not essential to the corporation; (3) the corporation holds no interest or expectancy in the opportunity; and (4) the director or officer has not wrongfully employed the resources of the corporation in pursuing or exploiting the opportunity.” A director or officer may also “present” an opportunity to the Board of Directors of a corporation to determine whether such opportunity belongs to the corporation and thereby be protected from inference of usurpation of corporate opportunity.
The Amended and Restated Certificate of Incorporation will also provide that no contract, agreement, arrangement or transaction between us and Citi will be void or voidable solely for the reason that Citi is a party to such agreement and Citi:
| • | will have fully satisfied and fulfilled its fiduciary duties to us and our stockholders with respect to the contract, agreement, arrangement or transaction; |
| • | will not be liable to us or our stockholders for breach of fiduciary duty by reason of entering into, performance or consummation of any such contract, agreement, arrangements or transaction; |
| • | will be deemed to have acted in good faith and in a manner it reasonably believed to be in, and not opposed to, the best interests of us for purposes of the Amended and Restated Certificate of Incorporation; and |
| • | will be deemed not to have breached its duty of loyalty to us and our stockholders and not to have derived an improper personal benefit therefrom for purposes of the Amended and Restated Certificate of Incorporation, if: |
| • | the material facts as to the contract, agreement, arrangement or transaction are disclosed or are known to our Board of Directors or the committee of our board that authorizes the contract, agreement, arrangement or transaction and our Board of Directors or that committee in good faith authorizes the contract, agreement, arrangement or transaction by the affirmative vote of a majority of the disinterested directors; |
| • | the material facts as to the contract, agreement, arrangement or transaction are disclosed to or are known by the holders of our shares entitled to vote on such contract, agreement, arrangement or transaction and the contract, agreement, arrangement or transaction is specifically approved in good faith by vote of the holders of a majority of the votes entitled to be cast by the holders of our common stock then outstanding not owned by Citi or a related entity; or |
| • | the contract, agreement, arrangement or transaction, judged according to the circumstances at the time of the commitment, is fair to us. |
Any person purchasing or otherwise acquiring any interest in any shares of our capital stock will be deemed to have consented to these provisions of the Amended and Restated Certificate of Incorporation.
127
Table of Contents
Until the time that Citi ceases to own shares entitled to 20% or more of the total voting power of all of our outstanding securities generally entitled to vote in the election of directors, voting together as a single class, the affirmative vote of the holders of at least 80% of the votes entitled to be cast will be required to alter, amend or repeal, or adopt any provision inconsistent with the corporate opportunity and interested director provisions described above; however, after Citi no longer owns 20% or more of the total voting power of all of our outstanding securities generally entitled to vote in the election of directors, voting together as a single class, any such alteration, adoption, amendment or repeal would be approved if a quorum is present and the votes favoring the action exceed the votes opposing it. Accordingly, until such time, so long as Citi owns 20% or more of the total voting power of all of our outstanding securities generally entitled to vote in the election of directors, voting together as a single class, it can prevent any such alteration, adoption, amendment or repeal.
In addition to the provisions relating to corporate opportunities and interested directors in our Amended and Restated Certificate of Incorporation, we will enter into a shareholders’ agreement with Citi that will prohibit each party from soliciting or hiring the other party’s employees above certain compensation levels without the consent of such other party. See “Certain Relationships and Related Party Transactions —Relationship with Citi.”
Provisions Relating to Regulatory Status
The Amended and Restated Certificate of Incorporation will also contain provisions regulating and defining the conduct of our affairs that may affect Citi’s legal and regulatory status. In general, the Amended and Restated Certificate of Incorporation will provide that, without the written consent of Citi, we will not take any action that, to our knowledge, would result in:
| • | Citi having to obtain the authorization or approval of, or otherwise become subject to any rules, regulations or other legal restrictions of any governmental, administrative or regulatory authority; or |
| • | any of our directors who is also a director or officer of Citi being ineligible or prohibited from serving as our director or, where such person is a director of Citi, as a director of Citi under applicable law. |
The Amended and Restated Certificate of Incorporation will further provide that Citi will not be liable to us or our stockholders for breach of any fiduciary duty by reason of the fact that Citi gives or withholds any such consent for any reason.
Any person or entity purchasing or otherwise acquiring any interest in shares of our capital stock will be deemed to have consented to these provisions of the Amended and Restated Certificate of Incorporation.
This provision will be in effect until (1) Citi no longer owns 10% or more of the shares of our capital stock, (2) Citi no longer owns 5% or more of the total voting power of all of our outstanding securities generally entitled to vote in the election of directors, voting together as a single class and (3) less than 5% of the members on the Board of Directors are considered “affiliates” of Citi under Rule 10A-3(b)(1) under the Exchange Act.
Until the regulatory status provision of the Amended and Restated Certificate of Incorporation is no longer in effect, any amendment to this provision will require the affirmative vote of at least 80% of the total voting power of all of our outstanding securities generally entitled to vote in the election of directors, voting together as a single class.
The Delaware courts have not conclusively determined the validity or enforceability of provisions relating to corporate opportunities, interested directors and legal and regulatory status that are included in our Amended and Restated Certificate of Incorporation and could rule that some liabilities that those provisions purport to eliminate remain in effect.
Limitation of Liability of Directors; Indemnification
Our Amended and Restated Certificate of Incorporation will provide that none of our directors shall be liable to us or our stockholders for monetary damages for any breach of fiduciary duty as a director, except to the
128
Table of Contents
extent otherwise required by the DGCL. The effect of this provision is to eliminate our rights, and our stockholders’ rights, to recover monetary damages against a director for breach of a fiduciary duty of care as a director. This provision does not limit or eliminate our right, or the right of any stockholder, to seek non-monetary relief, such as an injunction or rescission in the event of a breach of a director’s duty of care. These provisions will not alter the liability of directors under federal or state securities laws. Our Amended and Restated Certificate of Incorporation will also include provisions for the indemnification of our directors and officers to the fullest extent permitted by the DGCL. Further, we will enter into indemnification agreements with our directors and executive officers which require us, among other things, to indemnify them against certain liabilities which may arise by reason of their status or service as a director or officer and to advance to them expenses, subject to reimbursement to us if it is determined that they are not entitled to indemnification. We also have obtained director and officer liability insurance.
Listing
We intend to apply to have the common stock listed on the New York Stock Exchange under the trading symbol “ .”
Transfer Agent and Registrar
The Transfer Agent and Registrar for the common stock is .
129
Table of Contents
MATERIAL U.S. FEDERAL TAX CONSIDERATIONS FOR
NON-U.S. HOLDERS OF OUR COMMON STOCK
The following is a general discussion of the material U.S. federal income and estate tax consequences of the ownership and disposition of our common stock by a beneficial owner that is a “non-U.S. holder.” This discussion addresses only the U.S. federal income and estate tax considerations of non-U.S. holders that are initial purchasers of our common stock pursuant to the offering and that will hold our common stock as capital assets. For purposes of this discussion, a “non-U.S. holder” is a person or entity that, for U.S. federal income tax purposes, is a:
| • | non-resident alien individual, other than certain former citizens and residents of the United States subject to tax as expatriates; |
| • | foreign corporation; or |
| • | foreign estate or trust (as defined for U.S. federal income tax purposes). |
A “non-U.S. holder” does not include an individual who is present in the United States for 183 days or more in the taxable year of disposition of our common stock and is not otherwise a resident of the United States for U.S. federal income tax purposes. Such an individual is urged to consult his or her tax adviser regarding the U.S. federal income tax consequences of the sale, exchange or other disposition of common stock.
If an entity that is classified as a partnership for U.S. federal income tax purposes owns our common stock, the U.S. federal income tax treatment of a partner will generally depend on the status of the partner and upon the activities of the partnership. Partnerships owning our common stock and partners in such partnerships should consult their tax advisers as to the U.S. federal income tax consequences of owning and disposing of our common stock.
This discussion is based on the Internal Revenue Code of 1986, as amended (the “Code”), administrative pronouncements, judicial decisions and final, temporary and proposed Treasury Regulations, all as of the date hereof, changes to any of which subsequent to the date of this prospectus may affect the tax consequences described herein. This discussion does not address all aspects of U.S. federal income and estate taxation that may be relevant to non-U.S. holders in light of their particular circumstances and does not address any tax consequences arising under the laws of any state, local or foreign jurisdiction. Prospective holders are urged to consult their tax advisers with respect to the particular tax consequences to them of owning and disposing of our common stock, including the consequences under the laws of any state, local or foreign jurisdiction.
Dividends
We do not currently expect to make dividend distributions with respect to our common stock. See “Dividend Policy.” In the event that we do make such distributions, they will constitute dividends for U.S. federal income tax purposes to the extent of our current or accumulated earnings and profits, as determined under U.S. federal income tax principles. If a distribution with respect to our common stock exceeds our current and accumulated earnings and profits, the excess will be treated as a tax-free return of a non-U.S. holder’s investment, up to such non-U.S. holder’s tax basis in our common stock. Any remaining excess will be treated as capital gain, subject to the tax treatment described below in “—Gain on Disposition of Common Stock.”
Dividends paid to a non-U.S. holder of our common stock generally will be subject to withholding tax at a 30% rate or a reduced rate specified by an applicable income tax treaty. In order to obtain a reduced rate of withholding, a non-U.S. holder will be required to provide an Internal Revenue Service Form W-8BEN or W-8BEN-E, as applicable, certifying its entitlement to benefits under a treaty.
The withholding tax does not apply to dividends paid to a non-U.S. holder who provides an Internal Revenue Service Form W-8ECI, certifying that the dividends are effectively connected with the non-U.S. holder’s conduct of a trade or business within the United States. Instead, the effectively connected dividends will
130
Table of Contents
be subject to regular U.S. income tax as if the non-U.S. holder were a U.S. resident, subject to an applicable income tax treaty providing otherwise. A non-U.S. corporation receiving effectively connected dividends may also be subject to an additional “branch profits tax” imposed at a rate of 30% (or a lower treaty rate).
Gain on Disposition of our Common Stock
A non-U.S. holder generally will not be subject to U.S. federal income tax on gain realized on a sale or other disposition of our common stock unless:
| • | the gain is effectively connected with a trade or business of the non-U.S. holder in the United States, subject to an applicable treaty providing otherwise, in which case the gain will be subject to U.S. federal income tax generally in the same manner as effectively connected dividend income as described above; or |
| • | we are or have been a U.S. real property holding corporation at any time within the five-year period preceding the disposition or the non-U.S. holder’s holding period, whichever is shorter, and either (i) our common stock has ceased to be traded on an established securities market prior to the beginning of the calendar year in which the sale or disposition occurs or (ii) such non-U.S. holder owns, or has owned, at any time during the five-year period preceding the disposition or such non-U.S. holder’s holding period, whichever is shorter, actually or constructively, more than 5% of our common stock. |
We believe that we are not, and we do not anticipate becoming, a U.S. real property holding corporation.
Information Reporting and Backup Withholding Requirements
Information returns will be filed with the Internal Revenue Service in connection with payments of dividends. A non-U.S. holder may have to comply with certification procedures to establish that it is not a U.S. person in order to avoid information reporting and backup withholding requirements with respect to payments of dividends or proceeds from a sale or disposition of our common stock. The certification procedures required to claim a reduced rate of withholding under a treaty will satisfy the certification requirements necessary to avoid backup withholding as well. The amount of any backup withholding from a payment to a non-U.S. holder will be allowed as a credit against such holder’s U.S. federal income tax liability and may entitle such holder to a refund, provided that the required information is timely furnished to the Internal Revenue Service.
FATCA Withholding Tax
Provisions commonly referred to as “FATCA” will impose withholding at a rate of 30% on payments of U.S.-source dividends, and sales or redemption proceeds (beginning in 2017) with respect to our common stock, to “foreign financial institutions” (which is broadly defined for this purpose and in general includes investment vehicles) and certain other non-U.S. entities unless various U.S. information reporting and due diligence requirements (generally relating to ownership by U.S. persons of interests in or accounts with those entities) have been satisfied, or an exemption applies. If FATCA withholding is imposed, a beneficial owner that is not a foreign financial institution generally will be entitled to a refund of any amounts withheld by filing a U.S. federal income tax return (which may entail significant administrative burden). Prospective investors should consult their tax advisers regarding the effects of FATCA on their investment in our common stock.
Federal Estate Tax
Individual non-U.S. holders and entities the property of which is potentially includible in such an individual’s gross estate for U.S. federal estate tax purposes (for example, a trust funded by such an individual and with respect to which the individual has retained certain interests or powers), should note that, absent an applicable treaty benefit, our common stock will be treated as U.S. situs property subject to U.S. federal estate tax.
131
Table of Contents
SHARES ELIGIBLE FOR FUTURE SALE
Prior to this offering, there has been no market for our common stock. Future sales of substantial amounts of our common stock in the public market or perception of such sales could adversely affect market prices prevailing from time to time. Furthermore, because only a limited number of shares will be available for sale shortly after this offering due to existing contractual and legal restrictions on resale as described below, there may be sales of substantial amounts of our common stock in the public market after the restrictions lapse. This may adversely affect the prevailing market price and our ability to raise equity capital in the future.
Upon completion of this offering, we will have shares of common stock outstanding. Of these shares, the shares, or shares if the underwriters exercise their over-allotment option in full, sold in this offering will be freely transferable without restriction or registration under the Securities Act, except for any shares purchased by one of our existing “affiliates,” as that term is defined in Rule 144 under the Securities Act. The remaining shares of common stock existing are “restricted shares” as defined in Rule 144. Restricted shares may be sold in the public market only if registered or if they qualify for an exemption from registration under Rules 144 or 701 of the Securities Act. Citigroup Inc. will indirectly beneficially own all of the shares of our common stock not sold in this offering immediately after the completion of this offering.
Potential Future Sales by Citi
After the completion of this offering, Citi will beneficially own % of our common stock, assuming the underwriters do not exercise their over-allotment option. We can make no prediction as to the effect of Citi’s future sales of our common stock, if any, will have on the market price of shares of our common stock or the availability of shares of common stock for sale from time to time.
Rule 144
In general, under Rule 144 beginning 90 days after the date of this offering, an affiliate who has beneficially owned restricted shares of our common stock for at least six months would be entitled to sell within any three-month period a number of shares that does not exceed the greater of 1% of the number of shares of common stock then outstanding, which will equal shares immediately after this offering; assuming no exercise of the underwriters’ over-allotment option; or the average weekly reported volume of trading of our common stock during the four calendar weeks preceding the filing of a notice on Form 144 with respect to the sale. Sales by affiliates under Rule 144 are also limited by manner of sale provisions and notice requirements and the availability of current public information about us.
Following this offering, a person that is not an affiliate of ours at the time of, or at any time during the three months preceding, a sale and who has beneficially owned restricted shares of our common stock for at least six months, may sell shares without complying with the volume limitation, manner of sale or notice provisions described above, and any such person who has beneficially owned restricted shares of our common stock for at least one year may sell shares without complying with the abovementioned restrictions and the current public information requirement.
We are unable to estimate the number of shares that will be sold under Rule 144 since this will depend on the market price for our common stock, the personal circumstances of the stockholder and other factors.
Rule 701
In general, under Rule 701, any of our employees, directors, officers, consultants or advisors who purchases shares from us in connection with a compensatory stock or option plan or other written agreement before the effective date of this offering is entitled to resell such shares 90 days after the effective date of this offering in reliance on Rule 144, without having to comply with the holding period requirements or other restrictions contained in Rule 701.
132
Table of Contents
The Securities and Exchange Commission has indicated that Rule 701 will apply to typical stock options granted by an issuer before it becomes subject to the reporting requirements of the Securities Exchange Act of 1934, along with the shares acquired upon exercise of such options, including exercises after the date of this prospectus. Securities issued in reliance on Rule 701 are restricted securities and, subject to the contractual restrictions described above, beginning 90 days after the date of this prospectus, may be sold by persons other than “affiliates,” as defined in Rule 144, subject only to the manner of sale provisions of Rule 144 and by “affiliates” under Rule 144 without compliance with its one-year minimum holding period requirement.
Registration Rights
In connection with this offering, we will enter into a registration rights agreement with Citi pursuant to which we will provide Citi with certain registration rights relating to shares of our outstanding common stock held by Citi after this offering. Subject to certain limitations, Citi may require us to register under the Securities Act, all or any portion of the common stock, a so-called “demand request.” Additionally, Citi has so-called “piggyback” registration rights, which means that Citi may include its respective shares in any future registrations of our equity securities, whether or not that registration relates to a primary offering by us or a secondary offering by or on behalf of any of our stockholders. The demand registration rights and piggyback registration rights are each subject to market cutback exceptions. See “Certain Relationships and Related Party Transactions—Relationship with Citi—Registration Rights Agreement.”
Lock-Up Agreements
All of our directors, executive officers and the selling stockholder who collectively hold approximately shares of our common stock have agreed, subject to limited exceptions, not to offer, pledge, sell, contract to sell, sell any option or contract to purchase, purchase any option or contract to sell, grant any option, right or warrant to purchase, or otherwise transfer or dispose of, directly or indirectly, or enter into any swap or other arrangement that transfers to another, in whole or in part, any of the economic consequences of ownership of any shares of common stock or any securities convertible into or exercisable or exchangeable for shares of common stock for a period of 180 days after the date of this prospectus, without the prior written consent of Citigroup Global Markets Inc. See “Underwriting.”
133
Table of Contents
Citigroup Global Markets Inc. is acting as sole book-running manager of the offering and as representative of the underwriters named below. Subject to the terms and conditions stated in the underwriting agreement dated the date of this prospectus, each underwriter named below has severally agreed to purchase, and we have agreed to sell to each underwriter, the number of shares set forth opposite the underwriter’s name.
| Underwriter |
Number of Shares | |
| Citigroup Global Markets Inc. |
||
|
| ||
| Total. |
||
|
|
The underwriting agreement provides that the obligations of the underwriters to purchase the shares included in this offering are subject to approval of legal matters by counsel and to other conditions. The underwriters are obligated to purchase all the shares (other than those covered by the over-allotment option described below) if they purchase any of the shares.
Shares sold by the underwriters to the public will initially be offered at the initial public offering price set forth on the cover of this prospectus. Any shares sold by the underwriters to securities dealers may be sold at a discount from the initial public offering price not to exceed $ per share. If all the shares are not sold at the initial offering price, the underwriters may change the offering price and the other selling terms. The representative has advised us and the selling stockholder that the underwriters do not intend to make sales to discretionary accounts.
If the underwriters sell more shares than the total number set forth in the table above, the selling stockholder has granted to the underwriters an option, exercisable for 30 days from the date of this prospectus, to purchase up to additional shares at the public offering price less the underwriting discount. The underwriters may exercise the option solely for the purpose of covering over-allotments, if any, in connection with this offering. To the extent the option is exercised, each underwriter must purchase a number of additional shares approximately proportionate to that underwriter’s initial purchase commitment. Any shares issued or sold under the option will be issued and sold on the same terms and conditions as the other shares that are the subject of this offering.
We, our officers and directors and the selling stockholder have agreed that, for a period of 180 days from the date of this prospectus, we and they will not, without the prior written consent of Citigroup Global Markets Inc. dispose of or hedge any shares or any securities convertible into or exchangeable for our common stock. Citigroup Global Markets Inc., in its sole discretion, may release any of the securities subject to these lock-up agreements at any time, which, in the case of officers and directors, shall be with notice. Notwithstanding the foregoing, if (i) during the last 17 days of the 180-day restricted period, we issue an earnings release or material news or a material event relating to our company occurs; or (ii) prior to the expiration of the 180-day restricted period, we announce that we will release earnings results during the 16-day period beginning on the last day of the 180-day restricted period, the restrictions described above shall continue to apply until the expiration of the 18-day period beginning on the issuance of the earnings release or the occurrence of the material news or material event.
Prior to this offering, there has been no public market for our shares. Consequently, the initial public offering price for the shares was determined by negotiations among us, the selling stockholder and the representatives. Among the factors considered in determining the initial public offering price were our results of operations, our current financial condition, our future prospects, our markets, the economic conditions in and future prospects for the industry in which we compete, our management, and currently prevailing general conditions in the equity securities markets, including current market valuations of publicly traded companies considered comparable to our company. We cannot assure you, however, that the price at which the shares will sell in the public market after this offering will not be lower than the initial public offering price or that an active trading market in our shares will develop and continue after this offering.
134
Table of Contents
We intend to apply to have our shares listed on the New York Stock Exchange under the trading symbol “ .”
The following table shows the underwriting discounts and commissions that we and the selling stockholder will pay to the underwriters in connection with this offering. These amounts are shown assuming both no exercise and full exercise of the underwriters’ over-allotment option.
| Paid by OneMain | Paid by the Selling Stockholder | |||||||||||||||
| Full Exercise | No Exercise | Full Exercise | No Exercise | |||||||||||||
| Per share |
$ | $ | $ | $ | ||||||||||||
| Total |
$ | $ | $ | $ | ||||||||||||
The expenses of the offering, not including the underwriting discount, are estimated at $ million and are payable by us. We have agreed to reimburse the underwriters for expenses relating to the clearance of this offering with the Financial Industry Regulatory Authority up to $ .
In connection with the offering, the underwriters may purchase and sell shares in the open market. Purchases and sales in the open market may include short sales, purchases to cover short positions, which may include purchases pursuant to the over-allotment option, and stabilizing purchases.
| • | Short sales involve secondary market sales by the underwriters of a greater number of shares than they are required to purchase in the offering. |
| • | “Covered” short sales are sales of shares in an amount up to the number of shares represented by the underwriters’ over-allotment option. |
| • | “Naked” short sales are sales of shares in an amount in excess of the number of shares represented by the underwriters’ over-allotment option. |
| • | Covering transactions involve purchases of shares either pursuant to the over-allotment option or in the open market after the distribution has been completed in order to cover short positions. |
| • | To close a naked short position, the underwriters must purchase shares in the open market after the distribution has been completed. A naked short position is more likely to be created if the underwriters are concerned that there may be downward pressure on the price of the shares in the open market after pricing that could adversely affect investors who purchase in the offering. |
| • | To close a covered short position, the underwriters must purchase shares in the open market after the distribution has been completed or must exercise the over-allotment option. In determining the source of shares to close the covered short position, the underwriters will consider, among other things, the price of shares available for purchase in the open market as compared to the price at which they may purchase shares through the over-allotment option. |
| • | Stabilizing transactions involve bids to purchase shares so long as the stabilizing bids do not exceed a specified maximum. |
Purchases to cover short positions and stabilizing purchases, as well as other purchases by the underwriters for their own accounts, may have the effect of preventing or retarding a decline in the market price of the shares. They may also cause the price of the shares to be higher than the price that would otherwise exist in the open market in the absence of these transactions. The underwriters may conduct these transactions on the New York Stock Exchange, in the over-the-counter market or otherwise. If the underwriters commence any of these transactions, they may discontinue them at any time.
The underwriters are full service financial institutions engaged in various activities, which may include securities trading, commercial and investment banking, financial advisory, investment management, principal investment, hedging, financing and brokerage activities. The underwriters and their respective affiliates have in
135
Table of Contents
the past performed commercial banking, investment banking and advisory services for us from time to time for which they have received customary fees and reimbursement of expenses. The underwriters may, from time to time, engage in transactions with and perform services for us in the ordinary course of their business for which they may receive customary fees and reimbursement of expenses. In the ordinary course of their various business activities, the underwriters and their respective affiliates may make or hold a broad array of investments and actively trade debt and equity securities (or related derivative securities) and financial instruments (which may include bank loans and/or credit default swaps) for their own account and for the accounts of their customers and may at any time hold long and short positions in such securities and instruments. Such investments and securities activities may involve securities and/or instruments of ours or our affiliates. In addition, affiliates of some of the underwriters are lenders, and in some cases agents or managers for the lenders, under our credit facility. Certain of the underwriters or their affiliates that have a lending relationship with us routinely hedge their credit exposure to us consistent with their customary risk management policies. A typical such hedging strategy would include these underwriters or their affiliates hedging such exposure by entering into transactions which consist of either the purchase of credit default swaps or the creation of short positions in our securities. The underwriters and their affiliates may also make investment recommendations and/or publish or express independent research views in respect of such securities or financial instruments and may hold, or recommend to clients that they acquire, long and/or short positions in such securities and instruments.
We have agreed to indemnify the underwriters against certain liabilities, including liabilities under the Securities Act, or to contribute to payments the underwriters may be required to make because of any of those liabilities.
Conflicts of Interest
Because Citigroup Global Markets Inc. is under common control with us and the selling stockholder, and because the selling stockholder, an affiliate of Citigroup Global Markets Inc., will receive at least 5% of the proceeds of this offering, a conflict of interest under Financial Industry Regulatory Authority, Inc., or FINRA, Rule 5121 is deemed to exist. Accordingly, this offering will be conducted in accordance with FINRA Rule 5121, which requires, among other things, that a “qualified independent underwriter” has participated in the preparation of, and has exercised the usual standards of due diligence with respect to, this prospectus and the registration statement of which this prospectus is a part. has agreed to act as a qualified independent underwriter for this offering and has participated in due diligence and the preparation of this prospectus and the registration statement of which this prospectus is a part. will not receive any additional fees for serving as a qualified independent underwriter in connection with this offering. We have agreed to indemnify against liabilities incurred in connection with acting as a qualified independent underwriter, including liabilities under the Securities Act. Additionally, pursuant to FINRA Rule 5121, Citigroup Global Markets Inc. will not confirm sales to any account over which it exercises discretionary authority without the specific prior written approval of the account holder.
Notice to Prospective Investors in the European Economic Area
In relation to each Member State of the European Economic Area which has implemented the Prospectus Directive, or a Relevant Member State, an offer to the public of any shares which are the subject of the offering contemplated by this prospectus, or the Shares may not be made in that Relevant Member State, except that an offer to the public in that Relevant Member State of any Shares may be made at any time under the following exemptions under the Prospectus Directive, if they have been implemented in that Relevant Member State:
(a) to any legal entity which is a qualified investor as defined in the Prospectus Directive;
(b) to fewer than 100 or, if the Relevant Member State has implemented the relevant provision of the 2010 PD Amending Directive, 150, natural or legal persons (other than qualified investors as defined in the Prospectus Directive), as permitted under the Prospectus Directive, subject to obtaining the prior consent of Citigroup Global Markets Inc. for any such offer; or
136
Table of Contents
(c) in any other circumstances falling within Article 3(2) of the Prospectus Directive, provided that no such offer of Shares shall result in a requirement for the publication by us or any underwriter of a prospectus pursuant to Article 3 of the Prospectus Directive.
For the purposes of this provision, the expression an “offer to the public” in relation to any Shares in any Relevant Member State means the communication in any form and by any means of sufficient information on the terms of the offer and any Shares to be offered so as to enable an investor to decide to purchase any Shares, as the same may be varied in that Member State by any measure implementing the Prospectus Directive in that Member State, the expression “Prospectus Directive” means Directive 2003/71/EC (and amendments thereto, including the 2010 PD Amending Directive, to the extent implemented in the Relevant Member State), and includes any relevant implementing measure in the Relevant Member State, and the expression “2010 PD Amending Directive” means Directive 2010/73/EU.
Notice to Prospective Investors in the United Kingdom
Each underwriter has represented and agreed that:
(a) it has only communicated or caused to be communicated and will only communicate or cause to be communicated an invitation or inducement to engage in investment activity (within the meaning of Section 21 of the FSMA) received by it in connection with the issue or sale of the Shares in circumstances in which Section 21(1) of the FSMA does not apply to us; and
(b) it has complied and will comply with all applicable provisions of the FSMA with respect to anything done by it in relation to the Shares in, from or otherwise involving the United Kingdom.
Notice to Prospective Investors in France
Neither this prospectus nor any other offering material relating to the shares described in this prospectus has been submitted to the clearance procedures of the Autorité des Marchés Financiers or of the competent authority of another member state of the European Economic Area and notified to the Autorité des Marchés Financiers. The shares have not been offered or sold and will not be offered or sold, directly or indirectly, to the public in France. Neither this prospectus nor any other offering material relating to the shares has been or will be:
| • | released, issued, distributed or caused to be released, issued or distributed to the public in France; or |
| • | used in connection with any offer for subscription or sale of the shares to the public in France. |
Such offers, sales and distributions will be made in France only:
| • | to qualified investors (investisseurs qualifiés) and/or to a restricted circle of investors (cercle restreint d’investisseurs), in each case investing for their own account, all as defined in, and in accordance with articles L.411-2, D.411-1, D.411-2, D.734-1, D.744-1, D.754-1 and D.764-1 of the French Code monétaire et financier; |
| • | to investment services providers authorized to engage in portfolio management on behalf of third parties; or |
| • | in a transaction that, in accordance with article L.411-2-II-1°-or-2°-or 3° of the French Code monétaire et financier and article 211-2 of the General Regulations (Règlement Général) of the Autorité des Marchés Financiers, does not constitute a public offer (appel public à l’épargne). |
The shares may be resold directly or indirectly, only in compliance with articles L.411-1, L.411-2, L.412-1 and L.621-8 through L.621-8-3 of the French Code monétaire et financier.
137
Table of Contents
Notice to Prospective Investors in Australia
No prospectus or other disclosure document (as defined in the Corporations Act 2001 (Cth) of Australia (“Corporations Act”)) in relation to the common stock has been or will be lodged with the Australian Securities & Investments Commission (“ASIC”). This document has not been lodged with ASIC and is only directed to certain categories of exempt persons. Accordingly, if you receive this document in Australia:
(a) you confirm and warrant that you are either:
| (i) | a “sophisticated investor” under section 708(8)(a) or (b) of the Corporations Act; |
| (ii) | a “sophisticated investor” under section 708(8)(c) or (d) of the Corporations Act and that you have provided an accountant’s certificate to us which complies with the requirements of section 708(8)(c)(i) or (ii) of the Corporations Act and related regulations before the offer has been made; |
| (iii) | a person associated with the company under section 708(12) of the Corporations Act; or |
| (iv) | a “professional investor” within the meaning of section 708(11)(a) or (b) of the Corporations Act, and to the extent that you are unable to confirm or warrant that you are an exempt sophisticated investor, associated person or professional investor under the Corporations Act any offer made to you under this document is void and incapable of acceptance; and |
(b) you warrant and agree that you will not offer any of the common stock for resale in Australia within 12 months of that common stock being issued unless any such resale offer is exempt from the requirement to issue a disclosure document under section 708 of the Corporations Act.
Notice to Prospective Investors in Hong Kong
The shares may not be offered or sold in Hong Kong by means of any document other than (i) in circumstances which do not constitute an offer to the public within the meaning of the Companies Ordinance (Cap. 32, Laws of Hong Kong), or (ii) to “professional investors” within the meaning of the Securities and Futures Ordinance (Cap. 571, Laws of Hong Kong) and any rules made thereunder, or (iii) in other circumstances which do not result in the document being a “prospectus” within the meaning of the Companies Ordinance (Cap. 32, Laws of Hong Kong) and no advertisement, invitation or document relating to the shares may be issued or may be in the possession of any person for the purpose of issue (in each case whether in Hong Kong or elsewhere), which is directed at, or the contents of which are likely to be accessed or read by, the public in Hong Kong (except if permitted to do so under the laws of Hong Kong) other than with respect to shares which are or are intended to be disposed of only to persons outside Hong Kong or only to “professional investors” within the meaning of the Securities and Futures Ordinance (Cap. 571, Laws of Hong Kong) and any rules made thereunder.
Notice to Prospective Investors in Japan
The shares offered in this prospectus have not been registered under the Securities and Exchange Law of Japan. The shares have not been offered or sold and will not be offered or sold, directly or indirectly, in Japan or to or for the account of any resident of Japan, except (i) pursuant to an exemption from the registration requirements of the Securities and Exchange Law and (ii) in compliance with any other applicable requirements of Japanese law.
Notice to Prospective Investors in Singapore
This prospectus has not been registered as a prospectus with the Monetary Authority of Singapore. Accordingly, this prospectus and any other document or material in connection with the offer or sale, or invitation for subscription or purchase, of the shares may not be circulated or distributed, nor may the shares be offered or sold, or be made the subject of an invitation for subscription or purchase, whether directly or indirectly, to persons in Singapore other than (i) to an institutional investor under Section 274 of the Securities
138
Table of Contents
and Futures Act, Chapter 289 of Singapore (the “SFA”), (ii) to a relevant person pursuant to Section 275(1), or any person pursuant to Section 275(1A), and in accordance with the conditions specified in Section 275 of the SFA or (iii) otherwise pursuant to, and in accordance with the conditions of, any other applicable provision of the SFA, in each case subject to compliance with conditions set forth in the SFA.
Where the shares are subscribed or purchased under Section 275 of the SFA by a relevant person which is:
| • | a corporation (which is not an accredited investor (as defined in Section 4A of the SFA)) the sole business of which is to hold investments and the entire share capital of which is owned by one or more individuals, each of whom is an accredited investor; or |
| • | a trust (where the trustee is not an accredited investor) whose sole purpose is to hold investments and each beneficiary of the trust is an individual who is an accredited investor, |
shares, debentures and units of shares and debentures of that corporation or the beneficiaries’ rights and interest (howsoever described) in that trust shall not be transferred within six months after that corporation or that trust has acquired the shares pursuant to an offer made under Section 275 of the SFA except:
| • | to an institutional investor (for corporations, under Section 274 of the SFA) or to a relevant person defined in Section 275(2) of the SFA, or to any person pursuant to an offer that is made on terms that such shares, debentures and units of shares and debentures of that corporation or such rights and interest in that trust are acquired at a consideration of not less than $200,000 (or its equivalent in a foreign currency) for each transaction, whether such amount is to be paid for in cash or by exchange of securities or other assets, and further for corporations, in accordance with the conditions specified in Section 275 of the SFA; |
| • | where no consideration is or will be given for the transfer; or |
| • | where the transfer is by operation of law. |
139
Table of Contents
Certain legal matters, including the legality of the issuance of the shares of common stock offered hereby, will be passed upon for us by Davis Polk & Wardwell LLP, New York, New York and by Cleary Gottlieb Steen & Hamilton LLP, New York, New York for the underwriters.
The combined financial statements as of December 31, 2013 and 2012 and for the each of the years in the three-year period ended December 31, 2013 included in this prospectus and the related registration statement have been included in reliance upon the report of KPMG LLP, an independent registered public accounting firm, appearing elsewhere herein given on the authority of said firm as experts in auditing and accounting.
MARKET AND INDUSTRY DATA AND FORECASTS
Certain market and industry data included in this prospectus has been obtained from third-party sources that we believe to be reliable. Market estimates are calculated by using independent industry publications, government publications and third-party forecasts in conjunction with our assumptions about our markets. We have not independently verified such third-party information. While we are not aware of any misstatements regarding any market, industry or similar data presented herein, such data involves risks and uncertainties and is subject to change based on various factors, including those discussed under the headings “Risk Factors” and “Special Note Regarding Forward-Looking Statements” in this prospectus.
WHERE YOU CAN FIND MORE INFORMATION
We have filed a registration statement, of which this prospectus is a part, on Form S-1 with the SEC relating to this offering. This prospectus does not contain all of the information in the registration statement and the exhibits included with the registration statement. References in this prospectus to any of our contracts, agreements or other documents are not necessarily complete, and you should refer to the exhibits attached to the registration statement for copies of the actual contracts, agreements or documents. You may read and copy the registration statement, the related exhibits and other material we file with the SEC at the SEC’s public reference room in Washington, D.C. at 100 F Street, Room 1580, N.E., Washington D.C. 20549. You can also request copies of those documents, upon payment of a duplicating fee, by writing to the SEC. Please call the SEC at 1-800-SEC-0330 for further information on the operation of the public reference rooms. The SEC also maintains an Internet site that contains reports, proxy and information statements and other information regarding issuers that file with the SEC. The website address is http://www.sec.gov. Upon the effectiveness of the registration statement, we will be subject to the informational requirements of the Exchange Act, and, in accordance, with the Exchange Act, will file reports, proxy and information statements and other information with the SEC. Such annual, quarterly and special reports, proxy and information statements and other information can be inspected and copied at the locations set forth above. We intend to make this information available on the investor relations section of our website, www.onemainfinancial.com. Information on or accessible through our website is not part of this prospectus.
140
Table of Contents
INDEX TO COMBINED FINANCIAL STATEMENTS
F-1
Table of Contents
Condensed Combined Statements of Income
Six Months Ended June 30, 2014 and 2013
(Unaudited)
(In millions of dollars)
| 2014 | 2013 | |||||||
| Revenue |
||||||||
| Finance interest and other charges |
$ | 985 | $ | 953 | ||||
| Investment revenue |
30 | 33 | ||||||
|
|
|
|
|
|||||
| Total interest revenue |
1,015 | 986 | ||||||
| Interest expense |
114 | 116 | ||||||
|
|
|
|
|
|||||
| Net interest revenue |
901 | 870 | ||||||
|
|
|
|
|
|||||
| Other non-interest revenue: |
||||||||
| Insurance premiums |
171 | 176 | ||||||
| Realized gain on sales and impairments of investments, net |
1 | 2 | ||||||
| Other revenue |
23 | 74 | ||||||
|
|
|
|
|
|||||
| Total non-interest revenue |
195 | 252 | ||||||
|
|
|
|
|
|||||
| Total revenue, net of interest expense |
1,096 | 1,122 | ||||||
|
|
|
|
|
|||||
| Provisions for credit losses and for benefits and claims |
||||||||
| Provision for credit losses |
230 | 275 | ||||||
| Policyholder benefits and claims |
64 | 77 | ||||||
|
|
|
|
|
|||||
| Total provisions for credit losses and for benefits and claims |
294 | 352 | ||||||
|
|
|
|
|
|||||
| Operating expenses |
||||||||
| Compensation and benefits |
146 | 150 | ||||||
| Technology and communications |
40 | 41 | ||||||
| Occupancy |
37 | 41 | ||||||
| Advertising and marketing |
34 | 29 | ||||||
| Other operating |
98 | 117 | ||||||
|
|
|
|
|
|||||
| Total operating expenses |
355 | 378 | ||||||
|
|
|
|
|
|||||
| Income before income taxes |
447 | 392 | ||||||
| Provision for income taxes |
160 | 144 | ||||||
|
|
|
|
|
|||||
| Net income |
$ | 287 | $ | 248 | ||||
|
|
|
|
|
|||||
Refer to the Notes to Condensed Combined Financial Statements
F-2
Table of Contents
Condensed Combined Statements of Comprehensive Income
Six Months Ended June 30, 2014 and 2013
(Unaudited)
(In millions of dollars)
| 2014 | 2013 | |||||||
| Net income |
$ | 287 | $ | 248 | ||||
| Other comprehensive income (loss): |
||||||||
| Net change in unrealized gains and losses on investment securities, net of taxes |
16 | (30 | ) | |||||
| Net change in foreign currency translation adjustment, net of taxes |
1 | (2 | ) | |||||
|
|
|
|
|
|||||
| Total other comprehensive income (loss) |
17 | (32 | ) | |||||
|
|
|
|
|
|||||
| Comprehensive income |
$ | 304 | $ | 216 | ||||
|
|
|
|
|
|||||
Refer to the Notes to Condensed Combined Financial Statements
F-3
Table of Contents
Condensed Combined Statements of Financial Position
(In millions of dollars)
| June 30, 2014 (Unaudited) |
December 31, 2013 |
|||||||
| Assets |
||||||||
| Cash and cash equivalents (including restricted cash of $90 and $188) |
$ | 291 | $ | 319 | ||||
| Investments (at fair value) |
1,504 | 1,431 | ||||||
| Consumer finance receivables: |
||||||||
| Loans and accrued interest receivable |
9,707 | 10,100 | ||||||
| Unearned revenue and deferred costs |
(1,467 | ) | (1,433 | ) | ||||
| Unearned premium and claim reserves |
(408 | ) | (416 | ) | ||||
| Allowance for loan losses |
(604 | ) | (676 | ) | ||||
|
|
|
|
|
|||||
| Net consumer finance receivables |
7,228 | 7,575 | ||||||
| Deferred tax assets, net |
260 | 256 | ||||||
| Intangible assets |
76 | 82 | ||||||
| Premises and equipment, net |
19 | 21 | ||||||
| Other assets |
155 | 152 | ||||||
|
|
|
|
|
|||||
| Total assets |
$ | 9,533 | $ | 9,836 | ||||
|
|
|
|
|
|||||
The following table summarizes the assets of the variable interest entities (“VIEs”), that are included in the Condensed Combined Statements of Financial Position above. The assets in the table below include only those assets that can be used to settle obligations of combined VIEs on the following page, and are in excess of those obligations. Additionally, the assets in the table below include third-party assets of combined VIEs only and exclude intercompany balances that eliminate in combination.
| June 30, 2014 (Unaudited) |
December 31, 2013 |
|||||||
| Assets |
||||||||
| Cash and cash equivalents |
$ | 90 | $ | — | ||||
| Net consumer finance receivables |
982 | — | ||||||
| Other assets |
8 | — | ||||||
|
|
|
|
|
|||||
| Total assets |
$ | 1,080 | $ | — | ||||
|
|
|
|
|
|||||
Refer to the Notes to Condensed Combined Financial Statements
F-4
Table of Contents
ONEMAIN HOLDCO
Condensed Combined Statements of Financial Position (continued)
(In millions of dollars)
| June 30, 2014 (Unaudited) |
December 31, 2013 |
|||||||
| Liabilities and Parent Equity |
||||||||
| Related party debt |
$ | 4,619 | $ | 5,894 | ||||
| Long-term debt |
760 | — | ||||||
| Insurance policy and claim reserves |
471 | 483 | ||||||
| Income taxes payable |
380 | 539 | ||||||
| Accounts payable, accrued expenses and other liabilities |
83 | 73 | ||||||
|
|
|
|
|
|||||
| Total liabilities |
6,313 | 6,989 | ||||||
| Contingencies (Note 17) |
||||||||
| Parent Equity: |
||||||||
| Net Parent investment |
3,159 | 2,803 | ||||||
| Accumulated other comprehensive income |
61 | 44 | ||||||
|
|
|
|
|
|||||
| Total Parent equity |
3,220 | 2,847 | ||||||
|
|
|
|
|
|||||
| Total liabilities and Parent equity |
$ | 9,533 | $ | 9,836 | ||||
|
|
|
|
|
|||||
The following table summarizes the liabilities of VIEs, that are included in the Condensed Combined Statements of Financial Position above. The liabilities in the table below include third-party liabilities of combined VIEs only, and exclude intercompany balances that eliminate in combination. The liabilities also exclude amounts where creditors or beneficial interest holders have recourse to the general credit of the Parent.
| June 30, 2014 (Unaudited) |
December 31, 2013 |
|||||||
| Liabilities |
||||||||
| Long-term debt |
$ | 760 | $ | — | ||||
| Accounts payable, accrued expenses and other liabilities |
13 | — | ||||||
|
|
|
|
|
|||||
| Total liabilities |
$ | 773 | $ | — | ||||
|
|
|
|
|
|||||
Refer to the Notes to Condensed Combined Financial Statements
F-5
Table of Contents
Condensed Combined Statements of Parent Equity
(Unaudited)
(In millions of dollars)
| Net Parent investment |
Accumulated other comprehensive income |
Total Parent equity |
||||||||||
| Balance, January 1, 2014 |
$ | 2,803 | $ | 44 | $ | 2,847 | ||||||
| Net income |
287 | — | 287 | |||||||||
| Transfers from Parent, net(1) |
69 | — | 69 | |||||||||
| Other comprehensive income, net of taxes |
— | 17 | 17 | |||||||||
|
|
|
|
|
|
|
|||||||
| Balance, June 30, 2014 |
$ | 3,159 | $ | 61 | $ | 3,220 | ||||||
|
|
|
|
|
|
|
|||||||
| Balance, January 1, 2013 |
$ | 2,444 | $ | 82 | $ | 2,526 | ||||||
| Net income |
248 | — | 248 | |||||||||
| Other comprehensive loss, net of taxes |
— | (32 | ) | (32 | ) | |||||||
|
|
|
|
|
|
|
|||||||
| Balance, June 30, 2013 |
$ | 2,692 | $ | 50 | $ | 2,742 | ||||||
|
|
|
|
|
|
|
|||||||
| (1) | Includes capital contribution from Parent of $490 million partially offset by a distribution of real estate loans of $421 million. |
Refer to the Notes to Condensed Combined Financial Statements
F-6
Table of Contents
Condensed Combined Statements of Cash Flows
Six Months Ended June 30, 2014 and 2013
(Unaudited)
(In millions of dollars)
| 2014 | 2013 | |||||||
| Cash flows from operating activities: |
||||||||
| Net income |
$ | 287 | $ | 248 | ||||
| Adjustments to reconcile income to net cash from operating activities: |
||||||||
| Realized gain on sales of investments |
(1 | ) | (3 | ) | ||||
| Impairments of investments |
— | 1 | ||||||
| Provision for credit losses |
230 | 275 | ||||||
| Depreciation and amortization |
18 | 20 | ||||||
| Deferred tax expense (benefit) |
3 | (9 | ) | |||||
| Net changes in other assets and liabilities |
(161 | ) | 156 | |||||
|
|
|
|
|
|||||
| Net cash provided by operating activities |
376 | 688 | ||||||
|
|
|
|
|
|||||
| Cash flows from investing activities: |
||||||||
| Net increase in short-term investments |
(35 | ) | (2 | ) | ||||
| Purchases of investments |
(116 | ) | (194 | ) | ||||
| Proceeds from sales of investments |
17 | 16 | ||||||
| Proceeds from maturities of investments |
86 | 118 | ||||||
| Originations of consumer finance receivables(1) |
(1,600 | ) | (1,431 | ) | ||||
| Repayments of consumer finance receivables |
1,271 | 1,267 | ||||||
| Purchase of premises and equipment |
(2 | ) | (2 | ) | ||||
| Decrease in restricted cash |
98 | — | ||||||
|
|
|
|
|
|||||
| Net cash used in investing activities |
(281 | ) | (228 | ) | ||||
|
|
|
|
|
|||||
| Cash flows from financing activities: |
||||||||
| Proceeds from issuance of long-term debt |
760 | — | ||||||
| Net decrease in related party debt |
(1,275 | ) | (453 | ) | ||||
| Contribution from Parent |
475 | — | ||||||
| Net increase in net Parent investment |
15 | — | ||||||
|
|
|
|
|
|||||
| Net cash used in financing activities |
(25 | ) | (453 | ) | ||||
|
|
|
|
|
|||||
| Increase in cash and cash equivalents |
70 | 7 | ||||||
| Cash and cash equivalents, beginning of period (excluding restricted cash of $188 and $206) |
131 | 163 | ||||||
|
|
|
|
|
|||||
| Cash and cash equivalents, end of period (excluding restricted cash of $90 and $206) |
$ | 201 | $ | 170 | ||||
|
|
|
|
|
|||||
| Supplemental disclosure of cash flow information: |
||||||||
| Cash paid during the period for: |
||||||||
| Interest |
$ | 109 | $ | 116 | ||||
| Income taxes |
318 | 29 | ||||||
| Supplemental schedule of noncash investing and financing activities: |
||||||||
| Transfers to Parent |
$ | (421 | ) | $ | — | |||
| (1) | Originations of consumer finance receivables are presented net of payoffs on loans that were refinanced into a new loan. |
Refer to the Notes to Condensed Combined Financial Statements.
F-7
Table of Contents
NOTES TO CONDENSED COMBINED FINANCIAL STATEMENTS (UNAUDITED)
(1) Organization and Business
The accompanying unaudited Condensed Combined Financial Statements primarily include the accounts of OneMain Financial Holdings, Inc. (“OMFH”), a holding company, OneMain Financial, Inc. (DE) (“OMFI”), American Health and Life Insurance Company (“AHL”) and Triton Insurance Company (“Triton”), (collectively OneMain Holdco or “OMH”), each a wholly owned subsidiary of CitiFinancial Credit Company (“CCC” or “Parent”), a wholly owned subsidiary of Associates First Capital Corporation (“Associates”), an indirect subsidiary of Citigroup Inc. (“Citigroup”). All references in these Notes to Condensed Combined Financial Statements of “OMH,” “the Company,” or similar terms refer to OneMain Holdco and its combined entities.
The Company conducts its operations through two business segments—Lending and Insurance. In accordance with Financial Accounting Standards Board (“FASB”) Accounting Standards Codification (“ASC”) (Topic 280): Segment Reporting, operating segments represent components of an entity where discrete financial information is available and for which the operating results are regularly reviewed by the chief operating decision maker to determine resources to be allocated to a segment and assess its performance.
The Company’s Lending segment originates and services personal loans to consumers through a community branch-based network throughout the United States. Prior to January 6, 2014, the Company serviced a portfolio of owned real estate loans and a portfolio of real estate loans owned by an affiliate. Refer to Note 14 for further information on the transfer of real estate loans and related servicing in 2014.
The Company’s Insurance segment underwrites policies to all of its customers and underwrites and reinsures policies covering customers of Citigroup affiliates. In addition, the Company is a full service administrator of debt protection products for customers of Citigroup affiliates. Refer to Note 14 for further information on the services provided to Citigroup affiliates.
Refer to Note 3 for additional information regarding the Company’s business segments.
(2) Basis of Presentation
The accompanying unaudited Condensed Combined Financial Statements as of June 30, 2014 and for the six month periods ended June 30, 2014 and 2013 include the combined accounts of OMH. In the opinion of management, all adjustments, consisting of normal recurring adjustments, necessary for a fair presentation have been reflected. The accompanying unaudited Condensed Combined Financial Statements should be read in conjunction with the Combined Financial Statements and related notes as of December 31, 2013 and 2012 and for each of the years in the three-year period ended December 31, 2013.
These unaudited Condensed Combined Financial Statements have been prepared in accordance with generally accepted accounting principles in the United States of America (“GAAP”). The December 31, 2013, Condensed Combined Statement of Financial Position data was derived from the Company’s audited combined financial statements. Certain financial information that is normally included in annual financial statements but is not required for interim reporting purposes, has been condensed or omitted. All significant intercompany balances and transactions between the legal entities that comprise OMH have been eliminated.
Management must make estimates and assumptions that affect the Condensed Combined Financial Statements and the related footnote disclosures. While management uses its best judgment in making estimates, actual amounts or results could differ from those estimates. Current market conditions increase the risk and complexity of the judgments in these estimates.
The Condensed Combined Financial Statements include expense allocations to and from affiliates for certain costs of support functions provided on a centralized basis within Citigroup. Such allocations primarily
F-8
Table of Contents
relate to employee benefits, technology, operations and global functions such as finance, human resources, legal and compliance. Management believes the basis on which the expenses have been allocated to be a reasonable reflection of the utilization of services provided to or the benefits received by OMH during the periods presented. The allocations may not, however, reflect the expenses OMH would have incurred as a stand-alone company for the periods presented. Actual costs that may have been incurred if the Company had been a stand-alone company would depend on multiple factors, including organizational structure, which functions were outsourced or performed by employees and strategic decisions in various areas such as information technology and infrastructure. Refer to Note 14 for further discussion of these expense allocations.
The Condensed Combined Financial Statements included herein may not be indicative of the Company’s financial position, results of operations, and cash flows in the future, and may not be indicative of the financial position, results of operations and cash flows had the Company been a separate, stand-alone entity during the periods presented.
The Condensed Combined Financial Statements reflect the combination of various legal entities that do not necessarily have a legal ownership relationship. As such, the Parent’s equity investment in the Company is presented as Net Parent investment in lieu of common stock, paid in capital and retained earnings.
While the Company is included in the consolidated U.S. federal and certain state income tax returns of Citigroup, the income tax provision in the Condensed Combined Statements of Income has been calculated as if the Company filed a separate tax return.
The Company’s accounting policies are fundamental to understanding management’s discussion and analysis of the results of operations and financial condition. The Company has identified six policies as being significant because they require management to make subjective and/or complex judgments about matters that are inherently uncertain. These policies relate to valuations of financial instruments, allowance for loan losses, securitizations, insurance policy and claim reserves, income taxes and litigation accruals. These significant accounting policies are further described under Note 2 “Summary of Significant Accounting Policies” to the Combined Financial Statements and related notes as of December 31, 2013 and 2012 and for each of the years in the three-year period ended December 31, 2013.
Accounting Changes
Discontinued Operations and Significant Disposals
In April 2014, the FASB issued Accounting Standards Update (“ASU”) No. 2014-08, Presentation of Financial Statements (Topic 205) and Property, Plant, and Equipment (Topic 360), Reporting Discontinued Operations and Disclosures of Disposals of Components of an Entity (ASU 2014-08). ASU 2014-08 changes the criteria for reporting discontinued operations while enhancing disclosures. Under the ASU, only disposals representing a strategic shift having a major effect on an entity’s operations and financial results, such as a disposal of a major geographic area, a major line of business or a major equity method investment may be presented as discontinued operations. Additionally, the ASU requires expanded disclosures about discontinued operations that will provide more information about the assets, liabilities, income, and expenses of discontinued operations. The Company elected to early-adopt the ASU on a prospective basis for all disposals (or classifications as held-for-sale) of components of an entity that occurred on or after April 1, 2014. As a result of the adoption of the ASU, fewer disposals will now qualify for reporting as discontinued operations; however, disclosure of the pre-tax income attributable to a disposal of a significant part of an organization that does not qualify for discontinued operations reporting is required.
F-9
Table of Contents
Presentation of an Unrecognized Tax Benefit When a Net Operating Loss Carryforward, a Similar Tax Loss, or a Tax Credit Carryforward Exists
In July 2013, the FASB issued ASU No. 2013-11, Income Taxes (Topic 740): Presentation of an Unrecognized Tax Benefit When a Net Operating Loss Carryforward, a Similar Tax Loss, or a Tax Credit Carryforward Exists (a consensus of the FASB Emerging Issues Task Force). As a result of applying this ASU, an unrecognized tax benefit should be presented as a reduction of a deferred tax asset for a net operating loss (“NOL”) or other tax credit carryforward when settlement in this manner is available under the tax law. The assessment of whether settlement is available under the tax law would be based on facts and circumstances as of the balance sheet reporting date and would not consider future events (e.g., upcoming expiration of related NOL carryforwards). This classification does not affect an entity’s analysis of the realization of its deferred tax assets. Gross presentation in the rollforward of unrecognized tax positions in the notes to the combined financial statements would still be required.
This ASU was effective for the Company on January 1, 2014 and was applied on a prospective basis to all unrecognized tax benefits that existed at the effective date. There was no effect of adopting this ASU for OMH.
Future Application of Accounting Standards
Revenue Recognition
On May 28, 2014, the FASB issued ASU No. 2014-09, Revenue from Contracts with Customers, which requires an entity to recognize the amount of revenue to which it expects to be entitled for the transfer of promised goods or services to customers. The ASU will replace most existing revenue recognition guidance in GAAP when it becomes effective. The new standard is effective for the Company on January 1, 2017. Early application is not permitted. The standard permits the use of either the retrospective or cumulative effect transition method. The Company is evaluating the effect that ASU 2014-09 will have on its Condensed Combined Financial Statements and related disclosures. The Company has not yet selected a transition method nor has the Company determined the effect of the standard on its ongoing financial reporting.
Accounting for Financial Instruments—Credit Losses
In December 2012, the FASB issued a proposed ASU, Financial Instruments—Credit Losses. This proposed ASU, or exposure draft, was issued for public comment in order to allow stakeholders the opportunity to review the proposal and provide comments to the FASB and does not constitute accounting guidance until a final ASU is issued. The exposure draft contains proposed guidance developed by the FASB with the goal of improving financial reporting about expected credit losses on loans, securities and other financial assets held by banks, financial institutions, and other public and private organizations. The exposure draft proposes a new accounting model intended to require earlier recognition of credit losses, while also providing additional transparency about credit risk. The FASB’s proposed model would utilize a single “expected credit loss” measurement objective for the recognition of credit losses for loans and other receivables at the time the financial asset is originated or acquired and for securities where fair value is less than cost, replacing the multiple existing impairment models in GAAP, which generally require that a loss be “incurred” before it is recognized.
The FASB’s proposed model represents a significant departure from existing GAAP, and may result in material changes to the Company’s accounting for financial instruments. The effect of the FASB’s final ASU on the Company’s Condensed Combined Financial Statements will be assessed when it is issued. The exposure draft does not contain a proposed effective date; this would be included in the final ASU, when issued.
Other Potential Amendments to Current Accounting Standards
The FASB and International Accounting Standards Board (“IASB”), either jointly or separately, are currently working on several major projects, including amendments to existing accounting standards governing
F-10
Table of Contents
financial instruments discussed above. The FASB is working on a joint project with the IASB that would require substantially all leases to be capitalized on the balance sheet. Additionally, the FASB has issued a proposal on principal-agent considerations that would change the way the Company needs to evaluate whether to consolidate VIEs and non-VIE partnerships. The principal-agent consolidation proposal would require all VIEs, including those that are investment companies, to be evaluated for consolidation under the same requirements. The FASB is deliberating a proposed ASU relating to the accounting for insurance contracts. The scope of the project has been limited to insurance entities and will focus on making targeted improvements to existing GAAP. The initiatives referred to above may significantly affect the Company’s Condensed Combined Financial Statements.
Upon completion of the standards, the Company will need to re-evaluate its accounting and disclosures. However, due to ongoing deliberations of the standard setters, the Company is currently unable to determine the effect of future amendments or proposals.
(3) Business Segments
The Company evaluates the results of its operations through two reportable segments: Lending and Insurance. The Lending segment primarily originates, services and, from time to time, securitizes secured and unsecured personal loans. The Lending segment also included real estate loans in 2013. Prior to January 6, 2014, the Company serviced real estate loans to nonprime consumers through the Company’s community-based branch network. The business ceased originating real estate loans as of June 1, 2012 and transferred its remaining real estate loans to an affiliate on January 1, 2014.
The Insurance segment writes and reinsures credit life, credit disability, credit involuntary unemployment (“IUI”), collateral protection, term life, accidental death, and hospital indemnity policies.
The chief operating decision maker evaluates the operating results and performance of the Lending and Insurance segments through Income before income taxes.
The following table summarizes certain information by segment:
| Net interest revenue |
Operating expenses |
Income before income taxes |
Total assets | |||||||||||||||||||||||||||||
| Six Months Ended June 30, | June
30, 2014 |
December
31, 2013 |
||||||||||||||||||||||||||||||
| 2014 | 2013 | 2014 | 2013 | 2014 | 2013 | |||||||||||||||||||||||||||
| (in millions of dollars) |
||||||||||||||||||||||||||||||||
| Lending |
$ | 871 | $ | 837 | $ | 315 | $ | 338 | $ | 363 | $ | 312 | $ | 8,284 | $ | 8,676 | ||||||||||||||||
| Insurance |
30 | 33 | 60 | 60 | 84 | 80 | 1,657 | 1,576 | ||||||||||||||||||||||||
| Intersegment eliminations |
— | — | (20 | )(1) | (20 | )(1) | — | — | (408 | )(2) | (416 | )(2) | ||||||||||||||||||||
|
|
|
|
|
|
|
|
|
|
|
|
|
|
|
|
|
|||||||||||||||||
| Total |
$ | 901 | $ | 870 | $ | 355 | $ | 378 | $ | 447 | $ | 392 | $ | 9,533 | $ | 9,836 | ||||||||||||||||
|
|
|
|
|
|
|
|
|
|
|
|
|
|
|
|
|
|||||||||||||||||
| (1) | Represents commissions charged to the Insurance segment by the Lending segment for insurance products sold through the Lending branch network, which are eliminated in combination. |
| (2) | Represents unearned premium and claim reserves related to OMH customers that is managed as a liability for managed segment reporting purposes. |
Most of the revenue generated by the Company’s business segments is derived from U.S. clients. Neither business segment earned revenue from a single external customer that was 10% or more of total combined revenue.
F-11
Table of Contents
(4) Interest Revenue and Expense
The following table summarizes interest revenue, interest expense and provision for credit losses:
| Six Months Ended June 30, | ||||||||
| 2014 | 2013 | |||||||
| (in millions of dollars) |
||||||||
| Interest revenue: |
||||||||
| Finance interest and other charges |
$ | 985 | $ | 953 | ||||
| Investment revenue |
30 | 33 | ||||||
|
|
|
|
|
|||||
| Total interest revenue |
1,015 | 986 | ||||||
| Interest expense: |
||||||||
| Related party debt |
109 | 116 | ||||||
| Long term debt |
5 | — | ||||||
|
|
|
|
|
|||||
| Total interest expense |
114 | 116 | ||||||
|
|
|
|
|
|||||
| Net interest revenue |
901 | 870 | ||||||
| Provision for credit losses |
230 | 275 | ||||||
|
|
|
|
|
|||||
| Net interest revenue after provision for credit losses |
$ | 671 | $ | 595 | ||||
|
|
|
|
|
|||||
(5) Investments
The following tables summarize amortized cost, gross unrealized gains and losses and estimated fair value of investments classified as available for sale (“AFS”):
| June 30, 2014 | ||||||||||||||||
| Amortized cost |
Gross unrealized | Fair value |
||||||||||||||
| Gains | Losses | |||||||||||||||
| (in millions of dollars) |
||||||||||||||||
| Fixed maturity securities: |
||||||||||||||||
| Mortgage-backed securities: |
||||||||||||||||
| U.S. government agency guaranteed |
$ | 67 | $ | 5 | $ | — | $ | 72 | ||||||||
| Prime |
5 | — | — | 5 | ||||||||||||
| Commercial |
68 | 3 | — | 71 | ||||||||||||
|
|
|
|
|
|
|
|
|
|||||||||
| Total mortgage-backed securities |
140 | 8 | — | 148 | ||||||||||||
| U.S. Treasury and federal agency |
29 | — | — | 29 | ||||||||||||
| State and municipal |
40 | 1 | — | 41 | ||||||||||||
| Foreign government |
154 | 8 | — | 162 | ||||||||||||
| Corporate securities |
905 | 70 | 4 | 971 | ||||||||||||
| Other debt securities |
54 | — | 1 | 53 | ||||||||||||
|
|
|
|
|
|
|
|
|
|||||||||
| Total fixed maturity securities |
1,322 | 87 | 5 | 1,404 | ||||||||||||
| Equity securities |
41 | 10 | — | 51 | ||||||||||||
| Short-term and other securities |
49 | — | — | 49 | ||||||||||||
|
|
|
|
|
|
|
|
|
|||||||||
| Total investments |
$ | 1,412 | $ | 97 | $ | 5 | $ | 1,504 | ||||||||
|
|
|
|
|
|
|
|
|
|||||||||
F-12
Table of Contents
| December 31, 2013 | ||||||||||||||||
| Amortized cost |
Gross unrealized | Fair value |
||||||||||||||
| Gains | Losses | |||||||||||||||
| (in millions of dollars) |
||||||||||||||||
| Fixed maturity securities: |
||||||||||||||||
| Mortgage-backed securities: |
||||||||||||||||
| U.S. government agency guaranteed |
$ | 69 | $ | 5 | $ | — | $ | 74 | ||||||||
| Prime |
7 | — | — | 7 | ||||||||||||
| Commercial |
72 | 3 | — | 75 | ||||||||||||
|
|
|
|
|
|
|
|
|
|||||||||
| Total mortgage-backed securities |
148 | 8 | — | 156 | ||||||||||||
| U.S. Treasury and federal agency |
28 | — | 1 | 27 | ||||||||||||
| State and municipal |
33 | 1 | 1 | 33 | ||||||||||||
| Foreign government |
137 | 7 | 1 | 143 | ||||||||||||
| Corporate securities |
914 | 59 | 13 | 960 | ||||||||||||
| Other debt securities |
54 | — | 1 | 53 | ||||||||||||
|
|
|
|
|
|
|
|
|
|||||||||
| Total fixed maturity securities |
1,314 | 75 | 17 | 1,372 | ||||||||||||
| Equity securities |
36 | 9 | — | 45 | ||||||||||||
| Short-term and other securities |
14 | — | — | 14 | ||||||||||||
|
|
|
|
|
|
|
|
|
|||||||||
| Total investments |
$ | 1,364 | $ | 84 | $ | 17 | $ | 1,431 | ||||||||
|
|
|
|
|
|
|
|
|
|||||||||
Management reviews the investment portfolio on a periodic basis to determine the cause of declines in the fair value of each security in an unrealized loss position. Evaluations of the causes of the unrealized losses are performed to determine whether the impairment is temporary or other-than-temporary (“OTTI”) in nature. Each investment security has been assessed for indications of credit impairment.
As a result of this analysis the Company recorded no pre-tax losses for OTTI in the six months ended June 30, 2014. The Company recorded pre-tax losses for OTTI related to equity securities of $1 million in the six months ended June 30, 2013. These pre-tax losses for OTTI are classified in Realized gain on sales and impairments of investments, net on the Condensed Combined Statements of Income.
F-13
Table of Contents
The following table summarizes amortized cost and fair value by contractual maturities:
| June 30, 2014 | December 31, 2013 | |||||||||||||||
| Amortized cost |
Fair value |
Amortized cost |
Fair value |
|||||||||||||
| (in millions of dollars) |
||||||||||||||||
| Mortgage-backed securities: |
||||||||||||||||
| Due within 1 year |
$ | — | $ | — | $ | — | $ | — | ||||||||
| After 1 but within 5 years |
2 | 2 | 3 | 3 | ||||||||||||
| After 5 but within 10 years |
5 | 5 | 3 | 3 | ||||||||||||
| After 10 years |
133 | 141 | 142 | 150 | ||||||||||||
|
|
|
|
|
|
|
|
|
|||||||||
| 140 | 148 | 148 | 156 | |||||||||||||
|
|
|
|
|
|
|
|
|
|||||||||
| U.S. Treasury and federal agency: |
||||||||||||||||
| Due within 1 year |
6 | 6 | 6 | 6 | ||||||||||||
| After 1 but within 5 years |
12 | 12 | 11 | 11 | ||||||||||||
| After 5 but within 10 years |
11 | 11 | 11 | 10 | ||||||||||||
| After 10 years |
— | — | — | — | ||||||||||||
|
|
|
|
|
|
|
|
|
|||||||||
| 29 | 29 | 28 | 27 | |||||||||||||
|
|
|
|
|
|
|
|
|
|||||||||
| State and municipal: |
||||||||||||||||
| Due within 1 year |
— | — | 1 | 1 | ||||||||||||
| After 1 but within 5 years |
10 | 10 | 8 | 9 | ||||||||||||
| After 5 but within 10 years |
26 | 26 | 18 | 18 | ||||||||||||
| After 10 years |
4 | 5 | 6 | 5 | ||||||||||||
|
|
|
|
|
|
|
|
|
|||||||||
| 40 | 41 | 33 | 33 | |||||||||||||
|
|
|
|
|
|
|
|
|
|||||||||
| Foreign government: |
||||||||||||||||
| Due within 1 year |
16 | 16 | 10 | 10 | ||||||||||||
| After 1 but within 5 years |
83 | 88 | 72 | 76 | ||||||||||||
| After 5 but within 10 years |
55 | 58 | 55 | 57 | ||||||||||||
| After 10 years |
— | — | — | — | ||||||||||||
|
|
|
|
|
|
|
|
|
|||||||||
| 154 | 162 | 137 | 143 | |||||||||||||
|
|
|
|
|
|
|
|
|
|||||||||
| All other: |
||||||||||||||||
| Due within 1 year |
66 | 67 | 62 | 63 | ||||||||||||
| After 1 but within 5 years |
420 | 459 | 399 | 426 | ||||||||||||
| After 5 but within 10 years |
379 | 401 | 419 | 436 | ||||||||||||
| After 10 years |
94 | 97 | 88 | 88 | ||||||||||||
|
|
|
|
|
|
|
|
|
|||||||||
| 959 | 1,024 | 968 | 1,013 | |||||||||||||
|
|
|
|
|
|
|
|
|
|||||||||
| Total fixed maturity securities |
$ | 1,322 | $ | 1,404 | $ | 1,314 | $ | 1,372 | ||||||||
|
|
|
|
|
|
|
|
|
|||||||||
Actual maturities will differ from contractual maturities because borrowers may have the right to call or prepay obligations with or without call or prepayment penalties.
F-14
Table of Contents
The following tables summarize the fair value of investment securities that have been in an unrealized loss position for less than 12 months or for 12 months or longer:
| June 30, 2014 | ||||||||||||||||||||||||
| Less than
twelve months |
Twelve months or longer |
Total | ||||||||||||||||||||||
| Fair value |
Gross unrealized losses |
Fair value |
Gross unrealized losses |
Fair value |
Gross unrealized losses |
|||||||||||||||||||
| (in millions of dollars) |
||||||||||||||||||||||||
| Mortgage-backed securities |
$ | 5 | $ | — | $ | 14 | $ | — | $ | 19 | $ | — | ||||||||||||
| U.S. Treasury and federal agency |
— | — | 8 | — | 8 | — | ||||||||||||||||||
| State and municipal |
2 | — | 9 | — | 11 | — | ||||||||||||||||||
| Foreign government |
7 | — | 7 | — | 14 | — | ||||||||||||||||||
| Corporate securities |
39 | 1 | 86 | 3 | 125 | 4 | ||||||||||||||||||
| Other debt securities |
16 | — | 9 | 1 | 25 | 1 | ||||||||||||||||||
|
|
|
|
|
|
|
|
|
|
|
|
|
|||||||||||||
| Total fixed maturity securities |
$ | 69 | $ | 1 | $ | 133 | $ | 4 | $ | 202 | $ | 5 | ||||||||||||
|
|
|
|
|
|
|
|
|
|
|
|
|
|||||||||||||
| December 31, 2013 | ||||||||||||||||||||||||
| Less than
twelve months |
Twelve months or longer |
Total | ||||||||||||||||||||||
| Fair value |
Gross unrealized losses |
Fair value |
Gross unrealized losses |
Fair value |
Gross unrealized losses |
|||||||||||||||||||
| (in millions of dollars) |
||||||||||||||||||||||||
| Mortgage-backed securities |
$ | 28 | $ | — | $ | 3 | $ | — | $ | 31 | $ | — | ||||||||||||
| U.S. Treasury and federal agency |
12 | 1 | — | — | 12 | 1 | ||||||||||||||||||
| State and municipal |
20 | 1 | — | — | 20 | 1 | ||||||||||||||||||
| Foreign government |
26 | 1 | — | — | 26 | 1 | ||||||||||||||||||
| Corporate securities |
262 | 11 | 16 | 2 | 278 | 13 | ||||||||||||||||||
| Other debt securities |
17 | — | 6 | 1 | 23 | 1 | ||||||||||||||||||
|
|
|
|
|
|
|
|
|
|
|
|
|
|||||||||||||
| Total fixed maturity securities |
$ | 365 | $ | 14 | $ | 25 | $ | 3 | $ | 390 | $ | 17 | ||||||||||||
|
|
|
|
|
|
|
|
|
|
|
|
|
|||||||||||||
Investment securities with unrealized losses for which an OTTI has not been recognized as of June 30, 2014 are principally composed of corporate securities and other debt securities (including asset-backed securities). There are 325 investment securities in a gross unrealized loss position, of which a fair value of $69 million has been impaired for less than 12 months and $133 million has been impaired for greater than 12 months as of June 30, 2014. The unrealized losses are due to increases in interest rates primarily as a result of widening of interest rate spreads reflecting an increase in risk premiums. The evidence considered by management in reaching the conclusion that the unrealized losses are not other-than-temporary include analyst views, financial performance of the issuers and underlying collateral, cash flow projections, ratings and rating downgrades, and available credit enhancements. Based on the analysis of the evidence, management has determined it is probable that the Company will collect all amounts due according to the contractual terms of the investment securities. The Company has no intent to sell the investment securities and believes it will not likely be required to sell the investment securities before recovery of the amortized cost basis.
F-15
Table of Contents
The following table summarizes sales proceeds and Realized gain on sales and impairments of investments, net on the Condensed Combined Statements of Income:
| Six Months Ended June 30, | ||||||||
| 2014 | 2013 | |||||||
| (in millions of dollars) | ||||||||
| Sales proceeds |
$ | 17 | $ | 16 | ||||
| Gross pre-tax gains (losses) on investment securities: |
||||||||
| Gains |
2 | 7 | ||||||
| Losses |
(1 | ) | (4 | ) | ||||
|
|
|
|
|
|||||
| Net pre-tax gains on investment securities |
1 | 3 | ||||||
| OTTI |
— | (1 | ) | |||||
|
|
|
|
|
|||||
| Realized gain on sales and impairments of investments, net |
$ | 1 | $ | 2 | ||||
|
|
|
|
|
|||||
(6) Consumer Finance Receivables
The following table summarizes consumer finance receivables:
| June 30, 2014 |
December 31, 2013 |
|||||||
| (in millions of dollars) | ||||||||
| Personal loans |
$ | 8,156 | $ | 8,112 | ||||
| Home equity loans |
— | 371 | ||||||
| Residential first mortgages |
— | 92 | ||||||
|
|
|
|
|
|||||
| Total loans |
8,156 | 8,575 | ||||||
| Unearned premium and claim reserves |
(408 | ) | (416 | ) | ||||
| Accrued interest receivable |
84 | 92 | ||||||
|
|
|
|
|
|||||
| Consumer finance receivables(1) |
7,832 | 8,251 | ||||||
| Allowance for loan losses |
(604 | ) | (676 | ) | ||||
|
|
|
|
|
|||||
| Net consumer finance receivables |
$ | 7,228 | $ | 7,575 | ||||
|
|
|
|
|
|||||
| (1) | Presented net of unearned revenue and deferred costs of $1.5 billion at June 30, 2014 and $1.4 billion at December 31, 2013. |
Geographic diversification of consumer finance receivables reduces the concentration of credit risk associated with economic stresses in any one region. The Company’s entire personal loan portfolio is serviced within the United States. At June 30, 2014 and December 31, 2013, no state or customer comprised more than 10% of the Company’s total consumer finance receivable balance.
Refer to Note 13 for further discussion on the fair value of consumer finance receivables. Refer to Note 14 for discussion on the transfer of real estate loans.
Credit Quality Indicators
Credit quality indicators that are actively monitored include delinquency status, credit scores (“FICOs”) and loan to value (“LTV”) ratios.
Delinquency Status
Delinquency status is carefully monitored and considered a key indicator of credit quality. OMH considers a loan delinquent if a monthly payment has not been received by the close of business on the loan’s next due date. All loans are classified as nonaccrual when loan payments are 90 days contractually past due.
F-16
Table of Contents
The following tables summarize consumer finance receivables delinquencies and nonaccrual loans:
| June 30, 2014 | ||||||||||||||||
| Total current(1) |
30 - 89 days past due |
Greater than or equal to 90 days past due (Nonaccrual) |
Total loans | |||||||||||||
| (in millions of dollars) | ||||||||||||||||
| Personal loans |
$ | 7,848 | $ | 135 | $ | 173 | $ | 8,156 | ||||||||
| Home equity loans |
— | — | — | — | ||||||||||||
| Residential first mortgages |
— | — | — | — | ||||||||||||
|
|
|
|
|
|
|
|
|
|||||||||
| Total loans |
$ | 7,848 | $ | 135 | $ | 173 | $ | 8,156 | ||||||||
|
|
|
|
|
|
|
|
|
|||||||||
| December 31, 2013 | ||||||||||||||||
| Total current(1) |
30 - 89 days past due |
Greater than or equal to 90 days past due (Nonaccrual) |
Total loans | |||||||||||||
| (in millions of dollars) | ||||||||||||||||
| Personal loans |
$ | 7,780 | $ | 136 | $ | 196 | $ | 8,112 | ||||||||
| Home equity loans |
354 | 8 | 9 | 371 | ||||||||||||
| Residential first mortgages |
86 | 2 | 4 | 92 | ||||||||||||
|
|
|
|
|
|
|
|
|
|||||||||
| Total loans |
$ | 8,220 | $ | 146 | $ | 209 | $ | 8,575 | ||||||||
|
|
|
|
|
|
|
|
|
|||||||||
| (1) | Loans less than 30 days past due are presented as current. |
Credit Scores
Independent credit agencies rate an individual’s risk for assuming debt based on the individual’s credit history and assign every consumer a FICO credit score. These scores are continually updated by the agencies based upon an individual’s credit actions (e.g., taking out a loan, missed or late payments, etc.). FICO scores are updated monthly for substantially the entire portfolio or, otherwise, on a quarterly basis.
The following tables summarize details on FICO scores:
| June 30, 2014 | ||||||||||||||||
| Less than 620 |
Equal to or greater than 620 but less than 660 |
Equal to or greater than 660 |
Total loans | |||||||||||||
| (in millions of dollars) | ||||||||||||||||
| Personal loans |
$ | 3,452 | $ | 2,235 | $ | 2,469 | $ | 8,156 | ||||||||
| Home equity loans |
— | — | — | — | ||||||||||||
| Residential first mortgages |
— | — | — | — | ||||||||||||
|
|
|
|
|
|
|
|
|
|||||||||
| Total loans |
$ | 3,452 | $ | 2,235 | $ | 2,469 | $ | 8,156 | ||||||||
|
|
|
|
|
|
|
|
|
|||||||||
| December 31, 2013 | ||||||||||||||||
| Less than 620 |
Equal to or greater than 620 but less than 660 |
Equal to or greater than 660 |
Total loans | |||||||||||||
| (in millions of dollars) | ||||||||||||||||
| Personal loans |
$ | 3,533 | $ | 2,169 | $ | 2,410 | $ | 8,112 | ||||||||
| Home equity loans |
173 | 91 | 107 | 371 | ||||||||||||
| Residential first mortgages |
48 | 23 | 21 | 92 | ||||||||||||
|
|
|
|
|
|
|
|
|
|||||||||
| Total loans |
$ | 3,754 | $ | 2,283 | $ | 2,538 | $ | 8,575 | ||||||||
|
|
|
|
|
|
|
|
|
|||||||||
F-17
Table of Contents
Loan to Value Ratios
LTV ratios (loan balance divided by appraised value) are calculated on real estate loans at origination and updated by applying market price data. LTV ratios are updated monthly using the most recent CoreLogic Home Pricing Index data available for substantially all of the real estate loan portfolio applied at the Metropolitan Statistical Area level, if available; otherwise at the state level. The remainder of the real estate loan portfolio is updated in a similar manner using the Federal Housing Finance Agency indices.
The following table summarizes details on the LTV ratios as of December 31, 2013. Due to the January 2014 transfer of real estate loans, this information is not applicable as of June 30, 2014:
| December 31, 2013 | ||||||||||||||||
| Less than or equal to 80% |
Greater than 80% but less than or equal to 100% |
Greater than 100% |
Total real estate loans |
|||||||||||||
| (in millions of dollars) | ||||||||||||||||
| Home equity loans |
$ | 54 | $ | 312 | $ | 5 | $ | 371 | ||||||||
| Residential first mortgages |
73 | 19 | — | 92 | ||||||||||||
|
|
|
|
|
|
|
|
|
|||||||||
| Total real estate loans |
$ | 127 | $ | 331 | $ | 5 | $ | 463 | ||||||||
|
|
|
|
|
|
|
|
|
|||||||||
Allowance for Loan Losses
The following table summarizes the change in the allowance for loan losses on consumer finance receivables:
| Six Months Ended June 30, |
||||||||
| 2014 | 2013 | |||||||
| (in millions of dollars) | ||||||||
| Balance, January 1 |
$ | 676 | $ | 686 | ||||
| Provision for credit losses |
230 | 275 | ||||||
| Amounts charged off |
(286 | ) | (308 | ) | ||||
| Recovery of amounts previously charged off |
29 | 20 | ||||||
| Other(1) |
(45 | ) | (2 | ) | ||||
|
|
|
|
|
|||||
| Balance, June 30(2) |
$ | 604 | $ | 671 | ||||
|
|
|
|
|
|||||
| Total loans(3) |
$ | 8,156 | $ | 8,301 | ||||
| Ratio of allowance for loan losses to consumer finance receivables |
7.41 | % | 8.08 | % | ||||
| (1) | Related to a non-provision transfer of reserves associated with loan sale transactions. |
| (2) | Beginning in October 2013, impaired personal loans, which are TDRs, that have subsequently renewed into a new loan at current market terms, and for which the borrower is no longer experiencing financial difficulty, are no longer considered an impaired loan or a TDR at time of renewal. Management determined that it is impracticable to determine the effect of applying this change retrospectively to impaired loans and the related Allowance for Loan Losses presented prior to October 2013. |
| (3) | Excludes unearned premium and claim reserves and accrued interest receivable. |
The following table summarizes the allowance for loan losses and investment in loans:
| June
30, 2014 |
December
31, 2013 |
|||||||
| (in millions of dollars) | ||||||||
| Allowance for loan losses: |
||||||||
| Determined in accordance with ASC 450-20 |
$ | 393 | $ | 441 | ||||
| Determined in accordance with ASC 310-10-35 |
211 | 235 | ||||||
|
|
|
|
|
|||||
| Total allowance for loan losses |
$ | 604 | $ | 676 | ||||
|
|
|
|
|
|||||
| Loans, net of unearned income: |
||||||||
| Non TDR loans evaluated for impairment in accordance with ASC 450-20 |
$ | 7,676 | $ | 8,036 | ||||
| TDR loans evaluated for impairment in accordance with ASC 310-10-35 |
480 | 539 | ||||||
|
|
|
|
|
|||||
| Total loans |
$ | 8,156 | $ | 8,575 | ||||
|
|
|
|
|
|||||
F-18
Table of Contents
Impaired Loans
Impaired loans are those for which the Company believes it is not probable that the Company will collect all amounts due according to the original contractual terms of the loan. Impaired loans include loans whose terms have been modified due to the borrower’s financial difficulties and the Company has granted a concession to the borrower. These modifications may include interest rate reductions and/or principal forgiveness. Impaired loans exclude loans that have not been modified and are carried on a nonaccrual basis. In addition, impaired loans exclude substantially all loans modified pursuant to the Company’s short-term modification programs (i.e. for periods of 12 months or less) that were modified prior to January 1, 2011. Loans included in these short-term programs amounted to $19 million at June 30, 2014 and $41 million at December 31, 2013.
The following tables summarize impaired loans at June 30, 2014 and December 31, 2013 and interest income recognized on impaired loans for the six months ended June 30, 2014 and 2013:
| Six Months Ended June 30, |
||||||||||||||||||||||||
| June 30, 2014 | 2014 | 2013 | ||||||||||||||||||||||
| Recorded investment(1) |
Unpaid principal balance |
Related specific allowance(2) |
Average carrying value(3) |
Interest income recognized |
Interest income recognized |
|||||||||||||||||||
| (in millions of dollars) | ||||||||||||||||||||||||
| Personal loans |
$ | 480 | $ | 481 | $ | 211 | $ | 481 | $ | 45 | $ | 44 | ||||||||||||
| Home equity loans |
— | — | — | — | — | 3 | ||||||||||||||||||
| Residential first mortgages |
— | — | — | — | — | — | ||||||||||||||||||
|
|
|
|
|
|
|
|
|
|
|
|
|
|||||||||||||
| Total impaired consumer finance receivables(4) |
$ | 480 | $ | 481 | $ | 211 | $ | 481 | $ | 45 | $ | 47 | ||||||||||||
|
|
|
|
|
|
|
|
|
|
|
|
|
|||||||||||||
| December 31, 2013 | ||||||||||||||||
| Recorded investment(1) |
Unpaid principal balance |
Related specific allowance(2) |
Average carrying value(3) |
|||||||||||||
| (in millions of dollars) | ||||||||||||||||
| Personal loans |
$ | 476 | $ | 476 | $ | 212 | $ | 496 | ||||||||
| Home equity loans |
56 | 56 | 18 | 58 | ||||||||||||
| Residential first mortgages |
7 | 7 | 5 | 5 | ||||||||||||
|
|
|
|
|
|
|
|
|
|||||||||
| Total impaired consumer finance receivables(4) |
$ | 539 | $ | 539 | $ | 235 | $ | 559 | ||||||||
|
|
|
|
|
|
|
|
|
|||||||||
| (1) | Recorded investment in Consumer finance receivables includes net deferred loan fees and costs, unamortized premium or discount and direct write-downs. |
| (2) | Classified in Allowance for loan losses on the Condensed Combined Statements of Financial Position. |
| (3) | Average carrying value represents the average recorded investment ending balance for the two quarters ended June 30, 2014 and for the four quarters ended December 31, 2013 and does not include related specific allowance. |
| (4) | Prior to 2008, the Company’s financial accounting systems did not separately track impaired loans whose terms were modified due to the borrowers’ financial difficulties, and it was determined that a concession was granted to the borrower. |
Troubled Debt Restructuring
The Company may make modifications to its loans for various reasons. Such modifications may result in long-term or short-term rate reductions and payment deferrals. When a modification is made to a borrower experiencing financial difficulty and in which the terms are considered below market terms for that borrower, the Company reports such modified loans as troubled debt restructurings (“TDRs”).
F-19
Table of Contents
The following tables summarize TDR activity and default information:
| Six Months Ended June 30, 2014 | ||||||||||||
| (in millions of dollars except number of loans modified and average interest rate reduction) |
Number of loans modified |
Post-modification recorded investment |
Average interest rate reduction |
|||||||||
| Personal loans |
21,040 | $ | 154 | 5.94 | % | |||||||
| Home equity loans |
— | — | — | % | ||||||||
| Residential first mortgages |
— | — | — | % | ||||||||
|
|
|
|
|
|||||||||
| Total |
21,040 | $ | 154 | |||||||||
|
|
|
|
|
|||||||||
| Six Months Ended June 30, 2013 | ||||||||||||
| (in millions of dollars except number of loans modified and average interest rate reduction) |
Number of loans modified |
Post-modification recorded investment |
Average interest rate reduction |
|||||||||
| Personal loans |
19,674 | $ | 140 | 4.97 | % | |||||||
| Home equity loans |
574 | 7 | 2.40 | % | ||||||||
| Residential first mortgages |
35 | 3 | 2.65 | % | ||||||||
|
|
|
|
|
|||||||||
| Total |
20,283 | $ | 150 | |||||||||
|
|
|
|
|
|||||||||
The following table summarizes TDR loans that defaulted and for which the payment default (default is defined as 60 days past due) occurred within one year of the modification:
| Six Months Ended June 30, |
||||||||
| 2014 | 2013 | |||||||
| (in millions of dollars) | ||||||||
| Personal loans |
$ | 31 | $ | 27 | ||||
| Home equity loans |
— | 3 | ||||||
|
|
|
|
|
|||||
| Total |
$ | 31 | $ | 30 | ||||
|
|
|
|
|
|||||
(7) Intangible Assets
Intangible assets are composed of the present value of future profits (“PVFP”) of purchased insurance contracts in the Insurance segment. The PVFP is subject to premium deficiency testing in accordance with ASC 944 Financial Services—Insurance.
The following table summarizes intangible assets:
| June 30, 2014 | December 31, 2013 | |||||||||||||||||||||||
| Gross carrying amount |
Accumulated amortization |
Net carrying amount |
Gross carrying amount |
Accumulated amortization |
Net carrying amount |
|||||||||||||||||||
| (in millions of dollars) | ||||||||||||||||||||||||
| Present value of future profits |
$ | 226 | $ | (150 | ) | $ | 76 | $ | 226 | $ | (144 | ) | $ | 82 | ||||||||||
|
|
|
|
|
|
|
|
|
|
|
|
|
|||||||||||||
Amortization expense was $6 million and $7 million for the six months ended June 30, 2014 and 2013 and is classified in Other operating expense on the Condensed Combined Statements of Income.
Intangible assets subject to amortization are reviewed for impairment annually or whenever events or changes in circumstances indicate that the carrying amount may not be recoverable. Impairment is recognized if the carrying amount is not recoverable and exceeds the fair value of the intangible asset. At June 30, 2014 no intangible assets were deemed impaired.
F-20
Table of Contents
(8) Premises and Equipment, net
The following table summarizes the cost of premises and equipment and related accumulated depreciation and amortization:
| June 30, 2014 |
December 31, 2013 |
|||||||
| (in millions of dollars) | ||||||||
| Leasehold improvements |
$ | 82 | $ | 81 | ||||
| Equipment |
30 | 30 | ||||||
| Software |
2 | 2 | ||||||
|
|
|
|
|
|||||
| Premises and equipment |
114 | 113 | ||||||
| Less accumulated depreciation and amortization |
(95 | ) | (92 | ) | ||||
|
|
|
|
|
|||||
| Premises and equipment, net |
$ | 19 | $ | 21 | ||||
|
|
|
|
|
|||||
Depreciation and amortization expense was $4 million and $6 million for the six months ended June 30, 2014 and 2013. Rental expense (principally for offices and computer equipment) was $23 million and $26 million for the six months ended June 30, 2014 and 2013. These amounts are classified in Occupancy expense and Technology and communications expense on the Condensed Combined Statements of Income.
Premises and equipment are tested for impairment annually and when events or changes in circumstances indicate that the carrying value of such assets may not be recoverable. Impairment is recognized if the carrying amount is not recoverable and exceeds the fair value of the asset. At June 30, 2014 no premises and equipment were deemed impaired.
(9) Insurance
Reinsurance
The Company’s use of ceded reinsurance arrangements is limited. The Company has generally used assumed reinsurance arrangements to acquire blocks of business in force. Ceded reinsurance arrangements do not discharge the insurance entities or the Company as the primary insurer.
The following tables summarize reinsurance amounts included on the Condensed Combined Statements of Income:
| Six Months Ended June 30, 2014 | ||||||||||||||||
| Direct amount |
Assumed from other companies |
Ceded to other companies |
Net amount |
|||||||||||||
| (in millions of dollars) | ||||||||||||||||
| Premiums: |
||||||||||||||||
| Accident and health insurance |
$ | 57 | $ | 15 | $ | — | $ | 72 | ||||||||
| Life insurance |
43 | 25 | (2 | ) | 66 | |||||||||||
| Property and other |
31 | 2 | — | 33 | ||||||||||||
|
|
|
|
|
|
|
|
|
|||||||||
| Total premiums |
$ | 131 | $ | 42 | $ | (2 | ) | $ | 171 | |||||||
|
|
|
|
|
|
|
|
|
|||||||||
| Policyholder benefits and claims |
$ | 52 | $ | 16 | $ | (4 | ) | $ | 64 | |||||||
| Insurance policy and claim reserves |
$ | 676 | $ | 293 | $ | (90 | ) | $ | 879 | |||||||
F-21
Table of Contents
| Six Months Ended June 30, 2013 | ||||||||||||||||
| Direct amount |
Assumed from other companies |
Ceded to other companies |
Net amount |
|||||||||||||
| (in millions of dollars) | ||||||||||||||||
| Premiums: |
||||||||||||||||
| Accident and health insurance |
$ | 58 | $ | 16 | $ | — | $ | 74 | ||||||||
| Life insurance |
45 | 24 | (3 | ) | 66 | |||||||||||
| Property and other |
33 | 3 | — | 36 | ||||||||||||
|
|
|
|
|
|
|
|
|
|||||||||
| Total premiums |
$ | 136 | $ | 43 | $ | (3 | ) | $ | 176 | |||||||
|
|
|
|
|
|
|
|
|
|||||||||
| Policyholder benefits and claims |
$ | 63 | $ | 17 | $ | (3 | ) | $ | 77 | |||||||
Deferred Policy Acquisition Costs
Unamortized deferred policy acquisition costs were $105 million at June 30, 2014 and $109 million at December 31, 2013, and are classified in Other assets on the Condensed Combined Statements of Financial Position. Amortization of deferred policy acquisition costs was $8 million and $7 million for the six months ended June 30, 2014 and 2013 and are classified in Other operating expense on the Condensed Combined Statements of Income.
Statutory Stockholder’s Equity
The insurance entities statutory stockholder’s equity was $489 million at June 30, 2014 and $415 million at December 31, 2013. State law restricts the amounts the Company’s insurance entities may pay as dividends without prior notice to, or in some cases prior approval from, the Texas Department of Insurance. The Company’s insurance entities paid no dividends in the six months ended June 30, 2014 and 2013. The combined insurance entities net income determined in accordance with statutory accounting practices was $74 million and $79 million for the six months ended June 30, 2014 and 2013.
Liability for Accident and Health Unpaid Claims and Reserve for Losses and Loss Expenses
The following table summarizes activity in the accident and health policy and contract claims and certain accident and health aggregate reserves (present value of amounts not yet due on claims) and activity in the liability for credit IUI unpaid claims and claim adjustment expenses:
| Six Months Ended June 30, |
||||||||
| (in millions of dollars) | 2014 | 2013 | ||||||
| Balance, January 1 |
$ | 109 | $ | 120 | ||||
| Incurred related to: |
||||||||
| Current year |
38 | 42 | ||||||
| Prior years |
(5 | ) | 1 | |||||
|
|
|
|
|
|||||
| Total incurred |
33 | 43 | ||||||
|
|
|
|
|
|||||
| Paid related to: |
||||||||
| Current year |
(9 | ) | (11 | ) | ||||
| Prior years |
(33 | ) | (41 | ) | ||||
|
|
|
|
|
|||||
| Total paid |
(42 | ) | (52 | ) | ||||
|
|
|
|
|
|||||
| Balance, June 30 |
$ | 100 | $ | 111 | ||||
|
|
|
|
|
|||||
The decrease in incurred claims resulted from subsequent revisions to estimated claim reserves based on actual experience.
F-22
Table of Contents
(10) Income Taxes
At June 30, 2014, the Company recorded deferred tax assets, net of deferred tax liabilities, of $260 million, an increase of $4 million from December 31, 2013. The increase in deferred tax assets was driven primarily by deferred intercompany losses of $15.1 million partially offset by gains recorded through equity on unrealized gains and foreign currency translation of $8.8 million. The Company had no valuation allowance on deferred tax assets at June 30, 2014 and December 31, 2013. Although realization is not assured, the Company believes that the realization of the recognized deferred tax asset is more likely than not based on expectations as to future taxable income in the jurisdictions in which we operate.
The Company recorded an income tax provision of $160 million (35.8% effective income tax rate) for the six months ended June 30, 2014, compared with an income tax provision of $144 million (36.7% effective income tax rate) for the six months ended June 30, 2013. The effective tax rate differs from the U.S. federal statutory tax rate of 35.0% primarily due to state income taxes.
The Company recorded uncertain income tax positions relevant to the jurisdictions where it is required to file income tax returns. The unrecognized tax benefits and the potential benefits included in the balance of total unrecognized tax benefits was $2 million for each of the periods ended June 30, 2014 and 2013. The Company’s policy is to record interest and penalties related to uncertain tax positions in the tax provision.
The Company is under continuous examination by the IRS and tax authorities for various states as part of their audit of Citigroup’s tax returns. During the second quarter of 2014, Citigroup settled the U.S. consolidated audit of tax years 2009, 2010 and 2011 with the IRS. The audit adjustments had previously been recorded in the provision and will be settled with the Parent in a future period.
(11) Changes in Accumulated Other Comprehensive Income
The following table summarizes the components of accumulated other comprehensive income (“AOCI”):
| Six Months Ended June 30, 2014 |
Net unrealized gains (losses) on investment securities |
Foreign currency translation adjustment(1) |
Accumulated other comprehensive income |
|||||||||
| (in millions of dollars) | ||||||||||||
| Balance, January 1, 2014 |
$ | 43 | $ | 1 | $ | 44 | ||||||
| Other comprehensive income (loss) before reclassifications |
16 | 1 | 17 | |||||||||
| Increase (decrease) due to amounts reclassified from AOCI |
— | — | — | |||||||||
|
|
|
|
|
|
|
|||||||
| Change, net of tax |
16 | 1 | 17 | |||||||||
|
|
|
|
|
|
|
|||||||
| Balance, June 30, 2014 |
$ | 59 | $ | 2 | $ | 61 | ||||||
|
|
|
|
|
|
|
|||||||
| Six Months Ended June 30, 2013 |
||||||||||||
| Balance, January 1, 2013 |
$ | 79 | $ | 3 | $ | 82 | ||||||
| Other comprehensive income (loss) before reclassifications |
(29 | ) | (2 | ) | (31 | ) | ||||||
| Decrease due to amounts reclassified from AOCI |
(1 | ) | — | (1 | ) | |||||||
|
|
|
|
|
|
|
|||||||
| Change, net of tax |
(30 | ) | (2 | ) | (32 | ) | ||||||
|
|
|
|
|
|
|
|||||||
| Balance, June 30, 2013 |
$ | 49 | $ | 1 | $ | 50 | ||||||
|
|
|
|
|
|
|
|||||||
| (1) | Reflects the movements in the Canadian Dollar against the U.S. Dollar. |
F-23
Table of Contents
The following table summarizes the pre-tax and after-tax changes in each component of AOCI:
| Pre-tax | Tax effect | After-tax | ||||||||||
| (in millions of dollars) | ||||||||||||
| Balance, January 1, 2014 |
$ | 69 | $ | (25 | ) | $ | 44 | |||||
| Change in net unrealized gains (losses) on investment securities |
25 | (9 | ) | 16 | ||||||||
| Foreign currency translation adjustment |
1 | — | 1 | |||||||||
|
|
|
|
|
|
|
|||||||
| Change |
26 | (9 | ) | 17 | ||||||||
|
|
|
|
|
|
|
|||||||
| Balance, June 30, 2014 |
$ | 95 | $ | (34 | ) | $ | 61 | |||||
|
|
|
|
|
|
|
|||||||
| Balance, January 1, 2013 |
$ | 126 | $ | (44 | ) | $ | 82 | |||||
| Change in net unrealized gains (losses) on investment securities |
(46 | ) | 16 | (30 | ) | |||||||
| Foreign currency translation adjustment |
(3 | ) | 1 | (2 | ) | |||||||
|
|
|
|
|
|
|
|||||||
| Change |
(49 | ) | 17 | (32 | ) | |||||||
|
|
|
|
|
|
|
|||||||
| Balance, June 30, 2013 |
$ | 77 | $ | (27 | ) | $ | 50 | |||||
|
|
|
|
|
|
|
|||||||
The following table summarizes the decrease in AOCI for amounts reclassified to the Condensed Combined Statements of Income:
| Increase (decrease) in AOCI due to amounts reclassified to Condensed Combined Statement of Income |
||||||||
| Six Months Ended June 30, | ||||||||
| 2014 | 2013 | |||||||
| (in millions of dollars) | ||||||||
| Net realized gains on sales of investments(1) |
$ | (1 | ) | $ | (3 | ) | ||
| Gross OTTI impairment losses(1) |
— | 1 | ||||||
|
|
|
|
|
|||||
| Net realized gains reclassified out of AOCI—pre-tax |
(1 | ) | (2 | ) | ||||
| Tax expense (benefit) |
1 | 1 | ||||||
|
|
|
|
|
|||||
| Net realized (gains) losses reclassified out of AOCI—after-tax |
$ | — | $ | (1 | ) | |||
|
|
|
|
|
|||||
| (1) | Refer to Note 5 for additional information on realized gains and losses on investment securities and OTTI impairments. |
(12) Securitizations
On April 17, 2014, OMH completed the securitization of personal loans and formed OneMain Financial Issuance Trust 2014-1 (the “Issuer” or the “Trust”) resulting in the issuance of $760 million of 2.43% Class A and 3.24% Class B fixed rate notes collateralized by $1.0 billion of loans. The notes are due June 18, 2024 and may be optionally called by the Issuer on or after April 18, 2016 at a redemption price equal to 101% of the aggregate note principal balance at the time of the optional call. The Issuer will make payments of interest on the notes during the revolving period, which ends March 31, 2016, and make principal and interest payments thereafter. During the revolving period, additional loans may be transferred to the Trust. The loans are restricted from being sold or pledged as collateral and can only be used to pay the liabilities of the Trust while the notes are outstanding. The parent of the Trust is OneMain Financial Funding, LLC, which is a subsidiary of OneMain Financial Holdings, Inc.
The Company continues to combine a trust related to a previous securitization for which an optional early redemption was exercised in December 2012. Upon redemption, the assets were no longer considered restricted to only settle the obligations of the VIE and the creditors and beneficial interest holders were considered to have recourse to the general credit of the Parent as they are all related parties. The trust continued to exist as a VIE until its dissolution in May 2014.
F-24
Table of Contents
The securitization trust described above is a VIE consolidated by OMH as its primary beneficiary as OMH has: (1) as servicer of the loans in the VIE, the power to direct the activities that most significantly affect the VIE’s performance; and (2) the obligation to either absorb the losses or the right to receive benefits that could be potentially significant to the VIE.
The following table summarizes the carrying amounts and classifications of the VIEs assets and liabilities on the Condensed Combined Statements of Financial Position that are consolidated in accordance with ASC 810:
| June 30, 2014 | December 31, 2013 | |||||||
| (in millions of dollars) | ||||||||
| Assets |
||||||||
| Cash and cash equivalents |
$ | 90 | $ | 188 | ||||
| Net consumer finance receivables |
982 | 4,139 | ||||||
| Other assets |
8 | 112 | ||||||
|
|
|
|
|
|||||
| Total assets |
$ | 1,080 | $ | 4,439 | ||||
|
|
|
|
|
|||||
| Liabilities |
||||||||
| Long-term debt |
$ | 760 | $ | — | ||||
| Related party debt |
— | 403 | ||||||
| Accounts payable, accrued expenses and other liabilities |
13 | $ | 406 | |||||
|
|
|
|
|
|||||
| Total liabilities |
$ | 773 | $ | 809 | ||||
|
|
|
|
|
|||||
(13) Fair Value Measurements
ASC 820-10, Fair Value Measurement, defines fair value, establishes a consistent framework for measuring fair value and requires disclosures about fair value measurements. Fair value is defined as the price that would be received to sell an asset or paid to transfer a liability in an orderly transaction between market participants at the measurement date. Among other things, the standard requires the Company to maximize the use of observable inputs and minimize the use of unobservable inputs when measuring fair value.
Fair Value Hierarchy
ASC 820-10 specifies a hierarchy of inputs based on whether the inputs are observable or unobservable. Observable inputs reflect market data obtained from independent sources, while unobservable inputs reflect the Company’s market assumptions.
These two types of inputs have created the following fair value hierarchy:
Level 1—Quoted prices for identical instruments in active markets.
Level 2—Quoted prices for similar instruments in active markets; quoted prices for identical or similar instruments in markets that are not active; and model-derived valuations in which all significant inputs and significant value drivers are observable in active markets.
Level 3—Valuations derived from valuation techniques in which one or more significant inputs or significant value drivers are unobservable.
The Company’s policy with respect to transfers between levels of the fair value hierarchy is to recognize transfers into and out of each level as of the end of the reporting period.
Determination of Fair Value
For assets and liabilities carried at fair value, the Company primarily utilizes third-party valuation service providers to derive fair values based on various methodologies, including market quotes where available,
F-25
Table of Contents
external non-binding broker quotes, and proprietary valuation models. The Company assesses the reasonableness of security values received from valuation service providers through various analytical techniques including comparing the information obtained from the valuation service providers to other third-party valuation sources for selected securities.
Fair Value of Financial Instruments
The following tables summarize the fair value and carrying amount of financial instruments:
| June 30, 2014 | ||||||||||||||||||||
| Carrying value |
Estimated fair value |
Estimated fair value | ||||||||||||||||||
| Level 1 | Level 2 | Level 3 | ||||||||||||||||||
| (in millions of dollars) | ||||||||||||||||||||
| Assets |
||||||||||||||||||||
| Cash and cash equivalents |
$ | 291 | $ | 291 | $ | — | $ | 291 | $ | — | ||||||||||
| Investments (Note 5) |
1,504 | 1,504 | 106 | 1,338 | 60 | |||||||||||||||
| Consumer finance receivables(1) (Note 6) |
7,636 | 8,663 | — | — | 8,663 | |||||||||||||||
| Liabilities |
||||||||||||||||||||
| Related party debt (Note 14) |
4,619 | 4,619 | — | — | 4,619 | |||||||||||||||
| Long-term debt |
760 | 760 | — | — | 760 | |||||||||||||||
| (1) | The carrying value of consumer finance receivables includes accrued interest receivables of $84 million, is net of the allowance for loan losses of $604 million and excludes unearned premium and claim reserves of $408 million. |
| December 31, 2013 | ||||||||||||||||||||
| Carrying value |
Estimated fair value |
Estimated fair value | ||||||||||||||||||
| Level 1 | Level 2 | Level 3 | ||||||||||||||||||
| (in millions of dollars) | ||||||||||||||||||||
| Assets |
||||||||||||||||||||
| Cash and cash equivalents |
$ | 319 | $ | 319 | $ | — | $ | 319 | $ | — | ||||||||||
| Investments (Note 5) |
1,431 | 1,431 | 49 | 1,324 | 58 | |||||||||||||||
| Consumer finance receivables(1) (Note 6) |
7,991 | 8,651 | — | — | 8,651 | |||||||||||||||
| Liabilities |
||||||||||||||||||||
| Related party debt (Note 14) |
5,894 | 5,894 | — | — | 5,894 | |||||||||||||||
| (1) | The carrying value of consumer finance receivables includes accrued interest receivables of $92 million, is net of the allowance for loan losses of $676 million and excludes unearned premium and claim reserves of $416 million. |
The fair value assumptions are based upon subjective estimates of market conditions and perceived risks of the financial instruments at a certain point in time as disclosed further in various notes to the Combined Financial Statements.
Fixed maturities and equity securities—the fair value is based primarily on quoted market prices or if quoted market prices are not available, discounted expected cash flows using market rates for similar instruments which are commensurate with the credit quality and maturity of the investments. If market rates for similar instruments are not available, other valuation techniques would be used and the asset would be classified as Level 3.
Short-term and other investments—the carrying value approximates the fair value due to the relatively short period of time between the origination of the investment and its expected maturity or realization.
F-26
Table of Contents
Consumer finance receivables—At June 30, 2014, the fair value is estimated using a discounted cash flow methodology using assumptions management believes a market participant would make in valuing these assets. At December 31, 2013, the fair value was estimated based primarily on an exit value return-on-asset methodology, using assumptions that management believes a market participant would use in valuing these assets. While both methods achieve a fair value estimate in accordance with GAAP, management adopted the discounted cash flow valuation technique as it is considered a more traditional and universally understood methodology.
Related party debt—the carrying value approximates fair value due to the short-term nature of these instruments.
Long-term debt—fair value measurements of long-term debt is based on input from market participants or indicative prices obtained from a third party.
The disclosed fair values for financial instruments do not reflect any premium or discount that could result from offering for sale, at one time, the Company’s entire holdings of a particular financial instrument. In addition, any potential taxes and other expenses that would be incurred in an actual sale or settlement are not reflected in amounts disclosed.
Items Measured at Fair Value on a Recurring Basis
The Company has certain financial assets that are required to be reported on the Condensed Combined Statements of Financial Position at fair value, on either a recurring or nonrecurring basis.
The following tables summarize assets measured at fair value on a recurring basis:
| June 30, 2014 | ||||||||||||||||
| Level 1 | Level 2 | Level 3 | Total | |||||||||||||
| (in millions of dollars) | ||||||||||||||||
| Fixed maturity securities: |
||||||||||||||||
| Mortgage-backed securities: |
||||||||||||||||
| U.S. government agency guaranteed |
$ | — | $ | 71 | $ | 1 | $ | 72 | ||||||||
| Prime |
— | 5 | — | 5 | ||||||||||||
| Commercial |
— | 69 | 2 | 71 | ||||||||||||
|
|
|
|
|
|
|
|
|
|||||||||
| Total mortgage-backed securities |
— | 145 | 3 | 148 | ||||||||||||
| U.S. Treasury and federal agency |
15 | 14 | — | 29 | ||||||||||||
| State and municipal |
— | 41 | — | 41 | ||||||||||||
| Foreign government |
48 | 114 | — | 162 | ||||||||||||
| Corporate securities |
1 | 930 | 40 | 971 | ||||||||||||
| Other debt securities |
— | 43 | 10 | 53 | ||||||||||||
|
|
|
|
|
|
|
|
|
|||||||||
| Total fixed maturity securities |
64 | 1,287 | 53 | 1,404 | ||||||||||||
| Equity securities |
42 | 2 | 7 | 51 | ||||||||||||
| Short-term and other |
— | 49 | — | 49 | ||||||||||||
|
|
|
|
|
|
|
|
|
|||||||||
| Total investments |
$ | 106 | $ | 1,338 | $ | 60 | $ | 1,504 | ||||||||
|
|
|
|
|
|
|
|
|
|||||||||
F-27
Table of Contents
| December 31, 2013 | ||||||||||||||||
| Level 1 | Level 2 | Level 3 | Total | |||||||||||||
| (in millions of dollars) | ||||||||||||||||
| Fixed maturity securities: |
||||||||||||||||
| Mortgage-backed securities: |
||||||||||||||||
| U.S. government agency guaranteed |
$ | — | $ | 69 | $ | 5 | $ | 74 | ||||||||
| Prime |
— | 7 | — | 7 | ||||||||||||
| Commercial |
— | 75 | — | 75 | ||||||||||||
|
|
|
|
|
|
|
|
|
|||||||||
| Total mortgage-backed securities |
— | 151 | 5 | 156 | ||||||||||||
| U.S. Treasury and federal agency |
15 | 12 | — | 27 | ||||||||||||
| State and municipal |
— | 33 | — | 33 | ||||||||||||
| Foreign government |
— | 143 | — | 143 | ||||||||||||
| Corporate securities |
— | 923 | 37 | 960 | ||||||||||||
| Other debt securities |
— | 43 | 10 | 53 | ||||||||||||
|
|
|
|
|
|
|
|
|
|||||||||
| Total fixed maturity securities |
15 | 1,305 | 52 | 1,372 | ||||||||||||
| Equity securities |
34 | 5 | 6 | 45 | ||||||||||||
| Short-term and other |
— | 14 | — | 14 | ||||||||||||
|
|
|
|
|
|
|
|
|
|||||||||
| Total investments |
$ | 49 | $ | 1,324 | $ | 58 | $ | 1,431 | ||||||||
|
|
|
|
|
|
|
|
|
|||||||||
The following tables summarize the changes in the Level 3 fair value category:
| Balance January 1, 2014 |
Transfers into Level 3 |
Transfers out of Level 3 |
Purchases | Sales | Net realized gains (losses) |
Net unrealized gains (losses) in other comprehensive income on assets still held |
Balance June 30, 2014 |
|||||||||||||||||||||||||
| (in millions of dollars) | ||||||||||||||||||||||||||||||||
| Fixed maturity securities: |
||||||||||||||||||||||||||||||||
| Mortgage-backed securities: |
||||||||||||||||||||||||||||||||
| U.S. government agency guaranteed |
$ | 5 | $ | 1 | $ | (4 | ) | $ | — | $ | (1 | ) | $ | — | $ | — | $ | 1 | ||||||||||||||
| Prime |
— | 1 | (1 | ) | — | — | — | — | — | |||||||||||||||||||||||
| Commercial |
— | 2 | — | — | — | — | — | 2 | ||||||||||||||||||||||||
|
|
|
|
|
|
|
|
|
|
|
|
|
|
|
|
|
|||||||||||||||||
| Total mortgage-backed securities |
5 | 4 | (5 | ) | — | (1 | ) | — | — | 3 | ||||||||||||||||||||||
| Corporate securities |
37 | 1 | — | 3 | (1 | ) | — | — | 40 | |||||||||||||||||||||||
| Other debt securities |
10 | — | — | — | — | — | — | 10 | ||||||||||||||||||||||||
|
|
|
|
|
|
|
|
|
|
|
|
|
|
|
|
|
|||||||||||||||||
| Total fixed maturity securities |
52 | 5 | (5 | ) | 3 | (2 | ) | — | — | 53 | ||||||||||||||||||||||
| Equity securities |
6 | 7 | (7 | ) | 1 | — | — | — | 7 | |||||||||||||||||||||||
|
|
|
|
|
|
|
|
|
|
|
|
|
|
|
|
|
|||||||||||||||||
| Total fixed maturity and equity securities |
$ | 58 | $ | 12 | $ | (12 | ) | $ | 4 | $ | (2 | ) | $ | — | $ | — | $ | 60 | ||||||||||||||
|
|
|
|
|
|
|
|
|
|
|
|
|
|
|
|
|
|||||||||||||||||
F-28
Table of Contents
| Balance January 1, 2013 |
Transfers into Level 3 |
Transfers out of Level 3 |
Purchases | Sales | Net realized gains (losses) |
Net unrealized gains (losses) in other comprehensive income on assets still held |
Balance June 30, 2013 |
|||||||||||||||||||||||||
| (in millions of dollars) | ||||||||||||||||||||||||||||||||
| Fixed maturity securities: |
||||||||||||||||||||||||||||||||
| Mortgage-backed securities: |
||||||||||||||||||||||||||||||||
| U.S. government agency guaranteed |
$ | — | $ | 1 | $ | — | $ | — | $ | — | $ | — | $ | — | $ | 1 | ||||||||||||||||
| Alt- A |
— | 1 | — | — | — | — | — | 1 | ||||||||||||||||||||||||
| Commercial |
— | 1 | — | — | — | — | — | 1 | ||||||||||||||||||||||||
|
|
|
|
|
|
|
|
|
|
|
|
|
|
|
|
|
|||||||||||||||||
| Total mortgage-backed securities |
— | 3 | — | — | — | — | — | 3 | ||||||||||||||||||||||||
| Corporate securities |
4 | 38 | (4 | ) | 1 | (1 | ) | — | — | 38 | ||||||||||||||||||||||
| Other debt securities |
10 | — | (3 | ) | 3 | — | — | — | 10 | |||||||||||||||||||||||
|
|
|
|
|
|
|
|
|
|
|
|
|
|
|
|
|
|||||||||||||||||
| Total fixed maturity securities |
14 | 41 | (7 | ) | 4 | (1 | ) | — | — | 51 | ||||||||||||||||||||||
| Equity securities |
4 | 9 | — | — | — | — | — | 13 | ||||||||||||||||||||||||
|
|
|
|
|
|
|
|
|
|
|
|
|
|
|
|
|
|||||||||||||||||
| Total fixed maturity and equity securities |
$ | 18 | $ | 50 | $ | (7 | ) | $ | 4 | $ | (1 | ) | $ | — | $ | — | $ | 64 | ||||||||||||||
|
|
|
|
|
|
|
|
|
|
|
|
|
|
|
|
|
|||||||||||||||||
Transfers between Level 1 and Level 2 of the Fair Value Hierarchy
For the six months ended June 30, 2014, the Company made no transfers of investments between Level 1 and Level 2.
For the six months ended June 30, 2013, the Company transferred $66 million of investments from Level 1 to Level 2, primarily related to equity and short-term and other securities which were not traded with sufficient frequency to constitute an active market. For the six months ended June 30, 2013, the Company transferred $28 million of investments from Level 2 to Level 1, primarily related to U.S. Treasury and federal agency securities which were traded with sufficient frequency to constitute an active market.
Transfers in and out of Level 3 of the Fair Value Hierarchy
For the six months ended June 30, 2014, $12 million of investments, primarily related to equity and mortgage-backed securities, were transferred into Level 3 and $12 million of investments, primarily related to equity and mortgage-backed securities, were transferred out of Level 3 due to changes in the level of price observability for the specific securities.
For the six months ended June 30, 2013, $50 million of investments, primarily related to corporate and equity securities, were transferred into Level 3 and $7 million of investments, primarily related to corporate and other debt securities, were transferred out of Level 3 due to changes in the level of price observability for the specific securities.
Valuation Techniques and Inputs for Level 2 Fair Value Measurements
At June 30, 2014 and December 31, 2013, the majority of the financial instruments in Level 2 consisted of cash and investments. Investments in Level 2 were composed of corporate securities, mortgage-backed securities and foreign government securities. The fair value for these investments is based upon: (1) quoted prices for similar assets in active markets; (2) quoted prices for identical or similar assets in inactive markets; or (3) valuations based on models where the significant inputs are observable including, but not limited to, interest rates, yield curves, prepayment speeds, default rates and loss severities, or can be corroborated by observable market data.
F-29
Table of Contents
Valuation Techniques and Inputs for Level 3 Fair Value Measurements
At June 30, 2014, the majority of the investments in Level 3 were corporate securities for which the fair value is measured by the Company’s third-party valuation service provider using a price based methodology with the significant unobservable input as the price, which ranges from 3.24 to 116.39 of par.
At December 31, 2013, the majority of the investments in Level 3 were corporate securities for which the fair value is measured by the Company’s third-party valuation service provider using a price based methodology with the significant unobservable input as the price, which ranges from 1.25 to 121.28 of par.
The effect on the fair value measurement of a given security is wholly dependent on the amount and direction of any changes in the unobservable price input.
(14) Related Party Transactions
Expense Allocations
The Condensed Combined Financial Statements include direct and indirect expense allocations of certain costs for employee benefits and support functions provided on a centralized basis by various providers across Citigroup and CCC. These expenses are allocated based on various cost and/or activity-related drivers.
The following table summarizes the Company’s allocated share of the related costs from Citigroup and CCC providers for the six months ended June 30, 2014 and 2013:
| Six Months Ended June 30, | ||||||||
| (in millions of dollars) | 2014 | 2013 | ||||||
| Direct costs |
$ | 104 | $ | 112 | ||||
| Indirect costs |
22 | 40 | ||||||
|
|
|
|
|
|||||
| Total allocated expenses |
$ | 126 | $ | 152 | ||||
|
|
|
|
|
|||||
Direct Allocated Costs
Direct allocated costs represent specific services or functions that are attributable to the Company based on actual and/or estimated usage or consumption. These services include employee benefits, technology, occupancy, and other direct costs. Citigroup and CCC allocate the costs associated with these services using established allocation methodologies.
Indirect Allocated Costs
Indirect allocated costs represent general corporate level services provided to the Company and other affiliates by Citigroup. Corporate level services include finance, human resources, compliance, risk, legal, communications, treasury, audit, administration and security. Additionally, operations and technology management, and other shared administrative costs are also included in indirect allocated costs in 2013. In 2014, operations and technology costs are now directly allocated and included in direct costs. The costs are allocated to the Company on a pro-rata basis among certain of Citigroup’s subsidiaries using a three-month rolling average of the costs associated with assets, direct staff, direct expenses and, in certain cases, a time study.
Revenue Allocations
The Insurance segment provides administrative support related to debt protection products on behalf of other Citigroup affiliates. The Company recorded income related to these services of $6 million and $5 million for the six months ended June 30, 2014 and 2013. The Company provides other shared support to an affiliate beginning in 2013 following the transfer of employees from CCC to OMH. The Company recorded income related to these services of $4 million and $3 million for the six months ended June 30, 2014 and 2013. These amounts are classified in Other revenue on the Condensed Combined Statements of Income.
F-30
Table of Contents
Related Party Debt
The Company’s Related party debt was $4.6 billion and $5.9 billion, net of related party receivables of $1.5 billion and $854 million at June 30, 2014 and December 31, 2013. These unsecured balances are short-term in nature with no stated maturity and include charges for operational support and the borrowing and lending of funds. The Company is charged interest monthly based on CCC’s cost of funds.
The following table summarizes information with respect to Related party debt:
| Six Months Ended June 30, 2014 |
Year Ended December 31, 2013 |
|||||||
| (in millions of dollars) | ||||||||
| Weighted average interest rate |
4.04 | % | 3.69 | % | ||||
| Maximum outstanding balance |
$ | 5,625 | $ | 6,000 | ||||
| Interest paid |
$ | 109 | $ | 228 | ||||
Other Related Party Transactions
Cash on deposit with related parties was $105 million at June 30, 2014 and $153 million at December 31, 2013. These balances are classified in Cash and cash equivalents on the Condensed Combined Statements of Financial Position.
On January 1, 2014, the Company transferred its residential first mortgage and home equity loans totaling approximately $463 million to its parent in the form of a distribution. The distribution occurred at carrying value and accordingly, no gain or loss was recognized.
On January 6, 2014, the Company transferred real estate loan servicing responsibilities to an affiliate. Due to a licensing restriction, the servicing relating to $57 million of loans was not able to be released until April 6, 2014. The Company received servicing fees of $2 million and $55 million for the six months ended June 30, 2014 and 2013. These servicing fees are classified in Other revenue on the Condensed Combined Statements of Income. The Company did not receive or pay any consideration relating to the servicing transfer.
(15) Incentive Compensation
All equity awards granted by Citigroup since April 19, 2005 have been made pursuant to stockholder-approved stock incentive plans administered by the Personnel and Compensation Committee of the Citigroup Board of Directors, which is composed entirely of independent non-employee directors. Compensation expense related to annual incentive awards was $18 million and $17 million for the six months ended June 30, 2014 and 2013. For additional information on the Company’s incentive plans, refer to Note 2(n) to the annual Combined Financial Statements.
(16) Retirement and Postemployment Benefits
The Company participates in several noncontributory defined benefit pension plans sponsored by Citigroup covering certain U.S. employees. Citigroup’s U.S. qualified defined benefit plan was frozen effective January 1, 2008 for most employees. Accordingly, no additional compensation-based contributions were credited to the cash balance portion of the plan for existing plan participants after 2007. However, certain employees covered under the prior final pay plan formula continue to accrue benefits. The Company also participates in a number of noncontributory, nonqualified pension plans. These plans, which are unfunded, provide supplemental defined pension benefits to certain U.S. employees. With the exception of a few employees covered under the prior final average pay formulas, the benefits under these plans were frozen in prior years. The allocated share of the related benefit for these pension plans was $5 million and $4 million for the six months ended June 30, 2014, and 2013. These amounts are classified in Compensation and benefits expense on the Condensed Combined Statements of Income.
F-31
Table of Contents
The Company participates in postretirement health care and life insurance benefits offered by Citigroup to certain eligible U.S. retired employees. The allocated share of the related expense is classified in Compensation and benefits expense on the Condensed Combined Statements of Income and is not material to the results of operations for the six months ended June 30, 2014 and 2013.
The Company participates in postemployment plans sponsored by Citigroup that provide income continuation and health and welfare benefits to certain eligible U.S. employees on long-term disability. The allocated share of the related expense was $1 million and $2 million for the six months ended June 30, 2014 and 2013. These amounts are classified in Compensation and benefits expense on the Condensed Combined Statements of Income.
Citigroup sponsors defined contribution plans in the U.S. and in certain non-U.S. locations, all of which are administered in accordance with local laws. The most significant defined contribution plan is the Citigroup 401(k) Plan in the U.S. Under the Citigroup 401(k) plan, eligible U.S. employees received matching contributions of up to 6% of their eligible compensation for 2013 subject to statutory limits. Additionally, for eligible employees whose eligible compensation is $100,000 or less, a fixed contribution of up to 2% of eligible compensation is provided. All Company contributions are invested according to participants’ individual elections. The expense allocated to the Company for the Citigroup 401(k) plan amounted to approximately $8 million and $7 million for the six months ended June 30, 2014 and 2013. These amounts are classified in Compensation and benefits expense on the Condensed Combined Statements of Income and included in direct allocated costs. Refer to Note 14 for further discussion on direct allocated costs.
(17) Contingencies
In the ordinary course of business, the Company including its affiliates and subsidiaries, as well as its respective current and former officers, directors and employees, routinely are named as defendants in, or as parties to, various actual or threatened legal actions and proceedings. Certain of these actions and proceedings assert claims or seek relief in connection with alleged violations of consumer protection, lending, insurance, antifraud, anti-money laundering, employment and other statutory and common laws. Certain of these legal actions and proceedings may include claims for substantial or indeterminate compensatory or punitive damages, or for injunctive relief, and in some instances, seek recovery on a class wide basis.
In the ordinary course of business, the Company is also subject to governmental and regulatory examinations, information gathering requests, investigations and proceedings (both formal and informal), certain of which may result in adverse judgments, settlements, fines, penalties, restitutions, disgorgements, injunctions or other relief. In addition, the Company and certain of its affiliates and subsidiaries are regulated entities and, in those capacities, subject to regulation by various U.S. and state regulators. In connection with formal and informal inquiries by these regulators, the Company receives requests, subpoenas and orders seeking documents, testimony and other information in connection with various aspects of their regulated activities. The Company from time to time receives grand jury subpoenas and other requests for information or assistance, formal or informal, relating to the Company and its customers, from federal or state law enforcement agencies. The Company seeks to resolve all litigation and regulatory matters in the manner management believes is in the best interests of the Company and its shareholders, and contest liability, allegations of wrongdoing and, where applicable, the amount of damages or scope of any penalties or other relief sought as appropriate in each pending matter.
In connection with the possible separation from Citigroup, the Company may enter into an agreement with Citigroup under which the Company would indemnify Citigroup for all liabilities arising from activities (including origination and servicing), transactions and claims relating to the Company’s current or legacy businesses, whether now part of our business or part of Citigroup, including any liabilities from any sale by Citigroup or us of any such assets, but excluding liabilities arising out of servicing or other activities by Citigroup after January 1, 2014 with respect to the Citi Financial North America mortgage portfolio retained by Citigroup.
F-32
Table of Contents
In accordance with ASC 450, accruals are established for contingencies, including litigation and regulatory matters, when management believes it is probable that a loss has been incurred and the amount of the loss can be reasonably estimated. Once established, accruals are adjusted from time to time, as appropriate, in light of additional information. In view of the inherent unpredictability of litigation and regulatory matters, particularly where the damages sought are substantial or indeterminate, the investigations or proceedings are in the early stages, or the matters involve novel legal theories or a large number of parties, the Company cannot predict the timing or ultimate resolution of litigation and regulatory matters, and the actual costs of resolving litigation and regulatory matters may be substantially higher or lower than the amounts accrued for those matters.
The Company or its subsidiaries are named as defendants or otherwise directly involved in certain, but not all, of the matters disclosed below. Subject to the foregoing, it is the opinion of the Company’s management, based on current knowledge and after taking into account both current legal accruals, that the eventual outcome of the matters described in this Note would not be likely to have a material adverse effect on the Company’s financial condition. Nonetheless, given the substantial or indeterminate amounts sought in certain of these matters, and the inherent unpredictability of such matters, an adverse outcome in certain of these matters could, from time to time, have a material adverse effect on its results of operations or cash flows in particular periods.
West Virginia Consumer Finance Litigation
In 2006, Paul Lightner filed a counter-claim class action complaint seeking recovery under West Virginia’s Consumer Credit and Protection Act against CitiFinancial, Inc. (WV) for selling insurance with allegedly inflated premiums and for allegedly taking impermissible security interests in household goods. In 2008, the trial court certified a class under both claims and denied CitiFinancial, Inc.’s motion for summary judgment on both claims. CitiFinancial, Inc. appealed the denial of summary judgment on the insurance claim, and in 2009 the West Virginia Supreme Court reversed the trial court, and held that appropriateness of insurance rates was a matter to be decided by the West Virginia Insurance Commissioner. In 2010, the West Virginia Insurance Commissioner ruled in CitiFinancial, Inc. (WV)’s favor, and plaintiffs appealed this decision. In June, 2014, the West Virginia Supreme Court ruled in CitiFinancial, Inc. (WV)’s favor, and affirmed the decision of the Insurance Commissioner. The matter has been remanded back to the trial court, where a new Judge has been assigned to the matter. CitiFinancial, Inc. (WV) is subject to the prior Judge’s 2008 certification order, and is seeking to have the remaining claim for taking impermissible security interests in household goods decertified. Additional information concerning this matter is publicly available in court filings under Lightner v. CitiFinancial, Inc., Case No. 02-C0723 (Cir. Ct. Marshall Co. WV).
(18) Subsequent Events
On July 30, 2014, OMH completed the securitization of personal loans and formed OneMain Financial Issuance Trust 2014-2 (“OneMain Trust”) resulting in the issuance of $1.2 billion of Class A, Class B, Class C and Class D fixed rate notes collateralized by $1.3 billion of loans. The notes are due September 18, 2024 and may be optionally called by the OneMain Trust on or after July 18, 2016 at a redemption price equal to 101% of the aggregate note principal balance at the time of the optional call. The OneMain Trust will make payments of interest on the notes during the revolving period, which ends June 30, 2016, and make principal and interest payments thereafter. During the revolving period, additional loans may be transferred to the OneMain Trust. The loans are restricted from being sold or pledged as collateral and can only be used to pay the liabilities of the One Main Trust while the notes are outstanding. The parent of the OneMain Trust is OneMain Financial Funding II, LLC, which is a subsidiary of OneMain Financial Holdings, Inc. The OneMain Trust is a VIE consolidated by the Company as its primary beneficiary.
On July 25, 2014, CCC executed an agreement with a third party to maintain the loan processing technology infrastructure supporting the Company’s loans effective upon successful conversion to the third-party system. The infrastructure agreement has an initial five-year term and provides for payment based on a fixed fee per loan processed. If, once effective, the agreement is terminated without cause by CCC, OMH would be obligated to
F-33
Table of Contents
pay a termination fee of $26 million less any fees already paid under the agreement. On August 13, 2014 and in conjunction with the above infrastructure agreement, CCC also entered into an agreement to purchase professional services for converting the Company’s loans to the third-party loan processing system. The agreement provides for OMH to pay an estimated $7 million between August 13, 2014 and the date of converting the loans to the new system, which is currently expected to occur during the fourth quarter of 2015. If the agreement is terminated by CCC prior to conversion and without cause, OMH is obligated to pay a termination fee of approximately $9 million less any fees already paid under the agreement.
On July 1, 2014, CCC contributed all of the capital of OMFI, AHL and Triton to OMFH resulting in OMFH becoming the legal parent of the contributed entities. The contribution did not result in a change to the historical carrying value of the assets and liabilities of OMH.
F-34
Table of Contents

REPORT OF INDEPENDENT REGISTERED PUBLIC ACCOUNTING FIRM
The Board of Directors
OneMain Financial Holdings, Inc.:
We have audited the accompanying combined statements of financial position of OneMain Holdco (the “Company”) as of December 31, 2013 and 2012, and the related combined statements of income, comprehensive income, parent equity and cash flows for each of the years in the three-year period ended December 31, 2013. These combined financial statements are the responsibility of the Company’s management. Our responsibility is to express an opinion on these combined financial statements based on our audits.
We conducted our audits in accordance with the standards of the Public Company Accounting Oversight Board (United States). Those standards require that we plan and perform the audit to obtain reasonable assurance about whether the financial statements are free of material misstatement. An audit includes examining, on a test basis, evidence supporting the amounts and disclosures in the financial statements. An audit also includes assessing the accounting principles used and significant estimates made by management, as well as evaluating the overall financial statement presentation. We believe that our audits provide a reasonable basis for our opinion.
In our opinion, the combined financial statements referred to above present fairly, in all material respects, the financial position of OneMain Holdco as of December 31, 2013 and 2012, and the results of its operations and its cash flows for each of the years in the three-year period ended December 31, 2013, in conformity with U.S. generally accepted accounting principles.
/s/ KPMG LLP
Baltimore, Maryland
September 30, 2014
F-35
Table of Contents
Combined Statements of Income
Years ended December 31, 2013, 2012 and 2011
(In millions of dollars)
| 2013 | 2012 | 2011 | ||||||||||
| Revenue |
||||||||||||
| Finance interest and other charges |
$ | 1,953 | $ | 1,907 | $ | 2,251 | ||||||
| Investment revenue |
66 | 75 | 88 | |||||||||
|
|
|
|
|
|
|
|||||||
| Total interest revenue |
2,019 | 1,982 | 2,339 | |||||||||
| Interest expense |
228 | 264 | 676 | |||||||||
|
|
|
|
|
|
|
|||||||
| Net interest revenue |
1,791 | 1,718 | 1,663 | |||||||||
|
|
|
|
|
|
|
|||||||
| Other non-interest revenue: |
||||||||||||
| Insurance premiums |
353 | 379 | 400 | |||||||||
| Realized gain on sales and impairments of investments, net |
5 | 18 | 6 | |||||||||
| Other revenue |
140 | 156 | 94 | |||||||||
|
|
|
|
|
|
|
|||||||
| Total non-interest revenue |
498 | 553 | 500 | |||||||||
|
|
|
|
|
|
|
|||||||
| Total revenue, net of interest expense |
2,289 | 2,271 | 2,163 | |||||||||
|
|
|
|
|
|
|
|||||||
| Provisions for credit losses and for benefits and claims |
||||||||||||
| Provision for credit losses |
550 | 683 | 472 | |||||||||
| Policyholder benefits and claims |
151 | 167 | 193 | |||||||||
|
|
|
|
|
|
|
|||||||
| Total provisions for credit losses and for benefits and claims |
701 | 850 | 665 | |||||||||
|
|
|
|
|
|
|
|||||||
| Operating expenses: |
||||||||||||
| Compensation and benefits |
294 | 264 | 342 | |||||||||
| Technology and communications |
83 | 87 | 68 | |||||||||
| Occupancy |
75 | 81 | 75 | |||||||||
| Advertising and marketing |
66 | 67 | 83 | |||||||||
| Other operating |
225 | 291 | 238 | |||||||||
|
|
|
|
|
|
|
|||||||
| Total operating expenses |
743 | 790 | 806 | |||||||||
|
|
|
|
|
|
|
|||||||
| Income from continuing operations before income taxes |
845 | 631 | 692 | |||||||||
| Provision for income taxes |
309 | 224 | 234 | |||||||||
|
|
|
|
|
|
|
|||||||
| Income from continuing operations |
536 | 407 | 458 | |||||||||
|
|
|
|
|
|
|
|||||||
| Discontinued operations: |
||||||||||||
| Loss from discontinued operations |
— | — | (230 | ) | ||||||||
| Benefit for income taxes |
— | — | (90 | ) | ||||||||
|
|
|
|
|
|
|
|||||||
| Loss from discontinued operations |
— | — | (140 | ) | ||||||||
|
|
|
|
|
|
|
|||||||
| Net income |
$ | 536 | $ | 407 | $ | 318 | ||||||
|
|
|
|
|
|
|
|||||||
Refer to the Notes to Combined Financial Statements.
F-36
Table of Contents
Combined Statements of Comprehensive Income
Years ended December 31, 2013, 2012 and 2011
(In millions of dollars)
| 2013 | 2012 | 2011 | ||||||||||
| Net income |
$ | 536 | $ | 407 | $ | 318 | ||||||
| Other comprehensive income (loss): |
||||||||||||
| Net change in unrealized gains and losses on investment securities, net of taxes |
(36 | ) | 9 | 2 | ||||||||
| Net change in foreign currency translation adjustment, net of taxes |
(2 | ) | (1 | ) | (1 | ) | ||||||
|
|
|
|
|
|
|
|||||||
| Total other comprehensive income (loss) |
(38 | ) | 8 | 1 | ||||||||
|
|
|
|
|
|
|
|||||||
| Comprehensive income |
$ | 498 | $ | 415 | $ | 319 | ||||||
|
|
|
|
|
|
|
|||||||
Refer to the Notes to Combined Financial Statements.
F-37
Table of Contents
Combined Statements of Financial Position
December 31, 2013 and 2012
(In millions of dollars)
| 2013 | 2012 | |||||||
| Assets |
||||||||
| Cash and cash equivalents (including restricted cash of $188 and $206) |
$ | 319 | $ | 369 | ||||
| Investments (at fair value) |
1,431 | 1,507 | ||||||
| Consumer finance receivables: |
||||||||
| Loans and accrued interest receivable |
10,100 | 9,859 | ||||||
| Unearned revenue and deferred costs |
(1,433 | ) | (1,298 | ) | ||||
| Unearned premium and claim reserves |
(416 | ) | (394 | ) | ||||
| Allowance for loan losses |
(676 | ) | (686 | ) | ||||
|
|
|
|
|
|||||
| Net consumer finance receivables |
7,575 | 7,481 | ||||||
| Deferred tax assets, net |
256 | 221 | ||||||
| Intangible assets |
82 | 95 | ||||||
| Premises and equipment, net |
21 | 28 | ||||||
| Other assets |
152 | 162 | ||||||
|
|
|
|
|
|||||
| Total assets |
$ | 9,836 | $ | 9,863 | ||||
|
|
|
|
|
|||||
| Liabilities and Parent Equity |
||||||||
| Related party debt |
$ | 5,894 | $ | 6,037 | ||||
| Insurance policy and claim reserves |
483 | 505 | ||||||
| Income taxes payable |
539 | 721 | ||||||
| Accounts payable, accrued expenses and other liabilities |
73 | 74 | ||||||
|
|
|
|
|
|||||
| Total liabilities |
6,989 | 7,337 | ||||||
| Contingencies (Note 16) |
||||||||
| Parent Equity: |
||||||||
| Net Parent investment |
2,803 | 2,444 | ||||||
| Accumulated other comprehensive income |
44 | 82 | ||||||
|
|
|
|
|
|||||
| Total Parent equity |
2,847 | 2,526 | ||||||
|
|
|
|
|
|||||
| Total liabilities and Parent equity |
$ | 9,836 | $ | 9,863 | ||||
|
|
|
|
|
|||||
Refer to the Notes to Combined Financial Statements.
F-38
Table of Contents
Combined Statements of Parent Equity
Years ended December 31, 2013, 2012 and 2011
(In millions of dollars)
| Net Parent investment |
Accumulated other comprehensive income |
Total Parent equity |
||||||||||
| Balance, January 1, 2011 |
$ | 2,888 | $ | 73 | $ | 2,961 | ||||||
| Net income |
318 | — | 318 | |||||||||
| Transfers to Parent, net |
(653 | ) | — | (653 | ) | |||||||
| Stock based compensation |
1 | — | 1 | |||||||||
| Dividends |
(130 | ) | — | (130 | ) | |||||||
| Other comprehensive income, net of taxes |
— | 1 | 1 | |||||||||
|
|
|
|
|
|
|
|||||||
| Balance, December 31, 2011 |
$ | 2,424 | $ | 74 | $ | 2,498 | ||||||
|
|
|
|
|
|
|
|||||||
| Net income |
407 | — | 407 | |||||||||
| Transfers from Parent |
7 | — | 7 | |||||||||
| Dividends |
(394 | ) | — | (394 | ) | |||||||
| Other comprehensive income, net of taxes |
— | 8 | 8 | |||||||||
|
|
|
|
|
|
|
|||||||
| Balance, December 31, 2012 |
$ | 2,444 | $ | 82 | $ | 2,526 | ||||||
|
|
|
|
|
|
|
|||||||
| Net income |
536 | — | 536 | |||||||||
| Transfers from Parent |
6 | — | 6 | |||||||||
| Dividends |
(183 | ) | — | (183 | ) | |||||||
| Other comprehensive loss, net of taxes |
— | (38 | ) | (38 | ) | |||||||
|
|
|
|
|
|
|
|||||||
| Balance, December 31, 2013 |
$ | 2,803 | $ | 44 | $ | 2,847 | ||||||
|
|
|
|
|
|
|
|||||||
Refer to the Notes to Combined Financial Statements.
F-39
Table of Contents
Combined Statements of Cash Flows
Years ended December 31, 2013, 2012 and 2011
(In millions of dollars)
| 2013 | 2012 | 2011 | ||||||||||
| Cash flows from operating activities: |
||||||||||||
| Net income |
$ | 536 | $ | 407 | $ | 318 | ||||||
| Adjustments to reconcile income to net cash from operating activities: |
||||||||||||
| Realized gain on sales of investments |
(6 | ) | (21 | ) | (9 | ) | ||||||
| Impairments of investments |
1 | 3 | 3 | |||||||||
| Provision for credit losses |
550 | 683 | 718 | |||||||||
| Depreciation and amortization |
36 | 62 | 64 | |||||||||
| Deferred tax benefit |
(18 | ) | (96 | ) | (37 | ) | ||||||
| Net changes in other assets and liabilities |
(104 | ) | 120 | 178 | ||||||||
|
|
|
|
|
|
|
|||||||
| Net cash provided by operating activities |
995 | 1,158 | 1,235 | |||||||||
|
|
|
|
|
|
|
|||||||
| Cash flows from investing activities: |
||||||||||||
| Investments: |
||||||||||||
| Net decrease (increase) in short-term investments |
41 | 17 | (43 | ) | ||||||||
| Purchases of investments |
(321 | ) | (361 | ) | (379 | ) | ||||||
| Proceeds from sales of investments |
72 | 363 | 133 | |||||||||
| Proceeds from maturities of investments |
224 | 268 | 275 | |||||||||
| Consumer finance receivables: |
||||||||||||
| Originations of consumer finance receivables(1) |
(3,175 | ) | (2,692 | ) | — | |||||||
| Repayments of consumer finance receivables |
2,444 | 2,528 | — | |||||||||
|
|
|
|
|
|
|
|||||||
| Net (originations) repayments of consumer finance receivables(2) |
(731 | ) | (164 | ) | (26 | ) | ||||||
| Purchase of consumer finance receivables |
— | (87 | ) | — | ||||||||
| Purchase of premises and equipment |
(4 | ) | (29 | ) | (16 | ) | ||||||
| Proceeds from sale of other real estate owned |
— | — | 2 | |||||||||
| Decrease (increase) in restricted cash |
18 | 76 | (282 | ) | ||||||||
|
|
|
|
|
|
|
|||||||
| Net cash (used in) provided by investing activities |
(701 | ) | 83 | (336 | ) | |||||||
|
|
|
|
|
|
|
|||||||
| Cash flows from financing activities: |
||||||||||||
| Repayments of short-term borrowings |
— | (750 | ) | — | ||||||||
| Repayments of long-term debt |
— | (2,500 | ) | — | ||||||||
| Net (decrease) increase in related party debt |
(143 | ) | 2,399 | (678 | ) | |||||||
| Net decrease in net Parent investment |
(183 | ) | (394 | ) | (236 | ) | ||||||
|
|
|
|
|
|
|
|||||||
| Net cash used in financing activities |
(326 | ) | (1,245 | ) | (914 | ) | ||||||
|
|
|
|
|
|
|
|||||||
| Decrease in cash and cash equivalents |
(32 | ) | (4 | ) | (15 | ) | ||||||
| Cash and cash equivalents, beginning of year (excluding restricted cash of $206, $282 and $0) |
163 | 167 | 182 | |||||||||
|
|
|
|
|
|
|
|||||||
| Cash and cash equivalents, end of year (excluding restricted cash of $188, $206 and $282) |
$ | 131 | $ | 163 | $ | 167 | ||||||
|
|
|
|
|
|
|
|||||||
| Supplemental disclosure of cash flow information: |
||||||||||||
| Cash paid during the year for: |
||||||||||||
| Interest |
$ | 228 | $ | 277 | $ | 672 | ||||||
| Income taxes |
500 | 137 | 80 | |||||||||
| Supplemental schedule of noncash investing and financing activities: |
||||||||||||
| Transfers from Parent |
$ | 6 | $ | 7 | $ | — | ||||||
| Transfers to other real estate owned |
— | — | 7 | |||||||||
| Transfers to Parent, net |
— | — | (725 | ) | ||||||||
| (1) | Originations of consumer finance receivables are presented net of payoffs on loans that were refinanced into a new loan. |
| (2) | As a result of the business combination on July 1, 2011, separate loan origination and repayment information was not available for the full year 2011. Refer to Note 2(a) Basis of Presentation in the Notes to Combined Financial Statements for further discussion on the business combination. |
Refer to the Notes to Combined Financial Statements.
F-40
Table of Contents
NOTES TO COMBINED FINANCIAL STATEMENTS
(1) Organization and Business
The accompanying Combined Financial Statements primarily include the accounts of OneMain Financial Holdings, Inc. (“OMFH”), a holding company, OneMain Financial, Inc. (DE) (“OMFI”), American Health and Life Insurance Company (“AHL”) and Triton Insurance Company (“Triton”), (collectively “OneMain Holdco” or “OMH”), each a wholly owned subsidiary of CitiFinancial Credit Company (“CCC” or “Parent”), a wholly owned subsidiary of Associates First Capital Corporation (“Associates”), an indirect subsidiary of Citigroup Inc. (“Citigroup”). All references in these Notes to Combined Financial Statements of “OMH,” “the Company,” or similar terms refer to OneMain Holdco and its combined entities. The operations of the combined entities are further described below.
OMFI was established on December 5, 2010 and commenced operations on July 1, 2011 upon the transfer of certain assets and activities from a network of affiliates (“the Network”). The Network was composed of two segments: (1) Full Service Network (“FSN”), which focuses on originating, refinancing and servicing of personal and home equity loans through a branch network; and (2) CitiFinancial Servicing (“CFS”), which focuses on providing specialized service to customers who would benefit from expanded support, including loan modifications or restructurings. On July 1, 2011, FSN was rebranded as OneMain Financial. OMFI ceased originating real estate loans as of June 1, 2012 and distributed its remaining real estate portfolio to its Parent on January 1, 2014. Refer to Note 17 for more information on this distribution.
AHL and Triton underwrite policies to the Company’s customers and underwrite and reinsure policies covering customers of Citigroup affiliates. Such policies include credit life, credit disability, credit involuntary unemployment (“IUI”), collateral protection, term life, accidental death and hospital indemnity policies. In addition, the Company is a full service administrator of debt protection products for customers of Citigroup affiliates.
The Company conducts its operations through two business segments: Lending and Insurance. In accordance with Financial Accounting Standards Board (“FASB”) Accounting Standards Codification (“ASC”) (Topic 280): Segment Reporting, operating segments represent components of an entity where discrete financial information is available and for which the operating results are regularly reviewed by the chief operating decision maker to determine resources to be allocated to a segment and assess its performance. Refer to Note 4 for additional information regarding the Company’s business segments.
(2) Summary of Significant Accounting Policies
(a) Basis of Presentation
The Combined Financial Statements have been prepared in accordance with generally accepted accounting principles in the United States of America (“GAAP”) and present the combined statements of financial position of OMH as of December 31, 2013 and 2012 and the related combined statements of income, comprehensive income, Parent equity and cash flows of OMH for each of the years in the three-year period ended December 31, 2013. All significant intercompany balances and transactions between the legal entities that comprise OMH have been eliminated.
The July 1, 2011 transfer of certain assets of the Network to OMFI, as noted in Note 1 above, constituted a business combination between entities under common control with OMFI as the receiving entity and was accounted for in accordance with ASC 805-50-45 Business Combinations, Other Presentation Matters, Transactions Between Entities Under Common Control. ASC 805-50-45 requires the results of operations of the receiving entity, when the transfer occurs between entities under common control, to be retrospectively adjusted as if the transfer had occurred at the beginning of the period presented. Accordingly, these combined financial statements give retroactive effect to the business combination, with all periods presented as if the previously
F-41
Table of Contents
separate entities had always been combined. The activities and operations of the Network that were not transferred to OMFI and are not included in OMH after July 1, 2011, are reflected in OMH’s Combined Financial Statements as a July 1, 2011 distribution to its parent, CCC.
The operations of CFS and certain insurance operations that were included in the distribution to CCC on July 1, 2011, qualified as discontinued operations in accordance with ASC 205-20 Presentation of Financial Statements—Discontinued Operations. The operating results related to these operations are reflected as discontinued operations in the period ended December 31, 2011. Refer to Note 3 for further information related to discontinued operations.
The Combined Financial Statements include expense allocations to and from affiliates for certain costs of support functions provided on a centralized basis within Citigroup. Such allocations primarily relate to employee benefits, technology, operations and global functions such as finance, human resources, legal and compliance. Certain of these expenses were incurred directly, rather than allocated, following a transfer of employees from CCC to OMH, in 2013. Management believes the basis on which the expenses have been allocated to be a reasonable reflection of the utilization of services provided to or the benefits received by OMH during the periods presented. The allocations may not, however, reflect the expenses OMH would have incurred as a stand-alone company for the periods presented. Actual costs that may have been incurred if OMH had been a stand-alone company would depend on multiple factors, including organizational structure, which functions were outsourced or performed by employees and strategic decisions in various areas such as information technology and infrastructure. Refer to Note 15 for further discussion of these expense allocations.
The Combined Financial Statements included herein may not be indicative of the Company’s financial position, results of operations, and cash flows in the future, and also may not be indicative of the financial position, results of operations and cash flows had the Company been a separate, stand-alone entity during the periods presented.
The Combined Financial Statements reflect the combination of various legal entities that do not necessarily have a legal ownership relationship. As such, the Parent’s equity investment in the Company is presented as Net Parent investment in lieu of common stock, paid in capital and retained earnings.
While OMH is included in the consolidated U.S. federal and certain state income tax returns of Citigroup, the income tax provision in the Combined Statements of Income has been calculated as if OMH filed a separate tax return.
OMH consolidates entities deemed to be variable interest entities when OMH is determined to be the primary beneficiary.
(b) Use of Estimates
Management must make estimates and assumptions that affect the Combined Financial Statements and the related footnote disclosures. Such estimates are used in connection with certain fair value measurements. Refer to Note 14 for further discussions on estimates used in the determination of fair value. Moreover, estimates are significant in determining the amounts of other-than-temporary impairments (“OTTI”), provisions for probable and estimable losses that may arise from credit-related exposures, probable and estimable losses related to litigation and regulatory proceedings, insurance policy and claims reserves and tax reserves. While management uses its best judgment in making estimates, actual amounts or results could differ from those estimates. Current market conditions increase the risk and complexity of the judgments in these estimates.
(c) Cash and Cash Equivalents
Cash and cash equivalents include cash on deposit with banks and short-term, highly liquid investments with original maturities of three months or less. These short-term investments are carried at cost plus accrued
F-42
Table of Contents
interest, which approximates fair value. Cash and cash equivalents include $188 million and $206 million of restricted cash at December 31, 2013 and 2012. The cash is restricted for the use of the consolidated variable interest entities.
(d) Investments
Investments include fixed-income and equity securities. Fixed-income instruments primarily include mortgage-backed securities, corporate bonds, notes and redeemable preferred stocks. Equity securities include common and nonredeemable preferred stocks. All securities are classified as available-for-sale (“AFS”).
AFS securities are recorded at fair value. Unrealized holding gains and losses, net of the related tax effect on AFS securities, are excluded from earnings and reported as a component of accumulated other comprehensive income (“AOCI”) until realized. Realized gains and losses from the sale of AFS securities are determined on a specific identification basis and are recorded in earnings.
Premiums and discounts on debt securities are amortized or accreted over the life of the related AFS security as an adjustment to yield using the effective interest method. Such amortization and accretion are classified in Investment revenue on the Combined Statements of Income. Dividend and interest income are recognized when earned and included in Investment revenue on the Combined Statements of Income. For investments in fixed-income securities, accrual of interest income is suspended for investments that are in default or when collection is doubtful.
The Combined Statements of Income reflect the full impairment (that is, the difference between the security’s amortized cost basis and fair value) on debt securities that the Company intends to sell or would more-likely-than-not be required to sell before the expected recovery of the amortized cost basis. For AFS debt securities in a loss position that management has no intent to sell and believes that it more-likely-than-not will not be required to sell prior to recovery, only the credit loss component of the impairment is recognized in earnings, while the rest of the fair value loss is classified in AOCI on the Combined Statements of Financial Position. The credit loss component recognized in earnings is identified as the amount of principal cash flows not expected to be received over the remaining term of the security as projected using cash flow projections and base assumptions.
A decline in the market value of any AFS security below cost, that is deemed to be other-than-temporary, is recorded in earnings immediately. To determine whether impairment is other-than-temporary, the Company assessed each security for indications of credit impairment. Refer to Note 6 for further discussion on OTTI.
(e) Consumer Finance Receivables
Consumer finance receivables include loans which are reported at their outstanding unpaid principal balances reduced by any charge-off and net of any deferred fees or costs on originated loans, or unamortized premiums or discounts on purchased loans. In calculating net consumer finance receivables, consumer finance receivables are reduced by unearned revenue and deferred costs, allowance for loan losses and unearned insurance premium and claim reserves on certain collateral protection, credit life, credit IUI and credit disability policies related to the loans. Loan origination fees and certain direct origination costs are deferred and recognized as adjustments to income over the lives of the related loans. All loans are held for investment.
Interest income accrual ceases for personal loans when payments are 90 days contractually past due. If payments are made on a personal loan that reduces the loan’s contractual delinquency status to less than 90 days contractually past due, the accrual of income resumes. Cash receipts on nonaccruing loans are recorded either on a cash basis to income or entirely to the outstanding principal balance depending on the terms of the loan. Loans that have been modified to include a concession to a borrower who is in financial difficulty may not be accruing interest at the time of the modification. At least one payment under the new terms must be made to return the loan to accrual status.
F-43
Table of Contents
Charge-off policies follow the general guidelines below:
| • | Personal loans are charged off at the earlier of: (1) 180 days contractually past due if there have been no payments within the last six months; or (2) 360 days contractually past due; |
| • | Unsecured personal loans in bankruptcy are charged off in the month following 30 days contractual delinquency; and |
| • | Auto secured loans in bankruptcy are charged off at the earlier of: (1) 180 days contractually past due if there have been no payments within the last six months; or (2) 360 days contractually past due. |
The policies below relate to real estate loans, which were transferred to the Parent on January 1, 2014. Refer to Note 17.
| • | Loans secured by real estate were written down to the estimated value of the property, less costs to sell, at the earlier of: (1) the receipt of title; (2) the initiation of foreclosure (a process that commenced when payments were 120 days contractually past due); (3) when the loan was 180 days contractually past due if there were no payments within the past six months; or (4) 360 days contractually past due; |
| • | Loans secured by real estate, for which a decision was made not to foreclose on the loans, were charged off at the earlier of: (1) 180 days contractually past due if there were no payments within the last six months; or (2) 360 days contractually past due; and |
| • | Loans secured by real estate in Chapter 7 bankruptcy were written down to the estimated value of the property, less cost to sell, in the month following 60 days contractually past due. |
Charge-offs are recorded as a reduction to the allowance for loan losses and subsequent recoveries of previously charged-off amounts are credited to the allowance for loan losses.
Allowance for Loan Losses
An allowance for loan losses on finance receivables is maintained at an amount that represents management’s best estimate of probable losses inherent in its existing receivables portfolios. Losses on consumer finance receivables are recognized when incurred. The Company evaluates the loan portfolios for impairment quarterly. The allowance for non-troubled debt restructured loans is determined in accordance with ASC 450-20, Loss Contingencies, and established via a process that estimates these probable losses based upon various analyses. These include migration analysis, in which historical delinquency and credit loss experience is applied to the current aging of the portfolio, together with analyses that reflect current and anticipated economic conditions, including changes in housing prices and unemployment trends. Historical delinquency and credit loss experience is used to derive an expected loss probability, which is calculated by dividing the most recent six months average principal write-offs by the average of the six months of delinquencies on a lagged basis.
Provisions for loan losses are direct charges to income in amounts sufficient to maintain the allowance at a level management determines to be adequate to cover losses inherent in the portfolio. The allowance fluctuates based upon continual review of the loan portfolio and changes in economic conditions. Changes to the allowance for loan losses are classified in Provision for credit losses on the Combined Statements of Income.
Separate valuation allowances are determined for impaired loans whose terms have been modified in a troubled debt restructuring (“TDR”). Long-term modification programs, as well as short-term (less than 12 months) modifications from January 1, 2011 that provide concessions (such as interest rate reductions) to borrowers in financial difficulty, are reported as TDRs. Where short-term concessions have been granted prior to January 1, 2011, the allowance for loan losses is consistent with the requirements of ASC 310-10-35.
The allowance for loan losses for TDRs is determined in accordance with ASC 310-10-35, Receivables—Subsequent Measurement, considering all available evidence, including, as appropriate, the present
F-44
Table of Contents
value of the expected future cash flows of the loans discounted at the loans’ original effective interest rates or the estimated fair value of the collateral less disposal costs. These expected cash flows incorporate modification program default rate assumptions.
Finance Interest and Other Charges
Finance-related interest and other charges are recognized as income using the level-yield method. Fees received and direct costs incurred for the origination of loans are deferred and amortized over the contractual lives of the receivables as part of interest income. The remaining unamortized balances are reflected in interest income at the time that the receivables are paid in full or renewed, or reflected in credit losses when the receivables are partially or fully charged off.
(f) Premises and Equipment
Premises and equipment are stated at cost less accumulated depreciation and amortization. Depreciation is computed using the straight-line method over the estimated useful life of three to 10 years for equipment. Amortization of leasehold improvements is computed using the straight-line method over the shorter of the useful life of five to 15 years or the term of the related lease.
Computer software and development costs incurred in connection with developing or obtaining computer software for internal use are capitalized and amortized over a useful life of three to five years.
Premises and equipment are tested for impairment annually and when events or changes in circumstances indicate that the carrying value of such assets may not be recoverable. Impairment is recognized if the carrying amount is not recoverable and exceeds fair value of the asset.
(g) Intangible Assets
Intangible assets are composed of the present value of future profits (“PVFP”) of purchased insurance contracts in the Insurance segment and customer relationships in the Lending segment. The PVFP is subject to premium deficiency testing in accordance with ASC 944 Financial Services—Insurance. The PVFP is dynamically amortized over the lifetime of the block of business. Customer relationship intangibles are generally amortized on a straight-line basis over their estimated useful lives, which range from three to 20 years. Intangible assets subject to amortization are reviewed for impairment annually or whenever events or changes in circumstances indicate that the carrying amount may not be recoverable. Impairment is recognized if the carrying amount is not recoverable and exceeds the fair value of the intangible asset.
(h) Insurance
Insurance Premiums
Premiums from short-duration insurance contracts are earned over the related contract period. Short-duration contracts primarily include collateral protection, credit life, credit disability, and credit IUI policies. Credit insurance premiums that are billed monthly are recognized as revenue when billed. The Company defers single premium credit insurance premiums in Unearned premium and claim reserves. Unearned premiums on U.S. credit insurance are recognized as revenue on credit life using the sum-of-digits or actuarial methods, on credit disability using one-third pro-rata plus two-thirds sum-of-digits, on credit IUI using the mean of pro-rata and sum-of-digits, and on other collateral protection using the pro-rata method. For Canadian credit insurance, credit life unearned premiums are recognized as revenue using the sum-of-digits method, for credit disability the mean of pro-rata and sum-of-digits and for credit IUI the pro-rata method.
Premiums from long-duration contracts are earned when due from policyholders. Long-duration contracts include term life, accidental death and hospital indemnity policies. Benefits and expenses are associated with
F-45
Table of Contents
premiums by means of the provision for future policy benefits, unearned premiums and the deferral and amortization of policy acquisition costs. Premiums from reinsurance assumed are earned over the related contract period.
Unearned premium, policy and claim reserves related to OMH borrowers are netted in Consumer finance receivables. Unearned premium, policy and claim reserves related to non-OMH customers are classified as liabilities in Insurance policy and claim reserves on the Combined Statements of Financial Position.
Commissions on ancillary insurance products are recorded net of estimated refunds based on historical cancellation rates. These commissions are classified in Other revenue on the Combined Statements of Income.
Insurance Policy and Claim Reserves
The liabilities for future policy benefits for long-duration policies are calculated in accordance with principles set forth in ASC 944, Financial Services-Insurance. Mortality, morbidity, lapse and yield assumptions were set at the time of issue for each issue year of business and are not changed in future valuation periods.
The policy reserves for credit life, credit disability, credit IUI and collateral protection insurance equal related unearned premiums.
Claim reserves for losses are based on claims experience, actual claims reported and estimates of claims incurred but not reported. Assumptions are based on historical experience, adjusted to provide for possible adverse deviation. These estimates are periodically reviewed and compared with actual experience and industry standards, and revised if it is determined that future experience will differ substantially from that previously assumed. Since the reserves are based on estimates, the ultimate liability may be more or less than such reserves.
The effects of changes in such estimated reserves are classified in Policyholder benefits and claims on the Combined Statements of Income in the period in which the estimates are changed.
Acquisition Costs
The Company defers insurance policy acquisition costs (primarily commissions on acquired blocks and premium taxes). The Company classifies deferred policy acquisition costs in Other assets on the Combined Statements of Financial Position and amortizes these costs at a policy level over the term of the related policies, whether directly written or reinsured.
(i) Advertising
Advertising costs are expensed as incurred except for certain insurance direct mail and related expenses attributed to successful written premiums. These costs are capitalized into deferred acquisition costs (“DAC”) in Other assets in the Combined Statements of Financial Position.
(j) Income Taxes
The Company is included in the consolidated U.S. federal and state income tax returns of Citigroup, where applicable, but also files certain separate state and foreign income tax returns. The tax provision and current and deferred tax balances have been presented on a separate company basis as if the Company were a separate filer. The Company recognizes the current and deferred tax consequences of all transactions that have been recognized in the combined financial statements using the provisions of the enacted tax laws. Deferred tax assets and liabilities are determined based on differences between the financial reporting and tax basis of assets and liabilities and are measured using the enacted tax laws and rates that will be in effect when the differences are expected to reverse. The Company is subject to the income tax laws of the United States, its states and local municipalities and the Canadian jurisdictions in which it operates. These tax laws are complex and are subject to
F-46
Table of Contents
differing interpretations by the taxpayer and the relevant governmental taxing authorities. Disputes over interpretations of the tax laws may be subject to review and adjudication by the court systems of the various tax jurisdictions or may be settled with the taxing authority upon audit.
In establishing a provision for income tax expense, the Company must make judgments and interpretations about the application of these inherently complex tax laws. The Company must also make estimates about when, in the future, certain items will affect taxable income in the various tax jurisdictions, both domestic and foreign. Deferred taxes are recorded for the future consequences of events that have been recognized in the combined financial statements or tax returns, based upon enacted tax laws and rates. Deferred tax assets and liabilities relate to temporary differences between the financial reporting and income tax bases of the Company’s assets and liabilities. Deferred income tax expense or benefit represents the expected increase or decrease to future tax payments as these temporary differences reverse over time. Deferred tax assets are recognized subject to management’s judgment that realization is more likely than not.
ASC 740 Income Taxes sets out a consistent framework to determine the appropriate level of tax reserves to maintain for uncertain tax positions. This interpretation uses a two-step approach wherein a tax benefit is recognized if a position is more-likely-than-not to be sustained. The amount of the benefit is then measured to be the highest tax benefit that is greater than 50% likely to be realized. ASC 740 also sets out disclosure requirements to enhance transparency of an entity’s tax reserves.
Refer to Note 11 to the Combined Financial Statements for a further discussion of the Company’s tax provision and related income tax assets and liabilities.
(k) Foreign Currency Translation
Assets and liabilities of foreign operations are translated from their functional currencies into U.S. dollars for reporting purposes using the period end spot foreign exchange rate. Revenues and expenses of foreign operations are translated monthly from their respective functional currencies into U.S. dollars at amounts that approximate weighted average exchange rates. The effects of those translation adjustments are classified in Accumulated other comprehensive income on the Combined Statements of Financial Position.
(l) Securitization
The Company securitizes personal loans from time to time. There are two key accounting determinations that must be made relating to securitizations. First a determination is made as to whether the securitization entity would be consolidated. Second, a determination is made as to whether the transfer of financial assets to the entity is considered a sale under GAAP. If the securitization entity is a variable interest entity (“VIE”), and the Company is determined to be the primary beneficiary, the VIE is consolidated. Refer to Note 2(m) for more information regarding VIEs.
Interests in the securitized and sold assets may be retained in the form of subordinated tranches, spread accounts and servicing rights. In the case of consolidated securitization entities, these retained interests are not reported on the Combined Statements of Financial Position; rather, the securitized loans remain on the Combined Statements of Financial Position. The Company consolidates its securitization entities.
(m) Variable Interest Entities
An entity is referred to as a VIE if it meets the criteria outlined in ASC 810, Consolidation, which are: (1) the entity’s equity is insufficient to permit the entity to finance its activities without additional subordinated financial support from other parties; or (2) the entity’s equity investors cannot make significant decisions about the entity’s operations or do not absorb their proportionate share of the expected losses or receive the expected returns of the entity. The Company is involved with VIEs through its loan securitization activities.
F-47
Table of Contents
In accordance with ASC 810, the Company consolidates a VIE when it has both the power to direct the activities that most significantly impact the VIE’s economic performance and an obligation to absorb losses, or a right to receive benefits from the entity that could be potentially significant to the VIE (that is, the Company is the primary beneficiary).
VIEs are continually monitored to determine if any events have occurred that could cause the VIE’s primary beneficiary status to change. These events include:
| • | Additional purchases or sales of variable interests by the Company or an unrelated third party, which cause the Company’s overall variable interest ownership to change; |
| • | Changes in contractual arrangements in a manner that reallocates expected losses and residual returns among the variable interest holders; |
| • | Changes in the party with power to direct activities of a VIE that most significantly affect the entity’s economic performance; and |
| • | Providing support to an entity that results in an implicit variable interest. |
(n) Incentive Compensation
The Company’s executives and employees participate in the Citigroup programs described below to the extent they meet the eligibility criteria established by Citigroup. The Company makes cash payments to reimburse Citigroup for the cost of the awards when shares are delivered to participants (the payments are based on market value of the vested stock awards at such time or the spread realized by the employee on an option exercise). The Company recognizes compensation expense for the awards as described below.
Annual Incentive Awards
Discretionary annual incentives are generally awarded in the first quarter of the calendar year based on the previous year’s performance. Awards valued at less than U.S. $100,000 (or local currency equivalent) are generally paid in the form of an immediate cash bonus. Pursuant to Citigroup policy and/or regulatory requirements, employees and officers with higher incentive award values are subject to mandatory deferrals of incentive pay and generally receive 25%-60% of their award in a combination of restricted or deferred stock and deferred cash awards. Certain employees are subject to reduced deferral requirements that apply to awards valued at less than U.S. $100,000 (or local currency equivalent).
Deferred annual incentive awards are generally delivered as two awards: a restricted or deferred stock award under Citigroup’s Capital Accumulation Program (“CAP”) and a deferred cash award. The applicable mix of CAP and deferred cash awards may vary based on the employee’s minimum deferral requirement and the country of employment. In some cases, the entire deferral will be in the form of either a CAP or deferred cash award.
Subject to certain exceptions (principally, for retirement-eligible employees), continuous employment within Citigroup is required to vest in CAP and deferred cash awards. Post-employment vesting by retirement-eligible employees and participants who meet other conditions is generally conditioned upon their refraining from competition with Citigroup during the remaining vesting period, unless the employment relationship has been terminated by Citigroup under certain conditions.
Generally, the CAP and deferred cash awards vest in equal annual installments over three-or four-year periods. Vested CAP awards are delivered in shares of Citigroup common stock. Dividend equivalent payments are paid to participants during the vesting period. Deferred cash awards are payable in cash and earn a fixed notional rate of interest that is paid only if and when the underlying principal award amount vests.
In January 2010 and January 2009, the percentages of total annual incentives awarded pursuant to CAP were reduced and instead awarded as deferred cash awards. The deferred cash awards are subject to two-year or four-
F-48
Table of Contents
year vesting schedules, but the other terms and conditions are the same as CAP awards made in those years. The deferred cash awards earn a return during the vesting period based on LIBOR; in 2010 only, a portion of the award was denominated as a stock unit, the value of which will fluctuate based on the price of Citigroup common stock. In both cases, only cash is delivered at vesting.
CAP awards made to certain employees in February 2013 and later, and deferred cash awards made to certain employees in January 2012, are subject to a formulaic performance-based vesting condition pursuant to which amounts otherwise scheduled to vest will be reduced based on the amount of any pre-tax loss by a participant’s business in the calendar year preceding the scheduled vesting date. For CAP awards made in February 2013 and later, a minimum reduction of 20% applies for the first dollar of loss.
Other incentive awards may be made on an annual or other regular basis pursuant to programs designed to retain and motivate certain employees who do not participate in Citigroup’s annual discretionary incentive award program.
Stock Award Programs
The Company participates in various Citigroup stock-based compensation programs. Citigroup grants restricted or deferred stock and/or deferred cash awards, as well as stock payments, as part of its discretionary annual incentive award programs involving a large segment of Citigroup’s employees worldwide, including certain of the Company’s employees.
Stock awards, deferred cash awards and grants of stock options may also be made at various times during the year to induce new hires to join OMH, or to high-potential employees as long-term retention awards.
Recipients of Citigroup stock awards generally do not have any stockholder rights until shares are delivered upon vesting or exercise, or after the expiration of applicable required holding periods. Recipients of restricted or deferred stock awards, however, may be entitled to receive dividends or dividend-equivalent payments during the vesting period. Recipients of restricted stock awards are generally entitled to vote the shares in their award during the vesting period. Once a stock award vests, the shares become freely transferable, unless the shares are subject to a restriction on sale or transfer for a specified period. Pursuant to a stock ownership commitment, certain executives have committed to holding most of their vested shares indefinitely.
The total expense recognized for stock awards represents the grant-date fair value of such awards, which is generally recognized as a charge to income ratably over the vesting period, except for awards for retirement-eligible employees. Whenever awards are made or are expected to be made to retirement-eligible employees, the charge to income is accelerated based on the dates the applicable conditions to retirement eligibility are or will be met. If the employee is retirement eligible on the grant date, the entire expense is recognized in the year prior to grant. For employees who become retirement eligible during the vesting period, expense is recognized from the grant date until eligibility conditions are met.
Stock Option Programs
As of 2009, Citigroup no longer grants stock options as part of its annual incentive award programs. All stock options are granted on Citigroup common stock with exercise prices that are no less than the fair market value at the time of grant.
On October 29, 2009, Citigroup made a broad-based option grant to employees worldwide, including the Company’s employees. The options have a six-year term and generally vested in three equal installments over three years, beginning on the first anniversary of the grant date. The options were awarded with an exercise price equal to the New York Stock Exchange (“NYSE”) closing price on the trading day immediately preceding the date of grant ($40.80).
F-49
Table of Contents
On April 20, 2010, Citigroup made an option grant to a group of employees who were not eligible for the October 29, 2009, broad-based grant. The options were awarded with an exercise price equal to the NYSE closing price of a share of Citigroup common stock on the trading day immediately preceding the date of grant ($48.80). The options vested in three annual installments beginning on October 29, 2010. The options have a six-year term.
The compensation expense related to the annual incentive cash awards was $9 million, $2 million and $3 million for the years ended December 31, 2013, 2012 and 2011. These amounts are classified in Compensation and benefits expense in the Combined Statements of Income. Compensation expense related to the above stock based award programs was not material to the results of operations for the years ended December 31, 2013, 2012 and 2011. In January 2013, certain shared services employees were transferred to the Company. Prior to such transfer, annual incentive awards related to those employees were allocated to the Company and included in Other operating expense in the Combined Statements of Income.
Variable Incentive Compensation
Citigroup has various incentive programs globally that are used to motivate and reward performance primarily in the areas of sales, operational excellence and customer satisfaction. These programs are reviewed on a periodic basis to ensure that they are structured appropriately, aligned to shareholder interests and adequately risk balanced. Variable incentive compensation programs for the Company are based on several metrics including targets related to loan volumes, delinquencies, collections and overall profitability at the branches and collection centers as well as insurance coverage per loan for the insurance business and branch audit results.
The compensation expense related to the above variable incentive compensation awards was $25 million, $18 million and $22 million for the years ended December 31, 2013, 2012 and 2011 and is classified in Compensation and benefits expense in the Combined Statements of Income.
(o) Retirement and Postemployment Benefits
The Company participates in several noncontributory defined benefit pension plans sponsored by Citigroup covering certain U.S. employees. Citigroup’s U.S. qualified defined benefit plan was frozen effective January 1, 2008 for most employees. Accordingly, no additional compensation-based contributions were credited to the cash balance portion of the plan for existing plan participants after 2007. However, certain employees covered under the prior final pay plan formula continue to accrue benefits. The Company also participates in a number of noncontributory, nonqualified pension plans. These plans, which are unfunded, provide supplemental defined pension benefits to certain U.S. employees. With the exception of a few employees covered under the prior final average pay formulas, the benefits under these plans were frozen in prior years. The allocated share of the related benefit for these pension plans was $8 million, $6 million and $5 million for the years ended December 31, 2013, 2012 and 2011. These amounts are classified in Compensation and benefits expense on the Combined Statements of Income.
The Company participates in postretirement health care and life insurance benefits offered by Citigroup to certain eligible U.S. retired employees. The allocated share of the related expense is classified in Compensation and benefits expense on the Combined Statements of Income and is not material to the results of operations for the years ended December 31, 2013, 2012 and 2011.
The Company participates in postemployment plans sponsored by Citigroup that provide income continuation and health and welfare benefits to certain eligible U.S. employees on long-term disability. The allocated share of the related expense was $3 million for each of the years ended December 31, 2013, 2012 and 2011. These amounts are classified in Compensation and benefits expense on the Combined Statements of Income.
F-50
Table of Contents
Citigroup sponsors defined contribution plans in the U.S. and in certain non-U.S. locations, all of which are administered in accordance with local laws. The most significant defined contribution plan is the Citigroup 401(k) Plan in the U.S. Under the Citigroup 401(k) plan, eligible U.S. employees received matching contributions of up to 6% of their eligible compensation for 2013, 2012 and 2011 subject to statutory limits. Additionally, for eligible employees whose eligible compensation is $100,000 or less, a fixed contribution of up to 2% of eligible compensation is provided. All Company contributions are invested according to participants’ individual elections. The expense allocated to the Company for the Citigroup 401(k) plan amounted to approximately $15 million, $17 million, and $19 million for the years ended December 31, 2013, 2012 and 2011. These amounts are classified in Compensation and benefits expense on the Combined Statements of Income and included in direct allocated costs. Refer to Note 15 for further discussion on direct allocated costs.
As a result of the business combination on July 1, 2011, as discussed in Note 2(a), comparable data was not available for the full year 2011 and certain assumptions were made to derive the 2011 allocated expenses related to retirement and postemployment benefits. The Company assumed the base employee fringe expense used to determine these amounts before the business combination correlated to the actual employee fringe expense incurred subsequent to the business combination. The Company believes this is a reasonable method for determining the above amounts related to 2011.
(p) Accounting Changes
Reclassification out of Accumulated Other Comprehensive Income
In February 2013, the FASB issued Accounting Standards Update (“ASU”) No. 2013-02, Comprehensive Income (Topic 220): Reporting of Amounts Reclassified out of Accumulated Other Comprehensive Income, which required new footnote disclosures of items reclassified from AOCI to net income. The requirements became effective in 2013. Refer to Note 12 for more information on items reclassified from AOCI.
Deferred Acquisition Costs
In October 2010, the FASB issued ASU No. 2010-26, Financial Services—Insurance (Topic 944): Accounting for Costs Associated with Acquiring or Renewing Insurance Contracts. The ASU amended the guidance for insurance entities that required deferral and subsequent amortization of certain costs incurred during the acquisition of new or renewed insurance contracts. The new guidance limited DAC to those costs directly related to the successful acquisition of insurance contracts; all other acquisition-related costs must be expensed as incurred. Under prior guidance, DAC consisted of those costs that vary with, and primarily relate to, the acquisition of insurance contracts.
The ASU became effective for the Company on January 1, 2012 and was adopted using the retrospective method. As a result of implementing the ASU, DAC was reduced by approximately $6 million, and a $2 million deferred tax asset was recorded with an offset to Net Parent investment of $4 million (net of tax) at December 31, 2010.
(q) Future Application of Accounting Standards
Revenue Recognition
In May 2014, the FASB issued ASU No. 2014-09, Revenue from Contracts with Customers (Topic 606). This ASU affects any entity that either enters into contracts with customers to transfer goods or services or enters into contracts for the transfer of nonfinancial assets unless those contracts are within the scope of other standards (e.g., insurance contracts or lease contracts). This ASU will supersede the revenue recognition requirements in Topic 605, Revenue Recognition, and most industry-specific guidance in GAAP. In addition, the existing requirements for the recognition of a gain or loss on the transfer of nonfinancial assets that are not in a
F-51
Table of Contents
contract with a customer (e.g., assets within the scope of Topic 360, Property, Plant, and Equipment, and intangible assets within the scope of Topic 350, Intangibles—Goodwill and Other) are amended to be consistent with the guidance on recognition and measurement (including the constraint on revenue) in this ASU.
The core principle of the guidance is that an entity should recognize revenue to depict the transfer of promised goods or services to customers in an amount that reflects the consideration to which the entity expects to be entitled in exchange for those goods or services.
The ASU is effective beginning January 1, 2017 with two methods of retrospective application permitted. Early application is not permitted. The Company is in the process of evaluating any potential impact of applying the ASU.
Discontinued Operations and Significant Disposals
The FASB issued ASU No. 2014-08, Presentation of Financial Statements (Topic 205) and Property, Plant, and Equipment (Topic 360), Reporting Discontinued Operations and Disclosures of Disposals of Components of an Entity (ASU 2014-08) in the second quarter of 2014. ASU 2014-08 changes the criteria for reporting discontinued operations while enhancing disclosures. Under the ASU, only disposals representing a strategic shift having a major effect on an entity’s operations and financial results, such as a disposal of a major geographic area, a major line of business or a major equity method investment may be presented as discontinued operations. Additionally, the ASU requires expanded disclosures about discontinued operations that will provide more information about the assets, liabilities, income, and expenses of discontinued operations. The Company elected to early-adopt the ASU on a prospective basis for all disposals (or classifications as held-for-sale) of components of an entity that occurred on or after April 1, 2014. As a result of the adoption of the ASU, fewer disposals will now qualify for reporting as discontinued operations; however, disclosure of the pre-tax income attributable to a disposal of a significant part of an organization that does not qualify for discontinued operations reporting is required. The effect of adopting the ASU is not expected to be material.
Presentation of an Unrecognized Tax Benefit When a Net Operating Loss Carryforward, a Similar Tax Loss, or a Tax Credit Carryforward Exists
In July 2013, the FASB issued ASU No. 2013-11, Income Taxes (Topic 740): Presentation of an Unrecognized Tax Benefit When a Net Operating Loss Carryforward, a Similar Tax Loss, or a Tax Credit Carryforward Exists (a consensus of the FASB Emerging Issues Task Force). As a result of applying this ASU, an unrecognized tax benefit should be presented as a reduction of a deferred tax asset for a net operating loss (“NOL”) or other tax credit carryforward when settlement in this manner is available under the tax law. The assessment of whether settlement is available under the tax law would be based on facts and circumstances as of the balance sheet reporting date and would not consider future events (e.g., upcoming expiration of related NOL carryforwards). This classification should not affect an entity’s analysis of the realization of its deferred tax assets. Gross presentation in the rollforward of unrecognized tax positions in the notes to the financial statements would still be required.
This ASU was effective for the Company on January 1, 2014 and will be applied on a prospective basis to all unrecognized tax benefits that exist at the effective date. The effect of adopting this ASU is not expected to be material.
Accounting for Financial Instruments—Credit Losses
In December 2012, the FASB issued a proposed ASU, Financial Instruments-Credit Losses. This proposed ASU, or exposure draft, was issued for public comment in order to allow stakeholders the opportunity to review the proposal and provide comments to the FASB and does not constitute accounting guidance until such a final ASU is issued.
F-52
Table of Contents
The exposure draft contains proposed guidance developed by the FASB with the goal of improving financial reporting about expected credit losses on loans, securities and other financial assets held by banks, financial institutions and other public and private organizations. The exposure draft proposes a new accounting model intended to require earlier recognition of credit losses, while also providing additional transparency about credit risk.
The FASB’s proposed model would utilize a single “expected credit loss” measurement objective for the recognition of credit losses at the time the financial asset is originated or acquired, replacing the multiple existing impairment models in GAAP, which generally require that a loss be “incurred” before it is recognized.
The FASB’s proposed model represents a significant departure from existing GAAP and may result in material changes to the Company’s accounting for financial instruments. The effect of the FASB’s final ASU to the Company’s Combined Financial Statements will be assessed when it is issued. The exposure draft does not contain a proposed effective date; this will be included in the final ASU, when issued.
Other Potential Amendments to Current Accounting Standards
The FASB and International Accounting Standards Board (“IASB”), either jointly or separately, are currently working on several major projects, including amendments to existing accounting standards governing financial instruments discussed above.
The FASB is working on a joint project with the IASB that would require substantially all leases to be capitalized on the balance sheet. Additionally, the FASB has issued a proposal on principal-agent considerations that would change the way the Company needs to evaluate whether to consolidate VIEs and non-VIE partnerships. The principal-agent consolidation proposal would require all VIEs, including those that are investment companies, to be evaluated for consolidation under the same requirements.
The FASB is deliberating a proposed ASU relating to the accounting for insurance contracts. The scope of the project has been limited to insurance entities and will focus on making targeted improvements to existing GAAP.
The initiatives referred to above may significantly affect the Company’s Combined Financial Statements. Upon completion of these initiatives, the Company will re-evaluate its accounting and disclosures. However, due to ongoing deliberations of the standard setters, the Company is currently unable to determine the effect of future amendments or proposals.
(3) Discontinued Operations
The operations of CFS and certain insurance operations that were included in the distribution to CCC on July 1, 2011, qualified as discontinued operations under ASC 205-20. Refer to Note 2(a) for more information on this transaction.
F-53
Table of Contents
The following table summarizes the assets and liabilities related to CFS and certain insurance operations included in the distribution to CCC on July 1, 2011:
| (in millions of dollars) | ||||
| Assets |
||||
| Cash and cash equivalents |
$ | 107 | ||
| Investments |
91 | |||
| Consumer finance receivables |
8,606 | |||
| Allowance for loan losses |
(1,311 | ) | ||
| Other assets |
2,165 | |||
|
|
|
|||
| Total assets |
9,658 | |||
|
|
|
|||
| Liabilities |
||||
| Due to Parent |
8,898 | |||
| Accounts payable, accrued expenses and other liabilities |
191 | |||
|
|
|
|||
| Total liabilities |
9,089 | |||
|
|
|
|||
| Net carrying value of assets and liabilities |
$ | 569 | ||
|
|
|
|||
The following table summarizes results of discontinued operations for the period ended June 30, 2011:
| (in millions of dollars) | ||||
| Revenue |
$ | 412 | ||
| Expenses |
642 | |||
|
|
|
|||
| Loss from discontinued operations before benefit for income taxes |
(230 | ) | ||
| Benefit for income taxes |
(90 | ) | ||
|
|
|
|||
| Loss from discontinued operations |
$ | (140 | ) | |
|
|
|
|||
(4) Business Segments
The Company evaluates the results of its operations through two reportable segments: Lending and Insurance. The Lending segment primarily originates, services and, from time to time, securitizes secured and unsecured personal loans. The Lending segment also includes real estate loans. Prior to January 6, 2014, the Company serviced real estate loans to nonprime consumers through the Company’s community-based branch network. The business ceased originating real estate loans as of June 1, 2012 and transferred its remaining real estate loans to an affiliate on January 1, 2014.
The Insurance segment writes or reinsures credit life, credit disability, credit IUI, collateral protection, term life, accidental death, and hospital indemnity policies.
The chief operating decision maker evaluates the operating results and performance of the Lending and Insurance segments through Income from continuing operations before income taxes.
F-54
Table of Contents
The following table summarizes certain information by segment for the three years ended December 31, 2013, 2012 and 2011:
| Net interest revenue | Operating expenses | Income from continuing operations before income taxes |
||||||||||||||||||||||||||||||||||
| 2013 | 2012 | 2011 | 2013 | 2012 | 2011 | 2013 | 2012 | 2011 | ||||||||||||||||||||||||||||
| (in millions of dollars) | ||||||||||||||||||||||||||||||||||||
| Lending |
$ | 1,725 | $ | 1,643 | $ | 1,575 | $ | 663 | $ | 703 | $ | 703 | $ | 682 | $ | 443 | $ | 503 | ||||||||||||||||||
| Insurance |
66 | 75 | 88 | 120 | 127 | 124 | 163 | 188 | 189 | |||||||||||||||||||||||||||
| Intersegment eliminations and reclassifications |
— | — | — | (40 | )(1) | (40 | )(1) | (21 | )(1) | — | — | — | ||||||||||||||||||||||||
|
|
|
|
|
|
|
|
|
|
|
|
|
|
|
|
|
|
|
|||||||||||||||||||
| Total |
$ | 1,791 | $ | 1,718 | $ | 1,663 | $ | 743 | $ | 790 | $ | 806 | $ | 845 | $ | 631 | $ | 692 | ||||||||||||||||||
|
|
|
|
|
|
|
|
|
|
|
|
|
|
|
|
|
|
|
|||||||||||||||||||
| (1) | Represents commissions charged to the Insurance segment by the Lending segment for insurance products sold through the Lending branch network, which are eliminated in combination. Prior to July 1, 2011, the commissions were paid to an outside affiliate. |
The following table summarizes total assets by segment at December 31, 2013 and 2012:
| Total assets | ||||||||
| 2013 | 2012 | |||||||
| (in millions of dollars) | ||||||||
| Lending |
$ | 8,676 | $ | 8,575 | ||||
| Insurance |
1,576 | 1,682 | ||||||
| Intersegment eliminations and reclassifications(1) |
(416 | ) | (394 | ) | ||||
|
|
|
|
|
|||||
| Total |
$ | 9,836 | $ | 9,863 | ||||
|
|
|
|
|
|||||
| (1) | Represents unearned premium and claim reserves related to OMH customers that is managed as a liability for managed segment reporting purposes. |
Most of the revenue generated by the Company’s business segments is derived from U.S. clients. Neither business segment earned revenue from a single external customer that was 10% or more of total combined revenue.
(5) Interest Revenue and Expense
The following table summarizes interest revenue, interest expense and provision for credit losses for the years ended December 31, 2013, 2012 and 2011:
| 2013 | 2012 | 2011 | ||||||||||
| (in millions of dollars) | ||||||||||||
| Interest revenue: |
||||||||||||
| Finance interest and other charges |
$ | 1,953 | $ | 1,907 | $ | 2,251 | ||||||
| Investment revenue |
66 | 75 | 88 | |||||||||
|
|
|
|
|
|
|
|||||||
| Total interest revenue |
2,019 | 1,982 | 2,339 | |||||||||
| Interest expense: |
||||||||||||
| Related party debt |
228 | 173 | 606 | |||||||||
| Floating rate notes |
— | 91 | 70 | |||||||||
|
|
|
|
|
|
|
|||||||
| Total interest expense |
228 | 264 | 676 | |||||||||
|
|
|
|
|
|
|
|||||||
| Net interest revenue |
1,791 | 1,718 | 1,663 | |||||||||
| Provision for credit losses |
550 | 683 | 472 | |||||||||
|
|
|
|
|
|
|
|||||||
| Net interest revenue after provision for credit losses |
$ | 1,241 | $ | 1,035 | $ | 1,191 | ||||||
|
|
|
|
|
|
|
|||||||
F-55
Table of Contents
(6) Investments
The following tables summarize amortized cost, gross unrealized gains and losses and estimated fair value of investments classified as AFS at December 31, 2013 and 2012:
| 2013 | ||||||||||||||||
| Amortized cost |
Gross unrealized | Fair value |
||||||||||||||
| Gains | Losses | |||||||||||||||
| (in millions of dollars) | ||||||||||||||||
| Fixed maturity securities: |
||||||||||||||||
| Mortgage-backed securities: |
||||||||||||||||
| U.S. government agency guaranteed |
$ | 69 | $ | 5 | $ | — | $ | 74 | ||||||||
| Prime |
7 | — | — | 7 | ||||||||||||
| Commercial |
72 | 3 | — | 75 | ||||||||||||
|
|
|
|
|
|
|
|
|
|||||||||
| Total mortgage-backed securities |
148 | 8 | — | 156 | ||||||||||||
| U.S. Treasury and federal agency |
28 | — | 1 | 27 | ||||||||||||
| State and municipal |
33 | 1 | 1 | 33 | ||||||||||||
| Foreign government |
137 | 7 | 1 | 143 | ||||||||||||
| Corporate securities |
914 | 59 | 13 | 960 | ||||||||||||
| Other debt securities |
54 | — | 1 | 53 | ||||||||||||
|
|
|
|
|
|
|
|
|
|||||||||
| Total fixed maturity securities |
1,314 | 75 | 17 | 1,372 | ||||||||||||
| Equity securities |
36 | 9 | — | 45 | ||||||||||||
| Short-term and other securities |
14 | — | — | 14 | ||||||||||||
|
|
|
|
|
|
|
|
|
|||||||||
| Total investments |
$ | 1,364 | $ | 84 | $ | 17 | $ | 1,431 | ||||||||
|
|
|
|
|
|
|
|
|
|||||||||
| 2012 | ||||||||||||||||
| Amortized cost |
Gross unrealized | Fair value |
||||||||||||||
| Gains | Losses | |||||||||||||||
| (in millions of dollars) | ||||||||||||||||
| Fixed maturity securities: |
||||||||||||||||
| Mortgage-backed securities: |
||||||||||||||||
| U.S. government agency guaranteed |
$ | 77 | $ | 8 | $ | — | $ | 85 | ||||||||
| Prime |
11 | — | — | 11 | ||||||||||||
| Alt-A |
1 | — | — | 1 | ||||||||||||
| Commercial |
87 | 5 | — | 92 | ||||||||||||
|
|
|
|
|
|
|
|
|
|||||||||
| Total mortgage-backed securities |
176 | 13 | — | 189 | ||||||||||||
| U.S. Treasury and federal agency |
26 | — | — | 26 | ||||||||||||
| State and municipal |
16 | 1 | — | 17 | ||||||||||||
| Foreign government |
125 | 11 | — | 136 | ||||||||||||
| Corporate securities |
891 | 90 | 2 | 979 | ||||||||||||
| Other debt securities |
61 | — | 1 | 60 | ||||||||||||
|
|
|
|
|
|
|
|
|
|||||||||
| Total fixed maturity securities |
1,295 | 115 | 3 | 1,407 | ||||||||||||
| Equity securities |
36 | 9 | — | 45 | ||||||||||||
| Short-term and other securities |
55 | — | — | 55 | ||||||||||||
|
|
|
|
|
|
|
|
|
|||||||||
| Total investments |
$ | 1,386 | $ | 124 | $ | 3 | $ | 1,507 | ||||||||
|
|
|
|
|
|
|
|
|
|||||||||
F-56
Table of Contents
Management reviews the investment portfolio on a periodic basis to determine the cause of declines in the fair value of each security in an unrealized loss position. Evaluations of the causes of the unrealized losses are performed to determine whether the impairment is temporary or other-than-temporary in nature. Each investment security has been assessed for indications of credit impairment. Considerations such as recoverability of invested amount over a reasonable period of time, along with the factors considered in evaluating whether a loss is temporary, include:
| • | The length of time and the extent to which fair value has been below cost; |
| • | The severity of the impairment; |
| • | The cause of the impairment and the financial condition and near-term prospects of the issuer, including credit ratings and support from subordination for asset-backed securities; |
| • | Activity in the market of the issuer which may indicate adverse credit conditions; and |
| • | The Company’s ability and intent to hold the investment for a period of time sufficient to allow for any anticipated recovery. |
For fixed-maturity securities, including investment-grade perpetual preferred stocks, these considerations include management’s estimate of the probability of collecting amounts sufficient to recover the amortized cost basis of the security. For equity securities, these considerations reflect management’s ability and intent to hold the investment for a period of time sufficient to recover the cost basis of the security or whether it is more-likely-than-not that the Company will be required to sell the security prior to recovery of its cost basis.
Review for impairment generally includes:
| • | Identification and evaluation of investments that have indication of possible impairment; |
| • | Analysis of individual investments that have fair values less than amortized cost, including consideration of the length of time the investment has been in an unrealized loss position and the expected recovery period; |
| • | Discussion of evidential matter, including an evaluation of factors or triggers that could cause individual investments to qualify as having other-than-temporary impairment and those that would not support other-than-temporary impairment; and |
| • | Documentation of the results of these analyses, as required under business policies. |
As a result of this analysis, the Company recorded $1 million, $1 million and $2 million of pre-tax losses for OTTI of equity securities in the years ended December 31, 2013, 2012 and 2011, and the Company recorded $2 million and $1 million of pre-tax losses for OTTI of fixed-maturity securities in the years ended December 31, 2012 and 2011 both of which are classified in Realized gain on sales and impairments of investments, net on the Combined Statements of Income.
F-57
Table of Contents
Recognition and Measurement of OTTI
The following table summarizes the total OTTI recognized in earnings for the years ended December 31, 2013, 2012 and 2011:
| AFS(1) | ||||||||||||
| 2013 | 2012 | 2011 | ||||||||||
| (in millions of dollars) | ||||||||||||
| Impairment losses related to securities that the Company does not intend to sell nor will likely be required to sell: |
||||||||||||
| Total OTTI losses recognized during the year |
$ | 1 | $ | 4 | $ | 8 | ||||||
| Less: portion of impairment loss recognized in AOCI (before taxes) |
— | 1 | 5 | |||||||||
|
|
|
|
|
|
|
|||||||
| Net impairment losses recognized in earnings for securities that the Company does not intend to sell nor will likely be required to sell |
1 | 3 | 3 | |||||||||
| Impairment losses recognized in earnings for securities that the Company intends to sell or more-likely-than-not will be required to sell before recovery |
— | — | — | |||||||||
|
|
|
|
|
|
|
|||||||
| Total impairment losses recognized in earnings |
$ | 1 | $ | 3 | $ | 3 | ||||||
|
|
|
|
|
|
|
|||||||
| (1) | Includes OTTI on non-marketable equity securities. |
The following tables summarize a 12-month roll-forward of the credit-related impairments recognized in earnings for AFS debt securities held at December 31, 2013 and 2012 that the Company does not intend to sell nor likely will be required to sell:
| Cumulative OTTI credit losses recognized in earnings | ||||||||||||||||||||
| (in millions of dollars) | December 31, 2012 balance |
Credit impairments recognized in earnings on securities not previously impaired |
Credit impairments recognized in earnings on securities that have been previously impaired |
Reductions due to credit-impaired securities sold, transferred or matured |
December 31, 2013 balance |
|||||||||||||||
| AFS debt securities: |
||||||||||||||||||||
| Mortgage-backed securities |
$ | 1 | $ | — | $ | — | $ | — | $ | 1 | ||||||||||
| Foreign government securities |
— | — | — | — | — | |||||||||||||||
| Corporate |
3 | — | — | — | 3 | |||||||||||||||
| All other debt securities |
1 | — | — | — | 1 | |||||||||||||||
|
|
|
|
|
|
|
|
|
|
|
|||||||||||
| Total OTTI credit losses recognized for AFS debt securities |
$ | 5 | $ | — | $ | — | $ | — | $ | 5 | ||||||||||
|
|
|
|
|
|
|
|
|
|
|
|||||||||||
| Cumulative OTTI credit losses recognized in earnings | ||||||||||||||||||||
| (in millions of dollars) | December 31, 2011 balance |
Credit impairments recognized in earnings on securities not previously impaired |
Credit impairments recognized in earnings on securities that have been previously impaired |
Reductions due to credit-impaired securities sold, transferred or matured |
December 31, 2012 balance |
|||||||||||||||
| AFS debt securities: |
||||||||||||||||||||
| Mortgage-backed securities |
$ | 2 | $ | — | $ | — | $ | (1 | ) | $ | 1 | |||||||||
| Foreign government securities |
— | — | — | — | — | |||||||||||||||
| Corporate |
3 | 1 | 1 | (2 | ) | 3 | ||||||||||||||
| All other debt securities |
1 | — | — | — | 1 | |||||||||||||||
|
|
|
|
|
|
|
|
|
|
|
|||||||||||
| Total OTTI credit losses recognized for AFS debt securities |
$ | 6 | $ | 1 | $ | 1 | $ | (3 | ) | $ | 5 | |||||||||
|
|
|
|
|
|
|
|
|
|
|
|||||||||||
F-58
Table of Contents
The following table summarizes amortized cost and fair value by contractual maturities at December 31, 2013 and 2012:
| 2013 | 2012 | |||||||||||||||
| Amortized cost |
Fair value |
Amortized cost |
Fair value |
|||||||||||||
| (in millions of dollars) | ||||||||||||||||
| Mortgage-backed securities: |
||||||||||||||||
| Due within 1 year |
$ | — | $ | — | $ | — | $ | — | ||||||||
| After 1 but within 5 years |
3 | 3 | 3 | 3 | ||||||||||||
| After 5 but within 10 years |
3 | 3 | 6 | 6 | ||||||||||||
| After 10 years |
142 | 150 | 167 | 180 | ||||||||||||
|
|
|
|
|
|
|
|
|
|||||||||
| 148 | 156 | 176 | 189 | |||||||||||||
|
|
|
|
|
|
|
|
|
|||||||||
| U.S. Treasury and federal agency: |
||||||||||||||||
| Due within 1 year |
6 | 6 | 9 | 9 | ||||||||||||
| After 1 but within 5 years |
11 | 11 | 7 | 7 | ||||||||||||
| After 5 but within 10 years |
11 | 10 | 10 | 10 | ||||||||||||
| After 10 years |
— | — | — | — | ||||||||||||
|
|
|
|
|
|
|
|
|
|||||||||
| 28 | 27 | 26 | 26 | |||||||||||||
|
|
|
|
|
|
|
|
|
|||||||||
| State and municipal: |
||||||||||||||||
| Due within 1 year |
1 | 1 | 1 | 1 | ||||||||||||
| After 1 but within 5 years |
8 | 9 | 3 | 3 | ||||||||||||
| After 5 but within 10 years |
18 | 18 | 6 | 6 | ||||||||||||
| After 10 years |
6 | 5 | 6 | 7 | ||||||||||||
|
|
|
|
|
|
|
|
|
|||||||||
| 33 | 33 | 16 | 17 | |||||||||||||
|
|
|
|
|
|
|
|
|
|||||||||
| Foreign government: |
||||||||||||||||
| Due within 1 year |
10 | 10 | — | — | ||||||||||||
| After 1 but within 5 years |
72 | 76 | 71 | 77 | ||||||||||||
| After 5 but within 10 years |
55 | 57 | 52 | 57 | ||||||||||||
| After 10 years |
— | — | 2 | 2 | ||||||||||||
|
|
|
|
|
|
|
|
|
|||||||||
| 137 | 143 | 125 | 136 | |||||||||||||
|
|
|
|
|
|
|
|
|
|||||||||
| All other: |
||||||||||||||||
| Due within 1 year |
62 | 63 | 91 | 92 | ||||||||||||
| After 1 but within 5 years |
399 | 426 | 381 | 409 | ||||||||||||
| After 5 but within 10 years |
419 | 436 | 374 | 427 | ||||||||||||
| After 10 years |
88 | 88 | 106 | 111 | ||||||||||||
|
|
|
|
|
|
|
|
|
|||||||||
| 968 | 1,013 | 952 | 1,039 | |||||||||||||
|
|
|
|
|
|
|
|
|
|||||||||
| Total fixed maturity securities |
$ | 1,314 | $ | 1,372 | $ | 1,295 | $ | 1,407 | ||||||||
|
|
|
|
|
|
|
|
|
|||||||||
Actual maturities will differ from contractual maturities because borrowers may have the right to call or prepay obligations with or without call or prepayment penalties.
F-59
Table of Contents
The following tables summarize the fair value of investment securities that have been in an unrealized loss position for less than 12 months or for 12 months or longer at December 31, 2013 and 2012:
| 2013 | ||||||||||||||||||||||||
| Less than twelve months |
Twelve months or longer |
Total | ||||||||||||||||||||||
| Fair value |
Gross unrealized losses |
Fair value |
Gross unrealized losses |
Fair value |
Gross unrealized losses |
|||||||||||||||||||
| (in millions of dollars) | ||||||||||||||||||||||||
| Mortgage-backed securities |
$ | 28 | $ | — | $ | 3 | $ | — | $ | 31 | $ | — | ||||||||||||
| U.S. Treasury and federal agency |
12 | 1 | — | — | 12 | 1 | ||||||||||||||||||
| State and municipal |
20 | 1 | — | — | 20 | 1 | ||||||||||||||||||
| Foreign government |
26 | 1 | — | — | 26 | 1 | ||||||||||||||||||
| Corporate securities |
262 | 11 | 16 | 2 | 278 | 13 | ||||||||||||||||||
| Other debt securities |
17 | — | 6 | 1 | 23 | 1 | ||||||||||||||||||
|
|
|
|
|
|
|
|
|
|
|
|
|
|||||||||||||
| Total fixed maturity securities |
$ | 365 | $ | 14 | $ | 25 | $ | 3 | $ | 390 | $ | 17 | ||||||||||||
|
|
|
|
|
|
|
|
|
|
|
|
|
|||||||||||||
| 2012 | ||||||||||||||||||||||||
| Less than
twelve months |
Twelve months or longer |
Total | ||||||||||||||||||||||
| Fair value |
Gross unrealized losses |
Fair value |
Gross unrealized losses |
Fair value |
Gross unrealized losses |
|||||||||||||||||||
| (in millions of dollars) | ||||||||||||||||||||||||
| Mortgage-backed securities |
$ | 3 | $ | — | $ | 4 | $ | — | $ | 7 | $ | — | ||||||||||||
| State and municipal |
1 | — | — | — | 1 | — | ||||||||||||||||||
| Foreign government |
9 | — | — | — | 9 | — | ||||||||||||||||||
| Corporate securities |
59 | 1 | 10 | 1 | 69 | 2 | ||||||||||||||||||
| Other debt securities |
7 | — | 4 | 1 | 11 | 1 | ||||||||||||||||||
|
|
|
|
|
|
|
|
|
|
|
|
|
|||||||||||||
| Total fixed maturity securities |
$ | 79 | $ | 1 | $ | 18 | $ | 2 | $ | 97 | $ | 3 | ||||||||||||
|
|
|
|
|
|
|
|
|
|
|
|
|
|||||||||||||
Investment securities with unrealized losses for which an OTTI has not been recognized as of December 31, 2013 are principally composed of corporate securities and other debt securities (including asset-backed securities). There are 659 investment securities in a gross unrealized loss position, of which a fair value of $365 million has been impaired for less than 12 months and $25 million has been impaired for greater than 12 months as of December 31, 2013. The unrealized losses are due to increases in interest rates primarily as a result of widening of interest rate spreads reflecting an increase in risk premiums. The evidence considered by management in reaching the conclusion that the unrealized losses are not other-than-temporary include analyst views, financial performance of the issuers and underlying collateral, cash flow projections, ratings and rating downgrades, and available credit enhancements. Based on the analysis of the evidence, management has determined it is probable that the Company will collect all amounts due according to the contractual terms of the investment securities. The Company has no intent to sell the investment securities and believes it will not likely be required to sell the investment securities before recovery of the amortized cost basis.
F-60
Table of Contents
The following table summarizes sales proceeds, and Realized gain on sales and impairments of investments, net on the Combined Statements of Income for the years ended December 31, 2013, 2012 and 2011:
| 2013 | 2012 | 2011 | ||||||||||
| (in millions of dollars) | ||||||||||||
| Sales proceeds |
$ | 114 | $ | 363 | $ | 155 | ||||||
| Gross pre-tax gains (losses) on investment securities: |
||||||||||||
| Gains |
13 | 28 | 15 | |||||||||
| Losses |
(7 | ) | (7 | ) | (6 | ) | ||||||
|
|
|
|
|
|
|
|||||||
| Net pre-tax gains on investment securities |
6 | 21 | 9 | |||||||||
| OTTI |
(1 | ) | (3 | ) | (3 | ) | ||||||
|
|
|
|
|
|
|
|||||||
| Realized gain on sales and impairments of investments, net |
$ | 5 | $ | 18 | $ | 6 | ||||||
|
|
|
|
|
|
|
|||||||
(7) Consumer Finance Receivables
The following table summarizes consumer finance receivables at December 31, 2013 and 2012:
| 2013 | 2012 | |||||||
| (in millions of dollars) | ||||||||
| Personal loans |
$ | 8,112 | $ | 7,890 | ||||
| Home equity loans |
371 | 450 | ||||||
| Residential first mortgages |
92 | 107 | ||||||
|
|
|
|
|
|||||
| Total loans |
8,575 | 8,447 | ||||||
| Unearned premium and claim reserves |
(416 | ) | (394 | ) | ||||
| Accrued interest receivable |
92 | 114 | ||||||
|
|
|
|
|
|||||
| Consumer finance receivables(1) |
8,251 | 8,167 | ||||||
| Allowance for loan losses |
(676 | ) | (686 | ) | ||||
|
|
|
|
|
|||||
| Net consumer finance receivables |
$ | 7,575 | $ | 7,481 | ||||
|
|
|
|
|
|||||
| (1) | Presented net of unearned revenue and deferred costs of $1.4 billion and $1.3 billion at December 31, 2013 and 2012. |
Geographic diversification of consumer finance receivables reduces the concentration of credit risk associated with economic stresses in any one state. The Company’s entire personal loan portfolio is serviced within the U.S. At December 31, 2013 and 2012, no state or customer comprised more than 10% of the Company’s total consumer finance receivable balance.
Refer to Note 14 for further discussion on the fair value of consumer finance receivables. Refer to Note 15 for a discussion on the purchase of non-impaired personal loans from an affiliate.
Credit Quality Indicators
Credit quality indicators that are actively monitored include delinquency status, credit scores (“FICOs”) and loan to value (“LTV”) ratios.
Delinquency Status
Delinquency status is carefully monitored and considered a key indicator of credit quality. OMH considers a loan delinquent if a monthly payment has not been received by the close of business on the loan’s next due date. All loans are classified as nonaccrual when loan payments are 90 days contractually past due.
F-61
Table of Contents
The following tables summarize consumer finance receivables delinquencies and nonaccrual loans as of December 31, 2013 and 2012:
| 2013 | ||||||||||||||||
| Total current(1) |
30 - 89 days past due |
Greater than or equal to 90 days past due (Nonaccrual) |
Total loans | |||||||||||||
| (in millions of dollars) | ||||||||||||||||
| Personal loans |
$ | 7,780 | $ | 136 | $ | 196 | $ | 8,112 | ||||||||
| Home equity loans |
354 | 8 | 9 | 371 | ||||||||||||
| Residential first mortgages |
86 | 2 | 4 | 92 | ||||||||||||
|
|
|
|
|
|
|
|
|
|||||||||
| Total loans |
$ | 8,220 | $ | 146 | $ | 209 | $ | 8,575 | ||||||||
|
|
|
|
|
|
|
|
|
|||||||||
| 2012 | ||||||||||||||||
| Total current(1) |
30 - 89 days past due |
Greater than or equal to 90 days past due (Nonaccrual) |
Total loans | |||||||||||||
| (in millions of dollars) | ||||||||||||||||
| Personal loans |
$ | 7,570 | $ | 129 | $ | 191 | $ | 7,890 | ||||||||
| Home equity loans |
428 | 9 | 13 | 450 | ||||||||||||
| Residential first mortgages |
103 | 2 | 2 | 107 | ||||||||||||
|
|
|
|
|
|
|
|
|
|||||||||
| Total loans |
$ | 8,101 | $ | 140 | $ | 206 | $ | 8,447 | ||||||||
|
|
|
|
|
|
|
|
|
|||||||||
| (1) | Loans less than 30 days past due are presented as current. |
Credit Scores
Independent credit agencies rate an individual’s risk for assuming debt based on the individual’s credit history and assign every consumer a FICO credit score. These scores are continually updated by the agencies based upon an individual’s credit actions (e.g., taking out a loan, missed or late payments, etc.). FICO scores are updated monthly for substantially the entire portfolio or, otherwise, on a quarterly basis.
The following tables summarize details on FICO scores at December 31, 2013 and 2012:
| 2013 FICO | ||||||||||||||||
| Less than 620 |
Equal to or greater than 620 but less than 660 |
Equal to or greater than 660 |
Total loans | |||||||||||||
| (in millions of dollars) | ||||||||||||||||
| Personal loans |
$ | 3,533 | $ | 2,169 | $ | 2,410 | $ | 8,112 | ||||||||
| Home equity loans |
173 | 91 | 107 | 371 | ||||||||||||
| Residential first mortgages |
48 | 23 | 21 | 92 | ||||||||||||
|
|
|
|
|
|
|
|
|
|||||||||
| Total loans |
$ | 3,754 | $ | 2,283 | $ | 2,538 | $ | 8,575 | ||||||||
|
|
|
|
|
|
|
|
|
|||||||||
| 2012 FICO | ||||||||||||||||
| Less than 620 |
Equal to or greater than 620 but less than 660 |
Equal to or greater than 660 |
Total loans | |||||||||||||
| (in millions of dollars) | ||||||||||||||||
| Personal loans |
$ | 3,467 | $ | 2,052 | $ | 2,371 | $ | 7,890 | ||||||||
| Home equity loans |
219 | 109 | 122 | 450 | ||||||||||||
| Residential first mortgages |
55 | 28 | 24 | 107 | ||||||||||||
|
|
|
|
|
|
|
|
|
|||||||||
| Total loans |
$ | 3,741 | $ | 2,189 | $ | 2,517 | $ | 8,447 | ||||||||
|
|
|
|
|
|
|
|
|
|||||||||
F-62
Table of Contents
Loan to Value Ratios
LTV ratios (loan balance divided by appraised value) are calculated on real estate loans at origination and updated by applying market price data. LTV ratios are updated monthly using the most recent CoreLogic Home Pricing Index data available for substantially all of the portfolio applied at the Metropolitan Statistical Area level, if available; otherwise at the state level. The remainder of the portfolio is updated in a similar manner using the Federal Housing Finance Agency indices.
The following tables summarize details on the LTV ratios at December 31, 2013 and 2012:
| 2013 LTV | ||||||||||||||||
| Less than or equal to 80% |
Greater than 80% but less than or equal to 100% |
Greater than 100% |
Total real estate loans |
|||||||||||||
| (in millions of dollars) | ||||||||||||||||
| Home equity loans |
$ | 54 | $ | 312 | $ | 5 | $ | 371 | ||||||||
| Residential first mortgages |
73 | 19 | — | 92 | ||||||||||||
|
|
|
|
|
|
|
|
|
|||||||||
| Total real estate loans |
$ | 127 | $ | 331 | $ | 5 | $ | 463 | ||||||||
|
|
|
|
|
|
|
|
|
|||||||||
| 2012 LTV | ||||||||||||||||
| Less than or equal to 80% |
Greater than 80% but less than or equal to 100% |
Greater than 100% |
Total real estate loans |
|||||||||||||
| (in millions of dollars) | ||||||||||||||||
| Home equity loans |
$ | 66 | $ | 378 | $ | 6 | $ | 450 | ||||||||
| Residential first mortgages |
81 | 26 | — | 107 | ||||||||||||
|
|
|
|
|
|
|
|
|
|||||||||
| Total real estate loans |
$ | 147 | $ | 404 | $ | 6 | $ | 557 | ||||||||
|
|
|
|
|
|
|
|
|
|||||||||
Allowance for Loan Losses
The following table summarizes the change in the allowance for loan losses on consumer finance receivables for the years ended December 31, 2013, 2012 and 2011:
| 2013 | 2012 | 2011 | ||||||||||
| (in millions of dollars) | ||||||||||||
| Balance, January 1 |
$ | 686 | $ | 545 | $ | 2,652 | ||||||
| Provision for credit losses |
550 | 683 | 472 | |||||||||
| Amounts charged off |
(577 | ) | (561 | ) | (599 | ) | ||||||
| Recovery of amounts previously charged off |
43 | 29 | 25 | |||||||||
| Distribution to parent |
— | — | (278 | ) | ||||||||
| Changes due to discontinued operations |
— | — | (1,727 | ) | ||||||||
| Other(1) |
(26 | ) | (10 | ) | — | |||||||
|
|
|
|
|
|
|
|||||||
| Balance, December 31 |
$ | 676 | $ | 686 | $ | 545 | ||||||
|
|
|
|
|
|
|
|||||||
| Total loans(2) |
$ | 8,575 | $ | 8,447 | $ | 8,757 | ||||||
| Ratio of allowance for loan losses to total loans |
7.88 | % | 8.12 | % | 6.22 | % | ||||||
| (1) | The 2013 amount includes a non-provision transfer of reserves associated with deferred interest to accrued interest receivable which includes deferred interest. The 2012 amount relates to a transfer of real estate loans to an affiliate. Refer to Note 15. |
| (2) | Excludes unearned premium and claim reserves and accrued interest receivable. |
F-63
Table of Contents
The following table summarizes the allowance for loan losses and investment in loans at December 31, 2013 and 2012:
| 2013 | 2012 | |||||||
| (in millions of dollars) | ||||||||
| Allowance for loan losses: |
||||||||
| Determined in accordance with ASC 450-20 |
$ | 441 | $ | 445 | ||||
| Determined in accordance with ASC 310-10-35 |
235 | 241 | ||||||
|
|
|
|
|
|||||
| Total allowance for loan losses |
$ | 676 | $ | 686 | ||||
|
|
|
|
|
|||||
| Loans, net of unearned income: |
||||||||
| Non-TDR loans evaluated for impairment in accordance with ASC 450-20 |
$ | 8,036 | $ | 7,895 | ||||
| TDR loans evaluated for impairment in accordance with ASC 310-10-35 |
539 | 552 | ||||||
|
|
|
|
|
|||||
| Total loans |
$ | 8,575 | $ | 8,447 | ||||
|
|
|
|
|
|||||
Impaired Loans
Impaired loans are those for which the Company believes it is not probable that it will collect all amounts due according to the original contractual terms of the loan. Impaired loans include loans whose terms have been modified due to the borrower’s financial difficulties and the Company has granted a concession to the borrower. These modifications may include interest rate reductions and/or principal forgiveness. Impaired loans exclude loans that have not been modified and are carried on a nonaccrual basis. In addition, impaired loans exclude substantially all loans modified pursuant to the Company’s short-term modification programs (i.e., for periods of 12 months or less) that were modified prior to January 1, 2011. Loans included in these short-term programs amounted to $41 million and $105 million at December 31, 2013 and 2012.
The following tables summarize impaired loans at and for the years ended December 31, 2013, 2012 and 2011:
| At and for the year ended December 31, 2013 | ||||||||||||||||||||
| Recorded investment(1) |
Unpaid principal balance |
Related specific allowance(2) |
Average carrying value(3) |
Interest income recognized |
||||||||||||||||
| (in millions of dollars) | ||||||||||||||||||||
| Personal loans(5) |
$ | 476 | $ | 476 | $ | 212 | $ | 496 | $ | 91 | ||||||||||
| Home equity loans |
56 | 56 | 18 | 58 | 6 | |||||||||||||||
| Residential first mortgages |
7 | 7 | 5 | 5 | — | |||||||||||||||
|
|
|
|
|
|
|
|
|
|
|
|||||||||||
| Total impaired consumer finance receivables(4) |
$ | 539 | $ | 539 | $ | 235 | $ | 559 | $ | 97 | ||||||||||
|
|
|
|
|
|
|
|
|
|
|
|||||||||||
| At and for the year ended December 31, 2012 | ||||||||||||||||||||
| Recorded investment(1) |
Unpaid principal balance |
Related specific allowance(2) |
Average carrying value(3) |
Interest income recognized |
||||||||||||||||
| (in millions of dollars) | ||||||||||||||||||||
| Personal loans |
$ | 488 | $ | 488 | $ | 213 | $ | 476 | $ | 91 | ||||||||||
| Home equity loans |
61 | 61 | 28 | 58 | 7 | |||||||||||||||
| Residential first mortgages |
3 | 3 | — | 1 | — | |||||||||||||||
|
|
|
|
|
|
|
|
|
|
|
|||||||||||
| Total impaired consumer finance receivables(4) |
$ | 552 | $ | 552 | $ | 241 | $ | 535 | $ | 98 | ||||||||||
|
|
|
|
|
|
|
|
|
|
|
|||||||||||
F-64
Table of Contents
| At and for the year ended December 31, 2011 | ||||||||||||||||||||
| Recorded investment(1) |
Unpaid principal balance |
Related specific allowance(2) |
Average carrying value(3) |
Interest income recognized |
||||||||||||||||
| (in millions of dollars) | ||||||||||||||||||||
| Personal loans |
$ | 464 | $ | 465 | $ | 123 | $ | 399 | $ | 85 | ||||||||||
| Home equity loans |
61 | 62 | 17 | 57 | 6 | |||||||||||||||
| Residential first mortgages |
23 | 24 | 4 | 23 | 2 | |||||||||||||||
|
|
|
|
|
|
|
|
|
|
|
|||||||||||
| Total impaired consumer finance receivables(4) |
$ | 548 | $ | 551 | $ | 144 | $ | 479 | $ | 93 | ||||||||||
|
|
|
|
|
|
|
|
|
|
|
|||||||||||
| (1) | Recorded investment in Consumer finance receivables includes net deferred loan fees and costs, unamortized premium or discount and direct write-downs. |
| (2) | Classified in Allowance for loan losses on the Combined Statements of Financial Position. |
| (3) | Average carrying value represents the average recorded investment ending balance for the last four quarters and does not include related specific allowance. |
| (4) | Prior to 2008, the Company’s financial accounting systems did not separately track impaired loans whose terms were modified due to the borrowers’ financial difficulties, and it was determined that a concession was granted to the borrower. |
| (5) | Beginning in October 2013, impaired personal loans, which are TDRs, that have subsequently renewed into a new loan at current market terms, and for which the borrower is no longer experiencing financial difficulty, are no longer considered an impaired loan or a TDR at time of renewal. Management determined that it is impracticable to determine the effect of applying this change retrospectively to impaired loans presented prior to 2013. |
Troubled Debt Restructuring
The Company may make modifications to its loans for various reasons. Such modifications may result in long-term or short-term rate reductions and payment deferrals. When a modification is made to a borrower experiencing financial difficulty and in which the terms are considered below market terms for that borrower, the Company reports such modified loans as TDRs.
The following tables summarize TDR activity and default information at December 31, 2013, 2012 and 2011:
| (in millions of dollars except number of loans modified and average interest rate reduction) |
2013 | |||||||||||
| Number of loans modified |
Post-modification recorded investment |
Average interest rate reduction |
||||||||||
| Personal loans |
40,980 | $ | 293 | 5.02 | % | |||||||
| Home equity loans |
1,064 | 13 | 3.09 | % | ||||||||
| Residential first mortgages |
97 | 6 | 2.64 | % | ||||||||
|
|
|
|
|
|||||||||
| Total |
42,141 | $ | 312 | |||||||||
|
|
|
|
|
|||||||||
| 2012 | ||||||||||||
| Number of loans modified |
Post-modification recorded investment |
Average interest rate reduction |
||||||||||
| Personal loans |
37,233 | $ | 268 | 3.53 | % | |||||||
| Home equity loans |
1,931 | 24 | 1.73 | % | ||||||||
| Residential first mortgages |
32 | 2 | 2.07 | % | ||||||||
|
|
|
|
|
|||||||||
| Total |
39,196 | $ | 294 | |||||||||
|
|
|
|
|
|||||||||
F-65
Table of Contents
| 2011 | ||||||||||||
| Number of loans modified |
Post-modification recorded investment |
Average interest rate reduction |
||||||||||
| Personal loans |
38,119 | $ | 274 | 2.56 | % | |||||||
| Home equity loans |
1,429 | 20 | 2.82 | % | ||||||||
| Residential first mortgages |
54 | 5 | 3.38 | % | ||||||||
|
|
|
|
|
|||||||||
| Total |
39,602 | $ | 299 | |||||||||
|
|
|
|
|
|||||||||
The following table summarizes TDR loans for which a payment default (defined as 60 days past due) occurred within one year of the modification for the years ended December 31, 2013, 2012 and 2011:
| 2013 | 2012 | 2011 | ||||||||||
| (in millions of dollars) | ||||||||||||
| Personal loans |
$ | 61 | $ | 54 | $ | 31 | ||||||
| Home equity loans |
6 | 7 | — | |||||||||
| Residential first mortgages |
1 | — | 1 | |||||||||
|
|
|
|
|
|
|
|||||||
| Total |
$ | 68 | $ | 61 | $ | 32 | ||||||
|
|
|
|
|
|
|
|||||||
(8) Intangible Assets
The following table summarizes intangible assets at December 31, 2013 and 2012:
| 2013 | 2012 | |||||||||||||||||||||||
| Gross carrying amount |
Accumulated amortization |
Net carrying amount |
Gross carrying amount |
Accumulated amortization |
Net carrying amount |
|||||||||||||||||||
| (in millions of dollars) | ||||||||||||||||||||||||
| Present value of future profits |
$ | 226 | $ | (144 | ) | $ | 82 | $ | 226 | $ | (134 | ) | $ | 92 | ||||||||||
| Customer relationships |
91 | (91 | ) | — | 91 | (88 | ) | 3 | ||||||||||||||||
|
|
|
|
|
|
|
|
|
|
|
|
|
|||||||||||||
| Total intangible assets |
$ | 317 | $ | (235 | ) | $ | 82 | $ | 317 | $ | (222 | ) | $ | 95 | ||||||||||
|
|
|
|
|
|
|
|
|
|
|
|
|
|||||||||||||
Amortization expense was $13 million, $13 million and $17 million for the years ended December 31, 2013, 2012 and 2011 and is classified in Other operating expense on the Combined Statements of Income.
Annual impairment tests were performed and no intangible assets were deemed impaired.
The following table summarizes future amortization expense related to intangible assets at December 31, 2013:
| (in millions of dollars) | ||||
| 2014 |
$ | 10 | ||
| 2015 |
11 | |||
| 2016 |
11 | |||
| 2017 |
13 | |||
| 2018 and thereafter |
37 | |||
|
|
|
|||
| Total amortization expense |
$ | 82 | ||
|
|
|
|||
F-66
Table of Contents
(9) Premises and Equipment, net
The following table summarizes the cost of premises and equipment and related accumulated depreciation and amortization at December 31, 2013 and 2012:
| 2013 | 2012 | |||||||
| (in millions of dollars) | ||||||||
| Leasehold improvements |
$ | 81 | $ | 84 | ||||
| Equipment |
30 | 31 | ||||||
| Software |
2 | 2 | ||||||
|
|
|
|
|
|||||
| Premises and equipment |
113 | 117 | ||||||
| Less accumulated depreciation and amortization |
(92 | ) | (89 | ) | ||||
|
|
|
|
|
|||||
| Premises and equipment, net |
$ | 21 | $ | 28 | ||||
|
|
|
|
|
|||||
Depreciation and amortization expense was $10 million, $15 million and $13 million for the years ended December 31, 2013, 2012 and 2011. Rental expense (principally for offices and computer equipment) was $47 million, $54 million and $32 million for the years ended December 31, 2013, 2012 and 2011. These amounts are classified in Occupancy expense and Technology and communications expense on the Combined Statements of Income.
In February 2012, the Company purchased leasehold improvements and furniture, fixtures and equipment related to its branch operations from affiliated parties. These assets were purchased at net book value of $21 million and recorded using the historical cost basis of $96 million and accumulated depreciation of $75 million at the time of purchase.
Annual impairment tests were performed and no premises and equipment were deemed impaired.
The following table summarizes future minimum annual rentals under noncancelable operating leases at December 31, 2013:
| (in millions of dollars) | ||||
| 2014 |
$ | 33 | ||
| 2015 |
26 | |||
| 2016 |
19 | |||
| 2017 |
10 | |||
| 2018 and thereafter |
3 | |||
|
|
|
|||
| Total noncancelable operating leases |
$ | 91 | ||
|
|
|
|||
Some of the Company’s branch leases contain a standard renewal option of up to five years and have rent escalations built into their respective leases.
(10) Insurance
Reinsurance
The Company’s use of ceded reinsurance arrangements is limited. The Company has generally used assumed reinsurance agreements to acquire blocks of business in force. Ceded reinsurance arrangements do not discharge the insurance entities or the Company as the primary insurer.
F-67
Table of Contents
The following tables summarize reinsurance amounts included on the Combined Statements of Income for the years ended December 31, 2013, 2012 and 2011:
| 2013 | ||||||||||||||||
| Direct amount |
Assumed from other companies |
Ceded to other companies |
Net amount |
|||||||||||||
| (in millions of dollars) | ||||||||||||||||
| Premiums: |
||||||||||||||||
| Accident and health insurance |
$ | 118 | $ | 31 | $ | — | $ | 149 | ||||||||
| Life insurance |
89 | 50 | (5 | ) | 134 | |||||||||||
| Property and other |
65 | 5 | — | 70 | ||||||||||||
|
|
|
|
|
|
|
|
|
|||||||||
| Total premiums |
$ | 272 | $ | 86 | $ | (5 | ) | $ | 353 | |||||||
|
|
|
|
|
|
|
|
|
|||||||||
| Policyholder benefits and claims |
$ | 123 | $ | 34 | $ | (6 | ) | $ | 151 | |||||||
| Insurance policy and claim reserves |
$ | 694 | $ | 296 | $ | (91 | ) | $ | 899 | |||||||
| 2012 | ||||||||||||||||
| Direct amount |
Assumed from other companies |
Ceded to other companies |
Net amount |
|||||||||||||
| (in millions of dollars) | ||||||||||||||||
| Premiums: |
||||||||||||||||
| Accident and health insurance |
$ | 121 | $ | 34 | $ | — | $ | 155 | ||||||||
| Life insurance |
94 | 60 | (5 | ) | 149 | |||||||||||
| Property and other |
68 | 7 | — | 75 | ||||||||||||
|
|
|
|
|
|
|
|
|
|||||||||
| Total premiums |
$ | 283 | $ | 101 | $ | (5 | ) | $ | 379 | |||||||
|
|
|
|
|
|
|
|
|
|||||||||
| Policyholder benefits and claims |
$ | 137 | $ | 35 | $ | (5 | ) | $ | 167 | |||||||
| Insurance policy and claim reserves |
$ | 694 | $ | 301 | $ | (96 | ) | $ | 899 | |||||||
| 2011 | ||||||||||||||||
| Direct amount |
Assumed from other companies |
Ceded to other companies |
Net amount |
|||||||||||||
| (in millions of dollars) | ||||||||||||||||
| Premiums: |
||||||||||||||||
| Accident and health insurance |
$ | 131 | $ | 38 | $ | (4 | ) | $ | 165 | |||||||
| Life insurance |
98 | 68 | (8 | ) | 158 | |||||||||||
| Property and other |
70 | 9 | (2 | ) | 77 | |||||||||||
|
|
|
|
|
|
|
|
|
|||||||||
| Total premiums |
$ | 299 | $ | 115 | $ | (14 | ) | $ | 400 | |||||||
|
|
|
|
|
|
|
|
|
|||||||||
| Policyholder benefits and claims |
$ | 157 | $ | 45 | $ | (9 | ) | $ | 193 | |||||||
Life insurance policies in force were $12.0 billion and $13.0 billion at December 31, 2013 and 2012. Accident and health premiums in force were $280 million and $279 million at December 31, 2013 and 2012.
Deferred Policy Acquisition Costs
Unamortized deferred policy acquisition costs were $109 million and $117 million at December 31, 2013 and 2012, and are classified in Other assets on the Combined Statements of Financial Position. Amortization of deferred policy acquisition costs were $15 million, $19 million and $21 million for the years ended December 31, 2013, 2012 and 2011, and are classified in Other operating expense on the Combined Statements of Income.
F-68
Table of Contents
Statutory Stockholder’s Equity
The insurance entities statutory stockholder’s equity was $415 million, $454 million and $664 million at December 31, 2013, 2012 and 2011. The life insurance entities’ statutory stockholder’s equity was $209 million, $235 million and $372 million at December 31, 2013, 2012 and 2011. The property and casualty insurance entity’s statutory stockholder’s equity was $206 million, $219 million and $292 million at December 31, 2013, 2012 and 2011. State law restricts the amounts the Company’s insurance entities may pay as dividends without prior notice to, or in some cases prior approval from, the Texas Department of Insurance. The Company’s insurance entities paid dividends of $183 million in 2013 that did not require prior approval, dividends of $394 million in 2012 upon receiving prior approval and dividends of $122 million in 2011 that did not require prior approval. In 2014, the insurance entities may pay dividends up to $149 million without prior regulatory approval. For all of the years presented, the Company met the regulatory capital requirements. The combined insurance entities net income determined in accordance with GAAP was $128 million, $142 million, and $216 million for the years ended December 31, 2013, 2012 and 2011. The combined insurance entities net income determined in accordance with statutory accounting practices was $153 million, $189 million and $207 million for the years ended December 31, 2013, 2012 and 2011. The life insurance entities’ net income determined in accordance with statutory accounting practices was $89 million, $114 million and $129 million for the years ended December 31, 2013, 2012 and 2011. The property and casualty insurance entity’s net income determined in accordance with statutory accounting practices was $64 million, $75 million and $78 million for the years ended December 31, 2013, 2012 and 2011.
The following table reconciles statutory income before income taxes to GAAP Insurance segment income from continuing operations before income taxes for the Company’s insurance entities for the years ended December 31, 2013, 2012 and 2011:
| 2013 | 2012 | 2011 | ||||||||||
| (in millions of dollars) | ||||||||||||
| Statutory income before income taxes |
$ | 226 | $ | 265 | $ | 293 | ||||||
| Deferred policy acquisition costs |
(9 | ) | (15 | ) | (22 | ) | ||||||
| Amortization of present value of future profits |
(11 | ) | (9 | ) | (14 | ) | ||||||
| Reserve changes |
(4 | ) | (14 | ) | (40 | ) | ||||||
| Amortization of interest maintenance reserve |
(9 | ) | (10 | ) | (13 | ) | ||||||
| Other, net |
(30 | ) | (29 | ) | (15 | ) | ||||||
|
|
|
|
|
|
|
|||||||
| GAAP Insurance segment income from continuing operations before income taxes |
$ | 163 | $ | 188 | $ | 189 | ||||||
|
|
|
|
|
|
|
|||||||
The following table reconciles statutory equity to GAAP equity for the Company’s insurance entities for the years ended December 31, 2013, 2012, and 2011:
| 2013 | 2012 | 2011 | ||||||||||
| (in millions of dollars) | ||||||||||||
| Statutory equity |
$ | 415 | $ | 454 | $ | 664 | ||||||
| Deferred policy acquisition costs |
129 | 138 | 159 | |||||||||
| Reserve changes |
120 | 124 | 139 | |||||||||
| Present value of future profits |
82 | 92 | 99 | |||||||||
| Income taxes expense |
(101 | ) | (116 | ) | (129 | ) | ||||||
| Interest maintenance and asset valuation reserves |
35 | 43 | 52 | |||||||||
| Net unrealized gains |
36 | 74 | 68 | |||||||||
| Other |
(7 | ) | (6 | ) | (3 | ) | ||||||
|
|
|
|
|
|
|
|||||||
| GAAP equity |
$ | 709 | $ | 803 | $ | 1,049 | ||||||
|
|
|
|
|
|
|
|||||||
F-69
Table of Contents
Liability for Accident and Health Unpaid Claims and Reserve for Losses and Loss Expenses
The following table summarizes activity in the accident and health policy and contract claims and certain accident and health aggregate reserves (present value of amounts not yet due on claims) and activity in the liability for credit IUI unpaid claims and claim adjustment expenses for the years ended December 31, 2013, 2012 and 2011:
| (in millions of dollars) | 2013 | 2012 | 2011 | |||||||||
| Balance, January 1 |
$ | 120 | $ | 132 | $ | 149 | ||||||
| Incurred related to: |
||||||||||||
| Current year |
90 | 98 | 111 | |||||||||
| Prior years |
(5 | ) | (4 | ) | (1 | ) | ||||||
|
|
|
|
|
|
|
|||||||
| Total incurred |
85 | 94 | 110 | |||||||||
|
|
|
|
|
|
|
|||||||
| Paid related to: |
||||||||||||
| Current year |
(35 | ) | (37 | ) | (44 | ) | ||||||
| Prior years |
(60 | ) | (69 | ) | (83 | ) | ||||||
|
|
|
|
|
|
|
|||||||
| Total paid |
(95 | ) | (106 | ) | (127 | ) | ||||||
| Foreign currency translation adjustment |
(1 | ) | — | — | ||||||||
|
|
|
|
|
|
|
|||||||
| Balance, December 31 |
$ | 109 | $ | 120 | $ | 132 | ||||||
|
|
|
|
|
|
|
|||||||
The decrease in incurred claims in 2013 and 2012 resulted from subsequent revisions to estimated claim reserves based on actual experience.
(11) Income Taxes
The following table summarizes components of current and deferred provision (benefit) for income taxes applicable to income from continuing operations for the years ended December 31, 2013, 2012 and 2011:
| 2013 | 2012 | 2011 | ||||||||||
| (in millions of dollars) | ||||||||||||
| Current tax provision: |
||||||||||||
| U.S. federal |
$ | 294 | $ | 292 | $ | 409 | ||||||
| State & local |
23 | 16 | 18 | |||||||||
| Non-U.S. |
10 | 12 | 14 | |||||||||
|
|
|
|
|
|
|
|||||||
| Total current tax provision |
327 | 320 | 441 | |||||||||
|
|
|
|
|
|
|
|||||||
| Deferred tax benefit: |
||||||||||||
| U.S. Federal |
(17 | ) | (85 | ) | (178 | ) | ||||||
| State & local |
(1 | ) | (11 | ) | (30 | ) | ||||||
| Non-U.S. |
— | — | 1 | |||||||||
|
|
|
|
|
|
|
|||||||
| Total deferred tax benefit |
(18 | ) | (96 | ) | (207 | ) | ||||||
|
|
|
|
|
|
|
|||||||
| Provision for income taxes |
$ | 309 | $ | 224 | $ | 234 | ||||||
|
|
|
|
|
|
|
|||||||
F-70
Table of Contents
The following table reconciles the federal statutory income tax rate to the Company’s effective income tax rate applicable to income from continuing operations for the years ended December 31, 2013, 2012 and 2011:
| 2013 | 2012 | 2011 | ||||||||||
| Statutory U.S. federal income tax rate for corporations |
35.0 | % | 35.0 | % | 35.0 | % | ||||||
| State income taxes, net of federal income tax benefit |
1.7 | 0.5 | (1.2 | ) | ||||||||
| Tax advantaged income |
(0.1 | ) | — | — | ||||||||
|
|
|
|
|
|
|
|||||||
| Effective income tax rate |
36.6 | % | 35.5 | % | 33.8 | % | ||||||
|
|
|
|
|
|
|
|||||||
The following table summarizes deferred income taxes at December 31, 2013 and 2012:
| 2013 | 2012 | |||||||
| (in millions of dollars) | ||||||||
| Deferred tax assets: |
||||||||
| Credit loss deduction |
$ | 257 | $ | 264 | ||||
| Fixed assets |
43 | 21 | ||||||
| Other deferred tax assets |
45 | 53 | ||||||
|
|
|
|
|
|||||
| Total deferred tax assets |
345 | 338 | ||||||
|
|
|
|
|
|||||
| Deferred tax liabilities: |
||||||||
| Investments and loan basis differences |
(30 | ) | (49 | ) | ||||
| Deferred policy acquisition cost and value of insurance in force |
(24 | ) | (38 | ) | ||||
| Insurance reserves |
(17 | ) | (12 | ) | ||||
| Other deferred tax liabilities |
(18 | ) | (18 | ) | ||||
|
|
|
|
|
|||||
| Total deferred tax liabilities |
(89 | ) | (117 | ) | ||||
|
|
|
|
|
|||||
| Net deferred tax assets |
$ | 256 | $ | 221 | ||||
|
|
|
|
|
|||||
The Company had no valuation allowance on deferred tax assets at December 31, 2013 and 2012. Although realization is not assured, the Company believes that the realization of the recognized deferred tax asset is more-likely-than-not based on expectations as to future taxable income in the jurisdictions in which it operates.
The Company recorded uncertain income tax positions relevant to the jurisdictions where it is required to file income tax returns.
The following table summarizes the activity of the Company’s unrecognized tax benefits:
| 2013 | 2012 | 2011 | ||||||||||
| (in millions of dollars) | ||||||||||||
| Total unrecognized tax benefits at January 1 |
$ | 2 | $ | 2 | $ | 30 | ||||||
| Net amount of increases for current year’s tax positions |
— | — | 2 | |||||||||
| Gross amount of increases for prior year’s tax positions |
— | — | — | |||||||||
| Gross amount of decreases for prior year’s tax positions |
— | — | — | |||||||||
| Amounts of decreases related to settlements |
— | — | — | |||||||||
| Reductions due to lapse of statutes of limitations |
— | — | — | |||||||||
| Foreign exchange, acquisitions and dispositions |
— | — | — | |||||||||
| Distributions back to the Parent |
— | — | (30 | ) | ||||||||
|
|
|
|
|
|
|
|||||||
| Total unrecognized tax benefits at December 31 |
$ | 2 | $ | 2 | $ | 2 | ||||||
|
|
|
|
|
|
|
|||||||
The total amount of unrecognized tax benefits at December 31, 2013, 2012 and 2011 that, if recognized, would affect the effective tax rate is $2 million.
F-71
Table of Contents
Interest and penalties (not included in “unrecognized tax benefits” above) are a component of the Provision for income taxes. The total amount of interest and penalties recognized in the Combined Statements of Income and Combined Statements of Financial Position is insignificant.
The Company is currently under audit by the Internal Revenue Service and other major taxing jurisdictions, and it may conclude certain state and local tax audits within the next 12 months. It is thus reasonably possible that significant changes in the gross balance of unrecognized tax benefits may occur within the next 12 months, although the Company does not expect such audits to result in amounts that would cause a significant change to the effective tax rate.
The following table summarizes the major tax jurisdictions in which the Company operates and the earliest tax year subject to examination:
| Jurisdiction |
Tax year | |||
| United States |
2009 | |||
| Maryland |
2010 | |||
(12) Changes in AOCI
The following table summarizes the components of AOCI:
| Net unrealized gains (losses) on investment securities |
Foreign currency translation adjustment(1) |
Accumulated other comprehensive income |
||||||||||
| (in millions of dollars) | ||||||||||||
| Balance, January 1, 2011 |
$ | 68 | $ | 5 | $ | 73 | ||||||
| Change, net of tax |
2 | (1 | ) | 1 | ||||||||
|
|
|
|
|
|
|
|||||||
| Balance, December 31, 2011 |
$ | 70 | $ | 4 | $ | 74 | ||||||
| Change, net of tax |
9 | (1 | ) | 8 | ||||||||
|
|
|
|
|
|
|
|||||||
| Balance, December 31, 2012 |
$ | 79 | $ | 3 | $ | 82 | ||||||
| Other comprehensive income (loss) before reclassifications |
(33 | ) | (2 | ) | (35 | ) | ||||||
| Decrease due to amounts reclassified from AOCI |
(3 | ) | — | (3 | ) | |||||||
|
|
|
|
|
|
|
|||||||
| Change, net of tax |
(36 | ) | (2 | ) | (38 | ) | ||||||
|
|
|
|
|
|
|
|||||||
| Balance, December 31, 2013 |
$ | 43 | $ | 1 | $ | 44 | ||||||
|
|
|
|
|
|
|
|||||||
| (1) | Reflects the movements in the Canadian Dollar against the U.S. Dollar |
F-72
Table of Contents
The following table summarizes the pre-tax and after-tax changes in each component of AOCI:
| Pre-tax | Tax effect | After-tax | ||||||||||
| (in millions of dollars) | ||||||||||||
| Balance, January 1, 2011 |
$ | 113 | $ | (40 | ) | $ | 73 | |||||
| Change in net unrealized gains (losses) on investment securities |
3 | (1 | ) | 2 | ||||||||
| Foreign currency translation adjustment |
(2 | ) | 1 | (1 | ) | |||||||
|
|
|
|
|
|
|
|||||||
| Change |
1 | — | 1 | |||||||||
|
|
|
|
|
|
|
|||||||
| Balance, December 31, 2011 |
$ | 114 | $ | (40 | ) | $ | 74 | |||||
| Change in net unrealized gains (losses) on investment securities |
13 | (4 | ) | 9 | ||||||||
| Foreign currency translation adjustment |
(1 | ) | — | (1 | ) | |||||||
|
|
|
|
|
|
|
|||||||
| Change |
12 | (4 | ) | 8 | ||||||||
|
|
|
|
|
|
|
|||||||
| Balance, December 31, 2012 |
$ | 126 | $ | (44 | ) | $ | 82 | |||||
| Change in net unrealized gains (losses) on investment securities |
(54 | ) | 18 | (36 | ) | |||||||
| Foreign currency translation adjustment |
(3 | ) | 1 | (2 | ) | |||||||
|
|
|
|
|
|
|
|||||||
| Change |
(57 | ) | 19 | (38 | ) | |||||||
|
|
|
|
|
|
|
|||||||
| Balance, December 31, 2013 |
$ | 69 | $ | (25 | ) | $ | 44 | |||||
|
|
|
|
|
|
|
|||||||
The following table summarizes the decrease in AOCI for amounts reclassified to the Combined Statements of Income for the year ended December 31, 2013:
| Increase (decrease) in AOCI due to amounts reclassified to Combined Statement of Operations |
||||
| (in millions of dollars) | ||||
| Net realized gains on sales of investments(1) |
$ | (6 | ) | |
| Gross OTTI impairment losses(1) |
1 | |||
|
|
|
|||
| Net realized gains on investment securities reclassified out of AOCI—pretax |
(5 | ) | ||
| Tax expense (benefit) |
2 | |||
|
|
|
|||
| Net realized gains on investment securities reclassified out of AOCI—after-tax |
$ | (3 | ) | |
|
|
|
|||
| (1) | Refer to Note 6 for additional information on realized gains and losses on investment securities and OTTI impairments. |
(13) Securitizations
In December 2010, CCC sponsored a securitization of personal loans whereby $6.1 billion of such loans was transferred to a trust, which, in turn, issued $3.3 billion of floating rate notes collateralized by the transferred loans. The debt was issued to third parties. In 2011 and 2012, the expected principal distribution date of certain series of debt was extended and in December 2012, before the optional redemption was exercised, the debt had an expected principal distribution of one to 18 months. The securitization was a revolving structure with the principal amount of the debt intended to remain the same until expected maturity with interest-only payments made monthly to the investors. The principal balance of loans supporting the debt was required to be maintained at required minimum levels during the interest-only payment period, by transferring new eligible loans to the trust as needed. The loans were restricted from being sold or pledged as collateral and could only be used to pay the liabilities of the trust while the notes were outstanding. In addition to the cash flows from the loans, the trust could draw on a $10.0 billion subordinated line of credit (“LOC”) from Citigroup when it did not have sufficient funds available to purchase eligible new loans, pay principal and interest due to investors upon occurrence of an early redemption event, or pay principal and interest due to investors at maturity. Under the terms of the
F-73
Table of Contents
subordinated LOC agreement, Citigroup was not obligated to lend to the VIE if a VIE default event had occurred or did occur as a result of lending under the LOC. In December 2012, an optional redemption was exercised for the full amount of the third-party notes outstanding. There was a draw on the subordinated LOC for $3.3 billion to pay the principal due to the investors. The subordinated LOC was terminated by Citigroup after receipt from the VIE of $2.8 billion of cash and $451 million of funds the Company borrowed from CCC. There were no amounts outstanding related to the subordinated LOC at December 31, 2013. The subordinated LOC is classified in Related party debt on the Combined Statements of Financial Position.
The securitization trust described above is a consolidated VIE as OMH was the primary beneficiary as OMH had: (1) as servicer of the loans in the VIE, the power to direct the activities that most significantly affect the VIE’s performance; and (2) the obligation to either absorb the losses or the right to receive benefits that could be potentially significant to the VIE.
The following table summarizes the carrying amounts and classifications of the VIE’s assets and liabilities in the Combined Statements of Financial Position that are consolidated in accordance with ASC 810 for the years ended December 31, 2013 and 2012:
| 2013 | 2012 | |||||||
| (in millions of dollars) | ||||||||
| Assets |
||||||||
| Cash and cash equivalents |
$ | 188 | $ | 206 | ||||
| Net consumer finance receivables |
4,139 | 5,440 | ||||||
| Other assets |
112 | 118 | ||||||
|
|
|
|
|
|||||
| Total assets |
$ | 4,439 | $ | 5,764 | ||||
|
|
|
|
|
|||||
| Liabilities |
||||||||
| Related party debt(1) |
$ | 403 | $ | 2,117 | ||||
| Accounts payable, accrued expenses and other liabilities |
406 | 663 | ||||||
|
|
|
|
|
|||||
| Total liabilities |
$ | 809 | $ | 2,780 | ||||
|
|
|
|
|
|||||
| (1) | Presented net of intercompany receivable of $442 million at December 31, 2013 and 2012. |
(14) Fair Value Measurements
ASC 820-10, Fair Value Measurement, defines fair value, establishes a consistent framework for measuring fair value and requires disclosures about fair value measurements. Fair value is defined as the price that would be received to sell an asset or paid to transfer a liability in an orderly transaction between market participants at the measurement date. Among other things, the standard requires the Company to maximize the use of observable inputs and minimize the use of unobservable inputs when measuring fair value.
Fair Value Hierarchy
ASC 820-10 specifies a hierarchy of inputs based on whether the inputs are observable or unobservable. Observable inputs reflect market data obtained from independent sources, while unobservable inputs reflect the Company’s market assumptions.
These two types of inputs have created the following fair value hierarchy:
Level 1—Quoted prices for identical instruments in active markets.
Level 2—Quoted prices for similar instruments in active markets; quoted prices for identical or similar instruments in markets that are not active; and model-derived valuations in which all significant inputs and significant value drivers are observable in active markets.
Level 3—Valuations derived from valuation techniques in which one or more significant inputs or significant value drivers are unobservable.
F-74
Table of Contents
The Company’s policy with respect to transfers between levels of the fair value hierarchy is to recognize transfers into and out of each level as of the end of the reporting period.
Determination of Fair Value
For assets and liabilities carried at fair value, the Company primarily utilizes third-party valuation service providers to assist in deriving fair values based on various methodologies, including market quotes where available, external non-binding broker quotes, and proprietary valuation models. The Company assesses the reasonableness of security values received from valuation service providers through various analytical techniques including comparing the information obtained from the valuation service providers to other third-party valuation sources for selected securities.
Fair Value of Financial Instruments
The following tables summarize the fair value and carrying amount of financial instruments at December 31, 2013 and 2012:
| 2013 | ||||||||||||||||||||
| Carrying value |
Estimated fair value |
Estimated fair value | ||||||||||||||||||
| Level 1 | Level 2 | Level 3 | ||||||||||||||||||
| (in millions of dollars) | ||||||||||||||||||||
| Assets |
||||||||||||||||||||
| Cash and cash equivalents |
$ | 319 | $ | 319 | $ | — | $ | 319 | $ | — | ||||||||||
| Investments (Note 6) |
1,431 | 1,431 | 49 | 1,324 | 58 | |||||||||||||||
| Consumer finance receivables(1) (Note 7) |
7,991 | 8,651 | — | — | 8,651 | |||||||||||||||
| Liabilities |
||||||||||||||||||||
| Related party debt (Note 15) |
5,894 | 5,894 | — | — | 5,894 | |||||||||||||||
| (1) | The carrying value of consumer finance receivables includes accrued interest receivables of $92 million, is net of the allowance for loan losses of $676 million and excludes unearned premium and claim reserves of $416 million. |
| 2012 | ||||||||||||||||||||
| Carrying value |
Estimated fair value |
Estimated fair value | ||||||||||||||||||
| Level 1 | Level 2 | Level 3 | ||||||||||||||||||
| (in millions of dollars) | ||||||||||||||||||||
| Assets |
||||||||||||||||||||
| Cash and cash equivalents |
$ | 369 | $ | 369 | $ | — | $ | 369 | $ | — | ||||||||||
| Investments (Note 6) |
1,507 | 1,507 | 83 | 1,406 | 18 | |||||||||||||||
| Consumer finance receivables(1) (Note 7) |
7,875 | 8,473 | — | — | 8,473 | |||||||||||||||
| Liabilities |
||||||||||||||||||||
| Related party debt (Note 15) |
6,037 | 6,037 | — | — | 6,037 | |||||||||||||||
| (1) | The carrying value of consumer finance receivables includes accrued interest receivables of $114 million, is net of the allowance for loan losses of $686 million and excludes unearned premium and claim reserves of $394 million. |
The fair value assumptions are based upon subjective estimates of market conditions and perceived risks of the financial instruments at a certain point in time as disclosed further in various notes to the Combined Financial Statements.
Fixed maturities and equity securities—the fair value is based primarily on quoted market prices or if quoted market prices are not available, discounted expected cash flows using market rates for similar instruments which are commensurate with the credit quality and maturity of the investments. If market rates for similar instruments are not available, other valuation techniques would be used and the asset would be classified as Level 3.
F-75
Table of Contents
Short-term and other investments—the carrying value approximates the fair value due to the relatively short period of time between the origination of the investment and its expected maturity or realization.
Consumer finance receivables—the fair value is estimated based primarily on an exit value return-on-asset methodology, using assumptions that management believes a market participant would use in valuing these assets.
Related party debt—the carrying value approximates fair value due to the short-term nature of these instruments.
The disclosed fair values for financial instruments do not reflect any premium or discount that could result from offering for sale, at one time, the Company’s entire holdings of a particular financial instrument. In addition, any potential taxes and other expenses that would be incurred in an actual sale or settlement are not reflected in amounts disclosed.
Items Measured at Fair Value on a Recurring Basis
The Company has certain financial assets that are required to be reported on the Combined Statements of Financial Position at fair value, on either a recurring or nonrecurring basis.
The following tables summarize assets measured at fair value on a recurring basis:
| December 31, 2013 | ||||||||||||||||
| Level 1 | Level 2 | Level 3 | Total | |||||||||||||
| (in millions of dollars) | ||||||||||||||||
| Fixed maturity securities: |
||||||||||||||||
| Mortgage-backed securities: |
||||||||||||||||
| U.S. government agency guaranteed: |
$ | — | $ | 69 | $ | 5 | $ | 74 | ||||||||
| Prime |
— | 7 | — | 7 | ||||||||||||
| Commercial |
— | 75 | — | 75 | ||||||||||||
|
|
|
|
|
|
|
|
|
|||||||||
| Total mortgage-backed securities |
— | 151 | 5 | 156 | ||||||||||||
| U.S. Treasury and federal agency |
15 | 12 | — | 27 | ||||||||||||
| State and municipal |
— | 33 | — | 33 | ||||||||||||
| Foreign government |
— | 143 | — | 143 | ||||||||||||
| Corporate securities |
— | 923 | 37 | 960 | ||||||||||||
| Other debt securities |
— | 43 | 10 | 53 | ||||||||||||
|
|
|
|
|
|
|
|
|
|||||||||
| Total fixed maturity securities |
15 | 1,305 | 52 | 1,372 | ||||||||||||
| Equity securities |
34 | 5 | 6 | 45 | ||||||||||||
| Short-term and other |
— | 14 | — | 14 | ||||||||||||
|
|
|
|
|
|
|
|
|
|||||||||
| Total investments |
$ | 49 | $ | 1,324 | $ | 58 | $ | 1,431 | ||||||||
|
|
|
|
|
|
|
|
|
|||||||||
F-76
Table of Contents
| December 31, 2012 | ||||||||||||||||
| Level 1 | Level 2 | Level 3 | Total | |||||||||||||
| (in millions of dollars) | ||||||||||||||||
| Fixed maturity securities: |
||||||||||||||||
| Mortgage-backed securities: |
||||||||||||||||
| U.S. government agency guaranteed |
$ | — | $ | 85 | $ | — | $ | 85 | ||||||||
| Prime |
— | 11 | — | 11 | ||||||||||||
| Alt-A |
— | 1 | — | 1 | ||||||||||||
| Commercial |
— | 92 | — | 92 | ||||||||||||
|
|
|
|
|
|
|
|
|
|||||||||
| Total mortgage-backed securities |
— | 189 | — | 189 | ||||||||||||
| U.S. Treasury and federal agency |
— | 26 | — | 26 | ||||||||||||
| State and municipal |
— | 17 | — | 17 | ||||||||||||
| Foreign government |
— | 136 | — | 136 | ||||||||||||
| Corporate securities |
— | 975 | 4 | 979 | ||||||||||||
| Other debt securities |
— | 50 | 10 | 60 | ||||||||||||
|
|
|
|
|
|
|
|
|
|||||||||
| Total fixed maturity securities |
— | 1,393 | 14 | 1,407 | ||||||||||||
| Equity securities |
28 | 13 | 4 | 45 | ||||||||||||
| Short-term and other |
55 | — | — | 55 | ||||||||||||
|
|
|
|
|
|
|
|
|
|||||||||
| Total investments |
$ | 83 | $ | 1,406 | $ | 18 | $ | 1,507 | ||||||||
|
|
|
|
|
|
|
|
|
|||||||||
The following tables summarize the changes in the Level 3 fair value category for the years ended December 31, 2013 and 2012:
| Balance December 31, 2012 |
Transfers into Level 3 |
Transfers out of Level 3 |
Purchases | Sales | Net realized gains (losses) |
Net unrealized gains in other comprehensive income on assets still held |
Balance December 31, 2013 |
|||||||||||||||||||||||||
| (in millions of dollars) | ||||||||||||||||||||||||||||||||
| Fixed maturity securities: |
||||||||||||||||||||||||||||||||
| Mortgage-backed securities: |
||||||||||||||||||||||||||||||||
| U.S. government agency guaranteed |
$ | — | $ | 6 | $ | (1 | ) | $ | — | $ | — | $ | — | $ | — | $ | 5 | |||||||||||||||
| Alt- A |
— | 1 | (1 | ) | — | — | — | — | — | |||||||||||||||||||||||
| Commercial |
— | 2 | (2 | ) | — | — | — | — | — | |||||||||||||||||||||||
|
|
|
|
|
|
|
|
|
|
|
|
|
|
|
|
|
|||||||||||||||||
| Total mortgage-backed securities |
— | 9 | (4 | ) | — | — | — | — | 5 | |||||||||||||||||||||||
| State and municipal |
— | 1 | (1 | ) | — | — | — | — | — | |||||||||||||||||||||||
| Corporate securities |
4 | 38 | (5 | ) | 1 | (2 | ) | — | 1 | 37 | ||||||||||||||||||||||
| Other debt securities |
10 | — | (3 | ) | 3 | — | — | — | 10 | |||||||||||||||||||||||
|
|
|
|
|
|
|
|
|
|
|
|
|
|
|
|
|
|||||||||||||||||
| Total fixed maturity securities |
14 | 48 | (13 | ) | 4 | (2 | ) | — | 1 | 52 | ||||||||||||||||||||||
| Equity securities |
4 | 10 | (1 | ) | — | (7 | ) | — | — | 6 | ||||||||||||||||||||||
|
|
|
|
|
|
|
|
|
|
|
|
|
|
|
|
|
|||||||||||||||||
| Total fixed maturity and equity securities |
$ | 18 | $ | 58 | $ | (14 | ) | $ | 4 | $ | (9 | ) | $ | — | $ | 1 | $ | 58 | ||||||||||||||
|
|
|
|
|
|
|
|
|
|
|
|
|
|
|
|
|
|||||||||||||||||
F-77
Table of Contents
| Balance December 31, 2011 |
Transfers into Level 3 |
Transfers out of Level 3 |
Purchases | Sales | Net realized gains |
Net unrealized losses in other comprehensive income on assets still held |
Balance December 31, 2012 |
|||||||||||||||||||||||||
| (in millions of dollars) | ||||||||||||||||||||||||||||||||
| Fixed maturity securities: |
||||||||||||||||||||||||||||||||
| Corporate securities |
$ | 7 | $ | 1 | $ | (1 | ) | $ | 3 | $ | (6 | ) | $ | — | $ | — | $ | 4 | ||||||||||||||
| Other debt securities |
44 | — | — | — | (31 | ) | — | (3 | ) | 10 | ||||||||||||||||||||||
|
|
|
|
|
|
|
|
|
|
|
|
|
|
|
|
|
|||||||||||||||||
| Total fixed maturity securities |
51 | 1 | (1 | ) | 3 | (37 | ) | — | (3 | ) | 14 | |||||||||||||||||||||
| Equity securities |
3 | — | — | — | — | 1 | — | 4 | ||||||||||||||||||||||||
|
|
|
|
|
|
|
|
|
|
|
|
|
|
|
|
|
|||||||||||||||||
| Total fixed maturity and equity securities |
$ | 54 | $ | 1 | $ | (1 | ) | $ | 3 | $ | (37 | ) | $ | 1 | $ | (3 | ) | $ | 18 | |||||||||||||
|
|
|
|
|
|
|
|
|
|
|
|
|
|
|
|
|
|||||||||||||||||
Transfers between Level 1 and Level 2 of the Fair Value Hierarchy
For the year ended December 31, 2013, the Company transferred $65 million of investments from Level 1 to Level 2, primarily related to equity and short-term and other securities which were not traded with sufficient frequency to constitute an active market. For the year ended December 31, 2013, the Company transferred $28 million of investments from Level 2 to Level 1, primarily related to U.S. Treasury and federal agency securities which were traded with sufficient frequency to constitute an active market. During the year ended December 31, 2012 there were no transfers between Level 1 and Level 2.
Transfers in and out of Level 3 of the Fair Value Hierarchy
For the year ended December 31, 2013, $58 million of investments, primarily related to corporate securities, were transferred into Level 3 and $14 million of investments, primarily related to corporate and mortgage-backed securities, were transferred out of Level 3 due to changes in the level of price observability for the specific securities.
Transfers in and out of Level 3 for the year ended December 31, 2012 were not significant.
Valuation Techniques and Inputs for Level 2 Fair Value Measurements
At December 31, 2013 and 2012, the majority of the financial instruments in Level 2 consisted of cash and investments. Investments in Level 2 were composed of corporate securities, mortgage-backed securities and foreign government securities. The fair value for these investments is based upon: (1) quoted prices for similar assets in active markets; (2) quoted prices for identical or similar assets in inactive markets; or (3) valuations based on models where the significant inputs are observable including, but not limited to, interest rates, yield curves, prepayment speeds, default rates and loss severities, or can be corroborated by observable market data.
Valuation Techniques and Inputs for Level 3 Fair Value Measurements
At December 31, 2013, the majority of the investments in Level 3 were corporate securities for which the fair value is measured by the Company’s third-party valuation service provider using a price based methodology with the significant unobservable input as the price, which ranges from 1.25 to 121.28 of par.
At December 31, 2012, the majority of the investments in Level 3 were other debt securities for which the fair value is measured by the Company’s third-party valuation service provider using a price based methodology with the significant unobservable input as the price, which ranges from 0.88 to 121.00 of par.
F-78
Table of Contents
The effect on the fair value measurement of a given security is wholly dependent on the amount and direction of any changes in the unobservable price input.
(15) Related Party Transactions
Expense Allocations
The Combined Financial Statements include direct and indirect expense allocations of certain costs for employee benefits and support functions provided on a centralized basis by various providers across Citigroup and CCC. These expenses are allocated based on various cost and/or activity-related drivers.
The following table summarizes the Company’s allocated share of the related costs from Citigroup and CCC providers for the years ended December 31, 2013 and 2012:
| (in millions of dollars) |
2013 | 2012 | ||||||
| Direct costs |
$ | 224 | $ | 254 | ||||
| Indirect costs |
76 | 101 | ||||||
|
|
|
|
|
|||||
| Total allocated expenses(1) |
$ | 300 | $ | 355 | ||||
|
|
|
|
|
|||||
| (1) | As a result of the business combination on July 1, 2011, as discussed in Note 2(a), comparable information is not available for the period January 1, 2011 through June 30, 2011. Total allocated expenses for the year ended December 31, 2011 are estimated to be $315 million based upon applying actual ratios of allocated expenses of periods subsequent to June 30, 2011. The Company believes this is a reasonable basis for estimating total allocated expenses for the year ended December 31, 2011. |
Direct Allocated Costs
Direct allocated costs represent specific services or functions that are attributable to the Company based on actual and/or estimated usage or consumption.
Employee benefits
The Company reimburses Citigroup for payroll taxes and benefits provided to its employees under various U.S. Citigroup employee benefit plans, including costs associated with its participation in Citigroup’s retirement plans and active employee health and life insurance benefit plans. These costs are allocated by individual based on actual employee wages. The Company’s allocated share of the costs associated with these plans was $80 million and $70 million for the years ended December 31, 2013 and 2012. These costs are classified in Compensation and benefits expense on the Combined Statements of Income.
Technology
Citigroup provides certain information technology infrastructure, applications and support services. These costs are allocated based on individual employee consumption or information technology infrastructure usage. The Company’s allocated share of costs associated with these services was $75 million and $78 million for the years ended December 31, 2013 and 2012. These costs are classified in Technology and communications expense on the Combined Statements of Income.
Occupancy
Citigroup provides the Company certain shared premises and related services primarily located in Baltimore, Maryland. These costs are allocated based on the square footage occupied on the premises, including a share of costs related to unoccupied square footage and common areas. The Company’s allocated share of costs
F-79
Table of Contents
associated with these services was $5 million for the year ended December 31, 2013. These costs are classified in Occupancy expense on the Combined Statements of Income. For the year ended December 31, 2012, these costs were included in other shared support costs discussed in Other Direct Costs below.
Other Direct Costs
Centralized Citigroup locations provide various services including payment processing, preparation of customer statements and centralized default management services. Costs are allocated to the Company based on transactions, statements produced and number of accounts serviced. The Company’s allocated share of the costs for these services was $53 million and $40 million for the years ending December 31, 2013 and 2012. These costs are classified in Other operating expense on the Combined Statements of Income.
Other shared support costs includes local executive and administrative support functions which were shared with an affiliate in 2012 and 2011. These costs are allocated based on a variety of drivers, such as number of accounts, number of branches, and headcount. The Company’s allocated share of costs associated with these services was $52 million for the year ended December 31, 2012. These costs are classified in Other operating expense on the Combined Statements of Income. Following a transfer of employees from CCC to OMH in 2013, The Company was no longer allocated these expenses but rather incurred them directly.
The Company incurred expenses from certain affiliates for marketing/distributing its credit insurance products and billing and collecting periodic premiums on other products and programs. These expenses are based on a percentage of written insurance premiums. The Company’s share of costs associated with these services was $11 million and $14 million for the years ended December 31, 2013, and 2012. These costs are classified in Other operating expense on the Combined Statements of Income.
Indirect Allocated Costs
Indirect allocated costs represent general corporate level services provided to the Company and other affiliates by Citigroup. Corporate level services include finance, human resources, compliance, risk, legal, communications, treasury, audit, administration and security. Additionally, operations and technology management, and other shared administrative costs are also included in indirect allocated costs. The costs are allocated to the Company on a pro-rata basis among certain of Citigroup’s subsidiaries using a three-month rolling average of the costs associated with assets, direct staff, direct expenses and, in certain cases, a time study. The Company’s allocated share of the costs for these services was $76 million and $101 million for the years ending December 31, 2013 and 2012. These costs are classified in Other operating expense on the Combined Statements of Income.
Revenue Allocations
The Insurance segment provided administrative support related to debt protection products on behalf of other Citigroup affiliates. The Company recorded income related to these services of $11 million, $11 million and $12 million for the years ended December 31, 2013, 2012 and 2011. These amounts are classified in Other revenue on the Combined Statements of Income.
The Company provided other shared support to an affiliate beginning in 2013 following a transfer of employees from CCC to OMH. The Company, recorded income related to these services of $5 million for the year ended December 31, 2013. This amount is classified in Other revenue on the Combined Statements of Income.
Related Party Debt
The Company’s Related party debt was $5.9 billion and $6.0 billion, net of related party receivables of $854 million and $656 million at December 31, 2013 and 2012. The Company had no short-term floating rate notes outstanding at December 31, 2013. The outstanding balance of short-term floating rate notes with CCC, included in Related party debt, was $2.5 billion at December 31, 2012, with interest charged daily based on the BBA
F-80
Table of Contents
LIBOR plus a 2.63% spread. The remaining unsecured balances are short-term in nature with no stated maturity and include charges for operational support and the borrowing and lending of funds. The Company is charged interest monthly based on CCC’s cost of funds.
The following table summarizes information with respect to Related party debt for the years ended December 31, 2013 and 2012:
| 2013 | 2012 | |||||||
| (in millions of dollars) | ||||||||
| Weighted average interest rate |
3.69 | % | 4.36 | % | ||||
| Maximum outstanding balance |
$ | 6,000 | $ | 6,045 | ||||
| Interest paid |
$ | 228 | $ | 173 | ||||
Other Related Party Transactions
Cash on deposit with related parties was $153 million and $185 million as of December 31, 2013 and 2012. These balances are classified in Cash and cash equivalents on the Combined Statements of Financial Position.
Prior to January 6, 2014, the Company serviced a portfolio of real estate loans owned by an affiliate. The Company received servicing fees of $101 million, $127 million and $71 million for the years ended December 31, 2013, 2012 and 2011. These servicing fees are classified in Other revenue on the Combined Statements of Income.
On June 18, 2012, OMH purchased $87 million of non-impaired personal loans from an affiliate at par.
On February 29, 2012, the Company sold $31 million par value of Citigroup Junior Subordinated Debt Securities to an affiliate for $35 million, resulting in a realized pre-tax gain of $4 million. Interest revenue of $1 million was recorded from this investment for the year ended December 31, 2012.
On January 1, 2012, the Company transferred real estate loans with a carrying value of $107 million to an affiliate in exchange for a reduction of related party debt of $107 million.
(16) Contingencies
In the ordinary course of business, the Company including its affiliates and subsidiaries, as well as its respective current and former officers, directors and employees, routinely are named as defendants in, or as parties to, various actual or threatened legal actions and proceedings. Certain of these actions and proceedings assert claims or seek relief in connection with alleged violations of consumer protection, lending, insurance, antifraud, anti-money laundering, employment and other statutory and common laws. Certain of these legal actions and proceedings may include claims for substantial or indeterminate compensatory or punitive damages, or for injunctive relief, and in some instances, seek recovery on a class-wide basis.
In the ordinary course of business, the Company is also subject to governmental and regulatory examinations, information-gathering requests, investigations and proceedings (both formal and informal), certain of which may result in adverse judgments, settlements, fines, penalties, restitutions, disgorgements, injunctions or other relief. In addition, the Company and certain of its affiliates and subsidiaries are regulated entities and, in those capacities, subject to regulation by various U.S. and state regulators. In connection with formal and informal inquiries by these regulators, the Company receives requests, subpoenas and orders seeking documents, testimony and other information in connection with various aspects of their regulated activities. The Company from time to time receives grand jury subpoenas and other requests for information or assistance, formal or informal, relating to the Company and its customers, from federal or state law enforcement agencies. The
F-81
Table of Contents
Company seeks to resolve all litigation and regulatory matters in the manner management believes is in the best interests of the Company and its shareholders, and contest liability, allegations of wrongdoing and, where applicable, the amount of damages or scope of any penalties or other relief sought as appropriate in each pending matter.
In connection with the possible separation from Citigroup, the Company may enter into an agreement with Citigroup under which the Company would indemnify Citigroup for all liabilities arising from activities (including origination and servicing), transactions and claims relating to the Company’s current or legacy businesses, whether now part of the Company’s business or part of Citigroup, including any liabilities from any sale by Citigroup or the Company of any such assets, but excluding liabilities arising out of servicing or other activities by Citigroup after January 1, 2014 with respect to the Citi Financial North America mortgage portfolio retained by Citigroup.
In accordance with ASC 450, accruals are established for contingencies, including litigation and regulatory matters, when management believes it is probable that a loss has been incurred and the amount of the loss can be reasonably estimated. Once established, accruals are adjusted from time to time, as appropriate, in light of additional information. In view of the inherent unpredictability of litigation and regulatory matters, particularly where the damages sought are substantial or indeterminate, the investigations or proceedings are in the early stages, or the matters involve novel legal theories or a large number of parties, the Company cannot predict the timing or ultimate resolution of litigation and regulatory matters, and the actual costs of resolving litigation and regulatory matters may be substantially higher or lower than the amounts accrued for those matters.
The Company or its subsidiaries are named as defendants or otherwise directly involved in certain, but not all, of the matters disclosed below. Subject to the foregoing, it is the opinion of the Company’s management, based on current knowledge and after taking into account both current legal accruals, that the eventual outcome of the matters described in this Note would not be likely to have a material adverse effect on the Company’s financial condition. Nonetheless, given the substantial or indeterminate amounts sought in certain of these matters, and the inherent unpredictability of such matters, an adverse outcome in certain of these matters could, from time to time, have a material adverse effect on its results of operations or cash flows in particular periods.
West Virginia Consumer Finance Litigation
In 2006, Paul Lightner filed a counter-claim class action complaint seeking recovery under West Virginia’s Consumer Credit and Protection Act against CitiFinancial, Inc. (WV) for selling insurance with allegedly inflated premiums and for allegedly taking impermissible security interests in household goods. In 2008, the trial court certified a class under both claims and denied CitiFinancial, Inc.’s motion for summary judgment on both claims. CitiFinancial, Inc. appealed the denial of summary judgment on the insurance claim, and in 2009 the West Virginia Supreme Court reversed the trial court, and held that appropriateness of insurance rates was a matter to be decided by the West Virginia Insurance Commissioner. In 2010, the West Virginia Insurance Commissioner ruled in CitiFinancial, Inc. (WV)’s favor, and plaintiffs appealed this decision. In June, 2014, the West Virginia Supreme Court ruled in CitiFinancial, Inc. (WV)’s favor, and affirmed the decision of the Insurance Commissioner. The matter has been remanded back to the trial court, where a new Judge has been assigned to the matter. CitiFinancial, Inc. (WV) is subject to the prior Judge’s 2008 certification order, and is seeking to have the remaining claim for taking impermissible security interests in household goods decertified. Additional information concerning this matter is publicly available in court filings under Lightner v. CitiFinancial, Inc., Case No. 02-C0723 (Cir. Ct. Marshall Co. WV).
(17) Subsequent Events
On July 30, 2014, OMH completed the securitization of personal loans and formed OneMain Financial Issuance Trust 2014-2 (“OneMain Trust”) resulting in the issuance of $1.2 billion of Class A, Class B, Class C and Class D fixed rate notes collateralized by $1.3 billion of loans. The notes are due September 18, 2024 and
F-82
Table of Contents
may be optionally called by the OneMain Trust on or after July 18, 2016 at a redemption price equal to 101% of the aggregate note principal balance at the time of the optional call. The OneMain Trust will make payments of interest on the notes during the revolving period, which ends June 30, 2016, and make principal and interest payments thereafter. During the revolving period, additional loans may be transferred to the OneMain Trust. The loans are restricted from being sold or pledged as collateral and can only be used to pay the liabilities of the One Main Trust while the notes are outstanding. The parent of the OneMain Trust is OneMain Financial Funding II, LLC, which is a subsidiary of OneMain Financial Holdings, Inc. The OneMain Trust is a VIE consolidated by the Company as its primary beneficiary.
On July 25, 2014, CCC executed an agreement with a third party to maintain the loan processing technology infrastructure supporting the Company’s loans effective upon successful conversion to the third-party system. The infrastructure agreement has an initial five-year term and provides for payment based on a fixed fee per loan processed. If, once effective, the agreement is terminated without cause by CCC, OMH would be obligated to pay a termination fee of $26 million less any fees already paid under the agreement. On August 13, 2014 and in conjunction with the above infrastructure agreement, CCC also entered into an agreement to purchase professional services for converting the Company’s loans to the third-party loan processing system. The agreement provides for OMH to pay an estimated $7 million between August 13, 2014 and the date of converting the loans to the new system, which is currently expected to occur during the fourth quarter of 2015. If the agreement is terminated by CCC prior to conversion and without cause, OMH is obligated to pay a termination fee of approximately $9 million less any fees already paid under the agreement.
On July 1, 2014, CCC contributed all of the capital of OMFI, AHL and Triton to OMFH resulting in OMFH becoming the legal parent of the contributed entities. The contribution did not result in a change to the historical carrying value of the assets and liabilities of OMH.
On April 17, 2014, OMH completed the securitization of personal loans and formed OneMain Financial Issuance Trust 2014-1 (the “Issuer” or the “Trust”) resulting in the issuance of $760 million of Class A and Class B fixed rate notes collateralized by $1 billion of loans. The notes are due June 18, 2024 and may be optionally called by the Issuer on or after April 18, 2016 at a redemption price equal to 101% of the aggregate note principal balance at the time of the optional call. The Issuer will make payments of interest on the notes during the revolving period, which ends March 31, 2016, and make principal and interest payments thereafter. During the revolving period, additional loans may be transferred to the Trust. The loans are restricted from being sold or pledged as collateral and can only be used to pay the liabilities of the Trust while the notes are outstanding. The parent of the Trust is OneMain Financial Funding, LLC, which is a subsidiary of OneMain Financial Holdings, Inc. The securitization Trust is a VIE consolidated by the Company as its primary beneficiary.
On January 1, 2014, OMH transferred its residential first mortgage and home equity loans totaling approximately $463 million to its parent in the form of a distribution. The distribution occurred at carrying value and accordingly, no gain or loss was recognized. Additionally, on January 6, 2014, OMH transferred real estate loan servicing responsibilities to an affiliate. Due to a licensing restriction, the servicing relating to $57 million of loans was not able to be released on January 6, 2014. The income from servicing these loans continued until April 6, 2014 and is immaterial to the Company’s results. The Company did not receive or pay any consideration relating to the servicing transfer.
F-83
Table of Contents
Shares
Common Stock
PRELIMINARY PROSPECTUS
, 2014
Citigroup
Until , 2014 (25 days after the date of this prospectus), all dealers that buy, sell or trade shares of our common stock, whether or not participating in this offering, may be required to deliver a prospectus. This is in addition to the dealers’ obligation to deliver a prospectus when acting as underwriters and with respect to their unsold allotments or subscriptions.
Table of Contents
PART II
INFORMATION NOT REQUIRED IN PROSPECTUS
| Item 13. | Other Expenses of Issuance and Distribution. |
| Amount To Be Paid |
||||
| Registration fee |
$ | 5,810 | ||
| FINRA filing fee |
8,000 | |||
| NYSE listing fee |
* | |||
| Transfer agent’s fees |
* | |||
| Printing and engraving expenses |
* | |||
| Legal fees and expenses |
* | |||
| Accounting fees and expenses |
* | |||
| Blue Sky fees and expenses |
* | |||
| Miscellaneous |
* | |||
| Total |
* | |||
| * | To be completed by amendment. |
| Item 14. | Indemnification of Directors and Officers. |
Section 145 of the Delaware General Corporation Law provides that a corporation may indemnify directors and officers as well as other employees and individuals against expenses (including attorneys’ fees), judgments, fines and amounts paid in settlement actually and reasonably incurred by such person in connection with any threatened, pending or completed actions, suits or proceedings in which such person is made a party by reason of such person being or having been a director, officer, employee or agent to the Registrant. The Delaware General Corporation Law provides that Section 145 is not exclusive of other rights to which those seeking indemnification may be entitled under any bylaw, agreement, vote of stockholders or disinterested directors or otherwise. The Registrant’s Bylaws provide for indemnification by the Registrant of its directors, officers and employees to the fullest extent permitted by the Delaware General Corporation Law.
Section 102(b)(7) of the Delaware General Corporation Law permits a corporation to provide in its certificate of incorporation that a director of the corporation shall not be personally liable to the corporation or its stockholders for monetary damages for breach of fiduciary duty as a director, except for liability (i) for any breach of the director’s duty of loyalty to the corporation or its stockholders, (ii) for acts or omissions not in good faith or which involve intentional misconduct or a knowing violation of law, (iii) for unlawful payments of dividends or unlawful stock repurchases, redemptions or other distributions, or (iv) for any transaction from which the director derived an improper personal benefit. The Registrant’s Certificate of Incorporation provides for such limitation of liability.
OneMain maintains standard policies of insurance under which coverage is provided (a) to its directors and officers against loss rising from claims made by reason of breach of duty or other wrongful act, and (b) to OneMain with respect to payments which may be made by OneMain to such officers and directors pursuant to the above indemnification provision or otherwise as a matter of law.
The proposed form of Underwriting Agreement filed as Exhibit 1.1 to this Registration Statement will provide for the indemnification of directors and officers of OneMain by the underwriters against certain liabilities.
| Item 15. | Recent Sales of Unregistered Securities. |
None.
II-1
Table of Contents
| Item 16. | Exhibits and Financial Statement Schedules. |
(a) The following exhibits are filed as part of this Registration Statement:
| Exhibit Number |
Description | |||
| 1.1 | * | Form of Underwriting Agreement | ||
| 3.1 | * | Form of Amended and Restated Certificate of Incorporation | ||
| 3.2 | * | Form of Amended and Restated Bylaws | ||
| 4.1 | * | Form of Common Stock Certificate | ||
| 5.1 | * | Opinion of Davis Polk & Wardwell LLP | ||
| 10.1 | * | Form of Stockholder’s Agreement between OneMain Financial Holdings Inc. and Citigroup Inc. | ||
| 10.2 | * | Form of Transition Services Agreement between OneMain Financial Holdings Inc. and Citigroup Inc. | ||
| 10.3 | * | Form of Tax Matters Agreement between OneMain Financial Holdings Inc. and Citigroup Inc. | ||
| 10.4 | * | Form of Employee Matters Agreement between OneMain Financial Holdings Inc. and Citigroup Inc. | ||
| 10.5 | * | Form of Intellectual Property Agreement between OneMain Financial Holdings Inc. and Citigroup Inc. | ||
| 10.6 | * | Form of Registration Rights Agreement between OneMain Financial Holdings Inc. and Citigroup Inc. | ||
| 10.7 | * | Form of Indemnification Agreement | ||
| 21.1 | * | Subsidiaries of the Registrant | ||
| 23.1 | Consent of KPMG LLP | |||
| 23.2 | * | Consent of Davis Polk & Wardwell LLP (included in Exhibit 5.1) | ||
| 24.1 | Power of Attorney (included on signature page) | |||
| * | To be filed by amendment. |
(b) No financial statement schedules are provided because the information called for is not required or is shown either in the financial statements or the notes thereto.
| Item 17. | Undertakings. |
The undersigned hereby undertakes:
(a) The undersigned registrant hereby undertakes to provide to the underwriter at the closing specified in the underwriting agreement certificates in such denominations and registered in such names as required by the underwriter to permit prompt delivery to each purchaser.
(b) Insofar as indemnification for liabilities arising under the Securities Act of 1933 may be permitted to directors, officers and controlling persons of the Registrant pursuant to the provisions referenced in Item 14 of this Registration Statement, or otherwise, the Registrant has been advised that in the opinion of the Securities and Exchange Commission such indemnification is against public policy as expressed in the Act and is, therefore, unenforceable. In the event that a claim for indemnification against such liabilities (other than the payment by the Registrant of expenses incurred or paid by a director, officer, or controlling person of the Registrant in the
II-2
Table of Contents
successful defense of any action, suit or proceeding) is asserted by such director, officer or controlling person in connection with the securities being registered hereunder, the Registrant will, unless in the opinion of its counsel the matter has been settled by controlling precedent, submit to a court of appropriate jurisdiction the question of whether such indemnification by it is against public policy as expressed in the Act and will be governed by the final adjudication of such issue.
(c) The undersigned registrant hereby undertakes that:
(1) For purposes of determining any liability under the Securities Act of 1933, the information omitted from the form of prospectus filed as part of this Registration Statement in reliance upon Rule 430A and contained in a form of prospectus filed by the Registrant pursuant to Rule 424(b)(1) or (4) or 497(h) under the Securities Act shall be deemed to be part of this Registration Statement as of the time it was declared effective.
(2) For the purpose of determining any liability under the Securities Act of 1933, each post-effective amendment that contains a form of prospectus shall be deemed to be a new Registration Statement relating to the securities offered therein, and the offering of such securities at that time shall be deemed to be the initial bona fide offering thereof.
II-3
Table of Contents
SIGNATURES
Pursuant to the requirements of the Securities Act of 1933, as amended, the Registrant has duly caused this Registration Statement to be signed on its behalf by the undersigned, thereunto duly authorized, in the City of Baltimore, State of Maryland, on the 8th day of October, 2014.
| ONEMAIN FINANCIAL HOLDINGS INC. | ||||
| By: | /s/ Mary McDowell | |||
| Name: | Mary McDowell | |||
| Title: | Chief Executive Officer, President and Director | |||
KNOW ALL MEN BY THESE PRESENTS, that each person whose signature appears below constitutes and appoints Mary McDowell, April O. Park, Micah Conrad and John Schachtel, and each of them, as his or her true and lawful attorneys-in-fact and agents, with full power to act separately and full power of substitution and resubstitution, for him or her and in his or her name, place and stead, in any and all capacities, to sign any and all amendments (including post-effective amendments) to this Registration Statement and all additional registration statements pursuant to Rule 462(b) of the Securities Act of 1933, as amended, and to file the same, with all exhibits thereto, and all other documents in connection therewith, with the Securities and Exchange Commission, granting unto each said attorney-in-fact and agent full power and authority to do and perform each and every act in person, hereby ratifying and confirming all that said attorneys-in-fact and agents or either of them or his or her or their substitute or substitutes may lawfully do or cause to be done by virtue hereof.
Pursuant to the requirements of the Securities Act of 1933, as amended, this Registration Statement has been signed by the following persons in the capacities, in the locations and on the dates indicated.
| Signature |
Title |
Date | ||
| /s/ Mary McDowell Mary McDowell |
Chief Executive Officer, President and Director (Principal Executive Officer) |
October 8, 2014 | ||
| /s/ Micah Conrad Micah Conrad |
Chief Financial Officer (Principal Financial Officer) |
October 8, 2014 | ||
| /s/ Donna Stone Donna Stone |
Controller (Principal Accounting Officer) |
October 8, 2014 | ||
| /s/ William J. Mills William J. Mills |
Director |
October 8, 2014 | ||
| /s/ Francesco Vanni d’Archirafi Francesco Vanni d’Archirafi |
Director | October 8, 2014 | ||
II-4
Table of Contents
EXHIBIT INDEX
| Exhibit Number |
Description | |||
| 1.1 | * | Form of Underwriting Agreement | ||
| 3.1 | * | Form of Amended and Restated Certificate of Incorporation | ||
| 3.2 | * | Form of Amended and Restated Bylaws | ||
| 4.1 | * | Form of Common Stock Certificate | ||
| 5.1 | * | Opinion of Davis Polk & Wardwell LLP | ||
| 10.1 | * | Form of Stockholder’s Agreement between OneMain Financial Holdings Inc. and Citigroup Inc. | ||
| 10.2 | * | Form of Transition Services Agreement between OneMain Financial Holdings Inc. and Citigroup Inc. | ||
| 10.3 | * | Form of Tax Matters Agreement between OneMain Financial Holdings Inc. and Citigroup Inc. | ||
| 10.4 | * | Form of Employee Matters Agreement between OneMain Financial Holdings Inc. and Citigroup Inc. | ||
| 10.5 | * | Form of Intellectual Property Agreement between OneMain Financial Holdings Inc. and Citigroup Inc. | ||
| 10.6 | * | Form of Registration Rights Agreement between OneMain Financial Holdings Inc. and Citigroup Inc. | ||
| 10.7 | * | Form of Indemnification Agreement | ||
| 21.1 | * | Subsidiaries of the Registrant | ||
| 23.1 | Consent of KPMG LLP | |||
| 23.2 | * | Consent of Davis Polk & Wardwell LLP (included in Exhibit 5.1) | ||
| 24.1 | Power of Attorney (included on signature page) | |||
| * | To be filed by amendment. |
1