Attached files
| file | filename |
|---|---|
| 8-K - 8-K - DiamondRock Hospitality Co | a14-22015_18k.htm |
Exhibit 99.1
|
|
Hilton Garden Inn Times Square Property Showcase October 7, 2014 |

|
|
2 Forward Looking Statements Certain statements made during this presentation are forward-looking statements that are subject to risks and uncertainties. Forward-looking statements generally include the words “believe,” “expect,” “anticipate,” “plan,” “estimate,” “project,” “will,” “intend” or other similar expressions. Forward-looking statements include, without limitation, statements regarding, industry outlook, results of operations, cash flows, business strategies, growth and value opportunities, capital and other expenditures, financing plans, expense reduction initiatives and projected dispositions. Factors that could cause actual results to materially differ from those contained in the forward-looking statements include, without limitation, those risks and uncertainties discussed in the Company’s most recent Annual Report on Form 10-K, quarterly report on Form 10-Q and current reports on Form 8-K, which have been filed with the Securities and Exchange Commission, all of which you should carefully review. The forward-looking statements made are based on our beliefs, assumptions and expectations of future performance, taking into account all information currently available to us. Actual results could differ materially from the forward-looking statements made during this presentation. The forward-looking statements made during this presentation are subject to the safe harbor of the Private Securities Litigation Reform Act of 1995. Any forward-looking statement speaks only as of the date on which it is made. Although the Company believes the expectations reflected in such forward-looking statements are based upon reasonable assumptions, it can give no assurance that the expectations will be attained or that any deviation will not be material. All information in this presentation is as of the date of this presentation, and the Company undertakes no obligation to update any forward- looking statement to conform the statement to actual results or changes in the Company's expectations. This presentation contains statistics and other data that has been obtained or compiled from information made available by third-party service providers. |

|
|
3 Welcome and Agenda 1.Welcome 2.Hilton Garden Inn Times Square Overview 3.Company Update 4.Questions Please join the DiamondRock management team for a cocktail reception following the presentation. |

|
|
4 Hilton Garden Inn Times Square •Background: Born from distressed debt deal •New York City: Great Market Exposure –High RevPARand dynamic demand generators •Operational Wins: •Outsourced F&B •ComplexingOperations with The Lexington •Hotel Adj. EBITDA of $5M in 2014 growing to 9.0% yield ($11M+) in 2015 •Economic Success: Locked in 2010 pricing ($450K/key) with current values indicating $28M NAV gain PROJECTED EBITDA GROWTH Value in Millions 0 2 4 6 8 10 12 14 2014F 2015E 2016E |

|
|
5 New York City Market Overview NYC AVG OCCUPANCY FAR EXCEEDS TOP 25 Supply Growth New York City Midtown East 2014 6.6% 3.9% 2015 5.5% 0.5% Source: PKF Hotel Horizons September to November 2014 Forecast. Source: Lodging Econometrics Q2 2014 Report. •Since 1988, NYC has had a 4.5% RevPAR CAGR, which is 50% higher than the national average during that same period •Occupancy approximately 15 percentage points higher than national average over the same period •Mid-80% occupancy on an annual basis •City tracking to have 55M visitors this year with international inbound travel up 9% on average over the last decade •Times Square has 39M visitors annually Supply Growth –Submarkets Matter •Midtown East submarket has significantly lower supply growth than any other Manhattan submarket •Supply seen declining after 2015 as land prices and construction costs increase and residential use often tops hotel use for available sites NYC AVG REVPAR OVER 2.0x TOP 25 AVG REVPAR $0.00 $50.00 $100.00 $150.00 $200.00 $250.00 $300.00 2009 2010 2011 2012 2013 2014 2015 2016 2017 2018 NYC Top 25 Source: PKF Hotel Horizons September to November 2014 Forecast. 50.0% 60.0% 70.0% 80.0% 90.0% 100.0% 2009 2010 2011 2012 2013 2014 2015 2016 2017 2018 NYC Top 25 |

|
|
6 COMPANY UPDATE |

|
|
7 DiamondRock at aGlance 90% URBAN AND DESTINATION RESORTS IN TOP U.S. MARKETS KEYSTATISTICS Hotels 27 Rooms 11,000+ Enterprise Value $3.5B EnterpriseValue / Key $313,000 Net Debt/EBITDA(2) 4.2x Values in % of 2014F EBITDA(1,3) (1)Based on mid-point of 2014 RevPARguidance and does not include projected results from the Inn at Key West. (2)Based on mid-point of 2014 EBITDA guidance and projected 2014 year-end net debt. (3)Based on 2014F EBITDA for all properties including HGI Time Square Central PF for normalized, full year results. New York20% Destination Resorts16% Chicago13% Boston13% Other CBD10% Minneapolis 5% Los Angeles 5% Washington, DC 5% Denver 5% Other 4% San Diego 3% San Francisco1% INDUSTRY LEADING GROWTH IN 2014 PORTFOLIO TRANSFORMATION LEADS TO HIGHER PORTFOLIO REVPAR .2014F RevPAR Growth: 9.5% -11.5% .3Q14 RevPAR Growth 17% plus .265 Bps Margin Expansion .Margin Growth to Double Peer Average $126.95 $150.97 $120.00 $125.00 $130.00 $135.00 $140.00 $145.00 $150.00 $155.00 2008A 2014 Guidance +20% (1) |

|
|
8 Premier Portfolio Driving Over 17% Q3 RevPAR Growth Hilton Burlington Downtown Hilton Boston Boston Westin Westin Washington DC The Renaissance Dallas / Ft. Worth Courtyard Midtown NYC Courtyard 5thAve NYC Hilton Garden Inn Chelsea NYC Hilton Garden Inn Times Square Lexington Hotel NYC Westin San Diego Hotel Rex San Francisco Atlanta Alpharetta Marriott Courtyard Denver JW Marriott Denver Salt Lake City Marriott Hilton Minneapolis Conrad Chicago Chicago Marriott Charleston Renaissance Sonoma Renaissance Resort and Spa Vail Marriott Mountain Resort Frenchman’s Reef Marriott Resort and Spa Inn at Key West Los Angeles Airport Marriott |

|
|
9 Company Growth Catalysts Position DRH for Multi-Year Outperformance 2015 GROWTH DRIVERS HGI Times Square $6+ EBITDA HGI Times Square Hotel Adj. EBITDA to Reach 9.0% Yield Renovated Portfolio $4 -$5M EBITDA Multi-year Outperformance from Renovated Portfolio: •The Lexington Hotel •Westin DC and Westin San Diego ROI Projects Investment in High ROI and Value-Add Projects: 1.Boston Hilton: Adding 41 keys 2.Boston Westin: Creating 12,500 sq. ft. of new meeting space 3.Lexington: Creating 3-function lounge $4 -$8M EBITDA Asset Management Goal to Further Exceed Average Peer Margin Expansion by 50 –100 bps through 2015 and 2016 •Portfolio 360 bps below prior peak profit margins indicates even further opportunity for future growth beyond 2015 Margin Expansion $1 -$2M EBITDA $1.3M NOI $1.2M NOI $0.5M NOI $15M -$20M EBITDA Ability to execute accretive deals in near term with $250M in dry powder: •Disciplined •Urban and Resort Focus •Near-Term Accretive •Not Capital Disruptive Dry Powder Incremental Value |

|
|
10 Key Takeaways Rendering.jpg.Renovation Fueled Outperformance .360bps of Margin Expansion Opportunity .High Quality Portfolio Bolstered by Recent Capital Recycling .$250M of Investment Capacity .Fortress Balance Sheet with 3.0x Net Debt / EBITDA by 2016 The Lexington New York City Hilton Garden Inn Times Square Westin San Diego |

|
|
11 APPENDIX |

|
|
12 Lodging Cycle –Many Years Left To Go -20% -15% -10% -5% 0% 5% 10% 2002 2003 2004 2005 2006 2007 2008 2009 2010 2011 2012 2013 2014 2015 2016 2017 RevPAR Supply Demand Source: Smith Travel Research August 2014 HISTORICAL AND FORECAST REVPAR, SUPPLY AND DEMAND •RevPAR to increase at a CAGR of 5.5% •Supply and Demand growth favorable through 2016 Forecast through 2017 of: |

|
|
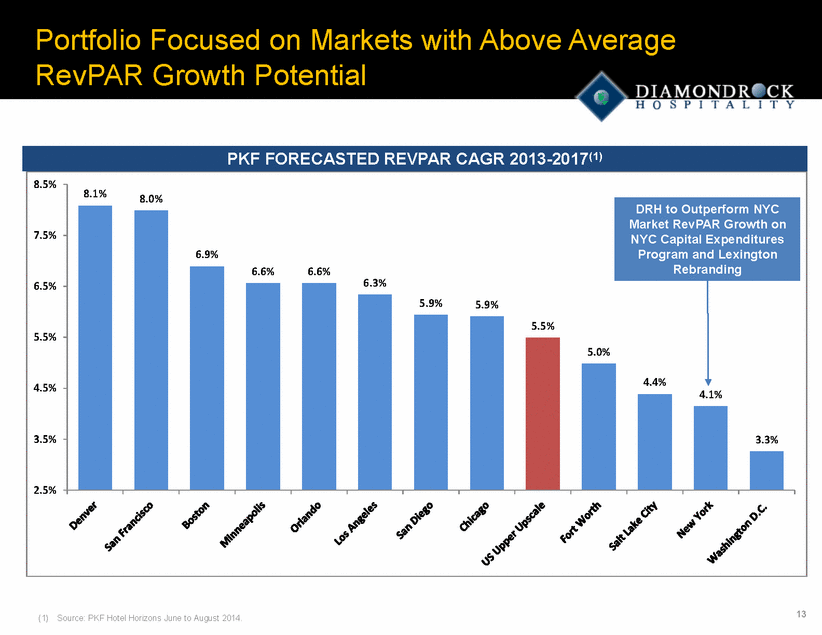
13 8.1%8.0% 6.9% 6.6%6.6% 6.3% 5.9%5.9% 5.5% 5.0% 4.4% 4.1% 3.3% 2.5% 3.5% 4.5% 5.5% 6.5% 7.5% 8.5% Portfolio Focused on Markets with Above Average RevPAR Growth Potential PKF FORECASTED REVPAR CAGR 2013-2017(1) (1)Source: PKF Hotel Horizons June to August 2014. DRH to Outperform NYC Market RevPARGrowth on NYC Capital Expenditures Program and Lexington Rebranding |
|
|
14 Increased Exposure to Urban Hotels •Acquired over 4,000 urban and destination resort rooms since 2010 •Disposed of over 2,600 non-core rooms since 2012 •Increased growth potential based on historical trends •Urban markets historically outperform CURRENT PORTFOLIO (BY EBITDA) -20.0% -15.0% -10.0% -5.0% 0.0% 5.0% 10.0% 15.0% 1988 1989 1990 1991 1992 1993 1994 1995 1996 1997 1998 1999 2000 2001 2002 2003 2004 2005 2006 2007 2008 2009 2010 2011 2012 URBAN US US Urban REVPAR CAGR US Industry REVPAR CAGR HISTORICAL 100BPS REVPAR CAGR PREMIUM FOR URBAN vsU.S. Source: Smith Travel Research Urban, 73% Resort, 16% Other, 11% |

|
|
15 Increased Third Party Managers And Brand Diversification •Goal of 50/50 brand/third-party managers •Adoption of best practices, improving overall portfolio profitability •Increased third party management by 30 percentage points1 •Reduced overall concentration of Marriott brands by 18 percentage points1 and increased diversity of Marriott brands (JW Marriott, Autograph Collection, Renaissance, and Courtyard) Managers CURRENT PORTFOLIO (BY EBITDA)(1) Brands (1)Based on 2014F EBITDA for all properties including HGI Time Square Central PF for normalized, full year results. Marriott44% Hilton9% Starwood8% Third-Party 39% Marriott33% Westin15% Hilton11% Renaissance 9% Autograph 8% Courtyard 8% Hilton Garden Inn 6% Conrad 4% JW Marriott 3% Boutique 3% |

|
|
16 Significant Value Created by Early Cycle Acquisitions 21% -4% -15% -31% 17% 20%20% 12% 15% 9% -40% -30% -20% -10% 0% 10% 20% 30% 2006 2007 2008 2009 2010 2011 2012 2013 2014 2015 U.S. ANNUAL GROWTH IN VALUE PER ROOM .Significant early cycle value appreciation •Price per key increased 68% from 2010 to 2012 .Value creation opportunity remains •Forecasted price per key to increase 40% from 2013 to 2015 Courtyard Denver Charleston Renaissance Source: HVS Hotel Valuation Index |

|
|
17 Portfolio Transformation BETTER MARKETS, HIGHER QUALITY ASSETS $0.4B in Strategic Dispositions Lexington, KY Suburban Atlanta, GA $1.3B in Strategic Acquisitions New York, NY Minneapolis, MN Washington, DC •Intend to sell between 1 to 2 non-core assets over next 24 months •DRH will selectively evaluate acquisitions of strong cash-flowing assets in select target markets Boston, MA Denver, CO San Diego, CA Burlington, VT Charleston, SC San Francisco, CA Suburban Austin, TX Suburban Los Angeles, CA Suburban Chicago, IL Key West, FL |

|
|
18 6.9% 6.5% 10.3% 10.5% 4.0% 6.0% 8.0% 10.0% 12.0% 14.0% YTD 2014 2014E Peer Set Average DRH 137 122 175 265 50 100 150 200 250 300 YTD 2014 2014E Peer Set Average DRH (Bps) DRH Portfolio Outperforming with Additional Upside 1 1 (1)Peer group includes BEE, CHSP, FCH, HST, LHO, PEB, SHO. DRH TO EXCEED PEER SET REVPARGROWTH ABOVE AVERAGE EBITDA MARGIN EXPANSION 143 bps 29.1% 32.7% 28% 30% 32% 34% 2014F Prior Peak (2007) Hotel Adj. EBITDA Margins 370 bps 360 bps SIGNFICANT MARGIN UPSIDE TO PRIOR PEAK •#1 Growth among peer lodging REITs for 2014 •Profit margin upside: •360 bps below prior peak margins |

|
|
19 $20 $22 $24 $26 $28 $30 2014F 2016E $200 $220 $240 $260 $280 2014F 2016E Lexington Hotel Successfully Repositioned •Renovation and rebranding to Autograph Collection complete in 2013 •Successfully generating target returns •ADR increase of approx. $30 since conversion with opportunity to further increase •Approx. 60% of hotel guests are Marriott Reward members •Highest-rated transient segment now 80%+ of mix, discount leisure and contract are less than 20% •Hotel Adj. EBITDA of $20M+ in 2014 and projected to grow to $30M by 2016 •Additional profit upside: •Converting underutilized space into flexible space to be used as concierge lounge, meeting space, and as additional lobby bar seating EXPECTED REVPAR GROWTH OF 18% BY 2016 EBITDA EXPECTED TO GROW BY 26% BY 2016 9% CAGR 12% CAGR |

|
|
20 Continued Outsized Growth From Renovated Portfolio 1 •Expect 20%+ RevPARgrowth in 2H 2014 •Expect to significantly outperform the market through 2016 as RevPARindex grows to 105 from 87 •Opportunity to add highly profitable keys from under-utilized space •Outsized RevPARgrowth through 2016 •Capitalize on prime location adjacent to Federal Courthouse •Further leverage of two new legal war rooms: $0.3M of revenues actualized •Streamlined F&B operations to improve experience and drive efficiencies •4 consecutive quarters of double-digit RevPARgrowth 2H 2014 RevPARgrowth of approx. 20% •2015 group booking pace up approx. 22% •Significant NAV appreciation through creation of 41 new keys from converting under-utilized suites into two rooms Westin DC 2 Westin San Diego 3 Hilton Boston |

|
|
21 0.0%1.0%2.0%3.0%4.0%5.0% BEEFCHSHOPEBDRHHTHSTLHO 2.04.06.08.010.0FCHHTBEEPEBSHOLHODRHHST Best-in-Class Capital Structure Source: Citi Investment Research and Analysis OPTIMAL CAPITAL STRUCTURE •Simple Capital Structure: •No Corporate Debt or Preferreds •Expect to end 2014 with $150M of cash •3.0x net debt-to-EBITDA by 2016 on internal growth •Near-term debt maturities marked to market yields approx. $5M in annual cash flow NET DEBT + PREF / EBITDA Source: Citi Investment Research and Analysis SUSTAINABLE DIVIDEND YIELD WITH $500M OF CAPITAL RETURNED TO SHAREHOLDERS Hilton Boston Boston Westin Conrad Chicago Vail Marriott Courtyard Denver Hotel Rex SanFrancisco Hilton Burlington Hilton Garden Inn Chelsea Alpharetta Marriott Charleston Renaissance Bethesda Marriott Suites HGI Times Square Inn at Key West 13 UNENCUMBERED HOTELS Chicago Marriott Lexington Hotel Hilton Minneapolis Frenchman’s Reef Marriott LAX Marriott JWMarriott Cherry Creek Courtyard 5thAvenue Courtyard Midtown East Salt Lake City Marriott Worthington Renaissance Orlando Airport Marriott Westin Washington, DC Sonoma Renaissance Westin San Diego 14 ENCUMBERED HOTELS 13 UNENCUMBERED HOTELS WITH $1.4B ASSET VALUE |

|
|
22 Plan to Support Funding Needs .Achieve 3.0x net debt/EBITDA by 2016 .Maximize flexibility to address capital needs •End 2014 with $150M cash, generate $40M to $50M in annual free cash flow •Borrowing capacity of $600M to $700M from unencumbered hotels •Refinancing of debt maturities through 2016 •$200M of credit line capacity plus $200M accordion option .Debt Maturities .Dividends FUNDING NEEDS ACTION PLAN |

|
|
23 Accretive External Growth Potential .Preference for hotels located in urban markets (Top 15 MSAs) or resort locations where DRH is currently underexposed and where there are high barriers to entry .Will avoid significant capital investment or deep/lengthy turnaround .Brand and management diversity .Near-term accretive 1.Ability to acquire assets without raising equity 2.Potential to acquire approx. $250 of high-quality assets 3.New CIO with strong hotel transaction experience and deep industry relationships 4.Targeting off-market deals to uncover high value opportunities PLATFORM TO TARGET ACCRETIVE DEALS KEY INVESTMENT CRITERIA Acquired Inn at Key West in Top RevPARMarket in the US Acquired Hilton Garden Inn Times Square at 20% Discount to Market Value |
