Attached files
| file | filename |
|---|---|
| 8-K - CURRENT REPORT OF MATERIAL EVENTS OR CORPORATE CHANGES - Helmerich & Payne, Inc. | a14-21969_18k.htm |
Exhibit 99.1
|
|
Helmerich & Payne, Inc. Investor Relations Meetings October 6, 2014 |

|
|
Statements within this presentation are “forward-looking statements” within the meaning of the Securities Act of 1933 and the Securities Exchange Act of 1934, and are based on current expectations and assumptions that are subject to risks and uncertainties. All statements other than statements of historical facts included in this release, including, without limitation, statements regarding the registrant’s future financial position, business strategy, budgets, projected costs and plans and objectives of management for future operations, are forward looking statements. For information regarding risks and uncertainties associated with the Company’s business, please refer to the “Risk Factors” and “Management’s Discussion & Analysis of Financial Condition and Results of Operations” sections of the Company’s SEC filings, including but not limited to, its annual report on Form 10-K and quarterly reports on Form 10-Q. As a result of these factors, Helmerich & Payne, Inc.’s actual results may differ materially from those indicated or implied by such forward-looking statements. We undertake no duty to update or revise our forward-looking statements based on changes in internal estimates, expectations or otherwise, except as required by law. Forward-looking Statements |
|
|
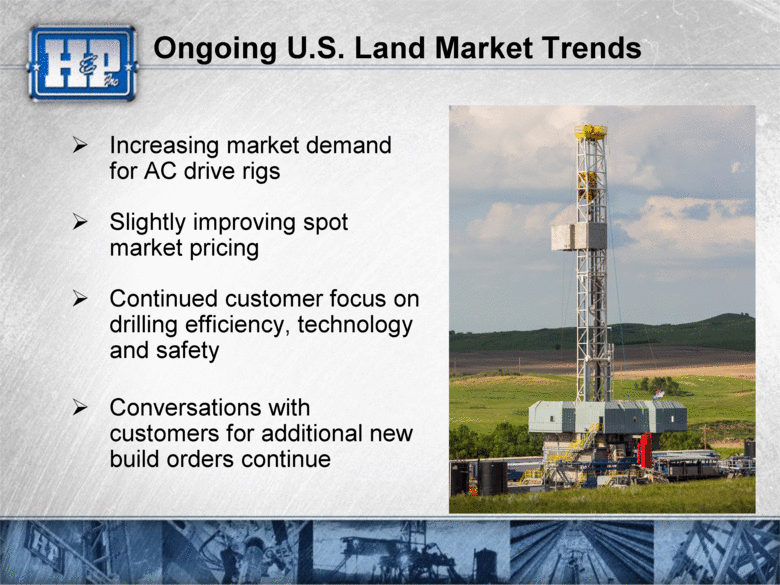
Ongoing U.S. Land Market Trends Increasing market demand for AC drive rigs Slightly improving spot market pricing Continued customer focus on drilling efficiency, technology and safety Conversations with customers for additional new build orders continue |
|
|
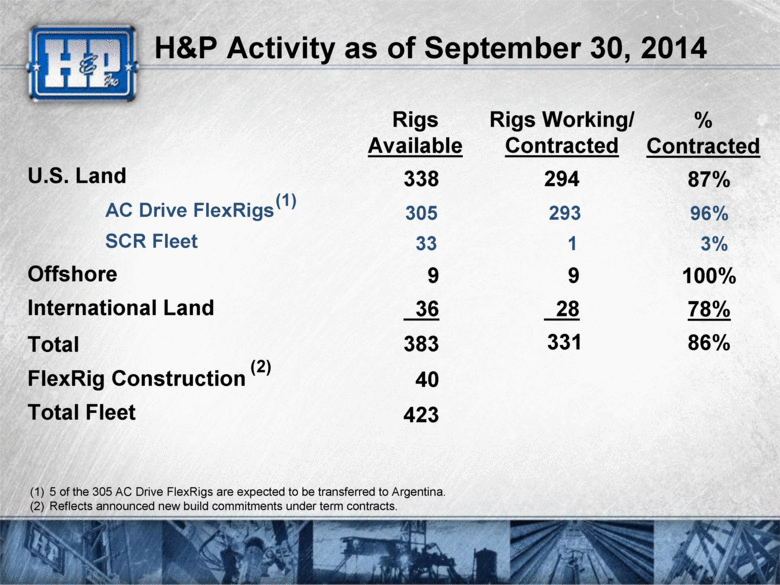
H&P Activity as of September 30, 2014 Rigs Working/ Contracted 294 293 1 9 28 331 Rigs Available 338 305 33 9 36 383 40 423 % Contracted 87% 96% 3% 100% 78% 86% U.S. Land AC Drive FlexRigs SCR Fleet Offshore International Land Total FlexRig Construction Total Fleet 5 of the 305 AC Drive FlexRigs are expected to be transferred to Argentina. Reflects announced new build commitments under term contracts. (1) (2) |
|
|
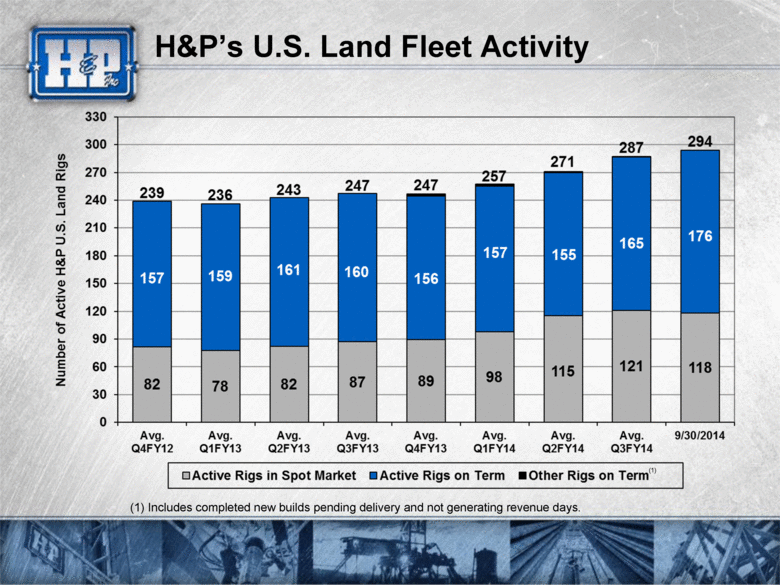
H&P’s U.S. Land Fleet Activity (1) (1) Includes completed new builds pending delivery and not generating revenue days. |
|
|
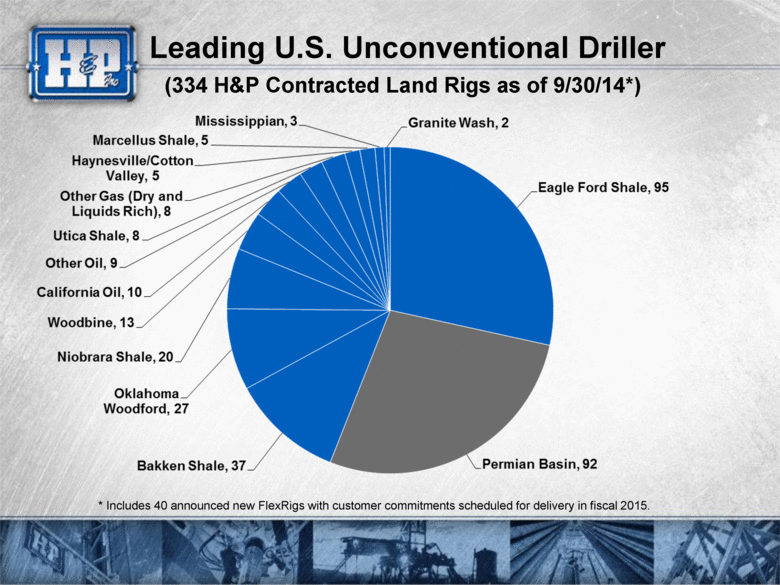
Leading U.S. Unconventional Driller * Includes 40 announced new FlexRigs with customer commitments scheduled for delivery in fiscal 2015. (334 H&P Contracted Land Rigs as of 9/30/14*) |
|
|
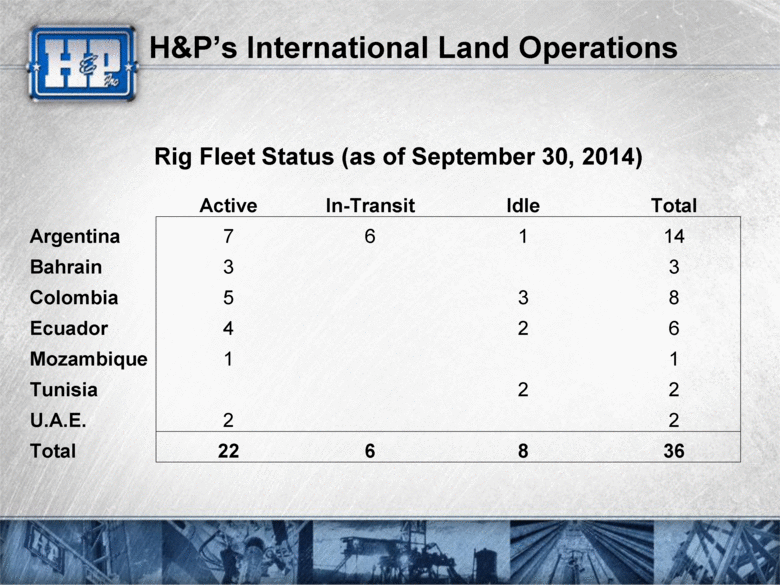
H&P’s International Land Operations Rig Fleet Status (as of September 30, 2014) Active In-Transit Idle Total Argentina 7 6 1 14 Bahrain 3 3 Colombia 5 3 8 Ecuador 4 2 6 Mozambique 1 1 Tunisia 2 2 U.A.E. 2 2 Total 22 6 8 36 |
|
|
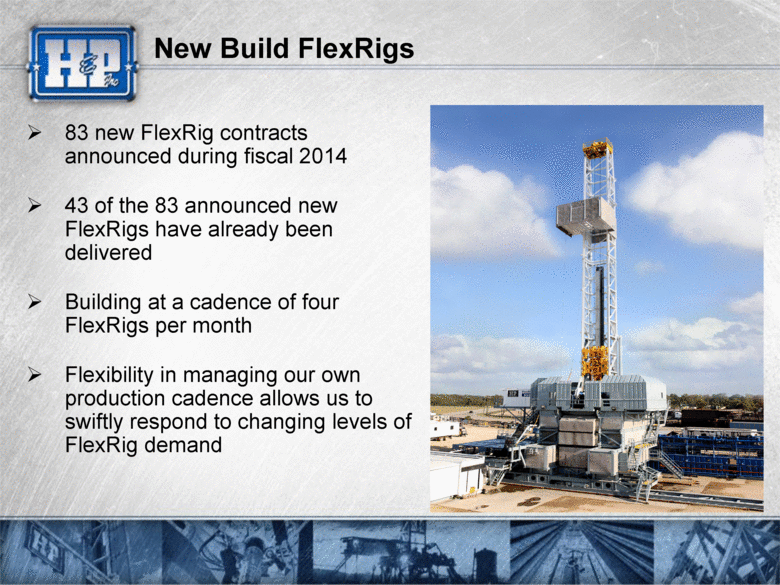
New Build FlexRigs 83 new FlexRig contracts announced during fiscal 2014 43 of the 83 announced new FlexRigs have already been delivered Building at a cadence of four FlexRigs per month Flexibility in managing our own production cadence allows us to swiftly respond to changing levels of FlexRig demand |
|
|
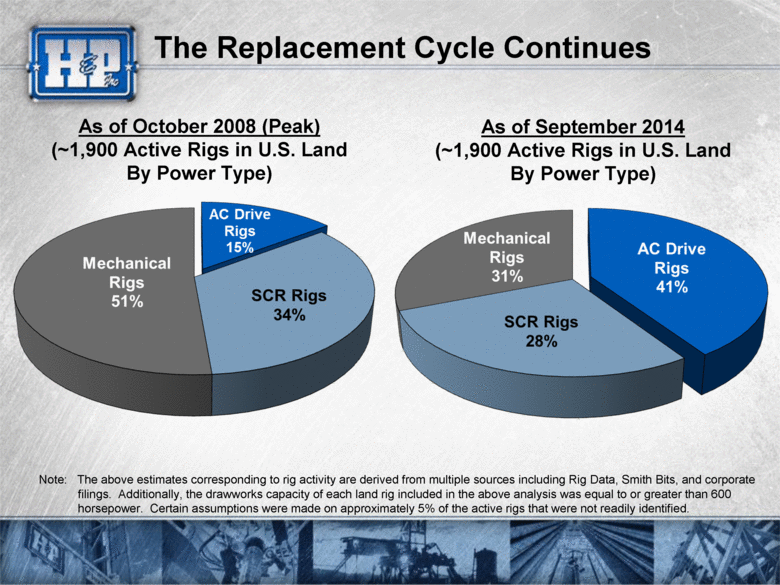
As of September 2014 (~1,900 Active Rigs in U.S. Land By Power Type) The Replacement Cycle Continues As of October 2008 (Peak) (~1,900 Active Rigs in U.S. Land By Power Type) Note: The above estimates corresponding to rig activity are derived from multiple sources including Rig Data, Smith Bits, and corporate filings. Additionally, the drawworks capacity of each land rig included in the above analysis was equal to or greater than 600 horsepower. Certain assumptions were made on approximately 5% of the active rigs that were not readily identified. |
|
|
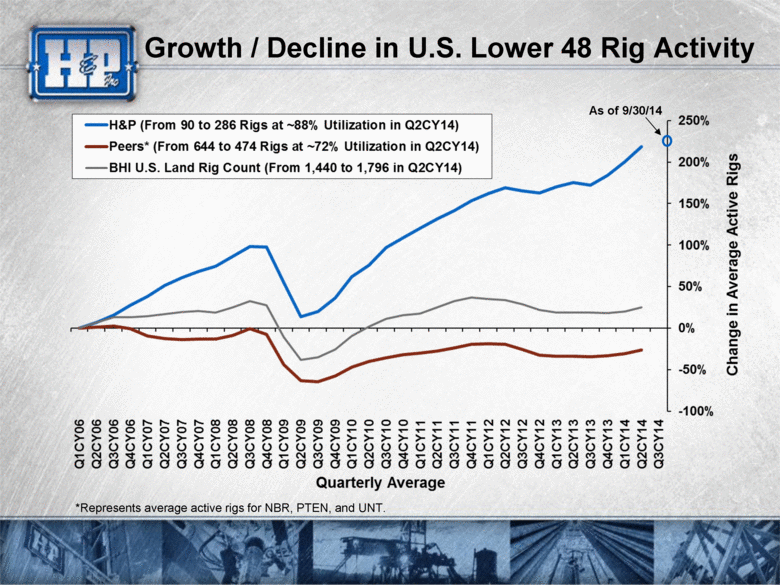
Growth / Decline in U.S. Lower 48 Rig Activity As of 9/30/14 *Represents average active rigs for NBR, PTEN, and UNT. |
|
|
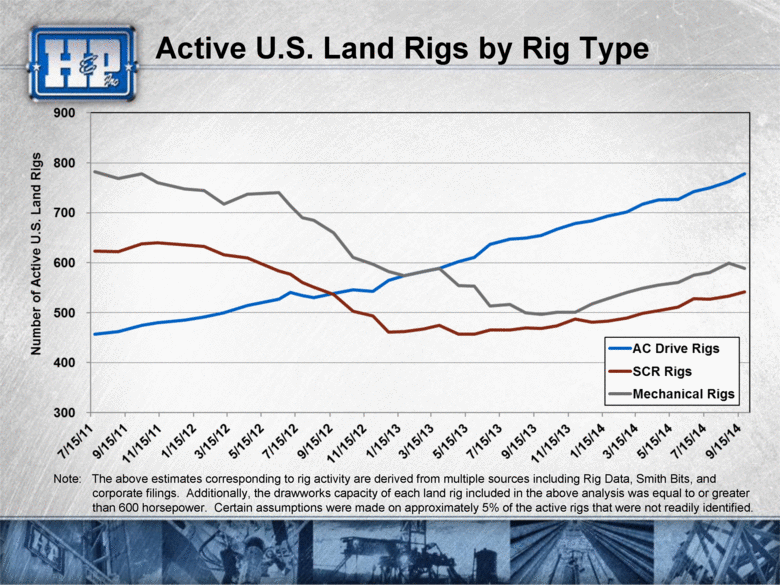
Active U.S. Land Rigs by Rig Type Note: The above estimates corresponding to rig activity are derived from multiple sources including Rig Data, Smith Bits, and corporate filings. Additionally, the drawworks capacity of each land rig included in the above analysis was equal to or greater than 600 horsepower. Certain assumptions were made on approximately 5% of the active rigs that were not readily identified. |
|
|
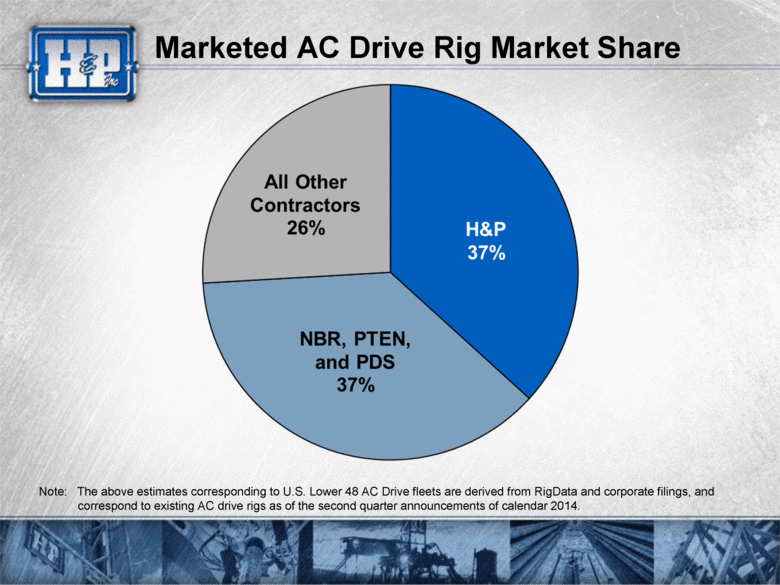
Marketed AC Drive Rig Market Share Note: The above estimates corresponding to U.S. Lower 48 AC Drive fleets are derived from RigData and corporate filings, and correspond to existing AC drive rigs as of the second quarter announcements of calendar 2014. |
|
|
End of Document |