Attached files
| file | filename |
|---|---|
| 8-K - 8-K - STARWOOD PROPERTY TRUST, INC. | a14-21692_18k.htm |
Exhibit 99.1
|
|
Starwood Property Trust Investor Presentation | September 2014 |
|
|
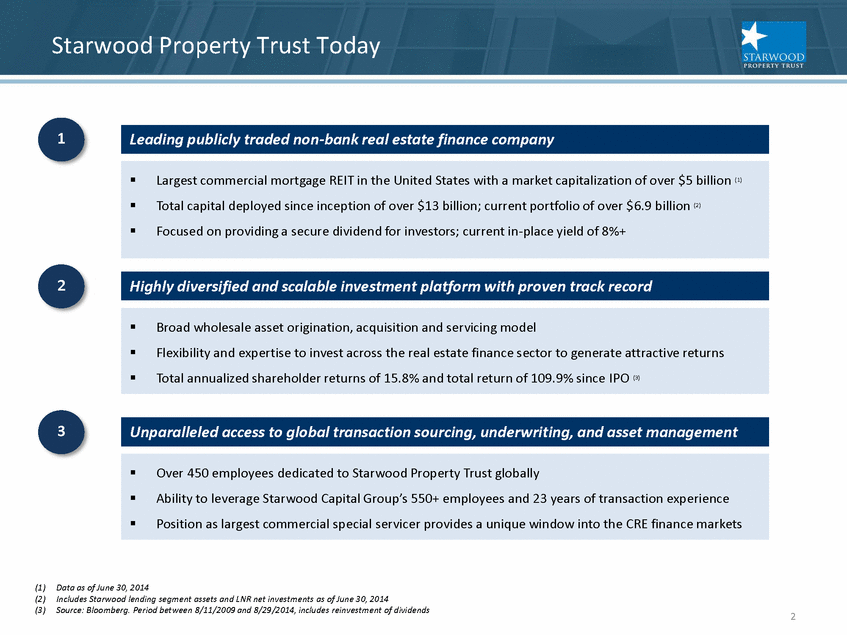
Starwood Property Trust Today Leading publicly traded non-bank real estate finance company Largest commercial mortgage REIT in the United States with a market capitalization of over $5 billion (1) Total capital deployed since inception of over $13 billion; current portfolio of over $6.9 billion (2) Focused on providing a secure dividend for investors; current in-place yield of 8%+ Highly diversified and scalable investment platform with proven track record Broad wholesale asset origination, acquisition and servicing model Flexibility and expertise to invest across the real estate finance sector to generate attractive returns Total annualized shareholder returns of 15.8% and total return of 109.9% since IPO (3) Unparalleled access to global transaction sourcing, underwriting, and asset management Over 450 employees dedicated to Starwood Property Trust globally Ability to leverage Starwood Capital Group’s 550+ employees and 23 years of transaction experience Position as largest commercial special servicer provides a unique window into the CRE finance markets (1) Data as of June 30, 2014 (2) Includes Starwood lending segment assets and LNR net investments as of June 30, 2014 (3) Source: Bloomberg. Period between 8/11/2009 and 8/29/2014, includes reinvestment of dividends 2 |
|
|
Premiere Real Estate Finance Franchise Full scale real estate finance platform allows for a broad investment scope Conduit Loans First Mortgages Construction Loans Mezzanine Loans Preferred Equity RMBS CMBS CMBS B-Pieces Note: Figures as of June 30, 2014 unless otherwise noted 3 |
|
|
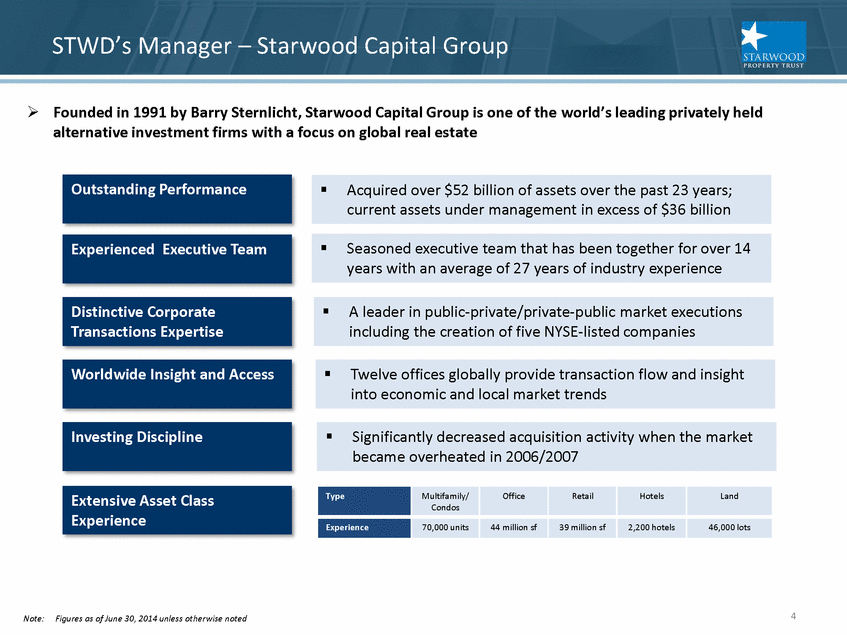
STWD’s Manager – Starwood Capital Group Founded in 1991 by Barry Sternlicht, Starwood Capital Group is one of the world’s leading privately held alternative investment firms with a focus on global real estate Outstanding Performance Experienced Executive Team Distinctive Corporate Transactions Expertise Worldwide Insight and Access Investing Discipline Extensive Asset Class Experience Acquired over $52 billion of assets over the past 23 years; current assets under management in excess of $36 billion Seasoned executive team that has been together for over 14 years with an average of 27 years of industry experience A leader in public-private/private-public market executions including the creation of five NYSE-listed companies Twelve offices globally provide transaction flow and insight into economic and local market trends Significantly decreased acquisition activity when the market became overheated in 2006/2007 Type Multifamily/ Office Retail Hotels Land Condos Experience 70,000 units 44 million sf 39 million sf 2,200 hotels 46,000 lots Note: Figures as of June 30, 2014 unless otherwise noted 4 |
|
|
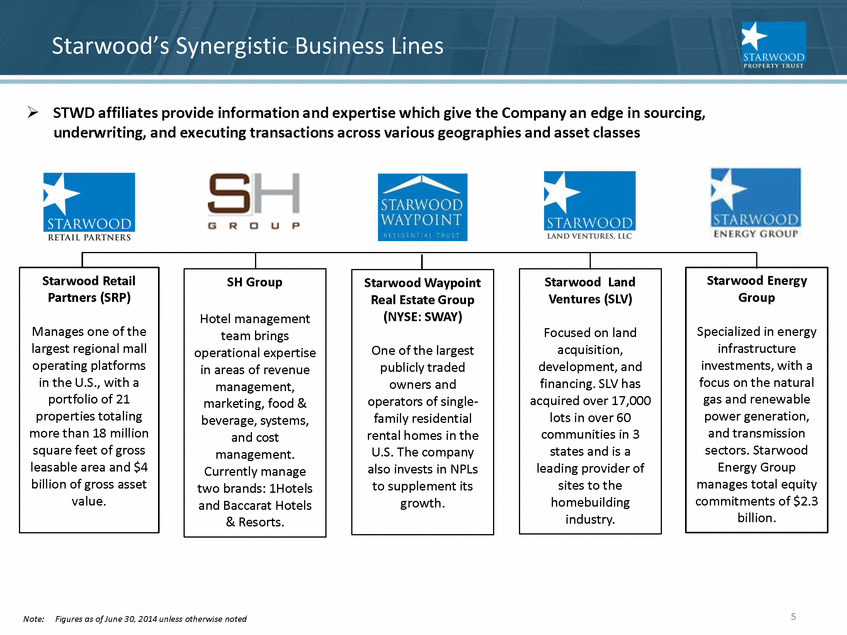
starwood’s Syngistic Business Lines STWD affiliates provide information and expertise which give the Company an edge in sourcing, underwriting, and executing transactions across various geographies and asset classes Starwood Retail Partners (SRP) Manages one of the largest regional mall operating platforms in the U.S., with a portfolio of 21 properties totaling more than 18 million square feet of gross leasable area and $4 billion of gross asset value. SH Group Hotel management team brings operational expertise in areas of revenue management, marketing, food & beverage, systems, and cost management. Currently manage two brands: 1Hotels and Baccarat Hotels & Resorts. Starwood Waypoint Real Estate Group (NYSE: SWAY) One of the largest publicly traded owners and operators of single- family residential rental homes in the U.S. The company also invests in NPLs to supplement its growth. Starwood Land Ventures (SLV) Focused on land acquisition, development, and financing. SLV has acquired over 17,000 lots in over 60 communities in 3 states and is a leading provider of sites to the homebuilding industry. Starwood Energy Group Specialized in energy infrastructure investments, with a focus on the natural gas and renewable power generation, and transmission sectors. Starwood Energy Group manages total equity commitments of $2.3 billion. Note: Figures as of June 30, 2014 unless otherwise noted 5 |
|
|
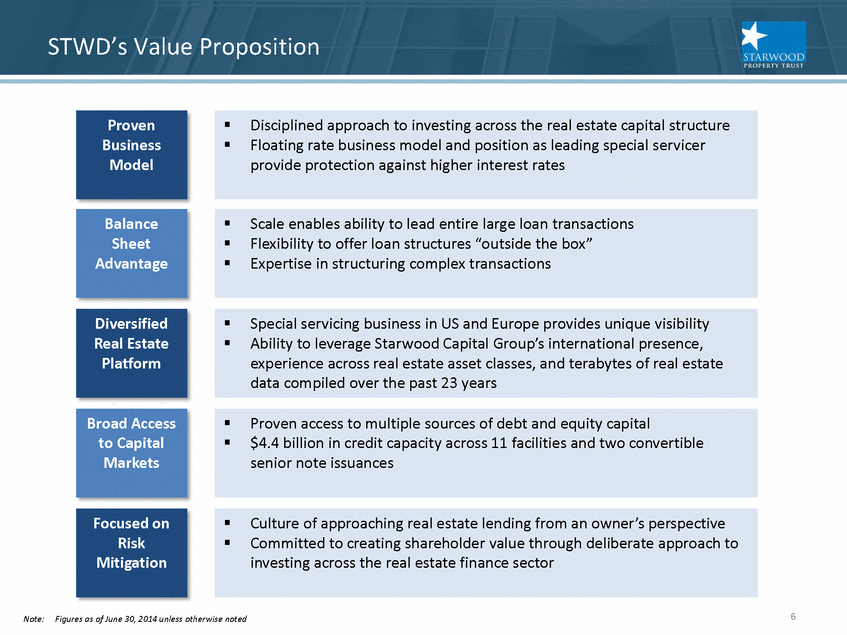
STWD’s Value Proposition Proven Business Model Balance Sheet Advantage Diversified Real Estate Platform Broad Access to Capital Markets Focused on Risk Mitigation Disciplined approach to investing across the real estate capital structure Floating rate business model and position as leading special servicer provide protection against higher interest rates Scale enables ability to lead entire large loan transactions Flexibility to offer loan structures “outside the box” Expertise in structuring complex transactions Special servicing business in US and Europe provides unique visibility Ability to leverage Starwood Capital Group’s international presence, experience across real estate asset classes, and terabytes of real estate data compiled over the past 23 years Proven access to multiple sources of debt and equity capital $4.4 billion in credit capacity across 11 facilities and two convertible senior note issuances Culture of approaching real estate lending from an owner’s perspective Committed to creating shareholder value through deliberate approach to investing across the real estate finance sector Note: Figures as of June 30, 2014 unless otherwise noted 6 |
|
|
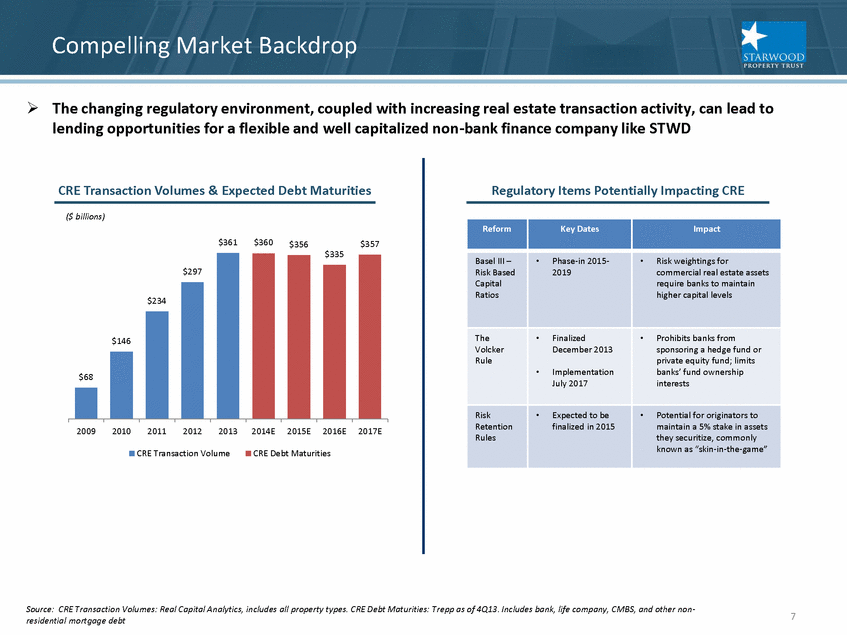
Compelling Market Backdrop The changing regulatory environment, coupled with increasing real estate transaction activity, can lead to lending opportunities for a flexible and well capitalized non-bank finance company like STWD CRE Transaction Volumes & Expected Debt Maturities ($ billions) $68 $146 $234 $297 $361 $360 $356 $335 $357 2009 2010 2011 2012 2013 2014E 2015E 2016E 2017E CRE Transaction Volume CRE Debt Maturities Regulatory Items Potentially Impacting CRE Reform Key Dates Impact Basel III – Risk Based Capital Ratios Phase-in 2015-2019 Risk weightings for commercial real estate assets require banks to maintain higher capital levels The Volcker Rule Finalized December 2013 Implementation July 2017 Prohibits banks from sponsoring a hedge fund or private equity fund; limits banks’ fund ownership interests Risk Retention Rules • Expected to be finalized in 2015 • Potential for originators to maintain a 5% stake in assets they securitize, commonly known as “skin-in-the-game” Source: CRE Transaction Volumes: Real Capital Analytics, includes all property types. CRE Debt Maturities: Trepp as of 4Q13. Includes bank, life company, CMBS, and other non-residential mortgage debt 7 |
|
|
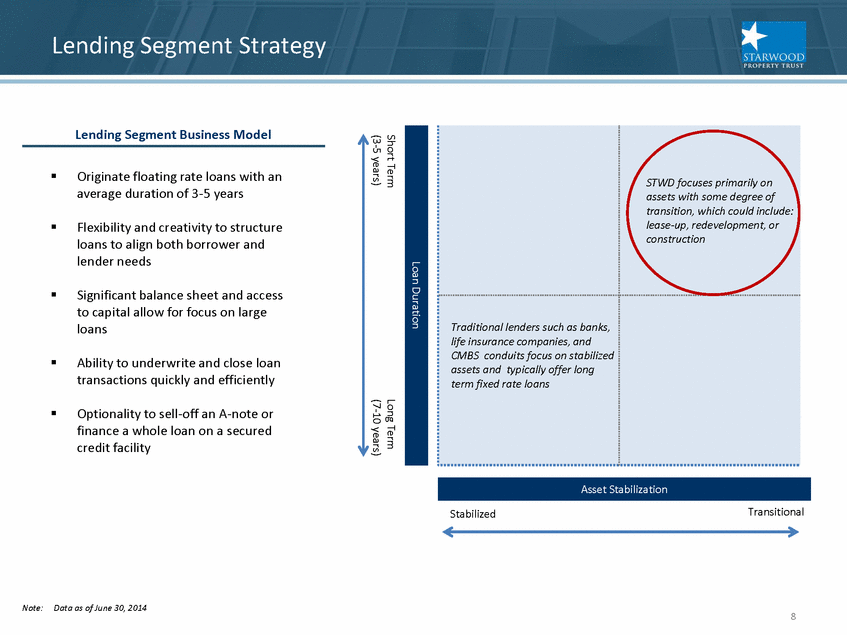
Lending Segment Strategy Lending Segment Business Model Originate floating rate loans with an average duration of 3-5 years Flexibility and creativity to structure loans to align both borrower and lender needs Significant balance sheet and access to capital allow for focus on large loans Ability to underwrite and close loan transactions quickly and efficiently Optionality to sell-off an A-note or finance a whole loan on a secured credit facility STWD focuses primarily on assets with some degree of transition, which could include: lease-up, redevelopment, or construction Traditional lenders such as banks, life insurance companies, and CMBS conduits focus on stabilized assets and typically offer long term fixed rate loans Asset Stabilization Stabilized Transitional Note: Data as of June 30, 2014 8 |
|
|
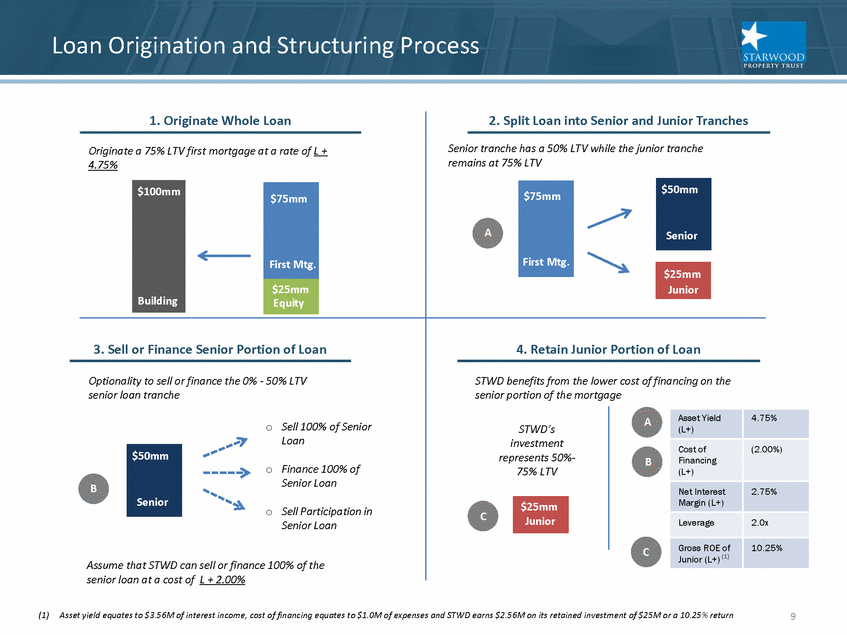
Loan Origination and Structuring Proces 1. Originate Whole Loan Originate a 75% LTV first mortgage at a rate of L + 4.75% $100mm Building $75mm First Mtg. $25mm Equity rst Mt 3. Sell or Finance Senior Portion of Loan Optionality to sell or finance the 0% - 50% LTV senior loan tranche Assume that STWD can sell or finance 100% of the senior loan at a cost of L + 2.00% Sell 100% of Senior Loan Finance 100% of Senior Loan Sell Participation in Senior Loan 2. Split Loan into Senior and Junior Tranches Senior tranche has a 50% LTV while the junior tranche remains at 75% LTV $75mm First Mtg. $50mm Senior $25mm $25mm Junior 4. Retain Junior Portion of Loan STWD benefits from the lower cost of financing on the senior portion of the mortgage STWD’s investment represents 50%- 75% LTV $25mm Junior Asset Yield (L+) 4.75% Cost of Financing (L+) Net Interest Margin (L+) 2.75% Leverage 2.0x Gross ROE of Junior (L+) (1) 10.25% (1) Asset yield equates to $3.56M of interest income, cost of financing equates to $1.0M of expenses and STWD earns $2.56M on its retained investment of $25M or a 10.25% return 9 |
|
|
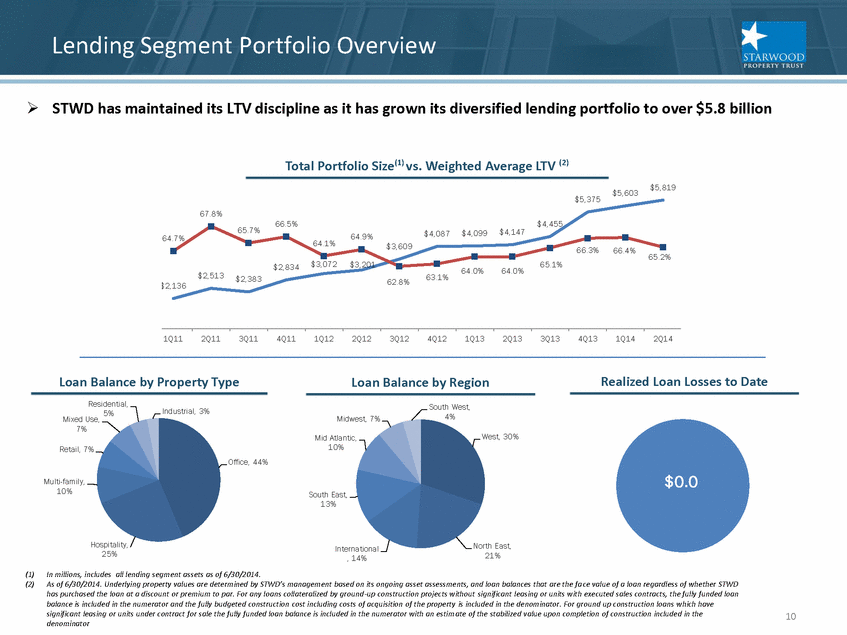
Lending Segment Portfolio Overview STWD has maintained its LTV discipline as it has grown its diversified lending portfolio to over $5.8 billion (1) In millions, includes all lending segment assets as of 6/30/2014. (2) As of 6/30/2014. Underlying property values are determined by STWD’s management based on its ongoing asset assessments, and loan balances that are the face value of a loan regardless of whether STWD has purchased the loan at a discount or premium to par. For any loans collateralized by ground-up construction projects without significant leasing or units with executed sales contracts, the fully funded loan balance is included in the numerator and the fully budgeted construction cost including costs of acquisition of the property is included in the denominator. For ground up construction loans which have significant leasing or units under contract for sale the fully funded loan balance is included in the numerator with an estimate of the stabilized value upon completion of construction included in the denominator 10 |
|
|
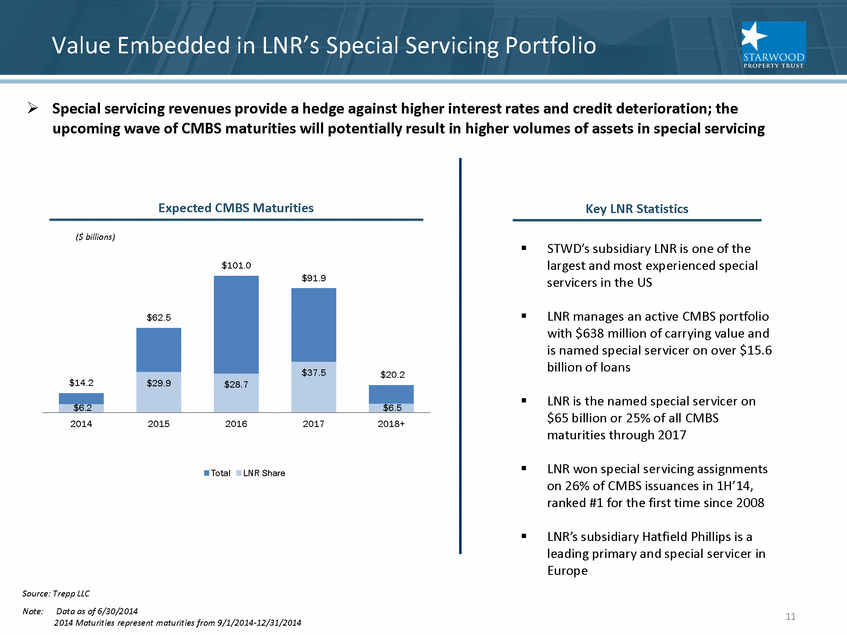
Special servicing revenues provide a hedge against higher interest rates and credit deterioration; the upcoming wave of CMBS maturities will potentially result in higher volumes of assets in special servicing Value Embedded in LNR’s Special Servicing Portfolio ($ billions) Source: Trepp LLC Note: Data as of 6/30/2014 2014 Maturities represent maturities from 9/1/2014-12/31/2014 $14.2 $62.5 $101.0 $91.9 $20.2 $6.2 $29.9 $28.7 $37.5 $6.5 2014 2015 2016 2017 2018+ Total LNR Share Key LNR Statistics STWD’s subsidiary LNR is one of the largest and most experienced special servicers in the US LNR manages an active CMBS portfolio with $638 million of carrying value and is named special servicer on over $15.6 billion of loans LNR is the named special servicer on $65 billion or 25% of all CMBS maturities through 2017 LNR won special servicing assignments on 26% of CMBS issuances in 1H’14, ranked #1 for the first time since 2008 LNR’s subsidiary Hatfield Phillips is a leading primary and special servicer in Europ 11 |
|
|
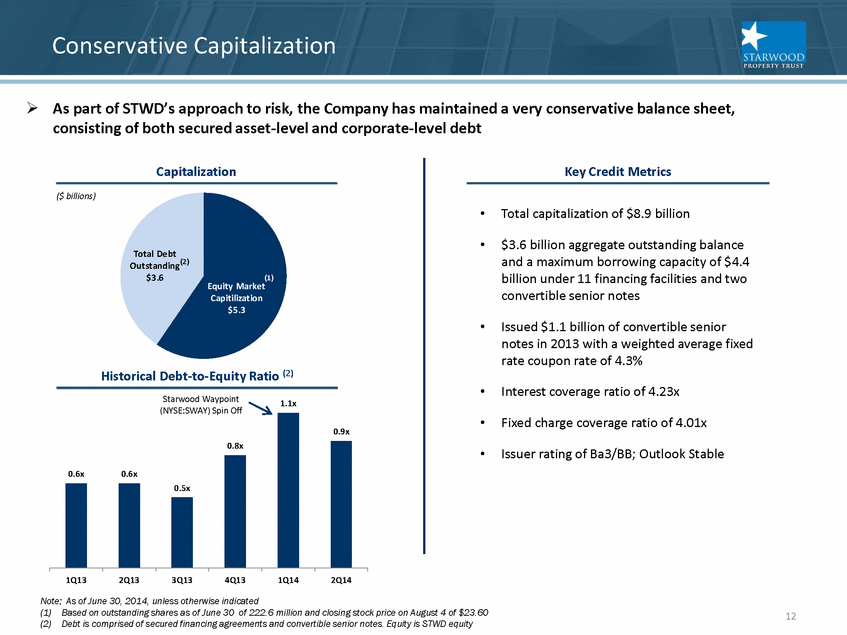
Conservative Capitalization As part of STWD’s approach to risk, the Company has maintained a very conservative balance sheet, consisting of both secured asset-level and corporate-level debt Key Credit Metrics Total capitalization of $8.9 billion $3.6 billion aggregate outstanding balance and a maximum borrowing capacity of $4.4 billion under 11 financing facilities and two convertible senior notes Issued $1.1 billion of convertible senior notes in 2013 with a weighted average fixed rate coupon rate of 4.3% Interest coverage ratio of 4.23x Fixed charge coverage ratio of 4.01x Issuer rating of Ba3/BB; Outlook Stable Note: As of June 30, 2014, unless otherwise indicated (1) Based on outstanding shares as of June 30 of 222.6 million and closing stock price on August 4 of $23.60 (2) Debt is comprised of secured financing agreements and convertible senior notes. Equity is STWD equity 12 |
|
|
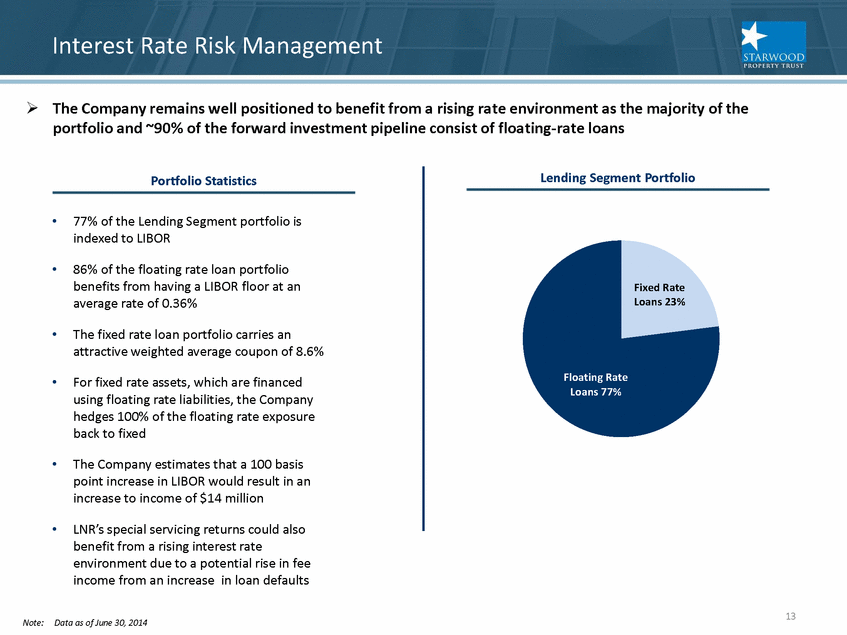
Compelling Market Opportunity The Company remains well positioned to benefit from a rising rate environment as the majority of the portfolio and ~90% of the forward investment pipeline consist of floating-rate loans Interest Rate Risk Management Portfolio Statistics 77% of the Lending Segment portfolio is indexed to LIBOR 86% of the floating rate loan portfolio benefits from having a LIBOR floor at an average rate of 0.36% The fixed rate loan portfolio carries an attractive weighted average coupon of 8.6% For fixed rate assets, which are financed using floating rate liabilities, the Company hedges 100% of the floating rate exposure back to fixed The Company estimates that a 100 basis point increase in LIBOR would result in an increase to income of $14 million LNR’s special servicing returns could also benefit from a rising interest rate environment due to a potential rise in fee income from an increase in loan defaults Lending Segment Portfolio Note: Data as of June 30, 2014 13 |
|
|
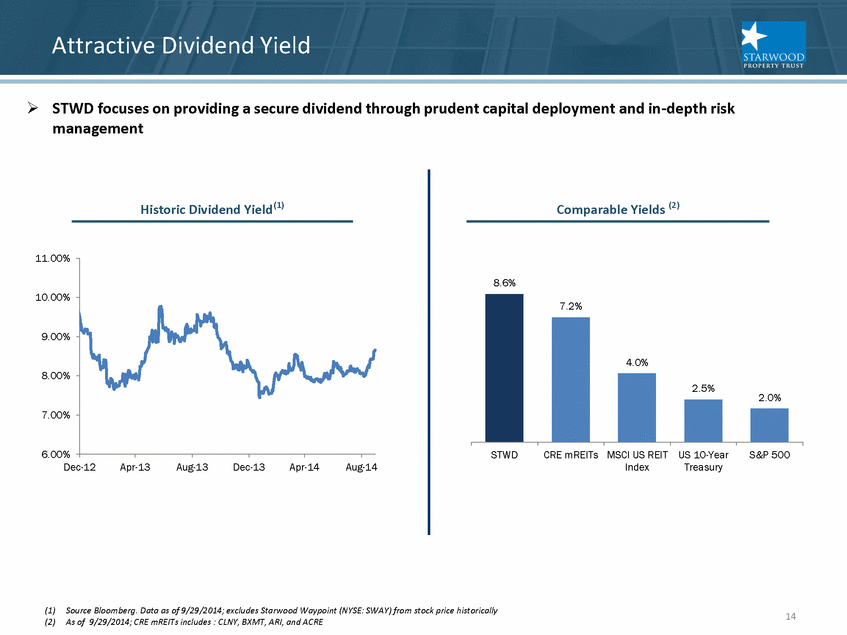
Attractive Dividend yield STWD focuses on providing a secure dividend through prudent capital deployment and in-depth risk management (1) Source Bloomberg. Data as of 9/29/2014; excludes Starwood Waypoint (NYSE: SWAY) from stock price historically (2) As of 9/29/2014; CRE mREITs includes : CLNY, BXMT, ARI, and ACRE 14 |
|
|
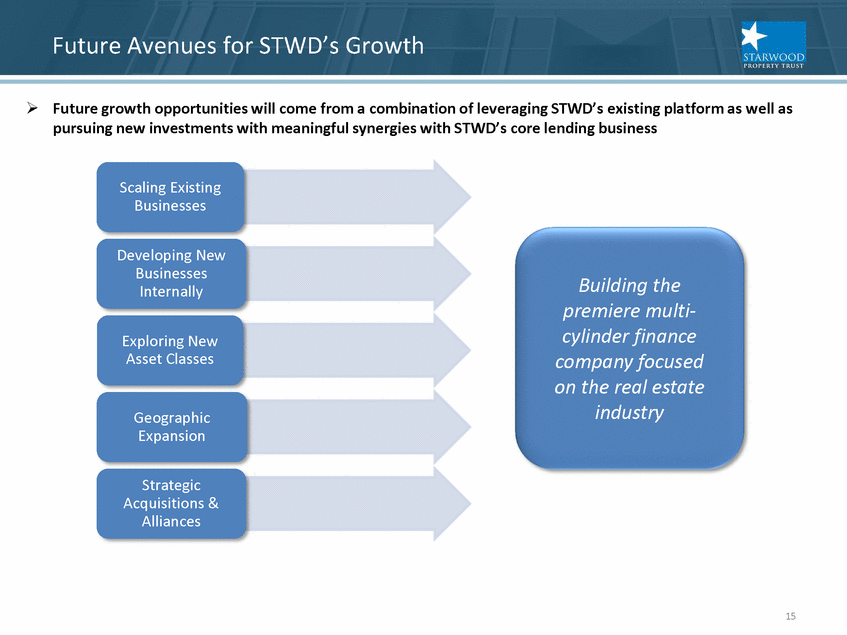
Future Avenues for STWD’s Growth Future growth opportunities will come from a combination of leveraging STWD’s existing platform as well as pursuing new investments with meaningful synergies with STWD’s core lending business Scaling Existing Businesses Developing New Businesses Internally Exploring New Asset Classes Geographic Expansion Strategic Acquisitions & Alliances Building the premiere multi-cylinder finance company focused on the real estate industry 15 |
|
|
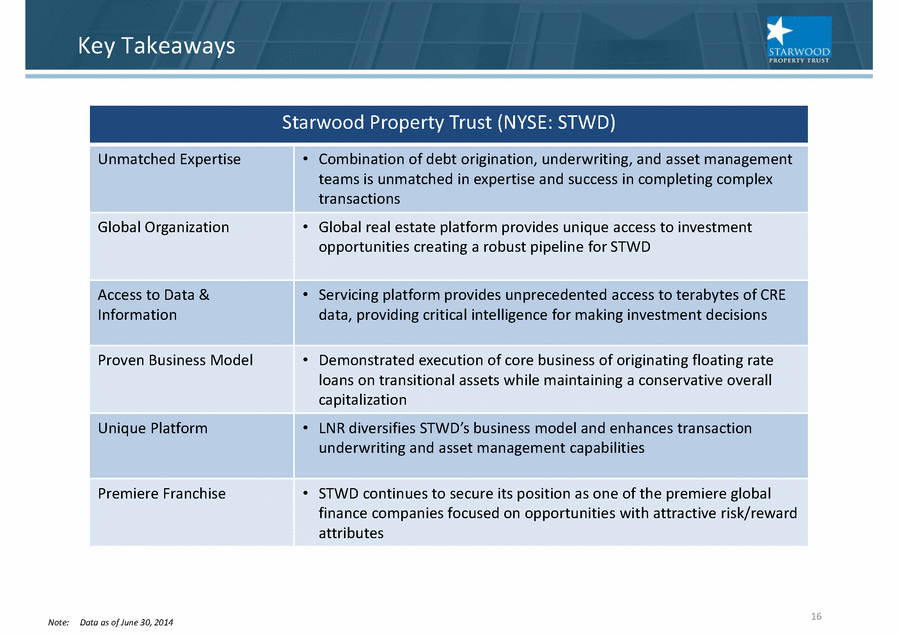
Key Takeaways Starwood Property Trust (NYSE: STWD) Unmatched Expertise Combination of debt origination, underwriting, and asset management teams is unmatched in expertise and success in completing complex transactions Global Organization Global real estate platform provides unique access to investment opportunities creating a robust pipeline for STWD Access to Data & Information Servicing platform provides unprecedented access to terabytes of CRE data, providing critical intelligence for making investment decisions Proven Business Model Demonstrated execution of core business of originating floating rate loans on transitional assets while maintaining a conservative overall capitalization Unique Platform LNR diversifies STWD’s business model and enhances transaction underwriting and asset management capabilities Premiere Franchise STWD continues to secure its position as one of the premiere global finance companies focused on opportunities with attractive risk/reward attributes Note: Data as of June 30, 2014 16 |
|
|
Forward Looking Financial Statements This presentation contains certain forward-looking statements, including without limitation, statements concerning our operations, economic performance and financial condition. These forward-looking statements are made pursuant to the safe harbor provisions of the Private Securities Litigation Reform Act of 1995. Forward-looking statements are developed by combining currently available information with our beliefs and assumptions and are generally identified by the words “believe,” “expect,” “anticipate,” and other similar expressions. Forward-looking statements do not guarantee future performance, which may be materially different from that expressed in, or implied by, any such statements. Readers are cautioned not to place undue reliance on these forward-looking statements, which speak only as of their dates. These forward-looking statements are based largely on our current beliefs, assumptions and expectations of our future performance taking into account all information currently available to us. These beliefs, assumptions and expectations can change as a result of many possible events or factors, not all of which are known to us or within our control, and which could materially affect actual results, performance or achievements. Factors that may cause actual results to vary from our forward-looking statements include, but are not limited to: • factors described in our Annual Report on Form 10-K for the year ended December 31, 2013, including those set forth under the captions “Risk Factors” and “Business”; • defaults by borrowers in paying debt service on outstanding indebtedness and in our quarterly reports on Form 10-Q for the quarters ended June 30, 2014 and March 31, 2014; • impairment in the value of real estate property securing our loans; • availability of mortgage origination and acquisition opportunities acceptable to us; • our ability to fully integrate LNR Property LLC, a Delaware limited liability company (“LNR”), which was acquired on April 19, 2013, into our business and achieve the benefits that we anticipate from this acquisition; • potential mismatches in the timing of asset repayments and the maturity of the associated financing agreements; • national and local economic and business conditions; • general and local commercial and residential real estate property conditions; • changes in federal government policies; • changes in federal, state and local governmental laws and regulations; • increased competition from entities engaged in mortgage lending; • changes in interest rates; and • the availability and costs associated with sources of liquidity. Additional risk factors are identified in our filings with the U.S. Securities Exchange Commission (the “SEC”), which are available on our website at http://www.starwoodpropertytrust.com and the SEC’s website at http://www.sec.gov. If a change occurs, our business, financial condition, liquidity and results of operations may vary materially from those expressed in our forward-looking statements. As a result, our business, financial condition, liquidity and results of operations may vary materially from those expressed in our forward-looking statements. We undertake no obligation to update or revise any forward-looking statements, whether as a result of new information, future events or otherwise. In light of these risks, uncertainties and assumptions, the events described by our forward-looking statements might not occur. We qualify any and all of our forward-looking statements by these cautionary factors. Please keep this cautionary note in mind as you assess the information given in this presentation. 17 |

