Attached files
| file | filename |
|---|---|
| EX-3.1 - EX-3.1 - Veritex Holdings, Inc. | a2221578zex-3_1.htm |
| EX-4.1 - EX-4.1 - Veritex Holdings, Inc. | a2221578zex-4_1.htm |
| EX-23.2 - EX-23.2 - Veritex Holdings, Inc. | a2221578zex-23_2.htm |
| EX-5.1 - EX-5.1 - Veritex Holdings, Inc. | a2221578zex-5_1.htm |
| EX-10.8 - EX-10.8 - Veritex Holdings, Inc. | a2221578zex-10_8.htm |
| EX-23.1 - EX-23.1 - Veritex Holdings, Inc. | a2221578zex-23_1.htm |
Use these links to rapidly review the document
TABLE OF CONTENTS
INDEX TO FINANCIAL STATEMENTS
As filed with the Securities and Exchange Commission on September 29, 2014
Registration No. 333-198484
UNITED STATES
SECURITIES AND EXCHANGE COMMISSION
WASHINGTON, D.C. 20549
AMENDMENT NO. 2
TO
FORM S-1
REGISTRATION STATEMENT
UNDER
THE SECURITIES ACT OF 1933
Veritex Holdings, Inc.
(Exact Name of Registrant as Specified in Its Charter)
| Texas (State or Other Jurisdiction of Incorporation or Organization) |
6022 (Primary Standard Industrial Classification No.) |
27-0973566 (I.R.S. Employer Identification No.) |
8214 Westchester Drive, Suite 400
Dallas, Texas 75225
(972) 349 - 6200
(Address, Including Zip Code, of Registrant's Principal Executive Offices)
C. Malcolm Holland, III
Chairman and Chief Executive Officer
Veritex Holdings, Inc.
8214 Westchester Drive, Suite 400
Dallas, Texas 75225
(972) 349 - 6200
(Name, Address and Telephone Number, Including Area Code, of Agent For Service)
| Copies to: | ||||
William S. Anderson Jason M. Jean Bracewell & Giuliani LLP 711 Louisiana, Suite 2300 Houston, Texas 77002 (713) 223-2300 (713) 437-5370 (facsimile) |
Sanford M. Brown Justin M. Long Bracewell & Giuliani LLP 1445 Ross Avenue, Suite 3800 Dallas, Texas 75202 (214) 468-3800 (214) 758-8300 (facsimile) |
Chet A. Fenimore Geoffrey S. Kay Fenimore, Kay, Harrison & Ford, LLP 812 San Antonio Street, Suite 600 Austin, Texas 78701 (512) 583-5900 (512) 583-5940 (facsimile) |
||
Approximate date of commencement of proposed sale to the public:
As soon as practicable after the effective date of this Registration Statement.
If any of the securities being registered on this Form are to be offered on a delayed or continuous basis pursuant to Rule 415 under the Securities Act of 1933, check the following box. o
If this Form is filed to register additional securities for an offering pursuant to Rule 462(b) under the Securities Act, check the following box and list the Securities Act registration statement number of the earlier effective registration statement for the same offering. o
If this Form is a post-effective amendment filed pursuant to Rule 462(c) under the Securities Act, check the following box and list the Securities Act registration statement number of the earlier effective registration statement for the same offering. o
If this Form is a post-effective amendment filed pursuant to Rule 462(d) under the Securities Act, check the following box and list the Securities Act registration statement number of the earlier effective registration statement for the same offering. o
Indicate by check mark whether the registrant is a large accelerated filer, an accelerated filer, a non-accelerated filer, or a smaller reporting company. See the definitions of "large accelerated filer," "accelerated filer" and "smaller reporting company" in Rule 12b-2 under the Exchange Act. (check one)
| Large accelerated filer o | Accelerated filer o | Non-accelerated filer ý (Do not check if a smaller reporting company) |
Smaller reporting company o |
CALCULATION OF REGISTRATION FEE
|
||||||||
| Title of Each Class of Securities to be Registered |
Amount to be Registered(1) |
Proposed Maximum Offering Price Per Share(2) |
Proposed Maximum Aggregate Offering Price(2)(3) |
Amount of Registration Fee |
||||
|---|---|---|---|---|---|---|---|---|
Common Stock, $0.01 par value per share |
3,105,000 | $14.00 | $43,470,000 | $5,598.94(4) | ||||
|
||||||||
- (1)
- Includes
405,000 shares subject to the underwriters' option to purchase additional shares.
- (2)
- Estimated
solely for the purpose of calculating the registration fee pursuant to Rule 457(a) under the Securities Act of 1933, as amended.
- (3)
- Includes
the offering price of any additional shares of common stock that the underwriters' have the option to purchase.
- (4)
- $5,152 was previously paid in connection with the initial filing of this Registration Statement.
The Registrant hereby amends this Registration Statement on such date or dates as may be necessary to delay its effective date until the Registrant shall file an amendment which specifically states that this Registration Statement shall thereafter become effective in accordance with Section 8(a) of the Securities Act of 1933 or until this Registration Statement shall become effective on such date as the Securities and Exchange Commission, acting pursuant to said Section 8(a), may determine.
The information in this preliminary prospectus is not complete and may be changed. We may not sell these securities until the registration statement filed with the Securities and Exchange Commission is effective. This preliminary prospectus is not an offer to sell these securities and it is not soliciting an offer to buy these securities in any state where the offer or sale is not permitted.
Subject to Completion, Dated September 29, 2014
PROSPECTUS
2,700,000 Shares

Veritex Holdings, Inc.
Common Stock
This is the initial public offering of shares of common stock of Veritex Holdings, Inc., the holding company for Veritex Community Bank, a Texas state chartered bank headquartered in Dallas, Texas.
We are offering 2,700,000 shares of our common stock. No public market currently exists for our common stock. We have applied to list our common stock on the NASDAQ Global Market under the symbol "VBTX."
We anticipate that the initial public offering price per share of our common stock will be between $12.00 and $14.00.
We are an "emerging growth company" as defined in the Jumpstart Our Business Startups Act of 2012, and are subject to reduced public company disclosure standards.
Investing in our common stock involves risks. See "Risk Factors" beginning on page 13 of this prospectus to read about factors you should consider before investing in our common stock.
| |
Per share |
Total |
||
|---|---|---|---|---|
Initial public offering price of our common stock |
$ | $ | ||
Underwriting discounts and commissions |
||||
Proceeds, before expenses, to us(1) |
- (1)
- See "Underwriting" for additional information regarding the underwriting discounts and commissions and certain expenses payable to the underwriters by us.
We have granted the underwriters the option to purchase up to an additional 405,000 shares of our common stock from us within 30 days of the date of this prospectus on the same terms and conditions set forth above, to cover over allotments, if any.
Neither the Securities and Exchange Commission, any state securities commission, the Federal Deposit Insurance Corporation, the Board of Governors of the Federal Reserve System, the Texas Department of Banking nor any other regulatory authority has approved or disapproved of these securities or passed upon the accuracy or adequacy of this prospectus. Any representation to the contrary is a criminal offense.
These securities are not deposits, savings accounts or other obligations of any bank or savings association and are not insured or guaranteed by the Federal Deposit Insurance Corporation or any other governmental agency and are subject to investment risks, including the possible loss of the entire amount you invest.
The underwriters expect to deliver the shares to purchasers on or about , 2014, subject to customary closing conditions.
| Sandler O'Neill + Partners, L.P. | Stephens Inc. | |
Sterne Agee |
||
The date of this prospectus is , 2014

You should rely only on the information contained in this prospectus and any free writing prospectus prepared by us or on our behalf that we have referred you to. We and the underwriters have not authorized anyone to provide you with additional or different information. If anyone provides you with additional, different or inconsistent information, you should not rely on it. We and the underwriters take no responsibility for, and can provide no assurance as to the reliability of, any other information that others may give you. This prospectus is an offer to sell only the shares offered hereby, and only under circumstances and in jurisdictions where it is lawful to do so. We are not making an offer of these securities in any state, country or other jurisdiction where the offer is not permitted. You should not assume that the information in this prospectus or any free writing prospectus is accurate as of any date other than the date of the applicable document regardless of its time of delivery or the time of any sales of our common stock. Our business, financial condition, results of operations and cash flows may have changed since the date of the applicable document.
This prospectus includes industry and trade association data, forecasts and information that we have prepared based, in part, upon data, forecasts and information obtained from independent trade associations, industry publications and surveys, government agencies and other information available to us, which information may be specific to particular markets or geographic locations. Some data is also based on our good faith estimates, which are derived from management's knowledge of the industry and independent sources. Industry publications and surveys and forecasts generally state that the information contained therein has been obtained from sources believed to be reliable. Although we believe these sources are reliable, we have not independently verified the information. Statements as to our market position are based on market data currently available to us. While we are not aware of any misstatements regarding our industry data presented herein, our estimates involve risks and uncertainties and are subject to change based on various factors, including those discussed under the heading "Risk Factors" in this prospectus. Similarly, we believe our internal research is reliable, even though such research has not been verified by any independent sources.
Implications of Being an Emerging Growth Company
As a company with less than $1.0 billion in revenue during our last fiscal year, we qualify as an "emerging growth company" as defined in the Jumpstart Our Business Startups Act of 2012, or the JOBS Act. We will continue to be an emerging growth company until the earliest to occur of: (1) the last day of the fiscal year following the fifth anniversary of this offering; (2) the last day of the fiscal year in which we have more than $1.0 billion in annual revenues; (3) the date on which we are deemed to be a "large accelerated filer" under the Securities Exchange Act of 1934, as amended, or the Exchange Act; or (4) the date on which we have, during the previous three-year period, issued more than $1.0 billion in non-convertible debt securities. Until we cease to be an emerging growth company, we may take advantage of specified reduced reporting and other regulatory requirements generally unavailable to other public companies. Those provisions allow us to present only two years of audited financial statements, discuss only our results of operations for two years in related Management's Discussions and Analyses and provide less than five years of selected financial data in an initial public offering registration statement; not to provide an auditor attestation of our internal control over financial reporting; to choose not to comply with any new requirements adopted by the Public Company Accounting Oversight Board, or the PCAOB, requiring mandatory audit firm rotation or a supplement to the auditor's report providing additional information about the audit and our audited financial statements; to provide reduced disclosure regarding our executive compensation arrangements pursuant to the rules applicable to smaller reporting companies, which means we do not have to include a compensation discussion and analysis and certain other disclosure regarding our executive
i
compensation; and not to seek a non-binding advisory vote on executive compensation or golden parachute arrangements. We may choose to take advantage of some or all of these reduced reporting and other regulatory requirements. We have elected in this prospectus to take advantage of the reduced disclosure requirements relating to executive compensation arrangements.
The JOBS Act also permits an "emerging growth company" to take advantage of an extended transition period to comply with new or revised accounting standards applicable to public companies. However, we have "opted out" of this provision. As a result, we will comply with new or revised accounting standards to the same extent that compliance is required for non-emerging growth companies. This decision to opt out of the extended transition period under the JOBS Act is irrevocable.
ii
Forward-looking statements included in this prospectus are based on various facts and derived utilizing numerous important assumptions and are subject to known and unknown risks, uncertainties and other factors that may cause our actual results, performance or achievements to be materially different from any future results, performance or achievements expressed or implied by such forward-looking statements. Forward-looking statements include the information concerning our future financial performance, business and growth strategy, projected plans and objectives, as well as projections of macroeconomic and industry trends, which are inherently unreliable due to the multiple factors that impact economic trends, and any such variations may be material. Statements preceded by, followed by or that otherwise include the words "believes," "expects," "anticipates," "intends," "projects," "estimates," "plans" and similar expressions or future or conditional verbs such as "will," "should," "would," "may" and "could" are generally forward-looking in nature and not historical facts, although not all forward-looking statements include the foregoing. You should understand that the following important factors could affect our future results and cause actual results to differ materially from those expressed in the forward-looking statements:
- •
- risks related to the concentration of our business within the Dallas metropolitan area, including risks associated with
any downturn in the real estate sector and risks associated with a decline in the values of single family homes in the Dallas metropolitan area;
- •
- our ability to implement our growth strategy, including identifying and consummating suitable acquisitions;
- •
- risks related to the integration of any acquired businesses, including exposure to potential asset quality and credit
quality risks and unknown or contingent liabilities, the time and costs associated with integrating systems, technology platforms, procedures and personnel, the need for additional capital to finance
such transactions, and possible failures in realizing the anticipated benefits from acquisitions;
- •
- our ability to recruit and retain successful bankers that meet our expectations in terms of customer relationships and
profitability;
- •
- our ability to retain executive officers and key employees and their customer and community relationships;
- •
- risks associated with our limited operating history and the relatively unseasoned nature of a significant portion of our
loan portfolio;
- •
- market conditions and economic trends nationally, regionally and particularly in the Dallas metropolitan area and Texas;
- •
- risks related to our strategic focus on lending to small to medium-sized businesses;
- •
- the sufficiency of the assumptions and estimates we make in establishing reserves for potential loan losses;
- •
- risks associated with our commercial loan portfolio, including the risk for deterioration in value of the general
business assets that generally secure such loans;
- •
- risks associated with our nonfarm nonresidential and construction loan portfolios, including the risks inherent in the
valuation of the collateral securing such loans;
- •
- potential changes in the prices, values and sales volumes of commercial and residential real estate securing our real
estate loans;
- •
- risks related to the significant amount of credit that we have extended to a limited number of borrowers and in a limited geographic area;
iii
- •
- our ability to maintain adequate liquidity and to raise necessary capital to fund our acquisition strategy and operations
or to meet increased minimum regulatory capital levels;
- •
- changes in market interest rates that affect the pricing of our loans and deposits and our net interest income;
- •
- potential fluctuations in the market value and liquidity of our investment securities;
- •
- the effects of competition from a wide variety of local, regional, national and other providers of financial, investment
and insurance services;
- •
- our ability to maintain an effective system of disclosure controls and procedures and internal controls over financial
reporting;
- •
- risks associated with fraudulent and negligent acts by our customers, employees or vendors;
- •
- our ability to keep pace with technological change or difficulties when implementing new technologies;
- •
- risks associated with system failures or failures to prevent breaches of our network security;
- •
- risks associated with data processing system failures and errors;
- •
- potential impairment on the goodwill we have recorded or may record in connection with business acquisitions;
- •
- the institution and outcome of litigation and other legal proceeding against us or to which we become subject;
- •
- our ability to comply with various governmental and regulatory requirements applicable to financial institutions;
- •
- the impact of recent and future legislative and regulatory changes, including changes in banking, securities and tax laws
and regulations and their application by our regulators, such as the Dodd-Frank Wall Street Reform and Consumer Protection Act of 2010, or the Dodd-Frank Act;
- •
- governmental monetary and fiscal policies, including the policies of the Board of Governors of the Federal Reserve
System, or the Federal Reserve;
- •
- our ability to comply with supervisory actions by federal and state banking agencies;
- •
- changes in the scope and cost of Federal Deposit Insurance Corporation, or the FDIC, insurance and other coverage; and
- •
- systemic risks associated with the soundness of other financial institutions.
Other factors not identified above, including those described under the headings "Risk Factors" and "Management's Discussion and Analysis of Financial Condition and Results of Operations," may also cause actual results to differ materially from those described in our forward-looking statements. Most of these factors are difficult to anticipate and are generally beyond our control. You should consider these factors in connection with considering any forward-looking statements that may be made by us. We undertake no obligation to release publicly any revisions to any forward-looking statements, to report events or to report the occurrence of unanticipated events unless we are required to do so by law.
iv
This summary highlights information contained elsewhere in this prospectus. This summary does not contain all of the information that you should consider in making your investment decision. You should read the following summary together with the entire prospectus, including the more detailed information regarding us, the common stock being sold in this offering and our consolidated financial statements and the related notes included elsewhere in this prospectus. You should carefully consider, among other things, the matters discussed in the sections entitled "Risk Factors" and "Management's Discussion and Analysis of Financial Condition and Results of Operations" in this prospectus before deciding to invest in our common stock. Some of the statements in this prospectus constitute forward-looking statements. See "Forward-Looking Statements."
Except where the context otherwise requires or where otherwise indicated, in this prospectus the terms "we," "us," "our," "our company" and "our business" refer to Veritex Holdings, Inc. and our wholly-owned banking subsidiary, Veritex Community Bank, a Texas state chartered bank, and the term "Bank" refers to Veritex Community Bank.
Our Company
We are a bank holding company headquartered in Dallas, Texas. Through our wholly-owned subsidiary, Veritex Community Bank, a Texas state chartered bank, we provide relationship-driven commercial banking products and services tailored to meet the needs of small to medium-sized businesses and professionals. Since our inception, we have targeted customers and focused our acquisitions primarily in the Dallas metropolitan area, which we consider to be Dallas and the adjacent communities in North Dallas. As we continue to grow, we expect to expand our primary market to include the broader Dallas-Fort Worth metropolitan area, which would include Fort Worth and Arlington, as well as the communities adjacent to those cities. We currently operate eight branches and one mortgage office, all of which are located in the Dallas metropolitan area. We have experienced significant organic growth since commencing banking operations in 2010 and have successfully acquired and integrated three banks. As of June 30, 2014, we had total assets of $710.4 million, total loans of $541.0 million, total deposits of $611.2 million and total stockholders' equity of $74.2 million.
Our primary customers are small and medium-sized businesses, generally with annual revenues of under $30 million, and professionals. We believe that these businesses and professionals highly value the local decision-making and relationship-driven, quality service we provide and our deep, long-term understanding of the Dallas community and Texas banking. As a result of consolidation, we believe that there are few locally-based banks that are dedicated to providing this level of service to small and medium-sized businesses. Our management team's long-standing presence and experience in the Dallas metropolitan area gives us unique insight into our local market and the needs of our customers. This enables us to respond quickly to customers, provide high quality personal service and develop comprehensive, long-term banking relationships by providing products and services tailored to meet the individual needs of our customers. This focus and approach enhances our ability to continue to grow organically, successfully recruit talented bankers and strategically source potential acquisitions in our target market.
Our History and Growth
Our management team is led by our Chairman and Chief Executive Officer, C. Malcolm Holland, III, who has overseen and managed our organic growth and acquisition activity since we commenced banking operations in 2010. We have completed three whole-bank acquisitions that have increased our market presence within the Dallas metropolitan area. We have also grown organically by
1
opening two branches and a mortgage office in the Dallas metropolitan area. The following table summarizes our three acquisitions:
Bank Acquired
|
Date Completed | Acquired Assets |
Acquired Loans |
Number of Branches |
Dallas Area Locations |
||||||||
|---|---|---|---|---|---|---|---|---|---|---|---|---|---|
| |
(Dollars in millions) |
||||||||||||
Professional Bank, N.A. through Professional Capital, Inc. |
September 2010 | $ | 181.8 | $ | 91.7 | 3 | Park Cities, Lakewood and Garland |
||||||
Fidelity Bank through Fidelity Resources Company |
March 2011 |
166.3 |
108.1 |
3 |
Preston Center, |
||||||||
Bank of Las Colinas |
October 2011 |
53.8 |
40.4 |
1 |
Las Colinas |
||||||||
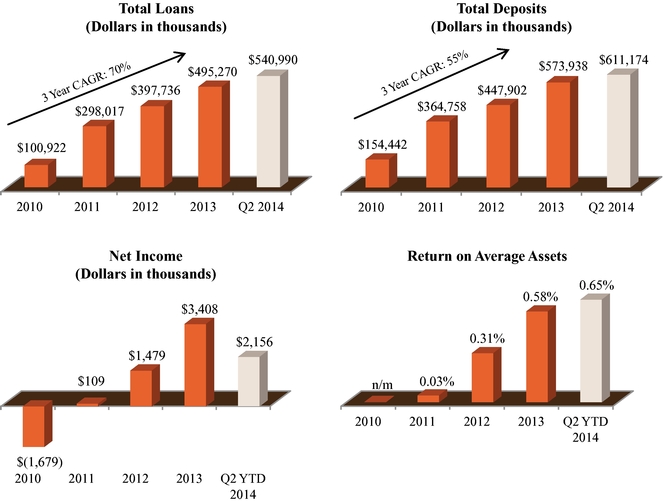
We have established a record of steady growth and profitable operations since commencing banking operations in 2010, as demonstrated below (total loans and deposits as of period-end and three year compound annual growth rate, or CAGR, through December 31, 2013), while preserving our strong credit culture. Our initial growth in 2010 and 2011 was primarily the result of our acquisitions. During 2012, 2013 and the first six months of 2014, we grew our total loans and deposits organically by increasing our commercial lending relationships and more deeply penetrating the Dallas metropolitan area.
2
Our Strategy
Our business strategy is comprised of the following components:
- •
- Organic Growth in Thriving Dallas Metropolitan
Area. Our organic growth strategy has focused on more deeply penetrating the Dallas metropolitan area through our community-focused,
relationship-driven approach to banking. We believe that our current market area provides abundant opportunities to continue to grow our customer base, increase loans and deposits and expand our
overall market share. Our team of seasoned bankers has been an important driver of our organic growth by further developing banking relationships with current and potential customers, many of which
span more than 20 years. Our market presidents and relationship managers are incentivized to increase the size of their loan and deposit portfolios and generate fee income while maintaining
strong credit quality. We intend to add to our team of experienced bankers in order to grow our current footprint and expand further into markets throughout the Dallas-Fort Worth metropolitan area.
Preserving sound credit underwriting standards as we grow our loan portfolio will continue to be the foundation of our organic growth strategy.
- •
- Acquisitions. We intend to continue to grow through acquisitions, and we believe
having publicly traded common stock will improve our ability to compete for acquisitions. Many small to medium-sized banking organizations in the Dallas-Fort Worth metropolitan area face significant
scale and operational challenges, regulatory pressure, management succession issues and shareholder liquidity needs. There were 59 banks headquartered in this area with less than $500 million
of assets, which collectively held approximately $11.0 billion in assets, as of June 30, 2014, according to the FDIC. As a result, we believe that there will continue to be attractive
acquisition opportunities in the Dallas-Fort Worth metropolitan area as well as in other attractive markets in Texas. Although we have no current plans, arrangements or understandings to make any
material acquisitions, this market dynamic will afford us opportunities to identify and execute acquisitions designed to strengthen our franchise and increase shareholder value.
- •
- Improve Operational Efficiency and Increase
Profitability. We are committed to maintaining and enhancing profitability. Our net income increased from $109,000 in 2011 to
$3.4 million in 2013 and our efficiency ratio improved from 92.2% in 2011 to 69.8% in 2013. For the six months ended June 30, 2014, our net income was $2.2 million compared to
$1.5 million for the six months ended June 30, 2013. We employ a systematic and calculated approach to improving our operational efficiency, which in turn we believe increases our
profitability. We have upgraded our operating capabilities and created a platform for continued efficiencies in the areas of technology, data processing, regulatory compliance and human resources. We
believe that our scalable infrastructure and efficient operating platform will allow us to achieve continued growth without incurring significant incremental noninterest expenses and will enhance our
returns.
- •
- Continue to Build Our Community Ties. Our officers and employees are heavily involved in civic and community organizations, and we sponsor numerous activities that benefit our community. Our business development strategy, which focuses on building market share through personal relationships, as opposed to formal advertising, is consistent with our customer-centric culture and is a cost-effective approach to developing new relationships and enhancing existing ones.
Our Competitive Strengths
We believe our competitive strengths include the following:
- •
- Experienced Senior Management Team. Our Chairman and Chief Executive Officer, C. Malcolm Holland, III, and our Vice Chairman, William C. Murphy, have more than 75 years of combined experience acquiring, growing and selling banks in the Dallas metropolitan area. Messrs. Holland
3
- •
- Mr. Holland began his banking career in 1982, and in 1986 was an organizer and leader of EastPark National Bank,
Dallas, until it was acquired by Fidelity Bank of Dallas in 1995, which, at that time, was led by Mr. Murphy. Mr. Holland then assumed the primary lending and business development role
at Fidelity Bank of Dallas until it was acquired by Compass Bank in 1998. In 2000, Mr. Holland became President of First Mercantile Bank, where, through a combination of an acquisition and
organic growth, the bank grew from $125.0 million to $325.0 million in total assets over a two-year period. When Colonial Bank acquired First Mercantile Bank in 2002, Mr. Holland
assumed the role of Chief Executive Officer for the Texas Region of Colonial Bank, overseeing the management and organic growth of the region from $625.0 million in assets in 2002 to over
$1.6 billion in assets in 2009.
- •
- Mr. Murphy began his banking career in 1971 and has been Chairman or Chief Executive Officer of several community banks in the Dallas metropolitan area, including Parkway National Bank, Mercantile Bank & Trust and Fidelity Bank of Dallas, and was instrumental in the growth and leadership of these institutions. Mr. Murphy has led financial institutions in over 25 transactions involving the acquisition, formation or sale of banks, bank holding companies or individual branches.
and Murphy have worked together in three different banking institutions during seven of the past 17 years.
- •
- Strong Brand and Reputation in Our
Market. The name "Veritex" is derived from a combination of the Latin root word "veritas," meaning truth, and "Texas," and we strive to
provide truth in Texas banking every day. We have developed a reputation as an active lender in our community. The members of our management team have spent the majority of their careers as bankers in
the Dallas metropolitan area. We believe that our strong brand and market reputation have become and will remain a competitive advantage within our market. By capitalizing on the business and personal
relationships of our senior management team, market presidents and relationship managers, we believe that we are positioned for continued growth and increased profitability.
- •
- Loyal and Growing Core Deposit Franchise. Developing significant deposit relationships with our borrowers is a key component of our growth strategy. Our core deposits, which include all demand deposits, money market and savings accounts and time deposits under $250,000, but exclude all brokered deposits, represented approximately 90.7% of our deposits as of June 30, 2014, 93.5% of our deposits as of December 31, 2013 and 95.0% of our deposits as of December 31, 2012. Our customers maintain significant noninterest-bearing deposits with us, which contributes to our lower cost of funds. Noninterest-bearing deposits represented 38.7%, 38.2% and 38.1% of our total deposits as of June 30, 2014, December 31, 2013 and December 31, 2012, respectively. Our cost of funds was 48 basis points for the first six months of 2014, 44 basis points for 2013, and 56 basis points for 2012. Our strong, low-cost deposit base
In addition to Messrs. Holland and Murphy, we believe we have significant depth in management throughout each function of our organization, including lending, credit administration, treasury services, finance, operations, information technology, regulatory compliance and risk management. Our bankers also have significant experience, with eight of our market presidents and relationship managers having more than 25 years of banking experience in the Dallas metropolitan area. Our team has a demonstrated track record of achieving profitable growth, successfully executing acquisitions, maintaining a strong credit culture, and implementing a community-focused, relationship-driven approach to banking. The depth of our team's market knowledge and long-term relationships in the Dallas metropolitan area are the keys to our strong successful referral business.
4
- •
- Proven Ability and Demonstrated Success in Acquisitions and
Integration. We have completed three whole-bank acquisitions since the beginning of 2010 and only two other Texas-based banking
institutions have completed more acquisitions in Texas during that period, according to SNL Financial. As a result, we believe we have developed an experienced and disciplined acquisition and
integration approach capable of identifying candidates, conducting thorough due diligence, determining financial attractiveness, and integrating the acquired institution. Utilizing the prior
experience of our management team at larger financial institutions, we believe that we have built a corporate infrastructure capable of supporting additional acquisitions and continued organic growth.
We believe our acquisition experience and our reputation as a successful acquirer position us to capitalize on additional opportunities in the future.
- •
- Strong Credit
Culture. Our disciplined implementation of comprehensive policies and procedures for credit underwriting and administration has enabled
us to maintain strong asset quality during our growth. We manage the risk in the portfolio with prudent underwriting and proactive credit administration. Mr. Murphy, our Vice Chairman, who
leads the Bank directors' loan committee, has more than 40 years of banking experience. Our nonperforming assets to total assets ratio was 0.42% as of June 30, 2014, 0.44% as of
December 31, 2013 and 0.71% as of December 31, 2012, while our net charge-offs to average loans outstanding was 0.04% during the first six months of 2014, 0.02% during 2013 and 0.21%
during 2012. As much of the growth in our loan portfolio is attributed to new loans with which we have limited experience and payment history, a portion of our loan portfolio is considered to be
relatively unseasoned.
- •
- Scalable Platform. Throughout our operating history, we have built and maintained a strong and scalable banking platform to support our dynamic growth. Utilizing the significant prior experience of our management team and employees, we believe that we have built a scalable corporate infrastructure, including technology and banking processes, capable of supporting future organic growth and acquisitions while improving our operational efficiencies. We believe that our strong capital and asset quality position will allow us to grow and our scalable operating platform will allow us to manage that growth effectively, resulting in greater efficiency and improved profitability. This increased efficiency has been demonstrated by the improvement in our efficiency ratio from 92.2% in 2011 to 69.8% in 2013.
serves as a major driver of our operating results, as we utilize our core deposit base primarily to fund our loan growth. Our total deposits grew by 28.1% in 2013 and 22.8% in 2012, while our noninterest-bearing deposits grew by 28.4% in 2013 and 51.3% in 2012. Total deposits grew by 13.0% and non-interest bearing deposits grew by 15.7% during the first six months of 2014 on an annualized basis. We believe that our ability to grow strong core deposits is a unique and valuable competitive advantage.
Our Market Area
We currently operate in the Dallas metropolitan area, which is part of the broader Dallas-Fort Worth-Arlington metropolitan statistical area, which we refer to as the Dallas-Fort Worth metropolitan area. The Dallas economy is fueled by the real estate, technology, financial services, insurance, transportation, manufacturing, health care and energy sectors. This market is among the most vibrant in the United States with a rapidly growing population, a high level of job growth, an affordable cost of living and a pro-growth business climate. More broadly, Texas is also experiencing significant population and employment growth on a statewide basis.
- •
- A Leading Population Growth Center. The Dallas-Fort Worth metropolitan area is the fourth largest metropolitan area in the nation by population, behind only New York City, Los Angeles and Chicago, based on data from the United States Census Bureau. Population in this area is projected to grow by 8.6% from 2014 to 2019, compared to 3.5% for the nation as a whole,
5
- •
- Robust Employment
Growth. The Dallas-Fort Worth metropolitan area had the highest percentage of employment growth of the 12 most populous metropolitan
areas in the United States during the 12 months ended April 30, 2014, according to the U.S. Bureau of Labor Statistics. The area's unemployment rate was 5.5% in July 2014, according to
the U.S. Bureau of Labor Statistics. Texas led the nation in job growth for the period from 2000 to 2013, according to the Federal Reserve Bank of Dallas.
- •
- Fortune 500
Companies. The Dallas-Fort Worth metropolitan area serves as the corporate headquarters for numerous Fortune 500 companies across many
varied industries, including ExxonMobil, AT&T, American Airlines, Fluor, Kimberly-Clark, HollyFrontier, Southwest Airlines, Texas Instruments, Neiman-Marcus, Tenent Healthcare, JCPenney, Dean Foods,
GameStop, Energy Transfer Equity, Commercial Metals, Celanese, D.R. Horton, Dr Pepper Snapple Group and Energy Future Holdings. Other major companies have recently announced significant
relocations or expansions in the area, such as Toyota, which announced the relocation of its North American headquarters, and State Farm, which announced a major expansion of its regional hub. On a
statewide basis, Texas is home to the corporate headquarters of 52 Fortune 500 companies.
- •
- Numerous Small and Medium-Sized
Businesses. Our primary customers are small and medium-sized businesses and professionals. Small and medium-size businesses are a vital
part of the Dallas-Fort Worth metropolitan area. With more than 140,000 businesses that employ less than 100 people, representing approximately 97.0% of total businesses, the Dallas-Fort Worth
metropolitan area ranks fifth in the United States in number of businesses employing less than 100 people, according to United States Census Bureau data for 2012 released in May 2014.
- •
- World Class Hospitals and Universities. The Dallas-Fort Worth metropolitan area contains several world-class hospitals and medical research facilities, major universities, and professional sports franchises.
according to SNL Financial. Texas is the second most populous state in the United States and its population is projected to grow by 7.6% from 2014 to 2019, according to SNL Financial.
Third Quarter 2014 Update
We expect to report net income in the range of $1.3 million to $1.4 million for the three months ended September 30, 2014 as compared to $1.2 million for the three months ended June 30, 2014 and $952,000 for the three months ended September 30, 2013. We also expect to report net income in the range of $3.4 million to $3.5 million for the nine months ended September 30, 2014 as compared to $2.4 million for the nine months ended September 30, 2013. The increase in net income for these periods is primarily attributable to growth in outstanding loan balances and a corresponding increase in net interest income.
As of September 15, 2014, total loans were $576.3 million, representing a $125.8 million increase from September 30, 2013 and a $35.3 million increase from June 30, 2014. Total deposits were $619.9 million as of September 15, 2014 representing an increase of $104.8 million from September 30, 2013, and an $8.7 million increase from June 30, 2014. Increases in our total loans and total deposits were largely driven by execution of our strategy and continued focus on strengthening and developing new and existing customer relationships in our market area.
Our expected net income for the three and nine month periods ending September 30, 2014 are preliminary estimates and subject to closing procedures, which we expect to complete after the completion of this offering. These closing procedures could result in material changes to our preliminary estimates indicated above. The foregoing estimates constitute forward-looking statements and are subject to risks and uncertainties, including those described under "Risk Factors" in this
6
prospectus. Accordingly, our final results for the three and nine month periods ending September 30, 2014 may not be consistent with the foregoing estimates. See "Risk Factors—Risks Related to Our Business" and "Forward-Looking Statements."
Our Corporate Information
Our principal executive offices are located at 8214 Westchester Drive, Suite 400, Dallas, Texas 75225, and our telephone number is (972) 349-6200. Our website is www.veritexbank.com. The information contained on or accessible from our website does not constitute a part of this prospectus and is not incorporated by reference herein.
7
Common stock we are offering |
2,700,000 shares (3,105,000 shares if the underwriters exercise their option to purchase additional shares in full). | |
Common stock to be outstanding after this offering |
9,058,832 shares (9,463,832 shares if the underwriters exercise their option to purchase additional shares in full). |
|
Use of proceeds |
We estimate that our net proceeds from the sale of the shares of common stock by us will be approximately $30.8 million, after deducting the estimated underwriting discounts and commissions and estimated offering expenses payable by us, based on an assumed initial public offering price of $13.00 per share, which is the midpoint of the estimated initial public offering price range set forth on the cover page of this prospectus. If the underwriters exercise their option to purchase additional shares in full, the net proceeds to us will be approximately $35.7 million. We intend to use the net proceeds to us from this offering to support our continued growth, including organic growth and potential future acquisitions, and for general corporate purposes. See "Use of Proceeds." |
|
Dividend policy |
We have not declared or paid any dividends on our common stock. We currently intend to retain all of our future earnings, if any, for use in our business and do not anticipate paying any cash dividends on our common stock in the foreseeable future. See "Dividend Policy." |
|
Directed share program |
At our request, the underwriters have reserved up to 135,000 shares of our common stock offered by this prospectus, for sale, at the initial public offering price, to our directors, executive officers, employees and certain other persons who have expressed an interest in purchasing our common stock in this offering. The number of shares available for sale to the general public in the offering will be reduced to the extent these persons purchase the reserved shares. Any reserved shares not so purchased will be offered by the underwriters to the general public on the same terms as the other shares. |
|
Registration and Board Rights |
We have entered into a registration rights agreement with SunTx Veritex Holdings, L.P., or SunTx, and WCM Parkway, Ltd., two of our largest shareholders, pursuant to which such shareholders will have the ability to cause us to register the resale of their shares. Such shareholders have agreed with the underwriters not to exercise such rights for a period of at least 180 days from the date of this prospectus. SunTx also has the right to nominate one representative to serve on our board of directors for so long as they hold at least 4.9% of our common stock. See "Certain Relationships and Related Party Transactions—Registration Rights Agreement" and "—Agreements with SunTx Veritex Holdings, L.P." |
8
Management and Principal Shareholders |
As of August 29, 2014, our executive officers and directors, together with SunTx, beneficially owned 42.0% of our common stock. Following the completion of this offering, we anticipate that our executive officers and directors, together with SunTx, will beneficially own approximately 29.3% of our common stock (or 28.1% if the underwriters exercise their option to purchase additional shares in full). See "Principal Shareholders". |
|
Stock exchange symbol |
We have applied to list our common stock on the NASDAQ Global Market under the symbol "VBTX." |
|
Risk factors |
Investing in our common stock involves risks. See "Risk Factors" beginning on page 13 for a discussion of factors you should carefully consider before deciding to invest in our common stock. |
Except as otherwise indicated, all of the information in this prospectus:
- •
- assumes no exercise of the underwriters' option to purchase up to 405,000 additional shares of common stock from us;
- •
- excludes 357,500 shares of common stock issuable upon the exercise of outstanding time-based options at a weighted
average exercise price of $10.15 per share (181,200 shares of which were exercisable), as of June 30, 2014;
- •
- excludes 472,500 shares of common stock issuable upon the exercise of performance-based options at a weighted
average exercise price of $10.15 per share (none of which were exercisable), as of June 30, 2014, which we intend to cancel prior to the completion of this offering as described in "Executive
Compensation—2014 Omnibus Incentive Plan";
- •
- excludes restricted stock units that we intend to grant prior to the completion of this offering in connection with the
cancelation of our performance-based options, as described in "Executive Compensation—2014 Omnibus Incentive Plan";
- •
- excludes 63,250 shares of common stock underlying outstanding restricted stock units that were not fully vested as
of June 30, 2014;
- •
- excludes 25,000 shares of our common stock issuable upon exercise of warrants at an exercise price of $11.00 per
share as of June 30;
- •
- does not attribute to any director, executive officer or principal shareholder any purchase of shares of our common stock
in the offering, including through the directed share program described in "Underwriting—Directed Share Program;" and
- •
- assumes an initial offering price of $13.00 per share, which is the midpoint of the estimated initial public offering price range set forth on the cover page of this prospectus.
9
SELECTED HISTORICAL CONSOLIDATED FINANCIAL DATA
The following selected historical consolidated financial data as of and for the years ended December 31, 2013, 2012 and 2011 have been derived from our audited consolidated financial statements appearing elsewhere in this prospectus, and the selected historical consolidated financial data as of and for the year ended December 31, 2010 have been derived from our audited consolidated financial statements not appearing in this prospectus.
The selected historical consolidated financial data for the six months ended June 30, 2014 and 2013 and the selected historical consolidated financial data as of June 30, 2014 have been derived from our unaudited consolidated financial statements included elsewhere in this prospectus.
You should read the selected historical consolidated financial data set forth below in conjunction with the sections entitled "Management's Discussion and Analysis of Financial Condition and Results of Operations" and our consolidated financial statements and the related notes included elsewhere in this prospectus.
| |
|
As of December 31, | ||||||||||||||
|---|---|---|---|---|---|---|---|---|---|---|---|---|---|---|---|---|
| |
As of June 30, 2014 |
|||||||||||||||
| |
2013 | 2012 | 2011 | 2010 | ||||||||||||
| |
(Dollars in thousands) |
|||||||||||||||
Selected Period-end Balance Sheet Data: |
||||||||||||||||
Total assets |
$ | 710,382 | $ | 664,971 | $ | 524,127 | $ | 437,820 | $ | 197,949 | ||||||
Cash and cash equivalents |
66,550 | 76,646 | 53,160 | 62,790 | 11,446 | |||||||||||
Securities available for sale |
50,547 | 45,604 | 29,538 | 42,688 | 69,502 | |||||||||||
Total loans(1) |
540,990 | 495,270 | 397,736 | 298,017 | 100,922 | |||||||||||
Allowance for loan losses |
5,516 | 5,018 | 3,238 | 1,012 | 166 | |||||||||||
Goodwill |
19,148 | 19,148 | 19,148 | 19,148 | 10,409 | |||||||||||
Intangibles |
1,413 | 1,567 | 1,875 | 2,183 | 838 | |||||||||||
Noninterest-bearing deposits |
236,198 | 218,990 | 170,497 | 112,698 | 37,919 | |||||||||||
Interest-bearing deposits |
374,976 | 354,948 | 277,405 | 252,060 | 116,523 | |||||||||||
Total deposits |
611,174 | 573,938 | 447,902 | 364,758 | 154,442 | |||||||||||
Advances from FHLB |
15,000 | 15,000 | 10,000 | 10,000 | 10,000 | |||||||||||
Other borrowings |
8,073 | 8,072 | 3,093 | 3,093 | — | |||||||||||
Total stockholders' equity |
74,244 | 66,239 | 61,860 | 58,676 | 33,019 | |||||||||||
10
| |
As of and for the Six Months Ended June 30, |
As of and for the Years Ended December 31, |
|||||||||||||||||
|---|---|---|---|---|---|---|---|---|---|---|---|---|---|---|---|---|---|---|---|
| |
2014 | 2013 | 2013 | 2012 | 2011 | 2010 | |||||||||||||
| |
(Dollars in thousands, except per share amounts) |
||||||||||||||||||
Selected Income Statement Data: |
|||||||||||||||||||
Net interest income |
$ | 11,806 | $ | 10,043 | $ | 21,041 | $ | 19,093 | $ | 12,567 | $ | 2,000 | |||||||
Provision for loan losses |
677 | 1,008 | 1,883 | 2,953 | 960 | 166 | |||||||||||||
| | | | | | | | | | | | | | | | | | | | |
Net interest income after provision for loan losses |
11,129 | 9,035 | 19,158 | 16,140 | 11,607 | 1,834 | |||||||||||||
Noninterest income |
1,211 | 1,306 | 2,391 | 1,647 | 1,277 | 195 | |||||||||||||
Noninterest expense |
8,994 | 8,108 | 16,364 | 16,172 | 12,762 | 3,708 | |||||||||||||
| | | | | | | | | | | | | | | | | | | | |
Income (loss) before income tax |
3,346 | 2,233 | 5,185 | 1,615 | 122 | (1,679 | ) | ||||||||||||
Income tax expense |
1,190 | 774 | 1,777 | 136 | 13 | — | |||||||||||||
| | | | | | | | | | | | | | | | | | | | |
Net income (loss) |
2,156 | 1,459 | 3,408 | 1,479 | 109 | (1,679 | ) | ||||||||||||
Preferred dividends |
40 | 40 | 60 | 100 | 76 | — | |||||||||||||
| | | | | | | | | | | | | | | | | | | | |
Net income (loss) available to common stockholders |
$ | 2,116 | $ | 1,419 | $ | 3,348 | $ | 1,379 | $ | 33 | $ | (1,679 | ) | ||||||
| | | | | | | | | | | | | | | | | | | | |
| | | | | | | | | | | | | | | | | | | | |
Per Share Data: |
|||||||||||||||||||
Earnings (loss) per common share, basic |
$ | 0.34 | $ | 0.25 | $ | 0.58 | $ | 0.24 | $ | 0.01 | $ | (1.68 | ) | ||||||
Earnings (loss) per common share, diluted |
0.33 | 0.24 | 0.57 | 0.24 | 0.01 | (1.68 | ) | ||||||||||||
Book value per common share(2) |
10.42 | 9.69 | 10.03 | 9.46 | 9.12 | 9.29 | |||||||||||||
Tangible book value per common share(3) |
7.18 | 6.09 | 6.46 | 5.77 | 5.28 | 6.13 | |||||||||||||
Weighted average common shares outstanding, basic |
6,231,031 | 5,771,841 | 5,787,810 | 5,640,801 | 5,041,454 | 998,477 | |||||||||||||
Weighted average common shares outstanding, diluted |
6,359,031 | 5,835,841 | 5,848,810 | 5,677,801 | 5,068,454 | 998,477 | |||||||||||||
| |
|
As of and for the Years Ended December 31, |
||||||||||||||
|---|---|---|---|---|---|---|---|---|---|---|---|---|---|---|---|---|
| |
As of and for the Six Months Ended June 30, 2014 |
|||||||||||||||
| |
2013 | 2012 | 2011 | 2010(4) | ||||||||||||
Summary Performance Ratios: |
||||||||||||||||
Return on average assets(5) |
0.65 | % | 0.58 | % | 0.31 | % | 0.03 | % | n/m | |||||||
Return on average equity(5) |
5.96 | 5.27 | 2.47 | 0.23 | n/m | |||||||||||
Net interest margin(6) |
3.86 | 3.96 | 4.50 | 4.12 | n/m | |||||||||||
Efficiency ratio(7) |
69.09 | 69.84 | 77.97 | 92.18 | 168.93 | |||||||||||
Loans to deposits ratio |
88.52 | 86.29 | 88.80 | 81.70 | 65.35 | |||||||||||
Noninterest expense to average assets(5) |
2.70 | 2.80 | 3.42 | 3.67 | n/m | |||||||||||
Summary Credit Quality Ratios: |
||||||||||||||||
Nonperforming assets to total assets |
0.42 | % | 0.44 | % | 0.71 | % | 0.20 | % | 0.35 | |||||||
Nonperforming loans to total loans |
0.09 | 0.23 | 0.33 | 0.05 | 0.36 | |||||||||||
Allowance for loan losses to nonperforming loans |
1,109.86 | 445.65 | 248.31 | 661.44 | 0.46 | |||||||||||
Allowance for loan losses to total loans |
1.02 | 1.01 | 0.81 | 0.34 | 0.16 | |||||||||||
Net charge-offs to average loans outstanding |
0.04 | 0.02 | 0.21 | 0.05 | n/m | |||||||||||
11
| |
|
As of December 31, | ||||||||||||||
|---|---|---|---|---|---|---|---|---|---|---|---|---|---|---|---|---|
| |
As of June 30, 2014 |
|||||||||||||||
| |
2013 | 2012 | 2011 | 2010(4) | ||||||||||||
Capital Ratios: |
||||||||||||||||
Total stockholders' equity to total assets |
10.45 | % | 9.96 | % | 11.80 | % | 13.40 | % | 16.68 | % | ||||||
Tangible common equity to tangible assets(8) |
6.62 | 5.82 | 6.53 | 7.05 | 11.66 | |||||||||||
Tier 1 capital to average assets(5) |
8.66 | 8.06 | 8.81 | 9.80 | 8.30 | |||||||||||
Tier 1 capital to risk-weighted assets |
10.44 | 9.75 | 11.34 | 14.00 | 13.30 | |||||||||||
Total capital to risk-weighted assets |
12.35 | 11.74 | 12.17 | 13.70 | 13.40 | |||||||||||
- (1)
- Total
loans does not include loans held for sale of $6.3 million as of June 30, 2014, $2.1 million as of December 31, 2013 and
$2.8 million as of December 31, 2012. There were no loans held for sale as of December 31, 2011 or 2010.
- (2)
- We
calculate book value per common share as stockholders' equity less preferred stock at the end of the relevant period divided by the outstanding number of
shares of our common stock at the end of the relevant period.
- (3)
- We
calculate tangible book value per common share as total stockholders' equity less preferred stock, goodwill, core deposit intangibles and other
intangible assets, net of accumulated amortization at the end of the relevant period, divided by the outstanding number of shares of our common stock at the end of the relevant period. Tangible book
value per common share is a non-GAAP financial measure, and, as we calculate tangible book value per common share, the most directly comparable GAAP financial measure is total stockholders' equity per
common share. See our reconciliation of non-GAAP financial measures to their most directly comparable GAAP financial measures under the caption "Management's Discussion and Analysis of Financial
Condition and Results of Operations—Non-GAAP Financial Measures."
- (4)
- We
commenced banking operations in 2010. Accordingly, certain ratios are not meaningful.
- (5)
- Except
as otherwise indicated in this footnote, we calculate our average assets and average equity for a period by dividing the sum of our total assets or
total stockholders' equity, as the case may be, as of the close of business on each day in the relevant period, by the number of days in the period. We have calculated our return on average assets and
return on average equity for a period by dividing net income for that period by our average assets and average equity, as the case may be, for that period. As a result of system conversions and
integrations associated with acquisitions, we are unable to calculate daily average balances for 2010, 2011 or 2012. For these periods, return on average assets and return on average equity are
calculated using period-end balances divided by the number of months in the period.
- (6)
- Net
interest margin represents net interest income, annualized on a fully tax equivalent basis, divided by average interest-earning assets.
- (7)
- Efficiency
ratio represents noninterest expense divided by the sum of net interest income and noninterest income.
- (8)
- We calculate tangible common equity as total stockholders' equity less preferred stock, goodwill, core deposit intangibles and other intangible assets, net of accumulated amortization, and we calculate tangible assets as total assets less goodwill and core deposit intangibles and other intangible assets, net of accumulated amortization. Tangible common equity to tangible assets is a non-GAAP financial measure, and, as we calculate tangible common equity to tangible assets, the most directly comparable GAAP financial measure is total stockholders' equity to total assets. See our reconciliation of non-GAAP financial measures to their most directly comparable GAAP financial measures under the caption "Management's Discussion and Analysis of Financial Condition and Results of Operations—Non-GAAP Financial Measures."
12
Investing in our common stock involves a high degree of risk. Before you decide to invest in our common stock, you should carefully consider the risks described below, together with all other information included in this prospectus, including our consolidated financial statements and the related notes included elsewhere in this prospectus. We believe the risks described below are the risks that are material to us as of the date of this prospectus. If any of the following risks actually occur, our business, financial condition, results of operations and growth prospects could be materially and adversely affected. In that case, you could experience a partial or complete loss of your investment.
Risks Related to Our Business
Our business concentration in the Dallas metropolitan area imposes risks and may magnify the consequences of any regional or local economic downturn affecting the Dallas metropolitan area, including any downturn in the real estate sector.
We conduct our operations exclusively in the Dallas metropolitan area. As of June 30, 2014, the substantial majority of the loans in our loan portfolio were made to borrowers who live and/or conduct business in the Dallas metropolitan area and the substantial majority of our secured loans were secured by collateral located in the Dallas metropolitan area. Accordingly, we are significantly exposed to risks associated with a lack of geographic diversification. The economic conditions in the Dallas metropolitan area are highly dependent on the real estate sector as well as the technology, financial services, insurance, transportation, manufacturing and energy sectors. Any downturn or adverse development in these sectors, particularly the real estate sector, or a decline in the value of single family homes in the Dallas metropolitan area could have a material adverse impact on our business, financial condition and results of operations, and future prospects. Any adverse economic developments, among other things, could negatively affect the volume of loan originations, increase the level of nonperforming assets, increase the rate of foreclosure losses on loans and reduce the value of our loans. Any regional or local economic downturn that affects the Dallas metropolitan area or Texas, our existing or prospective borrowers or property values in our market area may affect us and our profitability more significantly and more adversely than our competitors whose operations are less geographically focused.
We may not be able to implement aspects of our growth strategy, which may affect our ability to maintain our historical earnings trends.
Our business has grown rapidly. Financial institutions that grow rapidly can experience significant difficulties as a result of rapid growth. Furthermore, our strategy focuses on organic growth, supplemented by acquisitions. We may not be able to execute on aspects of our growth strategy to sustain our historical rate of growth or may not be able to grow at all. More specifically, we may not be able to generate sufficient new loans and deposits within acceptable risk and expense tolerances, obtain the personnel or funding necessary for additional growth or find suitable acquisition candidates. Various factors, such as economic conditions and competition, may impede or prohibit the growth of our operations, the opening of new branches and the consummation of acquisitions. Further, we may be unable to attract and retain experienced bankers, which could adversely affect our growth. The success of our strategy also depends on our ability to effectively manage growth, which is dependent upon a number of factors, including our ability to adapt our existing credit, operational, technology and governance infrastructure to accommodate expanded operations. If we fail to build infrastructure sufficient to support rapid growth or fail to implement one or more aspects of our strategy, we may be unable to maintain our historical earnings trends, which could have an adverse effect on our business, financial condition and results of operations.
13
Our strategy of pursuing acquisitions exposes us to financial, execution and operational risks that could have a material adverse effect on our business, financial condition, results of operations and growth prospects.
We intend to continue pursuing a strategy that includes acquisitions. An acquisition strategy involves significant risks, including the following:
- •
- finding suitable candidates for acquisition;
- •
- attracting funding to support additional growth within acceptable risk tolerances;
- •
- maintaining asset quality;
- •
- retaining customers and key personnel, including bankers;
- •
- obtaining necessary regulatory approvals, which we may have difficulty obtaining or be unable to obtain;
- •
- conducting adequate due diligence and managing known and unknown risks and uncertainties;
- •
- integrating acquired businesses; and
- •
- maintaining adequate regulatory capital.
The market for acquisition targets is highly competitive, which may adversely affect our ability to find acquisition candidates that fit our strategy and standards. We face significant competition in pursuing acquisition targets from other banks and financial institutions, many of which possess greater financial, human, technical and other resources than we do. Our ability to compete in acquiring target institutions will depend on our available financial resources to fund the acquisitions, including the amount of cash and cash equivalents we have and the liquidity and market price of our common stock. In addition, increased competition may also drive up the acquisition consideration that we will be required to pay in order to successfully capitalize on attractive acquisition opportunities. To the extent that we are unable to find suitable acquisition targets, an important component of our growth strategy may not be realized.
Acquisitions of financial institutions also involve operational risks and uncertainties, such as unknown or contingent liabilities with no available manner of recourse, exposure to unexpected problems such as asset quality, the retention of key employees and customers, and other issues that could negatively affect our business. We may not be able to complete future acquisitions or, if completed, we may not be able to successfully integrate the operations, technology platforms, management, products and services of the entities that we acquire or to realize our attempts to eliminate redundancies. The integration process may also require significant time and attention from our management that would otherwise be directed toward servicing existing business and developing new business. Failure to successfully integrate the entities we acquire into our existing operations in a timely manner may increase our operating costs significantly and adversely affect our business, financial condition and results of operations. Further, acquisitions typically involve the payment of a premium over book and market values and, therefore, some dilution of our tangible book value and net income per common share may occur in connection with any future acquisition, and the carrying amount of any goodwill that we currently maintain or may acquire may be subject to impairment in future periods.
Our ability to retain bankers and recruit additional successful bankers is critical to the success of our business strategy, and any failure to do so could adversely affect our business, financial condition, results of operations and growth prospects.
Our ability to retain and grow our loans, deposits and fee income depends upon the business generation capabilities, reputation and relationship management skills of our bankers. If we were to lose the services of any of our bankers, including successful bankers employed by banks that we may acquire, to a new or existing competitor or otherwise, we may not be able to retain valuable
14
relationships and some of our customers could choose to use the services of a competitor instead of our services.
Our growth strategy also relies on our ability to attract and retain additional profitable bankers. We may face difficulties in recruiting and retaining bankers of our desired caliber, including as a result of competition from other financial institutions. In particular, many of our competitors are significantly larger with greater financial resources, and may be able to offer more attractive compensation packages and broader career opportunities. Additionally, we may incur significant expenses and expend significant time and resources on training, integration and business development before we are able to determine whether a new banker will be profitable or effective. If we are unable to attract and retain successful bankers, or if our bankers fail to meet our expectations in terms of customer relationships and profitability, we may be unable to execute our business strategy and our business, financial condition, results of operations and growth prospects may be adversely affected.
Loss of our executive officers or other key employees could impair our relationships with our customers and adversely affect our business.
Our success is dependent upon the continued service and skills of our executive management team. Our goals, strategies and marketing efforts are closely tied to the banking philosophy and strengths of our executive management, including our Chairman and Chief Executive Officer, C. Malcolm Holland, III, and our Vice Chairman, William C. Murphy. Our success is also dependent in part on the continued service of our market presidents and relationship managers. The loss of services of any of these key personnel could adversely affect our business because of their skills, years of industry experience, relationships with customers and the difficulty of promptly finding qualified replacement personnel. We cannot guarantee that these executive officers or key employees will continue to be employed with us in the future.
We have limited operating history and, accordingly, investors will have little basis on which to evaluate our ability to achieve our business objectives.
We were formed as a bank holding company in 2009 and commenced banking operations in 2010. Accordingly, we have a limited operating history upon which to evaluate our business and future prospects. As a result, it is difficult, if not impossible, to predict future operating results and to assess the likelihood of the success of our business. As a relatively young financial institution, the Bank is also subject to risks and levels of risk that are often greater than those encountered by financial institutions with longer established operations and relationships. New financial institutions often require significant capital from sources other than operations. Since we are a relatively young financial institution, our management team and employees will shoulder the burdens of the business operations and a workload associated with business growth and capitalization that is disproportionately greater than a more mature, established financial institution
The relatively unseasoned nature of a significant portion of our loan portfolio may expose us to increased credit risks.
The business of lending is inherently risky, including risks that the principal of or interest on any loan will not be repaid timely or at all or that the value of any collateral supporting the loan will be insufficient to cover our outstanding exposure. Our loan portfolio has grown to $541.0 million as of June 30, 2014, from $100.9 million as of December 31, 2010. A portion of this growth is related to a combination of organic growth and loans acquired in connection with our acquisitions. The organic portion of this increase is due to our increased loan production in a strong market. It is difficult to assess the future performance of acquired or recently originated loans because our relatively limited experience with such loans does not provide us with a significant payment history from which to judge future collectability. These loans may experience higher delinquency or charge-off levels than our
15
historical loan portfolio experience, which could adversely affect our business, financial condition and results of operations.
Difficult market conditions and economic trends have adversely affected the banking industry and could adversely affect our business, financial condition and results of operations.
We are operating in a challenging and uncertain economic environment, including generally uncertain conditions nationally and locally in our industry and market. Although economic conditions have improved in recent years, financial institutions continue to be affected by volatility in the real estate market in some parts of the country and uncertain regulatory and interest rate conditions. We retain direct exposure to the residential and commercial real estate market in Texas, particularly in the Dallas metropolitan area, and are affected by these events.
Our ability to assess the creditworthiness of customers and to estimate the losses inherent in our loan portfolio is made more complex by uncertain market and economic conditions. Our risk management practices, such as monitoring the concentration of our loans within specific industries and our credit approval practices, may not adequately reduce credit risk, and our credit administration personnel, policies and procedures may not adequately adapt to changes in economic or any other conditions affecting customers and the quality of the loan portfolio. Another national economic recession or deterioration of conditions in our market could drive losses beyond that which is provided for in our allowance for loan losses and result in the following consequences:
- •
- increases in loan delinquencies;
- •
- increases in nonperforming assets and foreclosures;
- •
- decreases in demand for our products and services, which could adversely affect our liquidity position; and
- •
- decreases in the value of the collateral securing our loans, especially real estate, which could reduce customers' borrowing power and repayment ability.
While economic conditions in Texas and the U.S. continue to show signs of recovery, there can be no assurance that these conditions will continue to improve. Although real estate markets have stabilized in portions of the U.S., a resumption of declines in real estate values, volume of home sales and financial stress on borrowers as a result of the uncertain economic environment, including job losses, could have an adverse effect on our borrowers and/or their customers, which could adversely affect our business, financial condition and results of operations.
The small to medium-sized businesses that we lend to may have fewer resources to weather adverse business developments, which may impair a borrower's ability to repay a loan, and such impairment could adversely affect our results of operations and financial condition.
We focus our business development and marketing strategy primarily on small to medium-sized businesses. Small to medium-sized businesses frequently have smaller market shares than their competition, may be more vulnerable to economic downturns, often need substantial additional capital to expand or compete and may experience substantial volatility in operating results, any of which may impair a borrower's ability to repay a loan. In addition, the success of a small and medium-sized business often depends on the management skills, talents and efforts of one or two people or a small group of people, and the death, disability or resignation of one or more of these people could have a material adverse impact on the business and its ability to repay its loan. If general economic conditions negatively impact the Dallas metropolitan area or Texas and small to medium-sized businesses are adversely affected or our borrowers are otherwise affected by adverse business developments, our business, financial condition and results of operations could be adversely affected.
16
Our allowance for loan losses may prove to be insufficient to absorb potential losses in our loan portfolio, which could adversely affect our business, financial condition and results of operations.
We establish our allowance for loan losses and maintain it at a level considered adequate by management to absorb probable loan losses based on our analysis of our loan portfolio and market environment. The allowance for loan losses represents our estimate of probable losses in the portfolio at each balance sheet date and is based upon relevant information available to us. Our allowance for loan losses consists of a general component based upon probable but unidentified losses inherent in the portfolio and a specific component based on individual loans that are considered impaired. The general component is based on various factors including our historical loss experience, historical loss experience for peer banks, growth trends, loan concentrations, migration trends between internal loan risk ratings, current economic conditions and other qualitative factors. The specific component of the allowance for loan losses is calculated based on a review of individual loans considered impaired. The analysis of impaired losses may be based on the present value of expected future cash flows discounted at the effective loan rate, an observable market price or the fair value of the underlying collateral on collateral dependent loans. In determining the collectability of certain loans, management also considers the fair value of any underlying collateral. The amount ultimately realized may differ from the carrying value of these assets because of economic, operating or other conditions beyond our control, and any such differences may be material.
As of June 30, 2014, our allowance for loan losses was 1.02% of our total loans. Loans acquired are initially recorded at fair value, which includes an estimate of credit losses expected to be realized over the remaining lives of the loans, and therefore no corresponding allowance for loan losses is recorded for these loans at acquisition. Additional loan losses will likely occur in the future and may occur at a rate greater than we have previously experienced. We may be required to take additional provisions for loan losses in the future to further supplement the allowance for loan losses, either due to management's decision to do so or requirements by our banking regulators. In addition, bank regulatory agencies will periodically review our allowance for loan losses and the value attributed to non-accrual loans or to real estate acquired through foreclosure. Such regulatory agencies may require us to recognize future charge-offs. These adjustments could adversely affect our business, financial condition and results of operations.
A large portion of our loan portfolio is comprised of commercial loans secured by receivables, promissory notes, inventory, equipment or other commercial collateral, the deterioration in value of which could increase the potential for future losses.
As of June 30, 2014, $174.1 million, or 32.2% of our total loans, was comprised of commercial loans to businesses. In general, these loans are collateralized by general business assets including, among other things, accounts receivable, promissory notes, inventory and equipment and most are backed by a personal guaranty of the borrower or principal. These commercial loans are typically larger in amount than loans to individuals and, therefore, have the potential for larger losses on a single loan basis. Additionally, the repayment of commercial loans is subject to the ongoing business operations of the borrower. The collateral securing such loans generally includes moveable property such as equipment and inventory, which may decline in value more rapidly than we anticipate exposing us to increased credit risk. A significant portion of our commercial loans are secured by promissory notes that evidence loans made by us to borrowers that in turn make loans to others that are secured by real estate. Accordingly, negative changes in the economy affecting real estate values and liquidity could impair the value of the collateral securing these loans. Significant adverse changes in the economy or local market conditions in which our commercial lending customers operate could cause rapid declines in loan collectability and the values associated with general business assets resulting in inadequate collateral coverage that may expose us to credit losses and could adversely affect our business, financial condition and results of operations.
17
Our nonfarm nonresidential and construction and land loan portfolios expose us to credit risks that could be greater than the risks related to other types of loans.
As of June 30, 2014, $180.9 million, or 33.5% of our total loans, was comprised of nonfarm nonresidential real estate loans (including owner occupied commercial real estate loans) and $56.8 million, or 10.5% of our total loans, was comprised of construction and land loans. These loans typically involve repayment dependent upon income generated, or expected to be generated, by the property securing the loan in amounts sufficient to cover operating expenses and debt service. The availability of such income for repayment may be adversely affected by changes in the economy or local market conditions. These loans expose a lender to greater credit risk than loans secured by other types of collateral because the collateral securing these loans is typically more difficult to liquidate due to the fluctuation of real estate values. Additionally, non-owner occupied commercial real estate loans generally involve relatively large balances to single borrowers or related groups of borrowers. Unexpected deterioration in the credit quality of our non-owner occupied commercial real estate loan portfolio could require us to increase our allowance for loan losses, which would reduce our profitability and could have a material adverse effect on our business, financial condition and results of operations.
Construction and land loans also involve risks attributable to the fact that loan funds are secured by a project under construction, and the project is of uncertain value prior to its completion. It can be difficult to accurately evaluate the total funds required to complete a project, and construction lending often involves the disbursement of substantial funds with repayment dependent, in part, on the success of the ultimate project rather than the ability of a borrower or guarantor to repay the loan. If we are forced to foreclose on a project prior to completion, we may be unable to recover the entire unpaid portion of the loan. In addition, we may be required to fund additional amounts to complete a project and may have to hold the property for an indeterminate period of time, any of which could adversely affect our business, financial condition and results of operations.
Because a significant portion of our loan portfolio is comprised of real estate loans, negative changes in the economy affecting real estate values and liquidity could impair the value of collateral securing our real estate loans and result in loan and other losses.
As of June 30, 2014, $362.6 million, or 67.0% of our total loans, was comprised of loans with real estate as a primary or secondary component of collateral. As a result, adverse developments affecting real estate values in the Dallas metropolitan area or Texas generally could increase the credit risk associated with our real estate loan portfolio. Real estate values in many Texas markets have experienced periods of fluctuation over the last five years. The market value of real estate can fluctuate significantly in a short period of time. Adverse changes affecting real estate values and the liquidity of real estate in one or more of our markets could increase the credit risk associated with our loan portfolio, and could result in losses that adversely affect credit quality, financial condition, and results of operation. Negative changes in the economy affecting real estate values and liquidity in our market areas could significantly impair the value of property pledged as collateral on loans and affect our ability to sell the collateral upon foreclosure without a loss or additional losses. Collateral may have to be sold for less than the outstanding balance of the loan, which could result in losses on such loans. Such declines and losses could have a material adverse impact on our business, results of operations and growth prospects. If real estate values decline, it is also more likely that we would be required to increase our allowance for loan losses, which could adversely affect our business, financial condition and results of operations.
We may be subject to additional credit risk with respect to loans that we make to other lenders.
As a part of our commercial lending activities, we make loans to customers that, in turn, make commercial and residential real estate loans to other borrowers. As of June 30, 2014, $62.8 million, or
18
36.1%, of our commercial loan portfolio was comprised of these types of loans. When we make a loan of this nature, we take as collateral the promissory notes issued by the end borrowers to our customer, which are themselves secured by the underlying real estate. Although the loans to our customers are subject to the risks inherent in commercial lending generally, we are also exposed to additional risks, including those related to commercial and residential real estate lending, as the ability of our customer to repay the loan from us can be affected by the risks associated with the value and liquidity of the real estate underlying our customer's loans to the end borrowers. Moreover, because we are not lending directly to the end borrower, and because our collateral is a promissory note rather than the underlying real estate, we may be subject to risks that are different from those we are exposed to when we make a loan directly that is secured by commercial or residential real estate. Because the ability of the end borrower to repay its loan from our customer could affect the ability of our customer to repay its loan from us, our inability to exercise control over the relationship with the end borrower and the collateral, except under limited circumstances, could expose us to credit losses that adversely affect our business, financial condition and results of operations.
We have a concentration of loans outstanding to a limited number of borrowers, which may increase our risk of loss.
We have extended significant amounts of credit to a limited number of borrowers, and as of June 30, 2014, the aggregate amount of loans to our 10 and 25 largest borrowers (including related entities) amounted to $73.7 million, or 13.6% of total loans, and $142.1 million, or 26.3% of total loans, respectively. As of such date, none of these loans were nonperforming loans. Concentration of a significant amount of credit extended to a limited number of borrowers increases the risk in our loan portfolio. In the event that one or more of these borrowers is not able to make payments of interest and principal in respect of such loans, the potential loss to us is more likely to have a material adverse effect on our business, financial condition and results of operations.
A lack of liquidity could impair our ability to fund operations and adversely affect our operations and jeopardize our business, financial condition, and results of operations.
Liquidity is essential to our business. We rely on our ability to generate deposits and effectively manage the repayment and maturity schedules of our loans and investment securities, respectively, to ensure that we have adequate liquidity to fund our operations. An inability to raise funds through deposits, borrowings, the sale of our investment securities, the sale of loans, and other sources could have a substantial negative effect on our liquidity. Our most important source of funds is deposits. Deposit balances can decrease when customers perceive alternative investments as providing a better risk/return tradeoff. If customers move money out of bank deposits and into other investments such as money market funds, we would lose a relatively low-cost source of funds, increasing our funding costs and reducing our net interest income and net income.
Other primary sources of funds consist of cash flows from operations, maturities and sales of investment securities, and proceeds from the issuance and sale of our equity and debt securities to investors. Additional liquidity is provided by the ability to borrow from the Federal Reserve Bank of Dallas and the Federal Home Loan Bank of Dallas, or the FHLB. We also may borrow funds from third-party lenders, such as other financial institutions. Our access to funding sources in amounts adequate to finance or capitalize our activities, or on terms that are acceptable to us, could be impaired by factors that affect us directly or the financial services industry or economy in general, such as disruptions in the financial markets or negative views and expectations about the prospects for the financial services industry. Our access to funding sources could also be affected by a decrease in the level of our business activity as a result of a downturn in the Dallas metropolitan area or by one or more adverse regulatory actions against us.
19
Any decline in available funding could adversely impact our ability to originate loans, invest in securities, meet our expenses, or to fulfill obligations such as repaying our borrowings or meeting deposit withdrawal demands, any of which could have a material adverse impact on our liquidity and could, in turn, adversely affect our business, financial condition and results of operations.
We may need to raise additional capital in the future, and if we fail to maintain sufficient capital, whether due to losses, an inability to raise additional capital or otherwise, our financial condition, liquidity and results of operations, as well as our ability to maintain regulatory compliance, could be adversely affected.
We face significant capital and other regulatory requirements as a financial institution. We may need to raise additional capital in the future to provide us with sufficient capital resources and liquidity to meet our commitments and business needs, which could include the possibility of financing acquisitions. In addition, we, on a consolidated basis, and the Bank, on a stand-alone basis, must meet certain regulatory capital requirements and maintain sufficient liquidity. Importantly, regulatory capital requirements could increase from current levels, which could require us to raise additional capital or reduce our operations. Our ability to raise additional capital depends on conditions in the capital markets, economic conditions and a number of other factors, including investor perceptions regarding the banking industry, market conditions and governmental activities, and on our financial condition and performance. Accordingly, we cannot assure you that we will be able to raise additional capital if needed or on terms acceptable to us. If we fail to maintain capital to meet regulatory requirements, our liquidity, business, financial condition and results of operations could be adversely affected.
Interest rate shifts could reduce net interest income and otherwise negatively impact our financial condition and results of operations.
The majority of our banking assets are monetary in nature and subject to risk from changes in interest rates. Like most financial institutions, our earnings and cash flows depend to a great extent upon the level of our net interest income, or the difference between the interest income we earn on loans, investments and other interest-earning assets, and the interest we pay on interest-bearing liabilities, such as deposits and borrowings. Changes in interest rates can increase or decrease our net interest income, because different types of assets and liabilities may react differently, and at different times, to market interest rate changes. When interest-bearing liabilities mature or reprice more quickly, or to a greater degree than interest-earning assets in a period, an increase in interest rates could reduce net interest income. Similarly, when interest-earning assets mature or reprice more quickly, or to a greater degree than interest-bearing liabilities, falling interest rates could reduce net interest income. As of June 30, 2014, 45.0% of our interest-earning assets and 62.3% of our interest-bearing liabilities are variable rate. Our interest sensitivity profile was asset sensitive as of June 30, 2014, meaning that we estimate our net interest income would increase more from rising interest rates than from falling interest rates.
Additionally, an increase in interest rates may, among other things, reduce the demand for loans and our ability to originate loans and decrease loan repayment rates. A decrease in the general level of interest rates may affect us through, among other things, increased prepayments on our loan portfolio and increased competition for deposits. Accordingly, changes in the level of market interest rates affect our net yield on interest-earning assets, loan origination volume, loan portfolio and our overall results. Although our asset-liability management strategy is designed to control and mitigate exposure to the risks related to changes in market interest rates, those rates are affected by many factors outside of our control, including governmental monetary policies, inflation, deflation, recession, changes in unemployment, the money supply, international disorder and instability in domestic and foreign financial markets.
20
We could recognize losses on investment securities held in our securities portfolio, particularly if interest rates increase or economic and market conditions deteriorate.
While we attempt to invest a significant percentage of our assets in loans (our loan to deposit ratio was 88.5% as of June 30, 2014), we invest a percentage of our total assets (7.1% as of June 30, 2014) in investment securities with the primary objectives of providing a source of liquidity, providing an appropriate return on funds invested, managing interest rate risk, meeting pledging requirements and meeting regulatory capital requirements. As of June 30, 2014, the fair value of our securities portfolio was $50.5 million, which included a net unrealized gain of $294,731. Factors beyond our control can significantly influence the fair value of securities in our portfolio and can cause potential adverse changes to the fair value of these securities. For example, fixed-rate securities are generally subject to decreases in market value when interest rates rise. Additional factors include, but are not limited to, rating agency downgrades of the securities, defaults by the issuer or individual borrowers with respect to the underlying securities, and continued instability in the credit markets. Any of the foregoing factors could cause other-than-temporary impairment in future periods and result in realized losses. The process for determining whether impairment is other-than-temporary usually requires difficult, subjective judgments about the future financial performance of the issuer and any collateral underlying the security in order to assess the probability of receiving all contractual principal and interest payments on the security. Because of changing economic and market conditions affecting interest rates, the financial condition of issuers of the securities and the performance of the underlying collateral, we may recognize realized and/or unrealized losses in future periods, which could have an adverse effect on our business, financial condition and results of operations.
We face strong competition from financial services companies and other companies that offer banking services, which could adversely affect our business, financial condition, and results of operations.
We conduct our operations almost exclusively in Texas and particularly in the Dallas metropolitan area. Many of our competitors offer the same, or a wider variety of, banking services within our market area. These competitors include banks with nationwide operations, regional banks and other community banks. We also face competition from many other types of financial institutions, including savings banks, credit unions, finance companies, mutual funds, insurance companies, brokerage and investment banking firms, asset-based non-bank lenders and certain other non-financial entities, such as retail stores which may maintain their own credit programs and certain governmental organizations which may offer more favorable financing or deposit terms than we can. In addition, a number of out-of-state financial intermediaries have opened production offices, or otherwise solicit deposits, in our market area. Increased competition in our market may result in reduced loans and deposits, as well as reduced net interest margin, fee income and profitability. Ultimately, we may not be able to compete successfully against current and future competitors. If we are unable to attract and retain banking customers, we may be unable to continue to grow our loan and deposit portfolios, and our business, financial condition and results of operations could be adversely affected.
Our ability to compete successfully depends on a number of factors, including, among other things:
- •
- the ability to develop, maintain and build long-term customer relationships based on top quality service, high ethical
standards and safe, sound assets;
- •
- the scope, relevance and pricing of products and services offered to meet customer needs and demands;
- •
- the rate at which we introduce new products and services relative to our competitors;
- •
- customer satisfaction with our level of service;
- •
- the ability to expand our market position; and
21
- •
- industry and general economic trends.
Failure to perform in any of these areas could significantly weaken our competitive position, which could adversely affect our growth and profitability, which, in turn, could adversely affect on our business, financial condition and results of operations.
Negative public opinion regarding our company or failure to maintain our reputation in the community we serve could adversely affect our business and prevent us from growing our business.
As a community bank, our reputation within the community we serve is critical to our success. We have set ourselves apart from our competitors by building strong personal and professional relationships with our customers and being active members of the communities we serve. As such, we strive to enhance our reputation by recruiting, hiring and retaining employees who share our core values of being an integral part of the communities we serve and delivering superior service to our customers. If our reputation is negatively affected by the actions of our employees or otherwise, we may be less successful in attracting new customers, and our business, financial condition, results of operations and prospects could be materially and adversely affected. Further, negative public opinion can expose us to litigation and regulatory action as we seek to implement our growth strategy.
The dividend rate on our Series C preferred stock will increase in the future if not redeemed, which would reduce net income available to our common shareholders.
We have issued $8.0 million in Series C preferred stock to the U.S. Treasury in connection with our participation in the SBLF program. The annual dividend rate is currently 1.0%. The dividend rate increases to 9.0% per annum in February 2016. If we do not redeem our Series C preferred stock on or before such date, the increase in the dividend rate on our Series C preferred stock will reduce net income available to our common shareholders.
If we fail to maintain an effective system of disclosure controls and procedures and internal control over financial reporting, we may not be able to accurately report our financial results or prevent fraud.
Ensuring that we have adequate disclosure controls and procedures, including internal control over financial reporting, in place so that we can produce accurate financial statements on a timely basis is costly and time-consuming and needs to be reevaluated frequently. We are in the process of documenting, reviewing and, if appropriate, improving our internal controls and procedures in anticipation of being a public company and being subject to the requirements of Section 404 of the Sarbanes-Oxley Act of 2002, or the Sarbanes-Oxley Act, which will require annual management assessments of the effectiveness of our internal control over financial reporting and, when we cease to be an emerging growth company under the JOBS Act, a report by our independent auditors addressing these assessments. Our management may conclude that our internal control over financial reporting are not effective due to our failure to cure any identified material weakness or otherwise. Moreover, even if our management concludes that our internal control over financial reporting are effective, our independent registered public accounting firm may not conclude that our internal control over financial reporting are effective. In the future, our independent registered public accounting firm may not be satisfied with our internal control over financial reporting or the level at which our controls are documented, designed, operated or reviewed, or it may interpret the relevant requirements differently from us. In addition, during the course of the evaluation, documentation and testing of our internal control over financial reporting, we may identify deficiencies that we may not be able to remediate in time to meet the deadline imposed by the Securities and Exchange Commission, or the SEC, for compliance with the requirements of Section 404 of the Sarbanes-Oxley Act. Any such deficiencies may also subject us to adverse regulatory consequences. If we fail to achieve and maintain the adequacy of our internal control over financial reporting, as these standards are modified, supplemented or amended from time to time, we may be unable to report our financial information on a timely basis, we
22
may not be able to conclude on an ongoing basis that we have effective internal control over financial reporting in accordance with the Sarbanes-Oxley Act, and we may suffer adverse regulatory consequences or violations of listing standards. There could also be a negative reaction in the financial markets due to a loss of investor confidence in the reliability of our financial statements.
We are subject to certain operational risks, including, but not limited to, customer or employee fraud and data processing system failures and errors.
Employee errors and employee or customer misconduct could subject us to financial losses or regulatory sanctions and seriously harm our reputation. Misconduct by our employees could include hiding unauthorized activities from us, improper or unauthorized activities on behalf of our customers or improper use of confidential information. It is not always possible to prevent employee errors and misconduct, and the precautions we take to prevent and detect this activity may not be effective in all cases. Employee errors could also subject us to financial claims for negligence.
We maintain a system of internal controls to mitigate against operational risks, including data processing system failures and errors and customer or employee fraud, as well as insurance coverage designed to protect us from material losses associated with these risks including losses resulting from any associated business interruption. If our internal controls fail to prevent or detect an occurrence, or if any resulting loss is not insured or exceeds applicable insurance limits, it could adversely affect our business, financial condition and results of operations.
In addition, we rely heavily upon information supplied by third parties, including the information contained in credit applications, property appraisals, title information, equipment pricing and valuation and employment and income documentation, in deciding which loans we will originate, as well as the terms of those loans. If any of the information upon which we rely is misrepresented, either fraudulently or inadvertently, and the misrepresentation is not detected prior to loan funding, the value of the loan may be significantly lower than expected, or we may fund a loan that we would not have funded or on terms we would not have extended. Whether a misrepresentation is made by the applicant or another third party, we generally bear the risk of loss associated with the misrepresentation. A loan subject to a material misrepresentation is typically unsellable or subject to repurchase if it is sold prior to detection of the misrepresentation. The sources of the misrepresentations are often difficult to locate, and it is often difficult to recover any of the resulting monetary losses we may suffer.
We have a continuing need for technological change, and we may not have the resources to effectively implement new technology, or we may experience operational challenges when implementing new technology.
The financial services industry is undergoing rapid technological changes with frequent introductions of new technology-driven products and services. In addition to better serving customers, the effective use of technology increases efficiency and enables financial institutions to reduce costs. Our future success will depend, at least in part, upon our ability to address the needs of our customers by using technology to provide products and services that will satisfy customer demands for convenience as well as to create additional efficiencies in our operations as we continue to grow and expand our products and service offerings. We may experience operational challenges as we implement these new technology enhancements or products, which could result in us not fully realizing the anticipated benefits from such new technology or require us to incur significant costs to remedy any such challenges in a timely manner.
Many of our larger competitors have substantially greater resources to invest in technological improvements. As a result, they may be able to offer additional or superior products compared to those that we will be able to provide, which would put us at a competitive disadvantage. Accordingly, we may
23
lose customers seeking new technology-driven products and services to the extent we are unable to provide such products and services.
Our operations could be interrupted if our third-party service providers experience difficulty, terminate their services or fail to comply with banking regulations.
We depend on a number of relationships with third-party service providers. Specifically, we receive certain third-party services including, but not limited to, core systems processing, essential web hosting and other Internet systems, our online banking services, deposit processing and other processing services. If these third-party service providers experience difficulties, or terminate their services, and we are unable to replace them with other service providers, particularly on a timely basis, our operations could be interrupted. If an interruption were to continue for a significant period of time, our business, financial condition and results of operations could be adversely affected, perhaps materially. Even if we are able to replace third-party service providers, it may be at a higher cost to us, which could adversely affect our business, financial condition and results of operations.
System failure or breaches of our network security could subject us to increased operating costs as well as litigation and other liabilities.
The computer systems and network infrastructure we use, including the systems and infrastructure of our third-party service providers, could be vulnerable to unforeseen problems. Our operations are dependent upon our ability to protect our computer equipment, and the information stored therein, against damage from physical theft, fire, power loss, telecommunications failure or a similar catastrophic event, as well as from security breaches, denial of service attacks, viruses, worms and other disruptive problems caused by hackers. Any damage or failure that causes breakdowns or disruptions in our general ledger, deposit, loan and other systems could damage our reputation, result in a loss of customer business, subject us to additional regulatory scrutiny, including enforcement action that could restrict our operations, or expose us to civil litigation and possible financial liability, any of which could have a material adverse effect on us. Computer break-ins, phishing and other disruptions could also jeopardize the security of information stored in and transmitted through our computer systems and network infrastructure, which may result in significant liability to us and may cause existing and potential customers to refrain from doing business with us. In addition, advances in computer capabilities could result in a compromise or breach of the systems we and our third-party service providers use to encrypt and protect customer transaction data. A failure of such security measures could adversely affect our business, financial condition and results of operations.
If the goodwill that we have recorded or may record in connection with a business acquisition becomes impaired, it could require charges to earnings, which would adversely affect on our business, financial condition and results of operations.
Goodwill represents the amount by which the cost of an acquisition exceeded the fair value of net assets we acquired in connection with the purchase of another financial institution. We review goodwill for impairment at least annually, or more frequently if a triggering event occurs which indicates that the carrying value of the asset might be impaired.
Our goodwill impairment test involves a two-step process. Under the first step, the estimation of fair value of the reporting unit is compared to its carrying value including goodwill. If step one indicates a potential impairment, the second step is performed to measure the amount of impairment, if any. If the carrying amount of the reporting unit goodwill exceeds the implied fair value of that goodwill, an impairment loss is recognized in an amount equal to that excess. Any such adjustments are reflected in our results of operations in the periods in which they become known. As of June 30, 2014, our goodwill totaled $19.1 million. While we have not recorded any impairment charges since we initially recorded the goodwill, there can be no assurance that our future evaluations of our existing goodwill or goodwill we may acquire in the future will not result in findings of impairment and related write-downs, which could adversely affect our business, financial condition and results of operations.
24
We may be subject to environmental liabilities in connection with the foreclosure on real estate assets securing our loan portfolio.
Hazardous or toxic substances or other environmental hazards may be located on the properties that secure our loans. If we acquire such properties as a result of foreclosure or otherwise, we could become subject to various environmental liabilities. For example, we could be held liable for the cost of cleaning up or otherwise addressing contamination at or from these properties. We could also be held liable to a governmental entity or third party for property damage, personal injury or other claims relating to any environmental contamination at or from these properties. In addition, we own and operate certain properties that may be subject to similar environmental liability risks. Although we have policies and procedures that are designed to mitigate against certain environmental risks, we may not detect all environmental hazards associated with these properties. In the event we ever became subject to significant environmental liabilities, our business, financial condition and results of operations could be adversely affected.
Risks Related to Our Industry and Regulation
The ongoing implementation of the Dodd-Frank Act could adversely affect our business, financial condition, and results of operations.
On July 21, 2010, the Dodd-Frank Act was signed into law, and the process of implementation is ongoing. The Dodd-Frank Act imposes significant regulatory and compliance changes on many industries, including ours. There remains significant uncertainty surrounding the manner in which the provisions of the Dodd-Frank Act will ultimately be implemented by the various regulatory agencies and the full extent of the impact of the requirements on our operations is unclear. The changes resulting from the Dodd-Frank Act may impact the profitability of our business activities, require changes to certain of our business practices, require the development of new compliance infrastructure, impose upon us more stringent capital, liquidity and leverage requirements or otherwise adversely affect our business. These changes may also require us to invest significant management attention and resources to evaluate and make any changes necessary to comply with new statutory and regulatory requirements. Failure to comply with the new requirements or with any future changes in laws or regulations could adversely affect our business, financial condition and results of operations.
We operate in a highly regulated environment and the laws and regulations that govern our operations, corporate governance, executive compensation and accounting principles, or changes in them, or our failure to comply with them, could adversely affect us.
We are subject to extensive regulation, supervision and legal requirements that govern almost all aspects of our operations. These laws and regulations are not intended to protect our shareholders. Rather, these laws and regulations are intended to protect customers, depositors, the Deposit Insurance Fund, and the overall financial stability of the United States, these laws and regulations, among other matters, prescribe minimum capital requirements, impose limitations on the business activities in which we can engage, limit the dividend or distributions that the Bank can pay to us, restrict the ability of institutions to guarantee our debt, and impose certain specific accounting requirements on us that may be more restrictive and may result in greater or earlier charges to earnings or reductions in our capital than generally accepted accounting principles would require. Compliance with laws and regulations can be difficult and costly, and changes to laws and regulations often impose additional compliance costs. Our failure to comply with these laws and regulations, even if the failure follows good faith effort or reflects a difference in interpretation, could subject us to restrictions on our business activities, fines and other penalties, any of which could adversely affect our results of operations, capital base and the price of our securities. Further, any new laws, rules and regulations could make compliance more difficult or expensive or otherwise adversely affect our business, financial condition and results of operations.
25
State and federal banking agencies periodically conduct examinations of our business, including compliance with laws and regulations, and our failure to comply with any supervisory actions to which we are or become subject as a result of such examinations could adversely affect us.
Texas and federal banking agencies, including the Texas Department of Banking and the Federal Reserve, periodically conduct examinations of our business, including compliance with laws and regulations. If, as a result of an examination, a Texas or federal banking agency were to determine that the financial condition, capital resources, asset quality, earnings prospects, management, liquidity or other aspects of any of our operations had become unsatisfactory, or that our company, the Bank or their respective management were in violation of any law or regulation, it may take a number of different remedial actions as it deems appropriate. These actions include the power to enjoin "unsafe or unsound" practices, to require affirmative actions to correct any conditions resulting from any violation or practice, to issue an administrative order that can be judicially enforced, to direct an increase in our capital levels, to restrict our growth, to assess civil monetary penalties against us, the Bank or their respective officers or directors, to remove officers and directors and, if it is concluded that such conditions cannot be corrected or there is an imminent risk of loss to depositors, to terminate the Bank's deposit insurance. If we become subject to such regulatory actions, our business, financial condition, results of operations and reputation could be adversely affected.
Many of our new activities and expansion plans require regulatory approvals, and failure to obtain them may restrict our growth.
We intend to complement and expand our business by pursuing strategic acquisitions of financial institutions and other complementary businesses. Generally, we must receive state and federal regulatory approval before we can acquire an FDIC-insured depository institution or related business. In determining whether to approve a proposed acquisition, federal banking regulators will consider, among other factors, the effect of the acquisition on competition, our financial condition, our future prospects, and the impact of the proposal on U.S. financial stability. The regulators also review current and projected capital ratios and levels, the competence, experience and integrity of management and its record of compliance with laws and regulations, the convenience and needs of the communities to be served (including the acquiring institution's record of compliance under the Community Reinvestment Act, or the CRA) and the effectiveness of the acquiring institution in combating money laundering activities. Such regulatory approvals may not be granted on terms that are acceptable to us, or at all. We may also be required to sell branches as a condition to receiving regulatory approval, which condition may not be acceptable to us or, if acceptable to us, may reduce the benefit of any acquisition.
In addition to the acquisition of existing financial institutions, as opportunities arise, we plan to continue de novo branching as a part of our organic growth strategy. De novo branching and any acquisitions carry with them numerous risks, including the inability to obtain all required regulatory approvals. The failure to obtain these regulatory approvals for potential future strategic acquisitions and de novo branches could impact our business plans and restrict our growth.
Financial institutions, such as the Bank, face a risk of noncompliance and enforcement action with the Bank Secrecy Act and other anti-money laundering statutes and regulations.
The Bank Secrecy Act, the Uniting and Strengthening America by Providing Appropriate Tools Required to Intercept and Obstruct Terrorism Act of 2001, or the USA PATRIOT Act, and other laws and regulations require financial institutions, among other duties, to institute and maintain an effective anti-money laundering program and file suspicious activity and currency transaction reports as appropriate. The Financial Crimes Enforcement Network, established by the U.S. Department of the Treasury, or the Treasury Department, to administer the Bank Secrecy Act, is authorized to impose significant civil money penalties for violations of those requirements, and has recently engaged in coordinated enforcement efforts with the individual federal banking regulators, as well as the U.S.
26
Department of Justice, Drug Enforcement Administration, and Internal Revenue Service. There is also increased scrutiny of compliance with the sanctions programs and rules administered and enforced by the Treasury Department's Office of Foreign Assets Control.
In order to comply with regulations, guidelines and examination procedures in this area, we have dedicated significant resources to our anti-money laundering program. If our policies, procedures and systems are deemed deficient, we could be subject to liability, including fines and regulatory actions such as restrictions on our ability to pay dividends and the necessity to obtain regulatory approvals to proceed with certain aspects of our business plans, including acquisitions and de novo branching.
We are subject to the CRA and fair lending laws, and failure to comply with these laws could lead to material penalties.
The CRA, the Equal Credit Opportunity Act, the Fair Housing Act and other fair lending laws and regulations impose nondiscriminatory lending requirements on financial institutions. The Consumer Financial Protection Bureau, or the CFPB, the Justice Department and other federal agencies are responsible for enforcing these laws and regulations. A successful challenge to an institution's performance under the CRA or fair lending laws and regulations could result in a wide variety of sanctions, including the required payment of damages and civil money penalties, injunctive relief, imposition of restrictions on mergers and acquisitions activity, and restrictions on expansion activity. Private parties may also have the ability to challenge an institution's performance under fair lending laws in private class action litigation.
The FDIC's restoration plan and the related increased assessment rate could adversely affect our earnings and results of operations.
As a result of economic conditions and the enactment of the Dodd-Frank Act, the FDIC has increased deposit insurance assessment rates, which in turn raised deposit premiums for many insured depository institutions. If these increases are insufficient for the Deposit Insurance Fund to meet its funding requirements, further special assessments or increases in deposit insurance premiums may be required. We are generally unable to control the amount of premiums that we are required to pay for FDIC insurance. If there are additional financial institution failures that affect the Deposit Insurance Fund, we may be required to pay FDIC premiums higher than current levels. Our FDIC insurance related costs were $378,000 for the year ended December 31, 2013, compared to $234,000 for the year ended December 31, 2012, and $383,000 for the year ended December 31, 2011. Any future additional assessments, increases or required prepayments in FDIC insurance premiums could adversely affect our earnings and results of operations.
We will become subject to more stringent capital requirements, which may adversely impact our return on equity or constrain us from paying dividends or repurchasing shares.
The Dodd-Frank Act requires the federal banking agencies to establish stricter risk-based capital requirements and leverage limits to apply to banks and bank and savings and loan holding companies. In July 2013, the federal banking agencies published the final Basel III Capital Rules (as defined in "Regulation and Supervision—Regulatory Capital Requirements and Capital Adequacy") that revised their risk-based and leverage capital requirements and their method for calculating risk-weighted assets. The Basel III Capital Rules will apply to all bank holding companies with $500 million or more in consolidated assets and all banks regardless of size.
As a result of the enactment of the Basel III Capital Rules, we will become subject to increased required capital levels. The Basel III Capital Rules become effective as applied to us on January 1, 2015, with a phase-in period that generally extends from January 1, 2015 through January 1, 2019. The application of more stringent capital requirements on us could, among other things, result in lower
27
returns on equity, require the raising of additional capital, and result in regulatory actions such as the inability to pay dividends or repurchase shares if we were to be unable to comply with such requirements.
The Federal Reserve may require us to commit capital resources to support the Bank.
The Federal Reserve requires a bank holding company to act as a source of financial and managerial strength to its subsidiary banks and to commit resources to support its subsidiary banks. Under the "source of strength" doctrine, the Federal Reserve may require a bank holding company to make capital injections into a troubled subsidiary bank at times when the bank holding company may not be inclined to do so and may charge the bank holding company with engaging in unsafe and unsound practices for failure to commit resources to such a subsidiary bank. Accordingly, we could be required to provide financial assistance to the Bank if it experiences financial distress.
Such a capital injection may be required at a time when our resources are limited and we may be required to borrow the funds to make the required capital injection. In the event of a bank holding company's bankruptcy, the bankruptcy trustee will assume any commitment by the holding company to a federal bank regulatory agency to maintain the capital of a subsidiary bank. Moreover, bankruptcy law provides that claims based on any such commitment will be entitled to a priority of payment over the claims of the holding company's general unsecured creditors, including the holders of any note obligations.
We could be adversely affected by the soundness of other financial institutions.
Financial services institutions are interrelated as a result of trading, clearing, counterparty or other relationships. We have exposure to many different industries and counterparties, and routinely execute transactions with counterparties in the financial services industry, including commercial banks, brokers and dealers, investment banks and other institutional clients. Many of these transactions expose us to credit risk in the event of a default by a counterparty or client. In addition, our credit risk may be exacerbated when our collateral cannot be foreclosed upon or is liquidated at prices not sufficient to recover the full amount of the credit or derivative exposure due. Any such losses could adversely affect our business, financial condition and results of operations.
Monetary policies and regulations of the Federal Reserve could adversely affect our business, financial condition and results of operations.
In addition to being affected by general economic conditions, our earnings and growth are affected by the policies of the Federal Reserve. An important function of the Federal Reserve is to regulate the U.S. money supply and credit conditions. Among the instruments used by the Federal Reserve to implement these objectives are open market operations in U.S. government securities, adjustments of both the discount rate and the federal funds rate and changes in reserve requirements against bank deposits. These instruments are used in varying combinations to influence overall economic growth and the distribution of credit, bank loans, investments and deposits. Their use also affects interest rates charged on loans or paid on deposits.
The monetary policies and regulations of the Federal Reserve have had a significant effect on the operating results of commercial banks in the past and are expected to continue to do so in the future. Although we cannot determine the effects of such policies on us at this time, such policies could adversely affect our business, financial condition and results of operations.
28
Risks Related to this Offering and an Investment in our Common Stock
An active trading market for our common stock may not develop, and you may not be able to sell your common stock at or above the initial public offering price.
Prior to this offering there has been no public market for our common stock. An active trading market for shares of our common stock may never develop or be sustained following this offering. If an active trading market does not develop, you may have difficulty selling your shares of common stock at an attractive price, or at all. The initial public offering price for our common stock will be determined by negotiations between us and the representative of the underwriters and may not be indicative of prices that will prevail in the open market following this offering. Consequently, you may not be able to sell your common stock at or above the initial public offering price or at any other price or at the time that you would like to sell. An inactive market may also impair our ability to raise capital by selling our common stock and may impair our ability to expand our business by using our common stock as consideration in an acquisition.
The market price of our common stock may fluctuate significantly.
The market price of our common stock could fluctuate significantly due to a number of factors, including, but not limited to:
- •
- our quarterly or annual earnings, or those of other companies in our industry;
- •
- actual or anticipated fluctuations in our operating results;
- •
- changes in accounting standards, policies, guidance, interpretations or principles;
- •
- the public reaction to our press releases, our other public announcements and our filings with the SEC;
- •
- announcements by us or our competitors of significant acquisitions, dispositions, innovations or new programs and
services;
- •
- changes in financial estimates and recommendations by securities analysts following our stock, or the failure of
securities analysts to cover our common stock after this offering;
- •
- changes in earnings estimates by securities analysts or our ability to meet those estimates;
- •
- the operating and stock price performance of other comparable companies;
- •
- general economic conditions and overall market fluctuations;
- •
- the trading volume of our common stock;
- •
- changes in business, legal or regulatory conditions, or other developments affecting participants in our industry, and
publicity regarding our business or any of our significant customers or competitors;
- •
- changes in governmental monetary policies, including the policies of the Federal Reserve;
- •
- future sales of our common stock by us, directors, executives and significant shareholders; and
- •
- changes in economic conditions in and political conditions affecting our target markets.
In particular, the realization of any of the risks described in this "Risk Factors" section could have a material adverse effect on the market price of our common stock and cause the value of your investment to decline. In addition, the stock market in general has experienced extreme volatility that has often been unrelated to the operating performance of particular companies. These broad market fluctuations may adversely affect the trading price of our common stock over the short, medium or long term, regardless of our actual performance. If the market price of our common stock reaches an
29
elevated level following this offering, it may materially and rapidly decline. In the past, following periods of volatility in the market price of a company's securities, shareholders have often instituted securities class action litigation. If we were to be involved in a class action lawsuit, it could divert the attention of senior management and could adversely affect our business, financial condition and results of operations.
The obligations associated with being a public company will require significant resources and management attention.
As a public company, we will face increased legal, accounting, administrative and other costs and expenses that we have not incurred as a private company, particularly after we are no longer an emerging growth company. We expect to incur incremental costs related to operating as a public company of approximately $700,000 annually, although these costs could be higher, particularly when we no longer qualify as an emerging growth company. After the completion of this offering, we will be subject to the reporting requirements of the Exchange Act, which requires that we file annual, quarterly and current reports with respect to our business and financial condition and proxy and other information statements, and the rules and regulations implemented by the SEC, the Sarbanes-Oxley Act, the Dodd-Frank Act, the PCAOB and the Nasdaq Stock Market, each of which imposes additional reporting and other obligations on public companies. As a public company, we will be required to:
- •
- prepare and distribute periodic reports, proxy statements and other shareholder communications in compliance with the
federal securities laws and rules;
- •
- expand the roles and duties of our board of directors and committees thereof;
- •
- maintain an internal audit function;
- •
- institute more comprehensive financial reporting and disclosure compliance procedures;
- •
- involve and retain to a greater degree outside counsel and accountants in the activities listed above;
- •
- enhance our investor relations function;
- •
- establish new internal policies, including those relating to trading in our securities and disclosure controls and
procedures;
- •
- retain additional personnel;
- •
- comply with Nasdaq Stock Market listing standards; and
- •
- comply with the Sarbanes-Oxley Act.
We expect these rules and regulations and changes in laws, regulations and standards relating to corporate governance and public disclosure, which have created uncertainty for public companies, to increase legal and financial compliance costs and make some activities more time consuming and costly. These laws, regulations and standards are subject to varying interpretations, in many cases due to their lack of specificity, and, as a result, their application in practice may evolve over time as new guidance is provided by regulatory and governing bodies. This could result in continuing uncertainty regarding compliance matters and higher costs necessitated by ongoing revisions to disclosure and governance practices. Our investment in compliance with existing and evolving regulatory requirements will result in increased administrative expenses and a diversion of management's time and attention from revenue-generating activities to compliance activities, which could have a material adverse effect on our business, financial condition and results of operations. These increased costs could require us to divert a significant amount of money that we could otherwise use to expand our business and achieve our strategic objectives.
30
You will incur immediate dilution as a result of this offering.
If you purchase our common stock in this offering, you will pay more for your shares than the net tangible book value per share immediately prior to consummation of this offering. As a result, you will incur immediate dilution of $4.56 per share representing the difference between the offering price of $13.00, the midpoint of the estimated initial public offering price range set forth on the cover page of this prospectus, and our net tangible book value per share as of June 30, 2014 of $7.18. Accordingly, if we are liquidated at our book value, you would not receive the full amount of your investment.
If securities or industry analysts change their recommendations regarding our stock or if our operating results do not meet their expectations, our stock price could decline.
The trading market for our common stock could be influenced by the research and reports that industry or securities analysts may publish about us or our business. If one or more of these analysts cease coverage of us or fail to publish reports on us regularly, we could lose visibility in the financial markets, which in turn could cause our stock price or trading volume to decline. Moreover, if one or more of the analysts who cover us downgrade our stock or if our operating results do not meet their expectations, either absolutely or relative to our competitors, our stock price could decline significantly.
Future sales or the possibility of future sales of a substantial amount of our common stock may depress the price of shares of our common stock.
Future sales or the availability for sale of substantial amounts of our common stock in the public market could adversely affect the prevailing market price of our common stock and could impair our ability to raise capital through future sales of equity securities.
Our certificate of formation authorizes us to issue up to 75,000,000 shares of common stock, 9,058,832 of which will be outstanding upon consummation of this offering (or 9,463,832 shares if the underwriters exercise their option to purchase additional shares in full). This number includes 2,700,000 shares that we are selling in this offering (or 3,105,000 shares if the underwriters exercise their option to purchase additional shares in full), which will be freely transferable without restriction or further registration under the Securities Act of 1933, as amended, or the Securities Act. Holders of approximately 66% of the shares of our common stock outstanding prior to this offering, including all of our executive officers and directors, have agreed not to sell any shares of our common stock for a period of at least 180 days from the date of this prospectus, subject to certain exceptions. See "Underwriting." Following the expiration of the applicable lock-up period, all of these shares will be eligible for resale under Rule 144 of the Securities Act, subject to any remaining holding period requirements and, if applicable, volume limitations. The remaining shares of common stock outstanding prior to this offering are not subject to lock-up agreements and substantially all of such shares have been held by our non-affiliates for at least one year and therefor may be freely sold by such persons upon the completion of this offering. See "Shares Eligible for Future Sale" for a discussion of the shares of our common stock that may be sold into the public market in the future.
We may issue shares of our common stock or other securities from time to time as consideration for future acquisitions and investments and pursuant to compensation and incentive plans. If any such acquisition or investment is significant, the number of shares of our common stock, or the number or aggregate principal amount, as the case may be, of other securities that we may issue may in turn be substantial. We may also grant registration rights covering those shares of our common stock or other securities in connection with any such acquisitions and investments.
We cannot predict the size of future issuances of our common stock or the effect, if any, that future issuances and sales of our common stock will have on the market price of our common stock. Sales of substantial amounts of our common stock (including shares of our common stock issued in connection with an acquisition or under a compensation or incentive plan), or the perception that such
31
sales could occur, may adversely affect prevailing market prices for our common stock and could impair our ability to raise capital through future sales of our securities.
We may issue shares of preferred stock in the future, which could make it difficult for another company to acquire us or could otherwise materially adversely affect holders of our common stock, which could depress the price of our common stock.
Our certificate of formation authorizes us to issue up to 10,000,000 shares of one or more series of preferred stock. Our board of directors will have the authority to determine the preferences, limitations and relative rights of shares of preferred stock and to fix the number of shares constituting any series and the designation of such series, without any further vote or action by our shareholders. Our preferred stock could be issued with voting, liquidation, dividend and other rights superior to the rights of our common stock. The potential issuance of preferred stock may delay or prevent a change in control of us, discouraging bids for our common stock at a premium over the market price, and materially adversely affect the market price and the voting and other rights of the holders of our common stock.
The holders of our debt obligations and shares of our preferred stock will have priority over our common stock with respect to payment in the event of liquidation, dissolution or winding up and with respect to the payment of interest and preferred dividends.
As of June 30, 2014, we had outstanding $5.0 million in aggregate principal amount of subordinated promissory notes held by investors, and $3.1 million of junior subordinated debentures issued to a statutory trust that, in turn, issued $3.0 million of trust preferred securities. In the future we may incur additional indebtedness. Upon our liquidation, dissolution or winding up, holders of our common stock will not be entitled to receive any payment or other distribution of assets until after all of our obligations to our debt holders have been satisfied and holders of trust preferred securities have received any payment or distribution due to them. In addition, we are required to pay interest on our outstanding indebtedness before we pay any dividends on our common stock.
As of June 30, 2014, we had outstanding 8,000 shares of our Series C preferred stock issued to the U.S. Treasury in connection with our participation in the SBLF program. These shares have rights that are senior to our common stock. As a result, we must make dividend payments on the Series C preferred stock before any dividends can be paid on our common stock and, in the event of our bankruptcy, dissolution or liquidation, the holders of the Series C preferred stock must be satisfied in full before any distributions can be made to the holders of our common stock. Furthermore, our board of directors, in its sole discretion, has the authority to designate and issue one or more series of preferred stock from our authorized and unissued preferred stock, which may have preferences with respect to common stock in dissolution, dividends, liquidation or otherwise.
Because our decision to issue debt or equity securities or incur other borrowings in the future will depend on market conditions and other factors beyond our control, the amount, timing, nature or success of our future capital raising efforts is uncertain. Thus, common shareholders bear the risk that our future issuances of debt or equity securities or our incurrence of other borrowings will negatively affect the market price of our common stock.
We currently have no plans to pay dividends on our common stock, so you may not receive funds without selling your common stock.
We do not anticipate paying any dividends on our common stock in the foreseeable future. Our ability to pay dividends on our common stock is dependent on the Bank's ability to pay dividends to us, which is limited by applicable laws and banking regulations, and may in the future be restricted by the terms of any debt or preferred securities we may incur or issue. Payments of future dividends, if any,
32
will be at the discretion of our board of directors after taking into account various factors, including our business, operating results and financial condition, current and anticipated cash needs, plans for expansion and any legal or contractual limitations on our ability to pay dividends. Accordingly, shares of common stock should not be purchased by persons who need or desire dividend income from their investment.
We are an "emerging growth company," and we cannot be certain if the reduced disclosure requirements applicable to emerging growth companies will make our common stock less attractive to investors.
We are an "emerging growth company," as defined in the JOBS Act, and we may take advantage of certain exemptions from various reporting requirements that are applicable to other public companies that are not emerging growth companies. These exemptions allow us, among other things, to present only two years of audited financial statements and discuss our results of operations for only two years in related Management's Discussions and Analyses; not to provide an auditor attestation of our internal control over financial reporting; to choose not to comply with any new requirements adopted by the PCAOB requiring mandatory audit firm rotation or a supplement to the auditor's report providing additional information about the audit and our audited financial statements; to provide reduced disclosure regarding our executive compensation arrangements pursuant to the rules applicable to smaller reporting companies, which means we do not have to include a compensation discussion and analysis and certain other disclosure regarding our executive compensation; and not to seek a non-binding advisory vote on executive compensation or golden parachute arrangements. In addition, even if we comply with the greater disclosure obligations of public companies that are not emerging growth companies immediately after this offering, we may avail ourselves of these reduced requirements applicable to emerging growth companies from time to time in the future, so long as we are an emerging growth company. We will remain an emerging growth company for up to five years, though we may cease to be an emerging growth company earlier under certain circumstances, including if, before the end of such five years, we are deemed to be a large accelerated filer under the rules of the SEC (which depends on, among other things, having a market value of common stock held by non-affiliates in excess of $700.0 million). Investors and securities analysts may find it more difficult to evaluate our common stock because we may rely on one or more of these exemptions, and, as a result, investor confidence and the market price of our common stock may be materially and adversely affected.
We are dependent upon the Bank for cash flow, and the Bank's ability to make cash distributions is restricted which could impact our ability to satisfy our obligations.
Our primary asset is the Bank. As such, we depend upon the Bank for cash distributions through dividends on the Bank's stock to pay our operating expenses and satisfy our obligations, including debt obligations. There are numerous laws and banking regulations that limit the Bank's ability to pay dividends to us. If the Bank is unable to pay dividends to us, we will not be able to satisfy our obligations. Federal and state statutes and regulations restrict the Bank's ability to make cash distributions to us. These statutes and regulations require, among other things, that the Bank maintain certain levels of capital in order to pay a dividend. Further, federal and state banking authorities have the ability to restrict the Bank's payment of dividends through supervisory action. In addition, in connection with our participation in the SBLF program, we are subject to restrictions on the payment of dividends.
We have broad discretion in the use of the net proceeds from this offering, and our use of those proceeds may not yield a favorable return on your investment.
We expect to use the net proceeds of this offering to support our continued growth, including organic growth and potential future acquisitions, and for general corporate purposes. From time to
33
time, we evaluate and conduct due diligence with respect to potential acquisition candidates and may enter into letters of intent, although we do not have any current arrangements or understandings to make a material acquisition. There can be no assurance that we will enter into any definitive agreements in respect of any such transaction. Our management has broad discretion over how these proceeds are used and could spend the proceeds in ways with which you may not agree. In addition, we may not use the proceeds of this offering effectively or in a manner that increases our market value or enhances our profitability. We have not established a timetable for the effective deployment of the proceeds, and we cannot predict how long it will take to deploy the proceeds. Investing the offering proceeds in securities until we are able to deploy the proceeds will provide lower margins that we generally earn on loans, potentially adversely affecting shareholder returns, including earnings per share, return on assets and return on equity.
We have a significant investor whose individual interests may differ from yours.
Our largest shareholder is SunTx Veritex Holdings, L.P., or SunTx. SunTx currently owns 24.7% of our outstanding common stock, and is expected to own, following the completion of this offering, 17.4% of our outstanding common stock (or 16.6% if the underwriters exercise their option to purchase additional shares in full). We have granted SunTx certain rights, such as board representation rights, that may give SunTx greater influence over our company than you or other shareholders. As a result of its significant ownership, SunTx could have greater ability to influence matters such as the election of directors and other matters submitted to a vote of our shareholders, such as mergers, a sale of all or substantially all of our assets and other extraordinary corporate transactions. SunTx's interests could conflict with the interests of our other shareholders, including you, and any future transfer by SunTx of its shares of common stock to other investors who have different business objectives could adversely affect the market value of our common stock.
Our corporate organizational documents and provisions of federal and state law to which we are subject contain certain provisions that could have an anti-takeover effect and may delay, make more difficult or prevent an attempted acquisition that you may favor.
Certain provisions may have an anti-takeover effect and may delay, discourage or prevent an attempted acquisition or change of control. These provisions may include:
- •
- a provision that the vote of the holders of at least four-fifths of our shares entitled to vote at the meeting is
required to remove a director for cause; and
- •
- a provision that any special meeting of our shareholders may be called only by a majority of the board of directors, the Chairman, the President or a holder or group of holders of at least 10.0% of our shares entitled to vote at the meeting.
Our amended and restated certificate of formation does not provide for cumulative voting for directors and authorizes the board of directors to issue shares of its preferred stock without shareholder approval and upon such terms as the board of directors may determine. The issuance of our preferred stock, while providing desirable flexibility in connection with possible acquisitions, financings and other corporate purposes, could have the effect of making it more difficult for a third party to acquire, or of discouraging a third-party from acquiring, a controlling interest in us. In addition, certain provisions of Texas law, including a provision which restricts certain business combinations between a Texas corporation and certain affiliated shareholders, may delay, discourage or prevent an attempted acquisition or change in control.
Furthermore, banking laws impose notice, approval, and ongoing regulatory requirements on any shareholder or other party that seeks to acquire direct or indirect "control" of an FDIC-insured depository institution. These laws include the Bank Holding Company Act of 1956, or the BHC Act, and the Change in Bank Control Act. These laws could delay or prevent an acquisition.
34
Shareholders may be deemed to be acting in concert or otherwise in control of us, which could impose notice, approval and ongoing regulatory requirements and result in adverse regulatory consequences for such holders.
We are a bank holding company regulated by the Federal Reserve. Banking laws impose notice, approval, and ongoing regulatory requirements on any shareholder or other party that seeks to acquire direct or indirect "control" of an FDIC-insured depository institution or a company that controls an FDIC-insured depository institution, such as a bank holding company. These laws include the BHC Act and the Change in Bank Control Act. The determination whether an investor "controls" a depository institution or holding company is based on all of the facts and circumstances surrounding the investment.
As a general matter, a party is deemed to control a depository institution or other company if the party (1) owns or controls 25.0% or more of any class of voting stock of the bank or other company, (2) controls the election of a majority of the directors of the bank or other company, or (3) has the power to exercise a controlling influence over the management or policies of the bank or other company. In addition, subject to rebuttal, a party may be presumed to control a depository institution or other company if the investor owns or controls 10.0% or more of any class of voting stock. Ownership by affiliated parties, or parties acting in concert, is typically aggregated for these purposes. "Acting in concert" generally means knowing participation in a joint activity or parallel action towards the common goal of acquiring control of a bank or a parent company, whether or not pursuant to an express agreement. The manner in which this definition is applied in individual circumstances can vary and cannot always be predicted with certainty.
Any shareholder that is deemed to "control" us for regulatory purposes would become subject to notice, approval, and ongoing regulatory requirements and may be subject to adverse regulatory consequences. Potential investors are advised to consult with their legal counsel regarding the applicable regulations and requirements.
An investment in our common stock is not an insured deposit and is not guaranteed by the FDIC, so you could lose some or all of your investment.
An investment in our common stock is not a bank deposit and, therefore, is not insured against loss or guaranteed by the FDIC, any other deposit insurance fund or by any other public or private entity. An investment in our common stock is inherently risky for the reasons described herein. As a result, if you acquire our common stock, you could lose some or all of your investment.
35
We intend to initially retain the net proceeds from this offering at our holding company and to use such proceeds to support our continued growth, including organic growth and potential future acquisitions, and for general corporate purposes. From time to time, we evaluate and conduct due diligence with respect to potential acquisition candidates and may enter into letters of intent, although we do not have any current plans, arrangements or understandings to make a material acquisition. There can be no assurance that we will enter into any definitive agreements in respect of any such transaction. Our management will retain broad discretion to allocate the net proceeds of this offering. Although we intend to initially retain the net proceeds of this offering at our holding company, we may elect to contribute a portion of the net proceeds to the Bank as regulatory capital. The precise amounts and timing of our use of the proceeds will depend upon market conditions and other factors.
We estimate that the net proceeds from the sale of the shares of our common stock in this offering will be approximately $30.8 million, after deducting the estimated underwriting discounts and commissions and estimated offering expenses payable by us, based on an assumed initial public offering price of $13.00 per share, which is the midpoint of the estimated initial public offering price range set forth on the cover page of this prospectus. If the underwriters exercise their option to purchase additional shares in full, the net proceeds to us will be approximately $35.7 million.
A $1.00 increase (or decrease) in the assumed initial public offering price of $13.00 per share, which is the midpoint of the estimated initial public offering price range set forth on the cover page of this prospectus, would increase (or decrease) the net proceeds from the sale of the shares of common stock by us by approximately $2.5 million, assuming that the number of shares offered by us, as set forth on the cover page of this prospectus, remains the same and after deducting estimated underwriting discounts and commissions and estimated offering expenses payable by us.
A 100,000 share increase (or decrease) in the number of shares of common stock offered by us, would increase (or decrease) the net proceeds from the sale of the shares of common stock by us by approximately $1.2 million, assuming an initial public offering price of $13.00 per share, which is the midpoint of the estimated initial public offering price range set forth on the cover page of this prospectus, and after deducting estimated underwriting discounts and commissions and estimated offering expenses payable by us.
36
The following table sets forth our capitalization as of June 30, 2014:
- •
- on an actual basis; and
- •
- on an as adjusted basis to give effect to the sale of 2,700,000 shares of common stock by us in this offering (assuming the underwriters do not exercise their purchase option), at an assumed initial public offering price of $13.00 per share, the midpoint of the estimated initial public offering price range set forth on the cover page of this prospectus, after deducting the underwriting discounts and commissions and estimated offering expenses payable by us.
This table should be read in conjunction with "Use of Proceeds," "Selected Consolidated Financial Data," "Management's Discussion and Analysis of Financial Condition and Results of Operations" and our consolidated financial statements and the related notes included elsewhere in this prospectus.
| |
As of June 30, 2014 | ||||||
|---|---|---|---|---|---|---|---|
| |
Actual | As Adjusted | |||||
| |
(Dollars in thousands, except per share data) |
||||||
Other borrowings: |
|||||||
Junior subordinated debentures due 2036 |
$ | 3,093 | $ | 3,093 | |||
Subordinated notes due 2023 |
4,979 | 4,979 | |||||
Stockholders' equity: |
|||||||
Preferred stock, $0.01 par value; 500,000 shares authorized; 8,000 shares Series C, issued and outstanding with a $1,000 liquidation value(1) |
$ | 8,000 | $ | 8,000 | |||
Common stock, par value $0.01 per share; 10,000,000 shares authorized; issued and outstanding—6,358,832 shares actual, shares as adjusted (excluding 10,000 shares held in treasury)(1) |
64 | 91 | |||||
Additional paid-in capital |
61,419 | 92,178 | |||||
Retained earnings |
5,038 | 5,038 | |||||
Accumulated other comprehensive income (loss) |
194 | 194 | |||||
Unearned ESOP shares |
(401 | ) | (401 | ) | |||
Treasury shares, 10,000 at $7.00 per share |
(70 | ) | (70 | ) | |||
| | | | | | | | |
Total stockholders' equity |
$ | 74,244 | $ | 105,030 | |||
| | | | | | | | |
Total capitalization |
$ | 82,316 | $ | 113,102 | |||
| | | | | | | | |
| | | | | | | | |
Per Share Data: |
|||||||
Book value per common share(2) |
$ | 10.42 | $ | 10.71 | |||
Tangible book value per common share(3) |
7.18 | 8.44 | |||||
Capital Ratios: |
|||||||
Tier 1 capital to average assets |
8.66 | % | 12.75 | % | |||
Tier 1 capital to risk-weighted assets |
10.44 | 15.21 | |||||
Total capital to risk-weighted assets |
12.35 | 17.03 | |||||
Tangible common equity to tangible assets(4) |
6.62 | 10.61 | |||||
- (1)
- Our certificate of formation authorizes us to issue up to 10,000,000 shares of preferred stock and up to 75,000,000 shares of common stock.
37
- (2)
- We
calculate book value per common share as stockholders' equity less preferred stock at the end of the relevant period divided by the outstanding number of
shares of our common stock at the end of the relevant period.
- (3)
- Tangible
book value per common share is a non-GAAP financial measure. We calculate tangible book value per common share as total stockholders' equity less
preferred stock, goodwill, core deposit intangibles and other intangible assets, net of accumulated amortization at the end of the relevant period, divided by the outstanding number of shares of our
common stock at the end of the relevant period. We believe that the most directly comparable GAAP financial measure is total stockholders' equity per common share. For a reconciliation of the non-GAAP
financial measure to its most directly comparable GAAP financial measure, see "Management's Discussion and Analysis of Financial Condition and Results of Operations—Non-GAAP Financial
Measures."
- (4)
- Tangible common equity to tangible assets is a non-GAAP financial measure. We calculate tangible common equity as total stockholders' equity less preferred stock, goodwill, core deposit intangibles and other intangible assets, net of accumulated amortization, and we calculate tangible assets as total assets less goodwill and core deposit intangibles and other intangible assets, net of accumulated amortization. We believe that the most directly comparable GAAP financial measure is total stockholders' equity to total assets. For a reconciliation of the non-GAAP financial measure to its most directly comparable GAAP financial measure, see "Management's Discussion and Analysis of Financial Condition and Results of Operations—Non-GAAP Financial Measures."
A $1.00 increase (or decrease) in the assumed initial public offering price of $13.00 per share, which is the midpoint of the estimated initial public offering price range set forth on the cover page of this prospectus, would increase (or decrease) the net proceeds from the sale of the shares of common stock by us by approximately $2.5 million, assuming that the number of shares offered by us, as set forth on the cover page of this prospectus, remains the same and after deducting estimated underwriting discounts and commissions and estimated offering expenses payable by us.
A 100,000 share increase (or decrease) in the number of shares of common stock offered by us, would increase (or decrease) the net proceeds from the sale of the shares of common stock by us by approximately $1.2 million, assuming an initial public offering price of $13.00 per share, which is the midpoint of the estimated initial public offering price range set forth on the cover page of this prospectus, and after deducting estimated underwriting discounts and commissions and estimated offering expenses payable by us.
The "as adjusted" amounts discussed above are illustrative only and subject to the actual initial public offering price and the actual number of shares sold by us in this offering.
38
If you invest in our common stock, your ownership interest will be diluted to the extent that the initial public offering price per share of our common stock in this offering exceeds the net tangible book value per share of common stock upon completion of this offering.
Net tangible book value per common share represents the amount of our total tangible assets less total liabilities, divided by the number of shares of common stock outstanding. Our net tangible book value as of June 30, 2014 was $45.7 million, or $7.18 per share of common stock.
Investors participating in this offering will incur immediate, substantial dilution. After giving effect to the sale of 2,700,000 shares of our common stock by us at the initial public offering price of $13.00 per share, the midpoint of the estimated initial public offering price range set forth on the cover page of this prospectus, and after deducting the estimated underwriting discounts and commissions and estimated offering expenses payable by us, our net tangible book value as of June 30, 2014 would have been approximately $76.5 million, or approximately $8.44 per share of common stock. This represents an immediate increase in net tangible book value of $1.26 per share to existing common shareholders, and an immediate dilution of $4.56 per share to investors participating in this offering. If the initial public offering price is higher or lower, the dilution to new shareholders will be greater or less, respectively.
The following table illustrates the calculation of the amount of dilution per share that a purchaser of our common stock in this offering will incur given the assumptions above:
Assumed initial public offering price per share of common stock |
$ | 13.00 | |||||
Net tangible book value per common share as of June 30, 2014 |
$ | 7.18 | |||||
Increase in tangible book value per common share attributable to this offering |
1.26 | ||||||
| | | | | | | | |
As adjusted net tangible book value per common share after this offering |
8.44 | ||||||
| | | | | | | | |
Dilution in net tangible book value per common share to new investors(1) |
$ | 4.56 | |||||
| | | | | | | | |
| | | | | | | | |
- (1)
- Dilution is determined by subtracting net tangible book value per share after giving effect to this offering from the initial public offering price paid by a new investor.
A $1.00 increase (or decrease) in the assumed initial public offering price of $13.00 per share, which is the midpoint of the estimated initial public offering price range set forth on the cover page of this prospectus, would increase (or decrease) the as adjusted net tangible book value per share after this offering by approximately $0.28, and dilution in net tangible book value per share to new investors by approximately $0.72, assuming that the number of shares offered by us, as set forth on the cover page of this prospectus, remains the same and after deducting estimated underwriting discounts and commissions and estimated offering expenses payable by us. If the underwriters exercise in full their option to purchase additional shares of our common stock in this offering, the as adjusted net tangible book value after this offering would be $8.60 per share, the increase in net tangible book value to existing shareholders would be $1.42 per share and the dilution to new investors would be $4.40 per share, in each case assuming an initial public offering price of $13.00 per share, which is the midpoint of the estimated initial public offering price range set forth on the cover page of this prospectus.
The following table summarizes, as of June 30, 2014, the differences between our existing shareholders and new investors with respect to the number of shares of our common stock purchased from us, the total consideration paid to us and the average price per share paid by existing shareholders and investors purchasing common stock in the offering. The calculations with respect to
39
shares purchased by new investors in this offering reflect the initial public offering price of $13.00 per share, which is the midpoint of the estimated initial public offering price range set forth on the cover page of this prospectus, before deducting estimated underwriting discounts and commissions and estimated offering expenses payable by us:
| |
Shares Purchased | Total Consideration | |
|||||||||||||
|---|---|---|---|---|---|---|---|---|---|---|---|---|---|---|---|---|
| |
Average Price Per Share |
|||||||||||||||
| |
Number | Percentage | Amount | Percentage | ||||||||||||
Existing shareholders |
6,358,832 | 70.2 | % | $ | 63,544,177 | 64.4 | % | $ | 10.07 | |||||||
New investors |
2,700,000 | 29.8 | 35,100,000 | 35.6 | 13.00 | |||||||||||
| | | | | | | | | | | | | | | | | |
Total |
9,058,832 | 100 | % | $ | 98,644,177 | 100 | % | $ | 10.89 | |||||||
| | | | | | | | | | | | | | | | | |
| | | | | | | | | | | | | | | | | |
The discussion and tables above assume no exercise of the underwriters' option to purchase additional shares, and no exercise of any outstanding options. In addition, if the underwriters' option to purchase additional shares is exercised in full, the number of shares of common stock held by existing shareholders will be further reduced to 67.2% of the total number of shares of common stock to be outstanding upon the completion of this offering, and the number of shares of common stock held by investors participating in this offering will be further increased to 3,105,000 shares or 32.8% of the total number of shares of common stock to be outstanding upon the completion of this offering.
The discussion and tables above exclude 855,000 shares of our common stock issuable upon the exercise of outstanding options and warrants and 63,250 shares of common stock underlying outstanding restricted stock units that are not fully vested. As of June 30, 2014, we had outstanding options to purchase 830,000 shares of common stock at a weighted average exercise price of $10.15 per share, of which 357,500 shares were issuable upon the exercise of time-based options (181,200 shares of which were exercisable) and 472,500 shares were issuable upon the exercise of performance-based options (none of which were exercisable). We intend to cancel all of our performance-based options prior to the completion of this offering and to grant additional restricted stock units as described in "Executive Compensation—2014 Omnibus Incentive Plan." As of June 30, 2014, we had outstanding warrants to purchase 25,000 shares of common stock at an exercise price of $11.00 per share. To the extent any of these options or warrants are exercised or shares are issued upon vesting of restricted stock units, investors purchasing common stock in this offering will experience further dilution.
40
We have not declared or paid any dividends on our common stock. We currently intend to retain all of our future earnings, if any, for use in our business and do not anticipate paying cash dividends on our common stock in the foreseeable future. Payments of future dividends, if any, will be at the discretion of our board of directors after taking into account various factors, including our business, operating results and financial condition, current and anticipated cash needs, plans for expansion and any legal or contractual limitations on our ability to pay dividends.
As a bank holding company, our ability to pay dividends is affected by the policies and enforcement powers of the Federal Reserve. In addition, because we are a holding company, we are dependent upon the payment of dividends by the Bank to us as our principal source of funds to pay dividends in the future, if any, and to make other payments. The Bank is also subject to various legal, regulatory and other restrictions on its ability to pay dividends and make other distributions and payments to us. See "Regulation and Supervision—Regulatory Limits on Dividends and Distributions." In addition, in the future we may enter into borrowing or other contractual arrangements that restrict our ability to pay dividends.
As a result of our participation in the SBLF program, we are obligated to pay quarterly non-cumulative dividends on our Series C preferred stock held by the U.S. Treasury. Payments are due each January 1, April 1, July 1 and October 1. The dividend rate on our Series C preferred stock is 1.0% per annum as of June 30, 2014 and will increase to 9.0% beginning February 2016. Failure to pay quarterly dividends on the Series C preferred stock may limit our ability to pay dividends on our common stock in the future.
41
Our Company
We are a bank holding company headquartered in Dallas, Texas. Through our wholly-owned subsidiary, Veritex Community Bank, a Texas state chartered bank, we provide relationship-driven commercial banking products and services tailored to meet the needs of small to medium-sized businesses and professionals. Since our inception, we have targeted customers and focused our acquisitions primarily in the Dallas metropolitan area, which we consider to be Dallas and the adjacent communities in North Dallas. As we continue to grow, we expect to expand our primary market to include the broader Dallas-Fort Worth metropolitan area, which would include Fort Worth and Arlington, as well as the communities adjacent to those cities. We currently operate eight branches and one mortgage office, all of which are located in the Dallas metropolitan area. We have experienced significant organic growth since commencing banking operations in 2010 and have successfully acquired and integrated three banks. As of June 30, 2014, we had total assets of $710.4 million, total loans of $541.0 million, total deposits of $611.2 million and total stockholders' equity of $74.2 million.
Our primary customers are small and medium-sized businesses, generally with annual revenues of under $30 million, and professionals. We believe that these businesses and professionals highly value the local decision-making and relationship-driven, quality service we provide and our deep, long-term understanding of the Dallas community and Texas banking. As a result of consolidation, we believe that there are few locally-based banks that are dedicated to providing this level of service to small and medium-sized businesses. Our management team's long-standing presence and experience in the Dallas metropolitan area gives us unique insight into our local market and the needs of our customers. This enables us to respond quickly to customers, provide high quality personal service and develop comprehensive, long-term banking relationships by providing products and services tailored to meet the individual needs of our customers. This focus and approach enhances our ability to continue to grow organically, successfully recruit talented bankers and strategically source potential acquisitions in our target market.
Our History and Growth
Our management team is led by our Chairman and Chief Executive Officer, C. Malcolm Holland, III, who has overseen and managed our organic growth and acquisition activity since we commenced banking operations in 2010. We have completed three whole-bank acquisitions that have increased our market presence within the Dallas metropolitan area. We have also grown organically by opening two branches and a mortgage office in the Dallas metropolitan area. The following table summarizes our three acquisitions:
Bank Acquired
|
Date Completed | Acquired Assets |
Acquired Loans |
Number of Branches |
Dallas Area Locations |
||||||||
|---|---|---|---|---|---|---|---|---|---|---|---|---|---|
| |
(Dollars in millions) |
||||||||||||
Professional Bank, N.A. through Professional Capital, Inc. |
September 2010 | $ | 181.8 | $ | 91.7 | 3 | Park Cities, Lakewood and Garland | ||||||
Fidelity Bank through Fidelity Resources Company |
March 2011 | 166.3 | 108.1 | 3 | Preston Center, SMU and Plano | ||||||||
Bank of Las Colinas |
October 2011 | 53.8 | 40.4 | 1 | Las Colinas | ||||||||
We have established a record of steady growth and profitable operations since commencing banking operations in 2010, as demonstrated below (total loans and deposits as of period-end and three year compound annual growth rate, or CAGR, through December 31, 2013), while preserving our strong credit culture. Our initial growth in 2010 and 2011 was primarily the result of our acquisitions. During 2012, 2013 and the first six months of 2014, we grew our total loans and deposits organically by
42
increasing our commercial lending relationships and more deeply penetrating the Dallas metropolitan area.
Our Strategy
Our business strategy is comprised of the following components:
- •
- Organic Growth in Thriving Dallas Metropolitan
Area. Our organic growth strategy has focused on more deeply penetrating the Dallas metropolitan area through our community-focused,
relationship-driven approach to banking. We believe that our current market area provides abundant opportunities to continue to grow our customer base, increase loans and deposits and expand our
overall market share. Our team of seasoned bankers has been an important driver of our organic growth by further developing banking relationships with current and potential customers, many of which
span more than 20 years. Our market presidents and relationship managers are incentivized to increase the size of their loan and deposit portfolios and generate fee income while maintaining
strong credit quality. We intend to add to our team of experienced bankers in order to grow our current footprint and expand further into markets throughout the Dallas-Fort Worth metropolitan area.
Preserving sound credit underwriting standards as we grow our loan portfolio will continue to be the foundation of our organic growth strategy.
- •
- Acquisitions. We intend to continue to grow through acquisitions, and we believe having publicly traded common stock will improve our ability to compete for acquisitions. Many small to medium-sized banking organizations in the Dallas-Fort Worth metropolitan area face significant scale and operational challenges, regulatory pressure, management succession issues and
43
- •
- Improve Operational Efficiency and Increase
Profitability. We are committed to maintaining and enhancing profitability. Our net income increased from $109,000 in 2011 to
$3.4 million in 2013, and our efficiency ratio improved from 92.2% in 2011 to 69.8% in 2013. For the six months ended June 30, 2014, our net income was $2.2 million compared to
$1.5 million for the six months ended June 30, 2013. We employ a systematic and calculated approach to improving our operational efficiency, which in turn we believe increases our
profitability. We have upgraded our operating capabilities and created a platform for continued efficiencies in the areas of technology, data processing, regulatory compliance and human resources. We
believe that our scalable infrastructure and efficient operating platform will allow us to achieve continued growth without incurring significant incremental noninterest expenses and will enhance our
returns.
- •
- Continue to Build Our Community Ties. Our officers and employees are heavily involved in civic and community organizations, and we sponsor numerous activities that benefit our community. Our business development strategy, which focuses on building market share through personal relationships, as opposed to formal advertising, is consistent with our customer-centric culture and is a cost-effective approach to developing new relationships and enhancing existing ones.
shareholder liquidity needs. There were 59 banks headquartered in this area with less than $500 million of assets, which collectively held approximately $11.0 billion in assets, as of June 30, 2014, according to the FDIC. As a result, we believe that there will continue to be attractive acquisition opportunities in the Dallas-Fort Worth metropolitan area as well as in other attractive markets in Texas. Although we have no current plans, arrangements or understandings to make any material acquisitions, this market dynamic will afford us opportunities to identify and execute acquisitions designed to strengthen our franchise and increase shareholder value.
Our Competitive Strengths
We believe our competitive strengths include the following:
- •
- Experienced Senior Management
Team. Our Chairman and Chief Executive Officer, C. Malcolm Holland, III, and our Vice Chairman, William C. Murphy, have more than
75 years of combined experience acquiring, growing and selling banks in the Dallas metropolitan area. Messrs. Holland and Murphy have worked together in three different banking
institutions during seven of the past 17 years.
- •
- Mr. Holland began his banking career in 1982, and in 1986 was an organizer and leader of EastPark National Bank,
Dallas, until it was acquired by Fidelity Bank of Dallas in 1995, which, at that time, was led by Mr. Murphy. Mr. Holland then assumed the primary lending and business development role
at Fidelity Bank until it was acquired by Compass Bank in 1998. In 2000, Mr. Holland became President of First Mercantile Bank, where, through a combination of an acquisition and organic
growth, the bank grew from $125.0 million to $325.0 million in total assets over a two-year period. When Colonial Bank acquired First Mercantile Bank in 2002, Mr. Holland assumed
the role of Chief Executive Officer for the Texas Region, overseeing the organic growth and management of the region from $625.0 million in assets in 2002 to over $1.6 billion in assets
in 2009.
- •
- Mr. Murphy began his banking career in 1971 and has been Chairman or Chief Executive Officer of several community banks in the Dallas metropolitan area, including Parkway National Bank, Mercantile Bank & Trust and Fidelity Bank of Dallas, and was instrumental in the growth and leadership of these institutions. Mr. Murphy has led financial institutions in over 25 transactions involving the acquisition, formation or sale of banks, bank holding companies or individual branches.
44
- •
- Strong Brand and Reputation in Our
Market. The name "Veritex" is derived from a combination of the Latin root word "veritas," meaning truth, and "Texas," and we strive to
provide truth in Texas banking every day. We have developed a reputation as an active lender in our community. The members of our management team have spent the majority of their careers as bankers in
the Dallas metropolitan area. We believe that our strong brand and market reputation have become and will remain a competitive advantage within our market. By capitalizing on the business and personal
relationships of our senior management team, market presidents and relationship managers, we believe that we are positioned for continued growth and increased profitability.
- •
- Loyal and Growing Core Deposit
Franchise. Developing significant deposit relationships with our borrowers is a key component of our growth strategy. Our core deposits,
which include all demand deposits, money market and savings accounts and time deposits under $250,000, but exclude all brokered deposits, represented approximately 90.7% of our deposits as of
June 30, 2014, 93.5% of our deposits as of December 31, 2013 and 95.0% of our deposits as of December 31, 2012. Our customers maintain significant noninterest-bearing deposits
with us, which contributes to our lower cost of funds. Noninterest-bearing deposits represented 38.7%, 38.2% and 38.1% of our total deposits as of June 30, 2014, December 31, 2013 and
December 31, 2012, respectively. Our cost of funds was 48 basis points for the first six months of 2014, 44 basis points for 2013, and 56 basis points for 2012. Our strong,
low-cost deposit base serves as a major driver of our operating results, as we utilize our core deposit base primarily to fund our loan growth. Our total deposits grew by 28.1% in 2013 and 22.8% in
2012, while our noninterest-bearing deposits grew by 28.4% in 2013 and 51.3% in 2012. Total deposits grew by 13.0% and non-interest bearing deposits grew by 15.7% during the first six months of 2014
on an annualized basis. We believe that our ability to grow strong core deposits is a unique and valuable competitive advantage.
- •
- Proven Ability and Demonstrated Success in Acquisitions and
Integration. We have completed three whole-bank acquisitions since the beginning of 2010 and only two other Texas-based banking
institutions have completed more acquisitions in Texas during that period, according to SNL Financial. As a result, we believe we have developed an experienced and disciplined acquisition and
integration approach capable of identifying candidates, conducting thorough due diligence, determining financial attractiveness, and integrating the acquired institution. Utilizing the prior
experience of our management team at larger financial institutions, we believe that we have built a corporate infrastructure capable of supporting additional acquisitions and continued organic growth.
We believe our acquisition experience and our reputation as a successful acquirer position us to capitalize on additional opportunities in the future.
- •
- Strong Credit Culture. Our disciplined implementation of comprehensive policies and procedures for credit underwriting and administration has enabled us to maintain strong asset quality during our growth. We manage the risk in the portfolio with prudent underwriting and proactive credit administration. Mr. Murphy, our Vice Chairman, who leads the Bank directors' loan committee,
In addition to Messrs. Holland and Murphy, we believe we have significant depth in management throughout each function of our organization, including lending, credit administration, treasury services, finance, operations, information technology, regulatory compliance and risk management. Our bankers also have significant experience, with eight of our market presidents and relationship managers having more than 25 years of banking experience in the Dallas metropolitan area. Our team has a demonstrated track record of achieving profitable growth, successfully executing acquisitions, maintaining a strong credit culture, and implementing a community-focused, relationship-driven approach to banking. The depth of our team's market knowledge and long-term relationships in the Dallas metropolitan area are the keys to our strong successful referral business.
45
- •
- Scalable Platform. Throughout our operating history, we have built and maintained a strong and scalable banking platform to support our dynamic growth. Utilizing the significant prior experience of our management team and employees, we believe that we have built a scalable corporate infrastructure, including technology and banking processes, capable of supporting future organic growth and acquisitions while improving our operational efficiencies. We believe that our strong capital and asset quality position will allow us to grow and our scalable operating platform will allow us to manage that growth effectively, resulting in greater efficiency and improved profitability. This increased efficiency has been demonstrated by the improvement in our efficiency ratio from 92.2% in 2011 to 69.8% in 2013.
has more than 40 years of banking experience. Our nonperforming assets to total assets ratio was 0.42% as of June 30, 2014, 0.44% as of December 31, 2013 and 0.71% as of December 31, 2012, while our net charge-offs to average loans outstanding was 0.04% during the first six months of 2014, 0.02% during 2013 and 0.21% during 2012. As much of the growth in our loan portfolio is attributed to new loans with which we have limited experience and payment history, a portion of our loan portfolio is considered to be relatively unseasoned.
Our Banking Services
We are focused on delivering a wide variety of relationship-driven commercial banking products and services tailored to meet the needs of small to medium-sized businesses and professionals in the Dallas metropolitan area. A general discussion of the range of commercial banking products and other services we offer follows.
Lending Activities
We offer a variety of loans, including commercial lines of credit, working capital loans, commercial real estate-backed loans (including loans secured by owner occupied commercial properties), term loans, equipment financing, acquisition, expansion and development loans, borrowing base loans, real estate construction loans, homebuilder loans, letters of credit and other loan products to small and medium-sized businesses, real estate developers, mortgage lenders, manufacturing and industrial companies and other businesses. We also offer various consumer loans to individuals and professionals including residential real estate loans, home equity loans, installment loans, unsecured and secured personal lines of credit, and standby letters of credit. Lending activities originate from the efforts of our bankers, with an emphasis on lending to individuals, professionals, small to medium-sized businesses and commercial companies located in the Dallas metropolitan area. Although all lending involves a degree of risk, we believe that commercial business loans and commercial real estate loans present greater risks than other types of loans in our portfolio.
46
As of June 30, 2014, we had total loans of $541.0 million, representing 76.2% of our total assets. Our loan portfolio consisted of the following loan categories as of June 30, 2014:
| |
Amount of Loans | Percentage | |||||
|---|---|---|---|---|---|---|---|
| |
(Dollars in thousands) (Unaudited) |
||||||
Real estate: |
|||||||
Construction and land |
$ | 56,818 | 10.5 | % | |||
Farmland |
11,982 | 2.2 | |||||
1 - 4 family residential |
98,030 | 18.1 | |||||
Multi-family residential |
14,866 | 2.7 | |||||
Nonfarm nonresidential |
180,921 | 33.5 | |||||
| | | | | | | | |
Total real estate loans |
362,617 | 67.0 | |||||
Commercial |
174,094 | 32.2 | |||||
Consumer |
4,279 | 0.8 | |||||
| | | | | | | | |
Total loans |
$ | 540,990 | 100.00 | % | |||
| | | | | | | | |
| | | | | | | | |
Loan Types. A description of the types of loans we offer to our customers follows below.
Real Estate Loans. A significant portion of our loan portfolio consists of various types of real estate loans, including, commercial, construction, farmland, multi-family residential and owner occupied residential loans. Our real estate loans can be broken out into the following categories:
- •
- Nonfarm Nonresidential Real Estate Loans. We make nonfarm nonresidential real estate, or commercial real estate loans, including, commercial mortgage loans collateralized by real estate, which may be owner occupied or non-owner occupied real estate. Commercial real estate loans are often larger and involve greater risks than other types of lending. Due to the larger average size of these loans, we face the risk that losses incurred on a small number of commercial real estate loans could have a material adverse impact on our financial condition and results of operations. In addition, commercial real estate loans have the risk that repayment is subject to the ongoing business operations of the borrower and/or sufficient income from the properties securing the loans to cover operating expenses and debt service. Accordingly, repayment of these loans may be subject to adverse conditions in the real estate market or the economy to a greater extent than other types of loans.
We require our commercial real estate loans to be secured by well-managed property with adequate margins and generally obtain a guarantee from responsible parties. Our commercial mortgage loans generally are collateralized by first liens on real estate, have variable or fixed interest rates and amortize over a 10-to-25 year period with terms of 3-to-5 years depending on the type of property and scheduled rate adjustments.
Payments on loans secured by such properties are often dependent on the successful operation (in the case of owner occupied real estate) or management (in the case of non-owner occupied real estate) of the properties. Accordingly, repayment of these loans may be subject to adverse conditions in the real estate market or the economy to a greater extent than other types of loans. In underwriting commercial real estate loans, we seek to minimize these risks in a variety of ways, including giving careful consideration to the property's age, condition, operating history, future operating projections, current and projected market rental rates, vacancy rates, location and physical condition. The underwriting analysis also may include credit verification, reviews of appraisals, environmental hazards or reports, the borrower's liquidity and leverage, management experience of the owners or principals, economic condition and industry trends.
47
- •
- 1-4 Family Residential Rea1 Estate Loans. We make residential real estate loans collateralized by owner occupied properties and land purchased for new home purchases, refinanced homes, residential development located in our market areas. We offer a variety of loan products including loans to residents in our community for the purchase of primary and secondary residences, homebuilder financing, residential investment/rehabilitation loans and acquisition and development financing, improvement with amortization periods up to 30 years. Loans collateralized by 1-to-4 family residential real estate generally are originated in amounts of no more than 80% of appraised value. Home equity loans and lines of credit are generally limited to a combined loan-to-value ratio of 70%, including the subordinate lien. We retain a valid lien on real estate, obtain a title insurance policy that insures that the property is free from encumbrances and require hazard insurance.
- •
- Construction and Land
Loans. We make loans to finance the construction of residential and nonresidential properties. Construction loans
generally are collateralized by first liens on real estate and have floating interest rates. We conduct periodic inspections, either directly or through an agent, prior to approval of periodic draws
on these loans. Underwriting guidelines similar to those described above also are used in our construction lending activities. Construction loans generally involve additional risks attributable to the
fact that loan funds are advanced upon the security of a project under construction, and the project is of uncertain value prior to its completion. Because of uncertainties inherent in estimating
construction costs, the market value of the completed project and the effects of governmental regulation on real property, it can be difficult to accurately evaluate the total funds required to
complete a project and the related loan-to-value ratio. As a result of these uncertainties, construction lending often involves the disbursement of substantial funds with repayment dependent, in part,
on the success of the ultimate project rather than the ability of a borrower or guarantor to repay the loan. If we are forced to foreclose on a project prior to completion, there is no assurance that
we will be able to recover the entire unpaid portion of the loan. In addition, we may be required to fund additional amounts to complete a project and it may be necessary to hold the property for an
indeterminate period of time subject to the regulatory limitations imposed by local, state or federal laws.
- •
- Multi-family Residential. We make loans for the acquisition and redevelopment or improvement of multi-family residential properties for terms ranging from two to five years depending on the life of the property and the type of interest rate. These loans generally are adjustable rate loans with interest rates tied to a variety of independent indexes; although in some cases these loans have fixed interest rates for periods ranging from three to five years and adjust thereafter based on an applicable index. The loans are underwritten based on a variety of underwriting criteria, including an evaluation of the character and creditworthiness of the borrower and guarantors,
Our 1-4 family residential real estate loans are secured by a first lien in the real property, the value of which may fluctuate over a short period of time as market conditions in our lending area change. Low loan to value ratios, high credit scores and the borrower's liquidity help to mitigate the credit risk associated with our portfolio 1-4 family residential loans.
We offer and retain in our loan portfolio first lien residential mortgage loans originated for our individual customers that are generally have a fixed rate for an initial period of three to five years and then adjust annually thereafter. Additionally we originate long-term fixed rate single-family residential mortgage loans for sale into the secondary market, which are underwritten by third party correspondent lenders/purchasers. For the six months ended June 30, 2014, we originated $18.8 million in 1-4 family residential mortgage loans, all of which were sold into the secondary market. For the years ended December 31, 2013 and 2012, we originated $35.8 million and $16.6 million in 1-4 family residential mortgage loans, respectively, and sold $37.2 million and $14.0 million, respectively, into the secondary market.
48
- •
- Farmland Loans. We have made loans for the purchase of farmland or loans for farm equipment which are secured by farmland. Loan-to-value ratios on loans secured by farmland generally do not exceed 80.0% and have amortization periods limited to 15 years. Loans originated for the purchase of farmland are generally underwritten based on the down payment and borrower/guarantor support and not on the success of an agricultural operation. If were to enter into this line of business, then we would adopt specific underwriting standards for agricultural-related loans. We realize that agricultural loans carry significant credit risks as they involve larger balances concentrated with single borrowers or groups of related borrowers. In addition, repayment of such loans depends on the successful operation or management of the farm property securing the loan or for which an operating loan is utilized. Farming operations may be affected by adverse weather conditions such as drought, hail or floods that can severely limit crop yields.
loan-to-value and debt service coverage ratios, borrower liquidity and credit history. In addition, we perform stress testing for changes in interest rates, capitalization rates and other factors and review general economic trends such as lease rates, values and absorption rates. We typically require personal guarantees from the owners of the entities to which we make such loans.
Commercial Loans. We make general commercial loans, including commercial lines of credit, working capital loans, term loans, equipment financing, asset acquisition, expansion and development loans, borrowing base loans, letters of credit and other loan products, primarily in our target markets that are underwritten on the basis of the borrower's ability to service the debt from income. Generally, we take as collateral, a lien on general business assets including, among other things, available real estate, accounts receivable, promissory notes, inventory and equipment and generally obtain a personal guaranty of the borrower or principal. A significant portion of our commercial loans are secured by promissory notes that evidence loans made by us to borrowers that in turn make loans to others that are secured by real estate. Our commercial loans generally have variable interest rates and terms that typically range from one to five years depending on factors such as the type and size of the loan, the financial strength of the borrower/guarantor and the age, type and value of the collateral. Fixed rate commercial loan maturities are generally short-term, with three to five year maturities, or include periodic interest rate resets.
In general, commercial loans may involve increased credit risk and, therefore, typically yield a higher return. The increased risk in commercial loans derives from the expectation that such loans generally are serviced principally from the operations of the business, and those operations may not be successful. Any interruption or discontinuance of operating cash flows from the business, which may be influenced by events not under the control of the borrower such as economic events and changes in governmental regulations, could materially affect the ability of the borrower to repay the loan. In addition, the collateral securing commercial loans generally includes moveable property such as equipment and inventory, which may decline in value more rapidly than we anticipated, exposing us to increased credit risk. As a result of these additional complexities, variables and risks, commercial loans require extensive underwriting and servicing.
49
Consumer Loans. We also make a variety of loans to individuals for personal and household purposes, including secured and unsecured term loans and home improvement loans. Consumer loans are underwritten based on the individual borrower's income, current debt level, past credit history and the value of any available collateral. The terms of consumer loans vary considerably based upon the loan type, nature of collateral and size of the loan. Consumer loans entail greater risk than residential real estate loans because they may be unsecured, or if secured, the value of the collateral, such as an automobile or boat, may be more difficult to assess and more likely to decrease in value than real estate. In such cases, any repossessed collateral for a defaulted consumer loan may not provide an adequate source of repayment for the outstanding loan balance. The remaining deficiency often will not warrant further substantial collection efforts against the borrower beyond obtaining a deficiency judgment. In addition, consumer loan collections are dependent on the borrower's continuing financial stability, and thus are more likely to be adversely affected by job loss, divorce, illness or personal bankruptcy. Furthermore, the application of various federal and state laws may limit the amount which can be recovered on such loans.
Concentrations of Credit Risk. Most of our lending activity is conducted with businesses and individuals in north central Texas. Our loan portfolio consists primarily of real estate loans, which were $362.6 million and constituted 67.0% of our total loans as of June 30, 2014, and commercial loans, which were $174.1 million and constituted 32.2% of our total loans as of June 30, 2014. Of the commercial loans outstanding as of June 30, 2014, $62.8 million were secured by promissory notes that evidence loans made by us to borrowers that in turn make loans to others that are secured by real estate. The remaining commercial loans are secured by general business assets, accounts receivable and/or the personal guaranty of the borrower. The geographic concentration subjects the loan portfolio to the general economic conditions within this area. The risks created by such concentrations have been considered by management in the determination of the adequacy of the allowance for loan losses. Management believes the allowance for loan losses is adequate to cover estimated losses on loans as of December 31, 2013 and 2012.
The majority of our loan portfolio consists of commercial loans and commercial real estate loans. As of June 30, 2014 and December 31, 2013 and 2012, commercial real estate loans represented approximately 33.5%, 34.6% and 33.8%, respectively, of our total loans. In addition, commercial loans represented approximately 32.2%, 32.5% and 31.1% as of June 30, 2014 and December 31, 2013 and 2012, respectively.
Sound risk management practices and appropriate levels of capital are essential elements of a sound commercial real estate lending program. Concentrations of commercial real estate exposures add a dimension of risk that compounds the risk inherent in individual loans. Interagency guidance on commercial real estate concentrations describe sound risk management practices which include board and management oversight, portfolio management, management information systems, market analysis, portfolio stress testing and sensitivity analysis, credit underwriting standards, and credit risk review functions. Management believes it has implemented these practices in order to monitor concentrations in commercial real estate in our loan portfolio.
Large Credit Relationships. As of June 30, 2014, the aggregate amount of loans to our 10 and 25 largest borrowers (including related entities) amounted to approximately $73.7 million, or 13.6% of total loans, and $142.1 million, or 26.3% of total loans, respectively. See "Risk Factors—Risk Related to Our Business—We have a significant amount of loans outstanding to a limited number of borrowers, which may increase our risk of loss."
Loan Underwriting and Approval. Our underwriting philosophy seeks to balance our desire to make sound, high quality loans while recognizing that lending money involves a degree of business risk. We have loan policies designed to assist us in managing this business risk. These policies provide a general framework for our loan origination, monitoring and funding activities, while recognizing that
50
not all risks can be anticipated. Our board of directors delegates loan authority up to board-approved limits collectively to our Director's Loan Committee, comprised of two outside directors, and the members of the Executive Loan Committee, which is comprised of the Bank's Chairman and Chief Executive Officer, the Vice Chairman and the Chief Lending Officer (or other designee of executive management). Responsibility is then delegated to the Bank's loan officers and lending support staff, who are charged with executing this responsibility in a judicious manner. When the total relationship exceeds an individual's loan authority, approval of the Executive Loan Committee is required. Additionally, loans to individuals that would exceed $8.0 million in total relationship debt must also be approved by the Director's Loan Committee. Further, loans that exceed $12.5 million in total relationship debt must be approved by the full board of directors. The Director's Loan Committee also reviews all loans approved by the Executive Loan Committee which exceed $3.0 million in total relationship debt on a monthly basis. The objective of the Bank's approval process is to provide a disciplined, collaborative approach to larger credits while maintaining responsiveness to client needs.
Loan decisions are documented as to the borrower's business, purpose of the loan, evaluation of the repayment source and the associated risks, evaluation of collateral, covenants and monitoring requirements, and the risk rating rationale. Our strategy for approving or disapproving loans is to follow conservative loan policies and consistent underwriting practices which include:
- •
- maintaining close relationships with the overall financial needs of our customers to fully understand the objectives of
our customers and assess their ability to perform under all economic conditions;
- •
- granting credit on a sound basis with full knowledge of the purpose and source of repayment for such credit;
- •
- serving the legitimate credit needs of our primary markets in a responsible manner for the benefit of our community, our
shareholders and our depositors;
- •
- developing and maintaining targeted levels of diversification for our loan portfolio as a whole and for loans within each
category; and
- •
- ensuring that each loan is properly documented and that any insurance coverage requirements are satisfied.
Managing credit risk is a company-wide process. Our strategy for credit risk management includes well-defined, centralized credit policies, uniform underwriting criteria by loan type and ongoing risk monitoring and review processes for all types of credit exposures. Our processes emphasize early-stage review of loans, regular credit evaluations and management reviews of loans, which supplement the ongoing and proactive credit monitoring and loan servicing provided by our loan officers and lending support staff. Our Director's Loan Committee, Executive Loan Committee and our Chief Lending Officer provide company-wide credit oversight and periodically review all credit risk portfolios to ensure that the risk identification processes are functioning properly and that our credit standards are followed. In addition, a third-party loan review is performed at least annually to identify problem assets and confirm our internal risk rating of loans. We attempt to identify potential problem loans early in an effort to aggressively seek resolution of these situations before the loans become a loss, record any necessary charge-offs promptly and maintain adequate allowance levels for probable loan losses inherent in the loan portfolio.
Our loan policies generally include other underwriting guidelines for loans collateralized by real estate. These underwriting standards are designed to determine the maximum loan amount that a borrower has the capacity to repay based upon the type of collateral securing the loan, borrower liquidity and historical and current market conditions relevant to the borrower's business and the type of real estate. Such loan policies include loan-to-value limits and loan terms tailored to the category of loans collateralized by liens on real estate.
51
In addition, our loan policies provide guidelines for personal guarantees, an environmental policy review, loans to employees, executive officers and directors, problem loan identification, maintenance of an adequate allowance for loan losses and other matters relating to lending practices.
Lending Limits. Our lending activities are subject to a variety of lending limits imposed by federal and state law. In general, the Bank is subject to a legal lending limit on loans to a single borrower based on the Bank's capital level. The dollar amounts of the Bank's lending limit increases or decreases as the Bank's capital increases or decreases. The Bank is able to sell participations in its larger loans to other financial institutions, which allows it to manage the risk involved in these loans and to meet the lending needs of its customers requiring extensions of credit in excess of these limits.
The Bank's current legal lending limit on loans to a single borrower is approximately $15.0 million, which we expect to increase to $25.0 million following the consummation of this offering. Currently, we maintain an in-house limit of $12.5 million for loans to a single borrower. Exceptions to this limit may be made in the case of particularly strong credit. We currently have no relationships with an aggregate principal balance of more than $12.5 million. We require approval by two of three designated executive officers for new loans exceeding $1.5 million or renewals of existing loans exceeding $2.5 million. Further, all loan relationships over $5.0 million but less than $8.0 million to a single borrower must be approved by the Chief Executive Officer and Vice Chairman. The Director's Loan Committee must approve loan relationships over $8.0 million to $12.5 million. All loan relationships over $12.5 million must be approved by the board of directors. We have strict policies and procedures in place for the establishment of hold limits with respect to specific products and businesses and evaluating exceptions to the hold limits for individual relationships.
Our loan policies provide general guidelines for loan-to-value ratios that restrict the size of loans to a maximum percentage of the value of the collateral securing the loans, which percentage varies by the type of collateral. Our internal loan-to-value limitations follow limits established by applicable law.
Deposits
Deposits are our principal source of funds for our interest earning assets. We believe that a critical component of our success is the importance we place on our deposit services. Market presidents and other key personnel are trained and incentivized to fully develop each relationship including asking our customers to bring their full relationship to the bank. We ensure our branches are staffed with skilled personnel to handle the needs of our customers. Delivering a "private bank" experience is an important component of our value proposition to our customers.
Our services include the usual deposit functions of commercial banks, safe deposit facilities, commercial and personal banking services in addition to our loan offerings. We offer a variety of deposit products and services consistent with the goal of attracting a wide variety of customers, including high net worth individuals and small to medium-sized businesses. The types of deposit accounts we offer consist of demand, savings, money market and time accounts. We actively pursue business checking accounts by offering competitive rates, telephone banking, online banking and other convenient services to our customers. We also pursue commercial deposit accounts that will benefit from the utilization of our treasury management services. Through our marketing focus on relationship banking, more than 84.0% of our commercial loan customers have deposit relationships with us as of June 30, 2014.
We believe core deposit relationships are critical to building franchise value. As of June 30, 2014, we held $236.2 million in noninterest-bearing deposits and $554.5 million in core deposits. As of December 31, 2013, we have grown our total deposits and our noninterest-bearing deposits organically at a compound annual growth rate of 25.4% and 39.4%, respectively, since December 31, 2011.
52
Other Products and Services
We offer banking products and services that are attractively priced and easily understood by the customer, with a focus on convenience and accessibility. We offer a full suite of online banking solutions including access to account balances, online transfers, online bill payment and electronic delivery of customer statements, as well as ATMs, and banking by telephone, mail and personal appointment. We also offer debit cards, night depository, direct deposit, cashier's checks, and letters of credit, as well as treasury management services including wire transfer services and automated clearinghouse services.
We are currently focused on expanding noninterest income though increased income from our treasury management service. We offer a full array of commercial treasury management services designed to be competitive with banks of all sizes. Treasury Management Services include balance reporting (including current day and previous day activity), transfers between accounts, wire transfer initiation, automated clearinghouse origination and stop payments. Cash management deposit products consist of lockbox, remote deposit capture, positive pay, reverse positive pay, account reconciliation services, zero balance accounts, and sweep accounts including loan sweep.
Investments
The primary objectives of our investment policy are to provide a source of liquidity, to provide an appropriate return on funds invested, to manage interest rate risk, to meet pledging requirements and to meet regulatory capital requirements.
As of June 30, 2014, the book value of our investment portfolio totaled $50.5 million, with an average yield of 1.73% and an estimated duration of approximately 2.17 years.
Our board of directors and Asset-Liability Committee are responsible for the regular review of our investment activities and the review and approval of our investment policy. Day-to-day transactions affecting our investment securities portfolio are managed by our Chief Financial Officer in accordance with the guidelines set forth in our investment policy. These investment activities are reviewed regularly by our board of directors and Asset-Liability Committee.
Our investment policy outlines investment type limitations, security mix parameters, authorization guidelines and risk management guidelines. The policy authorizes us to invest in a variety of investment securities, subject to various limitations. Our current investment portfolio consists of obligations of the U.S. Treasury and other U.S. government agencies or sponsored entities, including mortgage-backed securities and collateralized mortgage obligations.
Our Market Area
We currently operate in the Dallas metropolitan area, which is part of the broader Dallas-Fort Worth-Arlington metropolitan statistical area, which we refer to as the Dallas-Fort Worth metropolitan area. The Dallas economy is fueled by the real estate, technology, financial services, insurance, transportation, manufacturing, health care and energy sectors. This market is among the most vibrant in the United States with a rapidly growing population, a high level of job growth, an affordable cost of living and a pro-growth business climate. More broadly, Texas is also experiencing significant population and employment growth on a statewide basis.
- •
- A Leading Population Growth Center. The Dallas-Fort Worth metropolitan area is the fourth largest metropolitan area in the nation by population, behind only New York City, Los Angeles and Chicago, based on data from the United States Census Bureau. Population in this area is projected to grow by 8.6% from 2014 to 2019, compared to 3.5% for the nation as a whole, according to SNL Financial. Texas is the second most populous state in the United States and its population is projected to grow by 7.6% from 2014 to 2019, according to SNL Financial.
53
- •
- Robust Employment
Growth. The Dallas-Fort Worth metropolitan area had the highest percentage of employment growth of the 12 most populous metropolitan
areas in the United States during the 12 months ended April 30, 2014, according to the U.S. Bureau of Labor Statistics. The area's unemployment rate was 5.5% in July 2014, according to
the U.S. Bureau of Labor Statistics. Texas led the nation in job growth for the period from 2000 to 2013, according to the Federal Reserve Bank of Dallas.
- •
- Fortune 500
Companies. The Dallas-Fort Worth metropolitan area serves as the corporate headquarters for numerous Fortune 500 companies across many
varied industries, including ExxonMobil, AT&T, American Airlines, Fluor, Kimberly-Clark, HollyFrontier, Southwest Airlines, Texas Instruments, Neiman-Marcus, Tenent Healthcare, JCPenney, Dean Foods,
GameStop, Energy Transfer Equity, Commercial Metals, Celanese, D.R. Horton, Dr Pepper Snapple Group and Energy Future Holdings. Other major companies have recently announced significant
relocations or expansions in the area, such as Toyota, which announced the relocation of its North American headquarters, and State Farm, which announced a major expansion of its regional hub. On a
statewide basis, Texas is home to the corporate headquarters of 52 Fortune 500 companies.
- •
- Numerous Small and Medium-Sized
Businesses. Our primary customers are small and medium-sized businesses and professionals. Small and medium-size businesses are a vital
part of the Dallas-Fort Worth metropolitan area. With more than 140,000 businesses that employ less than 100 people, representing approximately 97.0% of total businesses, the Dallas-Fort Worth
metropolitan area ranks fifth in the United States in number of businesses employing less than 100 people, according to United States Census Bureau data for 2012 released in May 2014.
- •
- World Class Hospitals and Universities. The Dallas-Fort Worth metropolitan area contains several world-class hospitals and medical research facilities, major universities, and professional sports franchises.
Information Technology Systems
We continue to make significant investments in our information technology systems for our banking and lending operations and treasury management activities. We believe this is a necessary investment in order to enhance our capabilities to offer new products and overall customer experience, to provide scale for future growth and acquisitions, and to increase controls and efficiencies in our back office operations. We outsource our core data processing services to a nationally recognized bank software vendor providing us with capabilities to support the continued growth of the Bank. Our internal network and e-mail systems are maintained in-house. We leverage the capabilities of a third party service provider to provide the technical expertise around network design and architecture that is required for us to operate as an effective and efficient organization. We actively manage our business continuity plan. We follow all recommendations outlined by the Federal Financial Institutions Examination Council to ensure that we have effectively identified our risks and documented contingency plans for key functions and systems including providing for back up sites for all critical applications. We perform tests to ensure the adequacy of these contingency plans.
The majority of our other systems, including our electronic funds transfer, transaction processing and online banking services, are hosted by third-party service providers. The scalability of this infrastructure is designed to support our growth strategy. These critical business applications and processes are included in the business continuity plans referenced above.
Competition
The banking business is highly competitive, and our profitability will depend principally upon our ability to compete with other banks and non-bank financial institutions located in the Dallas
54
metropolitan area for lending opportunities, deposit funds, bankers and acquisition candidates. Our banking competitors in our target markets include Chase Bank, Wells Fargo, Bank of America, BBVA Compass, Amegy Bank, Comerica Bank, Regions Bank, Prosperity Bank, Independent Bank, Texas Capital Bank and various community banks.
We are subject to vigorous competition in all aspects of our business from banks, savings banks, savings and loan associations, finance companies, credit unions and other providers of financial services, such as money market mutual funds, brokerage firms, consumer finance companies, asset-based non-bank lenders, insurance companies and certain other non-financial entities, including retail stores which may maintain their own credit programs and certain governmental organizations which may offer more favorable financing than we can.
Many of the banks and other financial institutions with which we compete have significantly greater financial strength, marketing capability and name recognition than us and operate on a statewide, regional or nationwide basis. These institutions are also likely to have legal loan limits substantially in excess of those that we maintain. Such institutions can perform certain functions for their customers, including trust, securities brokerage and international banking services, which we presently do not offer directly. Although we may offer these services through correspondent banks, the inability to provide such services directly may be a competitive disadvantage and this may affect our ability to generate business, attract experienced bankers and capitalize on acquisition opportunities.
In addition, recent developments in technology and mass marketing have permitted larger companies to market loans and other products and services more aggressively to our small business customers. Such advantages may enable our competitors to realize greater economies of scale and operating efficiencies than we can. Further, some of the non-bank competitors are not subject to the same extensive regulations that govern the Company and the Bank. Various legislative acts in recent years have led to increased competition among financial institutions and competition from both financial and non-financial institutions is expected to continue. See "Risk Factors—We face strong competition from financial services companies and other companies that offer banking services, which could impact our business."
We have been able to compete effectively with other financial institutions by providing a high level of personalized banking service to professionals and owner-operated businesses and by emphasizing quick and flexible responses to customer demands, establishing long-term customer relationships and building customer loyalty, and by offering products and services designed to address the specific needs of our customers. We rely heavily on the continued business generation of our bankers and the efforts of our officers and directors for the solicitation and referral of potential customers and we expect this to continue for the foreseeable future.
Employees
As of June 30, 2014, we had 120 full-time employees and six part-time employees. None of our employees are represented by a union. Management believes that our relationship with employees is good.
Properties
Our principal offices are located at 8214 Westchester Drive, Suite 400, Dallas, Texas 75225. All of our branches are located in Texas. We own two of our branch locations and lease the remaining seven locations. The terms of our leases range from five to 10 years and generally give us the option to renew for subsequent terms of equal duration or otherwise extend the lease term subject to price adjustment
55
based on market conditions at the time of renewal. The following table sets forth a list of our locations as of the date of this prospectus.
| Branch Locations | ||||||
|---|---|---|---|---|---|---|
Location
|
Own or Lease | Sq. Ft. | ||||
Park Branch |
Own | 8,500 | ||||
5049 W. Park Boulevard |
||||||
Royal Branch |
Own |
3,938 |
||||
10703 Preston Road |
||||||
Westchester Branch |
Lease |
14,396 |
||||
8214 Westchester Drive |
||||||
SMU Branch |
Lease |
3,714 |
||||
6116 N. Central Expressway |
||||||
Lakewood Branch |
Lease |
4,473 |
||||
2101 Abrams Road |
||||||
Garland Branch |
Lease |
5,195 |
||||
622 Clara Barton Boulevard |
||||||
Alexis Branch |
Lease |
3,200 |
||||
14885 Preston Road |
||||||
Las Colinas Branch |
Lease |
7,630 |
||||
300 E. John Carpenter Freeway |
||||||
| Other Non-Banking Locations | ||||||
|---|---|---|---|---|---|---|
Location
|
Own or Lease | Sq. Ft. | ||||
Veritex Mortgage |
Lease | 2,462 | ||||
7001 Preston Road |
||||||
Our operational support functions are located at our Lakewood and Park Branch facilities. Our Westchester location houses management and staff totaling approximately 40 people with the capacity to significantly increase staffing within the existing space. In addition, certain mortgage functions are performed out of the Veritex Mortgage location. In June 2014, we acquired two parcels located at 2700 and 2706 Oak Lawn that we expect to serve as the new location of our existing Las Colinas Branch.
56
Legal Proceedings
We are not currently subject to any material legal proceedings. We are from time to time subject to claims and litigation arising in the ordinary course of business. These claims and litigation may include, among other things, allegations of violation of banking and other applicable regulations, competition law, labor laws and consumer protection laws, as well as claims or litigation relating to intellectual property, securities, breach of contract and tort. We intend to defend ourselves vigorously against any pending or future claims and litigation.
At this time, in the opinion of management, the likelihood is remote that the impact of such proceedings, either individually or in the aggregate, would have a material adverse effect on our combined results of operations, financial condition or cash flows. However, one or more unfavorable outcomes in any claim or litigation against us could have a material adverse effect for the period in which they are resolved. In addition, regardless of their merits or their ultimate outcomes, such matters are costly, divert management's attention and may materially adversely affect our reputation, even if resolved in our favor.
57
MANAGEMENT'S DISCUSSION AND ANALYSIS OF
FINANCIAL CONDITION AND RESULTS OF OPERATIONS
The following discussion and analysis of our financial condition and results of operations should be read in conjunction with "Selected Consolidated Financial Data" and our consolidated financial statements and the accompanying notes included elsewhere in this prospectus. This discussion and analysis contains forward-looking statements that are subject to certain risks and uncertainties and are based on certain assumptions that we believe are reasonable but may prove to be inaccurate. Certain risks, uncertainties and other factors, including those set forth under "Forward-Looking Statements," "Risk Factors" and elsewhere in this prospectus, may cause actual results to differ materially from those projected results discussed in the forward-looking statements appearing in this discussion and analysis. We assume no obligation to update any of these forward-looking statements.
Overview
We are a bank holding company headquartered in Dallas, Texas. Through our wholly-owned subsidiary, Veritex Community Bank, a Texas state chartered bank, we provide relationship-driven commercial banking products and services tailored to meet the needs of small to medium-sized businesses and professionals. Since our inception, we have targeted customers and focused our acquisitions primarily in the Dallas metropolitan area, which we consider to be Dallas and the adjacent communities in North Dallas. As we continue to grow, we expect to expand our primary market to include the broader Dallas-Fort Worth metropolitan area, which would include Fort Worth and Arlington, as well as the communities adjacent to those cities. We currently operate eight branches and one mortgage office, all of which are located in the Dallas metropolitan area. We have experienced significant organic growth since commencing banking operations in 2010 and have successfully acquired and integrated three banks. As of June 30, 2014, we had total assets of $710.4 million, total loans of $541.0 million, total deposits of $611.2 million and total stockholders' equity of $74.2 million.
The comparability of our consolidated results of operations for the years ended December 31, 2013, 2012 and 2011 is affected by the two acquisitions that we completed in 2011. We acquired Fidelity Resources Company and its wholly-owned subsidiary, Fidelity Bank, on March 23, 2011, and Bank of Las Colinas on October 26, 2011. Therefore, the results of the acquired operations of Fidelity Bank and Bank of Las Colinas were included in our results of operations for only a portion of 2011, compared to the full year in 2012 and 2013.
As a bank holding company operating through one segment, community banking, we generate most of our revenues from interest income on loans, customer service and loan fees, gains on sale of mortgage loans, and interest income from securities. We incur interest expense on deposits and other borrowed funds and noninterest expense, such as salaries and employee benefits and occupancy expenses. We analyze our ability to maximize income generated from interest earning assets and expense of our liabilities through our net interest margin. Net interest margin is a ratio calculated as net interest income divided by average interest-earning assets. Net interest income is the difference between interest income on interest-earning assets, such as loans and securities, and interest expense on interest-bearing liabilities, such as deposits and borrowings, which are used to fund those assets.
Changes in the market interest rates and interest rates we earn on interest-earning assets or pay on interest-bearing liabilities, as well as the volume and types of interest-earning assets, interest-bearing and noninterest-bearing liabilities and stockholders' equity, are usually the largest drivers of periodic changes in net interest spread, net interest margin and net interest income. Fluctuations in market interest rates are driven by many factors, including governmental monetary policies, inflation, deflation, macroeconomic developments, changes in unemployment, the money supply, political and international conditions and conditions in domestic and foreign financial markets. Periodic changes in the volume and types of loans in our loan portfolio are affected by, among other factors, economic and competitive
58
conditions in Texas and specifically in the Dallas metropolitan area, as well as developments affecting the real estate, technology, financial services, insurance, transportation, manufacturing and energy sectors within our target market and throughout the state of Texas.
Third Quarter 2014 Update
We expect to report net income in the range of $1.3 million to $1.4 million for the three months ended September 30, 2014 as compared to $1.2 million for the three months ended June 30, 2014 and $952,000 for the three months ended September 30, 2013. We also expect to report net income in the range of $3.4 million to $3.5 million for the nine months ended September 30, 2014 as compared to $2.4 million for the nine months ended September 30, 2013. The increase in net income for these periods is primarily attributable to growth in outstanding loan balances and a corresponding increase in net interest income.
As of September 15, 2014, total loans were $576.3 million, representing a $125.8 million increase from September 30, 2013 and a $35.3 million increase from June 30, 2014. Total deposits were $619.9 million as of September 15, 2014 representing an increase of $104.8 million from September 30, 2013, and an $8.7 million increase from June 30, 2014. Increases in our total loans and total deposits were largely driven by execution of our strategy and continued focus on strengthening and developing new and existing customer relationships in our market area.
Our expected net income for the three and nine month periods ending September 30, 2014 are preliminary estimates and subject to closing procedures, which we expect to complete after the completion of this offering. These closing procedures could result in material changes to our preliminary estimates indicated above. The foregoing estimates constitute forward-looking statements and are subject to risks and uncertainties, including those described under "Risk Factors" in this prospectus. Accordingly, our final results for the three and nine month periods ending September 30, 2014 may not be consistent with the foregoing estimates. See "Risk Factors—Risks Related to Our Business" and "Forward-Looking Statements."
Results of Operations for the Six Months Ended June 30, 2014 and 2013
Net Interest Income
Our operating results depend primarily on our net interest income, calculated as the difference between interest income on interest-earning assets, such as loans and securities, and interest expense on interest-bearing liabilities, such as deposits and borrowings. Fluctuations in market interest rates impact the yield and rates paid on interest sensitive assets and liabilities. Changes in the amount and type of interest-earning assets and interest-bearing liabilities also impact net interest income. The variance driven by the changes in the amount and mix of interest-earning assets and interest-bearing liabilities is referred to as a "volume change." Changes in yields earned on interest-earning assets and rates paid on interest-bearing deposits and other borrowed funds are referred to as a "rate change."
To evaluate net interest income, we measure and monitor (1) yields on our loans and other interest-earning assets, (2) the costs of our deposits and other funding sources, (3) our net interest spread and (4) our net interest margin. Net interest spread is the difference between rates earned on interest-earning assets and rates paid on interest-bearing liabilities. Net interest margin is a ratio calculated as net interest income divided by average interest-earning assets. Because noninterest-bearing sources of funds, such as noninterest-bearing deposits and stockholders' equity also fund interest-earning assets, net interest margin includes the benefit of these noninterest-bearing sources.
For the six months ended June 30, 2014, net interest income totaled $11.8 million, and net interest margin and net interest spread were 3.86% and 3.57%, respectively. For the six months ended June 30, 2013, net interest income totaled $10.0 million and net interest margin and net interest spread were
59
4.02% and 3.71%, respectively. The decreases in net interest margin and net interest spread were primarily attributable to the decrease in the average yield on the loan portfolio due to the low interest rate environment and its impact on competitive loan pricing. While we have experienced significant growth in average loan balances, market yields on new loan originations are below the average yield of amortizing or paid-off loans. Due to the continued impact of new loan growth and the runoff of higher yielding loan balances, we anticipate continued pressure on our net interest margin and net interest spread. Changes in rates paid on interest-bearing deposits for the six months ended June 30, 2014 and June 30, 2013 had a minimal impact on the net interest margin.
The following table presents, for the periods indicated, an analysis of net interest income by each major category of interest-earning assets and interest-bearing liabilities, the average amounts outstanding and the interest earned or paid on such amounts. The table also sets forth the average rate earned on interest-earning assets, the average rate paid on interest-bearing liabilities, and the net interest margin on average total interest-earning assets for the same periods. Interest earned on loans that are classified as non-accrual is not recognized in income, however the balances are reflected in average outstanding balances for the period. For the six months ended June 30, 2014 and 2013, interest
60
income not recognized on non-accrual loans was not material. Any non-accrual loans have been included in the table as loans carrying a zero yield.
| |
For the Six Months Ended June 30, | ||||||||||||||||||
|---|---|---|---|---|---|---|---|---|---|---|---|---|---|---|---|---|---|---|---|
| |
2014 | 2013 | |||||||||||||||||
| |
Average Outstanding Balance |
Interest Earned/ Interest Paid |
Average Yield/ Rate |
Average Outstanding Balance |
Interest Earned/ Interest Paid |
Average Yield/ Rate |
|||||||||||||
| |
(Dollars in thousands) (Unaudited) |
||||||||||||||||||
Assets |
|||||||||||||||||||
Interest-earning assets: |
|||||||||||||||||||
Total loans(1) |
$ | 508,836 | $ | 12,718 | 5.04 | % | $ | 409,217 | $ | 10,918 | 5.38 | % | |||||||
Securities available for sale |
50,186 | 422 | 1.70 | 33,295 | 280 | 1.70 | |||||||||||||
Investment in subsidiary |
93 | 1 | 2.17 | 93 | 1 | 2.17 | |||||||||||||
Interest-bearing deposits in other banks |
57,948 | 77 | 0.27 | 61,532 | 60 | 0.20 | |||||||||||||
| | | | | | | | | | | | | | | | | | | | |
Total interest-earning assets |
617,063 | 13,218 | 4.32 | 504,137 | 11,259 | 4.50 | % | ||||||||||||
Allowance for loan losses |
(5,205 | ) | (3,602 | ) | |||||||||||||||
Noninterest-earning assets |
59,668 | 55,381 | |||||||||||||||||
| | | | | | | | | | | | | | | | | | | | |
Total assets |
$ | 671,526 | $ | 555,916 | |||||||||||||||
| | | | | | | | | | | | | | | | | | | | |
| | | | | | | | | | | | | | | | | | | | |
Liabilities and Stockholders' Equity |
|||||||||||||||||||
Interest-bearing liabilities: |
|||||||||||||||||||
Interest-bearing deposits |
$ | 357,320 | $ | 1,161 | 0.66 | % | $ | 294,172 | $ | 1,060 | 0.73 | % | |||||||
Advances from FHLB |
15,000 | 59 | 0.79 | 14,861 | 125 | 1.70 | |||||||||||||
Other borrowings |
8,072 | 192 | 4.80 | 3,093 | 31 | 2.02 | |||||||||||||
| | | | | | | | | | | | | | | | | | | | |
Total interest-bearing liabilities |
380,392 | 1,412 | 0.75 | 312,126 | 1,216 | 0.79 | |||||||||||||
| | | | | | | | | | | | | | | | | | | | |
Noninterest-bearing liabilities: |
|||||||||||||||||||
Noninterest-bearing deposits |
216,721 | 178,186 | |||||||||||||||||
Other liabilities |
1,494 | 1,877 | |||||||||||||||||
| | | | | | | | | | | | | | | | | | | | |
Total noninterest-bearing liabilities |
218,215 | 180,063 | |||||||||||||||||
Stockholders' equity |
72,919 | 63,727 | |||||||||||||||||
| | | | | | | | | | | | | | | | | | | | |
Total liabilities and stockholders' equity |
$ | 671,526 | $ | 555,916 | |||||||||||||||
| | | | | | | | | | | | | | | | | | | | |
| | | | | | | | | | | | | | | | | | | | |
Net interest rate spread(2) |
3.57 | % | 3.71 | % | |||||||||||||||
Net interest income |
$ | 11,806 | $ | 10,043 | |||||||||||||||
| | | | | | | | | | | | | | | | | | | | |
| | | | | | | | | | | | | | | | | | | | |
Net interest margin(3) |
3.86 | % | 4.02 | % | |||||||||||||||
- (1)
- Includes
average outstanding balances of loans held for sale of $2,855 and $2,802 for the six months ended June 30, 2014 and 2013, respectively.
- (2)
- Net
interest spread is the average yield on interest-earning assets minus the average rate on interest-bearing liabilities.
- (3)
- Net interest margin is equal to net interest income divided by average interest-earning assets.
The following table presents information regarding the dollar amount of changes in interest income and interest expense for the periods indicated for each major component of interest-earning assets and interest-bearing liabilities and distinguishes between the changes attributable to changes in
61
volume and changes attributable to changes in interest rates. For purposes of this table, changes attributable to both rate and volume that cannot be segregated have been allocated to rate.
| |
For the Six Months Ended June 30, 2014 compared to 2013 |
|||||||||
|---|---|---|---|---|---|---|---|---|---|---|
| |
Increase (Decrease) due to |
|
||||||||
| |
Volume | Rate | Total | |||||||
| |
(Dollars in thousands) (Unaudited) |
|||||||||
Interest-earning assets: |
||||||||||
Total loans |
$ | 2,658 | $ | (858 | ) | $ | 1,800 | |||
Securities available for sale |
142 | — | 142 | |||||||
Interest-earning deposits in other banks |
(3 | ) | 20 | 17 | ||||||
| | | | | | | | | | | |
Total increase (decrease) in interest income |
2,797 | (838 | ) | 1,959 | ||||||
| | | | | | | | | | | |
| | | | | | | | | | | |
Interest-bearing liabilities: |
||||||||||
Interest-bearing deposits |
228 | (127 | ) | 101 | ||||||
Advances from FHLB |
1 | (67 | ) | (66 | ) | |||||
Other borrowings |
50 | 111 | 161 | |||||||
| | | | | | | | | | | |
Total increase (decrease) in interest expense |
279 | (83 | ) | 196 | ||||||
| | | | | | | | | | | |
Increase (decrease) in net interest income |
$ | 2,518 | $ | (755 | ) | $ | 1,763 | |||
| | | | | | | | | | | |
| | | | | | | | | | | |
Provision for Loan Losses
Our provision for loan losses is a charge to income in order to bring our allowance for loan losses to a level deemed appropriate by management. For a description of the factors taken into account by management in determining the allowance for loan losses see "—Financial Condition—Allowance for Loan Losses." The provision for loan losses was $677,000 for the six months ended June 30, 2014, compared to $1.0 million for the same period in 2013, a decrease of $323,000 or 32.3%. The decrease in provision expense was due to a reduction in the level of specific reserves needed to cover classified loans and a lower amount of expense required to replenish the reserve from the net charge-off to loans. This reduction was partially offset by general reserves needed to cover the amount of growth in the loan portfolio.
Noninterest Income
Our primary sources of recurring noninterest income are service charges on deposit accounts, gains on the sale of loans and other real estate owned and income from bank-owned life insurance. Noninterest income does not include loan origination fees to the extent they exceed the direct loan origination costs, which are generally recognized over the life of the related loan as an adjustment to yield using the interest method.
62
The following table presents, for the periods indicated, the major categories of noninterest income:
| |
For the Six Months Ended June 30, |
|
||||||||
|---|---|---|---|---|---|---|---|---|---|---|
| |
Increase (Decrease) |
|||||||||
| |
2014 | 2013 | ||||||||
| |
(Dollars in thousands) (Unaudited) |
|||||||||
Noninterest income: |
||||||||||
Service charges on deposit accounts |
$ | 396 | $ | 369 | $ | 27 | ||||
Gain on sales of loans held for sale |
245 | 424 | (179 | ) | ||||||
Gain on sales of other real estate owned |
37 | 17 | 20 | |||||||
Bank-owned life insurance income |
212 | 166 | 46 | |||||||
Gain on sales of investment securities |
34 | — | 34 | |||||||
Other |
287 | 330 | (43 | ) | ||||||
| | | | | | | | | | | |
Total noninterest income |
$ | 1,211 | $ | 1,306 | $ | (95 | ) | |||
| | | | | | | | | | | |
| | | | | | | | | | | |
Noninterest income for the six months ended June 30, 2014 decreased $95,000 or 7.3% to $1.2 million compared to noninterest income of $1.3 million for the same period in 2013. The primary components of the decrease were as follows:
Service charges on deposit accounts. We earn fees from our customers for deposit-related services, and these fees constitute a significant and predictable component of our noninterest income. Service charges on deposit accounts were $396,000 for the six months ended June 30, 2014, an increase of $27,000 over the same period in 2013. This increase was primarily attributable to an increase in merchant and debit card fees of $11,000, an increase in stop payment fees of $10,000 and the growth in the number of deposit accounts, fees and related balances.
Gain on sales of loans. We originate long-term fixed-rate mortgage loans for resale into the secondary market. Our mortgage originations were $18.8 million for the six months ended June 30, 2014 compared to $23.7 million for the six months ended June 30, 2013. Income from the sales of loans was $245,000 for the six months ended June 30, 2014 compared to $424,000 for the same period of 2013. This decrease of $179,000 was primarily due to decreases in the number of loans sold and average gain per sale. For the six months ended June 30, 2013, 70 loans were sold at an average gain of $6,000 per loan compared to 45 loan sales at an average gain of $5,400 per loan for the same period of 2014.
Gain on sales of other real estate owned. Gain on sales of other real estate owned was $37,000 and $17,000 for the six months ended June 30, 2014 and 2013, respectively. This increase of $20,000 or 117.6% was due to the sale of three properties in 2014 for an overall net gain of $37,000 versus the sale of two properties in the same period of 2013 at a total net gain of $17,000.
Bank-owned life insurance income. We invest in bank-owned life insurance due to its attractive nontaxable return and protection against the loss of our key employees. We record income based on the growth of the cash surrender value of these policies as well as the annual yield. Income from bank-owned life insurance increased $46,000 for the six months ended June 30, 2014, compared to the same period in 2013. The increase in income was primarily attributable to the purchase of $5.0 million in additional bank-owned life insurance on March 25, 2013. We earned tax equivalent yields on these policies of 4.92% for the six months ended June 30, 2014, compared to 5.61% for the same period in 2013. The decline in yield over the period was the result of a decline in market interest rates.
Other. This category includes a variety of other income producing activities, including late charges, wire transfer fees, and revenue from other real estate owned. Other income decreased $43,000
63
or 13.0% for the six months ended June 30, 2014, compared to the same period in 2013, primarily due to a decrease of $9,500 in wire transfer fees and a decrease $21,000 in revenue from other real estate owned.
Noninterest Expense
Generally, noninterest expense is composed of all employee expenses and costs associated with operating our facilities, obtaining and retaining customer relationships and providing bank services. The major component of noninterest expense is salaries and employee benefits. Noninterest expense also includes operational expenses, such as occupancy expenses, depreciation and amortization of office equipment, professional and regulatory fees, including FDIC assessments, data processing expenses, and advertising and promotion expenses.
The following table presents, for the periods indicated, the major categories of noninterest expense:
| |
For the Six Months Ended June 30, |
|
||||||||
|---|---|---|---|---|---|---|---|---|---|---|
| |
Increase (Decrease) |
|||||||||
| |
2014 | 2013 | ||||||||
| |
(Dollars in thousands) (Unaudited) |
|||||||||
Salaries and employee benefits |
$ | 4,838 | $ | 4,446 | $ | 392 | ||||
Non-staff expenses: |
||||||||||
Occupancy of bank premises |
920 | 830 | 90 | |||||||
Depreciation and amortization |
667 | 607 | 60 | |||||||
Data processing |
426 | 358 | 68 | |||||||
FDIC assessment fees |
217 | 186 | 31 | |||||||
Legal fees |
59 | 48 | 11 | |||||||
Other professional fees |
543 | 274 | 269 | |||||||
Advertising and promotions |
93 | 78 | 15 | |||||||
Utilities and telephone |
141 | 143 | (2 | ) | ||||||
Other real estate owned expenses and write-downs |
134 | 243 | (109 | ) | ||||||
Other |
956 | 895 | 61 | |||||||
| | | | | | | | | | | |
Total noninterest expense |
$ | 8,994 | $ | 8,108 | $ | 886 | ||||
| | | | | | | | | | | |
| | | | | | | | | | | |
Noninterest expense for the six months ended June 30, 2014 increased $886,000 or 10.9% to $9.0 million compared to noninterest expense of $8.1 million for the same period in 2013. The most significant components of the increase were as follows:
Salaries and employee benefits. Salaries and employee benefits are the largest component of noninterest expense and include payroll expense, the cost of incentive compensation, benefit plans, health insurance and payroll taxes. Salaries and employee benefits were $4.8 million for the six months ended June 30, 2014, an increase of $392,000 or 8.8% compared to the same period in 2013. The increase was primarily attributable to the addition of nine full-time equivalent employees since June 30, 2013. As of June 30, 2014, we had 120 full-time equivalent employees and six part-time employees. Salaries and employee benefits included $165,000 and $160,000 in stock-based compensation expense for the six months ended June 30, 2014 and 2013, respectively.
64
Occupancy of bank premises. Our expense associated with occupancy of bank premises was $920,000 for the six months ended June 30, 2014 compared to $830,000 for the same period of 2013. This increase of $90,000 or 10.8% was due primarily to lease expense increase of $46,000 related to an additional 3,500 square feet resulting from the expansion of our corporate office space, a $24,000 increase in common area maintenance expense, and a $13,000 increase in grounds maintenance.
Depreciation and amortization. Depreciation and amortization costs were $667,000 and $607,000 for the six months ended June 30, 2014 and 2013, respectively. This category includes building, leasehold, furniture, fixtures and equipment depreciation totaling $520,000 and $460,000 for the six months ended June 30, 2014 and 2013, respectively, as well as intangible asset amortization of $147,000 for the same periods. The increase of $60,000 or 9.9% was due to depreciation from additional furniture and technology equipment purchases.
Data processing. Data processing expenses were $426,000 for the six months ended June 30, 2014 and $358,000 for the same period in 2013. The increase of $68,000 or 19.0% was attributable to incremental processing fees resulting from the growth in the volume of our deposit accounts.
FDIC assessment fees. Our FDIC assessment fees were $217,000 and $186,000 for the six months ended June 30, 2014 and 2013, respectively. The increase of $31,000 or 16.7% was a result of the growth in assets over this period.
Legal fees. Legal fees were $59,000 and $48,000 for the six months ended June 30, 2014 and 2013, respectively. The increase of $11,000 or 22.9% was due to an increase in loan work-out related legal support.
Other professional fees. Other professional fees include audit, loan review, regulatory assessments, and information technology services. These fees were $543,000 and $274,000 for the six months ended June 30, 2014 and 2013, respectively. This increase of $269,000 or 98.2% was primarily attributable to increased audit and accounting fees of $140,000 for services related to our initial public offering and an $81,000 increase in professional services for a compensation analysis and review.
Other real estate owned expenses and write-downs. Expenses related to other real estate owned were $134,000 and $243,000 for the six months ended June 30, 2014 and 2013, respectively. The decrease of $109,000 or 44.9% was due to a reduction in the number of properties comprising other real estate owned and in related property write-downs. The bank sold six other real estate owned properties and foreclosed on three additional properties between June 30, 2013 and June 30, 2014 reducing the number of properties held from seven as of June 30, 2013, to four as of June 30, 2014. In addition, we had no write-downs of other real estate owned for the six months ended June 30, 2014, compared to a write-down of $137,000 related to a commercial retail property for the six months ended June 30, 2013.
Other. This category includes operating and administrative expenses including small hardware and software purchases, business development expenses (i.e. travel and entertainment, donations and club memberships), insurance and security expenses. Other noninterest expense increased $61,000 or 6.8% to $956,000 for the six months ended June 30, 2014, compared to $895,000 for the same period in 2013 primarily related to an increase in software expenses, security expenses and business development related expenses required to support our marketing efforts.
Income Tax Expense
The amount of income tax expense is influenced by the amounts of our pre-tax income, tax-exempt income and other nondeductible expenses. Deferred tax assets and liabilities are reflected at currently enacted income tax rates in effect for the period in which the deferred tax assets and liabilities are expected to be realized or settled. As changes in tax laws or rates are enacted, deferred tax assets and
65
liabilities are adjusted through the provision for income taxes. Valuation allowances are established when necessary to reduce deferred tax assets to the amount expected to be realized.
For the six months ended June 30, 2014, income tax expense totaled $1.2 million, an increase of $416,000 or 53.7% compared to $774,000 for the same period in 2013. The increase was primarily attributable to the $1.1 million increase in net operating income from $2.2 million for the six months ended June 30, 2013 to $3.3 million for the same period in 2014. Our effective tax rates for the six months ended June 30, 2014 and 2013 were 35.6% and 34.7%, respectively. Our effective tax rates for both periods were affected primarily by tax-exempt income generated by bank-owned life insurance and other nondeductible expenses.
Results of Operations For the Years Ended December 31, 2013, 2012 and 2011
Net Interest Income
For additional information on net interest income and how we measure and monitor it, see "—Results of Operations for the Six Months Ended June 30, 2014 and 2013—Net Interest Income."
2013 vs. 2012. Net interest income for 2013 was $21.0 million compared to $19.1 million for 2012, an increase of $1.9 million or 9.95%. The increase in net interest income was primarily due to a $2.1 million or 9.8% increase in interest income, which was partially offset by a $164,000 or 7.1% increase in interest expense. The growth in interest income was primarily attributable to a $91.5 million or 26.7% increase in average loans outstanding for the year ended December 31, 2013, compared to 2012, partially offset by a 62 basis point decrease in the yield on interest-earning assets. The increase in average loans outstanding was due to an increase in new customer accounts and an increase in existing customer balances. The decrease in the average yield on the loan portfolio was primarily due to the low interest rate environment and its impact on competitive loan pricing. While we experienced significant growth in average loan balances, market yields on new loan originations were below the average yield of amortizing or paid-off loans. Due to the continued impact of new loan growth and the runoff of higher yielding loan balances, we anticipate continued interest rate pressure on our total interest-earning assets. The decline in average loan yields is also the result of a reduction in deferred loan fees and a declining purchase discount accretion. Interest income on loans was $22.8 million for 2013, an increase of $2.2 million or 10.7% compared to 2012 due to the increase in average loans outstanding. Interest income on securities was $613,000 during 2013, a decrease of $42,000 over 2012, due to the continued low rate environment. Investment portfolio purchases during 2013 were targeted short duration, low price risk mortgage-backed securities, which provided lower yields.
Interest expense was $2.5 million for 2013, an increase of $164,000 over 2012. Average interest-bearing deposits increased $44.0 million for 2013 compared to 2012, $36.7 million of which resulted from increases in money market balances. The average rate on interest-bearing deposits decreased from 0.74% to 0.71% for the same period, resulting in a $29,000 decrease in related interest expense. Average certificates and other time deposits increased $7.8 million for 2013 compared to 2012, $5.0 million of which resulted from the purchase of six month brokered deposits, and the average rate decreased from 1.10% to 1.06% for the same period, resulting in a decrease in related interest expense of $48,000.
Net interest income was also materially impacted by a $49.3 million or 35.4% increase in average noninterest-bearing deposits during 2013, which was primarily attributable to growth in customer relationships and noninterest-bearing checking accounts. Total cost of funds decreased 12 basis points to 0.44% for the year ended December 31, 2013 from 0.56% for the year ended December 31, 2012. Net interest margin, defined as net interest income divided by average interest-earning assets, for 2013 was 3.96%, a decrease of 54 basis points compared to 4.50% for 2012.
66
2012 vs. 2011. Net interest income for 2012 was $19.1 million compared to $12.6 million for 2011, an increase of $6.5 million or 51.6%. The increase in net interest income was primarily due to a $6.5 million or 43.9% increase in interest income, as interest expense remained flat year over year. The growth in interest income was primarily attributable to a $125.1 million or 57.6% increase in average loans outstanding for 2012, compared to 2011, which was primarily due to the acquisition of Fidelity Bank in March 2011 and Bank of Las Colinas in October 2011. The growth in interest income was also impacted by an increase of 17 basis points in our yield on interest-earning assets, which resulted primarily for a shift in the composition of our interest-earning assets from investment securities to loans, although our average yield on loans decreased 19 basis points year over year. The decrease in the average yield on the loan portfolio was primarily due to the low interest rate environment and its impact on competitive pricing for new loan originations compared to rates on runoff of the higher yielding loans. Interest income on loans was $20.6 million for 2012, an increase of $7.1 million or 52.6% compared to 2011 due to the increase in average loans outstanding. Interest income on securities was $655,000 during 2012, a decrease of $632,000 from 2011, due to a decrease in average balances of the investment portfolio. Specifically, we sold certain low yielding securities and reinvested the proceeds of the sale in higher yielding loans.
The average balance of interest-bearing liabilities increased by $54.1 million or 24.8% in 2012, compared to 2011, although the average rate on interest-bearing liabilities decreased 21 basis points, resulting in total interest expense remaining flat year over year at $2.3 million. Average interest-bearing demand deposits, money market and savings accounts increased $42.4 million for 2012 compared to 2011 due to the acquisitions of Fidelity Bank and Bank of Las Colinas ($33.5 million of the increase resulted from increase in money market accounts) but were partially offset by a decrease in the average rate on interest-bearing demand deposits, money market and savings accounts from 0.72% to 0.55% for the same time period. Average certificates and other time deposits increased by $11.1 million or 14.3% in 2012 compared to 2011. A majority of this increase was due to growth in certificates of deposits greater than $100,000, which was partially offset by a decrease in the average rate on time deposits from 1.15% in 2011 to 1.10% in 2012.
Net interest income was also impacted by a $58.4 million or 72.3% increase in average noninterest-bearing deposits during 2012, which was primarily attributable to the two bank acquisitions, coupled with growth in customer relationships and noninterest-bearing checking accounts. Total cost of funds decreased 21 basis points to 0.56% for 2012 from 0.77% for 2011. Net interest margin for 2012 was 4.50%, an increase of 38 basis points compared to 4.12% for 2011.
The following table presents, for the periods indicated, the total dollar amount of average balances, interest income from average interest-earning assets and the resultant yields, as well as the interest expense on average interest-bearing liabilities, expressed both in dollars and rates. Average
67
balances for 2013 and 2012 are daily average balances and average balances for 2011 are monthly average balances. Any non-accrual loans have been included in the table as loans carrying a zero yield.
| |
For the Years Ended December 31, | |||||||||||||||||||||||||||
|---|---|---|---|---|---|---|---|---|---|---|---|---|---|---|---|---|---|---|---|---|---|---|---|---|---|---|---|---|
| |
2013 | 2012 | 2011 | |||||||||||||||||||||||||
| |
Average Outstanding Balance |
Interest Earned/ Interest Paid |
Average Yield/ Rate |
Average Outstanding Balance |
Interest Earned/ Interest Paid |
Average Yield/ Rate |
Average Outstanding Balance |
Interest Earned/ Interest Paid |
Average Yield/ Rate |
|||||||||||||||||||
| |
(Dollars in thousands) |
|||||||||||||||||||||||||||
Assets |
||||||||||||||||||||||||||||
Interest-earning assets: |
||||||||||||||||||||||||||||
Total loans(1) |
$ | 433,612 | $ | 22,755 | 5.25 | % | $ | 342,130 | $ | 20,619 | 6.03 | % | $ | 217,064 | $ | 13,494 | 6.22 | % | ||||||||||
Securities available for sale |
37,066 |
613 |
1.65 |
34,496 |
655 |
1.90 |
65,243 |
1,287 |
1.97 |
|||||||||||||||||||
Investment in subsidiary |
93 | 2 | 2.15 | 93 | 8 | 8.60 | 72 | 5 | 6.94 | |||||||||||||||||||
Interest-earning deposits in financial institutions |
60,931 |
132 |
0.22 |
47,813 |
108 |
0.23 |
22,483 |
73 |
0.32 |
|||||||||||||||||||
| | | | | | | | | | | | | | | | | | | | | | | | | | | | | |
Total interest-earning assets |
531,702 | 23,502 | 4.42 | 424,532 | 21,390 | 5.04 | 304,862 | 14,859 | 4.87 | |||||||||||||||||||
Allowance for loan losses |
(4,047 |
) |
(1,924 |
) |
(824 |
) |
||||||||||||||||||||||
Noninterest-earning assets |
56,411 |
50,185 |
43,803 |
|||||||||||||||||||||||||
| | | | | | | | | | | | | | | | | | | | | | | | | | | | | |
Total assets |
$ | 584,066 | $ | 472,793 | $ | 347,841 | ||||||||||||||||||||||
| | | | | | | | | | | | | | | | | | | | | | | | | | | | | |
| | | | | | | | | | | | | | | | | | | | | | | | | | | | | |
Liabilities and Stockholders' Equity |
||||||||||||||||||||||||||||
Interest-bearing liabilities: |
||||||||||||||||||||||||||||
Interest-bearing deposits |
$ | 311,162 | $ | 2,207 | 0.71 | % | $ | 259,278 | $ | 1,911 | 0.74 | % | $ | 205,791 | $ | 1,817 | 0.88 | % | ||||||||||
Advances from FHLB |
14,932 | 190 | 1.27 | 10,000 | 314 | 3.14 | 10,000 | 312 | 3.12 | |||||||||||||||||||
Other borrowings |
3,207 | 63 | 1.96 | 3,093 | 72 | 2.33 | 2,398 | 163 | 6.80 | |||||||||||||||||||
| | | | | | | | | | | | | | | | | | | | | | | | | | | | | |
Total interest-bearing liabilities |
329,301 | 2,460 | 0.75 | 272,371 | 2,297 | 0.84 | 218,189 | 2,292 | 1.05 | |||||||||||||||||||
| | | | | | | | | | | | | | | | | | | | | | | | | | | | | |
Noninterest-bearing liabilities: |
||||||||||||||||||||||||||||
Noninterest-bearing deposits |
188,405 | 139,128 | 80,761 | |||||||||||||||||||||||||
Other liabilities |
1,714 | 1,400 | 1,538 | |||||||||||||||||||||||||
| | | | | | | | | | | | | | | | | | | | | | | | | | | | | |
Total noninterest-bearing liabilities |
190,119 | 140,528 | 82,299 | |||||||||||||||||||||||||
Stockholders' equity |
64,646 | 59,894 | 47,353 | |||||||||||||||||||||||||
| | | | | | | | | | | | | | | | | | | | | | | | | | | | | |
Total liabilities and stockholders' equity |
$ | 584,066 | $ | 472,793 | $ | 347,841 | ||||||||||||||||||||||
| | | | | | | | | | | | | | | | | | | | | | | | | | | | | |
| | | | | | | | | | | | | | | | | | | | | | | | | | | | | |
Net interest rate spread(2) |
3.67 | % | 4.20 | % | 3.82 | % | ||||||||||||||||||||||
Net interest income |
$ | 21,042 | $ | 19,093 | $ | 12,567 | ||||||||||||||||||||||
| | | | | | | | | | | | | | | | | | | | | | | | | | | | | |
| | | | | | | | | | | | | | | | | | | | | | | | | | | | | |
Net interest margin(3) |
3.96 | % | 4.50 | % | 4.12 | % | ||||||||||||||||||||||
- (1)
- Includes
average outstanding balances of loans held for sale of $2.2 million, $741,000 for 2013 and 2012. There were no loans held for sale in 2011.
- (2)
- Net
interest spread is the average yield on interest-earning assets minus the average rate on interest-bearing liabilities.
- (3)
- Net interest margin is equal to net interest income divided by average interest-earning assets.
68
The following table presents information regarding the dollar amount of changes in interest income and interest expense for the periods indicated for each major component of interest-earning assets and interest-bearing liabilities and distinguishes between the changes attributable to changes in volume and changes attributable to changes in interest rates. For purposes of this table, changes attributable to both rate and volume which cannot be segregated have been allocated to rate.
| |
For the Years Ended December 31, | ||||||||||||||||||
|---|---|---|---|---|---|---|---|---|---|---|---|---|---|---|---|---|---|---|---|
| |
2013 vs. 2012 | 2012 vs. 2011 | |||||||||||||||||
| |
Increase (Decrease) Due to Change in |
|
Increase (Decrease) Due to Change in |
|
|||||||||||||||
| |
Volume | Rate | Total | Volume | Rate | Total | |||||||||||||
| |
(Dollars in thousands) |
||||||||||||||||||
Interest-earning assets: |
|||||||||||||||||||
Total loans |
$ | 5,513 | $ | (3,377 | ) | $ | 2,136 | $ | 7,775 | $ | (650 | ) | $ | 7,125 | |||||
Securities available for sale |
49 | (91 | ) | (42 | ) | (606 | ) | (26 | ) | (632 | ) | ||||||||
Investment in subsidiary |
— | (6 | ) | (6 | ) | 1 | 2 | 3 | |||||||||||
Interest-earning deposits in other banks |
30 | (6 | ) | 24 | 82 | (47 | ) | 35 | |||||||||||
| | | | | | | | | | | | | | | | | | | | |
Total increase (decrease) in interest income |
$ | 5,592 | $ | (3,480 | ) | $ | 2,112 | $ | 7,252 | $ | (721 | ) | $ | 6,531 | |||||
| | | | | | | | | | | | | | | | | | | | |
| | | | | | | | | | | | | | | | | | | | |
Interest-bearing liabilities: |
|||||||||||||||||||
Interest-bearing deposits |
$ | 327 | $ | (31 | ) | $ | 296 | $ | 434 | $ | (340 | ) | $ | 94 | |||||
Advances from FHLB |
155 | (279 | ) | (124 | ) | — | 2 | 2 | |||||||||||
Other borrowings |
3 | (12 | ) | (9 | ) | 47 | (138 | ) | (91 | ) | |||||||||
| | | | | | | | | | | | | | | | | | | | |
Total increase (decrease) in interest expense |
485 | (322 | ) | 163 | 481 | (476 | ) | 5 | |||||||||||
| | | | | | | | | | | | | | | | | | | | |
Increase (decrease) in net interest income |
$ | 5,107 | $ | (3,158 | ) | $ | 1,949 | $ | 6,771 | $ | (245 | ) | $ | 6,526 | |||||
| | | | | | | | | | | | | | | | | | | | |
| | | | | | | | | | | | | | | | | | | | |
Provision for Loan Losses
The provision for loan losses for the year ended December 31, 2013 was $1.9 million compared to $3.0 million for the year ended December 31, 2012. The decrease in provision expense was due to a reduction in the level of specific reserves needed to cover classified loans and a lower amount of expense required to replenish the reserve from the net charge-off of loans. This reduction was partially offset by general reserves needed to cover the amount of growth in the loan portfolio. Net charge-offs for the years ended December 31, 2013 and 2012 were $103,000 and $727,000, respectively. This decrease of 86.0% reflected a decrease in gross charge-offs from $801,000 for the year ended December 31, 2012 to $240,000 for the year ended December 31, 2013 and an increase in recoveries from $74,000 for the year ended December 31, 2012 to $137,000 for the year ended December 31, 2013. The decrease in net charge-offs was largely a result of improvement in the quality of our loan portfolio.
69
Noninterest Income
For the year ended December 31, 2013, noninterest income totaled $2.4 million, an increase of $744,000 or 45.2% compared to 2012. The following table presents, for the periods indicated, the major categories of noninterest income:
| |
For the Years Ended December 31, |
Increase (Decrease) | ||||||||||||||
|---|---|---|---|---|---|---|---|---|---|---|---|---|---|---|---|---|
| |
2013 | 2012 | 2011 | 2013 v 2012 | 2012 v 2011 | |||||||||||
| |
(Dollars in thousands) |
|||||||||||||||
Noninterest income: |
||||||||||||||||
Service charges on deposit accounts |
$ | 726 | $ | 700 | $ | 563 | $ | 26 | $ | 137 | ||||||
Gain on sales of loans |
632 | 248 | — | 384 | 248 | |||||||||||
Gain on sales of other real estate owned |
20 | 61 | 43 | (41 | ) | 18 | ||||||||||
Bank-owned life insurance income |
385 | 180 | — | 205 | 180 | |||||||||||
Gain on sales of investment securities |
— | — | 421 | — | (421 | ) | ||||||||||
Other |
628 | 458 | 250 | 170 | 208 | |||||||||||
| | | | | | | | | | | | | | | | | |
Total noninterest income |
$ | 2,391 | $ | 1,647 | $ | 1,277 | $ | 744 | $ | 370 | ||||||
| | | | | | | | | | | | | | | | | |
| | | | | | | | | | | | | | | | | |
Service charges on deposit accounts. Service charges on deposit accounts increased $26,000 or 3.7% in 2013 compared to 2012 primarily due to the increase in the number of deposit accounts from organic deposit growth. The increase of $137,000 or 24.3% in 2012 compared to 2011 was due primarily to a full year of service charge income on the deposit accounts acquired in 2011 from Fidelity Bank and Bank of Las Colinas. The number of deposit accounts increased by 793 or 11.8% from 6,746 to 7,539 between December 31, 2011 and December 31, 2012, and 683 or 9.1% from 7,539 to 8,222 between December 31, 2012 and December 31, 2013.
Gain on sales of loans. Gain on sales of loans increased $384,000 or 154.8% in 2013 compared to 2012 due to an increase in the number of mortgage loans sold in 2013 compared to 2012. We began originating mortgage loans for sale in April 2012. Accordingly, our 2013 results reflect a full year of income related to the sale of mortgage loans. We sold 109 loans in 2013 with an average gain on sale of $5,900, compared to 40 loans in 2012 with an average gain on sale of $6,200. We did not sell any mortgage loans in 2011.
Gain on sales of other real estate owned. The decrease of $41,000 in gain on sales of other real estate owned for 2013 compared to 2012 was due to market conditions, which resulted in a loss taken on five out of six properties sold in 2013, although the loss was more than offset by a gain of $68,000 on 18 lots of a residential development held as other real estate owned. The increase of $18,000 or 41.9% for 2012 compared to 2011 was due primarily to the sale of eight lots sold at a gain of $34,000 from a residential development property held as other real estate owned, as well as a $25,000 gain on the sale of a participation in property classified as other real estate owned.
Bank-owned life insurance. Income from bank-owned life insurance income increased $205,000 or 113.9% in 2013 compared to 2012 due to the purchase of $5.0 million of additional bank-owned life insurance in March 2013. We did not own bank-owned life insurance during 2011.
Gain on sales of investment securities. We had no gain on the sale of securities in 2013 or 2012. In 2011, we had a gain on sales of our investment securities of $421,000, which was due to the sale of low yielding mortgage-backed securities and reinvestment of the proceeds from such sale into higher yielding loans.
Other. Other noninterest income increased $170,000 or 37.1% in 2013 compared to 2012 due primarily to an increase of $98,000 in wire transfer fees, an increase of $20,000 in Federal Reserve stock dividends, and an increase in income generated from other real estate owned rental income of
70
$31,000, as well as an increase in certain customer fees. Other noninterest income increased $208,000 from 2011 to 2012 due to increases in wire transfer fees, Federal Reserve stock dividends and other customer fees from the additional deposit accounts acquired from Fidelity Bank and Bank of Las Colinas in 2011.
Noninterest Expense
For the year ended December 31, 2013, noninterest expense totaled $16.3 million, an increase of $192,000 or 1.2% compared to 2012. For the year ended December 31, 2012, noninterest expense totaled $16.1 million, an increase of $3.4 million or 26.7% compared to $12.7 million for the same period in 2011. The following table presents, for the periods indicated, the major categories of noninterest expense:
| |
For the Years Ended December 31, |
Increase (Decrease) |
||||||||||||||
|---|---|---|---|---|---|---|---|---|---|---|---|---|---|---|---|---|
| |
2013 | 2012 | 2011 | 2013 v 2012 |
2012 v 2011 |
|||||||||||
| |
(Dollars in thousands) |
|||||||||||||||
Salaries and employee benefits |
$ | 9,084 | $ | 9,205 | $ | 6,967 | $ | (121 | ) | $ | 2,238 | |||||
Non-staff expenses: |
||||||||||||||||
Occupancy of bank premises |
1,694 | 1,546 | 888 | 148 | 658 | |||||||||||
Depreciation and amortization |
1,266 | 1,059 | 751 | 207 | 308 | |||||||||||
Data processing |
729 | 880 | 610 | (151 | ) | 270 | ||||||||||
FDIC assessment fees |
378 | 234 | 383 | 144 | (149 | ) | ||||||||||
Legal fees |
80 | 380 | 630 | (300 | ) | (250 | ) | |||||||||
Other professional fees |
574 | 668 | 560 | (94 | ) | 108 | ||||||||||
Advertising and promotions |
142 | 167 | 232 | (25 | ) | (65 | ) | |||||||||
Utilities and telephone |
295 | 399 | 322 | (104 | ) | 77 | ||||||||||
Other real estate owned expenses and writedowns |
399 | 175 | 40 | 224 | 135 | |||||||||||
Other |
1,723 | 1,459 | 1,379 | 264 | 80 | |||||||||||
| | | | | | | | | | | | | | | | | |
Total noninterest expense |
$ | 16,364 | $ | 16,172 | $ | 12,762 | $ | 192 | $ | 3,410 | ||||||
| | | | | | | | | | | | | | | | | |
| | | | | | | | | | | | | | | | | |
Salaries and employee benefits. Salaries and employee benefits decreased by $121,000 between 2012 and 2013 primarily as a result of an increase in deferred compensation costs in accordance with ASC 310-20, "Nonrefundable Fees and Other Costs." ASC 310-20 requires that direct loan origination costs and related loan origination fees be deferred and the resulting net fee or cost amortized or accreted to interest income as an adjustment of the loan yield. The increase in deferred compensation cost was partially offset by a $450,000 increase in salaries and a $660,000 increase in stock and incentive pay due to additional full-time employees and higher incentive cost related to growth in loans and income. Salaries and employee benefits increased $2.2 million to $9.2 million for 2012, compared to $7.0 million for 2011, primarily due to an increase in full-time employees resulting from the acquisitions of Fidelity Bank and Bank of Las Colinas in 2011. Salaries and employee benefits for the year ended December 31, 2013 included $323,000 in stock-based compensation expense compared to $255,000 and $207,000 recorded for each of the years ended December 31, 2012 and 2011, respectively.
Occupancy of bank premises. Occupancy expenses were $1.7 million, $1.5 million and $888,000 for the years ended December 31, 2013, 2012 and 2011, respectively. The increase of $148,000 or 9.6% for 2013 compared to 2012 was due primarily to increased rent and leasehold improvements related to relocating the corporate office and Preston Center branch in July 2012. The increase of $658,000 or 74.1% for 2012 compared to 2011 was due primarily to the acquisitions of Fidelity Bank and Bank of Las Colinas, which increased our branch locations by four. The bank also opened two additional branches in the fall of 2011.
71
Depreciation and amortization. Depreciation and amortization costs were $1.3 million, $1.1 million, and $751,000 for the years ended December 31, 2013, 2012 and 2011, respectively. This category includes building, leasehold, furniture, fixtures and equipment depreciation totaling $972,000, $764,000 and $535,000 for the years ended December 31, 2013, 2012 and 2011, respectively, as well as intangible asset amortization of $294,000, $295,000 and $216,000 for these same periods, respectively. The increase of $207,000 or 19.5% for 2013 compared to 2012, was due to depreciation from additional furniture and technology equipment purchases required to support our expansion and build the infrastructure needed for growth in the volume of our business. The increase of $308,000 or 41.0% for 2012 compared to 2011 was due to the addition of $6.6 million and $306,000 in premises and equipment we acquired in connection with the acquisitions of Fidelity Bank and Bank of Las Colinas, respectively.
Data processing. Data processing expenses were $729,000, $880,000 and $610,000 for the years ended December 31, 2013, 2012, and 2011, respectively. These expenses decreased $151,000 or 17.2% in 2013 and increased $270,000 or 44.2% from 2011 due to one-time project related expenses in 2012. Partially offsetting the decrease in expense in 2013, was an increase in transaction volumes associated with deposit growth. The increase during 2012 also reflects the full year impact of system usage resulting from the acquisitions of Fidelity Bank and Bank of Las Colinas in 2011.
Legal fees. Legal fees were $80,000, $380,000 and $630,000 for the years ended December 31, 2013, 2012 and 2011, respectively. The decrease in legal fees of $300,000, or 78.9%, for 2013 compared with 2012 was due in part to the completion of our conversion to a state chartered bank in 2012, and no acquisitions in 2013. The decrease of $250,000, or 39.7%, for 2012 compared with 2011 was due primarily to a decrease in legal and regulatory fees related to the completion of our acquisitions of Fidelity Bank and Bank of Las Colinas.
FDIC assessment fees. FDIC assessment fees were $378,000, $234,000 and $383,000 for the years ended December 31, 2013, 2012 and 2011, respectively. The increase of $144,000, or 61.5% for 2013 compared to 2012 was due to an increase in our average consolidated assets and average tangible equity, the two components of the assessment base. The decrease of $149,000 or 38.9%, for 2012 compared to 2011 was due to a change in methodology used by the FDIC to calculate the assessment base, which resulted in lower assessment fees for 2012.
Other professional fees. Other professional fees, which includes audit, loan review, regulatory assessments, and IT professional services, were $574,000, $668,000 and $560,000 for the years ended December 31, 2013, 2012 and 2011, respectively. The decrease of $94,000 or 14.1% for 2013 and the increase of $108,000 or 19.3% from 2011 compared to 2012 was due primarily to the fluctuation in IT support fees related to network infrastructure projects during 2012.
Other real estate owned expense and write-downs. Expenses related to other real estate owned increased $224,000 or 128.0% in 2013 compared to 2012 due to write-downs of $208,000 taken on four properties in 2013 and other miscellaneous expenses relating to the upkeep and maintenance of these types of properties. The increase of $135,000 or 337.5% in 2012 compared to 2011 was due to write-downs taken on four properties in 2012.
Other. Other noninterest income increased $264,000 or 18.1% in 2013 compared to 2012 and increased $80,000 or 5.8% for 2012 compared to 2011 due primarily to business development expenses required to support sales activities in these years.
Income Tax Expense
For the year ended December 31, 2013, income tax expense was $1.7 million compared to $136,000 for the year ended December 31, 2012 and $13,000 for the year ended December 31, 2011. The
72
increase in income tax expense of $1.6 million in 2013 was primarily attributable to the $3.6 million increase in net operating income during 2013. The increase in income tax expense of $123,000 in 2012 was primarily attributable to the $1.5 million increase in net operating income in 2012. Our effective income tax rates for the years ended December 31, 2013, 2012 and 2011 were 34.3%, 8.4% and 10.6%, respectively, compared to the U.S. statutory rate of 34% for each year.
Our effective tax rate for 2013 was essentially the same as the statutory rate because our tax-exempt bank-owned life insurance earnings were approximately equal to our other non-deductible expenses. Our effective tax rate for the year ended December 31, 2012 was affected primarily by tax-exempt bank-owned life insurance earnings and the reversal of our deferred tax asset valuation allowance. Our effective tax rate for the year ended December 31, 2011 was affected primarily by the partial reversal of our deferred tax asset valuation allowance.
Financial Condition
Our total assets increased $45.4 million or 6.8% from $665.0 million as of December 31, 2013 to $710.4 million as of June 30, 2014, and increased $140.9 million or 26.9% from $524.1 million as of December 31, 2012 to December 31, 2013. Our asset growth was due to the successful execution of our strategy of establishing deep relationships in the Dallas metropolitan area resulting in new customer accounts and growth in balances from existing loan and deposit customers.
Loan Portfolio
Our primary source of income is interest on loans to individuals, professionals, small to medium-sized businesses and commercial companies located in the Dallas metropolitan area. Our loan portfolio consists primarily of commercial loans and real estate loans secured by commercial real estate properties located in our primary market area. Our loan portfolio represents the highest yielding component of our earning asset base.
As of June 30, 2014, total loans were $541.0 million, an increase of $45.7 or 9.2% million compared to $495.3 million as of December 31, 2013. Total loans as of December 31, 2013 represented an increase of $97.6 million or 24.5% compared to $397.7 million as of December 31, 2012. These increases were primarily due to our continued penetration in our primary market area. Of these amounts, $6.3 million, $2.1 million and $2.8 million in loans were classified as held for sale as of June 30, 2014, December 31, 2013 and December 31, 2012, respectively.
Total loans as a percentage of deposits were 88.5%, 86.3% and 88.8% as of June 30, 2014 and December 31, 2013 and 2012, respectively. Total loans as a percentage of assets were 76.2%, 74.5% and 75.9% as of June 30, 2014 and December 31, 2013 and 2012, respectively.
The following table summarizes our loan portfolio by type of loan as of the dates indicated:
| |
|
|
As of December 31, | ||||||||||||||||||||||||||||
|---|---|---|---|---|---|---|---|---|---|---|---|---|---|---|---|---|---|---|---|---|---|---|---|---|---|---|---|---|---|---|---|
| |
As of June 30, 2014 (Unaudited) |
||||||||||||||||||||||||||||||
| |
2013 | 2012 | 2011 | 2010 | |||||||||||||||||||||||||||
| |
Amount | Percent | Amount | Percent | Amount | Percent | Amount | Percent | Amount | Percent | |||||||||||||||||||||
| |
(Dollars in thousands) |
||||||||||||||||||||||||||||||
Commercial |
$ | 174,094 | 32.2 | % | $ | 160,823 | 32.5 | % | $ | 123,779 | 31.1 | % | $ | 83,381 | 28.0 | % | $ | 28,369 | 28.1 | % | |||||||||||
Real estate: |
|||||||||||||||||||||||||||||||
Construction and land |
56,818 | 10.5 | 47,643 | 9.6 | 41,497 | 10.4 | 38,291 | 12.9 | 10,603 | 10.5 | |||||||||||||||||||||
Farmland |
11,982 | 2.2 | 11,656 | 2.4 | 6,281 | 1.6 | 5,211 | 1.7 | 1,141 | 1.1 | |||||||||||||||||||||
1 - 4 family residential |
98,030 | 18.1 | 86,908 | 17.5 | 71,875 | 18.1 | 51,356 | 17.2 | 26,431 | 26.2 | |||||||||||||||||||||
Multi-family residential |
14,866 | 2.7 | 11,862 | 2.4 | 12,997 | 3.3 | 14,360 | 4.8 | 2,088 | 2.1 | |||||||||||||||||||||
Nonfarm nonresidential |
180,921 | 33.5 | 171,451 | 34.6 | 134,449 | 33.8 | 92,913 | 31.2 | 28,211 | 28.0 | |||||||||||||||||||||
Consumer |
4,279 | 0.8 | 4,927 | 1.0 | 6,858 | 1.7 | 12,505 | 4.2 | 4,079 | 4.0 | |||||||||||||||||||||
| | | | | | | | | | | | | | | | | | | | | | | | | | | | | | | | |
Total loans held for investment |
$ | 540,990 | 100.0 | % | $ | 495,270 | 100.0 | % | $ | 397,736 | 100.0 | % | $ | 298,017 | 100.0 | % | $ | 100,922 | 100.0 | % | |||||||||||
| | | | | | | | | | | | | | | | | | | | | | | | | | | | | | | | |
| | | | | | | | | | | | | | | | | | | | | | | | | | | | | | | | |
Total loans held for sale |
$ | 6,342 | $ | 2,051 | $ | 2,818 | $ | — | $ | — | |||||||||||||||||||||
73
Commercial loans. Our commercial loans are underwritten after evaluating and understanding the borrower's ability to operate profitably and effectively. These loans are primarily made based on the identified cash flows of the borrower, and secondarily, on the underlying collateral provided by the borrower. Most commercial loans are secured by the assets being financed or other business assets, such as accounts receivable or inventory, and generally include personal guarantees.
Commercial loans increased $13.3 million or 8.3% to $174.1 million as of June 30, 2014 from $160.8 million as of December 31, 2013. The increase in lending activity was due to a relatively robust business environment in our primary market area and the efforts of our relationship-based lenders who leveraged these growth opportunities. Commercial loans as of December 31, 2013 represented an increase of $37.0 million or 29.9% from $123.8 million as of December 31, 2012. The increase in commercial loans during 2013 primarily resulted from our hiring of additional experienced lending officers in 2013.
Construction and land. Our construction and land development loans are comprised of loans to fund construction, land acquisition and land development construction. The properties securing the portfolio are located throughout North Texas and are generally diverse in terms of type.
Construction and land loans increased $9.2 million or 19.3% to $56.8 million as of June 30, 2014 from $47.6 million as of December 31, 2013. The increase in lending activity was due to a robust business environment in our primary market area and the continued efforts of our relationship-based lenders. Construction and land loans as of December 31, 2013 represented an increase of $6.1 million or 14.8% from $41.5 million as of December 31, 2012. The increase in construction and land loans during 2013 primarily resulted from our hiring of additional experienced lending officers in 2013 as well as an increase in market demand.
1-4 family residential. Our 1-4 family residential loans are comprised of loans secured by single family homes, which are both owner-occupied and investor owned. Our 1-4 family residential loans have a relatively small balance spread between many individual borrowers.
1-4 family residential loans increased $11.1 million or 12.8% to $98.0 million as of June 30, 2014 from $86.9 million as of December 31, 2013. This slight increase resulted primarily from an increase in market demand due to growth in the housing market in our primary market area. 1-4 family residential loans as of December 31, 2013 represented an increase of $15.0 million or 20.9% from $71.9 million as of December 31, 2012. The increase in 1-4 family residential loans during 2013 primarily resulted from our hiring of additional experienced lending officers in 2013 as well as an increase in market demand due to an improved housing market in our primary market area.
Nonfarm nonresidential. Our nonfarm nonresidential loans are underwritten primarily based on projected cash flows and, secondarily, as loans secured by real estate. These loans may be more adversely affected by conditions in the real estate markets or in the general economy. The properties securing the portfolio are located throughout north Texas and are generally diverse in terms of type. This diversity helps reduce the exposure to adverse economic events that affect any single industry.
Nonfarm nonresidential loans increased $9.4 million or 5.5% to $180.9 million as of June 30, 2014 from $171.5 million as of December 31, 2013. This slight increase primarily resulted from increased lending activity due to an increase in demand and favorable market conditions. Nonfarm nonresidential loans as of December 31, 2013 represented an increase of $37.1 million or 27.5% from $134.4 million as of December 31, 2012. The increase in nonfarm nonresidential loans during 2013 mainly resulted from our hiring of additional experienced lending officers in 2013 as well as an increase in market demand due to favorable market conditions.
Other loan categories. Other categories of loans included in our loan portfolio include farmland and agricultural loans made to farmers and ranchers relating to their operations, multi-family
74
residential loans and consumer loans. None of these categories of loans represents a significant portion of our total loan portfolio.
The contractual maturity ranges of loans in our loan portfolio and the amount of such loans with fixed and floating interest rates in each maturity range as of date indicated are summarized in the following tables:
| |
As of June 30, 2014 | ||||||||||||
|---|---|---|---|---|---|---|---|---|---|---|---|---|---|
| |
One Year or Less |
One Through Five Years |
After Five Years |
Total | |||||||||
| |
(Dollars in thousands)(Unaudited) |
||||||||||||
Commercial |
$ | 55,646 | $ | 94,541 | $ | 23,907 | $ | 174,094 | |||||
Real estate: |
|||||||||||||
Construction and land |
30,905 | 21,313 | 4,600 | 56,818 | |||||||||
Farmland |
2,042 | 9,375 | 565 | 11,982 | |||||||||
1 - 4 family residential |
8,107 | 58,159 | 31,764 | 98,030 | |||||||||
Multi-family residential |
2,101 | 11,935 | 830 | 14,866 | |||||||||
Nonfarm nonresidential |
15,863 | 123,960 | 41,098 | 180,921 | |||||||||
Consumer |
1,581 | 2,124 | 574 | 4,279 | |||||||||
| | | | | | | | | | | | | | |
Total loans |
$ | 116,245 | $ | 321,407 | $ | 103,338 | $ | 540,990 | |||||
| | | | | | | | | | | | | | |
| | | | | | | | | | | | | | |
Amounts with fixed rates |
$ | 36,934 | $ | 179,496 | $ | 38,666 | $ | 255,096 | |||||
Amounts with floating rates |
$ | 79,311 | $ | 141,911 | $ | 64,672 | $ | 285,894 | |||||
| |
As of December 31, 2013 | ||||||||||||
|---|---|---|---|---|---|---|---|---|---|---|---|---|---|
| |
One Year or Less |
One Through Five Years |
After Five Years |
Total | |||||||||
| |
(Dollars in thousands) |
||||||||||||
Commercial |
$ | 70,021 | $ | 72,156 | $ | 18,646 | $ | 160,823 | |||||
Real estate: |
|||||||||||||
Construction and land |
21,071 | 23,776 | 2,796 | 47,643 | |||||||||
Farmland |
863 | 9,620 | 1,173 | 11,656 | |||||||||
1 - 4 family residential |
10,427 | 45,211 | 31,270 | 86,908 | |||||||||
Multi-family residential |
2,604 | 7,968 | 1,290 | 11,862 | |||||||||
Nonfarm nonresidential |
15,861 | 123,846 | 31,744 | 171,451 | |||||||||
Consumer |
1,803 | 2,656 | 468 | 4,927 | |||||||||
| | | | | | | | | | | | | | |
Total loans |
$ | 122,650 | $ | 285,233 | $ | 87,387 | $ | 495,270 | |||||
| | | | | | | | | | | | | | |
| | | | | | | | | | | | | | |
Amounts with fixed rates |
$ | 36,610 | $ | 158,114 | $ | 29,125 | $ | 223,849 | |||||
Amounts with floating rates |
$ | 86,040 | $ | 127,119 | $ | 58,262 | $ | 271,421 | |||||
Nonperforming Assets
Loans are considered past due if the required principal and interest payments have not been received as of the date such payments were due. Loans are placed on non-accrual status when, in management's opinion, the borrower may be unable to meet payment obligations as they become due, as well as when required by regulatory provisions. Loans may be placed on non-accrual status regardless of whether or not such loans are considered past due. When interest accrual is discontinued, all unpaid accrued interest is reversed. Interest income is subsequently recognized only to the extent cash payments are received in excess of principal due. Loans are returned to accrual status when all the principal and interest amounts contractually due are brought current and future payments are reasonably assured.
75
We have several procedures in place to assist us in maintaining the overall quality of our loan portfolio. We have established underwriting guidelines to be followed by our bankers, and we also monitor our delinquency levels for any negative or adverse trends. There can be no assurance, however, that our loan portfolio will not become subject to increasing pressures from deteriorating borrower credit due to general economic conditions.
We believe our conservative lending approach and focused management of nonperforming assets has resulted in sound asset quality and timely resolution of problem assets. We had $3.0 million in nonperforming assets as of June 30, 2014 compared to $2.9 million and $3.7 million in nonperforming assets as of December 31, 2013 and 2012, respectively. We had $497,000 in nonperforming loans as of June 30, 2014 compared to $1.1 million and $1.3 million as of December 31, 2013 and 2012, respectively.
The following table presents information regarding nonperforming loans at the dates indicated:
| |
|
As of December 31, | ||||||||||||||
|---|---|---|---|---|---|---|---|---|---|---|---|---|---|---|---|---|
| |
As of June 30, 2014 (Unaudited) |
|||||||||||||||
| |
2013 | 2012 | 2011 | 2010 | ||||||||||||
| |
(Dollars in thousands) |
|||||||||||||||
Non-accrual loans(1) |
$ | 107 | $ | 1,117 | $ | 1,211 | $ | — | $ | 364 | ||||||
Accruing loans 90 or more days past due |
390 | 9 | 93 | 153 | — | |||||||||||
| | | | | | | | | | | | | | | | | |
Total nonperforming loans |
497 | 1,126 | 1,304 | 153 | 364 | |||||||||||
| | | | | | | | | | | | | | | | | |
Other real estate owned: |
||||||||||||||||
Commercial real estate, construction, land and land development |
2,494 | 1,797 | 2,438 | 729 | 319 | |||||||||||
Residential real estate |
— | — | — | — | — | |||||||||||
| | | | | | | | | | | | | | | | | |
Total other real estate owned |
2,494 | 1,797 | 2,438 | 729 | 319 | |||||||||||
| | | | | | | | | | | | | | | | | |
Total nonperforming assets |
$ | 2,991 | $ | 2,923 | $ | 3,742 | $ | 882 | $ | 683 | ||||||
| | | | | | | | | | | | | | | | | |
| | | | | | | | | | | | | | | | | |
Restructured loans—non-accrual |
$ | 541 | $ | 1,611 | $ | 1,525 | $ | — | $ | — | ||||||
Restructured loans—accruing |
$ | 1,271 | $ | 2,465 | $ | 1,156 | $ | — | $ | — | ||||||
Ratio of nonperforming loans to total loans |
0.09 | % | 0.23 | % | 0.33 | % | 0.05 | % | 0.36 | % | ||||||
Ratio of nonperforming assets to total assets |
0.42 | % | 0.44 | % | 0.71 | % | 0.20 | % | 0.35 | % | ||||||
- (1)
- Does not include purchased credit impaired loan of $541,000, $569,000 and $644,000 as of June 30, 2014, December 31, 2013 and December 31, 2012, respectively.
| |
|
As of December 31, | ||||||||||||||
|---|---|---|---|---|---|---|---|---|---|---|---|---|---|---|---|---|
| |
As of June 30, 2014 (Unaudited) |
|||||||||||||||
| |
2013 | 2012 | 2011 | 2010 | ||||||||||||
| |
(Dollars in thousands) |
|||||||||||||||
Non-accrual loans by category: |
||||||||||||||||
Real estate: |
||||||||||||||||
Construction and land |
$ | 76 | $ | 76 | $ | — | $ | — | $ | — | ||||||
Farmland |
— | — | — | — | — | |||||||||||
1 - 4 family residential |
— | 1,041 | 879 | — | — | |||||||||||
Multi-family residential |
— | — | — | — | — | |||||||||||
Nonfarm residential |
— | — | 331 | — | — | |||||||||||
Commercial |
30 | — | — | — | — | |||||||||||
Consumer |
— | — | 1 | — | — | |||||||||||
| | | | | | | | | | | | | | | | | |
Total |
$ | 106 | $ | 1,117 | $ | 1,211 | $ | — | $ | 364 | (1) | |||||
| | | | | | | | | | | | | | | | | |
| | | | | | | | | | | | | | | | | |
- (1)
- Classification by category was not available for 2010 data.
76
Potential Problem Loans
From a credit risk standpoint, we classify loans in one of four categories: pass, special mention, substandard or doubtful. Loans classified as loss are charged-off. The classifications of loans reflect a judgment about the risks of default and loss associated with the loan. We review the ratings on credits monthly. Ratings are adjusted to reflect the degree of risk and loss that is felt to be inherent in each credit as of each monthly reporting period. Our methodology is structured so that specific allocations are increased in accordance with deterioration in credit quality (and a corresponding increase in risk and loss) or decreased in accordance with improvement in credit quality (and a corresponding decrease in risk and loss).
Credits rated special mention show clear signs of financial weaknesses or deterioration in credit worthiness, however, such concerns are not so pronounced that we generally expect to experience significant loss within the short-term. Such credits typically maintain the ability to perform within standard credit terms and credit exposure is not as prominent as credits with a lower rating.
Credits rated substandard are those in which the normal repayment of principal and interest may be, or has been, jeopardized by reason of adverse trends or developments of a financial, managerial, economic or political nature, or important weaknesses which exist in collateral. A protracted workout on these credits is a distinct possibility. Prompt corrective action is therefore required to strengthen our position, and/or to reduce exposure and to assure that adequate remedial measures are taken by the borrower. Credit exposure becomes more likely in such credits and a serious evaluation of the secondary support to the credit is performed.
The following table summarizes our internal ratings of our loans, including purchase credit impaired loans, as of the dates indicated.
| |
As of June 30, 2014 | |||||||||||||||
|---|---|---|---|---|---|---|---|---|---|---|---|---|---|---|---|---|
| |
Pass | Special Mention | Substandard | Doubtful | Total | |||||||||||
| |
(Dollars in thousands) (Unaudited) |
|||||||||||||||
Real estate: |
||||||||||||||||
Construction |
$ | 56,201 | $ | — | $ | 617 | $ | — | $ | 56,818 | ||||||
Farmland |
11,982 | — | — | — | 11,982 | |||||||||||
1 - 4 family residential |
97,819 | — | 211 | — | 98,030 | |||||||||||
Multi-family residential |
14,866 | — | — | — | 14,866 | |||||||||||
Nonfarm nonresidential |
180,546 | — | 375 | — | 180,921 | |||||||||||
Commercial |
171,625 | 975 | 1,464 | 30 | 174,094 | |||||||||||
Consumer |
4,239 | — | 40 | — | 4,279 | |||||||||||
| | | | | | | | | | | | | | | | | |
Total |
$ | 537,278 | $ | 975 | $ | 2,707 | $ | 30 | $ | 540,990 | ||||||
| | | | | | | | | | | | | | | | | |
| | | | | | | | | | | | | | | | | |
| |
As of December 31, 2013 | |||||||||||||||
|---|---|---|---|---|---|---|---|---|---|---|---|---|---|---|---|---|
| |
Pass | Special Mention | Substandard | Doubtful | Total | |||||||||||
| |
(Dollars in thousands) |
|||||||||||||||
Real estate: |
||||||||||||||||
Construction |
$ | 46,998 | $ | — | $ | 645 | $ | — | $ | 47,643 | ||||||
Farmland |
11,656 | — | — | — | 11,656 | |||||||||||
1 - 4 family residential |
85,649 | — | 1,259 | — | 86,908 | |||||||||||
Multi-family residential |
11,862 | — | — | — | 11,862 | |||||||||||
Nonfarm nonresidential |
171,371 | — | 80 | — | 171,451 | |||||||||||
Commercial |
158,919 | 731 | 1,173 | — | 160,823 | |||||||||||
Consumer |
4,878 | 7 | 42 | — | 4,927 | |||||||||||
| | | | | | | | | | | | | | | | | |
Total |
$ | 491,333 | $ | 738 | $ | 3,199 | $ | — | $ | 495,270 | ||||||
| | | | | | | | | | | | | | | | | |
| | | | | | | | | | | | | | | | | |
77
| |
As of December 31, 2012 | |||||||||||||||
|---|---|---|---|---|---|---|---|---|---|---|---|---|---|---|---|---|
| |
Pass | Special Mention | Substandard | Doubtful | Total | |||||||||||
| |
(Dollars in thousands) |
|||||||||||||||
Real estate: |
||||||||||||||||
Construction |
$ | 39,349 | $ | — | $ | 2,148 | $ | — | $ | 41,497 | ||||||
Farmland |
6,281 | — | — | — | 6,281 | |||||||||||
1 - 4 family residential |
71,821 | — | 54 | — | 71,875 | |||||||||||
Multi-family residential |
12,997 | — | — | — | 12,997 | |||||||||||
Nonfarm nonresidential |
132,330 | 1,787 | 332 | — | 134,449 | |||||||||||
Commercial |
123,407 | 201 | 171 | — | 123,779 | |||||||||||
Consumer |
6,570 | 14 | 274 | — | 6,858 | |||||||||||
| | | | | | | | | | | | | | | | | |
Total |
$ | 392,755 | $ | 2,002 | $ | 2,979 | $ | — | $ | 397,736 | ||||||
| | | | | | | | | | | | | | | | | |
| | | | | | | | | | | | | | | | | |
Allowance for loan losses
We maintain an allowance for loan losses that represents management's best estimate of the loan losses and risks inherent in the loan portfolio. In determining the allowance for loan losses, we estimate losses on specific loans, or groups of loans, where the probable loss can be identified and reasonably determined. The balance of the allowance for loan losses is based on internally assigned risk classifications of loans, historical loan loss rates, changes in the nature of the loan portfolio, overall portfolio quality, industry concentrations, delinquency trends, current economic factors and the estimated impact of current economic conditions on certain historical loan loss rates. For additional discussion of our methodology, please refer to "—Critical Accounting Policies—Allowance for loan losses."
In connection with our review of the loan portfolio, we consider risk elements attributable to particular loan types or categories in assessing the quality of individual loans. Some of the risk elements we consider include:
- •
- for commercial and industrial loans, the operating results of the commercial, industrial or professional enterprise, the
borrower's business, professional and financial ability and expertise, the specific risks and volatility of income and operating results typical for businesses in that category and the value, nature
and marketability of collateral;
- •
- for commercial mortgage loans and multifamily residential loans, the debt service coverage ratio (income from the
property in excess of operating expenses compared to loan payment requirements), operating results of the owner in the case of owner occupied properties, the loan to value ratio, the age and condition
of the collateral and the volatility of income, property value and future operating results typical of properties of that type;
- •
- for 1-4 family residential mortgage loans, the borrower's ability to repay the loan, including a consideration of the
debt to income ratio and employment and income stability, the loan to value ratio, and the age, condition and marketability of the collateral; and
- •
- for construction, land development and other land loans, the perceived feasibility of the project including the ability to sell developed lots or improvements constructed for resale or the ability to lease property constructed for lease, the quality and nature of contracts for presale or prelease, if any, experience and ability of the developer and loan to value ratio.
As of June 30, 2014, the allowance for loan losses totaled $5.5 million or 1.02% of total loans. As of December 31, 2013, the allowance for loan losses totaled $5.0 million or 1.01% of total loans. As of December 31, 2012, the allowance for loan losses totaled $3.2 million or 0.81% of total loans. Ending balances for the purchase discount related to non-impaired acquired loans were $434,000, $667,000 and $1.1 million as of June 30, 2014, December 31, 2013 and 2012, respectively. Purchase credit impaired
78
loans are not considered nonperforming loans. Purchase credit impaired loans had no purchase discount outstanding as of June 30, 2014 and December 31, 2013 and $250,000 of non-accretable purchase discounts outstanding as of December 31, 2012.
The following table presents, as of and for the periods indicated, an analysis of the allowance for loan losses and other related data:
| |
For the Six Months Ended June 30, 2014 (Unaudited) |
For the Years Ended December 31, | ||||||||||||||
|---|---|---|---|---|---|---|---|---|---|---|---|---|---|---|---|---|
| |
2013 | 2012 | 2011 | 2010 | ||||||||||||
| |
(Dollars in thousands) |
|||||||||||||||
Average loans outstanding(1) |
$ | 508,836 | $ | 433,612 | $ | 342,130 | $ | 217,064 | $ | 91,948 | ||||||
| | | | | | | | | | | | | | | | | |
| | | | | | | | | | | | | | | | | |
Gross loans outstanding at end of period(1) |
$ | 540,990 | $ | 495,270 | $ | 397,736 | $ | 298,017 | $ | 100,922 | ||||||
| | | | | | | | | | | | | | | | | |
| | | | | | | | | | | | | | | | | |
Allowance for loan losses at beginning of period |
$ | 5,018 | $ | 3,238 | $ | 1,012 | $ | 166 | $ | — | ||||||
Provision for loan losses |
677 | 1,883 | 2,953 | 960 | 166 | |||||||||||
Charge-offs: |
||||||||||||||||
Real estate: |
||||||||||||||||
Construction, land and farmland |
(28 | ) | — | — | — | — | ||||||||||
Residential |
(30 | ) | (85 | ) | (265 | ) | (54 | ) | — | |||||||
Nonfarm non-residential |
— | — | (231 | ) | — | — | ||||||||||
Commercial |
(146 | ) | (110 | ) | (172 | ) | (77 | ) | — | |||||||
Consumer |
— | (45 | ) | (133 | ) | (18 | ) | — | ||||||||
| | | | | | | | | | | | | | | | | |
Total charge-offs |
(204 | ) | (240 | ) | (801 | ) | (149 | ) | ||||||||
Recoveries: |
||||||||||||||||
Real estate: |
||||||||||||||||
Construction, land and farmland |
— | — | — | — | — | |||||||||||
Residential |
— | 60 | — | 22 | — | |||||||||||
Nonfarm non-residential |
— | — | — | — | — | |||||||||||
Commercial |
23 | 32 | 61 | 3 | — | |||||||||||
Consumer |
2 | 45 | 13 | 10 | — | |||||||||||
| | | | | | | | | | | | | | | | | |
Total recoveries |
25 | 137 | 74 | 35 | — | |||||||||||
Net charge-offs |
(179 | ) | (103 | ) | (727 | ) | (114 | ) | — | |||||||
| | | | | | | | | | | | | | | | | |
Allowance for loan losses at end of period |
$ | 5,516 | $ | 5,018 | $ | 3,238 | $ | 1,012 | $ | 166 | ||||||
| | | | | | | | | | | | | | | | | |
| | | | | | | | | | | | | | | | | |
Ratio of allowance to end of period loans |
1.02 | % | 1.01 | % | 0.81 | % | 0.34 | % | 0.16 | % | ||||||
Ratio of net charge-offs to average loans |
0.04 | % | 0.02 | % | 0.21 | % | 0.05 | % | — | |||||||
- (1)
- Excluding loans held for sale.
We believe the successful execution of our growth strategy through key acquisitions and organic growth is demonstrated by the upward trend in loan balances from December 31, 2010 to June 30, 2014. Loan balances increased from $100.9 million as of December 31, 2010, to $541.0 million as of June 30, 2014. Our provision has increased consistently with the growth in our loan portfolio during the same period. Further, charge-offs have been immaterial, representing less than 0.25% of total loan balances during the same period.
79
Although we believe that we have established our allowance for loan losses in accordance with accounting principles generally accepted in the United States and that the allowance for loan losses was adequate to provide for known and inherent losses in the portfolio at all times shown above, future provisions will be subject to ongoing evaluations of the risks in our loan portfolio. If we experience economic declines or if asset quality deteriorates, material additional provisions could be required.
The following table shows the allocation of the allowance for loan losses among our loan categories and certain other information as of the dates indicated. The allocation of the allowance for loan losses as shown in the table should neither be interpreted as an indication of future charge-offs, nor as an indication that charge-offs in future periods will necessarily occur in these amounts or in the indicated proportions. The total allowance is available to absorb losses from any loan category.
| |
|
|
As of December 31, | |
|
|
|
||||||||||||||||||||||||
|---|---|---|---|---|---|---|---|---|---|---|---|---|---|---|---|---|---|---|---|---|---|---|---|---|---|---|---|---|---|---|---|
| |
As of June 30, 2014 (Unaudited) |
|
|
|
|
||||||||||||||||||||||||||
| |
2013 | 2012 | 2011 | 2010 | |||||||||||||||||||||||||||
| |
Amount | Percent to Total |
Amount | Percent to Total |
Amount | Percent to Total |
Amount | Percent to Total |
Amount | Percent to Total |
|||||||||||||||||||||
| |
(Dollars in thousands) |
||||||||||||||||||||||||||||||
Real estate: |
|||||||||||||||||||||||||||||||
Construction and land |
$ | 701 | 12.7 | % | $ | 660 | 13.2 | % | $ | 455 | 14.1 | % | n/a | n/a | n/a | n/a | |||||||||||||||
Farmland |
— |
— |
— |
— |
— |
— |
n/a |
n/a |
n/a |
n/a |
|||||||||||||||||||||
1 - 4 family residential |
1,062 | 19.3 | 861 | 17.1 | 672 | 20.8 | n/a | n/a | n/a | n/a | |||||||||||||||||||||
Multi-family residential |
138 | 2.5 | 109 | 2.2 | 83 | 2.6 | n/a | n/a | n/a | n/a | |||||||||||||||||||||
Nonfarm nonresidential |
1,780 | 32.3 | 1,726 | 34.4 | 1,028 | 31.7 | n/a | n/a | n/a | n/a | |||||||||||||||||||||
| | | | | | | | | | | | | | | | | | | | | | | | | | | | | | | | |
Total real estate |
3,681 | 66.8 | 3,356 | 66.9 | 2,238 | 69.2 | $ | 660 | (1) | 65.2 | % | n/a | n/a | ||||||||||||||||||
Commercial |
1,772 |
32.1 |
1,585 |
31.6 |
947 |
29.2 |
317 |
31.3 |
n/a |
n/a |
|||||||||||||||||||||
Consumer |
63 | 1.1 | 77 | 1.5 | 53 | 1.6 | 35 | 3.5 | n/a | n/a | |||||||||||||||||||||
| | | | | | | | | | | | | | | | | | | | | | | | | | | | | | | | |
Total allowance for loan losses |
$ | 5,516 | 100.0 | % | $ | 5,018 | 100.0 | % | $ | 3,238 | 100.0 | % | $ | 1,012 | 100.0 | % | $ | 166 | 100.0 | % | |||||||||||
| | | | | | | | | | | | | | | | | | | | | | | | | | | | | | | | |
| | | | | | | | | | | | | | | | | | | | | | | | | | | | | | | | |
- (1)
- In 2011 we did not break out real estate loans by category.
Securities
We use our securities portfolio to provide a source of liquidity, provide an appropriate return on funds invested, manage interest rate risk, meet collateral requirements and meet regulatory capital requirements. As of June 30, 2014, the carrying amount of investment securities totaled $50.5 million, an increase of $4.9 million or 10.8% compared to $45.6 million as of December 31, 2013. The balance in our securities portfolio as of December 31, 2013 represented an increase of $16.1 million or 54.4% compared to $29.5 million as of December 31, 2012. The increases in our investment securities were funded primarily from increases in deposits. Securities represented 7.1%, 6.9% and 5.6% of total assets as of June 30, 2014 and December 31, 2013 and 2012, respectively.
80
Our investment portfolio consists entirely of securities classified as available for sale. As a result, the carrying values of our investment securities are adjusted for unrealized gain or loss, and any gain or loss is reported on an after-tax basis as a component of other comprehensive income in stockholders' equity. The following table summarizes the amortized cost and estimated fair value of our investment securities as of the dates shown:
| |
As of June 30, 2014 | ||||||||||||
|---|---|---|---|---|---|---|---|---|---|---|---|---|---|
| |
Amortized Cost | Gross Unrealized Gains |
Gross Unrealized Losses |
Fair Value | |||||||||
| |
(Dollars in thousands) (Unaudited) |
||||||||||||
U.S. government agencies |
$ | 2,000 | $ | — | $ | 71 | $ | 1,929 | |||||
Corporate bonds |
500 | 3 | — | 503 | |||||||||
Municipal securities |
949 | 32 | — | 981 | |||||||||
Mortgage-backed securities |
32,248 | 283 | 97 | 32,434 | |||||||||
Collateralized mortgage obligations |
13,305 | 159 | 42 | 13,422 | |||||||||
Asset-backed securities |
1,251 | 27 | — | 1,278 | |||||||||
| | | | | | | | | | | | | | |
Total |
$ | 50,253 | $ | 504 | $ | 210 | $ | 50,547 | |||||
| | | | | | | | | | | | | | |
| | | | | | | | | | | | | | |
| |
As of December 31, 2013 | ||||||||||||
|---|---|---|---|---|---|---|---|---|---|---|---|---|---|
| |
Amortized Cost | Gross Unrealized Gains |
Gross Unrealized Losses |
Fair Value | |||||||||
| |
(Dollars in thousands) |
||||||||||||
U.S. government agencies |
$ | 2,019 | $ | — | $ | 95 | $ | 1,924 | |||||
Corporate bonds |
1,445 | 35 | — | 1,480 | |||||||||
Municipal securities |
934 | 24 | — | 958 | |||||||||
Mortgage-backed securities |
24,898 | 220 | 187 | 24,931 | |||||||||
Collateralized mortgage obligations |
14,898 | 158 | 141 | 14,915 | |||||||||
Asset-backed securities |
1,370 | 26 | — | 1,396 | |||||||||
| | | | | | | | | | | | | | |
Total |
$ | 45,564 | $ | 463 | $ | 423 | $ | 45,604 | |||||
| | | | | | | | | | | | | | |
| | | | | | | | | | | | | | |
| |
As of December 31, 2012 | ||||||||||||
|---|---|---|---|---|---|---|---|---|---|---|---|---|---|
| |
Amortized Cost | Gross Unrealized Gains |
Gross Unrealized Losses |
Fair Value | |||||||||
| |
(Dollars in thousands) |
||||||||||||
U.S. government agencies |
$ | — | $ | — | $ | — | $ | — | |||||
Corporate bonds |
1,435 | 31 | 4 | 1,462 | |||||||||
Municipal securities |
904 | 40 | — | 944 | |||||||||
Mortgage-backed securities |
15,006 | 448 | — | 15,454 | |||||||||
Collateralized mortgage obligations |
9,867 | 193 | 15 | 10,045 | |||||||||
Asset-backed securities |
1,600 | 33 | — | 1,633 | |||||||||
| | | | | | | | | | | | | | |
Total |
$ | 28,812 | $ | 745 | $ | 19 | $ | 29,538 | |||||
| | | | | | | | | | | | | | |
| | | | | | | | | | | | | | |
All of our mortgage-backed securities are agency securities. We do not hold any Fannie Mae or Freddie Mac preferred stock, corporate equity, collateralized debt obligations, collateralized loan obligations, structured investment vehicles, private label collateralized mortgage obligations, subprime, Alt-A, or second lien elements in our investment portfolio. As of June 30, 2014, our investment portfolio did not contain any securities that are directly backed by subprime or Alt-A mortgages.
81
Management evaluates securities for other-than-temporary impairment, at least on a quarterly basis, and more frequently when economic or market conditions warrant such an evaluation.
The following table sets forth the fair value, maturities and approximated weighted average yield based on estimated annual income divided by the average amortized cost of our securities portfolio as of the dates indicated. The contractual maturity of a mortgage-backed security is the date at which the last underlying mortgage matures.
| |
As of June 30, 2014 | ||||||||||||||||||||||||||||||
|---|---|---|---|---|---|---|---|---|---|---|---|---|---|---|---|---|---|---|---|---|---|---|---|---|---|---|---|---|---|---|---|
| |
Within One Year | After One Year but Within Five Years |
After Five Years but Within Ten Years |
After Ten Years |
Total | ||||||||||||||||||||||||||
| |
Amount | Yield | Amount | Yield | Amount | Yield | Amount | Yield | Total | Yield | |||||||||||||||||||||
| |
(Dollars in thousands) (Unaudited) |
||||||||||||||||||||||||||||||
U.S. government agencies |
$ | — | — | % | $ | — | — | % | $ | 1,929 | 1.67 | % | $ | — | — | % | $ | 1,929 | 1.67 | % | |||||||||||
Corporate bonds/Certificates of deposit |
503 | 3.01 | — | — | — | — | — | — | 503 | 3.01 | |||||||||||||||||||||
Municipal securities |
— | — | 981 | 3.25 | — | — | — | — | 981 | 3.25 | |||||||||||||||||||||
Mortgage-backed securities |
— | — | 29,779 | 1.72 | 2,565 | 0.99 | 90 | 1.60 | 32,434 | 1.66 | |||||||||||||||||||||
Collateralized mortgage obligations |
223 | 1.77 | 8,975 | 2.50 | 3,324 | 2.22 | 900 | 0.49 | 13,422 | 2.28 | |||||||||||||||||||||
Asset-backed securities |
— | — | 298 | 0.47 | 980 | 1.01 | — | — | 1,278 | 0.88 | |||||||||||||||||||||
| | | | | | | | | | | | | | | | | | | | | | | | | | | | | | | | |
Total |
$ | 726 | 2.63 | % | $ | 40,033 | 1.92 | % | $ | 8,798 | 1.61 | % | $ | 990 | 0.59 | % | $ | 50,547 | 1.85 | % | |||||||||||
| | | | | | | | | | | | | | | | | | | | | | | | | | | | | | | | |
| | | | | | | | | | | | | | | | | | | | | | | | | | | | | | | | |
| |
As of December 31, 2013 | ||||||||||||||||||||||||||||||
|---|---|---|---|---|---|---|---|---|---|---|---|---|---|---|---|---|---|---|---|---|---|---|---|---|---|---|---|---|---|---|---|
| |
Within One Year | After One Year but Within Five Years |
After Five Years but Within Ten Years |
After Ten Years |
Total | ||||||||||||||||||||||||||
| |
Amount | Yield | Amount | Yield | Amount | Yield | Amount | Yield | Total | Yield | |||||||||||||||||||||
| |
(Dollars in thousands) |
||||||||||||||||||||||||||||||
U.S. government agencies |
$ | — | — | % | $ | — | — | % | $ | 1,924 | 1.57 | % | $ | — | — | % | $ | 1,924 | 1.57 | % | |||||||||||
Corporate bonds/Certificates of deposit |
— | — | 1,480 | 2.17 | — | — | — | — | 1,480 | 2.17 | |||||||||||||||||||||
Municipal securities |
— | — | 958 | 3.25 | — | — | — | — | 958 | 3.25 | |||||||||||||||||||||
Mortgage-backed securities |
— | — | 20,794 | 1.83 | 4,046 | 1.21 | 91 | 1.60 | 24,931 | 1.73 | |||||||||||||||||||||
Collateralized mortgage obligations |
719 | 1.18 | 9,863 | 2.32 | 3,411 | 2.24 | 922 | 0.50 | 14,915 | 2.15 | |||||||||||||||||||||
Asset-backed securities |
— | — | 418 | 0.46 | 978 | 1.00 | — | — | 1,396 | 0.83 | |||||||||||||||||||||
| | | | | | | | | | | | | | | | | | | | | | | | | | | | | | | | |
Total |
$ | 719 | 1.18 | % | $ | 33,513 | 2.01 | % | $ | 10,359 | 1.60 | % | $ | 1,013 | 0.60 | % | $ | 45,604 | 1.88 | % | |||||||||||
| | | | | | | | | | | | | | | | | | | | | | | | | | | | | | | | |
| | | | | | | | | | | | | | | | | | | | | | | | | | | | | | | | |
The contractual maturity of mortgage-backed securities, collateralized mortgage obligations and asset backed securities is not a reliable indicator of their expected life because borrowers have the right to prepay their obligations at any time. Mortgage-backed securities, collateralized mortgage obligations and asset-backed securities are typically issued with stated principal amounts and are backed by pools of mortgage loans and other loans with varying maturities. The term of the underlying mortgages and loans may vary significantly due to the ability of a borrower to pre-pay. Monthly pay downs on mortgage-backed securities tend to cause the average life of the securities to be much different than the stated contractual maturity. During a period of increasing interest rates, fixed rate mortgage-backed securities do not tend to experience heavy prepayments of principal and consequently, the average life of this security will be lengthened. If interest rates begin to fall, prepayments may increase, thereby shortening the estimated life of this security. The weighted average life of our investment portfolio was 3.72 years with an estimated effective duration of 2.17 years as of June 30, 2014.
As of June 30, 2014 and December 31, 2013 and 2012, we did not own securities of any one issuer for which aggregate adjusted cost exceeded 10.0% of the consolidated stockholders' equity as of such respective dates.
82
The average yield of the securities portfolio was 1.65% during 2013 compared to 1.90% during 2012. The decrease in average yield during 2013 compared to 2012 was primarily due to the reinvestment of funds at lower rates in 2013 and the speed of prepayments on our mortgage-backed securities and collateralized mortgage obligation portfolios.
Deposits
We offer a variety of deposit accounts having a wide range of interest rates and terms including demand, savings, money market and time accounts. We rely primarily on competitive pricing policies, convenient locations and personalized service to attract and retain these deposits.
Total deposits as of June 30, 2014 were $611.2 million, an increase of $37.3 million or 6.5% compared to $573.9 million as of December 31, 2013 due primarily to increases of $17.2 million and $17.0 million in our noninterest-bearing deposit accounts and money market accounts, respectively. Total deposits as of December 31, 2013 were $573.9 million, an increase of $126.0 million or 28.1% compared to December 31, 2012 due primarily to increases of $48.5 million and $61.0 million in our noninterest-bearing deposit accounts and money market accounts, respectively. We believe our deposit growth was primarily due to our continued penetration in our primary market area and the increase in commercial lending relationships for which we also seek deposit balances.
Noninterest-bearing deposits as of June 30, 2014 were $236.2 million compared to $219.0 million as of December 31, 2013, an increase of $17.2 million or 7.9%. The December 31, 2013 balance for noninterest-bearing deposits represented an increase of $48.5 million or 28.4% compared to $170.5 million as of December 31, 2012.
Interest-bearing checking account balances as of June 30, 2014 were $40.1 million compared to $40.2 million as of December 31, 2013, a decrease of $98,000 or 0.24%. The December 31, 2013 balance for interest-bearing checking accounts represented an increase of $5.1 million or 15.0% compared to $35.0 million as of December 31, 2012.
Average deposits for the six months ended June 30, 2014 were $574.0 million, an increase of $74.4 million or 14.9% over the full year average for the year ended December 31, 2013 of $499.6 million. Average deposits grew $101.2 million or 25.4% from $398.4 million for the year ended December 31, 2012. The average rate paid on total interest-bearing deposits decreased consistently over this period from 0.74% for the year ended December 31, 2012 to 0.71% for the year ended December 31, 2013 to 0.65% for the six months ended June 30, 2014. The decreases in average rates were driven primarily by strategic reductions in limited access money market and certificate of deposit pricing during this time period. In addition, the continued growth of noninterest-bearing demand accounts resulted in further reductions to the cost of deposits from 0.48% for the year ended December 31, 2012 to 0.44% for the year ended December 31, 2013 and 0.40% for the six months ended June 30, 2014.
83
The following table presents the daily average balances and weighted average rates paid on deposits for the periods indicated:
| |
For the Six Months Ended June 30, 2014 (Unaudited) |
For the Years Ended December 31, | |||||||||||||||||
|---|---|---|---|---|---|---|---|---|---|---|---|---|---|---|---|---|---|---|---|
| |
2013 | 2012 | |||||||||||||||||
| |
Average Balance |
Average Rate |
Average Balance |
Average Rate |
Average Balance |
Average Rate |
|||||||||||||
| |
(Dollars in thousands) |
||||||||||||||||||
Interest-bearing demand accounts |
$ | 39,005 | 0.26 | % | $ | 35,021 | 0.25 | % | $ | 28,543 | 0.28 | % | |||||||
Savings accounts |
5,150 | 0.10 | 4,767 | 0.10 | 3,909 | 0.10 | |||||||||||||
Limited access money market accounts |
210,298 | 0.59 | 174,878 | 0.62 | 138,138 | 0.62 | |||||||||||||
Certificates and other time deposits > $100k |
85,610 | 0.96 | 79,278 | 1.01 | 72,097 | 1.08 | |||||||||||||
Certificates and other time deposits < $100k |
17,258 | 0.91 | 17,218 | 1.07 | 16,591 | 1.04 | |||||||||||||
| | | | | | | | | | | | | | | | | | | | |
Total interest-bearing deposits |
357,321 | 0.65 | 311,162 | 0.71 | 259,278 | 0.74 | |||||||||||||
| | | | | | | | | | | | | | | | | | | | |
Noninterest-bearing demand accounts |
216,721 | 188,405 | 139,128 | ||||||||||||||||
| | | | | | | | | | | | | | | | | | | | |
Total deposits |
$ | 574,042 | 0.40 | % | $ | 499,567 | 0.44 | % | $ | 398,406 | 0.48 | % | |||||||
| | | | | | | | | | | | | | | | | | | | |
| | | | | | | | | | | | | | | | | | | | |
Our ratio of average noninterest-bearing deposits to average total deposits for the six months ended June 30, 2014 and the years ended December 31, 2013 and 2012 was 38%, 38% and 35%, respectively.
Factors affecting the cost of funding our interest-bearing assets include the volume of noninterest and interest-bearing deposits, changes in market interest rates and economic conditions in our target markets and their impact on interest paid on our deposits, as well as the ongoing execution of our balance sheet management strategy. As a result of our experienced bankers successfully acquiring new deposit-rich commercial lending relationships, we experienced significant year over year organic deposit growth of 28.1% in 2013, 22.8% in 2012 and 21.2% in 2011, while at the same time we reduced our overall cost of funds. Cost of funds is calculated as total interest expense divided by total deposits plus total borrowings. Our cost of funds was 0.44% in 2013, 0.56% in 2012 and 0.77% in 2011. This reduction in our cost of funds was the result of our focus on acquisition of noninterest-bearing demand deposits through organic growth and bank acquisitions. Noninterest-bearing demand deposits as a percentage of total deposits grew to 38.2% in 2013, and 38.1% in 2012, compared to 30.9% in 2011. Average rates on interest-bearing deposits were 0.71% in 2013, 0.74% in 2012 and 0.88% in 2011.
The following table sets forth the amount of our certificates of deposit that are $100,000 or greater by time remaining until maturity:
| |
|
As of December 31, | ||||||||
|---|---|---|---|---|---|---|---|---|---|---|
| |
As of June 30, 2014 (Unaudited) |
|||||||||
| |
2013 | 2012 | ||||||||
| |
(Dollars in thousands) |
|||||||||
1 year or less |
$ | 68,233 | $ | 65,069 | $ | 63,269 | ||||
More than 1 year but less than 3 years |
11,973 | 12,226 | 6,181 | |||||||
3 years or more but less than 5 years |
4,567 | 4,185 | 2,296 | |||||||
5 years or more |
— | — | — | |||||||
| | | | | | | | | | | |
Total |
$ | 84,773 | $ | 81,480 | $ | 71,746 | ||||
| | | | | | | | | | | |
| | | | | | | | | | | |
84
Borrowings
We utilize short-term and long-term borrowings to supplement deposits to fund our lending and investment activities, each of which is discussed below.
Federal Home Loan Bank (FHLB) advances. The FHLB allows us to borrow on a blanket floating lien status collateralized by certain securities and loans. As of June 30, 2014 and December 31, 2013 and 2012, total borrowing capacity of $249.6 million, $227.6 million and $22.6 million, respectively, was available under this arrangement and $15.0 million, $15.0 million and $10.0 million, respectively, was outstanding with an average interest rate of 0.80% as of June 30, 2014, 0.80% as of December 31, 2013 and 3.13% as of December 31, 2012. Our current FHLB advances mature within five years. We utilize these borrowings to meet liquidity needs and to fund certain fixed rate loans in our portfolio.
The following table presents our FHLB borrowings at the dates indicated. Other than FHLB borrowings, we had no other short-term borrowings at the dates indicated.
| |
FHLB Advances |
|||
|---|---|---|---|---|
| |
(Dollars in Thousands) |
|||
June 30, 2014 |
||||
Amount outstanding at quarter-end |
$ | 15,000 | ||
Weighted average interest rate at quarter-end |
0.80 | % | ||
Maximum month-end balance during the quarter |
15,000 | |||
Average balance outstanding during the quarter |
15,000 | |||
Weighted average interest rate during the quarter |
0.80 | % | ||
December 31, 2013 |
||||
Amount outstanding at year-end |
$ | 15,000 | ||
Weighted average interest rate at year-end |
0.80 | % | ||
Maximum month-end balance during the year |
15,000 | |||
Average balance outstanding during the year |
14,932 | |||
Weighted average interest rate during the year |
1.28 | % | ||
December 31, 2012 |
||||
Amount outstanding at year-end |
$ | 10,000 | ||
Weighted average interest rate at year-end |
3.13 | % | ||
Maximum month-end balance during the year |
10,000 | |||
Average balance outstanding during the year |
10,000 | |||
Weighted average interest rate during the year |
3.13 | % | ||
Federal Reserve Bank of Dallas. The Federal Reserve Bank of Dallas has an available borrower in custody arrangement, which allows us to borrow on a collateralized basis. Certain commercial and consumer loans are pledged under this arrangement. We maintain this borrowing arrangement to meet liquidity needs pursuant to our contingency funding plan. As of June 30, 2014 and December 31, 2013 and 2012, $131.9 million, $127.1 million and $83.3 million, respectively, were available under this arrangement. As of June 30, 2014, approximately $162.9 million in commercial loans were pledged as collateral. As of June 30, 2014 and December 31, 2013 and 2012, no borrowings were outstanding under this arrangement.
Junior subordinated debentures. In connection with the acquisition of Fidelity Resource Company during 2011, we assumed $3.1 million in fixed/floating rate junior subordinated debentures underlying common securities and preferred capital securities, or the Trust Securities, issued by Parkway National Capital Trust I, a statutory business trust and acquired wholly-owned subsidiary. We assumed the guarantor position and as such, unconditionally guarantee payment of accrued and unpaid distributions
85
required to be paid on the Trust Securities subject to certain exceptions, the redemption price when a capital security is called for redemption and amounts due if a trust is liquidated or terminated.
We own all of the outstanding common securities of the trust. The trust used the proceeds from the issuance of its Trust Securities to buy the debentures originally issued by Fidelity Resource Company. These debentures are the trust's only assets and the interest payments from the debentures finance the distributions paid on the Trust Securities.
The Trust Securities pay cumulative cash distributions quarterly at a rate per annum equal to the 3-month LIBOR plus 1.85% percent. The effective rate as of December 31, 2013 and 2012 was 2.10% and 2.19%, respectively. The Trust Securities are subject to mandatory redemption in whole or in part, upon repayment of the debentures at the stated maturity in the year 2036 or their earlier redemption, in each case at a redemption price equal to the aggregate liquidation preference of the Trust Securities plus any accumulated and unpaid distributions thereon to the date of redemption. Prior redemption is permitted under certain circumstances.
The Trust Securities qualify as Tier 1 capital, subject to regulatory limitations, under guidelines established by the Federal Reserve.
Subordinated notes. On December 23, 2013, we completed a private offering of $5.0 million in aggregate principal amount of subordinated promissory notes. The notes were structured to qualify as Tier 2 capital under applicable rules and regulations of the Federal Reserve. The proceeds from the offering were used to support our continued growth. The notes are unsecured, with quarterly interest payable at a fixed rate of 6.0% per annum, and unpaid principal and interest on the notes is due at the stated maturity on December 31, 2023. We may redeem the notes in whole or in part on any interest payment date that occurs on or after December 23, 2018 subject to approval of the Federal Reserve.
Under the terms of the notes, if we have not paid interest on the notes within 30 days of any interest payment date, or if our classified assets to total tangible capital ratio exceeds 40.0%, then the note holder that holds the greatest aggregate principal amount of the notes may appoint one representative to attend meetings of our board of directors as an observer. The board observation rights terminate when such overdue interest is paid or our classified assets to total tangible capital ratio no longer exceeds 40.0%. In addition, the terms of the notes provide that the note holders will have the same rights to inspect our books and records provided to holders our common stock under Texas law.
In connection with the issuance of the notes, we also issued warrants to purchase 25,000 shares of our common stock, at an exercise price of $11.00 per share, exercisable at any time, in whole or in part, on or prior to December 31, 2023. See "Certain Relationships and Related Party Transactions—Private Placement of Subordinated Notes and Warrants" for additional discussion of these subordinated notes and warrants.
| |
As of June 30 (Unaudited) |
As of December 31, | ||||||||
|---|---|---|---|---|---|---|---|---|---|---|
| |
2014 | 2013 | 2012 | |||||||
| |
(Dollars in thousands) |
|||||||||
Junior subordinated debentures |
$ | 3,093 | $ | 3,093 | $ | 3,093 | ||||
Subordinated notes |
4,980 | 4,979 | — | |||||||
| | | | | | | | | | | |
Total |
$ | 8,073 | $ | 8,072 | $ | 3,093 | ||||
| | | | | | | | | | | |
| | | | | | | | | | | |
86
Liquidity and Capital Resources
Liquidity
Liquidity involves our ability to raise funds to support asset growth and acquisitions or reduce assets to meet deposit withdrawals and other payment obligations, to maintain reserve requirements and otherwise to operate on an ongoing basis and manage unexpected events. For the six months ended June 30, 2014 and the years ended December 31, 2013 and 2012, our liquidity needs were primarily met by core deposits, security and loan maturities and amortizing investment and loan portfolios. Although access to brokered deposits, purchased funds from correspondent banks and overnight advances from the FHLB and the Federal Reserve Bank of Dallas are available and have been utilized on occasion to take advantage of investment opportunities, we do not generally rely on these external funding sources. We maintained two lines of credit with commercial banks which provide for extensions of credit with an availability to borrow up to an aggregate $14.6 million as of June 30, 2014 and December 31, 2013 and $12.6 million as of December 31, 2012. There were no advances under these lines of credit outstanding as of June 30, 2014, December 31, 2013 and December 31, 2012.
The following table illustrates, during the periods presented, the mix of our funding sources and the average assets in which those funds are invested as a percentage of our average total assets for the period indicated. Average assets totaled $671.5 million for the six months ended June 30, 2014, $584.1 million for the year ended December 31, 2013 and $472.8 million for the year ended December 31, 2012.
| |
For the Six Months Ended June 30, 2014 (Unaudited) |
For the Years Ended December 31, |
||||||||
|---|---|---|---|---|---|---|---|---|---|---|
| |
2013 | 2012 | ||||||||
Sources of Funds: |
||||||||||
Deposits: |
||||||||||
Noninterest-bearing |
33.2 | % | 32.9 | % | 32.6 | % | ||||
Interest-bearing |
52.8 | 53.4 | 52.9 | |||||||
Advances from FHLB |
2.1 | 2.2 | 1.9 | |||||||
Other borrowings |
1.1 | 1.2 | 0.6 | |||||||
Other liabilities |
0.3 | 0.3 | 0.2 | |||||||
Stockholders' equity |
10.5 | 10.0 | 11.8 | |||||||
| | | | | | | | | | | |
Total |
100.0 | % | 100.0 | % | 100.0 | % | ||||
| | | | | | | | | | | |
| | | | | | | | | | | |
Uses of Funds: |
||||||||||
Loans |
75.3 | % | 74.0 | % | 75.8 | % | ||||
Securities available for sale |
7.1 | 6.9 | 5.6 | |||||||
Interest-bearing deposits in other banks |
8.0 | 10.2 | 8.6 | |||||||
Other noninterest-earning assets |
9.6 | 8.9 | 10.0 | |||||||
| | | | | | | | | | | |
Total |
100.0 | % | 100.0 | % | 100.0 | % | ||||
| | | | | | | | | | | |
| | | | | | | | | | | |
Average noninterest-bearing deposits to average deposits |
37.8 | % | 37.7 | % | 34.9 | % | ||||
Average loans to average deposits |
88.6 | % | 86.8 | % | 85.9 | % | ||||
Our primary source of funds is deposits, and our primary use of funds is loans. We do not expect a change in the primary source or use of our funds in the foreseeable future. Our average loans increased 24.3% for the six months ended June 30, 2014 compared to the same period in 2013 and 26.7% for the year ended December 31, 2013 compared to the year ended December 31, 2012. We predominantly invest excess deposits in overnight deposits with the Federal Reserve, securities, interest-bearing deposits at other banks or other short-term liquid investments until needed to fund loan growth. Our securities portfolio had a weighted average life of 3.72 years and an effective duration of
87
2.17 years as of June 30, 2014 and a weighted average life of 4.07 years and an effective duration of 2.76 years as of December 31, 2013.
As of June 30, 2014, we had outstanding $107.1 million in commitments to extend credit and $680,000 in commitments associated with outstanding standby and commercial letters of credit. As of December 31, 2013, we had outstanding $92.8 million in commitments to extend credit and $210,000 in commitments associated with outstanding standby and commercial letters of credit. Since commitments associated with letters of credit and commitments to extend credit may expire unused, the total outstanding may not necessarily reflect the actual future cash funding requirements.
As of June 30, 2014 and December 31, 2013, we had no exposure to future cash requirements associated with known uncertainties or capital expenditures of a material nature. As of June 30, 2014, we had cash and cash equivalents of $66.5 million compared to $76.6 million as of December 31, 2013. The decrease was primarily due to an increase in loans and a seasonal reduction in customer deposit balances.
Capital Resources
Total stockholders' equity increased to $74.2 million as of June 30, 2014, compared to $66.2 million as of December 31, 2013, an increase of $8.0 million or 12.1%. This increase was primarily the result of $5.4 million in proceeds from the sale of our common stock and $2.2 million of net income for the period. Total stockholders' equity increased to $66.2 million as of December 31, 2013, compared to $61.9 million as of December 31, 2012, an increase of $4.3 million or 6.9%. This increase was primarily the result of our net income of $3.4 million and the sale of 120,363 additional shares of common stock representing $1.2 million of additional paid-in capital.
For the years ended December 31, 2013, 2012 and 2011, we declared and paid cash dividends on our Series C preferred stock of $60,000, $100,000 and $8,000, respectively. See "Description of Capital Stock—Preferred Stock—Series C Preferred Stock" for additional discussion of our Series C preferred stock. To date, we have not declared or paid dividends on our common stock. We purchased 10,000 shares of our common stock for $70,000 during the year ended December 31, 2013. We did not purchase any of our common stock for the six months ended June 30, 2014 or for the years ended December 31, 2012 or 2011.
Capital management consists of providing equity to support our current and future operations. The bank regulators view capital levels as important indicators of an institution's financial soundness. As a general matter, FDIC-insured depository institutions and their holding companies are required to maintain minimum capital relative to the amount and types of assets they hold. We are subject to regulatory capital requirements at the bank holding company and bank levels. See "Regulation and Supervision—Prompt Corrective Action" for additional discussion regarding the regulatory capital requirements applicable to us and the Bank. As of June 30, 2014, December 31, 2013 and 2012, we and the Bank were in compliance with all applicable regulatory capital requirements, and the Bank was classified as "well capitalized," for purposes of the prompt corrective action regulations. As we employ our capital and continue to grow our operations, our regulatory capital levels may decrease depending on our level of earnings. However, we expect to monitor and control our growth in order to remain in compliance with all regulatory capital standards applicable to us.
88
The following table presents the actual capital amounts and regulatory capital ratios for us and the Bank as of the dates indicated.
| |
As of June 30, 2014 (Unaudited) |
As of December 31, 2013 |
|||||||||||
|---|---|---|---|---|---|---|---|---|---|---|---|---|---|
| |
Amount | Ratio | Amount | Ratio | |||||||||
| |
(Dollars in thousands) |
||||||||||||
Veritex Holdings, Inc. |
|||||||||||||
Total capital (to risk weighted assets) |
$ | 67,540 | 12.35 | % | $ | 59,100 | 11.74 | % | |||||
Tier 1 capital (to risk weighted assets) |
57,044 | 10.44 | 49,103 | 9.75 | |||||||||
Tier 1 capital (to average assets) |
57,044 | 8.66 | 49,103 | 8.06 | |||||||||
Veritex Community Bank |
|||||||||||||
Total capital (to risk weighted assets) |
$ | 65,480 | 11.99 | % | $ | 57,275 | 11.37 | % | |||||
Tier 1 capital (to risk weighted assets) |
59,964 | 10.98 | 52,257 | 10.37 | |||||||||
Tier 1 capital (to average assets) |
59,964 | 9.11 | 52,257 | 8.58 | |||||||||
Contractual Obligations
The following table summarizes our contractual obligations and other commitments to make future payments as of December 31, 2013 (other than deposit obligations), which consist of our future cash payments associated with our contractual obligations pursuant to our FHLB advances and non-cancelable future operating leases. Payments for FHLB advances include interest of $390,000 that will be paid over future periods. Payments related to leases are based on actual payments specified in underlying contracts. Advances from the Federal Home Loan Bank totaled approximately $15.0 million and $10.0 million as of December 31, 2013 and 2012, respectively. As of December 31, 2013, the advances are collateralized by a blanket floating lien on certain securities and loans, had a weighted average rate of 0.80% and mature on various dates during 2016 and 2018.
| |
As of December 31, 2013 | |||||||||||||||
|---|---|---|---|---|---|---|---|---|---|---|---|---|---|---|---|---|
| |
1 year or less | More than 1 year but less than 3 years |
3 years or more but less than 5 years |
5 years or more |
Total | |||||||||||
| |
(Dollars in thousands) |
|||||||||||||||
Non-cancelable future operating leases |
$ | 1,118 | $ | 991 | $ | 1,811 | $ | 3,284 | $ | 7,204 | ||||||
Time deposits |
80,878 | 14,105 | 4,370 | — | 99,353 | |||||||||||
Advances from FHLB |
— | 10,000 | 5,000 | — | 15,000 | |||||||||||
Other borrowings |
— | — | — | 8,072 | 8,072 | |||||||||||
Standby and commercial letters of credit |
210 | — | — | — | 210 | |||||||||||
Commitments to extend credit |
52,477 | 20,360 | 3,035 | 16,955 | 92,827 | |||||||||||
| | | | | | | | | | | | | | | | | |
Total |
$ | 134,683 | $ | 45,456 | $ | 14,216 | $ | 28,311 | $ | 222,666 | ||||||
| | | | | | | | | | | | | | | | | |
| | | | | | | | | | | | | | | | | |
Off-Balance Sheet Items
In the normal course of business, we enter into various transactions, which, in accordance with GAAP, are not included in our consolidated balance sheets. We enter into these transactions to meet the financing needs of our customers. These transactions include commitments to extend credit and standby and commercial letters of credit, which involve, to varying degrees, elements of credit risk and interest rate risk in excess of the amounts recognized in the consolidated balance sheets.
89
Our commitments associated with outstanding standby and commercial letters of credit and commitments to extend credit expiring by period as of the date indicated are summarized below. Since commitments associated with letters of credit and commitments to extend credit may expire unused, the amounts shown do not necessarily reflect the actual future cash funding requirements.
| |
As of December 31, 2013 | |||||||||||||||
|---|---|---|---|---|---|---|---|---|---|---|---|---|---|---|---|---|
| |
1 year or less | More than 1 year but less than 3 years |
3 years or more but less than 5 years |
5 years or more |
Total | |||||||||||
| |
(Dollars in thousands) |
|||||||||||||||
Standby and commercial letters of credit |
$ | 210 | $ | — | $ | — | $ | — | $ | 210 | ||||||
Commitments to extend credit |
52,477 | 20,360 | 3,035 | 16,955 | 92,827 | |||||||||||
| | | | | | | | | | | | | | | | | |
Total |
$ | 52,687 | $ | 20,360 | $ | 3,035 | $ | 16,955 | $ | 93,037 | ||||||
| | | | | | | | | | | | | | | | | |
| | | | | | | | | | | | | | | | | |
Standby and commercial letters of credit are conditional commitments issued by us to guarantee the performance of a customer to a third party. In the event of nonperformance by the customer, we have rights to the underlying collateral, which can include commercial real estate, physical plant and property, inventory, receivables, cash and/or marketable securities. The credit risk to us in issuing letters of credit is essentially the same as that involved in extending loan facilities to our customers.
Commitments to extend credit are agreements to lend to a customer as long as there is no violation of any condition established in the contract. Commitments generally have fixed expiration dates or other termination clauses and may require payment of a fee. Since many of the commitments are expected to expire without being fully drawn upon, the total commitment amounts disclosed above do not necessarily represent future cash requirements. We evaluate each customer's creditworthiness on a case-by-case basis. The amount of collateral obtained, if considered necessary by us, upon extension of credit, is based on management's credit evaluation of the customer.
Interest Rate Sensitivity and Market Risk
As a financial institution, our primary component of market risk is interest rate volatility. Our asset liability and funds management policy provides management with the guidelines for effective funds management, and we have established a measurement system for monitoring our net interest rate sensitivity position. We manage our sensitivity position within our established guidelines.
Fluctuations in interest rates will ultimately impact both the level of income and expense recorded on most of our assets and liabilities, and the market value of all interest-earning assets and interest-bearing liabilities, other than those which have a short term to maturity. Interest rate risk is the potential of economic losses due to future interest rate changes. These economic losses can be reflected as a loss of future net interest income and/or a loss of current fair market values. The objective is to measure the effect on net interest income and to adjust the balance sheet to minimize the inherent risk while at the same time maximizing income.
We manage our exposure to interest rates by structuring our balance sheet in the ordinary course of business. We do not enter into instruments such as leveraged derivatives, interest rate swaps, financial options, financial future contracts or forward delivery contracts for the purpose of reducing interest rate risk. Based upon the nature of our operations, we are not subject to foreign exchange or commodity price risk. We do not own any trading assets.
Our exposure to interest rate risk is managed by the Asset-Liability Committee of the Bank, in accordance with policies approved by its board of directors. The committee formulates strategies based on appropriate levels of interest rate risk. In determining the appropriate level of interest rate risk, the committee considers the impact on earnings and capital of the current outlook on interest rates, potential changes in interest rates, regional economies, liquidity, business strategies and other factors.
90
The committee meets regularly to review, among other things, the sensitivity of assets and liabilities to interest rate changes, the book and market values of assets and liabilities, unrealized gains and losses, purchase and sale activities, commitments to originate loans and the maturities of investments and borrowings. Additionally, the committee reviews liquidity, cash flow flexibility, maturities of deposits and consumer and commercial deposit activity. Management employs methodologies to manage interest rate risk which include an analysis of relationships between interest-earning assets and interest-bearing liabilities, and an interest rate shock simulation model.
We use interest rate risk simulation models and shock analysis to test the interest rate sensitivity of net interest income and fair value of equity, and the impact of changes in interest rates on other financial metrics. Contractual maturities and re-pricing opportunities of loans are incorporated in the model as are prepayment assumptions, maturity data and call options within the investment portfolio. Average life of our non-maturity deposit accounts are based on standard regulatory decay assumptions and are incorporated into the model. The assumptions used are inherently uncertain and, as a result, the model cannot precisely measure future net interest income or precisely predict the impact of fluctuations in market interest rates on net interest income. Actual results will differ from the model's simulated results due to timing, magnitude and frequency of interest rate changes as well as changes in market conditions and the application and timing of various management strategies.
On a quarterly basis, we run two simulation models including a static balance sheet and dynamic growth balance sheet. These models test the impact on net interest income and fair value of equity from changes in market interest rates under various scenarios. Under the static and dynamic growth models, rates are shocked instantaneously and ramped rate changes over a twelve-month horizon based upon parallel and non-parallel yield curve shifts. Parallel shock scenarios assume instantaneous parallel movements in the yield curve compared to a flat yield curve scenario. Non-parallel simulation involves analysis of interest income and expense under various changes in the shape of the yield curve. Internal policy regarding internal rate risk simulations currently specifies that for instantaneous parallel shifts of the yield curve, estimated net income at risk for the subsequent one-year period should not decline by more than 6.0% for a 100 basis point shift, 12.0% for a 200 basis point shift, and 18.0% for a 300 basis point shift.
The following table summarizes the simulated change in net interest income and fair value of equity over a 12-month horizon as of the date indicated:
| |
As of June 30, 2014 | As of December 31, 2013 | |||||||||||
|---|---|---|---|---|---|---|---|---|---|---|---|---|---|
Change in Interest Rates (Basis Points) |
Percent Change in Net Interest Income |
Percent Change in Fair Value of Equity |
Percent Change in Net Interest Income |
Percent Change in Fair Value of Equity |
|||||||||
+300 |
5.92 | % | 11.66 | % | 5.68 | % | 13.94 | % | |||||
+200 |
3.69 | % | 9.32 | % | 2.90 | % | 10.48 | % | |||||
+100 |
1.54 | % | 5.27 | % | 0.59 | % | 5.46 | % | |||||
Base |
(0.41 | )% | 0.00 | % | (0.48 | )% | 0.00 | % | |||||
-100 |
(0.61 | )% | 4.89 | % | (0.29 | )% | 4.22 | % | |||||
The results are primarily due to behavior of demand, money market and savings deposits during such rate fluctuations. We have found that, historically, interest rates on these deposits change more slowly than changes in the discount and federal funds rates. This assumption is incorporated into the simulation model and is generally not fully reflected in a gap analysis. The assumptions incorporated into the model are inherently uncertain and, as a result, the model cannot precisely measure future net interest income or precisely predict the impact of fluctuations in market interest rates on net interest income. Actual results will differ from the model's simulated results due to timing, magnitude and frequency of interest rate changes as well as changes in market conditions and the application and timing of various strategies.
91
Impact of Inflation
Our consolidated financial statements and related notes included elsewhere in this prospectus have been prepared in accordance with GAAP. These require the measurement of financial position and operating results in terms of historical dollars, without considering changes in the relative value of money over time due to inflation or recession.
Unlike many industrial companies, substantially all of our assets and liabilities are monetary in nature. As a result, interest rates have a more significant impact on our performance than the effects of general levels of inflation. Interest rates may not necessarily move in the same direction or in the same magnitude as the prices of goods and services. However, other operating expenses do reflect general levels of inflation.
Non-GAAP Financial Measures
Our accounting and reporting policies conform to GAAP, and the prevailing practices in the banking industry. However, we also evaluate our performance based on certain additional financial measures discussed in this prospectus as being non-GAAP financial measures. We classify a financial measure as being a non-GAAP financial measure if that financial measure excludes or includes amounts, or is subject to adjustments that have the effect of excluding or including amounts, that are included or excluded, as the case may be, in the most directly comparable measure calculated and presented in accordance with GAAP as in effect from time to time in the United States in our statements of income, balance sheets or statements of cash flows. Non-GAAP financial measures do not include operating and other statistical measures or ratios or statistical measures calculated using exclusively either financial measures calculated in accordance with GAAP, operating measures or other measures that are not non-GAAP financial measures or both.
The non-GAAP financial measures that we discuss in this prospectus should not be considered in isolation or as a substitute for the most directly comparable or other financial measures calculated in accordance with GAAP. Moreover, the manner in which we calculate the non-GAAP financial measures that we discuss in this prospectus may differ from that of other companies reporting measures with similar names. You should understand how such other banking organizations calculate their financial measures similar or with names similar to the non-GAAP financial measures we have discussed in this prospectus when comparing such non-GAAP financial measures.
Tangible Book Value Per Common Share. Tangible book value per common share is a non-GAAP measure generally used by financial analysts and investment bankers to evaluate financial institutions. We calculate (1) tangible common equity as stockholders' equity less preferred stock, goodwill and core deposit intangible and other intangible assets, net of accumulated amortization, and (2) tangible book value per common share as tangible common equity divided by shares of common stock outstanding. The most directly comparable GAAP financial measure for tangible book value per common share is book value per common share.
We believe that this measure is important to many investors in the marketplace who are interested in changes from period to period in book value per common share exclusive of changes in intangible assets. Goodwill and other intangible assets have the effect of increasing total book value while not increasing our tangible book value.
92
The following table reconciles, as of the dates set forth below, total stockholders' equity to tangible common equity and presents our tangible book value per common share compared to our book value per common share:
| |
As of June 30, | As of December 31, | ||||||||||||||
|---|---|---|---|---|---|---|---|---|---|---|---|---|---|---|---|---|
| |
2014 | 2013 | 2013 | 2012 | 2011 | |||||||||||
| |
(Unaudited) |
|
|
|
||||||||||||
| |
(Dollars in thousands, except per share data) |
|||||||||||||||
Tangible Common Equity |
||||||||||||||||
Total stockholders' equity |
$ | 74,244 | $ | 64,262 | $ | 66,239 | $ | 61,860 | $ | 58,676 | ||||||
Adjustments: |
||||||||||||||||
Preferred stock |
(8,000 | ) | (8,000 | ) | (8,000 | ) | (8,000 | ) | (8,000 | ) | ||||||
| | | | | | | | | | | | | | | | | |
Book value |
66,244 | 56,262 | 58,239 | 53,860 | 50,676 | |||||||||||
Goodwill |
(19,148 |
) |
(19,148 |
) |
(19,148 |
) |
(19,148 |
) |
(19,148 |
) |
||||||
Core deposit and other intangibles |
(1,413 | ) | (1,721 | ) | (1,567 | ) | (1,875 | ) | (2,183 | ) | ||||||
| | | | | | | | | | | | | | | | | |
Total tangible common equity |
$ | 45,683 | $ | 35,393 | $ | 37,524 | $ | 32,837 | $ | 29,345 | ||||||
| | | | | | | | | | | | | | | | | |
| | | | | | | | | | | | | | | | | |
Common shares outstanding(1) |
6,358,832 | 5,808,703 | 5,804,703 | 5,694,340 | 5,554,487 | |||||||||||
Book value per common share |
$ | 10.42 | $ | 9.69 | $ | 10.03 | $ | 9.46 | $ | 9.12 | ||||||
Tangible book value per common share |
$ | 7.18 | $ | 6.09 | $ | 6.46 | $ | 5.77 | $ | 5.28 | ||||||
- (1)
- Excludes the dilutive effect, if any, of 830,000, 730,000, 750,000, 765,000 and 700,000 shares of common stock issuable upon exercise of outstanding stock options as of June 30, 2014, June 30, 2013, December 31, 2013, December 31, 2012, and December 31, 2011, respectively, and 63,250, 34,000, 35,000, 40,000 and 26,000 shares of common stock issuable upon vesting of outstanding restricted stock units as of June 30, 2014, June 30, 2013, December 31, 2013, December 31, 2012, and December 31, 2011, respectively.
Tangible Common Equity to Tangible Assets. Tangible common equity to tangible assets is a non-GAAP measure generally used by financial analysts and investment bankers to evaluate financial institutions. We calculate tangible common equity, as described above, and tangible assets as total assets less goodwill, core deposit intangibles and other intangible assets, net of accumulated amortization. The most directly comparable GAAP financial measure for tangible common equity to tangible assets is total common stockholders' equity to total assets.
We believe that this measure is important to many investors in the marketplace who are interested in the relative changes from period to period in common equity and total assets, each exclusive of changes in intangible assets. Goodwill and other intangible assets have the effect of increasing both total stockholders' equity and assets while not increasing our tangible common equity or tangible assets.
93
The following table reconciles, as of the dates set forth below, total stockholders' equity to tangible common equity and total assets to tangible assets:
| |
|
As of December 31, | |||||||||||
|---|---|---|---|---|---|---|---|---|---|---|---|---|---|
| |
As of June 30, 2014 (Unaudited) |
2013 | 2012 | 2011 | |||||||||
| |
(Dollars in thousands) |
||||||||||||
Tangible Common Equity |
|||||||||||||
Total stockholders' equity |
$ | 74,244 | $ | 66,239 | $ | 61,860 | $ | 58,676 | |||||
Adjustments: |
|||||||||||||
Preferred stock |
(8,000 | ) | (8,000 | ) | (8,000 | ) | (8,000 | ) | |||||
Goodwill |
(19,148 | ) | (19,148 | ) | (19,148 | ) | (19,148 | ) | |||||
Core deposit and other intangibles |
(1,413 | ) | (1,567 | ) | (1,875 | ) | (2,183 | ) | |||||
| | | | | | | | | | | | | | |
Total tangible common equity |
$ | 45,683 | $ | 37,524 | $ | 32,837 | $ | 29,345 | |||||
| | | | | | | | | | | | | | |
| | | | | | | | | | | | | | |
Tangible Assets |
|||||||||||||
Total assets |
$ | 710,382 | $ | 664,971 | $ | 524,127 | $ | 437,820 | |||||
Adjustments: |
|||||||||||||
Goodwill |
(19,148 | ) | (19,148 | ) | (19,148 | ) | (19,148 | ) | |||||
Core deposit and other intangibles |
(1,413 | ) | (1,567 | ) | (1,875 | ) | (2,183 | ) | |||||
| | | | | | | | | | | | | | |
Total tangible assets |
$ | 689,821 | $ | 644,256 | $ | 503,104 | $ | 416,489 | |||||
| | | | | | | | | | | | | | |
| | | | | | | | | | | | | | |
Tangible Common Equity to Tangible Assets |
6.62 | % | 5.82 | % | 6.53 | % | 7.05 | % | |||||
Critical Accounting Policies
Our consolidated financial statements are prepared in accordance with accounting principles generally accepted in the United States and with general practices within the financial services industry. Application of these principles requires management to make estimates and assumptions that affect the amounts reported in the financial statements and accompanying notes. We base our estimates on historical experience and on various other assumptions that we believe to be reasonable under current circumstances. These assumptions form the basis for our judgments about the carrying values of assets and liabilities that are not readily available from independent, objective sources. We evaluate our estimates on an ongoing basis. Use of alternative assumptions may have resulted in significantly different estimates. Actual results may differ from these estimates.
We have identified the following accounting policies and estimates that, due to the difficult, subjective or complex judgments and assumptions inherent in those policies and estimates and the potential sensitivity of our financial statements to those judgments and assumptions, are critical to an understanding of our financial condition and results of operations. We believe that the judgments, estimates and assumptions used in the preparation of our financial statements are appropriate.
Investment Securities
Securities are classified as held to maturity and carried at amortized cost when we have the positive intent and ability to hold them until maturity. Securities to be held for indefinite periods of time are classified as available for sale and carried at fair value, with the unrealized holding gains and losses reported in other comprehensive income, net of tax. We determined the appropriate classification of securities at the time of purchase.
Interest income includes amortization of purchase premiums and discounts. Realized gains and losses are derived from the amortized cost of the security sold. Credit related declines in the fair value of held to maturity and available for sale securities below their cost that are deemed to be other than
94
temporary are reflected in earnings as realized losses, with the remaining unrealized loss recognized as a component of other comprehensive income. In estimating other-than-temporary impairment losses, we consider, among other things, (1) the length of time and the extent to which the fair value has been less than cost, (2) the financial condition and near-term prospects of the issuer, and (3) the intent and our ability to retain the investment in the issuer for a period of time sufficient to allow for any anticipated recovery in fair value.
Loans Held for Sale
Loans held for sale consist of certain mortgage loans originated and intended for sale in the secondary market and are carried at the lower of cost or estimated fair value on an individual loan basis. Net unrealized losses, if any, are recognized through a valuation allowance by charges to income. We obtain purchase commitments from secondary market investors prior to closing the loans and do not retain the servicing obligations related to any such loans upon their sale. Gains and losses on sales of loans held for sale are based on the difference between the selling price and the carrying value of the related loan sold.
Loans and Allowance for Loan Losses
Loans, excluding certain purchased loans which have shown evidence of deterioration since origination as of the date of the acquisition, that we have the intent and ability to hold for the foreseeable future or until maturity or pay-off are stated at the amount of unpaid principal, reduced by unearned income and an allowance for loan losses. Interest on loans is recognized using the simple-interest method on the daily balances of the principal amounts outstanding. Fees associated with the originating of loans and certain direct loan origination costs are netted and the net amount is deferred and recognized over the life of the loan as an adjustment of yield.
The accrual of interest on loans is discontinued when there is a clear indication that the borrower's cash flow may not be sufficient to meet payments as they become due, which is generally when a loan is 90 days past due. When a loan is placed on non-accrual status, all previously accrued and unpaid interest is reversed. Interest income is subsequently recognized on a cash basis as long as the remaining book balance of the asset is deemed to be collectible. If collectability is questionable, then cash payments are applied to principal. Loans are returned to accrual status when all the principal and interest amounts contractually due are brought current and future payments are reasonably assured in accordance with the terms of the loan agreement.
The allowance for loan losses is an estimated amount we believe is adequate to absorb inherent losses on existing loans that may be uncollectible based upon review and evaluation of the loan portfolio. Our periodic evaluation of the allowance is based on general economic conditions, the financial condition of borrowers, the value and liquidity of collateral, delinquency, prior loan loss experience, and the results of periodic reviews of the portfolio. The allowance for loan losses is comprised of two components: the general reserve and specific reserves. The general reserve is determined in accordance with current authoritative accounting guidance that considers historical loss rates for the last three years adjusted for qualitative factors based upon general economic conditions and other qualitative risk factors both internal and external to us. Such qualitative factors include current local economic conditions and trends including unemployment, changes in lending staff, policies and procedures, changes in credit concentrations, changes in the trends and severity of problem loans and changes in trends in volume and terms of loans. These qualitative factors serve to compensate for additional areas of uncertainty inherent in the portfolio that are not reflected in our historic loss factors. For purposes of determining the general reserve, the loan portfolio, less cash secured loans, government guaranteed loans and impaired loans, is multiplied by our adjusted historical loss rate. Specific reserves are determined in accordance with current authoritative accounting guidance based on probable losses on specific classified loans.
95
The allowance for loan losses is increased by charges to income and decreased by charge-offs (net of recoveries).
Due to the growth of the Bank over the past several years, a portion of the loans in our portfolio and our lending relationships are of relatively recent origin. The new loan portfolios have limited delinquency and credit loss history and have not yet exhibited an observable loss trend. The credit quality of loans in these loan portfolios are impacted by delinquency status and debt service coverage generated by the borrowers' business and fluctuations in the value of real estate collateral. We consider delinquency status to be the most meaningful indicator of the credit quality of one-to-four single family residential, home equity loans and lines of credit and other consumer loans. In general, loans do not begin to show signs of credit deterioration or default until they have been outstanding for some period of time, a process we refer to as "seasoning". As a result, a portfolio of older loans will usually behave more predictably than a portfolio of newer loans. Because the majority of our portfolio is relatively new, the current level of delinquencies and defaults may not be representative of the level that will prevail when the portfolio becomes more seasoned, which may be higher than current levels.
Delinquency statistics are updated at least monthly. Internal risk ratings are considered the most meaningful indicator of credit quality for new commercial, construction, and commercial real estate loans. Internal risk ratings are a key factor in identifying loans that are individually evaluated for impairment and impact our estimates of loss factors used in determining the amount of the allowance for loan losses. Internal risk ratings are updated on a continuous basis.
Loans are considered impaired when, based on current information and events, it is probable the Company will be unable to collect all amounts due in accordance with the original contractual terms of the loan agreement, including scheduled principal and interest payments. If a loan is impaired, a specific valuation allowance is allocated, if necessary. Interest payments on impaired loans are typically applied to principal unless collectability of the principal amount is reasonably assured, in which case interest is recognized on a cash basis. Impaired loans, or portions thereof, are charged off when deemed uncollectible.
Our policy requires measurement of the allowance for an impaired collateral dependent loan based on the fair value of the collateral. Other loan impairments are measured based on the present value of expected future cash flows or the loan's observable market price. At December 31, 2013 and 2012, all significant impaired loans have been determined to be collateral dependent and the allowance for loss has been measured utilizing the estimated fair value of the collateral.
From time to time, we may modify our loan agreement with a borrower. A modified loan is considered a troubled debt restructuring when two conditions are met: (1) the borrower is experiencing financial difficulty and (2) concessions are made by us that would not otherwise be considered for a borrower with similar credit risk characteristics. Modifications to loan terms may include a lower interest rate, a reduction of principal, or a longer term to maturity. All troubled debt restructurings are considered impaired loans. We review each troubled debt restructured loan and determine on a case by case basis if a specific allowance for loan loss is required. An allowance for loan loss allocation is based on either the present value of estimated future cash flows or the estimated fair value of the underlying collateral.
We have certain lending policies and procedures in place that are designed to maximize loan income with an acceptable level of risk. We review and approve these policies and procedures on a regular basis and makes changes as appropriate. We receive frequent reports related to loan originations, quality, concentrations, delinquencies, non-performing and potential problem loans. Diversification in the loan portfolio is a means of managing risk associated with fluctuations in economic conditions, both by type of loan and geography.
96
Commercial loans are underwritten after evaluating and understanding the borrower's ability to operate profitably and effectively. Underwriting standards are designed to determine whether the borrower possesses sound business ethics and practices and to evaluate current and projected cash flows to determine the ability of the borrower to repay their obligations as agreed. Commercial loans are primarily made based on the identified cash flows of the borrower and, secondarily, on the underlying collateral provided by the borrower. Most commercial loans are secured by the assets being financed or other business assets, such as accounts receivable or inventory, and include personal guarantees.
Real estate loans are also subject to underwriting standards and processes similar to commercial loans. These loans are underwritten primarily based on projected cash flows and, secondarily, as loans secured by real estate. The repayment of real estate loans is generally largely dependent on the successful operation of the property securing the loans or the business conducted on the property securing the loan. Real estate loans may be more adversely affected by conditions in the real estate markets or in the general economy. The properties securing our real estate portfolio are generally diverse in terms of type and geographic location, through the Dallas metropolitan area. This diversity helps reduce the exposure to adverse economic events that affect any single market or industry.
We utilize methodical credit standards and analysis to supplement our policies and procedures in underwriting consumer loans. Our loan policy addresses types of consumer loans that may be originated and the collateral, if secured, which must be perfected. The relatively smaller individual dollar amounts of consumer loans that are spread over numerous individual borrowers also minimizes our risk.
Emerging Growth Company
The JOBS Act permits an "emerging growth company" to take advantage of an extended transition period to comply with new or revised accounting standards applicable to public companies. However, we have "opted out" of this provision. As a result, we will comply with new or revised accounting standards to the same extent that compliance is required for non-emerging growth companies. This decision to opt out of the extended transition period under the JOBS Act is irrevocable.
Recently Issued Accounting Pronouncements
ASU 2013-02, "Comprehensive Income (Topic 220)—Reporting of Amounts Reclassified Out of Accumulated Other Comprehensive Income." ASU 2013-02 amends recent guidance related to the reporting of comprehensive income to enhance the reporting of reclassifications out of accumulated other comprehensive income. ASU 2013-02 is effective for reporting periods beginning after December 15, 2013 and is not expected to have a significant impact on our consolidated financial statements.
97
The U.S. banking industry is highly regulated under federal and state law. These laws and regulations affect the operations and performance of our company and subsidiaries.
Statutes, regulations and policies limit the activities in which we may engage and how we conduct certain permitted activities. The system of supervision and regulation applicable to us and our subsidiaries establishes a comprehensive framework for their respective operations and is intended primarily for the protection of the FDIC's Deposit Insurance Fund, the Bank's depositors and the public, rather than our shareholders or creditors. Further, the bank regulatory system imposes reporting and information collection obligations. We incur significant costs relating to compliance with these laws and regulations. Banking statutes, regulations and policies are continually under review by federal and state legislatures and regulatory agencies, and a change in them, including changes in how they are interpreted or implemented, could have a material adverse effect on our business.
The material statutory and regulatory requirements that are applicable to us are summarized below. This description is not intended to describe all laws and regulations applicable to us and our subsidiaries, and the description is qualified in its entirety by reference to the full text of the statutes, regulations, policies, interpretive letters and other written guidance that are described herein.
Bank and Bank Holding Company Regulation
The Bank is a Texas-chartered banking association, the deposits of which are insured by the FDIC's Deposit Insurance Fund. The Bank is a member of the Federal Reserve System; therefore, the Bank is subject to ongoing and comprehensive supervision, regulation, examination and enforcement by the Texas Department of Banking and the Federal Reserve.
Any entity that directly or indirectly controls a bank must be approved by the Federal Reserve under the Bank Holding Company Act of 1956, or the BHC Act to become a bank holding company. Bank holding companies are subject to regulation, inspection, examination, supervision and enforcement by the Federal Reserve under the BHC Act. The Federal Reserve's jurisdiction also extends to any company that is directly or indirectly controlled by a bank holding company.
Our company, which controls the Bank, became a registered bank holding company in 2009, and is subject to ongoing and comprehensive supervision, regulation, examination and enforcement by the Federal Reserve. As a bank holding company of a Texas state chartered bank, we are also subject to supervision, regulation, examination and enforcement by the Texas Department of Banking.
Broad Supervision, Examination and Enforcement Powers
The principal objective of the U.S. bank regulatory system is to protect depositors and to ensure the financial safety and soundness of banking organizations. To that end, the banking regulators have broad regulatory, examination and enforcement authority. The regulators regularly examine the operations of banking organizations. In addition, banking organizations are subject to periodic reporting requirements. Insured depository institutions with total assets of $500.0 million or more must submit annual audit reports prepared by independent auditors to federal and state regulators. In some instances, the audit report of the insured depository institution's bank holding company can be used to satisfy this requirement. Auditors must receive examination reports, supervisory agreements and reports of enforcement actions.
The regulators have various remedies available if they determine that the financial condition, capital resources, asset quality, earnings prospects, management, liquidity or other aspects of a banking organization's operations are unsatisfactory. The regulators may also take action if they determine that
98
the banking organization or its management is violating or has violated any law or regulation. The regulators have the power to, among other things:
- •
- enjoin "unsafe or unsound" practices;
- •
- require affirmative actions to correct any violation or practice;
- •
- issue administrative orders that can be judicially enforced;
- •
- direct increases in capital;
- •
- direct the sale of subsidiaries or other assets;
- •
- limit dividends and distributions;
- •
- restrict growth;
- •
- assess civil monetary penalties;
- •
- remove officers and directors; and
- •
- terminate deposit insurance.
The FDIC may terminate a depository institution's deposit insurance upon a finding that the institution's financial condition is unsafe or unsound or that the institution has engaged in unsafe or unsound practices or has violated any applicable rule, regulation, order or condition enacted or imposed by the institution's regulatory agency. Engaging in unsafe or unsound practices or failing to comply with applicable laws, regulations and supervisory agreements could subject the Bank and us, or our respective officers, directors and institution-affiliated parties to the remedies described above and other sanctions.
The Dodd-Frank Act
On July 21, 2010, the Dodd-Frank Act was signed into law. The Dodd-Frank Act is having a broad impact on the financial services industry, and imposes significant regulatory and compliance requirements, including the designation of certain financial companies as systemically important financial companies, the changing roles of credit rating agencies, the imposition of increased capital, leverage and liquidity requirements and numerous other provisions designed to improve supervision and oversight of, and strengthen safety and soundness within, the financial services sector. Additionally, the Dodd-Frank Act establishes a new framework of authority to conduct systemic risk oversight within the financial system to be distributed among new and existing federal regulatory agencies, including the Financial Stability Oversight Council, the Federal Reserve, the OCC and the FDIC.
The following items provide a brief description of certain provisions of the Dodd-Frank Act that are most relevant to the Bank and us.
- •
- Source of strength. Under Federal Reserve policy, bank
holding companies have historically been required to act as a source of financial and managerial strength to each of its banking subsidiaries, and the Dodd-Frank Act codified this policy as a
statutory requirement. The Dodd-Frank Act requires all companies, including bank holding companies that directly or indirectly control an insured depository institution, to serve as a source of
strength for the institution. Under this requirement, in the future we could be required to provide financial assistance to the Bank should it experience financial distress.
- •
- Mortgage lending rules. The Dodd-Frank Act authorized the CFPB to establish certain minimum standards for the origination of residential mortgages, including a determination of the borrower's ability to repay. Under the Dodd-Frank Act, financial institutions may not make a residential mortgage loan unless they make a "reasonable and good faith determination" that
99
- •
- Risk retention rule. On August 28, 2013, the OCC,
the Federal Reserve, the FDIC, the SEC, the Federal Housing Finance Agency and the Department of Housing and Urban Development issued a proposed rule in connection with the risk retention requirement
mandated by Section 941 of the Dodd-Frank Act. The risk retention requirement generally requires a securitizer to retain no less than 5.0% of the credit risk in assets it sells into a
securitization and prohibits a securitizer from directly or indirectly hedging or otherwise transferring the credit risk that the securitizer is required to retain, subject to limited exemptions. One
significant exemption is for securities entirely collateralized by "qualified residential mortgages," or QRMs, which are loans deemed to have a lower risk of default. The proposed rule defines
QRMs to have the same meaning as the term "qualified mortgage," as defined by the CFPB. In addition, the proposed rule provides for reduced risk retention requirements for qualifying commercial
loan, commercial real estate loan and auto loan securitizations.
- •
- Imposition of restrictions on certain activities. The
Dodd-Frank Act imposes a new regulatory structure on the over-the-counter derivatives market, including requirements for clearing, exchange trading, capital, margin, reporting and record keeping. In
addition, certain swaps and other derivatives activities are required to be "pushed out" of insured depository institutions and conducted in separately capitalized non-bank affiliates. The Dodd-Frank
Act also requires certain persons to register as a "major swap participant," "swap dealer," "major security-based swap participant" or a "security-based swap dealer." The U.S. Commodity Futures
Trading Commission has substantially completed adopting regulations to implement much of the new derivatives regulatory structure of the Dodd-Frank Act. The SEC and other U.S. regulators are still in
the process of adopting regulations to implement the new derivatives regulatory structure of the Dodd-Frank Act. With regard to security-based swaps, it is anticipated that this further rulemaking
will further clarify, among other things, reporting and recordkeeping obligations, margin and capital requirements, the scope of registration requirements and what swaps are required to be centrally
cleared and exchange-traded. Rules will also be issued to enhance the oversight of clearing and trading entities. As these remaining rules are implemented, new restrictions or limitations may affect
our ability to manage certain risks in our business.
- •
- Consumer Financial Protection Bureau. The Dodd-Frank Act created the CFPB, which is tasked with establishing and implementing rules and regulations under certain federal consumer protection laws with respect to the conduct of providers of certain consumer financial products and services. The CFPB has rulemaking authority over many of the statutes governing products and services offered to bank and thrift consumers. For banking organizations with assets of $10.0 billion or more, the CFPB has exclusive rule making and examination, and primary
the consumer has a "reasonable ability" to repay the loan. The Dodd-Frank Act allows borrowers to raise certain defenses to foreclosure but provides a full or partial safe harbor from such defenses for loans that are "qualified mortgages." The CFPB has promulgated final rules to, among other things, specify the types of income and assets that may be considered in the ability-to-repay determination, the permissible sources for verification and the required methods of calculating the loan's monthly payments. The rules extend the requirement that creditors verify and document a borrower's income and assets to include all information that creditors rely on in determining repayment ability. The rules also provide further examples of third-party documents that may be relied on for such verification, such as government records and check-cashing or funds-transfer service receipts. The new rules became effective on January 10, 2014. The rules also define "qualified mortgages," imposing both underwriting standards—for example, a borrower's debt-to-income ratio may not exceed 43.0%—and limits on the terms of their loans. Points and fees are subject to a relatively stringent cap, and the terms include a wide array of payments that may be made in the course of closing a loan. Certain loans, including interest-only loans and negative amortization loans, cannot be qualified mortgages.
100
- •
- Deposit insurance. The Dodd-Frank Act made permanent the
general $250,000 deposit insurance limit for insured deposits and changed the assessment base for federal deposit insurance from the amount of insured deposits held by the depository institution to
the institution's average consolidated total assets less its average tangible equity. Additionally, the Dodd-Frank Act increased the minimum reserve ratio for the Deposit Insurance Fund from 1.15% to
1.35% of the estimated amount of total insured deposits and eliminated the requirement that the FDIC pay dividends to depository institutions when the reserve ratio exceeds certain thresholds. Several
of these provisions may impact the FDIC deposit insurance premiums paid by the Bank.
- •
- Transactions with affiliates and insiders. The Dodd-Frank
Act generally enhanced the restrictions on transactions with affiliates under Section 23A and 23B of the Federal Reserve Act, including an expansion of the definition of "covered transactions"
and clarification regarding the amount of time for which collateral requirements regarding covered credit transactions must be satisfied. Insider transaction limitations are expanded through the
strengthening of loan restrictions to insiders and the expansion of the types of transactions subject to the various limits, including derivatives transactions, repurchase agreements, reverse
repurchase agreements and securities lending or borrowing transactions. Restrictions are also placed on certain asset sales to and from an insider to an institution, including requirements that such
sales be on market terms and, in certain circumstances, approved by the institution's board of directors.
- •
- Corporate governance. The Dodd-Frank Act addresses many investor protection, corporate governance and executive compensation matters that will affect most U.S. publicly traded companies, including us. The Dodd-Frank Act (1) grants shareholders of U.S. publicly traded companies an advisory vote on executive compensation; (2) enhances independence requirements for compensation committee members; (3) requires companies listed on national securities exchanges to adopt incentive-based compensation clawback policies for executive officers; and (4) provides the SEC with authority to adopt proxy access rules that would allow shareholders of publicly traded companies to nominate candidates for election as a director and have those nominees included in a company's proxy materials. For so long as we are an emerging growth company, we may take advantage of the provisions of the JOBS Act allowing us to not seek a non-binding advisory vote on executive compensation or golden parachute arrangements.
enforcement authority under federal consumer financial laws. In addition, the Dodd-Frank Act permits states to adopt consumer protection laws and regulations that are stricter than those regulations promulgated by the CFPB. Compliance with any such new regulations would increase our cost of operations.
The requirements of the Dodd-Frank Act are in the process of being implemented and many of the requirements remain subject to regulations to be implemented over the course of several years. Given the uncertainty associated with the manner in which the provisions of the Dodd-Frank Act will be implemented by the various regulatory agencies and through regulations, the full extent of the impact such requirements will have on our operations is unclear. The changes resulting from the Dodd-Frank Act may impact the profitability of our business activities, require changes to certain of our business practices, impose upon us more stringent capital, liquidity and leverage requirements or otherwise adversely affect our business. These changes may also require us to invest significant management attention and resources to evaluate and make any changes necessary to comply with new statutory and regulatory requirements.
Failure to comply with the new requirements may negatively impact our results of operations and financial condition.
101
The Volcker Rule
On December 10, 2013, the federal bank regulatory agencies, together with the SEC and the U.S. Commodity Futures Trading Commission, adopted a final rule, commonly known as the "Volcker Rule," under Section 619 of the Dodd-Frank Act that generally prohibits "banking entities" from engaging in "proprietary trading" and making investments and conducting certain other activities with "private equity funds and hedge funds." Although the final rule provides some tiering of compliance and reporting obligations based on size, the fundamental prohibitions of the Volcker Rule apply to banking entities of any size, including us and the Bank. The final regulations became effective April 1, 2014; however, at the time the agencies released the final Volcker Rule, the Federal Reserve announced an extension of the conformance period for all banking entities until July 21, 2015.
In response to industry questions regarding the final rule, the adopting agencies issued a clarifying interim final rule on January 14, 2014, permitting banking entities to retain interests in certain collateralized debt obligations backed by trust preferred securities if the collateralized debt obligations meet certain requirements.
We have reviewed the scope of the Volcker Rule and have preliminarily determined that we do not have any investments that meet the requirements of the rule.
Notice and Approval Requirements Related to Control
Federal and state banking laws impose notice, approval and ongoing regulatory requirements on any shareholder or other party that seeks to acquire direct or indirect "control" of an FDIC-insured depository institution. These laws include the BHC Act and the Change in Bank Control Act. The determination whether an investor "controls" a depository institution is based on all of the facts and circumstances surrounding the investment. As a general matter, a party is deemed to control a depository institution or other company if the party owns or controls 25.0% or more of any class of voting stock. Subject to rebuttal, a party may be presumed to control a depository institution or other company if the investor owns or controls 10.0% or more of any class of voting stock. Ownership by affiliated parties, or parties acting in concert, is typically aggregated for these purposes. If a party's ownership of our company were to exceed certain thresholds, the investor could be deemed to "control" our company for regulatory purposes. This could subject the investor to regulatory filings or other regulatory consequences.
In addition, except under limited circumstances, bank holding companies are prohibited from acquiring, without prior regulatory approval:
- •
- control of any other bank or bank holding company or all or substantially all the assets thereof; or
- •
- more than 5.0% of the voting shares of a bank or bank holding company which is not already a subsidiary.
Permissible Activities and Investments
Banking laws generally restrict our ability to engage in, or acquire 5% or more of the voting shares of a company engaged in, activities other than those determined by the Federal Reserve to be so closely related to banking as to be a proper incident thereto. The Gramm-Leach-Bliley Financial Modernization Act of 1999, or the GLB Act, expanded the scope of permissible activities for a bank holding company that qualifies as a financial holding company. Under the regulations implementing the GLB Act, a financial holding company may engage in additional activities that are financial in nature or incidental or complementary to a financial activity. Those activities include, among other activities, certain insurance and securities activities. Qualifications for becoming a financial holding company include, among other things, meeting certain specified capital standards and achieving certain
102
management ratings in examinations. Under the Dodd-Frank Act, bank holding companies and their subsidiaries must be well-capitalized and well-managed in order for the bank holding company and its nonbank affiliates to engage in the expanded financial activities permissible only for a financial holding company.
In addition, as a general matter, the establishment or acquisition by our company of a depository institution or, in certain cases, a non-bank entity, requires prior regulatory approval.
The Texas Constitution, as amended in 1986, provides that a Texas-chartered bank has the same rights and privileges that are or may be granted to national banks domiciled in Texas. To the extent that the Texas laws and regulations may have allowed state-chartered banks to engage in a broader range of activities than national banks, the Federal Deposit Insurance Corporation Improvement Act of 1991, or the FDICIA, has operated to limit this authority in most circumstances. The FDICIA provides that no state bank or subsidiary thereof may engage as a principal in any activity not permitted for national banks, unless the institution complies with applicable capital requirements and the FDIC determines that the activity poses no significant risk to the Deposit Insurance Fund. In general, statutory restrictions on the activities of banks are aimed at protecting the safety and soundness of depository institutions.
Branching
Texas law provides that a Texas-chartered bank can establish a branch anywhere in Texas provided that the branch is approved in advance by the Texas Department of Banking. The branch must also be approved by the Federal Reserve. When considering whether to approve the establishment of a branch, the Texas Department of Banking and the Federal Reserve consider a number of factors, including financial history, capital adequacy, earnings prospects, character of management, needs of the community and consistency with corporate powers. The Dodd-Frank Act permits insured state banks to engage in de novo interstate branching if the laws of the state where the new branch is to be established would permit the establishment of the branch if it were chartered by such state.
Regulatory Capital Requirements and Capital Adequacy
The Federal Reserve monitors our capital adequacy, on a consolidated basis, and the Federal Reserve and the Texas Department of Banking monitor the capital adequacy of the Bank. The regulatory agencies use a combination of risk-based guidelines and a leverage ratio to evaluate capital adequacy and consider these capital levels when taking action on various types of applications and when conducting supervisory activities related to safety and soundness. Assets and off-balance sheet items, such as letters of credit and unfunded loan commitments, are assigned to broad risk categories, each with appropriate risk weights. Regulatory capital, in turn, is classified in one of two tiers. "Tier 1" capital includes common equity, retained earnings, qualifying non-cumulative perpetual preferred stock, and minority interests in equity accounts of consolidated subsidiaries, less goodwill, most intangible assets and certain other assets. "Tier 2" capital includes, among other things, qualifying subordinated debt and allowances for loan and lease losses, subject to limitations. The resulting capital ratios represent capital as a percentage of total risk-weighted assets and off-balance sheet items.
Federal Reserve regulations currently require state chartered member banks and bank holding companies generally to maintain three minimum capital standards: (1) a Tier 1 capital to total assets ratio, or "leverage capital ratio," of at least 4.0%; (2) a Tier 1 capital to risk-weighted assets ratio, or "Tier 1 risk-based capital ratio," of at least 4.0%; and (3) a total risk-based capital (Tier 1 plus Tier 2) to risk-weighted assets ratio, or "total risk-based capital ratio," of at least 8.0%. In addition, the Texas Department of Banking has issued a policy which generally requires state chartered banks to maintain a leverage capital ratio of 5.0%. In addition, the prompt corrective action standards discussed below, in effect, increase the minimum regulatory capital ratios for banking organizations. These capital
103
requirements are minimum requirements. Higher capital levels may be required if warranted by the particular circumstances or risk profiles of individual institutions, or if required by the banking regulators due to the economic conditions impacting our primary markets. For example, Federal Reserve regulations provide that higher capital may be required to take adequate account of, among other things, interest rate risk and the risks posed by concentrations of credit, nontraditional activities or securities trading activities.
Failure to meet capital guidelines could subject us to a variety of enforcement remedies, including issuance of a capital directive, a prohibition on accepting brokered deposits, other restrictions on our business and the termination of deposit insurance by the FDIC.
The Dodd-Frank Act directed federal banking agencies to establish minimum leverage capital requirements and minimum risk-based capital requirements for depository institution holding companies and non-bank financial companies supervised by the Federal Reserve that are not less than the "generally applicable leverage and risk-based capital requirements" applicable to insured depository institutions, in effect applying the same leverage and risk-based capital requirements that apply to insured depository institutions to most bank holding companies. In addition, the Dodd-Frank Act requires the federal banking agencies to adopt capital requirements that address the risks that the activities of an institution pose to the institution and the public and private stakeholders, including risks arising from certain enumerated activities.
Basel III
The current risk-based capital guidelines that apply to us and the Bank are based on the 1988 capital accord, referred to as Basel I, of the International Basel Committee on Banking Supervision, or Basel Committee, a committee of central banks and bank supervisors, as implemented by federal bank regulators. In 2004, the Basel Committee published a new capital accord, Basel II. Basel II modifies risk weightings in an attempt to make capital requirements more risk sensitive and provides two approaches for setting capital standards for credit risk: an "advanced," internal ratings-based approach tailored to individual institutions' circumstances, and a "standardized" approach that bases risk weightings on external credit assessments to a much greater extent than permitted under existing risk-based capital guidelines. Basel II also sets capital requirements for operational risk and refines the existing capital requirements for market risk exposures. In 2007, the federal banking agencies adopted final rules implementing the advanced approaches of Basel II for "core" bank holding companies and banks having $250.0 billion or more in total consolidated assets or $10.0 billion or more of foreign exposures. These rules did not apply to the Bank or us.
On December 16, 2010, the Basel Committee released its final framework for strengthening international capital and liquidity regulation, known as Basel III, which substantially revised the existing capital requirements for banking organizations. Modest revisions were made in June 2011. The Basel III standards operate in conjunction with portions of the Basel I and Basel II standards previously released by the Basel Committee. On June 7, 2012, the Federal Reserve, the OCC and the FDIC requested comment on these proposed rules that, taken together, would implement the Basel regulatory capital reforms through what we refer to herein as the "Basel III Capital Rules."
In July 2013, the federal banking agencies published the final Basel III Capital Rules, which revised their risk-based and leverage capital requirements and their method for calculating risk-weighted assets to implement, in part, agreements reached by the Basel Committee and certain provisions of the Dodd-Frank Act. While some provisions are tailored to larger institutions, the Basel III Capital Rules generally apply to all banking organizations, including the Bank and us. Among other things, the Basel III Capital Rules: (1) introduce a new capital measure entitled "Common Equity Tier 1," or CET1; (2) specify that Tier 1 capital consist of CET1 and additional financial instruments satisfying specified requirements that permit inclusion in Tier 1 capital; (3) define CET1
104
narrowly by requiring that most deductions or adjustments to regulatory capital measures be made to CET1 and not to the other components of capital; and (4) expand the scope of the deductions or adjustments from capital as compared to the existing regulations.
Under the Basel III Capital Rules, banking organizations are provided a one-time option in their initial regulatory financial report filed after January 1, 2015 to remove certain components of accumulated other comprehensive income from the computation of common equity regulatory capital.
The Basel III Capital Rules also provide a permanent exemption from the proposed phase out of existing trust preferred securities and cumulative perpetual preferred stock from regulatory capital for banking organizations with less than $15 billion in total assets, while also implementing stricter eligibility requirements for regulatory capital instruments that should serve to disallow the inclusion of all non-exempt issuances of trust preferred securities and cumulative perpetual preferred stock from Tier 1 capital. The Basel III Capital Rules also provide additional constraints on the inclusion of minority interests, mortgage servicing assets, deferred tax assets and certain investments in the capital of unconsolidated financial institutions in Tier 1 capital, as well as providing stricter risk weighting rules to these assets.
The Basel III Capital Rules provide for the following minimum capital to risk-weighted assets ratios:
- •
- 4.5% based upon CET1;
- •
- 6.0% based upon Tier 1 capital; and
- •
- 8.0% based upon total regulatory capital.
A minimum leverage ratio (Tier 1 capital as a percentage of total assets) of 4.0% is also required under the Basel III Capital Rules. The Basel III Capital Rules additionally require institutions to retain a capital conservation buffer of 2.5% above these required minimum capital ratio levels. Banking organizations that fail to maintain the minimum 2.5% capital conservation buffer could face restrictions on capital distributions or discretionary bonus payments to executive officers, with distributions and discretionary bonus payments being completely prohibited if no capital conservation buffer exists, or in the event of the following: (1) the banking organization's capital conservation buffer was below 2.5% at the beginning of a quarter; and (2) its cumulative net income for the most recent quarterly period plus the preceding four calendar quarters is less than its cumulative capital distributions (as well as associated tax effects not already reflected in net income) during the same measurement period.
The Basel III Capital Rules also provide stricter rules related to the risk weighting of past due and certain commercial real estate loans, as well as on some equity investment exposures, and replaces the existing credit rating approach for determining the risk weighting of securitization exposures with an alternative approach.
Finally, the Basel III Capital Rules amend the thresholds under the prompt corrective action framework applicable to the Bank to reflect both (1) the generally heightened requirements for regulatory capital ratios as well as (2) the introduction of the CET1 capital measure.
The enactment of the Basel III Capital Rules will increase the required capital levels of the Bank and us. The Basel III Capital Rules become effective as applied to us and the Bank on January 1, 2015, with a phase in period from January 1, 2015 through January 1, 2019. We expect that we will meet all minimum capital requirements under the final rule when it becomes effective and as if fully phased in at the bank and bank holding company levels.
105
Liquidity Coverage Ratio
The Basel III Capital Rules did not address the proposed liquidity coverage ratio called for by the Basel Committee's Basel III framework. On October 24, 2013, the Federal Reserve issued a proposed rule implementing a liquidity coverage ratio requirement in the United States for larger banking organizations. Neither the Bank nor we would be subject to the liquidity coverage ratio requirement as proposed.
Prompt Corrective Action
Under the FDIA, the federal bank regulatory agencies must take prompt corrective action against undercapitalized U.S. depository institutions. U.S. depository institutions are assigned one of five capital categories: "well capitalized," "adequately capitalized," "undercapitalized," "significantly undercapitalized," and "critically undercapitalized," and are subjected to different regulation corresponding to the capital category within which the institution falls. Currently, a depository institution is deemed to be "well capitalized" if the banking institution has a total risk-based capital ratio of 10.0% or greater, a Tier 1 risk-based capital ratio of 6.0% or greater, a leverage ratio of 5.0% or greater and the institution is not subject to an order, written agreement, capital directive or prompt corrective action directive to meet and maintain a specific level for any capital measure. Under certain circumstances, a well-capitalized, adequately capitalized or undercapitalized institution may be treated as if the institution were in the next lower capital category. A banking institution that is undercapitalized is required to submit a capital restoration plan. The capital restoration plan will not be accepted by the regulators unless each company having control of the undercapitalized institution guarantees the subsidiary's compliance with the capital restoration plan up to a certain specified amount.
Failure to meet capital guidelines could subject the institution to a variety of enforcement remedies by federal bank regulatory agencies, including termination of deposit insurance by the FDIC, restrictions on certain business activities and appointment of the FDIC as conservator or receiver. As of June 30, 2014, the Bank met the requirements to be "well capitalized" under the prompt corrective action regulations.
As discussed above, the Basel III Capital Rules amend the thresholds under the prompt corrective action framework applicable to the Bank to reflect both (1) the generally heightened requirements for regulatory capital ratios as well as (2) the introduction of the CET1 capital measure.
Regulatory Limits on Dividends and Distributions
As a bank holding company, we are subject to certain restrictions on dividends under applicable banking laws and regulations. The Federal Reserve has issued a policy statement that provides that a bank holding company should not pay dividends unless (1) its net income over the last four quarters (net of dividends paid) has been sufficient to fully fund the dividends, (2) the prospective rate of earnings retention appears to be consistent with the capital needs, asset quality and overall financial condition of the bank holding company and its subsidiaries and (3) the bank holding company will continue to meet minimum required capital adequacy ratios. Accordingly, a bank holding company should not pay cash dividends that exceeds its net income or that can only be funded in ways that weaken the bank holding company's financial health, such as by borrowing. The Dodd-Frank Act imposes, and Basel III results in, additional restrictions on the ability of banking institutions to pay dividends.
Substantially all of our income, and a principal source of our liquidity, are dividends from the Bank, and the ability of the Bank to pay dividends to us is also restricted by federal and state laws, regulations and policies. Texas state law places limitations on the amount that state banks may pay in dividends, which the Bank must adhere to when paying dividends to us. Federal law also imposes
106
limitations upon certain capital distributions by banks that are members of the Federal Reserve System, such as certain cash dividends, payments to repurchase or otherwise acquire its shares, payments to shareholders of another institution in a cash-out merger and other distributions charged against capital. The Federal Reserve and Texas Department of Banking regulate all capital distributions by the Bank directly or indirectly to us, including dividend payments.
Additionally, under federal law, the Bank may not pay a dividend to us if, after paying those dividends, the Bank would fail to meet the required minimum levels under risk-based capital guidelines and the minimum leverage and tangible capital ratio requirements. Under the Federal Deposit Insurance Act, or the FDIA, an insured depository institution such as the Bank is prohibited from making capital distributions, including the payment of dividends, if, after making such distribution, the institution would become "undercapitalized." The Federal Reserve may further restrict the payment of dividends by requiring the Bank to maintain a higher level of capital than would otherwise be required to be adequately capitalized for regulatory purposes. Payment of dividends by the Bank also may be restricted at any time at the discretion of the appropriate regulator if it deems the payment to constitute an unsafe and unsound banking practice. As noted above, the capital conservation buffer created under the Basel III Capital Rules, when fully implemented, may also have the effect of limiting the payment of capital distributions from the Bank.
Reserve Requirements
In accordance with regulations of the Federal Reserve, all banking organizations are required to maintain average daily reserves at mandated ratios against their transaction accounts. In addition, reserves must be maintained on certain non-personal time deposits. These reserves must be maintained in the form of vault cash or in an account at a Federal Reserve Bank.
Limits on Transactions with Affiliates and Insiders
Insured depository institutions are subject to restrictions on their ability to conduct transactions with affiliates and other related parties. Section 23A of the Federal Reserve Act imposes quantitative limits, qualitative requirements and collateral requirements on certain transactions by an insured depository institution with, or for the benefit of, its affiliates. Transactions covered by Section 23A include loans, extensions of credit, investment in securities issued by an affiliate and acquisitions of assets from an affiliate. Section 23B of the Federal Reserve Act requires that most types of transactions by an insured depository institution with, or for the benefit of, an affiliate be on terms at least as favorable to the insured depository institution as if the transaction were conducted with an unaffiliated third party.
As noted above, the Dodd-Frank Act generally enhances the restrictions on transactions with affiliates under Section 23A and 23B of the Federal Reserve Act, including an expansion of the definition of "covered transactions" and a clarification regarding the amount of time for which collateral requirements regarding covered credit transactions must be satisfied. The ability of the Federal Reserve to grant exemptions from these restrictions is also narrowed by the Dodd-Frank Act, including by requiring coordination with other bank regulators.
The Federal Reserve's Regulation O regulations impose restrictions and procedural requirements in connection with the extension of credit by an insured depository institution to directors, executive officers, principal shareholders and their related interests.
Brokered Deposits
The FDIA restricts the use of brokered deposits by certain depository institutions. Under the applicable regulations, (1) a well capitalized insured depository institution may solicit and accept, renew or roll over any brokered deposit without restriction, (2) an adequately capitalized insured depository
107
institution may not accept, renew or roll over any brokered deposit unless it has applied for and been granted a waiver of this prohibition by the FDIC, and (3) an undercapitalized insured depository institution may not accept, renew or roll over any brokered deposit. The FDIC may, on a case-by-case basis and upon application by an adequately capitalized insured depository institution, waive the restriction on brokered deposits upon a finding that the acceptance of brokered deposits does not constitute an unsafe or unsound practice with respect to such institution.
Concentrated Commercial Real Estate Lending Guidance
The federal banking agencies, including the Federal Reserve, have promulgated guidance governing financial institutions with concentrations in commercial real estate lending. The guidance provides that a bank has a concentration in commercial real estate lending if (1) total reported loans for construction, land development and other land represent 100.0% or more of total capital or (2) total reported loans secured by multifamily and nonfarm residential properties and loans for construction, land development and other land represent 300.0% or more of total capital and the bank's commercial real estate loan portfolio has increased 50.0% or more during the prior 36 months. Owner occupied commercial real estate loans are excluded from this second category. If a concentration is present, management must employ heightened risk management practices that address the following key elements: including board and management oversight and strategic planning, portfolio management, development of underwriting standards, risk assessment and monitoring through market analysis and stress testing and maintenance of increased capital levels as needed to support the level of commercial real estate lending.
Examination and Examination Fees
The Federal Reserve periodically examines and evaluates state member banks. Based on such an evaluation, the Bank, among other things, may be required to revalue its assets and establish specific reserves to compensate for the difference between the Bank's assessment and that of the Federal Reserve. The Texas Department of Banking also conducts examinations of state banks but may accept the results of a federal examination in lieu of conducting an independent examination. In addition, the Federal Reserve and Texas Department of Banking may elect to conduct a joint examination. The Federal Reserve currently charges fees to recover the costs of examining member banks, processing applications and other filings and covering direct and indirect expenses in regulating member banks. The Texas Department of Banking charges fees to recover the costs of examining Texas chartered banks. The Dodd-Frank Act provides various agencies with the authority to assess additional supervision fees.
Deposit Insurance and Deposit Insurance Assessments
The FDIC is an independent federal agency that insures the deposits of federally insured depository institutions up to applicable limits. The FDIC also has certain regulatory, examination and enforcement powers with respect to FDIC-insured institutions. The deposits of the Bank are insured by the FDIC up to applicable limits. As a general matter, the maximum deposit insurance amount is $250,000 per depositor.
FDIC-insured depository institutions are required to pay deposit insurance assessments to the FDIC. The amount of a particular institution's deposit insurance assessment for institutions with less than $10.0 billion in assets is based on that institution's risk classification under an FDIC risk-based assessment system, with certain adjustments for any unsecured debt or brokered deposits held by the insured bank. An institution's risk classification is assigned based on its capital levels and the level of supervisory concern the institution poses to the regulators. Institutions assigned to higher risk categories (that is, institutions that pose a higher risk of loss to the Deposit Insurance Fund) pay assessments at higher rates than institutions that pose a lower risk. An institution's risk classification is
108
assigned based on a combination of its financial ratios and supervisory ratings, reflecting, among other things, its capital levels and the level of supervisory concern that the institution poses to the regulators. Deposit insurance assessments fund the Deposit Insurance Fund, which is currently underfunded.
As noted above, the Dodd-Frank Act changed the way an insured depository institution's deposit insurance premiums are calculated. Continued action by the FDIC to replenish the Deposit Insurance Fund, as well as these changes may impact assessment rates, which could impact the profitability of our operations.
Depositor Preference
The FDIA provides that, in the event of the "liquidation or other resolution" of an insured depository institution, the claims of depositors of the institution (including the claims of the FDIC as subrogee of insured depositors) and certain claims for administrative expenses of the FDIC as a receiver will have priority over other general unsecured claims against the institution. If we invest in or acquire an insured depository institution that fails, insured and uninsured depositors, along with the FDIC, will have priority in payment ahead of unsecured, non-deposit creditors, including us, with respect to any extensions of credit they have made to such insured depository institution.
Anti-Money Laundering and OFAC
Under federal law, financial institutions must maintain anti-money laundering programs that include established internal policies, procedures and controls; a designated compliance officer; an ongoing employee training program; and testing of the program by an independent audit function. Financial institutions are also prohibited from entering into specified financial transactions and account relationships and must meet enhanced standards for due diligence and customer identification in their dealings with non-U.S. financial institutions and non-U.S. customers. Financial institutions must take reasonable steps to conduct enhanced scrutiny of account relationships to guard against money laundering and to report any suspicious transactions, and law enforcement authorities have been granted increased access to financial information maintained by financial institutions. Bank regulators routinely examine institutions for compliance with these obligations and they must consider an institution's compliance with such obligations in connection with the regulatory review of applications, including applications for banking mergers and acquisitions. The regulatory authorities have imposed "cease and desist" orders and civil money penalty sanctions against institutions found to be violating these obligations.
The U.S. Department of the Treasury's Office of Foreign Assets Control, or OFAC, is responsible for helping to ensure that U.S. entities do not engage in transactions with certain prohibited parties, as defined by various Executive Orders and Acts of Congress. OFAC publishes lists of persons, organizations and countries suspected of aiding, harboring or engaging in terrorist acts, known as Specially Designated Nationals and Blocked Persons. If we or the Bank find a name on any transaction, account or wire transfer that is on an OFAC list, we or the Bank must freeze or block such account or transaction, file a suspicious activity report and notify the appropriate authorities.
Consumer Laws and Regulations
Banking organizations are subject to numerous laws and regulations intended to protect consumers. These laws include, among others:
- •
- Truth in Lending Act;
- •
- Truth in Savings Act;
- •
- Electronic Funds Transfer Act;
109
- •
- Expedited Funds Availability Act;
- •
- Equal Credit Opportunity Act;
- •
- Fair and Accurate Credit Transactions Act;
- •
- Fair Housing Act;
- •
- Fair Credit Reporting Act;
- •
- Fair Debt Collection Act;
- •
- Gramm-Leach-Bliley Act;
- •
- Home Mortgage Disclosure Act;
- •
- Right to Financial Privacy Act;
- •
- Real Estate Settlement Procedures Act;
- •
- laws regarding unfair and deceptive acts and practices; and
- •
- usury laws.
Many states and local jurisdictions have consumer protection laws analogous, and in addition, to those listed above. These federal, state and local laws regulate the manner in which financial institutions deal with customers when taking deposits, making loans, or conducting other types of transactions. Failure to comply with these laws and regulations could give rise to regulatory sanctions, customer rescission rights, action by state and local attorneys general and civil or criminal liability. The creation of the CFPB by the Dodd-Frank Act has led to enhanced enforcement of consumer financial protection laws.
Community Reinvestment Act
The CRA is intended to encourage banks to help meet the credit needs of their service areas, including low and moderate-income neighborhoods, consistent with safe and sound operations. The bank regulators examine and assign each bank a public CRA rating. The CRA then requires bank regulators to take into account the federally insured bank's record in meeting the needs of its service area when considering an application by a bank to establish or relocate a branch or to conduct certain mergers or acquisitions. The Federal Reserve is required to consider the CRA records of a bank holding company's controlled banks when considering an application by the bank holding company to acquire a banking organization or to merge with another bank holding company. When we or the Bank applies for regulatory approval to engage in certain transactions, the regulators will consider the CRA record of target institutions and our depository institution subsidiaries. An unsatisfactory CRA record could substantially delay approval or result in denial of an application. The regulatory agency's assessment of the institution's record is made available to the public. The Bank received an overall CRA rating of "satisfactory" on its most recent CRA examination.
Changes in Laws, Regulations or Policies
Federal, state and local legislators and regulators regularly introduce measures or take actions that would modify the regulatory requirements applicable to banks, their holding companies and other financial institutions. Changes in laws, regulations or regulatory policies could adversely affect the operating environment for our company in substantial and unpredictable ways, increase our cost of doing business, impose new restrictions on the way in which we conduct our operations or add significant operational constraints that might impair our profitability. We cannot predict whether new legislation will be enacted and, if enacted, the effect that it, or any implementing regulations, would have on our business, financial condition or results of operations. The Dodd-Frank Act is in the process
110
of imposing substantial changes to the regulatory framework applicable to us and our subsidiaries. The majority of these changes will be implemented over time by various regulatory agencies. The full effect that these changes will have on us remains uncertain at this time and may have a material adverse effect on our business and results of operations.
Effect on Economic Environment
The policies of regulatory authorities, including the monetary policy of the Federal Reserve, have a significant effect on the operating results of bank holding companies and their subsidiaries. Among the means available to the Federal Reserve to affect the money supply are open market operations in U.S. government securities, changes in the discount rate on member bank borrowings and changes in reserve requirements against member bank deposits. These means are used in varying combinations to influence overall growth and distribution of bank loans, investments and deposits, and their use may affect interest rates charged on loans or paid for deposits. Federal Reserve monetary policies have materially affected the operating results of commercial banks in the past and are expected to continue to do so in the future. We cannot predict the nature of future monetary policies and the effect of such policies on our business and earnings.
111
Executive Officers and Directors
The following table sets forth information regarding our directors and executive officers as of the date of this prospectus.
Name
|
Age | Position | |||
|---|---|---|---|---|---|
C. Malcolm Holland, III |
54 | Chairman, Chief Executive Officer and President | |||
William C. Murphy |
65 | Vice Chairman | |||
Noreen E. Skelly |
49 | Chief Financial Officer | |||
LaVonda Renfro |
53 | Executive Vice President and Chief Retail Officer | |||
Angela Harper |
45 | Executive Vice President and Credit Risk Officer | |||
Jeff Kesler |
36 | Chief Lending Executive | |||
Pat S. Bolin |
63 | Director | |||
Blake Bozman |
43 | Director | |||
Mark Griege |
55 | Director | |||
Michael D. Ilagan |
47 | Director | |||
Michael Kowalski |
60 | Director | |||
John Sughrue |
53 | Director | |||
Ray W. Washburne |
54 | Director | |||
The following is a brief discussion of the business and banking background and experience of our directors and executive officers. No director has any family relationship, as defined in Item 401 of Regulation S-K, with any other director or with any of our executive officers.
C. Malcolm Holland, III founded our company and has been our Chairman of the Board, Chief Executive Officer and President since 2009 and the Chairman of the Board, Chief Executive Officer and President of the Bank since its inception in 2010. Mr. Holland began his career in 1982 as a credit analyst and commercial lender at First City Bank. In 1984, Mr. Holland joined Capital Bank as a vice president of commercial lending. From 1985 to 1998, Mr. Holland was an organizer and executive vice president of EastPark National Bank, a de novo bank that opened in 1986. EastPark National Bank was acquired by Fidelity Bank of Dallas in 1995, and Mr. Holland served as executive vice president and head of commercial lending for Fidelity Bank of Dallas from 1995 to 1998, when the bank was acquired by Compass Bank. From 1998 to 2000, Mr. Holland served as senior vice president and head of business banking for Compass Bank. Mr. Holland served as President of First Mercantile Bank from 2000 to 2002, when the bank was acquired by Colonial Bank. From 2003 to 2009, Mr. Holland served as Chief Executive Officer for the Texas Region of Colonial Bank. Mr. Holland is a past president of the Texas Golf Association and was one of 15 members of the Executive Committee of the United States Golf Association in 2013. Mr. Holland is an active member and chairman of the business advisory committee of Watermark Community Church. He has served as chairman of the College Golf Fellowship since 2002. Mr. Holland received his Bachelor of Business Administration from Southern Methodist University in 1982. With over 30 years of banking experience in the Dallas metropolitan area, Mr. Holland's extensive business and banking experience and his community involvement and leadership skills qualify him to serve as on our board and as Chairman.
William C. Murphy has served as the Vice Chairman of both our company and the Bank since 2011 and actively participates in the execution of our business strategy and assists in the credit review process. From 2006 to 2011, Mr. Murphy served as the Chairman of the Board of Parkway National Bank and Parkway Bancshares, Inc., which were renamed Fidelity Bank of Dallas and Fidelity Resources Company, respectively. From 2001 to 2005, Mr. Murphy was the President and Chief Executive Officer of Mercantile Bank & Trust, and from 1999 to 2000, he served as a consultant for the Houston-based Sterling Bank to evaluate expansion opportunities in the Dallas market. From 1988 to
112
1998, Mr. Murphy served as the President and Chief Executive Officer of Fidelity Bank of Dallas, and then as an executive officer of the bank after it was acquired by Compass Bank in 1998. Under his leadership Fidelity completed four bank acquisition and three branch acquisitions and grew to $350 million in total assets with 14 banking offices. Mr. Murphy serves on the boards of Eagle Oil & Gas Co. and Foundation One Insurance Services. Mr. Murphy received a Bachelor of Business Administration in accounting from Southern Methodist University in 1971 and a Masters of Business Administration from Southern Methodist University in 1973. With over 40 years of banking experience in the Dallas metropolitan area, Mr. Murphy's perspective, knowledge and extensive community relationships qualify him to serve on our board and as Vice Chairman.
Noreen E. Skelly has served as the Chief Financial Officer of our company and the Bank since June 2012. Ms. Skelly is responsible for the Finance, Accounting, Treasury, and Information Technology functions of the Bank. From 2009 to March 2012, Ms. Skelly was the Chief Financial Officer of Highlands Bancshares, Inc., and from 2007 to 2009, she served as Senior Vice President and Retail Bank Division Finance Officer of Comerica Bank. From 1996 to 2007, Ms. Skelly served in various capacities for ABN AMRO/LaSalle Bank eventually becoming Senior Vice President and Chief Finance Officer of the Retail Line of Business. Ms. Skelly started her professional career at the Federal Reserve Bank of Chicago in 1987 and was promoted in 1996 to serve as an accounting policy analyst for the Board of Governors of the Federal Reserve System in Washington D.C. Ms. Skelly received a Bachelor of Business Administration in finance from the University of Texas at Austin in 1987 and a Masters of Business Administration from the University of Chicago Booth School of Business in 1993.
LaVonda Renfro has served as Executive Vice President and Chief Retail Officer of the Bank since 2010. Ms. Renfro is responsible for the overall administration and coordination of the activities of the Bank's branches, including operations, sales and marketing, deposit operations, merchant services, private banking, business banking and treasury management. From 2005 to 2010, Ms. Renfro served as the Retail Executive of Colonial Bank/BB&T. From 1994 to 2005, Ms. Renfro was Senior Vice President, District Manager for Bank of America's Austin and San Antonio Markets.
Angela Harper has served as Executive Vice President and Credit Risk Officer of the Bank since 2009. Ms. Harper oversees the credit underwriting, loan operations, compliance and Bank Secrecy Act departments. From 2002 to 2009, Ms. Harper served in various capacities at Colonial Bank including Senior Vice President, Chief Credit Administration and Risk Management Officer for the Texas region. Ms. Harper began her career in banking as an OCC Bank Examiner from 1991 to 1995 working in the Dallas Duty Station. Ms. Harper received a Bachelor of Business Administration in Finance in 1989 and a Masters of Business Administration from Texas Tech University in 1990 and is a Certified Regulatory Compliance Manager (CRCM).
Jeff Kesler has served as the Chief Lending Executive of the Bank since May 2014. Mr. Kesler is responsible for credit quality and profitability of the lending function. From May 2013 to May 2014, Mr. Kesler served as the Director of Loan Originations for United Development, a real estate investment trust. From 2009 to 2013, Mr. Kesler served as a Market President of Veritex Community Bank's North Dallas region. Mr. Kesler began his career in 2000 at Colonial Bank where he served in various capacities, eventually becoming an area president for the Dallas and Austin markets. Mr. Kesler received a Bachelor of Business Administration from Fort Hays State University in 2000.
Pat S. Bolin joined our board of directors in March 2011 upon our acquisition of Fidelity Bank of Dallas. Mr. Bolin is the Executive Chairman of the Board of Eagle Oil & Gas Co. a private independent oil and gas company based in Dallas founded by Mr. Bolin in 1976. Mr. Bolin is also Chairman of the Board and Chief Executive officer of Eagle Corp., Inc. Mr. Bolin began his professional career as a landman for Mitchell Energy Corp. in 1973. Mr. Bolin currently serves on the board of directors of Fidelity Bank, Wichita Falls, Texas and its holding company, FB Bancshares, Inc. Mr. Bolin has previously served on the boards of directors of Mercantile Bank & Trust and Fidelity
113
Bank of Dallas. Mr. Bolin also serves on the board of directors for Goodwill Industries and the executive board of the Southern Methodist University Cox School of Business and the Second Century Campaign Steering Committee at Southern Methodist University. Mr. Bolin received a Bachelor of Arts in Psychology from Southern Methodist University in 1973. Mr. Bolin's diverse business and community banking experience along with his community involvement qualify him to serve on our board.
Blake Bozman has served on our board since September 2010. Mr. Bozman is a Managing Director of Freedom Truck Finance, a secondary truck finance company based in Dallas. From 2007 to 2013, Mr. Bozman oversaw the operations of Prattco International, Inc., a family-owned business specializing in real estate investments and purchasing oil and gas properties. From 1995 to 2006, Mr. Bozman was with Drive Financial Services, a consumer finance company focused on sub-prime auto finance, which he co-founded in 1995 and served as Executive Vice President of Sales and Originations. Mr. Bozman received a Bachelor of Arts in Marketing from Southern Methodist University in 1993. Mr. Bozman's business experience, particularly in the consumer financial services industry, qualifies him to serve on our board.
Mark Griege has served on our board since 2009. Mr. Griege is a Managing Partner of Robertson, Griege & Thoele, a large-independent wealth management firm based in Dallas, which he co-founded in 1985. Mr. Griege received a Bachelor of Business Administration from Southern Methodist University in 1981, and a Juris Doctor from the University of Texas School of Law in 1985. His significant experience and leadership of Robertson, Griege & Thoele brings perspective and knowledge to our board regarding a variety of investment, businesses and leadership and qualifies him to serve on our board.
Michael D. Ilagan has served on our board since 2014. Since 2006, Mr. Ilagan has been with SunTx Capital Partners, where he is currently a Principal. From 1998 to 2005, Mr. Ilagan was an attorney at Skadden, Arps, Slate, Meagher, & Flom, LLP, and from 1988 to 1991, he was a consultant at Bain & Company. He also serves on the board of directors of Carolina Beverage Group LLC and The Park Group Ltd. and previously served on the board of directors of Huron Inc. Mr. Ilagan received a Bachelor of Arts in Economics from the University of Chicago in 1988, a Masters of Business Administration from the University of Chicago in 1992, and a Juris Doctor from the Chicago-Kent College of Law in 1998. Mr. Ilagan's business experience and legal understanding qualifies him to serve on our board.
Michael Kowalski has served as a director of our company and the Bank since June 2013. Since March 2013, Mr. Kowalski has served as Senior Vice President of Pacific Premier Bank, following its acquisition of First Associations Bank. From 2007 to March 2013, Mr. Kowalski served as Chairman and Chief Executive Officer of First Associations Bank. Mr. Kowalski received a Bachelor of Science in Mathematics from John Carroll University in 1976 and has been a licensed Certified Public Accountant since 1979. Mr. Kowalski's financial expertise and 30 years of community banking experience provides our board with significant knowledge and insight regarding the business and operations of banks and qualifies him to serve on our board.
John Sughrue has served as a director of our company since 2009. Mr. Sughrue currently serves as the Chairman of FIG Enterprises, Inc., the parent company of the Fashion Industry Gallery, a boutique wholesale venue for the fashion retail trade. Mr. Sughrue also serves as a Director and Chief Executive Officer of Brooks Partners, Inc., a diversified real estate company based in Dallas, which he founded in 1994. From 2007 to 2009, Mr. Sughrue served as an advisory board member for the Texas Region of Colonial Bank. From 1987 to 1989, Mr. Sughrue was an associate at Merrill Lynch Capital Markets and from 1983 to 1985 he was a Real Estate Lending Officer at Chemical Bank. Mr. Sughrue received a Bachelor of Arts in Economics from Harvard College in 1982 and a Masters of Business
114
Administration from the Amos Tuck School of Business at Dartmouth College in 1988. Mr. Sughrue's significant business experience and community involvement qualifies him to serve on our board.
Ray W. Washburne has served on our board since 2009. Mr. Washburne is currently the owner and serves as Chairman and Chief Executive Officer of Charter Holdings, a Dallas based private investment company. In addition, Mr. Washburne is the co-owner of M Crowd Restaurant Group, which owns the Mi Cocina and Taco Diner restaurant chains, which he co-founded in 1991. Since 2009 he has also served as the managing partner of the Highland Park Village, a premier retail destination in Dallas. Additionally, Mr. Washburne currently serves as the Finance Chairman of the Republican National Committee. Mr. Washburne received his Bachelor of Arts from Southern Methodist University in 1984. Mr. Washburne's leadership skills and business experience qualify him to serve on our board.
Composition of the Board of Directors
Upon completion of the proposed offering, our board of directors will consist of nine members. As discussed in greater detail below, our board of directors has affirmatively determined that seven of our nine current directors qualify as independent directors based upon the corporate governance standards of the Nasdaq Stock Market.
Under the terms of our amended and restated certificate of formation, our board of directors is elected at the annual meeting of shareholders, or special meeting in lieu thereof. Accordingly, the directors named above will stand for election at the 2015 annual meeting of shareholders, at which time their successors will be elected to serve from the time of election until the next annual meeting of shareholders following his or her election and the election and qualification of his or her successor. Individuals appointed to fill additional directorships resulting from an increase in the number of directors (as discussed above) will serve from the time such individual is appointed until the next annual meeting of shareholders and the election and qualification of his or her successor.
Director Independence
Under the rules of the Nasdaq Stock Market, independent directors must comprise a majority of our board of directors within a specified period of time of this offering. The rules of the Nasdaq Stock Market, as well as those of the SEC, also impose several other requirements with respect to the independence of our directors. Our board of directors has undertaken a review of the independence of each director based upon these rules. Applying these standards, our board of directors has affirmatively determined that, with the exception of Messrs. Holland and Murphy, each of our current directors qualifies as an independent director under applicable rules. In making these determinations, our board of directors considered the current and prior relationships that each director has with our company and all other facts and circumstances our board of directors deemed relevant in determining their independence, including the beneficial ownership of our capital stock by each director, and the transactions involving them described in the section titled "Certain Relationships and Related Party Transactions."
Risk Management and Oversight
Our board of directors oversees our risk management process, including a company-wide approach to risk management, carried out by our management. Our full board determines the appropriate risk for us generally, assesses the specific risks faced by us, and reviews the steps taken by management to manage those risks. While our full board maintains the ultimate oversight responsibility for the risk management process, its committees oversee risk in certain specified areas. In particular, our compensation committee is responsible for overseeing the management of risks relating to our executive compensation plans and arrangements, and the incentives created by the compensation awards it administers. Our audit committee oversees management of enterprise risks as well as financial
115
risks and, effective upon the consummation of this offering, will also be responsible for overseeing potential conflicts of interests. Effective upon the listing of our common stock on an exchange, our nominating and corporate governance committee will be responsible for overseeing the management of risks associated with the independence of our board of directors. Management regularly reports on applicable risks to the relevant committee or the full board, as appropriate, with additional review or reporting on risks conducted as needed or as requested by our board of directors and its committees.
Leadership Structure
Our board of directors meets quarterly, and the board of directors of the Bank meets monthly. Our board of directors does not have a policy regarding the separation of the roles of Chief Executive Officer and Chairman of the Board, as the board believes that it is in the best interests of our organization to make that determination from time to time based on the position and direction of our organization and the membership of the board. The board has determined that having our Chief Executive Officer serve as Chairman of the Board is in the best interests of our shareholders at this time. This structure makes best use of the Chief Executive Officer's extensive knowledge of our organization and the banking industry. The board views this arrangement as also providing an efficient nexus between our organization and the board, enabling the board to obtain information pertaining to operational matters expeditiously and enabling our Chairman to bring areas of concern before the board in a timely manner.
Committees of the Board of Directors
Our board of directors plans to establish the following committees in connection with this offering: an audit committee, a compensation committee and a corporate governance and nominating committee. The composition and responsibilities of each committee are described below. Members will serve on these committees until their resignation or until otherwise determined by our board of directors.
Audit Committee
Upon completion of this offering, our audit committee will consist of Pat S. Bolin, Blake Bozman, Michael Kowalski and John Sughrue, with Michael Kowalski serving as chair of the audit committee. Our audit committee will have responsibility for, among other things:
- •
- selecting and hiring our independent registered public accounting firm, and pre-approving the audit and non-audit
services to be performed by our independent registered public accounting firm;
- •
- evaluating the qualifications, performance and independence of our independent registered public accounting firm;
- •
- monitoring the integrity of our financial statements and our compliance with legal and regulatory requirements as they
relate to financial statements or accounting matters;
- •
- reviewing the adequacy and effectiveness of our internal control policies and procedures;
- •
- discussing the scope and results of the audit with the independent registered public accounting firm and reviewing with
management and the independent registered public accounting firm our interim and year-end operating results; and
- •
- preparing the audit committee report required by the SEC to be included in our annual proxy statement.
Rule 10A-3 promulgated by the SEC under the Exchange Act and applicable Nasdaq Stock Market rules require our audit committee to be composed entirely of independent directors upon the effective date of our registration statement. Our board of directors has affirmatively determined that each of the
116
members of our audit committee will qualify as independent directors under the rules of the Nasdaq Stock Market and for purposes of serving on an audit committee under applicable SEC rules. Our board of directors also has determined that Michael Kowalski qualifies as an "audit committee financial expert" as defined by the SEC.
Our board of directors will adopt a written charter for our audit committee, which will be available on our corporate website upon completion of this offering.
Compensation Committee
Upon completion of this offering, our compensation committee will consist of Pat S. Bolin, Blake Bozman and Mark Griege, with Mark Griege serving as chair of the compensation committee. The compensation committee will be responsible for, among other things:
- •
- reviewing and approving compensation of our executive officers including annual base salary, annual incentive bonuses,
specific goals, equity compensation, employment agreements, severance and change in control arrangements, and any other benefits, compensation or arrangements;
- •
- reviewing succession planning for our executive officers;
- •
- reviewing and recommending compensation goals, bonus and stock compensation criteria for our employees;
- •
- determining the compensation of our directors;
- •
- reviewing and discussing annually with management our executive compensation disclosure required by SEC rules;
- •
- preparing the compensation committee report required by the SEC to be included in our annual proxy statement; and
- •
- administrating, reviewing and making recommendations with respect to our equity compensation plans.
Our board of directors has evaluated the independence of the members of our compensation committee and has determined that each of the members of our compensation committee is independent under Nasdaq Stock Market standards. The members of the compensation committee also qualify as "non-employee directors" within the meaning of Rule 16b-3 under the Exchange Act and "outside directors" within the meaning of Section 162(m) of the Code.
Our board of directors will adopt a written charter for our compensation committee, which will be available on our corporate website upon completion of this offering.
Corporate Governance and Nominating Committee
Upon completion of this offering, our corporate governance and nominating committee will consist of Michael D. Ilagan, Michael Kowalski, John Sughrue and Ray Washburne, with John Sughrue serving as chair of the corporate governance and nominating committee. The corporate governance and nominating committee will be responsible for, among other things:
- •
- assisting our board of directors in identifying prospective director nominees and recommending nominees for each annual
meeting of shareholders to the board of directors;
- •
- reviewing developments in corporate governance practices and developing and recommending governance principles applicable
to our board of directors;
- •
- overseeing the evaluation of our board of directors and management; and
117
- •
- recommending members for each board committee of our board of directors.
Our board of directors has evaluated the independence of the members of our corporate governance and nominating committee and has determined that each of the members of our corporate governance and nominating committee is independent under Nasdaq Stock Market standards.
Our board of directors will adopt a written charter for our corporate governance and nominating committee, which will be available on our corporate website upon completion of this offering.
Compensation Committee Interlocks and Insider Participation
None of our executive officers currently serves, or in the past year has served, as a member of the board of directors or compensation committee or other board committee serving equivalent functions of any entity that has one or more executive officers serving on our board of directors.
Corporate Governance Guidelines and Code of Business Conduct and Ethics
Our board of directors will adopt corporate governance guidelines, which will set forth a flexible framework within which our board of directors, assisted by board committees, will direct the affairs of our company. The guidelines will address, among other things, the composition and functions of our board of directors, director independence, compensation of directors, management succession and review, board committees and selection of new directors.
We will adopt a code of business conduct and ethics applicable to our directors, officers and employees including specific standards and guidelines applicable to our principal executive, financial and accounting officers and all persons performing similar functions. A copy of that code and the corporate governance guidelines will be available on our corporate website upon completion of this offering. We expect that any amendments to such code and guidelines, or any waivers of their requirements, will be disclosed on our corporate website and by other means required by the Nasdaq Stock Market rules.
118
We are providing compensation disclosure that satisfies the requirements applicable to emerging growth companies, as defined in the JOBS Act. Our named executive officers for 2013, which consist of our principal executive officer and the two other most highly compensated executive officers, are:
- •
- C. Malcolm Holland, III, our Chairman of the Board, Chief Executive Officer and President;
- •
- William C. Murphy, our Vice Chairman of the Board; and
- •
- Noreen E. Skelly, our Chief Financial Officer.
Summary Compensation Table
The following table provides information regarding the compensation of our named executive officers for the year ended December 31, 2013. Except as set forth in the notes to the table, all cash compensation for each of our named executive officers was paid by the Bank, where each serves in the same capacity.
Name and Principal Position
|
Year | Salary(1) ($) |
Bonus(2) ($) |
Stock Awards ($) |
Option Awards ($) |
Non-Equity Incentive Plan Compensation ($) |
Nonqualified Deferred Compensation Earnings ($) |
All Other Compensation ($)(3) |
Total ($) |
|||||||||||||||||||
|---|---|---|---|---|---|---|---|---|---|---|---|---|---|---|---|---|---|---|---|---|---|---|---|---|---|---|---|---|
C. Malcolm Holland, III |
2013 | $ | 260,000 | $ | 91,000 | — | — | — | — | $ | 29,043 | $ | 377,543 | |||||||||||||||
Chairman of the Board, Chief Executive Officer & President |
||||||||||||||||||||||||||||
William C. Murphy, |
2013 | 200,000 | 70,000 | — | — | — | — | 25,817 | 295,817 | |||||||||||||||||||
Vice Chairman of the Board |
||||||||||||||||||||||||||||
Noreen E. Skelly, |
2013 | 200,000 | 60,000 | — | — | — | — | — | 260,000 | |||||||||||||||||||
Chief Financial Officer |
||||||||||||||||||||||||||||
- (1)
- The
amounts shown in this column reflect salaries earned during 2013.
- (2)
- The
amounts shown reflect cash bonuses earned in 2013, but paid in 2014.
- (3)
- The amounts shown in this column include (i) club dues of $26,236 for Mr. Holland and $25,207 for Mr. Murphy, (ii) $307 in premiums for bank-owned life insurance policies with a death benefit of $100,000 payable to the designated beneficiary of the named executive officer and (iii) $2,500 in premiums for a life insurance policy we maintain that provides a death benefit payable to Mr. Holland's spouse.
119
Outstanding Equity Awards at 2013 Fiscal Year-End
The following table sets forth information relating to the unexercised options and outstanding stock awards held by the named executive officers as of December 31, 2013.
| |
Options Awards | Stock Awards | ||||||||||||||||||||||||||
|---|---|---|---|---|---|---|---|---|---|---|---|---|---|---|---|---|---|---|---|---|---|---|---|---|---|---|---|---|
Name
|
Number of Securities Underlying Unexercised Options Exercisable (#)(2) |
Number of Securities Underlying Unexercised Options Unexercisable (#) |
Equity Incentive Plan Awards: Number of Securities Underlying Unexercised Unearned Options (#) |
Option Exercise Price ($) |
Option Expiration Date |
Number of shares or units of stock that have not vested (#)(3) |
Market value of shares or units of stock that have not vested ($)(10) |
Equity incentive plan awards: Number of unearned shares, units or other rights that have not vested (#) |
Equity incentive plan awards: Market or payout value of unearned shares, units or other rights that have not vested ($) |
|||||||||||||||||||
C. Malcolm Holland, III |
5,000 | (4) | 64,500 | — | — | |||||||||||||||||||||||
|
1,000 | (5) | 12,900 | — | — | |||||||||||||||||||||||
|
50,000 | 75,000 | (6) | — | 10.00 | 12/31/2020 | ||||||||||||||||||||||
|
— | 170,000 | (7) | — | 10.00 | 12/31/2020 | ||||||||||||||||||||||
William C. Murphy(1) |
||||||||||||||||||||||||||||
Noreen E. Skelly |
5,000 |
(8) |
64,500 |
— |
— |
|||||||||||||||||||||||
|
4,000 | 16,000 | (9) | — | 10.00 | 6/30/2022 | — | — | ||||||||||||||||||||
|
— | 20,000 | (7) | — | 10.00 | 6/30/2022 | — | — | ||||||||||||||||||||
- (1)
- As
of December 31, 2013, Mr. Murphy had no options or stock awards outstanding. On January 21, 2014, we issued Mr. Murphy
time-based options to purchase 15,000 shares of our common stock at an exercise price of $10.85, of which 9,000 were vested and fully exercisable as of the grant date, performance based options to
purchase 35,000 shares of our common stock at an exercise price of $10.85, which will become exercisable only upon a change of control and the achievement of certain investor returns as described
below under "—Awards to Named Executive Officers," and 1,000 restricted stock units, the restrictions on which will lapse on January 21, 2016.
- (2)
- The
time-based options shown in this column are fully vested and presently exercisable as of December 31, 2013.
- (3)
- Restrictions
on shares disclosed in this column lapse on the fourth anniversary of the grant date.
- (4)
- Restrictions
on restricted stock units lapse on January 1, 2015.
- (5)
- Restrictions
on restricted stock units lapse on January 21, 2016.
- (6)
- Time-based
options granted on January 1, 2011. Options to purchase 25,000 shares at an exercise price of $10.00 per share vested and became
exercisable on January 1, 2014. As to the remaining 50,000 shares, options to purchase 25,000 will vest and become exercisable on each of January 1, 2015 and 2016.
- (7)
- Performance-based
options will become exercisable only upon a change of control and the achievement of certain investor returns as described below under
"—Awards to Named Executive Officers". Prior to the completion of this offering, we intend to cancel all of our performanced-based options as described below under "—2014
Omnibus Incentive Plan."
- (8)
- Restrictions
on restricted stock units lapse on July 1, 2016.
- (9)
- Time-based
options granted on July 1, 2012. Options to purchase 4,000 shares at an exercise price of $10.00 per share vested and became exercisable
on July 1, 2014. As to the remaining 12,000 shares, options to purchase 4,000 shares will vest and become exercisable on each of July 1, 2015, 2016 and 2017.
- (10)
- Calculated using a market value of $12.90 per share based on a valuation of our Employee Stock Ownership Plan as of December 31, 2013.
2010 Equity Incentive Plan
In 2010, we adopted the Veritex Holdings, Inc. 2010 Stock Option and Equity Incentive Plan, or the 2010 Equity Incentive Plan, to provide incentive compensation opportunities that are competitive with those of similar companies in order to attract, retain and motivate eligible participants by providing for both the direct award or sale of shares and for the grant of options to purchase shares of our common stock. The maximum number of shares of our common stock that may be issued pursuant to grants or options under the 2010 Equity Incentive Plan is 1,000,000. The board of directors authorized the 2010 Equity Incentive Plan to provide for the award of up to 100,000 shares of direct stock awards in the form of restricted shares and up to 900,000 shares of stock options, of which 500,000 shares are performance-based stock options. During 2013, we awarded 1,000 restricted shares,
120
10,000 time-based stock options and 10,000 performance-based stock options. As of the date of this prospectus, we have granted 63,250 restricted stock units and options to purchase 830,000 shares of our common stock under the 2010 Equity Incentive Plan. We have granted options under the 2010 Equity Incentive Plan to our named executive officers, as described in greater detail below in "—Awards to Named Executive Officers." After this offering, no further options will be granted under the 2010 Equity Incentive Plan. A summary of the material terms of the 2010 Equity Incentive Plan are described below.
Plan Administration. The 2010 Equity Incentive Plan is administered by our board of directors, which has the authority to designate participants, determine the type and number of awards to be granted under the plan and determine the terms and conditions of any such award.
Eligibility. The 2010 Equity Incentive Plan permits the grant of stock options not described in Sections 422(b) or 423(b) of the Code and the direct award or sale of shares of common stock to our employees, officers, outside directors and consultants. The plan also permits the grant of incentive stock options, or ISOs, to employees and officers.
Agreements. The terms of each grant or award of shares or stock options, including terms relating to vesting, are set forth in a stock option agreement or stock grant agreement; provided that no stock option award will have a term that exceeds 10 years from the date of grant. The awards of restricted shares generally vest after four (4) years of continuous service. The vesting of performance-based stock options that are issued and outstanding are generally contingent upon a change of control and the achievement of specific performance criteria or other objectives set at the grant date.
Transfer Restrictions. Any shares granted or issued upon exercise of an option are subject to special forfeiture conditions, rights of repurchase, rights of first refusal and other transfer restrictions as the board of directors may determine at the time of grant. Stock options are generally only transferable by beneficiary designation, gift to an immediate family member, a will or other laws of descent and distribution.
Termination of Employment. Unless the board of directors provides otherwise in an agreement, upon a termination of a participant's employment, such participant's stock options or unvested grant of shares will generally cease to be exercisable and will terminate on the date of such termination.
Change in Control. Unless the board of directors provides otherwise in a stock option agreement or stock grant agreement, upon a "change in control" (as defined in the 2010 Equity Incentive Plan) in which there is an acquiring or surviving entity, all options or grants to the extent not previously terminated or vested will be accelerated and fully exercisable.
Right of Repurchase. We generally have the right to repurchase the shares of stock, and the shares issuable upon the exercise of any stock option, issued under the 2010 Equity Incentive Plan from the holder upon the termination of the holder's employment or upon the occurrence certain events relating to the holder's solvency. That repurchase right will terminate upon the completion of this offering.
Amendment and Termination. Our board of directors may, in its discretion, amend or alter the terms of the 2010 Equity Incentive Plan or any outstanding award under the plan at any time, provided that our shareholders must approve any amendment if the amendment increases the number of shares available for issuance under the plan or materially changes the class of persons who are eligible for the grant of ISOs. The 2010 Equity Incentive Plan will automatically terminate 10 years after the later of its adoption or the most recent increase in the number of shares reserved under the 2010 Equity Incentive Plan that was approved by our shareholders.
121
Awards to Named Executive Officers
We have granted time-based options to each of our named executive officers. The time-based options held by Mr. Holland and Ms. Skelly vest annually in 20.0% increments on each of the first five anniversaries of the grant date. Forty percent of the time-based options held by Mr. Murphy vested on the grant date and the remaining time-based options vest in 20.0% increments beginning March 2014 and annually thereafter.
We have also granted performance-based options to each of our named executive officers that will generally become exercisable as follows: (1) 35.0% of the performance-based options vest upon the occurrence of a "change of control"; (2) 35.0% of the performance-based options vest upon the occurrence of a "change of control" and the persons that acquired shares of our common stock in March 2010, or the 2010 Investors, having received either a 20.0% internal rate of return, defined as the fully diluted rate of return annualized for one share of stock on an original investment of $10.00 per share, or 2.5 times their original investment of $10.00 per share; and (3) the final 30.0% of the performance-based options vest upon the occurrence of a "change of control" and 2010 Investors having received either a 30.0% internal rate of return or 3.5 times their original investment of $10.00 per share. For purposes of the option agreements, a "change of control" is defined as (1) the consummation of a merger or consolidation of Veritex Holdings with or into another entity or any other corporate organization, if persons who were not shareholders immediately prior to such merger, consolidation or other reorganization own immediately after such merger, consolidation or other reorganization 50.0% or more of the voting power of the outstanding securities of each of the continuing or surviving entity, and any direct or indirect parent corporation of such continuing or surviving entity; or (2) the sale, transfer or other disposition of all or substantially all of our assets. Prior to the completion of this offering, we intend to cancel all of our performance-based options as described below under "—2014 Omnibus Incentive Plan."
We have also granted restricted stock units to each of our named executive officers. The restrictions on the restricted stock units held by Mr. Holland and Ms. Skelly lapse and the units are fully vested on the fourth anniversary of the grant date. The restrictions on the restricted stock units held by Mr. Murphy lapse and are fully vested on the third anniversary of the grant date.
In addition to the terms described above, the stock grant and stock option agreements provide for the number of shares granted, the price per share, the initial vesting date, the vesting schedule, and the expiration date of the grant. We have a right of first refusal that will terminate on the closing of an initial public offering.
Employment Agreements
Mr. Holland does not have a formal employment agreement. We and the Bank have entered into an executive employment agreement with Mr. Murphy, and the Bank has entered into a change of control agreement with Ms. Skelly.
Mr. Murphy's employment agreement provides that Mr. Murphy will serve as vice chairman of our board of directors, and the board of directors of the Bank, for a term commencing on March 23, 2011 and ending on March 31, 2015. Under the employment agreement, Mr. Murphy is entitled to an annual base salary of $185,000 with merit increases, bonus and other incentives, if any, in accordance with the Bank's salary administration program based upon performance, as well as to certain other employment related benefits. Upon an involuntary termination of Mr. Murphy's employment by the board of directors without "good cause," as defined in the employment agreement, Mr. Murphy would be entitled to receive all compensation and benefits due to him under the employment agreement as if his employment had not been terminated. The employment agreement also contains post-termination non-solicitation covenants for one year after the date of the termination of his employment, except upon his termination by the Bank without "good cause."
122
The change of control agreement for Ms. Skelly provides that if a change of control occurs and the gross amount of the proceeds from Ms. Skelly's stock options and grants do not equal at least $200,000, then the Bank will supplement the deficiency such that the total gross amount received by Ms. Skelly as a result of the stock options, grants and change of control payment will be equal to $200,000.
2014 Omnibus Incentive Plan
We have recently adopted an omnibus incentive plan or the 2014 Omnibus Plan. The purpose of the 2014 Omnibus Plan is to align the long-term financial interests of our employees, directors, consultants and other service providers with those of our shareholders, to attract and retain those employees, directors, consultants and other service providers by providing compensation opportunities that are competitive with other companies and to provide incentives to those individuals who contribute significantly to our long-term performance and growth. To accomplish these goals, the 2014 Omnibus Plan permits the issuance of stock options, share appreciation rights, restricted shares, restricted share units, deferred shares, unrestricted shares and cash-based awards. The maximum number of shares of our common stock that may be issued pursuant to grants or options under the 2014 Omnibus Plan is 1,000,000.
Prior to the completion of this offering, we intend to cancel all of our outstanding performance-based options to purchase an aggregate of 472,500 shares of our common stock (none of which are currently exercisable). Concurrently with such cancellation, we intend to grant to our named executive officers and certain of our directors and employees a number of restricted stock units having an initial fair market value that is approximately 45.0% of the estimated fair value of the performance-based options that are cancelled. The new restricted stock units will vest in equal installments over a five year period beginning on the first anniversary of the closing of this offering. These grants will be made under our 2014 Omnibus Plan.
Director Compensation
We currently pay our directors, other than those directors who are employed by the Bank or us, based on the directors' participation in board and committee meetings, and the Bank currently pays its directors in the same manner. Directors who are also employed by the Bank or us do not receive director remuneration for serving as a director of the Bank or us, but are compensated in their capacity as employees. The following table sets forth the compensation paid to each director who served on our board of directors in 2013, other than Messrs. Holland and Murphy, whose compensation is described in the "Summary Compensation Table" above. The table also includes compensation earned by each director that is attributable to his service as a director of the Bank.
Name
|
Fees Earned or Paid in Cash ($) |
Option Awards ($)(1) |
Total ($) | |||||||
|---|---|---|---|---|---|---|---|---|---|---|
Pat S. Bolin |
$ | 9,450 | — | $ | 9,450 | |||||
Blake Bozman |
13,500 | — | 13,500 | |||||||
Ned Fleming, III |
— | (2) | — | — | ||||||
Mark Griege |
11,100 | — | 11,100 | |||||||
John Sughrue |
13,200 | — | 13,200 | |||||||
Ray W. Washburne |
11,250 | — | 11,250 | |||||||
- (1)
- No
options were granted to directors during the year ended December 31, 2013; however, as of December 31, 2013, Mr. Bolin held options
to acquire 2,500 shares of our common stock, of which 2,000 were unvested, and each of Messrs. Bozman, Griege, Sughrue and Washburne held options to acquire 2,500 shares of our common stock,
1,500 of which were unvested.
- (2)
- In lieu of paying board fees to Mr. Fleming, at his request we donated the board fees to which he would otherwise be entitled to receive to a charity of his choice. In 2013, such donation was $10,750.
All non-employee directors have been and will continue to be reimbursed for their reasonable out-of-pocket travel expenses incurred in attending meetings of our board of directors or any committees of the board of directors. Directors are also entitled to the protection provided by the indemnification provisions in our certificate of formation and bylaws, as well as the articles of association and bylaws of the Bank.
123
The following table sets forth information with respect to the beneficial ownership of our common stock as of August 29, 2014, subject to certain assumptions set forth in the footnotes and as adjusted to reflect the sale of the shares of our common stock offered in this offering for:
- •
- each shareholder, or group of affiliated shareholders, who we know beneficially owns more than five percent of the
outstanding shares of our common stock;
- •
- each of our directors;
- •
- each of our named executive officers; and
- •
- all of our executive officers and directors as a group.
Beneficial ownership is determined in accordance with rules of the SEC and generally includes any shares over which a person exercises sole or shared voting and/or investment power. Shares of common stock subject to options and warrants currently exercisable or exercisable within 60 days are deemed outstanding for purposes of computing the percentage ownership of the person holding the options or warrants but are not deemed outstanding for purposes of computing the percentage ownership of any other person. Except as otherwise indicated, we believe the beneficial owners of the common stock listed below, based on information furnished by them, have sole voting and investment power with respect to the number of shares listed opposite their names.
The number of shares to be sold in this offering and the number of shares and percentages of beneficial ownership after this offering set forth below are based on 6,358,832 shares of our common stock outstanding on August 29, 2014, plus the number of shares of our common stock to be sold in this offering, assuming no exercise of the underwriters' option to purchase additional shares.
Unless otherwise indicated, the address of each of the individuals named in the table below under "Executive Officers and Directors" is c/o Veritex Holdings, Inc., 8214 Westchester Drive, Suite 400, Dallas, Texas 75225.
| |
Shares Beneficially Owned Prior to this Offering |
Shares Beneficially Owned After Giving Effect to this Offering |
||||||||
|---|---|---|---|---|---|---|---|---|---|---|
Name
|
Number | Percentage | Percentage | |||||||
Executive Officers and Directors: |
||||||||||
C. Malcolm Holland, III(1) |
139,825 | 2.2 | % | 1.5 | % | |||||
William C. Murphy(2) |
568,862 | 8.9 | % | 6.3 | % | |||||
Noreen E. Skelly(3) |
8,000 | * | * | |||||||
Pat S. Bolin(4) |
65,610 | 1.0 | % | 1.0 | % | |||||
Blake Bozman(5) |
110,718 | 1.7 | % | 1.2 | % | |||||
Mark Griege(6) |
36,500 | * | * | |||||||
Michael Kowalski |
10,000 | * | * | |||||||
Michael D. Ilagan |
— | — | — | |||||||
John Sughrue(7) |
28,805 | * | * | |||||||
Ray W. Washburne(8) |
148,943 | 2.3 | % | 1.6 | % | |||||
All Executive Officers and Directors as a group (10 persons) |
1,117,263 | 17.3 | % | 12.9 | % | |||||
Other 5% Shareholders: |
||||||||||
SunTx Veritex Holdings, LP(9) |
1,572,370 | 24.7 | % | 17.4 | % | |||||
Gregg Allen(10) |
344,515 | 5.4 | % | 3.8 | % | |||||
- *
- Amount represents less than 1.0% of outstanding common stock.
124
- (1)
- Includes:
(i) 54,825 shares owned jointly by Mr. Holland and his spouse, (ii) 10,000 shares held by Pershing LLC IRA for his
benefit and (iii) stock options to purchase 75,000 shares of our common stock.
- (2)
- Includes:
(i) 65,000 shares held by William C. Murphy Pension & Profit Sharing Plan & Trust, (ii) 32,259 shares held by William
C. Murphy, a sole proprietor, 401(k) Plan, (iii) stock options to purchase 9,000 shares, and (iv) 462,603 shares held by WCM Parkway, Ltd., over which Mr. Murphy has sole
voting control. The principal address of WCM Parkway, Ltd. is 3836 Caruth Boulevard, Dallas, Texas 75225.
- (3)
- Includes
options to purchase 8,000 shares of our common stock.
- (4)
- Includes:
(i) 27,305 shares held by the Aurora S. Bolin Revocable Trust, of which Mr. Bolin is the trustee; (ii) 27,305 shares held by
Eagle Creek Capital, LP, which is controlled by Mr. Bolin, (iii) options to purchase 1,000 shares, and (iv) warrants to purchase 10,000 shares of common stock presently
exercisable, issued to Red Star Yield Holdings, Inc. a wholly owned subsidiary of Eagle Oil & Gas, which is controlled by Mr. Bolin.
- (5)
- Includes:
(i) 81,913 shares held in Mr. Bozeman's name, (ii) 27,305 shares held by Bozman DFS Partnership, and (iii) options to
purchase 1,500 shares of our common stock.
- (6)
- Includes:
(i) 35,000 shares held jointly by Mr. Griege and his spouse and (ii) options to purchase 1,500 shares of our common stock.
- (7)
- Includes:
(i) 27,305 shares held individually by Mr. Sughrue and (ii) options to purchase 1,500 shares of our common stock.
- (8)
- Includes:
(i) 5,530 shares held by the Incline Trust, of which Mr. Washburne is the Trustee, (ii) 60,000 shares held by Huron
Holdings, Inc., Profit Sharing Plan, over which Mr. Washburne has sole voting control, and (iii) options to purchase 1,500 shares.
- (9)
- All
of these shares are held by SunTx Veritex Holdings, L.P., an entity controlled by Ned Fleming, III. The business address of SunTx Veritex
Holdings, L.P., is 5420 LBJ Freeway, Suite 1000, Dallas, Texas 75240.
- (10)
- The business address of Mr. Allen is 13455 Noel Road, Suite 2000, Dallas, Texas 75240.
125
CERTAIN RELATIONSHIPS AND RELATED PARTY TRANSACTIONS
General
Some of our officers, directors and principal shareholders and their affiliates are customers of the Bank. Such officers, directors and principal shareholders and their affiliates have had transactions in the ordinary course of business with the Bank, including borrowings, all of which were effected on substantially the same terms and conditions, including interest rate and collateral, as those prevailing from time to time for comparable transactions with unaffiliated persons and did not involve more than the normal risk of collectability or other unfavorable features. We expect to continue to have such transactions on similar terms and conditions with such officers, directors and shareholders and their affiliates in the future.
In addition to the above-described relationships and the director and executive officer compensation arrangements discussed above under "Executive Compensation," the following is a description of transactions since January 1, 2011, including currently proposed transactions to which we have been or are to be a party in which the amount involved exceeded or will exceed $120,000, and in which any of our directors (including nominees), executive officers or beneficial holders of more than 5.0% of our capital stock, or their immediate family members or entities affiliated with them, had or will have a direct or indirect material interest. We believe the terms and conditions set forth in such agreements are reasonable and customary for transactions of this type.
Directed Share Program
At our request, the underwriters have reserved up to 135,000 shares of our common stock offered by this prospectus for sale, at the initial public offering price, to our directors, executive officers, employees and certain other persons who have expressed an interest in purchasing our common stock in this offering. We will offer these shares to the extent permitted under applicable regulations in the United States through a directed share program. See "Underwriting—Directed Share Program."
126
Private Placements of Common Stock
The following table summarizes the purchases of our common stock in private placement transactions since January 1, 2011 by certain of our directors, executive officers and beneficial holders of more than 5.0% of our capital stock and their respective affiliates:
Stockholder
|
Issue Date | Shares | Total Purchase Price | ||||||
|---|---|---|---|---|---|---|---|---|---|
Pat S. Bolin (director) |
March 23, 2011 | 25,000 | (1) | $ | 250,000 | ||||
|
March 23, 2011 | 25,000 | (2) | 250,000 | |||||
C. Malcolm Holland, III (Chairman and Chief Executive Officer) |
February 1, 2014 |
13,825 |
150,001 |
||||||
William C. Murphy (Vice Chairman and 5% holder) |
March 23, 2011 |
65,000 |
(3) |
650,000 |
|||||
|
March 23, 2011 | 462,603 | (4) | 4,626,030 | |||||
|
February 1, 2014 | 32,259 | (5) | 350,010 | |||||
Mark Griege (director) |
December 23, 2013 |
35,000 |
358,500 |
||||||
Ray W. Washburne (director) |
March 23, 2011 |
25,000 |
250,000 |
||||||
|
September 20, 2011 | 25,000 | 250,000 | ||||||
|
May 14, 2012 | 60,000 | (6) | 600,000 | |||||
SunTx Veritex Holdings, LP. (5% holder) |
March 23, 2011 |
458,881 |
4,588,810 |
||||||
|
June 27, 2011 | 10,610 | 106,100 | ||||||
|
September 26, 2011 | 38,792 | 387,920 | ||||||
|
May 30, 2012 | 27,353 | 273,530 | ||||||
|
January 23, 2013 | 21,552 | 215,520 | ||||||
|
January 21, 2014 | 17,274 | 187,423 | ||||||
|
February 1, 2014 | 123,124 | 1,335,895 | ||||||
- (1)
- Shares
purchased by the Aurora S. Bolin Revocable Trust, of which Pat S. Bolin is the Trustee.
- (2)
- Shares
purchased by Eagle Creek Capital, LP, which Pat S. Bolin is the managing partner.
- (3)
- Shares
purchased by William C. Murphy, a sole proprietor, 401K plan.
- (4)
- Shares
purchased by WCM Parkway, Ltd. a limited partnership controlled by Mr. Murphy.
- (5)
- Shares
purchased by William C. Murphy Pension & Profit Sharing Plan & Trust.
- (6)
- Shares purchased by Huron Holdings, Inc. profit sharing plan, which is controlled by Mr. Washburne.
Private Placement of Subordinated Notes and Warrants
On December 23, 2013, we completed a private placement of $5.0 million in aggregate principal amount of subordinated promissory notes to Fidelity Bank, Wichita Falls, Texas, and Red Star Yield Holdings, LLC, each of which is an affiliate of Pat S. Bolin, one of our directors. In connection with the issuance of the notes, we also issued to these investors warrants to purchase an aggregate of 25,000 shares of our common stock at an exercise price of $11.00 per share. See "Management's Discussion and Analysis of Financial Condition and Results of Operations—Subordinated Notes" for additional description of the subordinated notes and warrants.
Agreements with SunTx Veritex Holdings, L.P.
SunTx currently owns 24.7% of our outstanding common stock, and is expected to own, following the completion of this offering, 17.4% of our outstanding common stock (or 16.6% if the underwriters
127
exercise their option to purchase additional shares in full). Pursuant to an agreement between SunTx and us, SunTx is entitled to nominate one representative to serve on our board of directors and the board of directors of the Bank for so long as SunTx holds at least 4.9% of our issued and outstanding common stock. We must use our reasonable best efforts to have the SunTx representative elected to our board. The director representative of SunTx is entitled to the same compensation, indemnification and reimbursement rights as the other members of our board of directors. In addition, SunTx also has the right to appoint a non-voting observer to attend our board meetings and those of the Bank. We also granted SunTx information and access rights with respect to our business. Michael D. Ilagan currently serves as the SunTx representative on our board of directors and the board of directors of the Bank.
In connection with the investment, we also made certain representations and warranties and covenants and agreed to provide indemnification rights to SunTx in connection with such representations and warranties.
Registration Rights Agreement
We have entered into a registration rights agreement with SunTx and WCM Parkway, Ltd. Under this agreement, beginning 180 days after the date of this prospectus, each of these holders may require us to file a registration statement under the Securities Act to register the sale of shares of our common stock, subject to certain limitations. These stockholders may each request a total of two such registrations and only one in any six-month period. These holders also have the right to cause us to register their shares of our common stock on Form S-3, when it becomes available to us. In addition, if we propose to register securities under the Securities Act, then the holders who are party to the agreement will have "piggy-back" rights to request that we register their shares of our common stock, subject to certain limitations including quantity limitations determined by underwriters if the offering involves an underwriting. There is no limit to the number of these "piggy-back" registrations in which these holders may request their shares be included. We will bear the registration expenses incurred in connection with these registrations, other than underwriting discounts and commissions, except that the holders will bear the registration expenses incurred in connection with registrations requested and filed prior to the first anniversary of the date of this prospectus. We have agreed to indemnify these stockholders against certain liabilities, including liabilities under the Securities Act, in connection with any registration effected under the agreement.
Review and Approval of Transactions with Related Persons
Transactions by us with related parties are subject to a formal written policy, as well as regulatory requirements and restrictions. These requirements and restrictions include Sections 23A and 23B of the Federal Reserve Act (which govern certain transactions by the Bank with its affiliates) and the Federal Reserve's Regulation O (which governs certain loans by the Bank to its executive officers, directors, and principal shareholders). See "Regulation and Supervision—Limits on Transactions with Affiliates and Insiders." We have adopted policies to comply with these regulatory requirements and restrictions.
In connection with this offering, we intend to supplement our related party transaction policy in order to comply with all applicable requirements of the SEC and the Nasdaq Stock Market concerning related party transactions. Related party transactions will be referred for approval or ratification to our audit committee. In determining whether to approve a related party transaction, our audit committee will consider, among other factors, the fairness of the proposed transaction, the direct or indirect nature of the director's, executive officer's or related party's interest in the transaction, the appearance of an improper conflict of interests for any director, executive officer or related party, taking into account the size of the transaction and the financial position of the director, executive officer or related party, whether the transaction would impair an outside director's independence, the acceptability of the transaction to our regulators and the potential violations of other corporate policies. A copy of this policy and our audit committee charter will be available on our corporate website upon completion of this offering.
128
General
The following discussion summarizes some of the important rights of our shareholders upon completion of this offering. This discussion does not purport to be a complete description of these rights and may not contain all of the information regarding our capital stock that is important to you. These rights can be determined in full only by reference to federal and state banking laws and regulations, the Texas Business Organizations Code and our certificate of formation and bylaws.
We are incorporated in the State of Texas. The rights of our shareholders are generally covered by Texas law and our certificate of formation and bylaws (each as amended and restated and in effect as of the completion of this offering). The terms of our capital stock are therefore subject to Texas law, including the Texas Business Organizations Code, and the common and constitutional law of Texas. The following discussion describes the terms of our amended and restated certificate of formation and bylaws. Our amended and restated certificate of formation and bylaws are filed with the SEC as Exhibit 3.1 and Exhibit 3.2 to the registration statement on Form S-1 of which this prospectus is a part, and we encourage you to read those documents.
Our amended and restated certificate of formation authorizes us to issue up to 75,000,000 shares of common stock, par value $0.01 per share, and 10,000,000 shares of preferred stock, par value $1.00 per share, of which 8,000 shares are designated as Series C preferred stock. The authorized but unissued shares of our capital stock are available for future issuance without shareholder approval, unless otherwise required by applicable law or the rules of any applicable securities exchange.
As of June 30, 2014, 6,358,832 shares of our common stock were issued and outstanding, and held by approximately 300 shareholders of record, and 8,000 shares of our Series C preferred stock were issued and outstanding and held by the U.S. Treasury. All of our shares outstanding at that date were fully paid and non-assessable. Also as of June 30, 2014, options to purchase 830,000 shares of our common stock and 63,250 restricted stock units held by our employees, officers and directors under the 2010 Equity Incentive Plan, and warrants to purchase 25,000 shares of common stock were outstanding.
Common Stock
Voting Rights. Subject to any special voting rights that may be given to any series of preferred stock that we may issue in the future, holders of our common stock are entitled to one vote per share in the election of directors and on all other matters submitted to a vote of our shareholders. Shareholders are not entitled to cumulate their votes with respect to the election of directors. Directors are elected by a plurality of the votes cast.
Dividend Rights. Holders of our common stock are entitled to dividends when, as and if declared by our board of directors out of funds legally available therefor.
Liquidation Rights. Upon any voluntary or involuntary liquidation, dissolution or winding up of our affairs, all shares of our common stock will be entitled to share equally in all remaining assets after the holders of shares of preferred stock or other senior securities have received the liquidation preference of their shares plus any declared but unpaid dividends, if any, and after all other indebtedness has been retired.
Other. Our common stock has no preemptive or conversion rights and is not entitled to the benefits of any redemption or sinking fund provision.
129
Preferred Stock
Our amended and restated certificate of formation permits us to issue one or more series of preferred stock and authorizes our board of directors to designate the preferences, limitations and relative rights of any such series of preferred stock, in each case, without any further action by our shareholders. Preferred stock may have voting rights, subject to applicable law and the determination at issuance by our board of directors. While the terms of preferred stock may vary from series to series, holders of our common stock should assume that all shares of preferred stock will be senior to our common stock in respect of distributions and on liquidation.
Although the creation and authorization of preferred stock does not, in and of itself, have any effect on the rights of the holders of our common stock, the issuance of one or more series of preferred stock may affect the holders of common stock in a number of respects, including the following:
- •
- by subordinating our common stock to the preferred stock with respect to dividend rights, liquidation preferences, and
other rights, preferences, and privileges;
- •
- by diluting the voting power of our common stock;
- •
- by diluting the earnings per share of our common stock; and
- •
- by issuing common stock, upon the conversion of the preferred stock, at a price below the fair market value or original issue price of the common stock that is outstanding prior to such issuance.
Series C Preferred Stock
As of the date of this prospectus, only one series of preferred stock is authorized, issued and outstanding. On August 25, 2011, we issued 8,000 shares of our Series C preferred stock, $1,000 liquidation value per share, in connection with our participation in the U.S. Treasury's SBLF program, all of which are currently outstanding.
Voting Rights. The holders of the Series C preferred stock do not have voting rights other than with respect to certain matters relating to the rights of holders of Series C preferred stock, on certain corporate transactions such as a merger or sale of all or substantially all of our assets, and, if applicable, the election of additional directors described below.
Dividends. The Series C preferred stock is entitled to receive non-cumulative dividends, payable quarterly, on each January 1, April 1, July 1 and October 1. The dividend rate is currently 1.0% per annum. Beginning February, 2016, the dividend rate will increase to 9.0% per annum.
Dividends on the Series C preferred stock are non-cumulative. If for any reason our board of directors does not declare a dividend on the Series C preferred stock for a particular dividend period, then the holders of the Series C preferred stock will have no right to receive any dividend for that dividend period, and we will have no obligation to pay a dividend for that dividend period. Our failure to pay a dividend on the Series C preferred stock will restrict our ability to pay dividends on and repurchase other classes and series of our capital stock, including our common stock. In addition, our failure to pay dividends on the Series C preferred stock for six or more dividend periods, whether consecutive or not, will give the holders of the Series C preferred stock the right to appoint a non-voting observer on our board of directors.
Redemption. The Series C preferred stock may be redeemed at any time at our option, at a redemption price of 100% of the liquidation amount plus accrued but unpaid dividends to the date of redemption for the current period, regardless of whether such dividends have been declared for that period, subject to the approval of our primary federal banking regulator.
130
Liquidation Rights. In the event of any voluntary or involuntary liquidation, dissolution or winding up of our affairs, holders of the Series C preferred stock will be entitled to receive for each share of Series C preferred stock, out of our assets or proceeds available for distribution to our shareholders, subject to any rights of our creditors, before any distribution of assets or proceeds is made to or set aside for the holders of our common stock payment of an amount equal to the sum of (1) the $1,000 liquidation preference amount per share of Series C preferred stock and (2) the amount of any accrued and unpaid dividends on the Series C preferred stock.
Registration Rights. As part of the terms of our participation in the SBLF, we agreed to provide the holders of our Series C preferred stock with the right to demand that we file a registration statement on Form S-3 or request that their shares be covered by a registration statement that we are otherwise filing. However, because this is our initial public offering and we are not eligible to file a registration statement on Form S-3, neither the demand registration rights nor the "piggyback" registration rights granted to the U.S. Treasury will apply at the time of this offering. Following our initial public offering, the U.S. Treasury may exercise its "piggyback" registration rights in connection with future offerings of our common stock, other than registration statements filed on Forms S-4 or S-8.
Warrants
We have issued warrants to purchase 25,000 shares of our common stock, at an exercise price of $11.00 per share, exercisable at any time, in whole or in part, on or prior to December 31, 2023. All of such warrants are outstanding.
Business Combinations under Texas Law
A number of provisions of Texas law and our amended and restated certificate of formation and bylaws could have an anti-takeover effect and make any potential acquisition of our organization by means of a tender offer, a proxy contest or otherwise and the removal of incumbent directors more difficult. These provisions are intended to discourage coercive takeover practices and inadequate takeover bids and to encourage persons seeking to acquire control of our company to negotiate first with our board of directors.
We are subject to the provisions of Title 2, Chapter 21, Subchapter M of the Texas Business Organizations Code, or the Texas Business Combination Law, which provides that a Texas corporation that qualifies as an "issuing public corporation" (as defined in the Texas Business Combination Law) may not engage in specified types of business combinations, including mergers, consolidations and asset sales, with a person, or an affiliate or associate of that person, who is an "affiliated shareholder." For purposes of this law, an "affiliated shareholder" is, or was, during the prior three years, the beneficial owner of 20.0% or more of the corporation's voting shares. The prohibition on certain transactions with such affiliated shareholders extends for a three-year period from the date such shareholder first becomes an affiliated shareholder. These prohibitions do not apply if:
- •
- the business combination or the acquisition of shares by the affiliated shareholder was approved by the board of
directors of the corporation before the affiliated shareholder became an affiliated shareholder; or
- •
- the business combination was approved by the affirmative vote of the holders of at least two-thirds of the outstanding voting shares of the corporation not beneficially owned by the affiliated shareholder or an affiliate or associate of the affiliated shareholder, at a meeting of shareholders called for that purpose, not less than six months after the affiliated shareholder became an affiliated shareholder.
131
As we currently have more than 100 shareholders, we are considered an "issuing public corporation" for purposes of this law. The Texas Business Combination Law does not apply to the following:
- •
- the business combination of an issuing public corporation: where the corporation's original certificate of formation or
bylaws contain a provision expressly electing not to be governed by the Texas Business Combination Law; or that adopts an amendment to its certificate of formation or bylaws, by the affirmative vote
of the holders, other than affiliated shareholders, of at least two-thirds of the outstanding voting shares of the corporation, expressly electing not to be governed by the Texas Business Combination
Law and so long as the amendment does not take effect for 18 months following the date of the vote and does not apply to a business combination with an affiliated shareholder who became
affiliated on or before the effective date of the amendment;
- •
- a business combination of an issuing public corporation with an affiliated shareholder that became an affiliated
shareholder inadvertently, if the affiliated shareholder divests itself, as soon as possible, of enough shares to no longer be an affiliated shareholder and would not at any time within the three-year
period preceding the announcement of the business combination have been an affiliated shareholder but for the inadvertent acquisition;
- •
- a business combination with an affiliated shareholder who became an affiliated shareholder through a transfer of shares
by will or intestacy and continuously was an affiliated shareholder until the announcement date of the business combination; and
- •
- a business combination of a corporation with its wholly-owned subsidiary, if the subsidiary is a Texas entity and not an affiliate or associate of the affiliated shareholder other than by reason of the affiliated shareholder's beneficial ownership of voting shares of the corporation.
Neither our amended and restated certificate of formation nor our amended and restated bylaws contains any provision expressly providing that we will not be subject to the Texas Business Combination Law. As a result, the Texas Business Combination Law may prevent a non-negotiated merger or other business combination involving us, even if such a merger or combination would be beneficial to our shareholders.
Action by Written Consent
Under Texas law, no action required or permitted to be taken at an annual or special meeting of shareholders may be taken by written consent in lieu of a meeting of shareholders without the unanimous written consent of all shareholders entitled to vote on the action unless the certificate of formation specifically allows action to be taken by a written consent of the shareholders holding at least the minimum number of shares necessary to take the action that is subject to that consent at a meeting of shareholders, even though such consent is not signed by all of the corporation's shareholders. Our amended and restated certificate of formation provides for shareholder action by less than unanimous written consent.
Certain Certificate of Formation and Bylaw Provisions Potentially Having an Anti-takeover Effect
Certain provisions of our amended and restated certificate of formation and bylaws may have an anti-takeover effect and thus discourage potential takeover attempts and make it more difficult for our shareholders to change management or receive a premium for their shares. These provisions include:
- •
- authorization for our board of directors to issue shares of one or more series of preferred stock without shareholder approval;
132
- •
- a provision that the vote of the holders of at least four-fifths of our shares entitled to vote at the meeting is
required to remove a director for cause;
- •
- a provision that vacancies on our board of directors, including newly created directorships, may be filled only by a
majority vote of directors then in office;
- •
- the prohibition of cumulative voting in the election of directors; and
- •
- a limitation on the ability of shareholders to call special meetings to those shareholders or groups of shareholders owning at least 10.0% of our outstanding shares of common stock.
In addition to these provisions of our amended and restated certificate of formation and bylaws, banking laws impose notice, approval, and ongoing regulatory requirements on any shareholder or other party that seeks to acquire direct or indirect "control" of an FDIC-insured depository institution. These laws include the BHC Act and the Change in Bank Control Act. These laws could delay or prevent an acquisition. See "Regulation and Supervision—Notice and Approval Requirements Related to Control."
Limitation of Liability and Indemnification of Officers and Directors
Our amended and restated certificate of formation provides that our directors and officers will be indemnified by us to the fullest extent permitted by the Texas Business Organizations Code, against all expenses incurred in connection with their service for or on our behalf. In addition, our amended and restated certificate of formation provides that our directors and officers will not be personally liable for monetary damages to us to the fullest extent permitted by the Texas Business Organizations Code.
In connection with this offering, we intend to enter into indemnification agreements with our officers and directors pursuant to which they will be indemnified as described above and will be advanced costs and expenses subject to the condition that such officers and directors will reimburse us for all advancements paid if a final judicial determination is made that such officer or director is not entitled to indemnification under applicable law or regulation.
Transfer Agent and Registrar
The transfer agent and registrar for our common stock is Continental Stock Transfer & Trust Company.
Listing
We have applied to list our common stock on the NASDAQ Global Market under the symbol "VBTX."
133
SHARES ELIGIBLE FOR FUTURE SALE
Prior to this offering, there has been no public market for our common stock, and no predictions can be made about the effect, if any, that market sales of shares of our common stock or the availability of such shares for sale will have on the market price prevailing from time to time. Nevertheless, the actual sale of, or the perceived potential for the sale of, our common stock in the public market may have a material adverse effect on the market price for our common stock and could impair our ability to raise capital through future sales of our securities.
Sale of Restricted Shares
Upon completion of this offering, we will have an aggregate of 9,058,832 shares of our common stock outstanding (or 9,463,832 shares of our common stock if the underwriters exercise their option to purchase additional shares in full). Of these shares, the 2,700,000 shares of our common stock to be sold in this offering (or 3,105,000 shares of our common stock if the underwriters exercise their option to purchase additional shares in full) will be freely tradable without restriction or further registration under the Securities Act, except for any shares which may be acquired by any of our affiliates as that term is defined in Rule 144 under the Securities Act. The remaining 6,358,832 shares of our common stock outstanding, and the 25,000 shares issuable upon the exercise of our currently outstanding warrants, will be restricted securities, as that term is defined in Rule 144, and such shares and any unrestricted shares acquired by any of our affiliates may in the future be sold under the Securities Act to the extent permitted by Rule 144 or any applicable exemption under the Securities Act.
Stock Incentive Plans
Following the completion of this offering, we intend to file a registration statement on Form S-8 under the Securities Act with the SEC to register approximately 1,419,750 shares of our common stock issued or reserved for issuance under the 2010 Equity Incentive Plan and the 2014 Omnibus Plan. The Form S-8 is expected to become effective immediately upon filing. As a result, subject to expiration of any lock-up restrictions as described below and following the completion of any remaining vesting periods and other vesting requirements, shares of our common stock issued under our plans, and shares of our common stock issuable upon the exercise of options granted or to be granted under our plans, will be freely tradable without restriction under the Securities Act, unless such shares are held by any of our affiliates.
As of June 30, 2014, time-based options to purchase a total of 357,500 shares of common stock under our stock option plans were outstanding, of which options to purchase 181,200 shares were exercisable, performance-based options to purchase a total of 472,500 shares of common stock were outstanding, none of which were exercisable, and 63,250 restricted stock units were outstanding that were not fully vested. Prior to the completion of this offering, we intend to cancel all of our performance-based options and to grant additional restricted stock units. See the section titled "Executive Compensation" for a description of our stock option plans.
Lock-up Agreements
Holders of approximately 66% of the shares of our common stock outstanding prior to this offering, including all of our executive officers and directors, have agreed not to sell any shares of our common stock for a period of at least 180 days from the date of this prospectus, subject to certain exceptions. See "Underwriting."
Rule 144
In general, under Rule 144 under the Securities Act as currently in effect, beginning 90 days after the date of this offering, a person who is not one of our affiliates who has beneficially owned shares of
134
our common stock for at least six months may sell shares without restriction, provided the current public information requirements of Rule 144 continue to be satisfied. If a person who is not one of our affiliates has beneficially owned the shares of common stock proposed to be sold for at least one year, then that person may sell those shares without complying with any of the requirements of Rule 144, including the 90 day period described above. We estimate that substantially all of the shares of common stock that are not subject to the lock-up restrictions described above have been held by non-affiliates for at least one year and therefor may be freely sold by such persons upon the completion of this offering.
Our affiliates who have beneficially owned shares of our common stock for at least six months may, in reliance on Rule 144, sell within any three-month period a number of shares that does not exceed the greater of:
- •
- 1.0% of the number of shares of our common stock then outstanding, which will equal approximately 90,588 shares
immediately after this offering, assuming the underwriters do not exercise their option to purchase additional shares; and
- •
- the average weekly trading volume of our common stock on the NASDAQ Global Market during the four calendar weeks immediately preceding the filing of a notice on Form 144 with respect to the sale.
Sales of restricted shares by our affiliates under Rule 144 are also subject to requirements regarding the manner of sale, notice, and the availability of current public information about us. Rule 144 also provides that affiliates relying on Rule 144 to sell shares of our common stock that are not restricted shares must nonetheless comply with the same restrictions applicable to restricted shares, other than the holding period requirement.
Registration Rights
SunTx and WCM Parkway, Ltd. have certain registration rights with respect to their shares. See "Certain Relationships and Related Party Transactions—Registration Rights Agreement."
Rule 701
In general, under Rule 701 of the Securities Act, any of our employees, consultants or advisors who purchased shares from us in connection with a qualified compensatory stock plan or other written agreement, such as our 2010 Equity Incentive Plan, before the effective date of the registration statement for this offering that was completed in reliance on Rule 701 and complied with the requirements of Rule 701 will, subject to the lock-up restrictions described below, be eligible to resell such shares 90 days after the date of this prospectus in reliance on Rule 144, but without compliance with certain restrictions, including the holding period, contained in Rule 144.
135
MATERIAL U.S. FEDERAL INCOME TAX CONSEQUENCES FOR NON-U.S. HOLDERS
The following is a general discussion of the material U.S. federal income tax consequences of the ownership and disposition of our common stock by a non-U.S. holder (as defined below) that purchases our common stock pursuant to this offering and holds such common stock as a capital asset (generally, property held for investment). This discussion is based on currently existing provisions of the Internal Revenue Code of 1986, as amended, or the Code, applicable U.S. Treasury regulations promulgated thereunder, judicial decisions, and rulings and pronouncements of the U.S. Internal Revenue Service, or the IRS, all as in effect on the date hereof and all of which are subject to change, possibly with retroactive effect, or subject to different interpretation.
This discussion does not address all the tax consequences that may be relevant to specific holders in light of their particular circumstances or to holders subject to special treatment under U.S. federal income tax laws (such as financial institutions, insurance companies, tax-exempt organizations, controlled foreign corporations, passive foreign investment companies, retirement plans, partnerships and their partners, dealers in securities, brokers, U.S. expatriates, persons who have acquired our common stock as compensation or otherwise in connection with the performance of services, or persons who have acquired our common stock as part of a straddle, hedge, conversion transaction or other integrated investment). In addition, this discussion does not address any other U.S. federal tax consequences (such as the Medicare contribution tax or U.S. federal estate or gift tax) or any aspects of state, local, or foreign tax laws.
If a partnership or other entity or arrangement treated as a partnership for U.S. federal income tax purposes holds our common stock, the tax treatment of a partner will generally depend upon the status of the partner and the activities of the partnership. A partnership that holds our common stock and any partner who owns an interest in such a partnership should consult their tax advisors regarding the U.S. federal income tax consequences of an investment in our common stock.
YOU ARE URGED TO CONSULT YOUR TAX ADVISOR WITH RESPECT TO THE APPLICATION OF THE U.S. FEDERAL INCOME TAX LAWS TO YOUR PARTICULAR SITUATION, AS WELL AS ANY TAX CONSEQUENCES OF THE PURCHASE, OWNERSHIP AND DISPOSITION OF OUR COMMON STOCK ARISING UNDER THE U.S. FEDERAL ESTATE OR GIFT TAX RULES OR UNDER THE LAWS OF ANY STATE, LOCAL, NON-U.S. OR OTHER TAXING JURISDICTION OR UNDER ANY APPLICABLE TAX TREATY.
As used in this discussion, the term "non-U.S. holder" refers to a beneficial owner of our common stock that for U.S. federal income tax purposes is neither a partnership (including any entity or arrangement treated as a partnership for such purposes) nor:
- •
- an individual who is a citizen or resident of the United States;
- •
- a corporation (or other entity taxable as a corporation) created or organized in or under the laws of the United States
or any state thereof, including the District of Columbia;
- •
- an estate the income of which is subject to U.S. federal income tax regardless of its source; or
- •
- a trust (1) if a court within the United States is able to exercise primary supervision over its administration and one or more U.S. persons have the authority to control all of its substantial decisions, or (2) that has in effect a valid election under applicable Treasury Regulations to be treated as a U.S. person.
Dividends and Distributions
In the event that we make a distribution of cash or other property (other than certain distributions of our stock) in respect of our common stock, the distribution generally will be treated as a dividend to the extent of our current or accumulated earnings and profits as determined under U.S. federal income
136
tax principles. To the extent those distributions exceed both our current and our accumulated earnings and profits, they will first constitute a nontaxable return of capital, on a share-by-share basis, and will first reduce your basis in our common stock, but not below zero, and then will be treated as gain from the disposition of the common stock, the tax treatment of which is discussed below under "Sale, Exchange or Other Taxable Disposition."
Any dividend paid to you generally will be subject to U.S. withholding tax either at a rate of 30.0% of the gross amount of the dividend or such lower rate as may be specified by an applicable income tax treaty. In order to receive a reduced treaty rate, you must provide us with an IRS Form W-8BEN (or successor form) or other appropriate version of IRS Form W-8 (or successor form), including a U.S. taxpayer identification number, certifying qualification for the reduced rate. A non-U.S. holder of shares of our common stock eligible for a reduced rate of U.S. withholding tax pursuant to an income tax treaty may obtain a refund of any excess amounts withheld by filing an appropriate claim for refund with the IRS. If the non-U.S. holder holds the stock through a financial institution or other agent acting on the non-U.S. holder's behalf, the non-U.S. holder will be required to provide appropriate documentation to the agent, which then will be required to provide certification to us or our paying agent, either directly or through other intermediaries.
Dividends received by you that are effectively connected with your conduct of a U.S. trade or business (and, if an income tax treaty applies, that are attributable to a permanent establishment or a fixed base maintained by you in the United States), are exempt from such withholding tax. In order to obtain this exemption, you must provide us with an IRS Form W-8ECI (or successor form) or other applicable IRS Form W-8 (or successor form) properly certifying such exemption. Such effectively connected dividends, although not subject to withholding tax, generally are taxed at the same graduated rates applicable to U.S. persons, net of certain deductions and credits. In addition, if you are a corporate non-U.S. holder, dividends you receive that are effectively connected with your conduct of a U.S. trade or business may also be subject to a branch profits tax at a rate of 30.0% or such lower rate as may be specified by an applicable income tax treaty.
A non-U.S. holder eligible for a reduced rate of U.S. withholding tax pursuant to an income tax treaty may obtain a refund of any excess amounts withheld by timely filing an appropriate claim for refund with the IRS.
Sale, Exchange or Other Taxable Disposition
Subject to the discussion below regarding backup withholding and foreign accounts, you generally will not be required to pay U.S. federal income tax on any gain realized upon the sale or other disposition of our common stock unless:
- •
- the gain is effectively connected with your conduct of a U.S. trade or business (and, if an income tax treaty applies,
the gain is attributable to a permanent establishment or a fixed base maintained by you in the United States);
- •
- you are an individual who is present in the United States for a period or periods aggregating 183 days or more
during the calendar year in which the sale or disposition occurs and certain other conditions are met; or
- •
- our common stock constitutes a U.S. real property interest by reason of our status as a "United States real property holding corporation," or USRPHC, for U.S. federal income tax purposes at any time within the shorter of the five-year period preceding your disposition of, or your holding period for, our common stock.
We believe that we are not currently and will not become a USRPHC. However, because the determination of whether we are a USRPHC depends on the fair market value of our U.S. real property relative to the fair market value of our other business assets, there can be no assurance that
137
we will not become a USRPHC in the future. Even if we become a USRPHC, however, as long as our common stock is regularly traded on an established securities market, such common stock will be treated as U.S. real property interests only if you actually or constructively hold more than 5.0% of such regularly traded common stock at any time during the shorter of the five-year period preceding your disposition of, or your holding period for, our common stock.
If you are a non-U.S. holder described in the first bullet above, you will be required to pay tax on the net gain derived from the sale under regular graduated U.S. federal income tax rates, and a corporate non-U.S. holder described in the first bullet above also may be subject to the branch profits tax at a 30.0% rate, or such lower rate as may be specified by an applicable income tax treaty. If you are an individual non-U.S. holder described in the second bullet above, you will be required to pay a flat 30% tax on the gain derived from the sale, which tax may be offset by U.S.-source capital losses for the year. You should consult any applicable income tax or other treaties that may provide for different rules.
Information Reporting and Backup Withholding
Information returns will be filed with the IRS in connection with payments of dividends and the proceeds from a sale or other disposition of our common stock. Information reporting and backup withholding (at the then applicable rate) may also apply to payments made to you on or with respect to our common stock, unless you certify as to your status as a non-U.S. person under penalties of perjury or otherwise establishes an exemption and certain other conditions are satisfied. Backup withholding is not an additional tax. Any amounts withheld under the backup withholding rules from a payment to you will be allowed as a refund or a credit against your U.S. federal income tax liability, if any, provided that the required information is timely furnished to the IRS.
Foreign Account Tax Compliance Act
After June 30, 2014, withholding at a rate of 30.0% generally will be required on dividends in respect of, and, after December 31, 2016, gross proceeds from the sale or other disposition of, our common stock held by or through certain foreign financial institutions (including investment funds), unless such institution enters into an agreement with the U.S. Treasury Department to report, on an annual basis, information with respect to interests in, and accounts maintained by, the institution that are owned by certain U.S. persons and by certain non-U.S. entities that are wholly or partially owned by U.S. persons and to withhold on certain payments. An intergovernmental agreement between the United States and an applicable foreign country, or future Treasury regulations or other guidance, may modify these requirements. Accordingly, the entity through which our common stock is held will affect the determination of whether such withholding is required. Similarly, dividends in respect of, and gross proceeds from the sale or other disposition of, our common stock held by an investor that is a non-financial non-U.S. entity that does not qualify under certain exemptions generally will be subject to withholding at a rate of 30.0%, unless such entity either (1) certifies that such entity does not have any "substantial United States owners" or (2) provides certain information regarding the entity's "substantial United States owners." Prospective investors should consult their tax advisors regarding the possible implications of these rules on their investment in our common stock.
138
We are offering the shares of our common stock described in this prospectus in an underwritten offering in which we and Sandler O'Neill + Partners, L.P. and Stephens Inc., as representatives of the underwriters for this offering, will enter into an underwriting agreement with respect to the common stock being offered. Subject to the terms and conditions contained in the underwriting agreement, the underwriters named below have agreed, severally and not jointly, to purchase the respective number of shares of our common stock set forth opposite their respective names below:
Name
|
Numbers of Shares |
|||
|---|---|---|---|---|
Sandler O'Neill + Partners, L.P. |
||||
Stephens Inc. |
||||
Sterne, Agee & Leach, Inc. |
||||
| | | | | |
Total |
2,700,000 | |||
| | | | | |
| | | | | |
The underwriting agreement provides that the underwriters' obligation to purchase shares of our common stock depends on the satisfaction of the conditions contained in the underwriting agreement, including:
- •
- the representations and warranties made by us are true and agreements have been performed;
- •
- there is no material adverse change in their determination in the financial markets or in our business; and
- •
- we deliver customary closing documents.
Subject to these conditions, the underwriters are committed to purchase and pay for all of the shares of our common stock offered by this prospectus, if any such shares are purchased. However, the underwriters are not obligated to take or pay for the shares of our common stock covered by the underwriters' purchase option described below, unless and until that option is exercised. The underwriting agreement also provides that if an underwriter defaults, the purchase commitments of non-defaulting underwriters may be increased or this offering may be terminated.
We have applied to list our common stock on the NASDAQ Global Market under the symbol "VBTX."
Discounts, Commissions and Expenses
Shares of our common stock sold by the underwriters to the public will be offered at the initial public offering price set forth on the cover of this prospectus. Any shares of our common stock sold by the underwriters to securities dealers may be sold at a discount of up to $ per share from the initial public offering price. Any of these securities dealers may resell any shares of our common stock purchased from the underwriters to other brokers or dealers at a discount of up to $ per share from the initial public offering price. If all of the shares of our common stock are not sold at the initial public offering price, the representatives may change the offering price and the other selling terms. Sales of shares of our common stock made outside of the United States may be made by affiliates of the underwriters. The underwriters reserve the right to reject an order for the purchase of shares, in whole or in part.
139
The following table shows the initial public offering price, underwriting discount and proceeds before expenses to us. The information assumes either no exercise or full exercise by the underwriters of their over-allotment option to purchase an additional shares, discussed below:
| |
Per Share | No Exercise | Full Exercise | |||
|---|---|---|---|---|---|---|
Initial public offering price |
$ | $ | $ | |||
Underwriting discounts and commissions to be paid by us |
||||||
Proceeds to us, before expenses |
In addition to the underwriting discount, we will reimburse the underwriters for their reasonable out-of-pocket expenses incurred in connection with their engagement as underwriters, including marketing, syndication and travel expenses, and will pay the fees and expenses of the underwriters in connection with the directed share program and the reasonable fees and disbursements of counsel for the underwriters in connection with this offering and the directed share program, in each case regardless of whether this offering is consummated. These reimbursements and payments will not exceed $450,000. In the event that we utilize underwriter-provided aircraft for travel in connection with the road show, we will provide reimbursement for such use at cost, up to $75,000. The underwriters would receive incremental value if representatives of the underwriters travel, at our expense, on the underwriter-provided aircraft during the road show. If at least one-half of the travelers on the underwriter-provided aircraft are representatives of underwriters, the maximum incremental value to be received by the underwriters in connection with our utilization of underwriter-provided aircraft is $37,500. In addition to these amounts and the underwriting discount, we estimate the expenses of this offering to be approximately $1.4 million and are payable by us.
Purchase Option
We have granted the underwriters an option to buy up to 405,000 additional shares of our common stock, at the initial public offering price less underwriting discounts, to cover over-allotments. The underwriters may exercise this option, in whole or from time to time in part, solely for the purpose of covering over-allotments, if any, made in connection with this offering. The underwriters have 30 days from the date of this prospectus to exercise this option. If the underwriters exercise this option, each underwriter will be obligated, subject to the conditions in the underwriting agreement, to purchase a number of additional shares of our common stock proportionate to such underwriter's initial amount relative to the total amount reflected next to their name in the table above. We will be obligated to sell these shares of common stock to the underwriters to the extent the purchase option is exercised.
Indemnification and Contribution
We have agreed to indemnify the underwriters, and persons who control the underwriters, against certain liabilities, including liabilities under the Securities Act, and to contribute to payments that the underwriters may be required to make in respect of these liabilities.
Lock-Up Agreements
We, our directors and executive officers, and certain other current shareholders have entered into lock-up agreements with the underwriters. Under these agreements, we and each of these persons may not, without the prior written approval of the representatives, subject to limited exceptions,
- •
- offer, pledge, sell, contract to sell, sell any option or contract to purchase, purchase any option or contract to sell, grant any option, right or warrant for the sale of, or otherwise dispose of or transfer any of our common stock or any securities convertible into or exchangeable or exercisable for our common stock, whether now owned or hereafter acquired or with respect to
140
- •
- enter into any swap or any other agreement or any transaction that transfers, in whole or in part, directly or indirectly, the economic consequence of ownership of our common stock whether any such swap or transaction is to be settled by delivery of our common stock or other securities, in cash or otherwise.
which such person has or hereafter acquires the power of disposition, or file any registration statement under the Securities Act, with respect to any of the foregoing; or
These restrictions will be in effect for a period of 180 days after the date of the underwriting agreement. The representatives may, in its sole discretion, waive or release all or some of the securities from these lock-up agreements.
These restrictions also apply to any shares of our common stock sold in the directed share program described below under "—Directed Share Program."
Pricing of the Offering
Prior to this offering, there has been no established public market for our common stock. The initial public offering price will be determined by negotiations among us and the representatives of the underwriters. In addition to prevailing market conditions, among the factors to be considered in determining the initial public offering price of our common stock will be our historical performance, estimates of our business potential and our earnings prospects, an assessment of our management and the consideration of the above factors in relation to market valuation of companies in related businesses. The estimated initial public offering price range set forth on the cover page of this preliminary prospectus is subject to change as a result of market conditions and other factors. An active trading market for the shares of our common stock may not develop. It is also possible that the shares will not trade in the public market at or above the initial public offering price following the completion of this offering.
Directed Share Program
At our request, the underwriters have reserved up to 135,000 shares of our common stock offered by this prospectus, for sale, at the initial public offering price, to our directors, executive officers, employees and certain other persons who have expressed an interest in purchasing our common stock in this offering. The number of shares available for sale to the general public in the offering will be reduced to the extent these persons purchase the reserved shares. Any reserved shares not so purchased will be offered by the underwriters to the general public on the same terms as the other shares. Any shares sold in the directed share program will be subject to the 180-day lock-up agreements described above.
Stabilization
In connection with this offering, the underwriters may, but are not obligated to, engage in stabilizing transactions, overallotment transactions, syndicate covering transactions and penalty bids.
- •
- Stabilizing transactions permit bids to purchase shares of common stock so long as the stabilizing bids do not exceed a
specified maximum, and are engaged in for the purpose of preventing or mitigating a decline in the market price of the common stock while this offering is in progress.
- •
- Overallotment transactions involve sales by the underwriters of shares of common stock in excess of the number of shares the underwriters are obligated to purchase. This creates a syndicate short position that may be either a covered short position or a naked short position. In a covered short position, the number of shares of common stock over-allotted by the underwriters is not greater than the number of shares that they may purchase in the purchase option. In a naked short position, the number of shares involved is greater than the number of shares in the
141
- •
- Syndicate covering transactions involve purchases of common stock in the open market after the distribution has been
completed in order to cover syndicate short positions. In determining the source of shares to close out the short position, the underwriters will consider, among other things, the price of shares
available for purchase in the open market compared to the price at which they may purchase shares through exercise of the purchase option. If the underwriters sell more shares than could be covered by
exercise of the purchase option and, therefore, have a naked short position, the position can be closed out only by buying shares in the open market. A naked short position is more likely to be
created if the underwriters are concerned that after pricing there could be downward pressure on the price of the shares in the open market that could adversely affect investors who purchase in this
offering.
- •
- Penalty bids permit the underwriters to reclaim a selling concession from a syndicate member when the common stock originally sold by that syndicate member is purchased in stabilizing or syndicate covering transactions to cover syndicate short positions.
purchase option. The underwriters may close out any short position by exercising their purchase option and/or purchasing shares in the open market.
These stabilizing transactions, syndicate covering transactions and penalty bids may have the effect of raising or maintaining the market price of our common stock or preventing or mitigating a decline in the market price of our common stock. As a result, the price of our common stock in the open market may be higher than it would otherwise be in the absence of these transactions. Neither we nor the underwriters make any representation or prediction as to the effect that the transactions described above may have on the price of our common stock. These transactions may be effected on the NASDAQ Global Market, in the over-the-counter market or otherwise and, if commenced, may be discontinued at any time.
Passive Market Making
In connection with this offering, the underwriters and selling group members may engage in passive market making transactions in our common stock on the NASDAQ Global Market in accordance with Rule 103 of Regulation M under the Exchange Act during a period before the commencement of offers or sales of our common stock and extending through the completion of the distribution of this offering. A passive market maker must display its bid at a price not in excess of the highest independent bid of that security. However, if all independent bids are lowered below the passive market maker's bid, that bid must then be lowered when specified purchase limits are exceeded. Passive market making may cause the price of our common stock to be higher than the price that otherwise would exist in the open market in the absence of those transactions. The underwriters and dealers are not required to engage in a passive market making and may end passive market making activities at any time.
Electronic Distribution
This prospectus may be made available in electronic format on websites or through other online services maintained by one or more of the underwriters, or by their affiliates. Other than this prospectus in electronic format, information on such websites and any information contained in any other website maintained by the underwriters or any of their affiliates is not part of this prospectus or registration statement of which the prospectus forms a part, has not been approved or endorsed by us or the underwriters in their capacities as underwriters and should not be relied on by investors.
Our Relationship with the Underwriters
The underwriters and their respective affiliates are full service financial institutions engaged in various activities, which may include securities trading, commercial and investment banking, financial
142
advisory, investment management, investment advisory, investment research, principal investment, hedging, financing, loan referrals, valuation and brokerage activities. From time to time, the underwriters and/or their respective affiliates have directly and indirectly engaged, and may in the future engage, in various financial advisory, investment banking loan referrals and commercial banking services with us and our affiliates, for which they received or paid, or may receive or pay, customary compensation, fees and expense reimbursement. In the ordinary course of their various business activities, the underwriters and their respective affiliates may make or hold a broad array of investments and actively trade debt and equity securities (or related derivative securities) and financial instruments (including bank loans) for their own account and for the accounts of their customers, and those investment and securities activities may involve securities and/or instruments of ours. The underwriters and their respective affiliates may also make investment recommendations and/or publish or express independent research views in respect of those securities or instruments and may at any time hold, or recommend to clients that they acquire, long and/or short positions in those securities and instruments.
143
The validity of the common stock offered hereby will be passed upon for us by Bracewell & Giuliani LLP, Houston, Texas, and for the underwriters by Fenimore, Kay, Harrison & Ford, LLP, Austin, Texas.
The consolidated financial statements as of and for the year ended December 31, 2013 included in this prospectus and included elsewhere in the registration statement have been so included in reliance upon the report of Grant Thornton LLP, independent registered public accountants, upon the authority of said firm as experts in accounting and auditing.
The consolidated financial statements as of December 31, 2012 and for the years ended December 31, 2012 and 2011 included in this prospectus and included elsewhere in the registration statement have been audited by JonesBaggett LLP, an independent registered public accounting firm, as stated in their report appearing elsewhere herein. Such consolidated financial statements are included in reliance upon the report of such firm given upon their authority as experts in accounting and auditing.
WHERE YOU CAN FIND MORE INFORMATION
We have filed with the SEC a registration statement on Form S-1 under the Securities Act relating to the shares of common stock offered by this prospectus that includes important business and financial information about us that is not included in or delivered with this prospectus. If we have made references in this prospectus to any contracts, agreements or other documents and also filed any of those contracts, agreements or other documents as exhibits to the registration statement, you should read the relevant exhibit for a more complete understanding of the document or the matter involved.
You may read and copy the registration statement and the related exhibits, and the reports, proxy statements and other information we will file with the SEC, at the SEC's public reference room maintained by the SEC at Room 1580, 100 F Street N.E., Washington, D.C. 20549. You can also request copies of those documents, upon payment of a duplicating fee, by writing to the SEC. Please call the SEC at 1-800-SEC-0330 for further information on the operation of the public reference room. The SEC also maintains an Internet site that contains reports, proxy and information statements and other information regarding issuers that file with the SEC. The site's Internet address is www.sec.gov. We also maintain a website at www.veritexbank.com. Upon completion of this offering, you may access these materials free of charge as soon as reasonably practicable after they are electronically filed with, or furnished to, the SEC. Information contained on our website is not a part of this prospectus and the inclusion of our website address in this prospectus is an inactive textual reference only. You should not rely on any such information in making your decision whether to purchase our securities.
144
F-1
VERITEX HOLDINGS, INC. AND SUBSIDIARY
Consolidated Condensed Balance Sheets (Unaudited)
June 30, 2014 and December 31, 2013
(Dollars in thousands, except par value information)
| |
June 30, 2014 |
December 31, 2013 |
|||||
|---|---|---|---|---|---|---|---|
ASSETS |
|||||||
Cash and due from banks |
$ | 10,038 | $ | 8,484 | |||
Interest bearing deposits in other banks |
56,512 | 68,162 | |||||
| | | | | | | | |
Total cash and cash equivalents |
66,550 | 76,646 | |||||
Investment securities |
50,547 | 45,604 | |||||
Loans held for sale |
6,342 | 2,051 | |||||
Loans, net |
535,403 | 490,158 | |||||
Accrued interest receivable |
1,359 | 1,351 | |||||
Bank-owned life insurance |
10,647 | 10,475 | |||||
Bank premises, furniture and equipment, net |
11,303 | 9,952 | |||||
Non-marketable equity securities |
2,959 | 2,714 | |||||
Investment in subsidiary |
93 | 93 | |||||
Other real estate owned |
2,494 | 1,797 | |||||
Intangible assets |
1,413 | 1,567 | |||||
Goodwill |
19,148 | 19,148 | |||||
Other assets |
2,124 | 3,415 | |||||
| | | | | | | | |
Total assets |
$ | 710,382 | $ | 664,971 | |||
| | | | | | | | |
| | | | | | | | |
LIABILITIES AND STOCKHOLDERS' EQUITY |
|||||||
Deposits: |
|||||||
Noninterest-bearing |
$ | 236,198 | $ | 218,990 | |||
Interest-bearing |
374,976 | 354,948 | |||||
| | | | | | | | |
Total deposits |
611,174 | 573,938 | |||||
Accounts payable and accrued expenses |
1,195 | 1,214 | |||||
Accrued interest payable and other liabilities |
696 | 508 | |||||
Advances from Federal Home Loan Bank |
15,000 | 15,000 | |||||
Other borrowings |
8,073 | 8,072 | |||||
| | | | | | | | |
Total liabilities |
636,138 | 598,732 | |||||
Commitments and contingencies (Note 6) |
|||||||
Stockholders' equity: |
|||||||
Preferred stock, $0.01 par value; 500,000 shares authorized; 8,000 shares Series C, issued and outstanding with a $1,000 liquidation value |
8,000 | 8,000 | |||||
Common stock, $0.01 par value; 10,000,000 shares authorized, 6,358,832 and 5,804,703 shares issued and outstanding at June 30, 2014 and December 31, 2013, respectively, (excluding 10,000 shares held in treasury) |
64 | 58 | |||||
Additional paid-in capital |
61,419 | 55,303 | |||||
Retained earnings |
5,038 | 2,922 | |||||
Accumulated other comprehensive income |
194 | 26 | |||||
Unallocated Employee Stock Ownership Plan shares; 36,935 shares at June 30, 2014 |
(401 | ) | — | ||||
Less: Treasury stock, 10,000 shares at cost |
(70 | ) | (70 | ) | |||
| | | | | | | | |
Total stockholders' equity |
74,244 | 66,239 | |||||
| | | | | | | | |
Total liabilities and stockholders' equity |
$ | 710,382 | $ | 664,971 | |||
| | | | | | | | |
| | | | | | | | |
See accompanying notes to condensed consolidated financial statements.
F-2
VERITEX HOLDINGS, INC. AND SUBSIDIARY
Consolidated Condensed Statements of Income (Unaudited)
For the Six Months Ended June 30, 2014 and 2013
(Dollars in thousands, except per share amounts)
| |
Six Months Ended June 30, |
||||||
|---|---|---|---|---|---|---|---|
| |
2014 | 2013 | |||||
Interest income: |
|||||||
Interest and fees on loans |
$ | 12,718 | $ | 10,918 | |||
Interest on investment securities |
422 | 280 | |||||
Interest on deposits in other banks |
77 | 60 | |||||
Interest on other |
1 | 1 | |||||
| | | | | | | | |
Total interest income |
13,218 | 11,259 | |||||
| | | | | | | | |
Interest expense: |
|||||||
Interest on deposit accounts |
1,161 | 1,060 | |||||
Interest on borrowings |
251 | 156 | |||||
| | | | | | | | |
Total interest expense |
1,412 | 1,216 | |||||
| | | | | | | | |
Net interest income |
11,806 | 10,043 | |||||
Provision for loan losses |
677 | 1,008 | |||||
| | | | | | | | |
Net interest income after provision for loan losses |
11,129 | 9,035 | |||||
| | | | | | | | |
Noninterest income: |
|||||||
Service charges on deposit accounts |
396 | 369 | |||||
Gain on sales of investment securities |
34 | — | |||||
Gain on sales of loans held for sale |
245 | 424 | |||||
Gain on sales of other real estate owned |
37 | 17 | |||||
Bank-owned life insurance |
212 | 166 | |||||
Other |
287 | 330 | |||||
| | | | | | | | |
Total noninterest income |
1,211 | 1,306 | |||||
| | | | | | | | |
Noninterest expense: |
|||||||
Salaries and employee benefits |
4,838 | 4,446 | |||||
Occupancy of bank premises |
920 | 830 | |||||
Depreciation and amortization |
667 | 607 | |||||
Data processing |
426 | 358 | |||||
FDIC assessment fees |
217 | 186 | |||||
Legal fees |
59 | 48 | |||||
Other professional fees |
543 | 274 | |||||
Advertising and promotions |
93 | 78 | |||||
Utilities and telephone |
141 | 143 | |||||
Other real estate owned expenses and writedowns |
134 | 243 | |||||
Other |
956 | 895 | |||||
| | | | | | | | |
Total noninterest expense |
8,994 | 8,108 | |||||
| | | | | | | | |
Net income from operations |
3,346 | 2,233 | |||||
Income tax expense |
1,190 | 774 | |||||
| | | | | | | | |
Net income |
$ | 2,156 | $ | 1,459 | |||
| | | | | | | | |
| | | | | | | | |
Preferred stock dividends |
40 | 40 | |||||
| | | | | | | | |
Net income available to common stockholders |
$ | 2,116 | $ | 1,419 | |||
| | | | | | | | |
Basic earnings per share |
$ | 0.34 | $ | 0.25 | |||
| | | | | | | | |
| | | | | | | | |
Diluted earnings per share |
$ | 0.33 | $ | 0.24 | |||
| | | | | | | | |
| | | | | | | | |
See accompanying notes to condensed consolidated financial statements.
F-3
VERITEX HOLDINGS, INC. AND SUBSIDIARY
Consolidated Condensed Statements of Comprehensive Income (Unaudited)
For the Six Months Ended June 30,
2014 and 2013
(Dollars in thousands)
| |
Six Months Ended June 30, |
||||||
|---|---|---|---|---|---|---|---|
| |
2014 | 2013 | |||||
Net income |
$ | 2,156 | $ | 1,459 | |||
| | | | | | | | |
Other comprehensive (loss) income: |
|||||||
Unrealized gains (losses) on securities available for sale arising during the period, net |
289 | (498 | ) | ||||
Reclassification adjustment for net gains included in net income |
34 | — | |||||
| | | | | | | | |
Other comprehensive gains (losses) before tax |
255 | (498 | ) | ||||
Income tax expense (benefit) |
87 | (169 | ) | ||||
| | | | | | | | |
Other comprehensive gains (losses), net of tax |
168 | (329 | ) | ||||
| | | | | | | | |
Comprehensive income |
$ | 2,324 | $ | 1,130 | |||
| | | | | | | | |
| | | | | | | | |
See accompanying notes to condensed consolidated financial statements.
F-4
VERITEX HOLDINGS, INC. AND SUBSIDIARY
Consolidated Condensed Statements of Changes in Stockholders' Equity (Unaudited)
For the Six Months Ended
June 30, 2014 and 2013
(Dollars in thousands)
| |
|
|
|
|
|
|
Unallocated Employee Stock Ownership Plan Shares |
|
|
|||||||||||||||||||
|---|---|---|---|---|---|---|---|---|---|---|---|---|---|---|---|---|---|---|---|---|---|---|---|---|---|---|---|---|
| |
|
Common stock | |
|
Accumulated Other Comprehensive Income (Loss) |
|
|
|||||||||||||||||||||
| |
Preferred Stock |
Additional Paid-In Capital |
Retained Earnings |
Treasury Stock |
|
|||||||||||||||||||||||
| |
Shares | Amount | Total | |||||||||||||||||||||||||
Balance at December 31, 2013 |
$ | 8,000 | 5,804,703 | $ | 58 | $ | 55,303 | $ | 2,922 | $ | 26 | $ | — | $ | (70 | ) | $ | 66,239 | ||||||||||
Sale of common stock |
— | 508,047 | 6 | 5,432 | — | — | — | — | 5,438 | |||||||||||||||||||
Preferred stock dividend Series C |
— | — | — | — | (40 | ) | — | — | — | (40 | ) | |||||||||||||||||
Sale and finance of stock to ESOP |
— | 46,082 | — | 500 | — | — | (500 | ) | — | — | ||||||||||||||||||
ESOP shares allocated |
— | — | — | 19 | — | — | 99 | — | 118 | |||||||||||||||||||
Stock based compensation |
— | — | — | 165 | — | — | — | — | 165 | |||||||||||||||||||
Net income |
— | — | — | — | 2,156 | — | — | — | 2,156 | |||||||||||||||||||
Other comprehensive income |
— | — | — | — | — | 168 | — | — | 168 | |||||||||||||||||||
| | | | | | | | | | | | | | | | | | | | | | | | | | | | | |
Balance at June 30, 2014 |
$ | 8,000 | 6,358,832 | $ | 64 | $ | 61,419 | $ | 5,038 | $ | 194 | $ | (401 | ) | $ | (70 | ) | $ | 74,244 | |||||||||
| | | | | | | | | | | | | | | | | | | | | | | | | | | | | |
| | | | | | | | | | | | | | | | | | | | | | | | | | | | | |
See accompanying notes to condensed consolidated financial statements.
F-5
VERITEX HOLDINGS, INC. AND SUBSIDIARY
Consolidated Condensed Statements of Cash Flows (Unaudited)
For the Six Months Ended June 30, 2014 and
2013
(Dollars in thousands)
| |
Six Months Ended June 30, |
||||||
|---|---|---|---|---|---|---|---|
| |
2014 | 2013 | |||||
Cash flows from operating activities: |
|||||||
Net income |
$ | 2,156 | $ | 1,459 | |||
Adjustments to reconcile net income to net cash provided by operating activities: |
|||||||
Depreciation and amortization |
667 | 607 | |||||
Provision for loan losses |
677 | 1,008 | |||||
Accretion of loan purchase discount |
(234 | ) | (226 | ) | |||
Stock based compensation expense |
165 | 160 | |||||
Amortization of other intangible assets |
7 | 7 | |||||
Net amortization of premiums on investment securities |
217 | 184 | |||||
Change in cash surrender value of bank-owned life insurance |
(172 | ) | (141 | ) | |||
Gain on sales of investment securities |
(34 | ) | — | ||||
Gain on sales of loans held for sale |
(245 | ) | (424 | ) | |||
Amortization of subordinated note discount |
1 | — | |||||
Net gain on sales of other real estate owned |
(37 | ) | (2 | ) | |||
Writedowns of other real estate owned |
— | 171 | |||||
Net originations of loans held for sale |
(18,779 | ) | (23,958 | ) | |||
Proceeds from sales of loans held for sale |
14,733 | 24,407 | |||||
Decrease in accrued interest receivable, prepaids and other assets |
1,283 | 415 | |||||
Increase in accrued expenses and other liabilities |
83 | 309 | |||||
| | | | | | | | |
Net cash provided by operating activities |
488 | 3,976 | |||||
| | | | | | | | |
Cash flows from investing activities: |
|||||||
Purchases of securities available for sale |
(10,983 | ) | (14,560 | ) | |||
Sales of securities available for sale |
981 | — | |||||
Proceeds from maturities, calls and pay downs of securities available for sale |
5,130 | 4,886 | |||||
Purchases of non-marketable equity securities, net |
(245 | ) | (124 | ) | |||
Net loans originated |
(46,798 | ) | (25,772 | ) | |||
Purchases of bank-owned life insurance |
— | (5,000 | ) | ||||
Net additions to bank premises and equipment |
(1,871 | ) | (246 | ) | |||
Proceeds from sales of other real estate owned |
450 | 1,009 | |||||
| | | | | | | | |
Net cash used in investing activities |
(53,336 | ) | (39,807 | ) | |||
| | | | | | | | |
Cash flows from financing activities: |
|||||||
Net change in deposits |
37,236 | 64,631 | |||||
Net increase in advances from Federal Home Loan Bank |
— | 5,000 | |||||
Dividends paid on preferred stock |
(40 | ) | (40 | ) | |||
Proceeds from payments on ESOP Loan |
118 | — | |||||
Proceeds from issuance of common stock, net |
5,438 | 1,151 | |||||
| | | | | | | | |
Net cash provided by financing activities |
42,752 | 70,742 | |||||
| | | | | | | | |
Net (decrease) increase in cash and cash equivalents |
(10,096 | ) | 34,911 | ||||
Cash and cash equivalents at beginning of year |
76,646 | 53,160 | |||||
| | | | | | | | |
Cash and cash equivalents at end of period |
$ | 66,550 | $ | 88,071 | |||
| | | | | | | | |
| | | | | | | | |
Supplemental disclosures of cash flow information: |
|||||||
Cash paid for interest |
$ | 1,346 | $ | 1,212 | |||
Cash paid for income taxes |
$ | 1,230 | $ | 800 | |||
Supplemental disclosures of non-cash flow information: |
|||||||
Sale and finance of stock to ESOP |
$ | 500 | — | ||||
Net foreclosure of other real estate owned |
$ | 1,110 | $ | 1,092 | |||
See accompanying notes to condensed consolidated financial statements.
F-6
VERITEX HOLDINGS, INC. AND SUBSIDIARY
Notes to Condensed Consolidated Financial Statements (Unaudited)
(Dollars in thousands, except per share
amounts)
1. Summary of Significant Accounting Policies
Nature of Operations
Veritex Holdings, Inc. (Veritex) through its wholly-owned subsidiary, Veritex Community Bank, a Texas state banking organization (Bank) (collectively known as the Company), with corporate offices in Dallas, Texas, currently operates nine branches located throughout the greater Dallas, Texas metropolitan area. The Bank provides a full range of banking services to individual and corporate customers, which include commercial and retail lending, and the acceptance of checking and savings deposits. The Texas Department of Banking and the Federal Reserve are the primary regulators of the Bank, which undergoes periodic examinations by those regulatory authorities in addition to the Federal Deposit Insurance Corporation.
Organization and Basis of Presentation
The accompanying unaudited condensed consolidated financial statements include the accounts of Veritex and its wholly-owned subsidiary, the Bank. All material intercompany transactions have been eliminated in consolidation.
The accompanying unaudited condensed consolidated financial statements have been prepared in accordance with generally accepted accounting principles in the United States of America (U.S. GAAP), but do not include all of the information and footnotes required for complete financial statements. In management's opinion, these interim unaudited condensed consolidated financial statements include all adjustments of a normal recurring nature necessary for a fair statement of the Company's consolidated financial position at June 30, 2014, consolidated results of operations for the six months ended June 30, 2014 and 2013, consolidated stockholders' equity for the six months ended June 30, 2014 and consolidated cash flows for the six months ended June 30, 2014 and 2013.
Accounting measurements at interim dates inherently involve greater reliance on estimates than at year end and the results for the interim periods shown in this report are not necessarily indicative of results to be expected for the full year due in part to global economic and financial market conditions, interest rates, access to sources of liquidity, market competition and interruptions of business processes. These interim unaudited condensed consolidated financial statements should be read in conjunction with the Company's audited consolidated financial statements and notes thereto for the year ended December 31, 2013 included within this Company's Form S-1 registration statement.
The preparation of financial statements in conformity with U.S. GAAP requires management to make estimates and assumptions that affect the amounts reported in the financial statements and accompanying notes. These estimates and assumptions may also affect disclosure of contingent assets and liabilities at the date of the financial statements and the reported amounts of revenues and expenses during the reporting period. Actual results could differ from these estimates.
Segment Reporting:
The Company has one reportable segment. The Company's chief operating decision- maker uses consolidated results to make operating and strategic decisions.
F-7
VERITEX HOLDINGS, INC. AND SUBSIDIARY
Notes to Condensed Consolidated Financial Statements (Unaudited) (Continued)
(Dollars in thousands, except per share amounts)
1. Summary of Significant Accounting Policies (Continued)
ESOP
Shares of the Company's common stock purchased by the Veritex Community Bank Employee Stock Ownership Plan (ESOP) are held in a suspense account until released for allocation to participants. Shares released are allocated to each eligible participant based on the participant's 401(k) contribution made during that year.
Compensation expense is measured based upon the expected amount of the Company's discretionary contribution which is determined on an annual basis and is accrued ratably over the year. Shares are committed to be released to settle the liability upon formal declaration of the contribution at the end of the year. The number of shares released to settle the liability is based upon fair value of the shares as of the end of year and become outstanding shares for earnings per share computations. The cost of shares issued to the ESOP, but not yet committed to be released, is shown as a reduction of stockholders' equity. To the extent that the fair value of the ESOP shares differs from the cost of such shares, the difference is charged or credited to stockholders' equity as additional paid in capital. During the six months ended June 30, 2014 the ESOP loan was repaid approximately $118 from contributions to ESOP from the Company. As a result of the repayment, 9,147 shares were released from collateral and allocated to employee participant accounts. Dividends on allocated ESOP shares are charged to retained earnings and paid to participants of the ESOP. Dividends on unallocated ESOP shares are used to repay the ESOP loan and related accrued interest. No cash dividends were declared or paid by the Company during the six months ended June 30, 2014 and 2013.
Earnings Per Share
Earnings per share (EPS) are based upon the weighted-average shares outstanding. The table below sets forth the reconciliation between weighted average shares used for calculating basic and diluted EPS for the six months ended June 30, 2014 and 2013:
| |
Six months Ended June 30, |
||||||
|---|---|---|---|---|---|---|---|
| |
2014 | 2013 | |||||
Earnings (numerator) |
|||||||
Net income for common stockholders |
$ | 2,156 | $ | 1,459 | |||
Less: preferred stock dividends |
40 | 40 | |||||
| | | | | | | | |
Net income allocated to common stockholders |
$ | 2,116 | $ | 1,419 | |||
| | | | | | | | |
| | | | | | | | |
Shares (denominator) |
|||||||
Weighted average shares outstanding for basic EPS (thousands) |
6,231 | 5,772 | |||||
Dilutive effect of employee stock based awards and warrants |
128 | 64 | |||||
| | | | | | | | |
Adjusted weighted average shares outstanding |
6,359 | 5,836 | |||||
| | | | | | | | |
| | | | | | | | |
Earnings per share: |
|||||||
Basic |
$ | 0.34 | $ | 0.25 | |||
| | | | | | | | |
| | | | | | | | |
Diluted |
$ | 0.33 | $ | 0.24 | |||
| | | | | | | | |
| | | | | | | | |
F-8
VERITEX HOLDINGS, INC. AND SUBSIDIARY
Notes to Condensed Consolidated Financial Statements (Unaudited) (Continued)
(Dollars in thousands, except per share amounts)
1. Summary of Significant Accounting Policies (Continued)
For the six months ended June 30, 2014, the Company excluded from diluted EPS weighted average shares of performance stock options representing the right to purchase 459,000 shares of the Company's common stock, because the issuance of shares related to these options is contingent upon the satisfaction of certain conditions unrelated to earnings or market value and these conditions were not expected to be met.
For the six months ended June 30, 2013 the Company excluded from diluted EPS weighted average shares of performance stock options representing the right to purchase 426,000 shares of the Company's common stock, because the issuance of shares related to these options is contingent upon the satisfaction of certain conditions unrelated to earnings or market value and these conditions were not expected to be met.
2. Common Stock
During January 2014, the Company engaged in a private offering of up to 500,000 shares of its common stock, par value $0.01 per share, at $10.85 per share. As of March 31, 2014, the offering was completed and closed. The Company issued 490,773 shares under the offering generating total proceeds of approximately $5,325 and had offering costs of approximately $60. In addition, the Company issued 17,274 shares of common stock at $10 per share generating total proceeds of approximately $173. The Company intends to use the proceeds from the stock issuances to support the growth of the Company.
3. Investment Securities
The carrying amount of securities and their approximate fair values at June 30, 2014 and December 31, 2013 are as follows:
| |
June 30, 2014 | ||||||||||||
|---|---|---|---|---|---|---|---|---|---|---|---|---|---|
| |
Amortized Cost |
Gross Unrealized Gains |
Gross Unrealized Losses |
Fair Value |
|||||||||
Available for Sale |
|||||||||||||
U.S. government agencies |
$ | 2,000 | $ | — | $ | 71 | $ | 1,929 | |||||
Corporate bonds |
500 | 3 | — | 503 | |||||||||
Municipal securities |
949 | 32 | — | 981 | |||||||||
Mortgage-backed securities |
32,248 | 283 | 97 | 32,434 | |||||||||
Collateralized mortgage obligations |
13,305 | 159 | 42 | 13,422 | |||||||||
Asset-backed securities |
1,251 | 27 | — | 1,278 | |||||||||
| | | | | | | | | | | | | | |
|
$ | 50,253 | $ | 504 | $ | 210 | $ | 50,547 | |||||
| | | | | | | | | | | | | | |
| | | | | | | | | | | | | | |
F-9
VERITEX HOLDINGS, INC. AND SUBSIDIARY
Notes to Condensed Consolidated Financial Statements (Unaudited) (Continued)
(Dollars in thousands, except per share amounts)
3. Investment Securities (Continued)
| |
December 31, 2013 | ||||||||||||
|---|---|---|---|---|---|---|---|---|---|---|---|---|---|
| |
Amortized Cost |
Gross Unrealized Gains |
Gross Unrealized Losses |
Fair Value |
|||||||||
Available for Sale |
|||||||||||||
U.S. government agencies |
$ | 2,019 | $ | — | $ | 95 | $ | 1,924 | |||||
Corporate bonds |
1,445 | 35 | — | 1,480 | |||||||||
Municipal securities |
934 | 24 | — | 958 | |||||||||
Mortgage-backed securities |
24,898 | 220 | 187 | 24,931 | |||||||||
Collateralized mortgage obligations |
14,898 | 158 | 141 | 14,915 | |||||||||
Asset-backed securities |
1,370 | 26 | — | 1,396 | |||||||||
| | | | | | | | | | | | | | |
|
$ | 45,564 | $ | 463 | $ | 423 | $ | 45,604 | |||||
| | | | | | | | | | | | | | |
| | | | | | | | | | | | | | |
The following tables disclose the Company's investment securities that have been in a continuous unrealized loss position for less than 12 months and those that have been in a continuous unrealized loss position for 12 or more months:
| |
June 30, 2014 | ||||||||||||||||||
|---|---|---|---|---|---|---|---|---|---|---|---|---|---|---|---|---|---|---|---|
| |
Less Than 12 Months | 12 Months or More | Totals | ||||||||||||||||
| |
Fair Value |
Unrealized Loss |
Fair Value |
Unrealized Loss |
Fair Value |
Unrealized Loss |
|||||||||||||
Available for Sale |
|||||||||||||||||||
U.S. government agencies |
$ | — | $ | — | $ | 1,929 | $ | 71 | $ | 1,929 | $ | 71 | |||||||
Mortgage-backed securities |
6,635 | 10 | 8,776 | 87 | 15,411 | 97 | |||||||||||||
Collateralized mortgage obligations |
3,222 | 31 | 900 | 11 | 4,122 | 42 | |||||||||||||
| | | | | | | | | | | | | | | | | | | | |
|
$ | 9,857 | $ | 41 | $ | 11,605 | $ | 169 | $ | 21,462 | $ | 210 | |||||||
| | | | | | | | | | | | | | | | | | | | |
| | | | | | | | | | | | | | | | | | | | |
| |
December 31, 2013 | ||||||||||||||||||
|---|---|---|---|---|---|---|---|---|---|---|---|---|---|---|---|---|---|---|---|
| |
Less Than 12 Months | 12 Months or More | Totals | ||||||||||||||||
| |
Fair Value |
Unrealized Loss |
Fair Value |
Unrealized Loss |
Fair Value |
Unrealized Loss |
|||||||||||||
Available for Sale |
|||||||||||||||||||
U.S. government agencies |
$ | 1,924 | $ | 95 | $ | — | $ | — | $ | 1,924 | $ | 95 | |||||||
Mortgage-backed securities |
10,612 | 187 | — | — | 10,612 | 187 | |||||||||||||
Collateralized mortgage obligations |
10,222 | 140 | 46 | 1 | 10,268 | 141 | |||||||||||||
| | | | | | | | | | | | | | | | | | | | |
|
$ | 22,758 | $ | 422 | $ | 46 | $ | 1 | $ | 22,804 | $ | 423 | |||||||
| | | | | | | | | | | | | | | | | | | | |
| | | | | | | | | | | | | | | | | | | | |
F-10
VERITEX HOLDINGS, INC. AND SUBSIDIARY
Notes to Condensed Consolidated Financial Statements (Unaudited) (Continued)
(Dollars in thousands, except per share amounts)
3. Investment Securities (Continued)
The number of investment positions in an unrealized loss position totaled 22 at June 30, 2014. The Company does not believe these unrealized losses are "other than temporary" as (i) the Company does not have the intent to sell investment securities prior to recovery and (ii) it is more likely than not that the Company will not have to sell these securities prior to recovery. The unrealized losses noted are interest rate related due to the level of interest rates at June 30, 2014. The Company has reviewed the ratings of the issuers and has not identified any issues related to the ultimate repayment of principal as a result of credit concerns on these securities.
The amortized costs and estimated fair values of securities available for sale, by contractual maturity, are shown below. Expected maturities will differ from contractual maturities because borrowers may have the right to call or prepay obligations with or without call or prepayments penalties. Mortgage-backed securities, collateralized mortgage obligations, and asset-backed securities typically are issued with stated principal amounts, and the securities are backed by pools of mortgage loans and other loans that have varying maturities. The term of mortgage-backed, collateralized mortgage obligations and asset-backed securities thus approximates the term of the underlying mortgages and loans and can vary significantly due to prepayments. Therefore, these securities are not included in the maturity categories below.
| |
June 30, 2014 | ||||||
|---|---|---|---|---|---|---|---|
| |
Available For Sale | ||||||
| |
Amortized Cost | Fair Value | |||||
Due in one year or less |
$ | 500 | $ | 503 | |||
Due from one year to five years |
949 | 981 | |||||
Due from five years to ten years |
2,000 | 1,929 | |||||
Due after ten years |
— | — | |||||
| | | | | | | | |
|
3,449 | 3,413 | |||||
Mortgage-backed securities |
32,248 | 32,434 | |||||
Collateralized mortgage obligations |
13,305 | 13,422 | |||||
Asset-backed securities |
1,251 | 1,278 | |||||
| | | | | | | | |
|
$ | 50,253 | $ | 50,547 | |||
| | | | | | | | |
| | | | | | | | |
F-11
VERITEX HOLDINGS, INC. AND SUBSIDIARY
Notes to Condensed Consolidated Financial Statements (Unaudited) (Continued)
(Dollars in thousands, except per share amounts)
3. Investment Securities (Continued)
| |
December 31, 2013 | ||||||
|---|---|---|---|---|---|---|---|
| |
Available For Sale | ||||||
| |
Amortized Cost | Fair Value | |||||
Due in one year or less |
$ | — | $ | — | |||
Due from one year to five years |
2,379 | 2,438 | |||||
Due from five years to ten years |
2,019 | 1,924 | |||||
Due after ten years |
— | — | |||||
| | | | | | | | |
|
4,398 | 4,362 | |||||
Mortgage-backed securities |
24,898 | 24,931 | |||||
Collateralized mortgage obligations |
14,898 | 14,915 | |||||
Asset-backed securities |
1,370 | 1,396 | |||||
| | | | | | | | |
|
$ | 45,564 | $ | 45,604 | |||
| | | | | | | | |
| | | | | | | | |
Proceeds from sales of investment securities available for sale and gross gains and losses for the six months ended June 30, 2014 were as follows:
| |
June 30, 2014 |
|||
|---|---|---|---|---|
Proceeds from sales |
$ | 981 | ||
Gross realized gains |
34 | |||
Gross realized losses |
— | |||
There were no sales of investment securities available for sale for the six months ended June 30, 2013.
There was a blanket floating lien on certain securities to secure Federal Home Loan Bank advances as of June 30, 2014 and December 31, 2013.
F-12
VERITEX HOLDINGS, INC. AND SUBSIDIARY
Notes to Condensed Consolidated Financial Statements (Unaudited) (Continued)
(Dollars in thousands, except per share amounts)
4. Loans and Allowance for Loan Losses
Loans in the accompanying consolidated balance sheets are summarized as follows:
| |
June 30, 2014 |
December 31, 2013 |
|||||
|---|---|---|---|---|---|---|---|
Real estate: |
|||||||
Construction and land |
$ | 56,818 | $ | 47,643 | |||
Farmland |
11,982 | 11,656 | |||||
1 - 4 family residential |
98,030 | 86,908 | |||||
Multi-family residential |
14,866 | 11,862 | |||||
Nonfarm nonresidential |
180,921 | 171,451 | |||||
Commercial |
174,094 | 160,823 | |||||
Consumer |
4,279 | 4,927 | |||||
| | | | | | | | |
|
540,990 | 495,270 | |||||
| | | | | | | | |
Deferred loan fees |
(71 | ) | (94 | ) | |||
Allowance for loan losses |
(5,516 | ) | (5,018 | ) | |||
| | | | | | | | |
|
$ | 535,403 | $ | 490,158 | |||
| | | | | | | | |
| | | | | | | | |
Included in the net loan portfolio as of June 30, 2014 and December 31, 2013 is an accretable discount related to loans acquired within a business combination in the approximate amounts of $434 and $667, respectively. The discount is being accreted into income using the interest method over the life of the loans.
The majority of the loan portfolio is comprised of loans to businesses and individuals in the Dallas metropolitan area. This geographic concentration subjects the loan portfolio to the general economic conditions within this area. The risks created by this concentration have been considered by management in the determination of the adequacy of the allowance for loan losses. Management believes the allowance for loan losses is adequate to cover estimated losses on loans as of June 30, 2014 and December 31, 2013.
Non-Accrual and Past Due Loans
Loans are considered past due if the required principal and interest payments have not been received as of the date such payments were due. Loans are placed on non-accrual status when, in management's opinion, the borrower may be unable to meet payment obligations as they become due, as well as when required by regulatory provisions. Loans may be placed on non-accrual status regardless of whether or not such loans are considered past due. When interest accrual is discontinued, all unpaid accrued interest is reversed. Interest income is subsequently recognized only to the extent cash payments are received in excess of principal due. Loans are returned to accrual status when all the principal and interest amounts contractually due are brought current and future payments are reasonably assured.
F-13
VERITEX HOLDINGS, INC. AND SUBSIDIARY
Notes to Condensed Consolidated Financial Statements (Unaudited) (Continued)
(Dollars in thousands, except per share amounts)
4. Loans and Allowance for Loan Losses (Continued)
Non-accrual loans, excluding purchased credit impaired loans, aggregated by class of loans as of June 30, 2014 and December 31, 2013 are as follows:
| |
June 30, 2014 |
December 31, 2013 |
|||||
|---|---|---|---|---|---|---|---|
Real estate: |
|||||||
Construction and land |
$ | 76 | $ | 76 | |||
Farmland |
— | — | |||||
1 - 4 family residential |
— | 1,041 | |||||
Multi-family residential |
— | — | |||||
Nonfarm nonresidential |
— | — | |||||
Commercial |
30 | — | |||||
Consumer |
— | — | |||||
| | | | | | | | |
|
$ | 106 | $ | 1,117 | |||
| | | | | | | | |
| | | | | | | | |
For the six months ended June 30, 2014 and 2013, gross interest income that would have been recorded had the Company's non-accrual loans been current in accordance with their original terms was minimal.
An age analysis of past due loans, excluding purchased credit impaired loans, aggregated by class of loans, as of June 30, 2014 and December 31, 2013 is as follows:
| |
June 30, 2014 | |||||||||||||||||||||
|---|---|---|---|---|---|---|---|---|---|---|---|---|---|---|---|---|---|---|---|---|---|---|
| |
30 to 59 Days |
60 to 89 Days |
90 Days or Greater |
Total Past Due |
Total Current |
Total Loans |
Total 90 Days Past Due and Still Accruing |
|||||||||||||||
Real estate: |
||||||||||||||||||||||
Construction and land |
$ | — | $ | — | $ | 76 | $ | 76 | $ | 56,742 | $ | 56,818 | $ | — | ||||||||
Farmland |
— | — | — | — | 11,982 | 11,982 | — | |||||||||||||||
1 - 4 family residential |
244 | — | — | 244 | 97,786 | 98,030 | — | |||||||||||||||
Multi-family residential |
— | — | — | — | 14,866 | 14,866 | — | |||||||||||||||
Nonfarm nonresidential |
— | — | 375 | 375 | 180,546 | 180,921 | 375 | (1) | ||||||||||||||
Commercial |
571 | — | 41 | 612 | 173,482 | 174,094 | 11 | |||||||||||||||
Consumer |
16 | 3 | 4 | 23 | 4,256 | 4,279 | 4 | |||||||||||||||
| | | | | | | | | | | | | | | | | | | | | | | |
|
$ | 831 | $ | 3 | $ | 496 | $ | 1,330 | $ | 539,660 | $ | 540,990 | $ | 390 | ||||||||
| | | | | | | | | | | | | | | | | | | | | | | |
| | | | | | | | | | | | | | | | | | | | | | | |
- (1)
- Entire
balance of $375 was placed on non-accrual in July 2014.
F-14
VERITEX HOLDINGS, INC. AND SUBSIDIARY
Notes to Condensed Consolidated Financial Statements (Unaudited) (Continued)
(Dollars in thousands, except per share amounts)
4. Loans and Allowance for Loan Losses (Continued)
| |
December 31, 2013 | |||||||||||||||||||||
|---|---|---|---|---|---|---|---|---|---|---|---|---|---|---|---|---|---|---|---|---|---|---|
| |
30 to 59 Days |
60 to 89 Days |
90 Days or Greater |
Total Past Due |
Total Current |
Total Loans |
Total 90 Days Past Due and Still Accruing |
|||||||||||||||
Real estate: |
||||||||||||||||||||||
Construction and land |
$ | 19 | $ | — | $ | 76 | $ | 95 | $ | 47,548 | $ | 47,643 | $ | — | ||||||||
Farmland |
— | — | — | — | 11,656 | 11,656 | — | |||||||||||||||
1 - 4 family residential |
168 | — | 1,041 | 1,209 | 85,699 | 86,908 | — | |||||||||||||||
Multi-family residential |
— | — | — | — | 11,862 | 11,862 | — | |||||||||||||||
Nonfarm nonresidential |
— | — | — | — | 171,451 | 171,451 | — | |||||||||||||||
Commercial |
94 | — | — | 94 | 160,729 | 160,823 | — | |||||||||||||||
Consumer |
34 | 9 | 9 | 52 | 4,875 | 4,927 | 9 | |||||||||||||||
| | | | | | | | | | | | | | | | | | | | | | | |
|
$ | 315 | $ | 9 | $ | 1,126 | $ | 1,450 | $ | 493,820 | $ | 495,270 | $ | 9 | ||||||||
| | | | | | | | | | | | | | | | | | | | | | | |
| | | | | | | | | | | | | | | | | | | | | | | |
Impaired Loans
Impaired loans are those loans where it is probable the Company will be unable to collect all amounts due in accordance with the original contractual terms of the loan agreement, including scheduled principal and interest payments. All troubled debt restructurings (TDRs) are considered impaired loans. Impaired loans are measured based on either the present value of expected future cash flows discounted at the loan's effective interest rate; the loan's observable market price; or the fair value of the collateral if the loan is collateral dependent. Substantially all of the Company's impaired loans are measured at the fair value of the collateral. Impaired loans, or portions thereof, are charged off when deemed uncollectible.
Impaired loans, including purchased credit impaired loans, at June 30, 2014 and December 31, 2013 are summarized in the following tables.
| |
June 30, 2014 | ||||||||||||||||||
|---|---|---|---|---|---|---|---|---|---|---|---|---|---|---|---|---|---|---|---|
| |
Unpaid Contractual Principal Balance |
Recorded Investment with No Allowance |
Recorded Investment With Allowance |
Total Recorded Investment |
Related Allowance |
Average Recorded Investment During Year |
|||||||||||||
Real estate: |
|||||||||||||||||||
Construction and land |
$ | 970 | $ | 76 | $ | 541 | $ | 617 | $ | 34 | $ | 645 | |||||||
Farmland |
— | — | — | — | — | — | |||||||||||||
1 - 4 family residential |
169 | 169 | — | 169 | — | 221 | |||||||||||||
Multi-family residential |
— | — | — | — | — | — | |||||||||||||
Nonfarm nonresidential |
1,094 | 1,094 | — | 1,094 | — | 1,097 | |||||||||||||
Commercial |
368 | 291 | 77 | 368 | 52 | 333 | |||||||||||||
Consumer |
44 | 15 | 29 | 44 | 14 | 47 | |||||||||||||
| | | | | | | | | | | | | | | | | | | | |
Total |
$ | 2,645 | $ | 1,645 | $ | 647 | $ | 2,292 | $ | 100 | $ | 2,343 | |||||||
| | | | | | | | | | | | | | | | | | | | |
| | | | | | | | | | | | | | | | | | | | |
F-15
VERITEX HOLDINGS, INC. AND SUBSIDIARY
Notes to Condensed Consolidated Financial Statements (Unaudited) (Continued)
(Dollars in thousands, except per share amounts)
4. Loans and Allowance for Loan Losses (Continued)
| |
December 31, 2013 | ||||||||||||||||||
|---|---|---|---|---|---|---|---|---|---|---|---|---|---|---|---|---|---|---|---|
| |
Unpaid Contractual Principal Balance |
Recorded Investment with No Allowance |
Recorded Investment With Allowance |
Total Recorded Investment |
Related Allowance |
Average Recorded Investment During Year |
|||||||||||||
Real estate: |
|||||||||||||||||||
Construction and land |
$ | 971 | $ | 645 | $ | — | $ | 645 | $ | — | $ | 871 | |||||||
Farmland |
— | — | — | — | — | — | |||||||||||||
1 - 4 family residential |
1,212 | 1,212 | — | 1,212 | — | 1,306 | |||||||||||||
Multi-family residential |
— | — | — | — | — | — | |||||||||||||
Nonfarm nonresidential |
1,900 | 1,900 | — | 1,900 | — | 1,462 | |||||||||||||
Commercial |
366 | 366 | — | 366 | — | 366 | |||||||||||||
Consumer |
32 | 32 | — | 32 | — | 28 | |||||||||||||
| | | | | | | | | | | | | | | | | | | | |
Total |
$ | 4,481 | $ | 4,155 | $ | — | $ | 4,155 | $ | — | $ | 4,033 | |||||||
| | | | | | | | | | | | | | | | | | | | |
| | | | | | | | | | | | | | | | | | | | |
Interest payments on impaired loans are typically applied to principal unless collectability of the principal amount is reasonably assured, in which case interest is recognized on a cash basis.
For the six months ended June 30, 2014, total interest income and cash-based interest income recognized on impaired loans was minimal.
Troubled Debt Restructuring
Modifications of terms for the Company's loans and their inclusion as troubled debt restructurings are based on individual facts and circumstances. Loan modifications that are included as troubled debt restructurings may involve a reduction of the stated interest rate of the loan, an extension of the maturity date at a stated rate of interest lower than the current market rate for new debt with similar risk, or deferral of principal payments, regardless of the period of the modification. The recorded investment in TDRs was approximately $1,812 and $4,078 as of June 30, 2014 and December 31, 2013.
F-16
VERITEX HOLDINGS, INC. AND SUBSIDIARY
Notes to Condensed Consolidated Financial Statements (Unaudited) (Continued)
(Dollars in thousands, except per share amounts)
4. Loans and Allowance for Loan Losses (Continued)
During the six months ended June 30, 2014 and 2013, the terms of certain loans were modified as troubled debt restructurings as follows:
| |
|
|
During the six months ended June 30, 2014 | ||||||||||||||||
|---|---|---|---|---|---|---|---|---|---|---|---|---|---|---|---|---|---|---|---|
| |
|
|
Post-Modification Outstanding Recorded Investment | ||||||||||||||||
| |
Number of Loans |
Pre- Modification Outstanding Recorded Investment |
Adjusted Interest Rate |
Extended Maturity |
Extended Maturity and Restructured Payments |
Extended Maturity, Restructured Payments and Adjusted Interest Rate |
|||||||||||||
Real estate loans: |
|||||||||||||||||||
Construction and land |
— | $ | — | $ | — | $ | — | $ | — | $ | — | ||||||||
Farmland |
— | — | — | — | — | — | |||||||||||||
1 - 4 family residential |
— | — | — | — | — | — | |||||||||||||
Multi-family residential |
— | — | — | — | — | — | |||||||||||||
Nonfarm nonresidential |
— | — | — | — | — | — | |||||||||||||
Commercial |
— | — | — | — | — | — | |||||||||||||
Consumer |
2 | 17 | — | 11 | 6 | — | |||||||||||||
| | | | | | | | | | | | | | | | | | | | |
Total |
2 | $ | 17 | $ | — | $ | 11 | $ | 6 | $ | — | ||||||||
| | | | | | | | | | | | | | | | | | | | |
| | | | | | | | | | | | | | | | | | | | |
| |
|
|
During the six months ended June 30, 2013 | ||||||||||||||||
|---|---|---|---|---|---|---|---|---|---|---|---|---|---|---|---|---|---|---|---|
| |
|
|
Post-Modification Outstanding Recorded Investment | ||||||||||||||||
| |
Number of Loans |
Pre- Modification Outstanding Recorded Investment |
Adjusted Interest Rate |
Extended Maturity |
Extended Maturity and Restructured Payments |
Extended Maturity, Restructured Payments and Adjusted Interest Rate |
|||||||||||||
Real estate loans: |
|||||||||||||||||||
Construction and land |
— | $ | — | $ | — | $ | — | $ | — | $ | — | ||||||||
Farmland |
— | — | — | — | — | — | |||||||||||||
1 - 4 family residential |
1 | 1,032 | — | 1,032 | — | — | |||||||||||||
Multi-family residential |
— | — | — | — | — | — | |||||||||||||
Nonfarm nonresidential |
1 | 1,180 | — | 1,180 | — | — | |||||||||||||
Commercial |
— | — | — | — | — | — | |||||||||||||
Consumer |
— | — | — | — | — | — | |||||||||||||
| | | | | | | | | | | | | | | | | | | | |
Total |
2 | $ | 2,212 | $ | — | $ | 2,212 | $ | — | $ | — | ||||||||
| | | | | | | | | | | | | | | | | | | | |
| | | | | | | | | | | | | | | | | | | | |
All TDRs are measured individually for impairment. The two loans restructured during the six months ending June 30, 2014 are performing as agreed to the modified terms. No specific allowance for loan losses is recorded for loans that were modified as of June 30, 2014 and December 31, 2013. Of the two loans restructured during the six months ended June 30, 2013, both were performing as agreed to the modified terms. No specific allowance for loan losses was recorded for loans that were modified as of June 30, 2013.
F-17
VERITEX HOLDINGS, INC. AND SUBSIDIARY
Notes to Condensed Consolidated Financial Statements (Unaudited) (Continued)
(Dollars in thousands, except per share amounts)
4. Loans and Allowance for Loan Losses (Continued)
Interest income recorded during the six months ended June 30, 2014 and 2013 on the restructured loans and interest income that would have been recorded had the terms of the loan not been modified was minimal.
There was one loan modified as a troubled debt restructured loan within the previous 12 months and for which there was a payment default during the six months ended June 30, 2014. The loan was secured by real estate and the collateral property was foreclosed upon subsequent to the default. No amounts were recorded against the allowance for loan losses related to the foreclosure. There were no loans modified as a troubled debt restructured loan within the previous 12 months and for which there was a payment default during the six months ended June 30, 2013. A default for purposes of this disclosure is a troubled debt restructured loan in which the borrower is 90 days past due or results in the foreclosure and repossession of the applicable collateral.
The Company has not committed to lend additional amounts to customers with outstanding loans that were classified as TDRs as of June 30, 2014 or December 31, 2013.
Credit Quality Indicators
From a credit risk standpoint, the Company classifies its loans in one of four categories: (i) pass, (ii) special mention, (iii) substandard or (iv) doubtful. Loans classified as loss are charged-off.
The classifications of loans reflect a judgment about the risks of default and loss associated with the loan. The Company reviews the ratings on criticized credits monthly. Ratings are adjusted to reflect the degree of risk and loss that is felt to be inherent in each credit as of each monthly reporting period. All classified credits are evaluated for impairments. If impairment is determined to exist, a specific reserve is established. The Company's methodology is structured so that specific reserves are increased in accordance with deterioration in credit quality (and a corresponding increase in risk and loss) or decreased in accordance with improvement in credit quality (and a corresponding decrease in risk and loss).
Credits rated special mention show clear signs of financial weaknesses or deterioration in credit worthiness, however, such concerns are not so pronounced that the Company generally expects to experience significant loss within the short-term. Such credits typically maintain the ability to perform within standard credit terms and credit exposure is not as prominent as credits rated more harshly.
Credits rated substandard are those in which the normal repayment of principal and interest may be, or has been, jeopardized by reason of adverse trends or developments of a financial, managerial, economic or political nature, or important weaknesses which exist in collateral. A protracted workout on these credits is a distinct possibility. Prompt corrective action is therefore required to strengthen the Company's position, and/or to reduce exposure and to assure that adequate remedial measures are taken by the borrower. Credit exposure becomes more likely in such credits and a serious evaluation of the secondary support to the credit is performed.
Credits rated doubtful are those in which full collection of principal appears highly questionable, and which some degree of loss is anticipated, even though the ultimate amount of loss may not yet be certain and/or other factors exist which could affect collection of debt. Based upon available
F-18
VERITEX HOLDINGS, INC. AND SUBSIDIARY
Notes to Condensed Consolidated Financial Statements (Unaudited) (Continued)
(Dollars in thousands, except per share amounts)
4. Loans and Allowance for Loan Losses (Continued)
information, positive action by the Company is required to avert or minimize loss. Credits rated doubtful are generally also placed on non-accrual.
As of June 30, 2014 and December 31, 2013, the following summarizes the Company's internal ratings of its loans, including purchased credit impaired loans:
| |
June 30, 2014 | |||||||||||||||
|---|---|---|---|---|---|---|---|---|---|---|---|---|---|---|---|---|
| |
Pass | Special Mention |
Substandard | Doubtful | Total | |||||||||||
Real estate: |
||||||||||||||||
Construction and land |
$ | 56,201 | $ | — | $ | 617 | $ | — | $ | 56,818 | ||||||
Farmland |
11,982 | — | — | — | 11,982 | |||||||||||
1 - 4 family residential |
97,819 | — | 211 | — | 98,030 | |||||||||||
Multi-family residential |
14,866 | — | — | — | 14,866 | |||||||||||
Nonfarm nonresidential |
180,546 | — | 375 | — | 180,921 | |||||||||||
Commercial |
171,625 | 975 | 1,464 | 30 | 174,094 | |||||||||||
Consumer |
4,239 | — | 40 | — | 4,279 | |||||||||||
| | | | | | | | | | | | | | | | | |
Total |
$ | 537,278 | $ | 975 | $ | 2,707 | $ | 30 | $ | 540,990 | ||||||
| | | | | | | | | | | | | | | | | |
| | | | | | | | | | | | | | | | | |
| |
December 31, 2013 | |||||||||||||||
|---|---|---|---|---|---|---|---|---|---|---|---|---|---|---|---|---|
| |
Pass | Special Mention |
Substandard | Doubtful | Total | |||||||||||
Real estate: |
||||||||||||||||
Construction and land |
$ | 46,998 | $ | — | $ | 645 | $ | — | $ | 47,643 | ||||||
Farmland |
11,656 | — | — | — | 11,656 | |||||||||||
1 - 4 family residential |
85,649 | — | 1,259 | — | 86,908 | |||||||||||
Multi-family residential |
11,862 | — | — | — | 11,862 | |||||||||||
Nonfarm nonresidential |
171,371 | — | 80 | — | 171,451 | |||||||||||
Commercial |
158,919 | 731 | 1,173 | — | 160,823 | |||||||||||
Consumer |
4,878 | 7 | 42 | — | 4,927 | |||||||||||
| | | | | | | | | | | | | | | | | |
Total |
$ | 491,333 | $ | 738 | $ | 3,199 | $ | — | $ | 495,270 | ||||||
| | | | | | | | | | | | | | | | | |
| | | | | | | | | | | | | | | | | |
F-19
VERITEX HOLDINGS, INC. AND SUBSIDIARY
Notes to Condensed Consolidated Financial Statements (Unaudited) (Continued)
(Dollars in thousands, except per share amounts)
4. Loans and Allowance for Loan Losses (Continued)
An analysis of the allowance for loan losses for the six months ended June 30, 2014 and 2013 and the twelve months ended December 31, 2013 is as follows:
| |
Six Months Ended June 30, 2014 |
Twelve Months Ended December 31, 2013 |
Six Months Ended June 30, 2013 |
|||||||
|---|---|---|---|---|---|---|---|---|---|---|
Balance at beginning of year |
$ | 5,018 | $ | 3,238 | $ | 3,238 | ||||
Provision charged to earnings |
677 | 1,883 | 1,008 | |||||||
Charge-offs |
(204 | ) | (240 | ) | (218 | ) | ||||
Recoveries |
25 | 137 | 117 | |||||||
| | | | | | | | | | | |
Net charge-offs |
(179 | ) | (103 | ) | (101 | ) | ||||
| | | | | | | | | | | |
Balance at end of period |
$ | 5,516 | $ | 5,018 | $ | 4,145 | ||||
| | | | | | | | | | | |
| | | | | | | | | | | |
The following tables summarize the activity in the allowance for loan losses by class of loans for the six months ended June 30, 2014 and 2013 and the twelve months ended December 31, 2013 is as follows:
| |
June 30, 2014 | ||||||||||||||||||
|---|---|---|---|---|---|---|---|---|---|---|---|---|---|---|---|---|---|---|---|
| |
Real Estate | |
|
|
|||||||||||||||
| |
Construction Land and Farmland |
Residential | Nonfarm Non- Residential |
Commercial | Consumer | Total | |||||||||||||
Balance at beginning of year |
$ | 660 | $ | 970 | $ | 1,726 | $ | 1,585 | $ | 77 | $ | 5,018 | |||||||
Provision charged to earnings |
69 | 260 | 54 | 311 | (17 | ) | 677 | ||||||||||||
Charge-offs |
(28 | ) | (30 | ) | — | (146 | ) | — | (204 | ) | |||||||||
Recoveries |
— | — | — | 22 | 3 | 25 | |||||||||||||
| | | | | | | | | | | | | | | | | | | | |
Net charge-offs |
(28 | ) | (30 | ) | — | (124 | ) | 3 | (179 | ) | |||||||||
| | | | | | | | | | | | | | | | | | | | |
Balance at end of period |
$ | 701 | $ | 1,200 | $ | 1,780 | $ | 1,772 | $ | 63 | $ | 5,516 | |||||||
| | | | | | | | | | | | | | | | | | | | |
| | | | | | | | | | | | | | | | | | | | |
Period-end amount allocated to: |
|||||||||||||||||||
Specific Reserves: |
|||||||||||||||||||
Impaired loans |
$ | — | $ | — | $ | — | $ | 52 | $ | 14 | $ | 66 | |||||||
Purchased credit impaired loans |
34 | — | — | — | — | 34 | |||||||||||||
| | | | | | | | | | | | | | | | | | | | |
Total specific reserves |
34 | — | — | 52 | 14 | 100 | |||||||||||||
| | | | | | | | | | | | | | | | | | | | |
General reserves |
667 | 1,200 | 1,780 | 1,720 | 49 | 5,416 | |||||||||||||
| | | | | | | | | | | | | | | | | | | | |
Total |
$ | 701 | $ | 1,200 | $ | 1,780 | $ | 1,772 | $ | 63 | $ | 5,516 | |||||||
| | | | | | | | | | | | | | | | | | | | |
| | | | | | | | | | | | | | | | | | | | |
F-20
VERITEX HOLDINGS, INC. AND SUBSIDIARY
Notes to Condensed Consolidated Financial Statements (Unaudited) (Continued)
(Dollars in thousands, except per share amounts)
4. Loans and Allowance for Loan Losses (Continued)
| |
December 31, 2013 | ||||||||||||||||||
|---|---|---|---|---|---|---|---|---|---|---|---|---|---|---|---|---|---|---|---|
| |
Real Estate | |
|
|
|||||||||||||||
| |
Construction Land and Farmland |
Residential | Nonfarm Non- Residential |
Commercial | Consumer | Total | |||||||||||||
Balance at beginning of year |
$ | 455 | $ | 755 | $ | 1,028 | $ | 947 | $ | 53 | $ | 3,238 | |||||||
Provision charged to earnings |
205 | 240 | 698 | 716 | 24 | 1,883 | |||||||||||||
Charge-offs |
— | (85 | ) | — | (110 | ) | (45 | ) | (240 | ) | |||||||||
Recoveries |
— | 60 | — | 32 | 45 | 137 | |||||||||||||
| | | | | | | | | | | | | | | | | | | | |
Net charge-offs |
— | (25 | ) | — | (78 | ) | — | (103 | ) | ||||||||||
| | | | | | | | | | | | | | | | | | | | |
Balance at end of year |
$ | 660 | $ | 970 | $ | 1,726 | $ | 1,585 | $ | 77 | $ | 5,018 | |||||||
| | | | | | | | | | | | | | | | | | | | |
| | | | | | | | | | | | | | | | | | | | |
Period-end amount allocated to: |
|||||||||||||||||||
Specific Reserves: |
|||||||||||||||||||
Impaired loans |
$ | — | $ | — | $ | — | $ | — | $ | — | $ | — | |||||||
Purchased credit impaired loans |
— | — | — | — | — | — | |||||||||||||
| | | | | | | | | | | | | | | | | | | | |
Total specific reserves |
— | — | — | — | — | — | |||||||||||||
| | | | | | | | | | | | | | | | | | | | |
General reserves |
660 | 970 | 1,726 | 1,585 | 77 | 5,018 | |||||||||||||
| | | | | | | | | | | | | | | | | | | | |
Total |
$ | 660 | $ | 970 | $ | 1,726 | $ | 1,585 | $ | 77 | $ | 5,018 | |||||||
| | | | | | | | | | | | | | | | | | | | |
| | | | | | | | | | | | | | | | | | | | |
| |
June 30, 2013 | ||||||||||||||||||
|---|---|---|---|---|---|---|---|---|---|---|---|---|---|---|---|---|---|---|---|
| |
Real Estate | |
|
|
|||||||||||||||
| |
Construction Land and Farmland |
Residential | Nonfarm Non- Residential |
Commercial | Consumer | Total | |||||||||||||
Balance at beginning of year |
$ | 455 | $ | 755 | $ | 1,028 | $ | 947 | $ | 53 | $ | 3,238 | |||||||
Provision charged to earnings |
(7 | ) | 147 | 346 | 482 | 40 | 1,008 | ||||||||||||
Charge-offs |
— | (85 | ) | — | (90 | ) | (43 | ) | (218 | ) | |||||||||
Recoveries |
— | 60 | — | 26 | 31 | 117 | |||||||||||||
| | | | | | | | | | | | | | | | | | | | |
Net charge-offs |
— | (25 | ) | — | (64 | ) | (12 | ) | (101 | ) | |||||||||
| | | | | | | | | | | | | | | | | | | | |
Balance at end of period |
$ | 448 | $ | 877 | $ | 1,374 | $ | 1,365 | $ | 81 | $ | 4,145 | |||||||
| | | | | | | | | | | | | | | | | | | | |
| | | | | | | | | | | | | | | | | | | | |
Period-end amount allocated to: |
|||||||||||||||||||
Specific Reserves: |
|||||||||||||||||||
Impaired loans |
$ | — | $ | — | $ | — | $ | — | $ | — | $ | — | |||||||
Purchased credit impaired loans |
— | — | — | — | — | — | |||||||||||||
| | | | | | | | | | | | | | | | | | | | |
Total specific reserves |
— | — | — | — | — | — | |||||||||||||
| | | | | | | | | | | | | | | | | | | | |
General reserves |
448 | 877 | 1,374 | 1,365 | 81 | 4,145 | |||||||||||||
| | | | | | | | | | | | | | | | | | | | |
Total |
$ | 448 | $ | 877 | $ | 1,374 | $ | 1,365 | $ | 81 | $ | 4,145 | |||||||
| | | | | | | | | | | | | | | | | | | | |
| | | | | | | | | | | | | | | | | | | | |
F-21
VERITEX HOLDINGS, INC. AND SUBSIDIARY
Notes to Condensed Consolidated Financial Statements (Unaudited) (Continued)
(Dollars in thousands, except per share amounts)
4. Loans and Allowance for Loan Losses (Continued)
The Company's recorded investment in loans as of June 30, 2014 and December 31, 2013 related to the balance in the allowance for loan losses on the basis of the Company's impairment methodology is as follows:
| |
June 30, 2014 | ||||||||||||||||||
|---|---|---|---|---|---|---|---|---|---|---|---|---|---|---|---|---|---|---|---|
| |
Real Estate | |
|
|
|||||||||||||||
| |
Construction Land and Farmland |
Residential | Nonfarm Non- Residential |
Commercial | Consumer | Total | |||||||||||||
Loans individually evaluated for impairment |
$ | 617 | $ | 169 | $ | 1,094 | $ | 368 | $ | 44 | $ | 2,292 | |||||||
Loans collectively evaluated for impairment |
68,183 | 112,727 | 179,827 | 173,726 | 4,235 | 538,698 | |||||||||||||
| | | | | | | | | | | | | | | | | | | | |
Total |
$ | 68,800 | $ | 112,896 | $ | 180,921 | $ | 174,094 | $ | 4,279 | $ | 540,990 | |||||||
| | | | | | | | | | | | | | | | | | | | |
| | | | | | | | | | | | | | | | | | | | |
| |
December 31, 2013 | ||||||||||||||||||
|---|---|---|---|---|---|---|---|---|---|---|---|---|---|---|---|---|---|---|---|
| |
Real Estate | |
|
|
|||||||||||||||
| |
Construction Land and Farmland |
Residential | Nonfarm Non- Residential |
Commercial | Consumer | Total | |||||||||||||
Loans individually evaluated for impairment |
$ | 645 | $ | 1,212 | $ | 1,900 | $ | 366 | $ | 32 | $ | 4,155 | |||||||
Loans collectively evaluated for impairment |
58,654 | 97,558 | 169,551 | 160,457 | 4,895 | 491,115 | |||||||||||||
| | | | | | | | | | | | | | | | | | | | |
Total |
$ | 59,299 | $ | 98,770 | $ | 171,451 | $ | 160,823 | $ | 4,927 | $ | 495,270 | |||||||
| | | | | | | | | | | | | | | | | | | | |
| | | | | | | | | | | | | | | | | | | | |
The Company acquired certain loans which experienced credit deterioration since origination (Purchased credit impaired loans). Accretion on purchased credit impaired loans is based on estimated future cash flows, regardless of contractual maturity.
The outstanding balance and related carrying amount of those loans as of June 30, 2014 and December 31, 2013 is as follows:
| |
June 30, 2014 |
December 31, 2013 |
|||||
|---|---|---|---|---|---|---|---|
Outstanding balance |
$ | 791 | $ | 819 | |||
Nonaccretable difference |
(250 | ) | (250 | ) | |||
Accretable yield |
— | — | |||||
| | | | | | | | |
Carrying amount |
$ | 541 | $ | 569 | |||
| | | | | | | | |
| | | | | | | | |
At June 30, 2014 and December 31, 2013, there was no allocation established in the allowance for loan losses related to purchased credit impaired loans. During the six months ending June 30, 2014, the Company charged off approximately $28 of the purchased credit impaired loans that was deemed uncollectible.
F-22
VERITEX HOLDINGS, INC. AND SUBSIDIARY
Notes to Condensed Consolidated Financial Statements (Unaudited) (Continued)
(Dollars in thousands, except per share amounts)
4. Loans and Allowance for Loan Losses (Continued)
Income is not recognized on certain purchased credit impaired loans if the Company cannot reasonably estimate cash flows expected to be collected. Income on these loans is recognized using the asset recovery method. As of June 30, 2014 and December 31, 2013, there was only one purchased credit impaired loan remaining, which was accounted for using the cost recovery method. The carrying amounts of the loan was as follows:
| |
June 30, 2014 |
December 31, 2013 |
|||||
|---|---|---|---|---|---|---|---|
Loans purchased during the year |
$ | — | $ | — | |||
Loans at the end of the period |
$ | 541 | $ | 569 | |||
5. Income Taxes
Income tax expense and the effective tax rates for the six months ended June 30, 2014 and 2013 is summarized as follows:
| |
Six months ended June 30, |
||||||
|---|---|---|---|---|---|---|---|
| |
2014 | 2013 | |||||
Income tax expense: |
$ | 1,190 | $ | 774 | |||
Effective tax rate |
35.6 | % | 34.7 | % | |||
The differences between the statutory rate of 34.0% and the effective tax rates presented in the table above were primarily attributable to permanent differences related to stock option expense, bank-owned life insurance income, and other non-deductible expenses.
Deferred income taxes reflect the net tax effects of temporary differences between the recorded amounts of assets and liabilities for financial reporting purposes, and the amounts used for income tax
F-23
VERITEX HOLDINGS, INC. AND SUBSIDIARY
Notes to Condensed Consolidated Financial Statements (Unaudited) (Continued)
(Dollars in thousands, except per share amounts)
5. Income Taxes (Continued)
purposes. Significant components of the Company's deferred tax assets and liabilities at June 30, 2014 and December 31, 2013 are as follows:
| |
June 30, 2014 |
December 31, 2013 |
|||||
|---|---|---|---|---|---|---|---|
Deferred tax assets: |
|||||||
Net operating loss |
$ | — | $ | 96 | |||
Organizational costs |
175 | 183 | |||||
Allowance for loan losses |
1,812 | 1,619 | |||||
Deferred loan fees |
24 | 32 | |||||
Non-accrual interest |
59 | 62 | |||||
Capital loss carryforward |
85 | 85 | |||||
OREO write down for book purposes |
55 | 55 | |||||
Deferred rent expenses |
62 | 70 | |||||
Restricted stock |
103 | 84 | |||||
Accrued bonuses |
162 | 243 | |||||
Other |
135 | 134 | |||||
| | | | | | | | |
Total deferred tax assets |
2,672 | 2,663 | |||||
| | | | | | | | |
Deferred tax liabilities: |
|||||||
Net unrealized gain on securities available for sale |
100 | 14 | |||||
Core deposit intangibles |
462 | 512 | |||||
FHLB stock dividends |
26 | 26 | |||||
Bank premises and equipment |
993 | 1,118 | |||||
| | | | | | | | |
Total deferred tax liabilities |
1,581 | 1,670 | |||||
| | | | | | | | |
Net deferred tax asset |
$ | 1,091 | $ | 993 | |||
| | | | | | | | |
| | | | | | | | |
Included in the accompanying consolidated balance sheets as of June 30, 2014 is a current tax receivable of approximately $181 in other assets and a net deferred tax asset of approximately $1,091 in other assets. Included in the accompanying consolidated balance sheets in other assets as of December 31, 2013 is a current tax receivable of approximately $292 and a net deferred tax asset of approximately $993.
6. Commitments and Contingencies
Litigation
The Company may from time to time be involved in legal actions arising from normal business activities. Management believes that these actions are without merit or that the ultimate liability, if any, resulting from them will not materially affect the financial position or results of operations of the Company.
F-24
VERITEX HOLDINGS, INC. AND SUBSIDIARY
Notes to Condensed Consolidated Financial Statements (Unaudited) (Continued)
(Dollars in thousands, except per share amounts)
6. Commitments and Contingencies (Continued)
Operating Leases
The Company leases several of its banking facilities under operating leases. Rental expense related to these leases was approximately $721 and $651 for the six months ended June 30, 2014 and 2013, respectively.
7. Fair Value Disclosures
ASC Topic 820, Fair Value Measurements and Disclosures, defines fair value as the price that would be received to sell an asset or paid to transfer a liability in an orderly transaction between market participants. A fair value measurement assumes that the transaction to sell the asset or transfer the liability occurs in the principal market for the asset or liability or, in the absence of a principal market, the most advantageous market for the asset or liability. The price in the principal (or most advantageous) market used to measure the fair value of the asset or liability shall not be adjusted for transaction costs. An orderly transaction is a transaction that assumes exposure to the market for a period prior to the measurement date to allow for marketing activities that are usual and customary for transactions involving such assets and liabilities; it is not a forced transaction. Market participants are buyers and sellers in the principal market that are (i) independent, (ii) knowledgeable, (iii) able to transact and (iv) willing to transact.
ASC Topic 820 requires the use of valuation techniques that are consistent with the market approach, the income approach and/or the cost approach. The market approach uses prices and other relevant information generated by market transactions involving identical or comparable assets and liabilities. The income approach uses valuation techniques to convert future amounts, such as cash flows or earnings, to a single present amount on a discounted basis. The cost approach is based on the amount that currently would be required to replace the service capacity of an asset (replacement costs). Valuation techniques should be consistently applied. Inputs to valuation techniques refer to the assumptions that market participants would use in pricing the asset or liability. Inputs may be observable, meaning those that reflect the assumptions market participants would use in pricing the asset or liability developed based on market data obtained from independent sources, or unobservable, meaning those that reflect the reporting entity's own assumptions about the assumptions market participants would use in pricing the asset or liability developed based on the best information available in the circumstances. In that regard, the authoritative guidance establishes a fair value hierarchy for valuation inputs that gives the highest priority to quoted prices in active markets for identical assets or liabilities and the lowest priority to unobservable inputs. The fair value hierarchy is as follows:
Level 1 Inputs. Unadjusted quoted prices in active markets for identical assets or liabilities that the reporting entity has the ability to access at the measurement date.
Level 2 Inputs. Inputs other than quoted prices included in Level 1 that are observable for the asset or liability, either directly or indirectly. These include quoted prices for similar assets or liabilities in active markets, quoted prices for identical or similar assets or liabilities in markets that are not active, inputs other than quoted prices that are observable for the asset or liability (for example, interest rates, volatilities, prepayment speeds, loss severities, credit risks and default rates) or inputs that are derived principally from or corroborated by observable market data by correlation or other means. Level 2 investments consist primarily of obligations of U.S. government sponsored enterprises
F-25
VERITEX HOLDINGS, INC. AND SUBSIDIARY
Notes to Condensed Consolidated Financial Statements (Unaudited) (Continued)
(Dollars in thousands, except per share amounts)
7. Fair Value Disclosures (Continued)
and agencies, obligations of state and municipal subdivisions, corporate bonds and mortgage-backed securities.
Level 3 Inputs. Significant unobservable inputs that reflect an entity's own assumptions that market participants would use in pricing the assets or liabilities.
In general, fair value is based upon quoted market prices, where available. If such quoted market prices are not available, fair value is based upon internally developed models that primarily use, as inputs, observable market-based parameters. Valuation adjustments may be made to ensure that financial instruments are recorded at fair value. While management believes the Company's valuation methodologies are appropriate and consistent with other market participants, the use of different methodologies or assumptions to determine the fair value of certain financial instruments could result in a different estimate of fair value at the reporting date.
A description of the valuation methodologies used for instruments measured at fair value, as well as the general classification of such instruments pursuant to the valuation hierarchy, is set forth below.
Assets and liabilities measured at fair value on a recurring basis include the following:
Investment Securities Available for Sale: Securities classified as available for sale are reported at fair value utilizing Level 2 inputs. For those securities classified as Level 2, the Company obtains fair value measurements from an independent pricing service. The fair value measurements consider observable data that may include dealer quotes, market spreads, cash flows, the U. S. Treasury yield curve, live trading levels, trade execution data, market consensus prepayments speeds, credit information and the bond's terms and conditions, among other things.
The following table summarizes assets measured at fair value on a recurring basis as of June 30, 2014 and December 31, 2013, segregated by the level of the valuation inputs within the fair value hierarchy utilized to measure fair value:
| |
Fair Value Measurements Using |
|
|||||||||||
|---|---|---|---|---|---|---|---|---|---|---|---|---|---|
| |
Level 1 Inputs |
Level 2 Inputs |
Level 3 Inputs |
Total Fair Value |
|||||||||
At June 30, 2014: |
|||||||||||||
Investment securities available for sale |
$ | — | $ | 50,547 | $ | — | $ | 50,547 | |||||
At December 31, 2013: |
|||||||||||||
Investment securities available for sale |
$ | — | $ | 45,604 | $ | — | $ | 45,604 | |||||
There were no liabilities measured at fair value on a recurring basis as of June 30, 2014 or December 31, 2013.
There were no transfers between Level 2 and Level 3 during the six months ended June 30, 2014 and 2013.
In accordance with ASC Topic 820, certain assets and liabilities are measured at fair value on a non-recurring basis; that is, the instruments are not measured at fair value on an ongoing basis but are
F-26
VERITEX HOLDINGS, INC. AND SUBSIDIARY
Notes to Condensed Consolidated Financial Statements (Unaudited) (Continued)
(Dollars in thousands, except per share amounts)
7. Fair Value Disclosures (Continued)
subject to fair value adjustments in certain circumstances (for example, when there is evidence of impairment).
Assets measured at fair value on a non-recurring basis include impaired loans and other real estate owned. The fair value of impaired loans with specific allocations of the allowance for loan losses and other real estate owned is based upon recent real estate appraisals less estimated costs of sale. For residential real estate impaired loans and other real estate owned, appraised values are based on the comparative sales approach. For commercial and commercial real estate impaired loans and other real estate owned, appraisers may use either a single valuation approach or a combination of approaches such as comparative sales, cost or the income approach. A significant unobservable input in the income approach is the estimated income capitalization rate for a given piece of collateral. Adjustments to appraisals may be made to reflect local market conditions or other economic factors and may result in changes in the fair value of a given asset over time. As such, the fair value of impaired loans and other real estate owned are considered a Level 3 in the fair value hierarchy.
The Company recovers the carrying value of other real estate owned through the sale of the property. The ability to affect future sales prices is subject to market conditions and factors beyond the Company's control and may impact the estimated fair value of a property.
Appraisals for impaired loans and other real estate owned are performed by certified general appraisers whose qualifications and licenses have been reviewed and verified by the Company. Once reviewed, a member of the credit department reviews the assumptions and approaches utilized in the appraisal as well as the overall resulting fair value in comparisons to independent data sources such as recent market data or industry wide-statistics. On a periodic basis, the Company compares the actual selling price of collateral that has been sold to the most recent appraised value to determine what additional adjustments, if any, should be made to the appraisal value to arrive at fair value.
The following table summarizes assets measured at fair value on a non-recurring basis as of June 30, 2014 and December 31, 2013, segregated by the level of the valuation inputs within the fair value hierarchy utilized to measure fair value:
| |
Fair Value Measurements Using | |
|
|||||||||||||
|---|---|---|---|---|---|---|---|---|---|---|---|---|---|---|---|---|
| |
Level 1 Inputs |
Level 2 Inputs |
Level 3 Inputs |
Total Fair Value | Period Ended Total Losses |
|||||||||||
At June 30, 2014: |
||||||||||||||||
Assets: |
||||||||||||||||
Impaired loans |
$ | — | $ | — | $ | 2,192 | $ | 2,192 | $ | 100 | ||||||
Other real estate owned |
$ | — | $ | — | $ | 2,395 | $ | 2,395 | $ | — | ||||||
At December 31, 2013: |
||||||||||||||||
Assets: |
||||||||||||||||
Impaired loans |
$ | — | $ | — | $ | 4,155 | $ | 4,155 | $ | — | ||||||
Other real estate owned |
$ | — | $ | — | $ | 1,797 | $ | 1,797 | $ | 162 | ||||||
There were no liabilities measured at fair value on a non-recurring basis as of June 30, 2014 and December 31, 2013.
F-27
VERITEX HOLDINGS, INC. AND SUBSIDIARY
Notes to Condensed Consolidated Financial Statements (Unaudited) (Continued)
(Dollars in thousands, except per share amounts)
7. Fair Value Disclosures (Continued)
For Level 3 financial and nonfinancial assets measured at fair value as of June 30, 2014 and December 31, 2013, the significant unobservable inputs used in the fair value measurements were as follows:
| June 30, 2014 | |||||||||||
|---|---|---|---|---|---|---|---|---|---|---|---|
Assets/Liabilities
|
Fair Value |
Valuation Technique |
Unobservable Input(s) |
Weighted Average |
|||||||
Impaired loans |
$ | 2,192 | Collateral Method | Adjustments for selling costs | 8 | % | |||||
Other real estate owned |
$ | 2,395 | Collateral Method | Adjustments for selling costs | 13 | % | |||||
| December 31, 2013 | |||||||||||
|---|---|---|---|---|---|---|---|---|---|---|---|
Assets/Liabilities
|
Fair Value |
Valuation Technique |
Unobservable Input(s) |
Weighted Average |
|||||||
Impaired loans |
$ | 4,155 | Collateral Method | Adjustments for selling costs | 8 | % | |||||
Other real estate owned |
$ | 1,797 | Collateral Method | Adjustments for selling costs | 8 | % | |||||
Fair Value of Financial Instruments
The Company is required under current authoritative guidance to disclose the estimated fair value of their financial instrument assets and liabilities including those subject to the requirements discussed above. For the Company, as for most financial institutions, substantially all of its assets and liabilities are considered financial instruments, as defined. Many of the Company's financial instruments, however, lack an available trading market as characterized by a willing buyer and willing seller engaging in an exchange transaction.
The estimated fair value amounts of financial instruments have been determined by the Company using available market information and appropriate valuation methodologies. However, considerable judgment is required to interpret data to develop the estimates of fair value. Accordingly, the estimates presented herein are not necessarily indicative of the amounts the Company could realize in a current market exchange. The use of different market assumptions and/or estimation methodologies may have a material effect on the estimated fair value amounts. In addition, reasonable comparability between financial institutions may not be likely due to the wide range of permitted valuation techniques and numerous estimates that must be made given the absence of active secondary markets for many of the financial instruments. This lack of uniform valuation methodologies also introduces a greater degree of subjectivity to these estimated fair values.
The methods and assumptions used by the Company in estimating fair values of financial instruments as disclosed herein in accordance with ASC Topic 825, Financial Instruments, other than for those measured at fair value on a recurring and nonrecurring basis discussed above, are as follows:
Cash and cash equivalents: The carrying amounts of cash and cash equivalents approximate their fair value.
Loans and loans held for sale: For variable-rate loans that reprice frequently and have no significant changes in credit risk, fair values are based on carrying values. Fair values for certain mortgage loans (for example, one-to-four family residential), commercial real estate and commercial
F-28
VERITEX HOLDINGS, INC. AND SUBSIDIARY
Notes to Condensed Consolidated Financial Statements (Unaudited) (Continued)
(Dollars in thousands, except per share amounts)
7. Fair Value Disclosures (Continued)
loans are estimated using discounted cash flow analyses, using interest rates currently being offered for loans with similar terms to borrowers of similar credit quality.
Bank-owned life insurance: The carrying amounts of bank-owned life insurance approximate their fair values.
Non-marketable equity securities: The carrying value of restricted securities such as stock in the Federal Home Loan Bank of Dallas and Independent Bankers Financial Corporation approximates fair value.
Deposits: The fair values disclosed for demand deposits are, by definition, equal to the amount payable on demand at the reporting date (that is their carrying amounts). The carrying amounts of variable-rate certificates of deposit (CDs) approximate their fair values at the reporting date. Fair values for fixed-rate CDs are estimated using a discounted cash flow calculation that applies interest rates currently being offered on certificates to a schedule of aggregated expected monthly maturities on time deposits.
Advances from Federal Home Loan Bank: The fair value of advances maturing within 90 days approximates carrying value. Fair value of other advances is based on the Company's current borrowing rate for similar arrangements.
Other borrowings: The fair values are based upon prevailing rates on similar debt in the market place.
Accrued interest: The carrying amounts of accrued interest approximate their fair values due to short term maturity.
Off-balance sheet instruments: Commitments to extend credit and standby letters of credit are generally priced at market at the time of funding and were not material to the Company's consolidated financial statements.
F-29
VERITEX HOLDINGS, INC. AND SUBSIDIARY
Notes to Condensed Consolidated Financial Statements (Unaudited) (Continued)
(Dollars in thousands, except per share amounts)
7. Fair Value Disclosures (Continued)
The estimated fair values and carrying values of all financial instruments under current authoritative guidance as of June 30, 2014 and December 31, 2013 were as follows:
| |
June 30, 2014 | December 31, 2013 | |||||||||||
|---|---|---|---|---|---|---|---|---|---|---|---|---|---|
| |
Carrying Amount |
Fair Value |
Carrying Amount |
Fair Value |
|||||||||
Financial assets: |
|||||||||||||
Level 2 inputs: |
|||||||||||||
Cash and cash equivalents |
$ | 66,550 | $ | 66,550 | $ | 76,646 | $ | 76,646 | |||||
Securities available for sale |
50,547 | 50,547 | 45,604 | 45,604 | |||||||||
Loans held for sale |
6,342 | 6,342 | 2,051 | 2,051 | |||||||||
Accrued interest receivable |
1,359 | 1,359 | 1,351 | 1,351 | |||||||||
Bank-owned life insurance |
10,647 | 10,647 | 10,475 | 10,475 | |||||||||
Non-marketable equity securities |
2,959 | 2,959 | 2,714 | 2,714 | |||||||||
Level 3 inputs: |
|||||||||||||
Loans, net |
535,403 | 534,047 | 490,158 | 490,344 | |||||||||
Financial liabilities: |
|||||||||||||
Level 2 inputs: |
|||||||||||||
Deposits |
$ | 611,174 | $ | 605,961 | $ | 573,938 | $ | 568,451 | |||||
Advances from FHLB |
15,000 | 15,028 | 15,000 | 15,055 | |||||||||
Accrued interest payable |
203 | 203 | 134 | 134 | |||||||||
Other borrowings |
8,073 | 8,073 | 8,072 | 8,072 | |||||||||
8. Financial Instruments with Off-Balance Sheet Risk
The Company is a party to financial instruments with off-balance sheet risk in the normal course of business to meet the financing needs of its customers. These financial instruments include commitments to extend credit and standby letters of credit. Those instruments involve, to varying degrees, elements of credit risk in excess of the amount recognized in the consolidated balance sheet.
The Company's exposure to credit loss in the event of nonperformance by the other party to the financial instrument for commitments to extend credit and standby letters of credit is represented by the contractual amount of those instruments. The Company uses the same credit policies in making commitments and conditional obligations as it does for on balance sheet instruments.
The following table sets forth the approximate amounts of these financial instruments as of June 30, 2014 and December 31, 2013:
| |
June 30, 2014 |
December 31, 2013 |
|||||
|---|---|---|---|---|---|---|---|
Commitments to extend credit |
$ | 107,113 | $ | 92,827 | |||
Standby letters of credit |
680 | 210 | |||||
| | | | | | | | |
|
$ | 107,793 | $ | 93,037 | |||
| | | | | | | | |
| | | | | | | | |
F-30
VERITEX HOLDINGS, INC. AND SUBSIDIARY
Notes to Condensed Consolidated Financial Statements (Unaudited) (Continued)
(Dollars in thousands, except per share amounts)
8. Financial Instruments with Off-Balance Sheet Risk (Continued)
Commitments to extend credit are agreements to lend to a customer as long as there is no violation of any condition established in the contract. Commitments generally have fixed expiration dates or other termination clauses and may require payment of a fee. Since many of the commitments may expire without being drawn upon, the total commitment amounts do not necessarily represent future cash requirements. Management evaluates each customer's creditworthiness on a case-by-case basis. The amount of collateral obtained, if deemed necessary upon extension of credit, is based on management's credit evaluation of the borrower.
Standby letters of credit are conditional commitments issued by the Company to guarantee the performance of a customer to a third party. Standby letters of credit generally have fixed expiration dates or other termination clauses and may require payment of a fee. The credit risk involved in issuing letters of credit is essentially the same as that involved in extending loan facilities to customers. The Company's policy for obtaining collateral and the nature of such collateral is essentially the same as that involved in making commitments to extend credit.
Although the maximum exposure to loss is the amount of such commitments, management currently anticipates no material losses from such activities.
9. Employee Benefits
Defined contribution plan
The Company maintains a retirement savings 401(k) profit sharing plan (Plan) in which substantially all employees may participate. The Plan provides for "before tax" employee contributions through salary reductions under section 401(k) of the Internal Revenue Code. The Company may make a discretionary match of employees' contributions based on a percentage of salary deferrals and certain discretionary profit sharing contributions. No matching contributions to the Plan were made during the six months ending June 30, 2014 and 2013.
ESOP
Effective January 1, 2012, the Company adopted an Employee Stock Ownership Plan (ESOP) covering all employees that meet certain age and service requirements. Plan assets are held and managed by the Company. The Company accrued approximately $120 as of December 31, 2013 to contribute to the ESOP. During the year ended December 31, 2013, the ESOP purchased 7,811 shares of the Company's common stock and allocated the shares to the plan participants.
In January 2014, the ESOP borrowed $500 from the Company and purchased 46,082 shares of the common stock of the Company. The ESOP debt is secured by shares of the Company. The loan will be repaid from contributions to the ESOP from the Company. As the debt is repaid, shares are released from collateral and allocated to employees' accounts. The shares pledged as collateral are reported as unearned ESOP shares in the consolidated balance sheets. During the six months ended June 30, 2014 the ESOP loan was repaid approximately $118 from contributions to ESOP from the Company. As a result of the repayment, 9,147 shares were released from collateral and allocated to employee participant accounts. Compensation expense attributed to the ESOP contributions recorded in the accompanying consolidated statements of income for the six months ended June 30, 2014 and 2013 was approximately $90 and $60, respectively.
F-31
VERITEX HOLDINGS, INC. AND SUBSIDIARY
Notes to Condensed Consolidated Financial Statements (Unaudited) (Continued)
(Dollars in thousands, except per share amounts)
9. Employee Benefits (Continued)
The following is a summary of ESOP shares as of June 30, 2014 and December 31, 2013.
| |
June 30, 2014 |
December 31, 2013 |
|||||
|---|---|---|---|---|---|---|---|
Allocated shares |
16,958 | 7,811 | |||||
Unearned shares |
36,935 | — | |||||
| | | | | | | | |
Total ESOP shares |
53,893 | 7,811 | |||||
| | | | | | | | |
Fair value of unearned shares |
$ | 476 | $ | — | |||
| | | | | | | | |
| | | | | | | | |
10. Stock Incentive Plan
In 2010, the Company adopted the 2010 Stock Option and Equity Incentive Plan (the Incentive Plan), which the Company's shareholders' approved in 2011, The maximum number of shares of common stock that may be issued pursuant to grants or options under the Incentive Plan is 1,000,000. The Incentive Plan is administered by the Board of Directors and provides for both the direct award of stock and the grant of stock options to eligible directors, officers, employees and outside consultants of the Company or its affiliates as defined in the Incentive Plan. The Company may grant either incentive stock options or nonqualified stock options as directed in the Incentive Plan.
The Board authorized that the Incentive Plan provide for the award of 100,000 shares of direct stock awards (restricted shares) and 900,000 shares of stock options, of which 500,000 shares are performance-based stock options. Options are generally granted with an exercise price equal to the market price of the Company's stock at the date of the grant; those option awards generally vest based on 5 years of continuous service and have 10-year contractual terms for non-controlling participants as defined by the Incentive Plan, and forfeiture of unexercised options upon termination of employment with the Company. Other grant terms can vary for controlling participants as defined by the Incentive Plan. Restricted share awards generally vest after 4 years of continuous service. The terms of the Incentive Plan include a provision whereby all unearned non-performance options and restricted shares become immediately exercisable and fully vested upon a change in control. The vesting of a performance-based stock option is contingent upon a change of control and the achievement of specific performance criteria or other objectives set at the grant date.
During the six months ended June 30, 2014, the Company awarded 28,500 restricted shares, 30,000 nonperformance-based stock options and 50,000 performance-based stock options. During the six months ended June 30, 2013, the Company did not grant any awards or options.
Stock based compensation expense is measured based upon the fair market value of the award at the grant date and is recognized ratably over the period during which the shares are earned (the requisite service period). For the six months ended June 30, 2014 and 2013, approximately $165 and $160, respectively, was recognized in the accompanying consolidated statements of income. As of June 30, 2014, there was approximately $1,832 of unrecognized compensation expense related to non-vested share-based compensation awards that is expected to be recognized over the remaining requisite service periods of the options granted.
F-32
VERITEX HOLDINGS, INC. AND SUBSIDIARY
Notes to Condensed Consolidated Financial Statements (Unaudited) (Continued)
(Dollars in thousands, except per share amounts)
10. Stock Incentive Plan (Continued)
The fair value of each option award is estimated on the grant date using the Black-Scholes option-pricing model with the following assumptions used for the awards granted during the six months ended June 30, 2014:
| |
June 30, 2014 | |
|---|---|---|
Dividend yield |
0.00% | |
Expected life |
10 years | |
Expected volatility |
5.60% | |
Risk-free interest rate |
2.54% to 2.71% |
The expected life is based on the expected amount of time that options granted are expected to be outstanding. The dividend yield assumption is based on the Company's history. The expected volatility is based on historical volatility of the Company. The risk-free interest rates are based upon yields of U.S. Treasury issues with a term equal to the expected life of the option being valued.
A summary of option activity under the Incentive Plan as of June 30, 2014 and 2013, and changes during the six month periods then ended is presented below:
| |
2014 | |||||||||||||||
|---|---|---|---|---|---|---|---|---|---|---|---|---|---|---|---|---|
| |
Nonperformance-based stock options | Performance-based stock options | ||||||||||||||
| |
Shares Underlying Options |
Weighted Exercise Price |
Weighted Average Contractual Term |
Shares Underlying Options |
Weighted Average Exercise Price |
Weighted Average Contractual Term |
||||||||||
Outstanding at beginning of period |
327,500 | $ | 10.03 | 7.69 years | 422,500 | $ | 10.02 | 8.0 years | ||||||||
| | | | | | | | | | | | | | | | | |
| | | | | | | | | | | | | | | | | |
Granted during the period |
30,000 | 11.86 | 50,000 | 11.19 | ||||||||||||
Forfeited during the period |
— | — | — | — | ||||||||||||
Exercised during the period |
— | — | — | — | ||||||||||||
| | | | | | | | | | | | | | | | | |
Outstanding at the end of period |
357,500 | $ | 10.15 | 7.17 years | 472,500 | $ | 10.15 | 8.0 years | ||||||||
| | | | | | | | | | | | | | | | | |
| | | | | | | | | | | | | | | | | |
Options exercisable at end of period |
181,200 | $ | 10.04 | 6.71 years | — | $ | — | — | ||||||||
| | | | | | | | | | | | | | | | | |
| | | | | | | | | | | | | | | | | |
Weighted average fair value of options granted during the period |
$ | 1.94 | $ | 2.01 | ||||||||||||
| | | | | | | | | | | | | | | | | |
| | | | | | | | | | | | | | | | | |
F-33
VERITEX HOLDINGS, INC. AND SUBSIDIARY
Notes to Condensed Consolidated Financial Statements (Unaudited) (Continued)
(Dollars in thousands, except per share amounts)
10. Stock Incentive Plan (Continued)
| |
2013 | |||||||||||||||
|---|---|---|---|---|---|---|---|---|---|---|---|---|---|---|---|---|
| |
Nonperformance-based stock options | Performance-based stock options | ||||||||||||||
| |
Shares Underlying Options |
Weighted Exercise Price |
Weighted Average Contractual Term |
Shares Underlying Options |
Weighted Average Exercise Price |
Weighted Average Contractual Term |
||||||||||
Outstanding at beginning of period |
332,500 | $ | 10.00 | 8.18 years | 432,500 | $ | 10.00 | 8.0 years | ||||||||
| | | | | | | | | | | | | | | | | |
| | | | | | | | | | | | | | | | | |
Granted during the period |
— | — | — | — | ||||||||||||
Forfeited during the period |
15,000 | — | 20,000 | — | ||||||||||||
Exercised during the period |
— | — | — | — | ||||||||||||
| | | | | | | | | | | | | | | | | |
Outstanding at the end of period |
317,500 | $ | 10.00 | 6.92 years | 412,500 | $ | 10.00 | 6.68 years | ||||||||
| | | | | | | | | | | | | | | | | |
| | | | | | | | | | | | | | | | | |
Options exercisable at end of period |
108,700 | $ | 10.00 | 7.50 years | — | $ | — | — | ||||||||
| | | | | | | | | | | | | | | | | |
| | | | | | | | | | | | | | | | | |
Weighted average fair value of options granted during the period |
$ | — | $ | — | ||||||||||||
| | | | | | | | | | | | | | | | | |
| | | | | | | | | | | | | | | | | |
As of June 30, 2014 and 2013, the aggregate intrinsic value was $983 and $270, respectively, for outstanding nonperformance-based stock options and $518 and $92, respectively, for exercisable nonperformance-based stock options.
As of June 30, 2014 and 2013, the aggregate intrinsic value was $1,300 and $351, respectively, for outstanding performance-based stock options. No performance-based stock options were exercisable as of June 30, 2014 and 2013.
As of June 30, 2014 there was $1,464 of total unrecognized compensation expense related to nonvested option shares, of which $343 was related to the nonperformance-based stock options. The nonperformance-based stock option cost is expected to be recognized over the remaining weighted average requisite service period of 2.10 years. Expense associated with the performance-based stock options is based on the probability of future changes in control and other market conditions. During 2013, management determined that one performance condition had been met and expensed a portion of the performance-based option cost. Total unrecognized compensation expense related to these performance-based options as of June 30, 2014 was approximately $392 and is expected to be recognized over the remaining weighted average requisite service period of 6.51 years. Management does not anticipate meeting the other market conditions in the foreseeable future; therefore no performance-based stock option expense related to these conditions was recorded for the six months ending June 30, 2014
F-34
VERITEX HOLDINGS, INC. AND SUBSIDIARY
Notes to Condensed Consolidated Financial Statements (Unaudited) (Continued)
(Dollars in thousands, except per share amounts)
10. Stock Incentive Plan (Continued)
A summary of the status of the Company's restricted shares as of June 30, 2014 and 2013, and changes during the periods then ended is as follows:
| |
2014 | 2013 | |||||||||||
|---|---|---|---|---|---|---|---|---|---|---|---|---|---|
| |
Shares | Weighted Average Grant Date Fair Value |
Shares | Weighted Average Grant Date Fair Value |
|||||||||
Nonvested at January 1, |
35,000 | $ | 10.02 | 40,000 | $ | 10.00 | |||||||
Granted |
28,500 | 11.93 | — | — | |||||||||
Vested |
— | — | — | — | |||||||||
Forfeited |
(250 | ) | 10.85 | (6,000 | ) | — | |||||||
| | | | | | | | | | | | | | |
Nonvested at June 30, |
63,250 | $ | 10.88 | 34,000 | $ | 10.00 | |||||||
| | | | | | | | | | | | | | |
| | | | | | | | | | | | | | |
As of June 30, 2014, there was $369 of total unrecognized compensation expense related to nonvested restricted shares. The compensation expense is expected to be recognized over the remaining weighted average requisite service period of 2.14 years.
11. Significant Concentrations of Credit Risk
Most of the Company's business activity is with customers located within the Dallas metropolitan area. Such customers are normally also depositors of the Company.
The distribution of commitments to extend credit approximates the distribution of loans outstanding. Commercial and standby letters of credit were granted primarily to commercial borrowers.
The contractual amounts of credit related financial instruments such as commitments to extend credit, credit card arrangements, and letters of credit represent the amounts of potential accounting loss should the contract be fully drawn upon, the customer default, and the value of any existing collateral become worthless.
12. Preferred Stock
On August 25, 2011 the Company entered into a Small Business Lending Fund-Securities Purchase Agreement (SBLF Purchase Agreement) with the Secretary of the Treasury, pursuant to which the Company (i) sold 8,000 shares of the Company's Senior Non-Cumulative Perpetual Preferred Stock, Series C (the SBLF Preferred Stock) to the Secretary of the Treasury for a purchase price of $8,000. The issuance was pursuant to the SBLF program, a fund established under the Small Business Jobs Act of 2010 that was created to encourage lending to small business by providing capital to qualified community banks.
The SBLF Preferred Stock qualifies as Tier 1 capital and pays non-cumulative dividends quarterly, on each January 1, April 1, July 1 and October 1. The dividend rate, as a percentage of the liquidation amount, can fluctuate on a quarterly basis during the first 10 quarters during which the SBLF Preferred Stock is outstanding, based upon changes in the level of "Qualified Small Business Lending" or "QBSL" (as defined in the SBLF Purchase Agreement) by the Bank. Based upon the increase in the Bank's level of QBSL over the baseline level calculated under the terms of the SBLF Purchase
F-35
VERITEX HOLDINGS, INC. AND SUBSIDIARY
Notes to Condensed Consolidated Financial Statements (Unaudited) (Continued)
(Dollars in thousands, except per share amounts)
12. Preferred Stock (Continued)
Agreement, the dividend rate for the initial dividend period for the Company was set at 1.00%. For the tenth calendar quarter through four and one half years after issuance, the dividend rate will be fixed and as of June 30, 2014 was set at one percent (1%) based upon the increase in QBSL as compared to the baseline. After four and one half years from issuance, the dividend rate will increase to 9% (including a quarterly lending incentive fee of 0.5%).
The SBLF Preferred Stock is non-voting, except in limited circumstances. In the event that the Company misses five dividend payments, whether or not consecutive, the holder of the SBLF Preferred Stock will have the right, but not the obligation, to appoint a representative as an observer on the Company's Board of Directors. The right expires when full dividends have been paid for four consecutive dividend periods. The SBLF Preferred Stock may be redeemed at any time at the Company's option, at a redemption price of 100% of the liquidation amount plus accrued but unpaid dividends to the date of redemption for the current period, subject to the approval of its federal banking regulator.
13. Capital Requirements and Restrictions on Retained Earnings
Under banking law, there are legal restrictions limiting the amount of dividends the Company can declare. Approval of the regulatory authorities is required if the effect of the dividends declared would cause regulatory capital of the Company to fall below specified minimum levels.
The Company (on a consolidated basis) and the Bank are subject to various regulatory capital requirements administered by federal banking agencies. Failure to meet minimum capital requirements can initiate certain mandatory and possibly additional discretionary actions by regulators that, if undertaken, could have a direct material effect on the Bank's financial statements. Under capital adequacy guidelines and the regulatory framework for prompt corrective action, the Bank must meet specific capital guidelines that involve quantitative measures of the Bank's assets, liabilities, and certain off balance sheet items as calculated under regulatory accounting practices. The Bank's capital amounts and classification are also subject to qualitative judgments by the regulators about components, risk weightings, and other factors.
Quantitative measures established by regulation to ensure capital adequacy require the Company and the Bank to maintain minimum amounts and ratios (set forth in the table below) of total and Tier 1 capital (as defined in the regulations) to risk weighted assets (as defined), and of Tier 1 capital (as defined) to average assets (as defined). Management believes, as of June 30, 2014 and December 31, 2013, that the Company and the Bank met all capital adequacy requirements to which it was subject.
As of June 30, 2014 and December 31, 2013 the Bank's capital ratios exceeded those levels necessary to be categorized as "well capitalized" under the regulatory framework for prompt corrective action. To be categorized as "well capitalized" the Bank must maintain minimum total risk-based, Tier 1 risk-based and Tier 1 leverage ratios as set forth in the table. There are no conditions or events since June 30, 2014 that management believes have changed the Bank's category.
F-36
VERITEX HOLDINGS, INC. AND SUBSIDIARY
Notes to Condensed Consolidated Financial Statements (Unaudited) (Continued)
(Dollars in thousands, except per share amounts)
13. Capital Requirements and Restrictions on Retained Earnings (Continued)
A comparison of the Company's and Bank's actual capital amounts and ratios to required capital amounts and ratios is presented in the following table:
| |
Actual | For Capital Adequacy Purposes |
To Be Well Capitalized Under Prompt Corrective Action Provisions |
||||||||||||||||
|---|---|---|---|---|---|---|---|---|---|---|---|---|---|---|---|---|---|---|---|
| |
Amount | Ratio | Amount | Ratio | Amount | Ratio | |||||||||||||
As June 30, 2014: |
|||||||||||||||||||
Total capital |
|||||||||||||||||||
Company |
$ | 67,540 | 12.35 | % ³ | $ | 43,733 ³ | 8.0 | % ³ | N/A ³ | N/A | |||||||||
Bank |
$ | 65,480 | 11.99 | % ³ | $ | 43,707 ³ | 8.0 | % ³ | $ | 54,634 ³ | 10.0 | % | |||||||
Tier 1 capital |
|||||||||||||||||||
Company |
$ | 57,044 | 10.44 | % ³ | $ | 21,866 ³ | 4.0 | % ³ | N/A ³ | N/A | |||||||||
Bank |
$ | 59,964 | 10.98 | % ³ | $ | 21,854 ³ | 4.0 | % ³ | $ | 32,780 ³ | 6.0 | % | |||||||
Tier 1 capital |
|||||||||||||||||||
Company |
$ | 57,044 | 8.66 | % ³ | $ | 26,352 ³ | 4.0 | % ³ | N/A ³ | N/A | |||||||||
Bank |
$ | 59,964 | 9.11 | % ³ | $ | 26,340 ³ | 4.0 | % ³ | $ | 32,925 ³ | 5.0 | % | |||||||
As of December 31, 2013: |
|||||||||||||||||||
Total capital |
|||||||||||||||||||
Company |
$ | 59,100 | 11.74 | % ³ | $ | 40,288 ³ | 8.0 | % ³ | N/A ³ | N/A | |||||||||
Bank |
$ | 57,275 | 11.37 | % ³ | $ | 40,296 ³ | 8.0 | % ³ | $ | 38,817 ³ | 10.0 | % | |||||||
Tier 1 capital |
|||||||||||||||||||
Company |
$ | 49,103 | 9.75 | % ³ | $ | 20,144 ³ | 4.0 | % ³ | N/A ³ | N/A | |||||||||
Bank |
$ | 52,257 | 10.37 | % ³ | $ | 20,148 ³ | 4.0 | % ³ | $ | 23,290 ³ | 6.0 | % | |||||||
Tier 1 capital |
|||||||||||||||||||
Company |
$ | 49,103 | 8.06 | % ³ | $ | 24,373 ³ | 4.0 | % ³ | N/A ³ | N/A | |||||||||
Bank |
$ | 52,257 | 8.58 | % ³ | $ | 24,369 ³ | 4.0 | % ³ | $ | 24,762 ³ | 5.0 | % | |||||||
14. Subsequent Events
The Company has evaluated subsequent events through August 29, 2014 which was the date the condensed consolidated financial statements were available to be issued and noted no subsequent events requiring financial statement recognition or disclosure.
F-37
REPORT OF INDEPENDENT REGISTERED PUBLIC ACCOUNTING FIRM
Board
of Directors and Shareholders
Veritex Holdings, Inc.
We have audited the accompanying consolidated balance sheet of Veritex Holdings, Inc. (a Texas corporation) and subsidiary (the "Company") as of December 31, 2013, and the related consolidated statements of income, comprehensive income, changes in stockholders' equity, and cash flows for the year ended December 31, 2013. These financial statements are the responsibility of the Company's management. Our responsibility is to express an opinion on these financial statements based on our audit.
We conducted our audit in accordance with the standards of the Public Company Accounting Oversight Board (United States). Those standards require that we plan and perform the audit to obtain reasonable assurance about whether the financial statements are free of material misstatement. We were not engaged to perform an audit of the Company's internal control over financial reporting. Our audit included consideration of internal control over financial reporting as a basis for designing audit procedures that are appropriate in the circumstances, but not for the purpose of expressing an opinion on the effectiveness of the Company's internal control over financial reporting. Accordingly, we express no such opinion. An audit also includes examining, on a test basis, evidence supporting the amounts and disclosures in the financial statements, assessing the accounting principles used and significant estimates made by management, as well as evaluating the overall financial statement presentation. We believe that our audit provides a reasonable basis for our opinion.
In our opinion, the consolidated financial statements referred to above present fairly, in all material respects, the financial position of Veritex Holdings, Inc. and subsidiary as of December 31, 2013, and the results of their operations and their cash flows for the year ended December 31, 2013 in conformity with accounting principles generally accepted in the United States of America.
/s/ Grant Thornton LLP
Dallas,
Texas
July 22, 2014
F-38
REPORT OF INDEPENDENT REGISTERED PUBLIC ACCOUNTING FIRM
The
Board of Directors
Veritex Holdings, Inc. and Subsidiary
We have audited the accompanying consolidated balance sheet of Veritex Holdings, Inc. and Subsidiary (the "Company") as of December 31, 2012, and the related consolidated statements of income, comprehensive income, changes in stockholders' equity, and cash flows for each of the years in the two-year period ended December 31, 2012. The Company's management is responsible for these financial statements. Our responsibility is to express an opinion on these consolidated financial statements based on our audits.
We conducted our audits in accordance with the standards of the Public Company Accounting Oversight Board (United States). Those standards require that we plan and perform the audit to obtain reasonable assurance about whether the consolidated financial statements are free of material misstatement. The company is not required to have, nor were we engaged to perform, an audit of its internal control over financial reporting. Our audit included consideration of internal control over financial reporting as a basis for designing audit procedures that are appropriate in the circumstances, but not for the purpose of expressing an opinion on the effectiveness of the company's internal control over financial reporting. Accordingly, we express no such opinion. An audit also includes examining, on a test basis, evidence supporting the amounts and disclosures in the consolidated financial statements, assessing the accounting principles used and significant estimates made by management, as well as evaluating the overall financial statement presentation. We believe that our audits provide a reasonable basis for our opinion.
In our opinion, the consolidated financial statements referred to above present fairly, in all material respects, the financial position of Veritex Holdings, Inc. and Subsidiary as of December 31, 2012, and the results of their operations and their cash flows for each of the years in the two-year period ended December 31, 2012 in conformity with accounting principles generally accepted in the United States of America.
/s/ JonesBaggett LLP
Dallas,
Texas
July 22, 2014
F-39
VERITEX HOLDINGS, INC. AND SUBSIDIARY
Consolidated Balance Sheets
December 31, 2013 and 2012
(Dollars in thousands, except
par value information)
| |
December 31, | ||||||
|---|---|---|---|---|---|---|---|
| |
2013 | 2012 | |||||
ASSETS |
|||||||
Cash and due from banks |
$ | 8,484 | $ | 8,197 | |||
Interest bearing deposits in other banks |
68,162 | 44,963 | |||||
| | | | | | | | |
Total cash and cash equivalents |
76,646 | 53,160 | |||||
Investment securities |
45,604 |
29,538 |
|||||
Loans held for sale |
2,051 | 2,818 | |||||
Loans, net of allowance for loan losses of $5,018 and $3,238, respectively |
490,158 | 394,278 | |||||
Accrued interest receivable |
1,351 | 1,201 | |||||
Prepaid FDIC assessment |
— | 501 | |||||
Bank-owned life insurance |
10,475 | 5,152 | |||||
Bank premises, furniture and equipment, net |
9,952 | 10,348 | |||||
Non-marketable equity securities |
2,714 | 2,589 | |||||
Investment in subsidiary |
93 | 93 | |||||
Other real estate owned |
1,797 | 2,438 | |||||
Intangible assets |
1,567 | 1,875 | |||||
Goodwill |
19,148 | 19,148 | |||||
Other assets |
3,415 | 988 | |||||
| | | | | | | | |
Total assets |
$ | 664,971 | $ | 524,127 | |||
| | | | | | | | |
| | | | | | | | |
LIABILITIES AND STOCKHOLDERS' EQUITY |
|||||||
Deposits: |
|||||||
Noninterest-bearing |
$ | 218,990 | $ | 170,497 | |||
Interest-bearing |
354,948 | 277,405 | |||||
| | | | | | | | |
Total deposits |
573,938 | 447,902 | |||||
Accounts payable and accrued expenses |
1,214 |
607 |
|||||
Accrued interest payable and other liabilities |
508 | 665 | |||||
Advances from Federal Home Loan Bank |
15,000 | 10,000 | |||||
Junior subordinated debentures |
3,093 | 3,093 | |||||
Subordinated notes |
4,979 | — | |||||
| | | | | | | | |
Total liabilities |
598,732 | 462,267 | |||||
Commitments and contingencies (Note 14) |
|||||||
Stockholders' equity: |
|||||||
Preferred stock, $0.01 par value; 500,000 shares authorized; 8,000 shares Series C, issued and outstanding with a $1,000 liquidation value |
8,000 | 8,000 | |||||
Common stock, $0.01 par value; 10,000,000 shares authorized, 5,804,703 and 5,694,340 shares issued and outstanding at December 31, 2013 and 2012, respectively (excluding 10,000 shares held in treasury at December 31, 2013) |
58 | 57 | |||||
Additional paid-in capital |
55,303 | 53,750 | |||||
Retained earnings (accumulated deficit) |
2,922 | (426 | ) | ||||
Accumulated other comprehensive income |
26 | 479 | |||||
Less: Treasury stock, 10,000 shares at cost |
(70 | ) | — | ||||
| | | | | | | | |
Total stockholders' equity |
66,239 | 61,860 | |||||
| | | | | | | | |
Total liabilities and stockholders' equity |
$ | 664,971 | $ | 524,127 | |||
| | | | | | | | |
| | | | | | | | |
See accompanying notes to consolidated financial statements.
F-40
VERITEX HOLDINGS, INC. AND SUBSIDIARY
Consolidated Statements of Income
Years Ended December 31, 2013, 2012 and 2011
(Dollars in thousands, except per share amounts)
| |
Years Ended December 31, | |||||||||
|---|---|---|---|---|---|---|---|---|---|---|
| |
2013 | 2012 | 2011 | |||||||
Interest income: |
||||||||||
Interest and fees on loans |
$ | 22,755 | $ | 20,619 | $ | 13,494 | ||||
Interest on investment securities |
613 | 655 | 1,287 | |||||||
Interest on federal fund sold |
— | — | 16 | |||||||
Interest on deposits in other banks |
132 | 108 | 57 | |||||||
Interest on other |
2 | 8 | 5 | |||||||
| | | | | | | | | | | |
Total interest income |
23,502 | 21,390 | 14,859 | |||||||
| | | | | | | | | | | |
Interest expense: |
||||||||||
Interest on deposit accounts |
2,207 | 1,911 | 1,817 | |||||||
Interest on borrowings |
254 | 386 | 475 | |||||||
| | | | | | | | | | | |
Total interest expense |
2,461 | 2,297 | 2,292 | |||||||
| | | | | | | | | | | |
Net interest income |
21,041 | 19,093 | 12,567 | |||||||
Provision for loan losses |
1,883 |
2,953 |
960 |
|||||||
| | | | | | | | | | | |
Net interest income after provision for loan losses |
19,158 | 16,140 | 11,607 | |||||||
| | | | | | | | | | | |
Noninterest income: |
||||||||||
Service charges on deposit accounts |
726 | 700 | 563 | |||||||
Gain on sales of investment securities |
— | — | 421 | |||||||
Gain on sales of loans held for sale |
632 | 248 | — | |||||||
Gain on sales of other real estate owned |
20 | 61 | 43 | |||||||
Bank-owned life insurance |
385 | 180 | — | |||||||
Other |
628 | 458 | 250 | |||||||
| | | | | | | | | | | |
Total noninterest income |
2,391 | 1,647 | 1,277 | |||||||
| | | | | | | | | | | |
Noninterest expense: |
||||||||||
Salaries and employee benefits |
9,084 | 9,205 | 6,967 | |||||||
Occupancy of bank premises |
1,694 | 1,546 | 888 | |||||||
Depreciation and amortization |
1,266 | 1,059 | 751 | |||||||
Data processing |
729 | 880 | 610 | |||||||
FDIC assessment fees |
378 | 234 | 383 | |||||||
Legal fees |
80 | 380 | 630 | |||||||
Other professional fees |
574 | 668 | 560 | |||||||
Advertising and promotions |
142 | 167 | 232 | |||||||
Utilities and telephone |
295 | 399 | 322 | |||||||
Other real estate owned expenses and writedowns |
399 | 175 | 40 | |||||||
Other |
1,723 | 1,459 | 1,379 | |||||||
| | | | | | | | | | | |
Total noninterest expense |
16,364 | 16,172 | 12,762 | |||||||
| | | | | | | | | | | |
Net income from operations |
5,185 | 1,615 | 122 | |||||||
Income tax expense |
1,777 |
136 |
13 |
|||||||
| | | | | | | | | | | |
Net income |
$ | 3,408 | $ | 1,479 | $ | 109 | ||||
| | | | | | | | | | | |
| | | | | | | | | | | |
Preferred stock dividends |
$ | 60 | $ | 100 | $ | 76 | ||||
| | | | | | | | | | | |
Net income available to common stockholders |
$ | 3,348 | $ | 1,379 | $ | 33 | ||||
| | | | | | | | | | | |
| | | | | | | | | | | |
Basic earnings per share |
$ |
0.58 |
$ |
0.24 |
$ |
0.01 |
||||
| | | | | | | | | | | |
| | | | | | | | | | | |
Diluted earnings per share |
$ | 0.57 | $ | 0.24 | $ | 0.01 | ||||
| | | | | | | | | | | |
| | | | | | | | | | | |
See accompanying notes to consolidated financial statements.
F-41
VERITEX HOLDINGS, INC. AND SUBSIDIARY
Consolidated Statements of Comprehensive Income
Years Ended December 31, 2013, 2012 and 2011
(Dollars in thousands)
| |
Years Ended December 31, | |||||||||
|---|---|---|---|---|---|---|---|---|---|---|
| |
2013 | 2012 | 2011 | |||||||
|
||||||||||
Net income |
$ | 3,408 | $ | 1,479 | $ | 109 | ||||
| | | | | | | | | | | |
Other comprehensive (loss) income: |
||||||||||
Unrealized (losses) gains on securities available for sale arising during the period, net |
(686 | ) | 230 | 1,262 | ||||||
Reclassification adjustment for net gains included in net income |
— | — | (421 | ) | ||||||
| | | | | | | | | | | |
Other comprehensive (loss) income before tax |
(686 | ) | 230 | 841 | ||||||
Income tax (benefit) expense |
(233 | ) | 78 | 286 | ||||||
| | | | | | | | | | | |
Other comprehensive (loss) income, net of tax |
(453 | ) | 152 | 555 | ||||||
| | | | | | | | | | | |
Comprehensive income |
$ | 2,955 | $ | 1,631 | $ | 664 | ||||
| | | | | | | | | | | |
| | | | | | | | | | | |
See accompanying notes to consolidated financial statements.
F-42
VERITEX HOLDINGS, INC. AND SUBSIDIARY
Consolidated Statements of Changes in Stockholders' Equity
Years Ended December 31, 2013, 2012 and 2011
(Dollars in thousands)
| |
|
Common Stock | |
(Accumulated Deficit) Retained Earnings |
Accumulated Other Comprehensive Income |
|
|
||||||||||||||||||
|---|---|---|---|---|---|---|---|---|---|---|---|---|---|---|---|---|---|---|---|---|---|---|---|---|---|
| |
Preferred Stock |
Additional Paid-In Capital |
Treasury Stock |
|
|||||||||||||||||||||
| |
Shares | Amount | Total | ||||||||||||||||||||||
Balance at January 1, 2011 |
$ | — | 3,553,333 | $ | 36 | $ | 34,946 | $ | (1,735 | ) | $ | (228 | ) | $ | — | $ | 33,019 | ||||||||
Sale of common stock |
— | 1,277,543 | 13 | 12,763 | — | — | — | 12,776 | |||||||||||||||||
Common stock issued and preferred stock acquired in connection with FRC business combination |
3,047 | 723,611 | 7 | 4,182 | — | — | — | 7,236 | |||||||||||||||||
Preferred stock dividend and accretion of preferred stock discount—Series A and B |
103 | — | — | — | (171 | ) | — | — | (68 | ) | |||||||||||||||
Issuance of preferred stock Series C |
8,000 | — | — | — | — | — | — | 8,000 | |||||||||||||||||
Redemption of preferred stock Series A and B |
(3,150 | ) | — | — | — | — | — | — | (3,150 | ) | |||||||||||||||
Preferred stock dividend Series C |
— | — | — | — | (8 | ) | — | — | (8 | ) | |||||||||||||||
Stock based compensation |
— | — | — | 207 | — | — | — | 207 | |||||||||||||||||
Net income |
— | — | — | — | 109 | — | — | 109 | |||||||||||||||||
Other comprehensive income |
— | — | — | — | — | 555 | — | 555 | |||||||||||||||||
| | | | | | | | | | | | | | | | | | | | | | | | | | |
Balance at December 31, 2011 |
8,000 | 5,554,487 | 56 | 52,098 | (1,805 | ) | 327 | — | 58,676 | ||||||||||||||||
Sale of common stock |
— | 139,853 | 1 | 1,397 | — | — | — | 1,398 | |||||||||||||||||
Preferred stock dividend Series C |
— | — | — | — | (100 | ) | — | — | (100 | ) | |||||||||||||||
Stock based compensation |
— | — | — | 255 | — | — | — | 255 | |||||||||||||||||
Net income |
— | — | — | — | 1,479 | — | — | 1,479 | |||||||||||||||||
Other comprehensive income |
— | — | — | — | — | 152 | — | 152 | |||||||||||||||||
| | | | | | | | | | | | | | | | | | | | | | | | | | |
Balance at December 31, 2012 |
8,000 | 5,694,340 | 57 | 53,750 | (426 | ) | 479 | — | 61,860 | ||||||||||||||||
Sale of common stock |
— | 120,363 | 1 | 1,209 | — | — | — | 1,210 | |||||||||||||||||
Preferred stock dividend Series C |
— | — | — | — | (60 | ) | — | — | (60 | ) | |||||||||||||||
Purchase of treasury stock at cost |
— | (10,000 | ) | — | — | — | — | (70 | ) | (70 | ) | ||||||||||||||
Issuance of warrants related to subordinated debt |
— | — | — | 21 | — | — | — | 21 | |||||||||||||||||
Stock based compensation |
— | — | — | 323 | — | — | — | 323 | |||||||||||||||||
Net income |
— | — | — | — | 3,408 | — | — | 3,408 | |||||||||||||||||
Other comprehensive loss |
— | — | — | — | — | (453 | ) | — | (453 | ) | |||||||||||||||
| | | | | | | | | | | | | | | | | | | | | | | | | | |
Balance at December 31, 2013 |
$ | 8,000 | 5,804,703 | $ | 58 | $ | 55,303 | $ | 2,922 | $ | 26 | $ | (70 | ) | $ | 66,239 | |||||||||
| | | | | | | | | | | | | | | | | | | | | | | | | | |
| | | | | | | | | | | | | | | | | | | | | | | | | | |
See accompanying notes to consolidated financial statements.
F-43
VERITEX HOLDINGS, INC. AND SUBSIDIARY
Consolidated Statements of Cash Flows
Years Ended December 31, 2013, 2012 and 2011
(Dollars in thousands)
| |
Years Ended December 31, | |||||||||
|---|---|---|---|---|---|---|---|---|---|---|
| |
2013 | 2012 | 2011 | |||||||
Cash flows from operating activities: |
||||||||||
Net income |
$ | 3,408 | $ | 1,479 | $ | 109 | ||||
Adjustments to reconcile net income to net cash |
||||||||||
provided by operating activities: |
||||||||||
Depreciation and amortization |
1,266 | 1,059 | 751 | |||||||
Provision for loan losses |
1,883 | 2,953 | 960 | |||||||
Accretion of loan purchase discount |
(404 | ) | (1,150 | ) | (885 | ) | ||||
Stock-based compensation expense |
323 | 255 | 207 | |||||||
Amortization of other intangible assets |
14 | 13 | 16 | |||||||
Net amortization of premiums on investment securities |
371 | 445 | 1,440 | |||||||
Change in cash surrender value of bank-owned life insurance |
(323 | ) | (152 | ) | — | |||||
Net gain on sales of investment securities |
— | — | (421 | ) | ||||||
Gain on sales of loans held for sale |
(632 | ) | (248 | ) | — | |||||
Net gain on sales of other real estate owned |
(20 | ) | (61 | ) | (43 | ) | ||||
Writedowns of other real estate owned |
249 | 48 | — | |||||||
Net originations of loans held for sale |
(35,895 | ) | (16,606 | ) | — | |||||
Proceeds from sales of loans held for sale |
37,294 | 14,036 | — | |||||||
(Increase) decrease in accrued interest receivable, prepaids and other assets |
(2,076 | ) | (338 | ) | 60 | |||||
Increase (decrease) in accrued expenses and other liabilities |
683 | (100 | ) | 336 | ||||||
| | | | | | | | | | | |
Net cash provided by operating activities |
6,141 | 1,633 | 2,530 | |||||||
| | | | | | | | | | | |
Cash flows from investing activities: |
||||||||||
Net cash received in business combination |
— | — | 22,821 | |||||||
Purchases of securities available for sale |
(146,787 | ) | (242,462 | ) | (78,068 | ) | ||||
Sales of securities available for sale |
120,000 | 239,997 | 90,224 | |||||||
Proceeds from maturities, calls and pay downs of securities available for sale |
9,664 | 15,401 | 18,589 | |||||||
(Purchases) sales of non-marketable equity securities, net |
(125 | ) | (1,554 | ) | 260 | |||||
Net loans originated |
(98,513 | ) | (102,640 | ) | (47,942 | ) | ||||
Purchases of bank-owned life insurance |
(5,000 | ) | (5,000 | ) | — | |||||
Net additions to bank premises and equipment |
(576 | ) | (909 | ) | (1,266 | ) | ||||
Proceeds from sales of other real estate owned |
1,566 | 1,462 | 767 | |||||||
| | | | | | | | | | | |
Net cash (used in) provided by investing activities |
(119,771 | ) | (95,705 | ) | 5,385 | |||||
| | | | | | | | | | | |
Cash flows from financing activities: |
||||||||||
Net change in deposits |
126,036 | 83,144 | 25,879 | |||||||
Proceeds from issuance of preferred stock Series C |
— | — | 8,000 | |||||||
Redemption of preferred stock Series A and B |
— | — | (3,150 | ) | ||||||
Net increase in advances from Federal Home Loan Bank |
5,000 | — | — | |||||||
Issuance of subordinated notes |
5,000 | — | — | |||||||
Purchase of common stock held in treasury |
(70 | ) | — | — | ||||||
Dividends paid on preferred stock |
(60 | ) | (100 | ) | (76 | ) | ||||
Proceeds from issuance of common stock, net |
1,210 | 1,398 | 12,776 | |||||||
| | | | | | | | | | | |
Net cash provided by financing activities |
137,116 | 84,442 | 43,429 | |||||||
| | | | | | | | | | | |
Net increase (decrease) in cash and cash equivalents |
23,486 | (9,630 | ) | 51,344 | ||||||
Cash and cash equivalents at beginning of year |
53,160 |
62,790 |
11,446 |
|||||||
| | | | | | | | | | | |
Cash and cash equivalents at end of year |
$ | 76,646 | $ | 53,160 | $ | 62,790 | ||||
| | | | | | | | | | | |
| | | | | | | | | | | |
Supplemental Disclosures of Cash Flow Information: |
||||||||||
Cash paid for interest |
$ | 2,470 | $ | 2,300 | $ | 2,218 | ||||
Cash paid for income taxes |
$ | 2,475 | $ | 900 | $ | — | ||||
Supplemental Disclosures of Non-Cash Flow Information: |
||||||||||
Net unrealized (depreciation) appreciation on securities available for sale |
$ | (686 | ) | $ | 230 | $ | 841 | |||
Net foreclosure of other real estate owned |
$ | 1,154 | $ | 3,158 | $ | 414 | ||||
Acquisitions in connection with business combinations: |
||||||||||
Fair value of assets acquired |
$ | — | $ | — | $ | 220,082 | ||||
Cash paid for common stock |
— | — | (24,405 | ) | ||||||
Common stock exchanged |
— | — | (7,236 | ) | ||||||
| | | | | | | | | | | |
Liabilities assumed |
$ | — | $ | — | $ | 188,441 | ||||
| | | | | | | | | | | |
| | | | | | | | | | | |
See accompanying notes to consolidated financial statements.
F-44
VERITEX HOLDINGS, INC. AND SUBSIDIARY
Notes to Consolidated Financial Statements
(Dollars in thousands, except for per share amounts)
1. Summary of Significant Accounting Policies
A summary of significant accounting policies of Veritex Holdings, Inc. and Subsidiary (together referred to as the Company) applied in the preparation of the accompanying consolidated financial statements are as follows. The accounting principles followed by the Company and the methods of applying them are in conformity with both U.S. generally accepted accounting principles and prevailing practices of the banking industry.
Organization and Basis of Presentation
The accompanying consolidated financial statements include the accounts of Veritex Holdings, Inc. (Veritex) and its wholly-owned subsidiary, Veritex Community Bank (Bank), formerly known as Veritex Community Bank, National Association. During 2012, the Bank applied to the Texas Department of Banking to convert to a state banking institution pursuant to Section 32.502 of the Texas Finance Code. The application was approved by the Banking Commissioner effective December 1, 2012.
Veritex Holdings, Inc., a Texas corporation and bank holding company, was incorporated in July 2009 and was formed for the purpose of acquiring one or more financial institutions located in Dallas, Texas and surrounding areas.
The Bank, a state banking institution with corporate offices in Dallas, Texas, currently operates nine branches located throughout the greater Dallas, Texas metropolitan area. The Bank provides a full range of banking services to individual and corporate customers and is subject to competition from other local, regional, and national financial institutions. The Bank is also subject to the regulations of certain state and federal agencies and undergoes periodic examinations by those regulatory authorities.
All material intercompany transactions have been eliminated in consolidation.
Segment Reporting:
The Company has one reportable segment. The Company's chief operating decision-maker uses consolidated results to make operating and strategic decisions.
Use of Estimates
The preparation of financial statements in conformity with accounting principles generally accepted in the United States requires management to make estimates and assumptions that affect the reported amounts of assets and liabilities and disclosure of contingent assets and liabilities at the date of the consolidated financial statements. Actual results could differ from those estimates. The allowance for loan losses, the fair values of financial instruments and the status of contingencies are particularly susceptible to significant change in the near term.
Cash and Cash Equivalents
For the purposes of reporting cash flows, cash and cash equivalents include cash on hand, amounts due from banks and federal funds sold.
The Bank maintains deposits with other financial institutions in amounts that exceed federal deposit insurance coverage. Furthermore, federal funds sold are essentially uncollateralized loans to other financial institutions. Management regularly evaluates the credit risk associated with the
F-45
VERITEX HOLDINGS, INC. AND SUBSIDIARY
Notes to Consolidated Financial Statements (Continued)
(Dollars in thousands, except for per share amounts)
1. Summary of Significant Accounting Policies (Continued)
counterparties to these transactions and believes that the Company is not exposed to any significant credit risks on cash and cash equivalents.
Restrictions on cash
The Bank is required to maintain regulatory reserve balances with the Federal Reserve Bank. The reserve balances required as of December 31, 2013 and 2012 were approximately $15,325 and $12,917, respectively.
Investment Securities
Securities are classified as held to maturity and carried at amortized cost when management has the positive intent and ability to hold them until maturity. Securities to be held for indefinite periods of time are classified as available for sale and carried at fair value, with the unrealized holding gains and losses reported in other comprehensive income, net of tax. Management determines the appropriate classification of securities at the time of purchase.
Interest income includes amortization of purchase premiums and discounts. Realized gains and losses are derived from the amortized cost of the security sold. Credit related declines in the fair value of held to maturity and available for sale securities below their cost that are deemed to be other than temporary are reflected in earnings as realized losses, with the remaining unrealized loss recognized as a component of other comprehensive income. In estimating other-than-temporary impairment losses, management considers, among other things, (i) the length of time and the extent to which the fair value has been less than cost, (ii) the financial condition and near-term prospects of the issuer, and (iii) the intent and ability of the Company to retain its investment in the issuer for a period of time sufficient to allow for any anticipated recovery in fair value.
Loans Held for Sale
Loans held for sale consist of certain mortgage loans originated and intended for sale in the secondary market and are carried at the lower of cost or estimated fair value on an individual loan basis. Net unrealized losses, if any, are recognized through a valuation allowance by charges to income. The Company obtains commitments to purchase the loans from the secondary market investors prior to closing of the loans. Loans held for sale are sold with servicing released. Gains and losses on sales of loans held for sale are based on the difference between the selling price and the carrying value of the related loan sold.
Loans and Allowance for Loan Losses
Loans, excluding certain purchased loans which have shown evidence of deterioration since origination as of the date of the acquisition, that management has the intent and ability to hold for the foreseeable future or until maturity or pay-off are stated at the amount of unpaid principal, reduced by unearned income and an allowance for loan losses. Interest on loans is recognized using the simple-interest method on the daily balances of the principal amounts outstanding. Fees associated with the originating of loans and certain direct loan origination costs are netted and the net amount is deferred and recognized over the life of the loan as an adjustment of yield.
F-46
VERITEX HOLDINGS, INC. AND SUBSIDIARY
Notes to Consolidated Financial Statements (Continued)
(Dollars in thousands, except for per share amounts)
1. Summary of Significant Accounting Policies (Continued)
The accrual of interest on loans is discontinued when there is a clear indication that the borrower's cash flow may not be sufficient to meet payments as they become due, which is generally when a loan is 90 days past due. When a loan is placed on non-accrual status, all previously accrued and unpaid interest is reversed. Interest income is subsequently recognized on a cash basis as long as the remaining book balance of the asset is deemed to be collectible. If collectability is questionable, then cash payments are applied to principal. Loans are returned to accrual status when all the principal and interest amounts contractually due are brought current and future payments are reasonably assured in accordance with the terms of the loan agreement.
The allowance for loan losses is an estimated amount management believes is adequate to absorb inherent losses on existing loans that may be uncollectible based upon review and evaluation of the loan portfolio. Management's periodic evaluation of the allowance is based on general economic conditions, the financial condition of borrowers, the value and liquidity of collateral, delinquency, prior loan loss experience, and the results of periodic reviews of the portfolio. The allowance for loan losses is comprised of two components: the general reserve and specific reserves. The general reserve is determined in accordance with current authoritative accounting guidance that considers historical loss rates for the last three years adjusted for qualitative factors based upon general economic conditions and other qualitative risk factors both internal and external to the Company. Such qualitative factors include current local economic conditions and trends including unemployment, changes in lending staff, policies and procedures, changes in credit concentrations, changes in the trends and severity of problem loans and changes in trends in volume and terms of loans. These qualitative factors serve to compensate for additional areas of uncertainty inherent in the portfolio that are not reflected in the Company's historic loss factors. For purposes of determining the general reserve, the loan portfolio, less cash secured loans, government guaranteed loans and impaired loans, is multiplied by the Company's adjusted historical loss rate. Specific reserves are determined in accordance with current authoritative accounting guidance based on probable losses on specific classified loans.
The allowance for loan losses is increased by charges to income and decreased by charge-offs (net of recoveries).
Due to the growth of the Bank over the past several years, a portion of the loans in its portfolio and its lending relationships are of relatively recent origin. The new loan portfolios have limited delinquency and credit loss history and have not yet exhibited an observable loss trend. The credit quality of loans in theses loan portfolios are impacted by delinquency status and debt service coverage generated by the borrowers' business and fluctuations in the value of real estate collateral. Management considers delinquency status to be the most meaningful indicator of the credit quality of one-to-four single family residential, home equity loans and lines of credit and other consumer loans. In general, loans do not begin to show signs of credit deterioration or default until they have been outstanding for some period of time, a process we refer to as "seasoning." As a result, a portfolio of older loans will usually behave more predictably than a portfolio of newer loans. Because the majority of the portfolio is relatively new, the current level of delinquencies and defaults may not be representative of the level that will prevail when the portfolio becomes more seasoned, which may be higher than current levels.
Delinquency statistics are updated at least monthly. Internal risk ratings are considered the most meaningful indicator of credit quality for new commercial, construction, and commercial real estate
F-47
VERITEX HOLDINGS, INC. AND SUBSIDIARY
Notes to Consolidated Financial Statements (Continued)
(Dollars in thousands, except for per share amounts)
1. Summary of Significant Accounting Policies (Continued)
loans. Internal risk ratings are a key factor in identifying loans that are individually evaluated for impairment and impact management's estimates of loss factors used in determining the amount of the allowance for loan losses. Internal risk ratings are updated on a continuous basis.
Loans are considered impaired when, based on current information and events, it is probable the Company will be unable to collect all amounts due in accordance with the original contractual terms of the loan agreement, including scheduled principal and interest payments. If a loan is impaired, a specific valuation allowance is allocated, if necessary. Interest payments on impaired loans are typically applied to principal unless collectability of the principal amount is reasonably assured, in which case interest is recognized on a cash basis. Impaired loans, or portions thereof, are charged off when deemed uncollectible.
The Company's policy requires measurement of the allowance for an impaired collateral dependent loan based on the fair value of the collateral. Other loan impairments are measured based on the present value of expected future cash flows or the loan's observable market price. At December 31, 2013 and 2012, all significant impaired loans have been determined to be collateral dependent and the allowance for loss has been measured utilizing the estimated fair value of the collateral.
From time to time, the Company modifies its loan agreement with a borrower. A modified loan is considered a troubled debt restructuring when two conditions are met: (i) the borrower is experiencing financial difficulty and (ii) concessions are made by the Company that would not otherwise be considered for a borrower with similar credit risk characteristics. Modifications to loan terms may include a lower interest rate, a reduction of principal, or a longer term to maturity. All troubled debt restructurings are considered impaired loans. The Company reviews each troubled debt restructured loan and determines on a case by case basis if a specific allowance for loan loss is required. An allowance for loan loss allocation is based on either the present value of estimated future cash flows or the estimated fair value of the underlying collateral.
The Company has certain lending policies and procedures in place that are designed to maximize loan income with an acceptable level of risk. Management reviews and approves these policies and procedures on a regular basis and makes changes as appropriate. Management receives frequent reports related to loan originations, quality, concentrations, delinquencies, non-performing and potential problem loans. Diversification in the loan portfolio is a means of managing risk associated with fluctuations in economic conditions, both by type of loan and geography.
Commercial loans are underwritten after evaluating and understanding the borrower's ability to operate profitably and effectively. Underwriting standards are designed to determine whether the borrower possesses sound business ethics and practices and to evaluate current and projected cash flows to determine the ability of the borrower to repay their obligations as agreed. Commercial loans are primarily made based on the identified cash flows of the borrower and, secondarily, on the underlying collateral provided by the borrower. Most commercial loans are secured by the assets being financed or other business assets, such as accounts receivable or inventory, and include personal guarantees.
Real estate loans are also subject to underwriting standards and processes similar to commercial loans. These loans are underwritten primarily based on projected cash flows and, secondarily, as loans
F-48
VERITEX HOLDINGS, INC. AND SUBSIDIARY
Notes to Consolidated Financial Statements (Continued)
(Dollars in thousands, except for per share amounts)
1. Summary of Significant Accounting Policies (Continued)
secured by real estate. The repayment of real estate loans is generally largely dependent on the successful operation of the property securing the loans or the business conducted on the property securing the loan. Real estate loans may be more adversely affected by conditions in the real estate markets or in the general economy. The properties securing the Company's real estate portfolio are generally diverse in terms of type and geographic location, through the Dallas metropolitan area. This diversity helps reduce the exposure to adverse economic events that affect any single market or industry.
The Company utilizes methodical credit standards and analysis to supplement its policies and procedures in underwriting consumer loans. The Company's loan policy addresses types of consumer loans that may be originated and the collateral, if secured, which must be perfected. The relatively smaller individual dollar amounts of consumer loans that are spread over numerous individual borrowers also minimizes the Company's risk.
Certain Acquired Loans
As part of business acquisitions, the Company evaluated each of the acquired loans under ASC 310-30 to determine whether (i) there was evidence of credit deterioration since origination, and (ii) it was probable that the Company would not collect all contractually required payments receivable. The Company determined the best indicator of such evidence was an individual loan's payment status and/or whether a loan was determined to be classified based on a review of each individual loan. Therefore, generally each individual loan that should have been or was on non-accrual at the acquisition date and each individual loan that was deemed impaired were included subject to ASC 310-30 accounting. These loans were recorded at the discounted expected cash flows of the individual loan.
Loans which were evaluated under ASC 310-30, and where the timing and amount of cash flows can be reasonably estimated, were accounted for in accordance with ASC 310-30-35. The Company applies the interest method for these loans under this subtopic and the loans are excluded from non-accrual. If, at acquisition, the Company identified loans that they could not reasonably estimate cash flows or, if subsequent to acquisition, such cash flows could not be estimated, such loans would be included in non-accrual. These acquired loans are recorded at the allocated fair value, such that there is no carryover of the seller's allowance for loan losses. Such acquired loans are accounted for individually. The Company estimates the amount and timing of expected cash flows for each purchased loan, and the expected cash flows in excess of the allocated fair value is recorded as interest income over the remaining life of the loan (accretable yield). The excess of the loan's contractual principal and interest over expected cash flows is not recorded (non-accretable difference). Over the life of the loan, expected cash flows continue to be estimated. If the present value of expected cash flows is less than the carrying amount, a loss is recorded through the allowance for loan losses. If the present value of expected cash flows is greater than the carrying amount, any related allowance for loan loss is reversed, with the remaining yield being recognized prospectively through interest income.
Transfers of Financial Assets
Transfers of financial assets (generally consisting of sales of loans held for sale and loan participations with unaffiliated banks) are accounted for as sales, when control over the assets has been
F-49
VERITEX HOLDINGS, INC. AND SUBSIDIARY
Notes to Consolidated Financial Statements (Continued)
(Dollars in thousands, except for per share amounts)
1. Summary of Significant Accounting Policies (Continued)
relinquished. Control over transferred assets is deemed to be surrendered when the assets have been isolated from the Company, the transferee obtains the right (free of conditions that constrain it from taking advantage of that right) to pledge or exchange the transferred assets, and the Company does not maintain effective control over the transferred assets through an agreement to repurchase them before their maturity.
Bank Premises and Equipment
Buildings and improvements, furniture and equipment are carried at cost less accumulated depreciation computed using the straight-line method over the estimated useful lives of the respective assets as follows:
Buildings and improvements |
10 - 40 years | |
Leasehold improvements |
Term of lease | |
Furniture and equipment |
3 - 10 years |
Major replacements and betterments are capitalized while maintenance and repairs are charged to expense when incurred. Gains or losses on dispositions are reflected in operations as incurred.
Non-Marketable Equity Securities
The Bank is a member of its regional Federal Reserve Bank (FRB) and of the Federal Home Loan Bank system (FHLB). FHLB members are required to own a certain amount of stock based on the level of borrowings and other factors, and may invest in additional amounts. Both FRB and FHLB stock are carried at cost, restricted for sale, and periodically evaluated for impairment based on ultimate recovery of par value. Both cash and stock dividends are reported as income. Other non-marketable equity securities are carried at cost which approximates fair value.
Other Real Estate Owned
Other real estate owned represents properties acquired through or in lieu of loan foreclosure and are initially recorded at fair value less estimated costs to sell. At foreclosure, if the fair value, less estimated costs to sell, of the real estate acquired is less than the Bank's recorded investment in the related loan, a write-down is recognized through a charge to the allowance for loan losses. Any subsequent reduction in value is recognized by a charge to income. Operating and holding expenses of such properties, net of related income, and gains and losses on their disposition are included in noninterest expense.
Bank-Owned Life Insurance
The Company has purchased life insurance policies on certain employees. These bank-owned life insurance (BOLI) policies are recorded in the accompanying consolidated balance sheets at their cash surrender values. Income from these policies and changes in the cash surrender values are recorded in other income in the accompanying consolidated statements of income.
F-50
VERITEX HOLDINGS, INC. AND SUBSIDIARY
Notes to Consolidated Financial Statements (Continued)
(Dollars in thousands, except for per share amounts)
1. Summary of Significant Accounting Policies (Continued)
Goodwill and Intangible Assets
Goodwill resulting from a business combination represents the excess of the fair value of the consideration transferred over the fair value of the net assets acquired and liabilities assumed as of the acquisition date. Goodwill is not amortized but is reviewed for potential impairment annually on December 31 or when a triggering event occurs. The Company's goodwill test involves a two-step process. Under the first step, the estimation of fair value of the reporting unit is compared to its carrying value including goodwill. If step one indicates a potential impairment, the second step is performed to measure the amount of impairment, if any. If the carrying amount of the reporting goodwill exceeds the implied fair value of that goodwill, an impairment loss is recognized in an amount equal to that excess. Any such adjustments are reflected in our results of operations in the periods in which they become known. Intangible assets consist of core deposit intangibles and other intangible assets related to operating leases with favorable market terms acquired in business combinations. Intangible assets are initially recognized based on a valuation performed as of the acquisition date. Intangible assets are amortized over the average remaining life of the acquired intangible using the straight-line method. All indefinite lived intangible assets are tested annually for potential impairment or when triggering events occur. Intangible assets with definite lives are tested for impairment when a triggering event occurs. No impairment charges were recorded during the years ended December 31, 2013, 2012 and 2011.
Advertising
Advertising consists of the Company's advertising in its local market. Advertising is expensed as incurred.
Income Taxes
The Company files a consolidated income tax return with its subsidiary. Federal income tax expense or benefit is allocated on a separate return basis.
The Company accounts for income taxes using the asset and liability approach for financial accounting and reporting. Deferred tax assets and liabilities are reflected at currently enacted income tax rates applicable to the period in which the deferred tax assets and liabilities are expected to be realized or settled. As changes in tax laws or rates are enacted, deferred tax assets and liabilities are adjusted through the provision for income taxes. Valuation allowances are established when necessary to reduce deferred tax assets to the amount expected to be realized. Realization of deferred tax assets is dependent upon the generation of a sufficient level of future taxable income and recoverable taxes paid in prior years.
The Company may recognize the tax benefit of an uncertain tax position only if it is more likely than not that the tax position will be sustained upon examination by the taxing authorities based on the technical merits of the position. For tax positions meeting the more-likely-than-not threshold, the amount recognized in the financial statements would be the benefit that has a greater than 50% likelihood of being realized upon ultimate settlement with the relevant tax authority. For the years ended December 31, 2013 and 2012, management has determined there are no material uncertain tax positions.
F-51
VERITEX HOLDINGS, INC. AND SUBSIDIARY
Notes to Consolidated Financial Statements (Continued)
(Dollars in thousands, except for per share amounts)
1. Summary of Significant Accounting Policies (Continued)
When necessary, the Company would include interest assessed by taxing authorities in "Interest expense" and penalties related to income taxes in "Other expense" on its consolidated statements of income. The Company did not record any interest or penalties related to income tax for the years ended December 31, 2013, 2012 and 2011. The Company is no longer subject to U.S. federal income tax examinations by tax authorities for the years before 2010.
Fair Values of Financial Instruments
Fair values of financial instruments are estimated using relevant market information and other assumptions. Fair value estimates involve uncertainties and matters of significant judgment regarding interest rates, credit risk, prepayments and other factors, especially in the absence of broad markets for particular items. Changes in assumptions or in market conditions could significantly affect the estimates. The fair value estimates of existing on and off-balance sheet financial instruments do not include the value of anticipated future business or the value of assets and liabilities not considered financial instruments.
Stock Based Compensation
Compensation cost is recognized for stock options and stock awards issued to employees and directors, based on the fair value of these awards at the date of grant. A Black-Scholes model is utilized to estimate the fair value of stock options, while the market price of the Company's common stock at the date of grant is used for stock awards. Compensation cost is recognized over the required service period, generally defined as the vesting period. For awards with graded vesting, compensation cost is recognized on a straight-line basis over the requisite service period for the entire award.
Treasury Stock
Treasury stock is stated at cost, which is determined by the first-in, first-out method.
Comprehensive Income
Comprehensive income includes all changes in stockholders' equity during a period, except those resulting from transactions with stockholders. In addition to net income, comprehensive income includes the net effect of changes in the fair value of securities available for sale, net of tax. Comprehensive income is reported in the accompanying consolidated statements of comprehensive income.
ESOP
Shares of the Company's common stock purchased by the Veritex Community Bank Employee Stock Ownership Plan (ESOP) are held in a suspense account until released for allocation to participants. Shares released are allocated to each eligible participant based on the participant's 401(k) contribution made during that year.
Compensation expense is measured based upon the expected amount of the Company's discretionary contribution to the ESOP which is determined on an annual basis and is accrued ratably over the year. The Company's contributions to the ESOP are used to purchase shares of the
F-52
VERITEX HOLDINGS, INC. AND SUBSIDIARY
Notes to Consolidated Financial Statements (Continued)
(Dollars in thousands, except for per share amounts)
1. Summary of Significant Accounting Policies (Continued)
Company's common stock at the current market value as of the end of the calendar year. Shares become outstanding for earnings per share computations upon allocation. Dividends on allocated ESOP shares are charged to retained earnings and paid to participants of the ESOP.
Earnings Per Share
Earnings per share (EPS) are based upon the weighted-average shares outstanding. The table below sets forth the reconciliation between weighted average shares used for calculating basic and diluted EPS for the years ended December 31, 2013, 2012 and 2011:
| |
Years ended December 31, | |||||||||
|---|---|---|---|---|---|---|---|---|---|---|
| |
2013 | 2012 | 2011 | |||||||
Earnings (numerator) |
||||||||||
Net income for common stockholders |
$ | 3,408 | $ | 1,479 | $ | 109 | ||||
Less: preferred stock dividends |
60 | 100 | 76 | |||||||
| | | | | | | | | | | |
Net income allocated to common stockholders |
$ | 3,348 | $ | 1,379 | $ | 33 | ||||
| | | | | | | | | | | |
| | | | | | | | | | | |
Shares (denominator) |
||||||||||
Weighted average shares outstanding for basic EPS (thousands) |
5,788 | 5,641 | 5,041 | |||||||
Dilutive effect of employee stock-based awards |
61 | 37 | 27 | |||||||
| | | | | | | | | | | |
Adjusted weighted average shares outstanding |
5,849 | 5,678 | 5,068 | |||||||
| | | | | | | | | | | |
| | | | | | | | | | | |
Earnings per share: |
||||||||||
Basic |
$ | 0.58 | $ | 0.24 | $ | 0.01 | ||||
| | | | | | | | | | | |
| | | | | | | | | | | |
Diluted |
$ | 0.57 | $ | 0.24 | $ | 0.01 | ||||
| | | | | | | | | | | |
| | | | | | | | | | | |
For the year ended December 31, 2013, the Company excluded from diluted EPS weighted average shares of performance stock options representing the right to purchase 423,000 shares of the Company's common stock because the issuance of shares related to these options is contingent upon the satisfaction of certain conditions unrelated to earnings or market value and these conditions were not met. In addition, for the year ended December 31, 2013, the Company excluded from diluted EPS weighted average warrants representing the right to purchase 1,000 shares of the Company's common stock because the effect was anti-dilutive.
For the years ended December 31, 2012 and 2011, the Company excluded from diluted EPS weighted average shares of performance stock options representing the right to purchase 419,000 and 394,000 shares, respectively, of the Company's common stock because the issuance of shares related to these options is contingent upon the satisfaction of certain conditions unrelated to earnings or market value and these conditions were not met.
2. Recent Accounting Pronouncements
ASU 2011-11, "Balance Sheet (Topic 210)—Disclosures about Offsetting Assets and Liabilities." ASU 2011-11 amends Topic 210, "Balance Sheet," to require an entity to disclose both gross and net information about financial instruments, such as sales and repurchase agreements and reverse sale and
F-53
VERITEX HOLDINGS, INC. AND SUBSIDIARY
Notes to Consolidated Financial Statements (Continued)
(Dollars in thousands, except for per share amounts)
2. Recent Accounting Pronouncements (Continued)
repurchase agreements and securities borrowing/lending arrangements, and derivative instruments that are eligible for offset in the statement of financial position and/or subject to a master netting arrangement or similar agreement. ASU No. 2013-01, "Balance Sheet (Topic 210)—Clarifying the Scope of Disclosures about Offsetting Assets and Liabilities," clarifies that ordinary trade receivables are not within the scope of ASU 2011-11. ASU 2011-11, as amended by ASU 2013-01, became effective for fiscal years beginning on or after January 1, 2013. Adoption of this new guidance did not have a significant impact on the Company's consolidated financial statements.
ASU 2013-02, "Comprehensive Income (Topic 220)—Reporting of Amounts Reclassified Out of Accumulated Other Comprehensive Income." ASU 2013-02 amends recent guidance related to the reporting of comprehensive income to enhance the reporting of reclassifications out of accumulated other comprehensive income. ASU 2013-02 is effective for reporting periods beginning after December 15, 2013 and is not expected to have a significant impact on the Company's consolidated financial statements.
ASU 2014-04, "Receivables—Troubled Debt Restructurings by Creditors (Subtopic 310-40): Reclassification of Residential Real Estate Collateralized Consumer Mortgage Loans upon Foreclosure" amends ASC Sub-Topic 310-40 "Receivables—Troubled Debt Restructurings by Creditors." The amendments clarify that an in substance repossession or foreclosure occurs when the Company is considered to have received physical possession of residential real estate property collateralizing a mortgage loan, upon either (1) the creditor obtaining legal title to the residential real estate property upon completion of a foreclosure or (2) the borrower conveying all interest in the residential real estate property to the creditor to satisfy that loan through completion of a deed in lieu of foreclosure or through a similar legal agreement. The amendments in this update are effective for the annual periods beginning on or after December 15, 2014 and an entity can elect to adopt the amendments in this update using either a modified retrospective transition method or a prospective transition method as allowed in ASU No. 2014-04. The implementation of ASU No. 2014-04 is not expected to have a material effect on the Company's consolidated financial statements.
F-54
VERITEX HOLDINGS, INC. AND SUBSIDIARY
Notes to Consolidated Financial Statements (Continued)
(Dollars in thousands, except for per share amounts)
3. Investment Securities
Debt and equity securities have been classified in the consolidated balance sheets according to management's intent. The carrying amount of securities and their approximate fair values are as follows:
| |
December 31, 2013 | ||||||||||||
|---|---|---|---|---|---|---|---|---|---|---|---|---|---|
| |
Amortized Cost |
Gross Unrealized Gains |
Gross Unrealized Losses |
Fair Value | |||||||||
Available for Sale |
|||||||||||||
U.S. government agencies |
$ | 2,019 | $ | — | $ | 95 | $ | 1,924 | |||||
Corporate bonds |
1,445 | 35 | — | 1,480 | |||||||||
Municipal securities |
934 | 24 | — | 958 | |||||||||
Mortgage-backed securities |
24,898 | 220 | 187 | 24,931 | |||||||||
Collateralized mortgage obligations |
14,898 | 158 | 141 | 14,915 | |||||||||
Asset-backed securities |
1,370 | 26 | — | 1,396 | |||||||||
| | | | | | | | | | | | | | |
|
$ | 45,564 | $ | 463 | $ | 423 | $ | 45,604 | |||||
| | | | | | | | | | | | | | |
| | | | | | | | | | | | | | |
| |
December 31, 2012 | ||||||||||||
|---|---|---|---|---|---|---|---|---|---|---|---|---|---|
| |
Amortized Cost |
Gross Unrealized Gains |
Gross Unrealized Losses |
Fair Value | |||||||||
Available for Sale |
|||||||||||||
Corporate bonds |
$ | 1,435 | $ | 31 | $ | 4 | $ | 1,462 | |||||
Municipal securities |
904 | 40 | — | 944 | |||||||||
Mortgage-backed securities |
15,006 | 448 | — | 15,454 | |||||||||
Collateralized mortgage obligations |
9,867 | 193 | 15 | 10,045 | |||||||||
Asset-backed securities |
1,600 | 33 | — | 1,633 | |||||||||
| | | | | | | | | | | | | | |
|
$ | 28,812 | $ | 745 | $ | 19 | $ | 29,538 | |||||
| | | | | | | | | | | | | | |
| | | | | | | | | | | | | | |
The following tables disclose the Company's investment securities that have been in a continuous unrealized loss position for less than 12 months and those that have been in a continuous unrealized loss position for 12 or more months:
| |
December 31, 2013 | ||||||||||||||||||
|---|---|---|---|---|---|---|---|---|---|---|---|---|---|---|---|---|---|---|---|
| |
Less Than 12 Months | 12 Months or More | Totals | ||||||||||||||||
| |
Fair Value |
Unrealized Loss |
Fair Value |
Unrealized Loss |
Fair Value |
Unrealized Loss |
|||||||||||||
Available for Sale |
|||||||||||||||||||
U.S. government agencies |
$ | 1,924 | $ | 95 | $ | — | $ | — | $ | 1,924 | $ | 95 | |||||||
Mortgage-backed securities |
10,612 | 187 | — | — | 10,612 | 187 | |||||||||||||
Collateralized mortgage obligations |
10,222 | 140 | 46 | 1 | 10,268 | 141 | |||||||||||||
| | | | | | | | | | | | | | | | | | | | |
|
$ | 22,758 | $ | 422 | $ | 46 | $ | 1 | $ | 22,804 | $ | 423 | |||||||
| | | | | | | | | | | | | | | | | | | | |
| | | | | | | | | | | | | | | | | | | | |
F-55
VERITEX HOLDINGS, INC. AND SUBSIDIARY
Notes to Consolidated Financial Statements (Continued)
(Dollars in thousands, except for per share amounts)
3. Investment Securities (Continued)
| |
December 31, 2012 | ||||||||||||||||||
|---|---|---|---|---|---|---|---|---|---|---|---|---|---|---|---|---|---|---|---|
| |
Less Than 12 Months | 12 Months or More | Totals | ||||||||||||||||
| |
Fair Value |
Unrealized Loss |
Fair Value |
Unrealized Loss |
Fair Value |
Unrealized Loss |
|||||||||||||
Available for Sale |
|||||||||||||||||||
Corporate bonds |
$ | 496 | $ | 4 | $ | — | $ | — | $ | 496 | $ | 4 | |||||||
Collateralized mortgage obligations |
1,412 | 10 | 314 | 5 | 1,726 | 15 | |||||||||||||
| | | | | | | | | | | | | | | | | | | | |
|
$ | 1,908 | $ | 14 | $ | 314 | $ | 5 | $ | 2,222 | $ | 19 | |||||||
| | | | | | | | | | | | | | | | | | | | |
| | | | | | | | | | | | | | | | | | | | |
The number of investment positions in an unrealized loss position totaled 25 at December 31, 2013. The Company does not believe these unrealized losses are "other than temporary" as (i) the Company does not have the intent to sell investment securities prior to recovery and (ii) it is more likely than not that the Company will not have to sell these securities prior to recovery. The unrealized losses noted are interest rate related due to the level of interest rates at December 31, 2013. The Company has reviewed the ratings of the issuers and has not identified any issues related to the ultimate repayment of principal as a result of credit concerns on these securities.
The amortized costs and estimated fair values of securities available for sale, by contractual maturity, are shown below. Expected maturities will differ from contractual maturities because borrowers may have the right to call or prepay obligations with or without call or prepayments penalties. Mortgage-backed securities, collateralized mortgage obligations, and asset-backed securities typically are issued with stated principal amounts, and the securities are backed by pools of mortgage loans and other loans that have varying maturities. The term of mortgage-backed, collateralized mortgage obligations and asset-backed securities thus approximates the term of the underlying mortgages and loans and can vary significantly due to prepayments. Therefore, these securities are not included in the maturity categories below.
| |
December 31, 2013 | ||||||
|---|---|---|---|---|---|---|---|
| |
Available For Sale | ||||||
| |
Amortized Cost | Fair Value | |||||
Due in one year or less |
$ | — | $ | — | |||
Due from one year to five years |
2,379 | 2,438 | |||||
Due from five years to ten years |
2,019 | 1,924 | |||||
Due after ten years |
— | — | |||||
| | | | | | | | |
|
4,398 | 4,362 | |||||
Mortgage-backed securities |
24,898 |
24,931 |
|||||
Collateralized mortgage obligations |
14,898 | 14,915 | |||||
Asset-backed securities |
1,370 | 1,396 | |||||
| | | | | | | | |
|
$ | 45,564 | $ | 45,604 | |||
| | | | | | | | |
| | | | | | | | |
F-56
VERITEX HOLDINGS, INC. AND SUBSIDIARY
Notes to Consolidated Financial Statements (Continued)
(Dollars in thousands, except for per share amounts)
3. Investment Securities (Continued)
Proceeds from sales of investment securities available for sale and gross gains and losses for the years ended December 31, 2013, 2012, and 2011 were as follows:
| |
December 31, | |||||||||
|---|---|---|---|---|---|---|---|---|---|---|
| |
2013 | 2012 | 2011 | |||||||
Proceeds from sales |
$ | 120,000 | $ | 239,997 | $ | 90,224 | ||||
Gross realized gains |
— | — | 432 | |||||||
Gross realized losses |
— | — | 11 | |||||||
The majority of the investment securities sold during the years ending 2013 and 2012, were sold for tax planning purposes.
As further explained in Note 10, there was a blanket floating lien on certain securities to secure Federal Home Loan Bank advances as of December 31, 2013. There was approximately $10,000 in investment securities pledged to secure borrowings as of December 31, 2012.
4. Loans and Allowance for Loan Losses
Loans in the accompanying consolidated balance sheets are summarized as follows:
| |
December 31, | ||||||
|---|---|---|---|---|---|---|---|
| |
2013 | 2012 | |||||
Real estate: |
|||||||
Construction and land |
$ | 47,643 | $ | 41,497 | |||
Farmland |
11,656 | 6,281 | |||||
1 - 4 family residential |
86,908 | 71,875 | |||||
Multi-family residential |
11,862 | 12,997 | |||||
Nonfarm nonresidential |
171,451 | 134,449 | |||||
Commercial |
160,823 | 123,779 | |||||
Consumer |
4,927 | 6,858 | |||||
| | | | | | | | |
|
495,270 | 397,736 | |||||
| | | | | | | | |
Deferred loan fees |
(94 | ) | (220 | ) | |||
Allowance for loan losses |
(5,018 | ) | (3,238 | ) | |||
| | | | | | | | |
|
$ | 490,158 | $ | 394,278 | |||
| | | | | | | | |
| | | | | | | | |
Included in the net loan portfolio as of December 31, 2013 and 2012 is an accretable discount related to loans acquired within a business combination in the approximate amounts of $667 and $1,071, respectively. The discount is being accreted into income using the interest method over the life of the loans.
F-57
VERITEX HOLDINGS, INC. AND SUBSIDIARY
Notes to Consolidated Financial Statements (Continued)
(Dollars in thousands, except for per share amounts)
4. Loans and Allowance for Loan Losses (Continued)
As of December 31, 2013, the Company had total commercial real estate loans (CRE) representing 274% of total risk-based capital. Included in these amounts, the Company had construction, land development, and other land loans representing 83% of total risk-based capital at December 31, 2013. Sound risk management practices and appropriate levels of capital are essential elements of a sound commercial real estate lending program). Concentrations of CRE exposures add a dimension of risk that compounds the risk inherent in individual loans. Interagency guidance on CRE concentrations describes sound risk management practices, which include board and management oversight, portfolio management, management information systems, market analysis, portfolio stress testing and sensitivity analysis, credit underwriting standards, and credit risk review functions. Management believes it has implemented these practices in order to monitor its CRE lending program. An institution which has reported loans for construction, land development, and other land loans representing 100% or more of total risk-based capital, or total non-owner occupied commercial real estate loans representing 300% or more of the institution's total risk-based capital and the outstanding balance of commercial real estate loan portfolio has increased by 50% or more during the prior 36 months, may be identified for further supervisory analysis by regulators to assess the nature and risk posed by the concentration.
The majority of the loan portfolio is comprised of loans to businesses and individuals in the Dallas metropolitan area. This geographic concentration subjects the loan portfolio to the general economic conditions within this area. The risks created by this concentration have been considered by management in the determination of the adequacy of the allowance for loan losses. Management believes the allowance for loan losses was adequate to cover estimated losses on loans as of December 31, 2013 and 2012.
Non-Accrual and Past Due Loans
Loans are considered past due if the required principal and interest payments have not been received as of the date such payments were due. Loans are placed on non-accrual status when, in management's opinion, the borrower may be unable to meet payment obligations as they become due, as well as when required by regulatory provisions. Loans may be placed on non-accrual status regardless of whether or not such loans are considered past due. When interest accrual is discontinued, all unpaid accrued interest is reversed. Interest income is subsequently recognized only to the extent cash payments are received in excess of principal due. Loans are returned to accrual status when all the principal and interest amounts contractually due are brought current and future payments are reasonably assured.
F-58
VERITEX HOLDINGS, INC. AND SUBSIDIARY
Notes to Consolidated Financial Statements (Continued)
(Dollars in thousands, except for per share amounts)
4. Loans and Allowance for Loan Losses (Continued)
Non-accrual loans, excluding purchased credit impaired loans, aggregated by class of loans are as follows:
| |
December 31, | ||||||
|---|---|---|---|---|---|---|---|
| |
2013 | 2012 | |||||
Real estate: |
|||||||
Construction and land |
$ | 76 | $ | — | |||
Farmland |
— | — | |||||
1 - 4 family residential |
1,041 | 879 | |||||
Multi-family residential |
— | — | |||||
Nonfarm nonresidential |
— | 331 | |||||
Commercial |
— | — | |||||
Consumer |
— | 1 | |||||
| | | | | | | | |
|
$ | 1,117 | $ | 1,211 | |||
| | | | | | | | |
| | | | | | | | |
During the years ended December 31, 2013, 2012 and 2011, interest income not recognized on non-accrual loans was minimal.
An age analysis of past due loans, excluding purchased credit impaired loans, aggregated by class of loans, as of December 31, 2013 and 2012 is as follows:
| |
December 31, 2013 | |||||||||||||||||||||
|---|---|---|---|---|---|---|---|---|---|---|---|---|---|---|---|---|---|---|---|---|---|---|
| |
30 to 59 Days |
60 to 89 Days |
90 Days or Greater |
Total Past Due |
Total Current |
Total Loans |
Total 90 Days Past Due and Still Accruing |
|||||||||||||||
Real estate: |
||||||||||||||||||||||
Construction and land |
$ | 19 | $ | — | $ | 76 | $ | 95 | $ | 47,548 | $ | 47,643 | $ | — | ||||||||
Farmland |
— | — | — | — | 11,656 | 11,656 | — | |||||||||||||||
1 - 4 family residential |
168 | — | 1,041 | 1,209 | 85,699 | 86,908 | — | |||||||||||||||
Multi-family residential |
— | — | — | — | 11,862 | 11,862 | — | |||||||||||||||
Nonfarm nonresidential |
— | — | — | — | 171,451 | 171,451 | — | |||||||||||||||
Commercial |
94 | — | — | 94 | 160,729 | 160,823 | — | |||||||||||||||
Consumer |
34 | 9 | 9 | 52 | 4,875 | 4,927 | 9 | |||||||||||||||
| | | | | | | | | | | | | | | | | | | | | | | |
|
$ | 315 | $ | 9 | $ | 1,126 | $ | 1,450 | $ | 493,820 | $ | 495,270 | $ | 9 | ||||||||
| | | | | | | | | | | | | | | | | | | | | | | |
| | | | | | | | | | | | | | | | | | | | | | | |
F-59
VERITEX HOLDINGS, INC. AND SUBSIDIARY
Notes to Consolidated Financial Statements (Continued)
(Dollars in thousands, except for per share amounts)
4. Loans and Allowance for Loan Losses (Continued)
|
December 31, 2012 | |||||||||||||||||||||
|
30 to 59 Days |
60 to 89 Days |
90 Days or Greater |
Total Past Due |
Total Current |
Total Loans |
Total 90 Days Past Due and Still Accruing |
|||||||||||||||
Real estate: |
||||||||||||||||||||||
Construction and land |
$ | — | $ | — | $ | — | $ | — | $ | 41,497 | $ | 41,497 | $ | — | ||||||||
Farmland |
— | — | — | — | 6,281 | 6,281 | — | |||||||||||||||
1 - 4 family residential |
— | — | — | — | 71,875 | 71,875 | — | |||||||||||||||
Multi-family residential |
— | — | — | — | 12,997 | 12,997 | — | |||||||||||||||
Nonfarm nonresidential |
— | — | 331 | 331 | 134,118 | 134,449 | — | |||||||||||||||
Commercial |
17 | 16 | 80 | 113 | 123,666 | 123,779 | 80 | |||||||||||||||
Consumer |
34 | 1 | 13 | 48 | 6,810 | 6,858 | 13 | |||||||||||||||
| | | | | | | | | | | | | | | | | | | | | | | |
|
$ | 51 | $ | 17 | $ | 424 | $ | 492 | $ | 397,244 | $ | 397,736 | $ | 93 | ||||||||
| | | | | | | | | | | | | | | | | | | | | | | |
| | | | | | | | | | | | | | | | | | | | | | | |
Impaired Loans
Impaired loans are those loans where it is probable the Company will be unable to collect all amounts due in accordance with the original contractual terms of the loan agreement, including scheduled principal and interest payments. All troubled debt restructurings (TDRs) are considered impaired loans. Impaired loans are measured based on either the present value of expected future cash flows discounted at the loan's effective interest rate; the loan's observable market price; or the fair value of the collateral if the loan is collateral dependent. Substantially all of the Company's impaired loans are measured at the fair value of the collateral. Impaired loans, or portions thereof, are charged off when deemed uncollectible.
Impaired loans, including purchased credit impaired loans and troubled debt restructurings, at December 31, 2013 and 2012 are summarized in the following tables.
| |
December 31, 2013 | ||||||||||||||||||
|---|---|---|---|---|---|---|---|---|---|---|---|---|---|---|---|---|---|---|---|
| |
Unpaid Contractual Principal Balance |
Recorded Investment with No Allowance |
Recorded Investment With Allowance |
Total Recorded Investment |
Related Allowance |
Average Recorded Investment During Year |
|||||||||||||
Real estate: |
|||||||||||||||||||
Construction and land |
$ | 971 | $ | 645 | $ | — | $ | 645 | $ | — | $ | 871 | |||||||
Farmland |
— | — | — | — | — | — | |||||||||||||
1 - 4 family residential |
1,212 | 1,212 | — | 1,212 | — | 1,306 | |||||||||||||
Multi-family residential |
— | — | — | — | — | — | |||||||||||||
Nonfarm nonresidential |
1,900 | 1,900 | — | 1,900 | — | 1,462 | |||||||||||||
Commercial |
366 | 366 | — | 366 | — | 366 | |||||||||||||
Consumer |
32 | 32 | — | 32 | — | 28 | |||||||||||||
| | | | | | | | | | | | | | | | | | | | |
Total |
$ | 4,481 | $ | 4,155 | $ | — | $ | 4,155 | $ | — | $ | 4,033 | |||||||
| | | | | | | | | | | | | | | | | | | | |
| | | | | | | | | | | | | | | | | | | | |
F-60
VERITEX HOLDINGS, INC. AND SUBSIDIARY
Notes to Consolidated Financial Statements (Continued)
(Dollars in thousands, except for per share amounts)
4. Loans and Allowance for Loan Losses (Continued)
| |
December 31, 2012 | ||||||||||||||||||
|---|---|---|---|---|---|---|---|---|---|---|---|---|---|---|---|---|---|---|---|
| |
Unpaid Contractual Principal Balance |
Recorded Investment with No Allowance |
Recorded Investment With Allowance |
Total Recorded Investment |
Related Allowance |
Average Recorded Investment During Year |
|||||||||||||
Real estate: |
|||||||||||||||||||
Construction and land |
$ | 894 | $ | — | $ | 644 | $ | 644 | $ | 90 | $ | 644 | |||||||
Farmland |
— | — | — | — | — | — | |||||||||||||
1 - 4 family residential |
880 | — | 880 | 880 | 85 | 1,110 | |||||||||||||
Multi-family residential |
— | — | — | — | — | — | |||||||||||||
Nonfarm nonresidential |
1,074 | 1,074 | — | 1,074 | — | 2,109 | |||||||||||||
Commercial |
384 | 384 | — | 384 | — | 244 | |||||||||||||
Consumer |
29 | 29 | — | 29 | — | 2 | |||||||||||||
| | | | | | | | | | | | | | | | | | | | |
Total |
$ | 3,261 | $ | 1,487 | $ | 1,524 | $ | 3,011 | $ | 175 | $ | 4,109 | |||||||
| | | | | | | | | | | | | | | | | | | | |
| | | | | | | | | | | | | | | | | | | | |
Interest payments on impaired loans are typically applied to principal unless collectability of the principal amount is reasonably assured, in which case interest is recognized on a cash basis.
During the years ended December 31, 2013, 2012 and 2011, total interest income and cash-based interest income recognized on impaired loans was minimal.
Troubled Debt Restructuring
Modifications of terms for the Company's loans and their inclusion as troubled debt restructurings are based on individual facts and circumstances. Loan modifications that are included as troubled debt restructurings may involve a reduction of the stated interest rate of the loan, an extension of the maturity date at a stated rate of interest lower than the current market rate for new debt with similar risk, or deferral of principal payments, regardless of the period of the modification. The recorded investment in troubled debt restructurings was $4,078 and $2,681 as of December 31, 2013 and 2012.
F-61
VERITEX HOLDINGS, INC. AND SUBSIDIARY
Notes to Consolidated Financial Statements (Continued)
(Dollars in thousands, except for per share amounts)
4. Loans and Allowance for Loan Losses (Continued)
During the years ended December 31, 2013 and 2012, the terms of certain loans were modified as troubled debt restructurings as follows:
| |
|
|
2013 | ||||||||||||||||
|---|---|---|---|---|---|---|---|---|---|---|---|---|---|---|---|---|---|---|---|
| |
|
|
Post-Modification Outstanding Recorded Investment | ||||||||||||||||
| |
Number of Loans |
Pre- Modification Outstanding Recorded Investment |
Adjusted Interest Rate |
Extended Maturity |
Extended Maturity and Restructured Payments |
Extended Maturity, Restructured Payments and Adjusted Interest Rate |
|||||||||||||
Real estate loans: |
|||||||||||||||||||
Construction and land |
— | $ | — | $ | — | $ | — | $ | — | $ | — | ||||||||
Farmland |
— | — | — | — | — | — | |||||||||||||
1 - 4 family residential |
2 | 1,203 | — | 1,051 | — | 171 | |||||||||||||
Multi-family residential |
— | — | — | — | — | — | |||||||||||||
Nonfarm nonresidential |
1 | 1,180 | — | 1,180 | — | — | |||||||||||||
Commercial |
1 | 16 | — | — | 16 | — | |||||||||||||
Consumer |
1 | 6 | — | — | 6 | — | |||||||||||||
| | | | | | | | | | | | | | | | | | | | |
Total |
5 | $ | 2,405 | $ | — | $ | 2,231 | $ | 22 | $ | 171 | ||||||||
| | | | | | | | | | | | | | | | | | | | |
| | | | | | | | | | | | | | | | | | | | |
| |
|
|
2012 | ||||||||||||||||
|---|---|---|---|---|---|---|---|---|---|---|---|---|---|---|---|---|---|---|---|
| |
|
|
Post-Modification Outstanding Recorded Investment | ||||||||||||||||
| |
Number of Loans |
Pre- Modification Outstanding Recorded Investment |
Adjusted Interest Rate |
Extended Maturity |
Extended Maturity and Restructured Payments |
Extended Maturity, Restructured Payments and Adjusted Interest Rate |
|||||||||||||
Real estate loans: |
|||||||||||||||||||
Construction and land |
— | $ | — | $ | — | $ | — | $ | — | $ | — | ||||||||
Farmland |
— | — | — | — | — | — | |||||||||||||
1 - 4 family residential |
1 | 880 | — | — | 880 | — | |||||||||||||
Multi-family residential |
— | — | — | — | — | — | |||||||||||||
Nonfarm nonresidential |
1 | 750 | 750 | — | — | — | |||||||||||||
Commercial |
3 | 400 | 400 | — | — | — | |||||||||||||
Consumer |
1 | 29 | 29 | — | — | — | |||||||||||||
| | | | | | | | | | | | | | | | | | | | |
Total |
6 | $ | 2,059 | $ | 1,179 | $ | — | $ | 880 | $ | — | ||||||||
| | | | | | | | | | | | | | | | | | | | |
| | | | | | | | | | | | | | | | | | | | |
F-62
VERITEX HOLDINGS, INC. AND SUBSIDIARY
Notes to Consolidated Financial Statements (Continued)
(Dollars in thousands, except for per share amounts)
4. Loans and Allowance for Loan Losses (Continued)
All TDRs are measured individually for impairment. Of the five loans restructured during the year ended December 31, 2013, four are performing as agreed to the modified terms and one was on non-accrual status as of December 31, 2013. No specific allowance for loan losses is recorded for this loan as of December 31, 2013. Of the six loans restructured during the year ended December 31, 2012, five are performing as agreed to the modified terms and one was on non-accrual status as of December 31, 2012. Approximately $85 of the allowance for loan losses was related to this loan as of December 31, 2012.
Interest income recorded during 2013, 2012 and 2011 on the restructured loans and interest income that would have been recorded had the terms of the loan not been modified was immaterial.
There was one loan modified as a troubled debt restructured loan within the previous 12 months and for which there was a payment default during the year ended December 31, 2013. The loan was secured by real estate, and a portion of the collateral property was foreclosed upon subsequent to the default. A charge-off of approximately $85 was recorded against the allowance for loan losses. There were no loans modified as a troubled debt restructured loan within the previous 12 months and for which there was a payment default during the year ending December 31, 2012. A default for purposes of this disclosure is a troubled debt restructured loan in which the borrower is 90 days past due or results in the foreclosure and repossession of the applicable collateral.
The Company has not committed to lend additional amounts to customers with outstanding loans that were classified as TDRs as of December 31, 2013 or 2012.
Credit Quality Indicators
From a credit risk standpoint, the Company classifies its loans in one of four categories: (i) pass, (ii) special mention, (iii) substandard or (iv) doubtful. Loans classified as loss are charged-off.
The classifications of loans reflect a judgment about the risks of default and loss associated with the loan. The Company reviews the ratings on criticized credits monthly. Ratings are adjusted to reflect the degree of risk and loss that is felt to be inherent in each credit as of each monthly reporting period. All classified credits are evaluated for impairments. If impairment is determined to exist, a specific reserve is established. The Company's methodology is structured so that specific reserves are increased in accordance with deterioration in credit quality (and a corresponding increase in risk and loss) or decreased in accordance with improvement in credit quality (and a corresponding decrease in risk and loss).
Credits rated special mention show clear signs of financial weaknesses or deterioration in credit worthiness, however, such concerns are not so pronounced that the Company generally expects to experience significant loss within the short-term. Such credits typically maintain the ability to perform within standard credit terms and credit exposure is not as prominent as credits rated more harshly.
Credits rated substandard are those in which the normal repayment of principal and interest may be, or has been, jeopardized by reason of adverse trends or developments of a financial, managerial, economic or political nature, or important weaknesses which exist in collateral. A protracted workout on these credits is a distinct possibility. Prompt corrective action is therefore required to strengthen the Company's position, and/or to reduce exposure and to assure that adequate remedial measures are
F-63
VERITEX HOLDINGS, INC. AND SUBSIDIARY
Notes to Consolidated Financial Statements (Continued)
(Dollars in thousands, except for per share amounts)
4. Loans and Allowance for Loan Losses (Continued)
taken by the borrower. Credit exposure becomes more likely in such credits and a serious evaluation of the secondary support to the credit is performed.
Credits rated doubtful are those in which full collection of principal appears highly questionable, and which some degree of loss is anticipated, even though the ultimate amount of loss may not yet be certain and/or other factors exist which could affect collection of debt. Based upon available information, positive action by the Company is required to avert or minimize loss. Credits rated doubtful are generally also placed on non-accrual.
As of December 31, 2013 and 2012, the following summarizes the Company's internal ratings of its loans, including purchased credit impaired loans:
| |
December 31, 2013 | |||||||||||||||
|---|---|---|---|---|---|---|---|---|---|---|---|---|---|---|---|---|
| |
Pass | Special Mention |
Substandard | Doubtful | Total | |||||||||||
Real estate: |
||||||||||||||||
Construction and land |
$ | 46,998 | $ | — | $ | 645 | $ | — | $ | 47,643 | ||||||
Farmland |
11,656 | — | — | — | 11,656 | |||||||||||
1 - 4 family residential |
85,649 | — | 1,259 | — | 86,908 | |||||||||||
Multi-family residential |
11,862 | — | — | — | 11,862 | |||||||||||
Nonfarm nonresidential |
171,371 | — | 80 | — | 171,451 | |||||||||||
Commercial |
158,919 | 731 | 1,173 | — | 160,823 | |||||||||||
Consumer |
4,878 | 7 | 42 | — | 4,927 | |||||||||||
| | | | | | | | | | | | | | | | | |
Total |
$ | 491,333 | $ | 738 | $ | 3,199 | $ | — | $ | 495,270 | ||||||
| | | | | | | | | | | | | | | | | |
| | | | | | | | | | | | | | | | | |
| |
December 31, 2012 | |||||||||||||||
|---|---|---|---|---|---|---|---|---|---|---|---|---|---|---|---|---|
| |
Pass | Special Mention |
Substandard | Doubtful | Total | |||||||||||
Real estate: |
||||||||||||||||
Construction and land |
$ | 39,349 | $ | — | $ | 2,148 | $ | — | $ | 41,497 | ||||||
Farmland |
6,281 | — | — | — | 6,281 | |||||||||||
1 - 4 family residential |
71,821 | — | 54 | — | 71,875 | |||||||||||
Multi-family residential |
12,997 | — | — | — | 12,997 | |||||||||||
Nonfarm nonresidential |
132,330 | 1,787 | 332 | — | 134,449 | |||||||||||
Commercial |
123,407 | 201 | 171 | — | 123,779 | |||||||||||
Consumer |
6,570 | 14 | 274 | — | 6,858 | |||||||||||
| | | | | | | | | | | | | | | | | |
Total |
$ | 392,755 | $ | 2,002 | $ | 2,979 | $ | — | $ | 397,736 | ||||||
| | | | | | | | | | | | | | | | | |
| | | | | | | | | | | | | | | | | |
F-64
VERITEX HOLDINGS, INC. AND SUBSIDIARY
Notes to Consolidated Financial Statements (Continued)
(Dollars in thousands, except for per share amounts)
4. Loans and Allowance for Loan Losses (Continued)
An analysis of the allowance for loan losses for the years ended December 31, 2013, 2012, and 2011, is as follows:
| |
Year Ended December 31, | |||||||||
|---|---|---|---|---|---|---|---|---|---|---|
| |
2013 | 2012 | 2011 | |||||||
Balance at beginning of year |
$ | 3,238 | $ | 1,012 | $ | 166 | ||||
Provision charged to earnings |
1,883 | 2,953 | 960 | |||||||
Charge-offs |
(240 |
) |
(801 |
) |
(149 |
) |
||||
Recoveries |
137 | 74 | 35 | |||||||
| | | | | | | | | | | |
Net charge-offs |
(103 | ) | (727 | ) | (114 | ) | ||||
| | | | | | | | | | | |
Balance at end of year |
$ | 5,018 | $ | 3,238 | $ | 1,012 | ||||
| | | | | | | | | | | |
| | | | | | | | | | | |
The following tables summarize the activity in the allowance for loan losses by portfolio segment for the years ended December 31, 2013, 2012 and 2011:
| |
December 31, 2013 | ||||||||||||||||||
|---|---|---|---|---|---|---|---|---|---|---|---|---|---|---|---|---|---|---|---|
| |
Real Estate | |
|
|
|||||||||||||||
| |
Construction Land and Farmland |
Residential | Nonfarm Non- Residential |
Commercial | Consumer | Total | |||||||||||||
Balance at beginning of year |
$ | 455 | $ | 755 | $ | 1,028 | $ | 947 | $ | 53 | $ | 3,238 | |||||||
Provision charged to earnings |
205 | 240 | 698 | 716 | 24 | 1,883 | |||||||||||||
Charge-offs |
— |
(85 |
) |
— |
(110 |
) |
(45 |
) |
(240 |
) |
|||||||||
Recoveries |
— | 60 | — | 32 | 45 | 137 | |||||||||||||
| | | | | | | | | | | | | | | | | | | | |
Net charge-offs |
— | (25 | ) | — | (78 | ) | — | (103 | ) | ||||||||||
| | | | | | | | | | | | | | | | | | | | |
Balance at end of year |
$ | 660 | $ | 970 | $ | 1,726 | $ | 1,585 | $ | 77 | $ | 5,018 | |||||||
| | | | | | | | | | | | | | | | | | | | |
| | | | | | | | | | | | | | | | | | | | |
Period-end amount allocated to: |
|||||||||||||||||||
Specific reserves: |
|||||||||||||||||||
Impaired loans |
$ | — | $ | — | $ | — | $ | — | $ | — | $ | — | |||||||
Purchased credit impaired loans |
— | — | — | — | — | — | |||||||||||||
| | | | | | | | | | | | | | | | | | | | |
Total specific reserves |
— | — | — | — | — | — | |||||||||||||
| | | | | | | | | | | | | | | | | | | | |
General reserves |
660 | 970 | 1,726 | 1,585 | 77 | 5,018 | |||||||||||||
| | | | | | | | | | | | | | | | | | | | |
Total |
$ | 660 | $ | 970 | $ | 1,726 | $ | 1,585 | $ | 77 | $ | 5,018 | |||||||
| | | | | | | | | | | | | | | | | | | | |
| | | | | | | | | | | | | | | | | | | | |
F-65
VERITEX HOLDINGS, INC. AND SUBSIDIARY
Notes to Consolidated Financial Statements (Continued)
(Dollars in thousands, except for per share amounts)
4. Loans and Allowance for Loan Losses (Continued)
| |
December 31, 2012 | ||||||||||||||||||
|---|---|---|---|---|---|---|---|---|---|---|---|---|---|---|---|---|---|---|---|
| |
Real Estate | |
|
|
|||||||||||||||
| |
Construction Land and Farmland |
Residential | Nonfarm Non- Residential |
Commercial | Consumer | Total | |||||||||||||
Balance at beginning of year |
$ | 142 | $ | 215 | $ | 303 | $ | 317 | $ | 35 | $ | 1,012 | |||||||
Provision charged to earnings |
313 | 805 | 956 | 741 | 138 | 2,953 | |||||||||||||
Charge-offs |
— |
(265 |
) |
(231 |
) |
(172 |
) |
(133 |
) |
(801 |
) |
||||||||
Recoveries |
— | — | — | 61 | 13 | 74 | |||||||||||||
| | | | | | | | | | | | | | | | | | | | |
Net charge-offs |
— | (265 | ) | (231 | ) | (111 | ) | (120 | ) | (727 | ) | ||||||||
| | | | | | | | | | | | | | | | | | | | |
Balance at end of year |
$ | 455 | $ | 755 | $ | 1,028 | $ | 947 | $ | 53 | $ | 3,238 | |||||||
| | | | | | | | | | | | | | | | | | | | |
| | | | | | | | | | | | | | | | | | | | |
Period-end amount allocated to: |
|||||||||||||||||||
Specific reserves: |
|||||||||||||||||||
Impaired loans |
$ | — | $ | 85 | $ | — | $ | — | $ | — | $ | 85 | |||||||
Purchased credit impaired loans |
90 | — | — | — | — | 90 | |||||||||||||
| | | | | | | | | | | | | | | | | | | | |
Total specific reserves |
90 | 85 | — | — | — | 175 | |||||||||||||
| | | | | | | | | | | | | | | | | | | | |
General reserves |
365 | 670 | 1,028 | 947 | 53 | 3,063 | |||||||||||||
| | | | | | | | | | | | | | | | | | | | |
Total |
$ | 455 | $ | 755 | $ | 1,028 | $ | 947 | $ | 53 | $ | 3,238 | |||||||
| | | | | | | | | | | | | | | | | | | | |
| | | | | | | | | | | | | | | | | | | | |
| |
December 31, 2011 | ||||||||||||
|---|---|---|---|---|---|---|---|---|---|---|---|---|---|
| |
Real Estate | Commercial | Consumer | Total | |||||||||
Balance at beginning of year |
$ | 93 | $ | 69 | $ | 4 | $ | 166 | |||||
Provision charged to earnings |
599 | 322 | 39 | 960 | |||||||||
Charge-offs |
(54 |
) |
(77 |
) |
(18 |
) |
(149 |
) |
|||||
Recoveries |
22 | 3 | 10 | 35 | |||||||||
| | | | | | | | | | | | | | |
Net charge-offs |
(32 | ) | (74 | ) | (8 | ) | (114 | ) | |||||
| | | | | | | | | | | | | | |
Balance at end of year |
$ | 660 | $ | 317 | $ | 35 | $ | 1,012 | |||||
| | | | | | | | | | | | | | |
| | | | | | | | | | | | | | |
Period-end amount allocated to: |
|||||||||||||
Specific reserves: |
|||||||||||||
Impaired loans |
$ | — | $ | — | $ | — | $ | — | |||||
Purchased credit impaired loans |
— | — | — | — | |||||||||
| | | | | | | | | | | | | | |
Total specific reserves |
— | — | — | — | |||||||||
| | | | | | | | | | | | | | |
General reserves |
660 | 317 | 35 | 1,012 | |||||||||
| | | | | | | | | | | | | | |
Total |
$ | 660 | $ | 317 | $ | 35 | $ | 1,012 | |||||
| | | | | | | | | | | | | | |
| | | | | | | | | | | | | | |
F-66
VERITEX HOLDINGS, INC. AND SUBSIDIARY
Notes to Consolidated Financial Statements (Continued)
(Dollars in thousands, except for per share amounts)
4. Loans and Allowance for Loan Losses (Continued)
The Company's recorded investment in loans as of December 31, 2013 and 2012 related to the balance in the allowance for loan losses on the basis of the Company's impairment methodology is as follows:
| |
December 31, 2013 | ||||||||||||||||||
|---|---|---|---|---|---|---|---|---|---|---|---|---|---|---|---|---|---|---|---|
| |
Real Estate | |
|
|
|||||||||||||||
| |
Construction Land and Farmland |
Residential | Nonfarm Non- Residential |
Commercial | Consumer | Total | |||||||||||||
Loans individually evaluated for impairment |
$ | 645 | $ | 1,212 | $ | 1,900 | $ | 366 | $ | 32 | $ | 4,155 | |||||||
Loans collectively evaluated for impairment |
58,654 | 97,558 | 169,551 | 160,457 | 4,895 | 491,115 | |||||||||||||
| | | | | | | | | | | | | | | | | | | | |
Total |
$ | 59,299 | $ | 98,770 | $ | 171,451 | $ | 160,823 | $ | 4,927 | $ | 495,270 | |||||||
| | | | | | | | | | | | | | | | | | | | |
| | | | | | | | | | | | | | | | | | | | |
| |
December 31, 2012 | ||||||||||||||||||
|---|---|---|---|---|---|---|---|---|---|---|---|---|---|---|---|---|---|---|---|
| |
Real Estate | |
|
|
|||||||||||||||
| |
Construction Land and Farmland |
Residential | Nonfarm Non- Residential |
Commercial | Consumer | Total | |||||||||||||
Loans individually evaluated for impairment |
$ | 644 | $ | 880 | $ | 1,074 | $ | 384 | $ | 29 | $ | 3,011 | |||||||
Loans collectively evaluated for impairment |
47,134 | 83,992 | 133,375 | 123,395 | 6,829 | 394,725 | |||||||||||||
| | | | | | | | | | | | | | | | | | | | |
Total |
$ | 47,778 | $ | 84,872 | $ | 134,449 | $ | 123,779 | $ | 6,858 | $ | 397,736 | |||||||
| | | | | | | | | | | | | | | | | | | | |
| | | | | | | | | | | | | | | | | | | | |
The Company has acquired certain loans which experienced credit deterioration since origination (purchased credit impaired loans). Accretion on purchased credit impaired loans is based on estimated future cash flows, regardless of contractual maturity.
F-67
VERITEX HOLDINGS, INC. AND SUBSIDIARY
Notes to Consolidated Financial Statements (Continued)
(Dollars in thousands, except for per share amounts)
4. Loans and Allowance for Loan Losses (Continued)
The carrying amount of those loans as of December 31, 2013 and 2012 was as follows:
| |
December 31, | ||||||
|---|---|---|---|---|---|---|---|
| |
2013 | 2012 | |||||
Real estate: |
|||||||
Construction and land |
$ | 819 | $ | 894 | |||
Farmland |
— | — | |||||
1 - 4 family residential |
— | — | |||||
Multi-family residential |
— | — | |||||
Nonfarm nonresidential |
— | — | |||||
Commercial |
— | — | |||||
Consumer |
— | — | |||||
| | | | | | | | |
Unpaid principal balance |
$ | 819 | $ | 894 | |||
| | | | | | | | |
| | | | | | | | |
Carrying amount |
$ | 569 | $ | 644 | |||
| | | | | | | | |
| | | | | | | | |
For those purchased credit impaired loans disclosed above, the Company did not increase the allowance for loan losses during 2013 and there was no allowance for loan losses related to these loans as of December 31, 2013. During 2012, the Company increased the allowance for loan losses by approximately $138. There was approximately $90 of the allowance for loan losses related to these loans as of December 31, 2012. No allowance for loan losses was reversed during the years ended 2013, 2012 and 2011.
There were no loans purchased during the years ended December 31, 2013 and 2012.
Accretable yield, or income expected to be collected from purchased loans, for the years ended December 31, 2013, 2012, and 2011, was as follows:
| |
Year Ended December 31, | |||||||||
|---|---|---|---|---|---|---|---|---|---|---|
| |
2013 | 2012 | 2011 | |||||||
Balance at beginning of year |
$ | — | $ | — | $ | — | ||||
New loans purchased |
— | — | — | |||||||
Accretion of income |
— | (76 | ) | (180 | ) | |||||
Reclassifications from non-accretable difference |
— | 76 | 180 | |||||||
Disposals |
— | — | — | |||||||
| | | | | | | | | | | |
Balance at end of year |
$ | — | $ | — | $ | — | ||||
| | | | | | | | | | | |
| | | | | | | | | | | |
Income is not recognized on certain purchased credit impaired loans if the Company cannot reasonably estimate cash flows expected to be collected. Income on these loans is recognized using the asset recovery method. As of December 31, 2013 and 2012, there was only one purchased credit
F-68
VERITEX HOLDINGS, INC. AND SUBSIDIARY
Notes to Consolidated Financial Statements (Continued)
(Dollars in thousands, except for per share amounts)
4. Loans and Allowance for Loan Losses (Continued)
impaired loan remaining, which was accounted for using the cost recovery method. The carrying amounts of such loans were as follows:
| |
Year Ended December 31, | |||||||||
|---|---|---|---|---|---|---|---|---|---|---|
| |
2013 | 2012 | 2011 | |||||||
Loans purchased during the year |
$ | — | $ | — | $ | 1,875 | ||||
Loans at the end of the year |
$ | 569 | $ | 644 | $ | 2,149 | ||||
5. Bank Premises and Equipment
Bank premises and equipment in the accompanying consolidated balance sheets are summarized as follows:
| |
December 31, | ||||||
|---|---|---|---|---|---|---|---|
| |
2013 | 2012 | |||||
Building and improvements |
$ | 2,343 | $ | 2,334 | |||
Leasehold improvements |
2,873 | 2,800 | |||||
Land |
3,609 | 3,609 | |||||
Furniture, fixtures and equipment |
3,459 | 2,994 | |||||
| | | | | | | | |
|
12,284 | 11,737 | |||||
Less accumulated depreciation |
2,332 |
1,389 |
|||||
| | | | | | | | |
|
$ | 9,952 | $ | 10,348 | |||
| | | | | | | | |
| | | | | | | | |
The Company recorded expense of approximately $972, $764 and $535 for the years ended December 31, 2013, 2012 and 2011, respectively.
6. Non-marketable Equity Securities
Investments in non-marketable equity securities in the accompanying consolidated balance sheets are summarized as follows:
| |
December 31, | ||||||
|---|---|---|---|---|---|---|---|
| |
2013 | 2012 | |||||
Federal Home Loan Bank of Dallas stock |
$ | 827 | $ | 667 | |||
Federal Reserve Bank of Dallas stock |
1,837 | 1,872 | |||||
Other non-marketable equity securities |
50 | 50 | |||||
| | | | | | | | |
|
$ | 2,714 | $ | 2,589 | |||
| | | | | | | | |
| | | | | | | | |
F-69
VERITEX HOLDINGS, INC. AND SUBSIDIARY
Notes to Consolidated Financial Statements (Continued)
(Dollars in thousands, except for per share amounts)
7. Intangible Assets
Intangible assets in the accompanying consolidated balance sheets are summarized as follows:
| |
December 31, 2013 | |||||||||||
|---|---|---|---|---|---|---|---|---|---|---|---|---|
| |
Weighted Amortization Period |
Gross Intangible Asset |
Accumulated Amortization |
Net Intangible Asset |
||||||||
Core deposit intangibles |
6.0 years | $ | 2,380 | $ | 875 | $ | 1,505 | |||||
Other intangible assets |
5.9 years | 107 | 45 | 62 | ||||||||
| | | | | | | | | | | | | |
|
$ | 2,487 | $ | 920 | $ | 1,567 | ||||||
| | | | | | | | | | | | | |
| | | | | | | | | | | | | |
| |
December 31, 2012 | |||||||||||
|---|---|---|---|---|---|---|---|---|---|---|---|---|
| |
Weighted Amortization Period |
Gross Intangible Asset |
Accumulated Amortization |
Net Intangible Asset |
||||||||
Core deposit intangibles |
7.0 years | $ | 2,380 | $ | 581 | $ | 1,799 | |||||
Other intangible assets |
6.9 years | 107 | 31 | 76 | ||||||||
| | | | | | | | | | | | | |
|
$ | 2,487 | $ | 612 | $ | 1,875 | ||||||
| | | | | | | | | | | | | |
| | | | | | | | | | | | | |
For each of the years ended December 31, 2013 and 2012, amortization expense related to intangible assets totaled approximately $308. For the year ended December 31, 2011, amortization expense totaled approximately $232. The estimated aggregate future amortization expense for intangible assets remaining as of December 31, 2013 was as follows:
Year
|
Amount | |||
|---|---|---|---|---|
2014 |
$ | 305 | ||
2015 |
301 | |||
2016 |
297 | |||
2017 |
297 | |||
2018 |
206 | |||
Thereafter |
161 | |||
| | | | | |
|
$ | 1,567 | ||
| | | | | |
| | | | | |
8. Goodwill
Changes in the carrying amount of goodwill are summarized as follows:
| |
December 31, | ||||||
|---|---|---|---|---|---|---|---|
| |
2013 | 2012 | |||||
Beginning of year |
$ | 19,148 | $ | 19,148 | |||
Effect of acquisitions |
— | — | |||||
Impairment losses |
— | — | |||||
| | | | | | | | |
End of year |
$ | 19,148 | $ | 19,148 | |||
| | | | | | | | |
| | | | | | | | |
F-70
VERITEX HOLDINGS, INC. AND SUBSIDIARY
Notes to Consolidated Financial Statements (Continued)
(Dollars in thousands, except for per share amounts)
9. Deposits
Deposits in the accompanying consolidated balance sheets are summarized as follows:
| |
December 31, | ||||||
|---|---|---|---|---|---|---|---|
| |
2013 | 2012 | |||||
Noninterest-bearing demand accounts |
$ | 218,990 | $ | 170,497 | |||
Interest-bearing demand accounts |
40,178 | 35,057 | |||||
Savings accounts |
5,286 | 4,411 | |||||
Limited access money market accounts |
210,131 | 149,158 | |||||
Certificates of deposit, greater than $100,000 |
81,478 | 72,030 | |||||
Certificates of deposit, less than $100,000 |
17,875 | 16,749 | |||||
| | | | | | | | |
|
$ | 573,938 | $ | 447,902 | |||
| | | | | | | | |
| | | | | | | | |
As of December 31, 2013, the scheduled maturities of certificates of deposit were as follows:
Year
|
Amount | |||
|---|---|---|---|---|
2014 |
$ | 80,878 | ||
2015 |
11,720 | |||
2016 |
2,385 | |||
2017 |
2,021 | |||
2018 |
2,349 | |||
| | | | | |
|
$ | 99,353 | ||
| | | | | |
| | | | | |
The aggregate amount of demand deposit overdrafts that have been reclassified as loans was $47 and $79 as of December 31, 2013 and 2012, respectively.
10. Advances from the Federal Home Loan Bank
Advances from the Federal Home Loan Bank totaled approximately $15,000 and $10,000 at December 31, 2013 and 2012, respectively. As of December 31, 2013, the advances were collateralized by a blanket floating lien on certain securities and loans, had a weighted average rate of 0.80% and mature on various dates during 2016 and 2018. The Company had the availability to borrow additional funds of approximately $212,622 as of December 31, 2013.
11. Other Credit Extensions
As of December 31, 2013 and 2012, the Company maintained two credit facilities with commercial banks which provide federal funds credit extensions with an availability to borrow up to an aggregate amount of approximately $14,600 and $12,600, respectively. There were no borrowings against these lines as of December 31, 2013 or 2012.
As of December 31, 2013 and 2012, the Company maintained a secured line of credit with the Federal Reserve Bank with an availability to borrow approximately $127,088 and $83,314, respectively. Approximately $155,895 and $102,789 of commercial loans were pledged as collateral at December 31,
F-71
VERITEX HOLDINGS, INC. AND SUBSIDIARY
Notes to Consolidated Financial Statements (Continued)
(Dollars in thousands, except for per share amounts)
11. Other Credit Extensions (Continued)
2013 and 2012, respectively. There were no borrowings against this line as of December 31, 2013 or 2012.
12. Junior Subordinated Debentures and Subordinated Notes
Junior subordinated debentures and subordinated notes in the accompanying consolidated balance sheets are as follows:
| |
December 31, | ||||||
|---|---|---|---|---|---|---|---|
| |
2013 | 2012 | |||||
Junior subordinated debentures—Trust Securities with a rate of LIBOR plus 1.85% debentures payable to Parkway National Capital Trust 1 with stated maturity of 2036 |
$ | 3,093 | $ | 3,093 | |||
| | | | | | | | |
| | | | | | | | |
Subordinated notes—unsecured notes with a fixed rate of 6% payable to entities of an affiliate with stated maturity of 2023 (less discount of $21—effective interest rate of 6.025%) |
$ | 4,979 | $ | — | |||
| | | | | | | | |
| | | | | | | | |
In connection with the acquisition of Fidelity Resource Company during 2011, the Company assumed $3.1 million in fixed/floating rate junior subordinated debentures underlying common securities and preferred capital securities, or the Trust Securities, issued by Parkway National Capital Trust I, a statutory business trust and acquired wholly-owned subsidiary of the Company. The Company assumed the guarantor position and as such, unconditionally guarantees payment of accrued and unpaid distributions required to be paid on the Trust Securities subject to certain exceptions, the redemption price when a capital security is called for redemption and amounts due if a trust is liquidated or terminated.
The Company owns all of the outstanding common securities of the trust. The trust used the proceeds from the issuance of its Trust Securities to buy the debentures originally issued by Fidelity Resource Company. These debentures are the trust's only assets and the interest payments from the debentures finance the distributions paid on the Trust Securities.
The Trust Securities pay cumulative cash distributions quarterly at a rate per annum equal to the 3-month LIBOR plus 1.85% percent. The effective rate as of December 31, 2013 and 2012 was 2.10% and 2.19%, respectively. The Trust Securities are subject to mandatory redemption in whole or in part, upon repayment of the debentures at the stated maturity in the year 2036 or their earlier redemption, in each case at a redemption price equal to the aggregate liquidation preference of the Trust Securities plus any accumulated and unpaid distributions thereon to the date of redemption. Prior redemption is permitted under certain circumstances.
The Trust Securities qualify as Tier 1 capital, subject to regulatory limitations, under guidelines established by the Federal Reserve.
Subordinated Notes
During 2013 the Company issued, in the aggregate principal amount of $5,000, subordinated promissory notes (Notes) via a private offering. The Notes were issued to certain entities controlled by
F-72
VERITEX HOLDINGS, INC. AND SUBSIDIARY
Notes to Consolidated Financial Statements (Continued)
(Dollars in thousands, except for per share amounts)
12. Junior Subordinated Debentures and Subordinated Notes (Continued)
an affiliate of the Company for the purpose of using the proceeds to support the growth of the Company. The Notes are unsecured, with interest payable quarterly at a fixed rate of 6% per annum, and unpaid principal and interest due at the stated maturity in the year 2023. The Notes qualify as Tier 2 Capital, subject to regulatory limitations, under guidelines established by the Federal Reserve. In addition, the Notes may be redeemed in whole or in part on any interest payment date that occurs on or after December 23, 2018 subject to approval of the Federal Reserve in compliance with applicable statues and regulations.
In connection with the issuance of the Notes, the Company issued warrants to purchase 25,000 shares of common stock of the Company at $11 per share, exercisable at any time, in whole or in part, prior to December 31, 2023. The fair value of the warrants was calculated at $0.80 and is recorded as additional paid-in capital and the related debt discount is being accreted into interest expense.
13. Income Taxes
The provision for income taxes is summarized as follows:
| |
Year Ended December 31, | |||||||||
|---|---|---|---|---|---|---|---|---|---|---|
| |
2013 | 2012 | 2011 | |||||||
Income tax expense (benefit): |
||||||||||
Current |
$ | 2,491 | $ | 534 | $ | (179 | ) | |||
Deferred |
(714 | ) | (398 | ) | 192 | |||||
| | | | | | | | | | | |
|
$ | 1,777 | $ | 136 | $ | 13 | ||||
| | | | | | | | | | | |
| | | | | | | | | | | |
The table below reconciles income tax expense for the years ended December 31, 2013, 2012, and 2011 computed by applying the applicable U.S. Federal statutory income tax rate, reconciled to the tax expense computed at the effective income tax rate:
| |
Year Ended December 31, | |||||||||
|---|---|---|---|---|---|---|---|---|---|---|
| |
2013 | 2012 | 2011 | |||||||
Federal income tax expense rate at 34% |
$ | 1,763 | $ | 549 | $ | 42 | ||||
Stock option expense |
76 | 58 | 50 | |||||||
Bank-owned life insurance income |
(110 | ) | (52 | ) | — | |||||
Non-deductible dues and memberships |
48 | 44 | 33 | |||||||
Other |
— | 55 | (53 | ) | ||||||
Change in valuation allowance |
— | (518 | ) | (59 | ) | |||||
| | | | | | | | | | | |
Total income tax expense |
1,777 | 136 | 13 | |||||||
| | | | | | | | | | | |
Effective tax rate |
34.3 | % | 8.4 | % | 10.6 | % | ||||
| | | | | | | | | | | |
| | | | | | | | | | | |
F-73
VERITEX HOLDINGS, INC. AND SUBSIDIARY
Notes to Consolidated Financial Statements (Continued)
(Dollars in thousands, except for per share amounts)
13. Income Taxes (Continued)
Deferred income taxes reflect the net tax effects of temporary differences between the recorded amounts of assets and liabilities for financial reporting purposes, and the amounts used for income tax purposes. Significant components of the Company's deferred tax assets and liabilities are as follows:
| |
December 31, | ||||||
|---|---|---|---|---|---|---|---|
| |
2013 | 2012 | |||||
Deferred tax assets: |
|||||||
Net operating loss |
$ | 96 | $ | 197 | |||
Organizational costs |
183 | 203 | |||||
Allowance for loan losses |
1,619 | 1,183 | |||||
Deferred loan fees |
32 | 75 | |||||
Non-accrual interest |
62 | 48 | |||||
Capital loss carryforward |
85 | 85 | |||||
ORE write down for book purposes |
55 | 16 | |||||
Deferred rent expenses |
70 | 92 | |||||
Restricted stock |
84 | 50 | |||||
Accrued bonuses |
243 | — | |||||
Other |
134 | 141 | |||||
| | | | | | | | |
Total deferred tax assets |
2,663 | 2,090 | |||||
| | | | | | | | |
Deferred tax liabilities: |
|||||||
Net unrealized gain on securities available for sale |
14 | 247 | |||||
Core deposit intangibles |
512 | 612 | |||||
FHLB stock dividends |
26 | 25 | |||||
Bank premises and equipment |
1,118 | 1,160 | |||||
| | | | | | | | |
Total deferred tax liabilities |
1,670 | 2,044 | |||||
| | | | | | | | |
Net deferred tax asset |
$ | 993 | $ | 46 | |||
| | | | | | | | |
| | | | | | | | |
The net change in the valuation allowance for the year ended December 31, 2012 was approximately $518. Included in the accompanying consolidated balance sheets in other assets as of December 31, 2013 is a current tax receivable of approximately $292 and a net deferred tax asset of approximately $993. Included in the accompanying consolidated balance sheets in other assets as of December 31, 2012 was a current tax receivable of approximately $333 and a net deferred tax asset of approximately $46.
For federal income tax purposes, the Company has an operating loss carryforward of approximately $281 that will expire beginning in 2029.
14. Commitments and Contingencies
Litigation
The Company may from time to time be involved in legal actions arising from normal business activities. Management believes that these actions are without merit or that the ultimate liability, if any,
F-74
VERITEX HOLDINGS, INC. AND SUBSIDIARY
Notes to Consolidated Financial Statements (Continued)
(Dollars in thousands, except for per share amounts)
14. Commitments and Contingencies (Continued)
resulting from them will not materially affect the financial position or results of operations of the Company.
Operating Leases
The Company leases several of its banking facilities under operating leases expiring in various years through 2022. Minimum future rental payments under these non-cancelable operating leases in excess of one year as of December 31, 2013 for each of the next five years and in the aggregate are:
Year Ended December 31,
|
Amount | |||
|---|---|---|---|---|
2014 |
$ | 1,118 | ||
2015 |
991 | |||
2016 |
907 | |||
2017 |
904 | |||
2018 |
816 | |||
Thereafter |
2,468 | |||
| | | | | |
|
$ | 7,204 | ||
| | | | | |
| | | | | |
Rental expense was approximately $1,353, $1,205, and $661 for the years ended December 31, 2013, 2012 and 2011, respectively.
Certain of the operating leases above provide for renewal options at their fair value at the time of renewal. In the normal course of business, operating leases are generally renewed or replaced by other leases.
During 2012, the Company relocated its corporate office facilities and incurred an approximate loss of $102 for early contract termination of the leased space. All terminating costs were recorded in occupancy of bank premises in the accompanying consolidated statements of income with a corresponding deferral recorded in other liabilities in the accompanying consolidated balance sheets. As of December 31, 2013 and 2012, approximately $7 and $91, respectively, is remaining as a liability in the accompanying consolidated balance sheets.
15. Fair Value Disclosures
The authoritative guidance for fair value measurements defines fair value as the price that would be received to sell an asset or paid to transfer a liability in an orderly transaction between market participants. A fair value measurement assumes that the transaction to sell the asset or transfer the liability occurs in the principal market for the asset or liability or, in the absence of a principal market, the most advantageous market for the asset or liability. The price in the principal (or most advantageous) market used to measure the fair value of the asset or liability shall not be adjusted for transaction costs. An orderly transaction is a transaction that assumes exposure to the market for a period prior to the measurement date to allow for marketing activities that are usual and customary for transactions involving such assets and liabilities; it is not a forced transaction. Market participants are buyers and sellers in the principal market that are (i) independent, (ii) knowledgeable, (iii) able to transact and (iv) willing to transact.
F-75
VERITEX HOLDINGS, INC. AND SUBSIDIARY
Notes to Consolidated Financial Statements (Continued)
(Dollars in thousands, except for per share amounts)
15. Fair Value Disclosures (Continued)
The authoritative guidance requires the use of valuation techniques that are consistent with the market approach, the income approach and/or the cost approach. The market approach uses prices and other relevant information generated by market transactions involving identical or comparable assets and liabilities. The income approach uses valuation techniques to convert future amounts, such as cash flows or earnings, to a single present amount on a discounted basis. The cost approach is based on the amount that currently would be required to replace the service capacity of an asset (replacement costs). Valuation techniques should be consistently applied. Inputs to valuation techniques refer to the assumptions that market participants would use in pricing the asset or liability. Inputs may be observable, meaning those that reflect the assumptions market participants would use in pricing the asset or liability developed based on market data obtained from independent sources, or unobservable, meaning those that reflect the reporting entity's own assumptions about the assumptions market participants would use in pricing the asset or liability developed based on the best information available in the circumstances. In that regard, the authoritative guidance establishes a fair value hierarchy for valuation inputs that gives the highest priority to quoted prices in active markets for identical assets or liabilities and the lowest priority to unobservable inputs. The fair value hierarchy is as follows:
Level 1 Inputs. Unadjusted quoted prices in active markets for identical assets or liabilities that the reporting entity has the ability to access at the measurement date.
Level 2 Inputs. Inputs other than quoted prices included in Level 1 that are observable for the asset or liability, either directly or indirectly. These include quoted prices for similar assets or liabilities in active markets, quoted prices for identical or similar assets or liabilities in markets that are not active, inputs other than quoted prices that are observable for the asset or liability (for example, interest rates, volatilities, prepayment speeds, loss severities, credit risks and default rates) or inputs that are derived principally from or corroborated by observable market data by correlation or other means. Level 2 investments consist primarily of obligations of U.S. government sponsored enterprises and agencies, obligations of state and municipal subdivisions, corporate bonds and mortgage-backed securities.
Level 3 Inputs. Significant unobservable inputs that reflect an entity's own assumptions that market participants would use in pricing the assets or liabilities.
In general, fair value is based upon quoted market prices, where available. If such quoted market prices are not available, fair value is based upon internally developed models that primarily use, as inputs, observable market-based parameters. Valuation adjustments may be made to ensure that financial instruments are recorded at fair value. While management believes the Company's valuation methodologies are appropriate and consistent with other market participants, the use of different methodologies or assumptions to determine the fair value of certain financial instruments could result in a different estimate of fair value at the reporting date.
A description of the valuation methodologies used for instruments measured at fair value, as well as the general classification of such instruments pursuant to the valuation hierarchy, is set forth below.
Assets and liabilities measured at fair value on a recurring basis include the following:
Investment Securities Available For Sale: Securities classified as available for sale are reported at fair value utilizing Level 2 inputs. For those securities classified as Level 2, the Company obtains fair
F-76
VERITEX HOLDINGS, INC. AND SUBSIDIARY
Notes to Consolidated Financial Statements (Continued)
(Dollars in thousands, except for per share amounts)
15. Fair Value Disclosures (Continued)
value measurements from an independent pricing service. The fair value measurements consider observable data that may include dealer quotes, market spreads, cash flows, the U. S. Treasury yield curve, live trading levels, trade execution data, market consensus prepayments speeds, credit information and the bond's terms and conditions, among other things.
The following table summarizes assets measured at fair value on a recurring basis as of December 31, 2013 and 2012, segregated by the level of the valuation inputs within the fair value hierarchy utilized to measure fair value:
| |
Fair Value Measurements Using |
|
|||||||||||
|---|---|---|---|---|---|---|---|---|---|---|---|---|---|
| |
Level 1 Inputs |
Level 2 Inputs |
Level 3 Inputs |
Total Fair Value |
|||||||||
As of December 31, 2013: |
|||||||||||||
Investment securities available for sale |
$ | — | $ | 45,604 | $ | — | $ | 45,604 | |||||
As of December 31, 2012: |
|||||||||||||
Investment securities available for sale |
$ | — | $ | 29,538 | $ | — | $ | 29,538 | |||||
There were no liabilities measured at fair value on a recurring basis as of December 31, 2013 and 2012.
There were no transfers between Level 2 and Level 3 during the years ended December 31, 2013 and 2012.
Certain assets and liabilities are measured at fair value on a non-recurring basis; that is, the instruments are not measured at fair value on an ongoing basis but are subject to fair value adjustments in certain circumstances (for example, when there is evidence of impairment).
Assets measured at fair value on a non-recurring basis include impaired loans and other real estate owned. The fair value of impaired loans with specific allocations of the allowance for loan losses and other real estate owned is based upon recent real estate appraisals less estimated costs of sale. For residential real estate impaired loans and other real estate owned, appraised values are based on the comparative sales approach. For commercial and commercial real estate impaired loans and other real estate owned, appraisers may use either a single valuation approach or a combination of approaches such as comparative sales, cost or the income approach. A significant unobservable input in the income approach is the estimated income capitalization rate for a given piece of collateral. Adjustments to appraisals may be made to reflect local market conditions or other economic factors and may result in changes in the fair value of a given asset over time. As such, the fair value of impaired loans and other real estate owned are considered a Level 3 in the fair value hierarchy.
The Company recovers the carrying value of other real estate owned through the sale of the property. The ability to affect future sales prices is subject to market conditions and factors beyond the Company's control and may impact the estimated fair value of a property.
F-77
VERITEX HOLDINGS, INC. AND SUBSIDIARY
Notes to Consolidated Financial Statements (Continued)
(Dollars in thousands, except for per share amounts)
15. Fair Value Disclosures (Continued)
Appraisals for impaired loans and other real estate owned are performed by certified general appraisers whose qualifications and licenses have been reviewed and verified by the Company. Once reviewed, a member of the credit department reviews the assumptions and approaches utilized in the appraisal as well as the overall resulting fair value in comparisons to independent data sources such as recent market data or industry wide-statistics. On a periodic basis, the Company compares the actual selling price of collateral that has been sold to the most recent appraised value to determine what additional adjustments, if any, should be made to the appraisal value to arrive at fair value.
The following table summarizes assets measured at fair value on a non-recurring basis as of December 31, 2013 and 2012, segregated by the level of the valuation inputs within the fair value hierarchy utilized to measure fair value:
| |
Fair Value Measurements Using |
|
|||||||||||
|---|---|---|---|---|---|---|---|---|---|---|---|---|---|
| |
Level 1 Inputs |
Level 2 Inputs |
Level 3 Inputs |
Total Fair Value |
|||||||||
As of December 31, 2013: |
|||||||||||||
Assets: |
|||||||||||||
Impaired loans |
$ | — | $ | — | $ | 4,155 | $ | 4,155 | |||||
Other real estate owned |
$ | — | $ | — | $ | 1,797 | $ | 1,797 | |||||
As of December 31, 2012: |
|||||||||||||
Assets: |
|||||||||||||
Impaired loans |
$ | — | $ | — | $ | 2,836 | $ | 2,836 | |||||
Other real estate owned |
$ | — | $ | — | $ | 2,438 | $ | 2,438 | |||||
At December 31, 2013, impaired loans had a carrying value of $4,155, with no specific allowance for loan loss allocated. At December 31, 2012, impaired loans, which had a specific allowance for loan losses allocated, had a carrying amount of approximately $3,011, with a specific valuation allowance of approximately $175, resulting in no additional provision for loan losses for the year ended December 31, 2012.
Other real estate owned properties are measured for impairment using the fair value of the collateral less estimated cost to sell and had a carrying amount of approximately $1,959 and $2,687 reduced by approximately $162 and $48, for the years ended December 31, 2013 and 2012, respectively.
There were no liabilities measured at fair value on a non-recurring basis as of December 31, 2013 and 2012.
For Level 3 financial and nonfinancial assets and liabilities measured at fair value as of December 31, 2013 and 2012, the significant unobservable inputs used in the fair value measurements were as follows:
| December 31, 2013 | |||||||||||
|---|---|---|---|---|---|---|---|---|---|---|---|
Assets/Liabilities
|
Fair Value | Valuation Technique |
Unobservable Input(s) |
Weighted Average |
|||||||
Impaired loans |
$ | 4,155 | Collateral Method | Adjustments for selling costs | 8 | % | |||||
Other real estate owned |
$ | 1,797 | Collateral Method | Adjustments for selling costs | 8 | % | |||||
F-78
VERITEX HOLDINGS, INC. AND SUBSIDIARY
Notes to Consolidated Financial Statements (Continued)
(Dollars in thousands, except for per share amounts)
15. Fair Value Disclosures (Continued)
| December 31, 2012 | |||||||||||
|---|---|---|---|---|---|---|---|---|---|---|---|
Assets/Liabilities
|
Fair Value | Valuation Technique |
Unobservable Input(s) |
Weighted Average |
|||||||
Impaired loans |
$ | 2,836 | Collateral Method | Adjustments for selling costs | 8 | % | |||||
Other real estate owned |
$ | 2,438 | Collateral Method | Adjustments for selling costs | 8 | % | |||||
Fair Value of Financial Instruments
The Company is required under current authoritative guidance to disclose the estimated fair value of their financial instrument assets and liabilities including those subject to the requirements discussed above. For the Company, as for most financial institutions, substantially all of its assets and liabilities are considered financial instruments, as defined. Many of the Company's financial instruments, however, lack an available trading market as characterized by a willing buyer and willing seller engaging in an exchange transaction.
The estimated fair value amounts of financial instruments have been determined by the Company using available market information and appropriate valuation methodologies. However, considerable judgment is required to interpret data to develop the estimates of fair value. Accordingly, the estimates presented herein are not necessarily indicative of the amounts the Company could realize in a current market exchange. The use of different market assumptions and/or estimation methodologies may have a material effect on the estimated fair value amounts. In addition, reasonable comparability between financial institutions may not be likely due to the wide range of permitted valuation techniques and numerous estimates that must be made given the absence of active secondary markets for many of the financial instruments. This lack of uniform valuation methodologies also introduces a greater degree of subjectivity to these estimated fair values.
The methods and assumptions used by the Company in estimating fair values of financial instruments as disclosed herein in accordance with ASC Topic 825, Financial Instruments, other than for those measured at fair value on a recurring and nonrecurring basis discussed above, are as follows:
Cash and cash equivalents: The carrying amounts of cash and cash equivalents approximate their fair value.
Loans and loans held for sale: For variable-rate loans that reprice frequently and have no significant changes in credit risk, fair values are based on carrying values. Fair values for certain mortgage loans (for example, one-to-four family residential), commercial real estate and commercial loans are estimated using discounted cash flow analyses, using interest rates currently being offered for loans with similar terms to borrowers of similar credit quality.
Bank-owned life insurance: The carrying amounts of bank-owned life insurance approximate their fair value.
Non-marketable equity securities: The carrying value of restricted securities such as stock in the Federal Home Loan Bank of Dallas and Independent Bankers Financial Corporation approximates fair value.
Deposits: The fair values disclosed for demand deposits are, by definition, equal to the amount payable on demand at the reporting date (that is their carrying amounts). The carrying amounts of
F-79
VERITEX HOLDINGS, INC. AND SUBSIDIARY
Notes to Consolidated Financial Statements (Continued)
(Dollars in thousands, except for per share amounts)
15. Fair Value Disclosures (Continued)
variable-rate certificates of deposit (CDs) approximate their fair values at the reporting date. Fair values for fixed-rate CDs are estimated using a discounted cash flow calculation that applies interest rates currently being offered on certificates to a schedule of aggregated expected monthly maturities on time deposits.
Advances from Federal Home Loan Bank: The fair value of advances maturing within 90 days approximates carrying value. Fair value of other advances is based on the Company's current borrowing rate for similar arrangements.
Junior subordinated debentures and subordinated notes: The fair values are based upon prevailing rates on similar debt in the market place.
Accrued interest: The carrying amounts of accrued interest approximate their fair values due to short term maturity.
Off-balance sheet instruments: Commitments to extend credit and standby letters of credit are generally priced at market at the time of funding and were not material to the Company's consolidated financial statements.
The estimated fair values and carrying values of all financial instruments under current authoritative guidance as of December 31, 2013 and 2012 were as follows:
| |
December 31, | ||||||||||||
|---|---|---|---|---|---|---|---|---|---|---|---|---|---|
| |
2013 | 2012 | |||||||||||
| |
Carrying Amount |
Fair Value |
Carrying Amount |
Fair Value |
|||||||||
Financial assets: |
|||||||||||||
Level 2 inputs: |
|||||||||||||
Cash and cash equivalents |
$ | 76,646 | $ | 76,646 | $ | 53,160 | $ | 53,160 | |||||
Securities available for sale |
45,604 | 45,604 | 29,538 | 29,538 | |||||||||
Loans held for sale |
2,051 | 2,051 | 2,818 | 2,818 | |||||||||
Accrued interest receivable |
1,351 | 1,351 | 1,201 | 1,201 | |||||||||
Bank-owned life insurance |
10,475 | 10,475 | 5,152 | 5,152 | |||||||||
Non-marketable equity securities |
2,714 | 2,714 | 2,589 | 2,589 | |||||||||
Level 3 inputs: |
|||||||||||||
Loans, net |
490,158 | 490,344 | 394,278 | 398,427 | |||||||||
Financial liabilities: |
|||||||||||||
Level 2 inputs: |
|||||||||||||
Deposits |
$ | 573,938 | $ | 568,451 | $ | 447,902 | $ | 443,033 | |||||
Advances from FHLB |
15,000 | 15,055 | 10,000 | 10,000 | |||||||||
Accrued interest payable |
134 | 134 | 148 | 148 | |||||||||
Junior subordinated debentures |
3,093 | 3,093 | 3,093 | 3,093 | |||||||||
Subordinated notes |
4,979 | 4,979 | — | — | |||||||||
F-80
VERITEX HOLDINGS, INC. AND SUBSIDIARY
Notes to Consolidated Financial Statements (Continued)
(Dollars in thousands, except for per share amounts)
16. Financial Instruments with Off-Balance Sheet Risk
The Company is a party to financial instruments with off-balance sheet risk in the normal course of business to meet the financing needs of its customers. These financial instruments include commitments to extend credit and standby letters of credit. Those instruments involve, to varying degrees, elements of credit risk in excess of the amount recognized in the consolidated balance sheets.
The Company's exposure to credit loss in the event of nonperformance by the other party to the financial instrument for commitments to extend credit and standby letters of credit is represented by the contractual amount of those instruments. The Company uses the same credit policies in making commitments and conditional obligations as it does for on balance sheet instruments.
The following table sets forth the approximate amounts of these financial instruments as of December 31, 2013 and 2012:
| |
December 31, | ||||||
|---|---|---|---|---|---|---|---|
| |
2013 | 2012 | |||||
Commitments to extend credit |
$ | 92,827 | $ | 76,252 | |||
Standby letters of credit |
210 | 222 | |||||
| | | | | | | | |
|
$ | 93,037 | $ | 76,474 | |||
| | | | | | | | |
| | | | | | | | |
Commitments to extend credit are agreements to lend to a customer as long as there is no violation of any condition established in the contract. Commitments generally have fixed expiration dates or other termination clauses and may require payment of a fee. Since many of the commitments may expire without being drawn upon, the total commitment amounts do not necessarily represent future cash requirements. Management evaluates each customer's creditworthiness on a case-by-case basis. The amount of collateral obtained, if deemed necessary upon extension of credit, is based on management's credit evaluation of the borrower.
Standby letters of credit are conditional commitments issued by the Company to guarantee the performance of a customer to a third party. Standby letters of credit generally have fixed expiration dates or other termination clauses and may require payment of a fee. The credit risk involved in issuing letters of credit is essentially the same as that involved in extending loan facilities to customers. The Company's policy for obtaining collateral and the nature of such collateral is essentially the same as that involved in making commitments to extend credit.
Although the maximum exposure to loss is the amount of such commitments, management currently anticipates no material losses from such activities.
17. Employee Benefits
The Company maintains a retirement savings 401(k) profit sharing plan (Plan) in which substantially all employees may participate. The Plan provides for "before tax" employee contributions through salary reductions under section 401(k) of the Internal Revenue Code. The Company may make a discretionary match of employees' contributions based on a percentage of salary deferrals and certain discretionary profit sharing contributions. No matching contributions to the Plan were made during the years ended December 31, 2013, 2012 and 2011.
Effective January 1, 2012, the Company adopted an Employee Stock Ownership Plan (ESOP) covering all employees that meet certain age and service requirements. Plan assets are held and managed by the Company. The Company accrued approximately $120 and $96 as of December 31, 2013 and 2012, respectively, to contribute to the ESOP. During the year ended December 31, 2013, the ESOP purchased 7811 shares of the Company's common stock and allocated the shares to the plan participants. The ESOP did not purchase shares during the year ended December 31, 2012
F-81
VERITEX HOLDINGS, INC. AND SUBSIDIARY
Notes to Consolidated Financial Statements (Continued)
(Dollars in thousands, except for per share amounts)
18. Stock Incentive Plan
In 2010, the Company adopted the 2010 Stock Option and Equity Incentive Plan (the Incentive Plan), which the Company's shareholders approved in 2011. The maximum number of shares of common stock that may be issued pursuant to grants or options under the Incentive Plan is 1,000,000. The Incentive Plan is administered by the Board of Directors and provides for both the direct award of stock and the grant of stock options to eligible directors, officers, employees and outside consultants of the Company or its affiliates as defined in the Incentive Plan. The Company may grant either incentive stock options or nonqualified stock options as directed in the Incentive Plan.
The Board authorized that the Incentive Plan provide for the award of 100,000 shares of direct stock awards (restricted shares) and 900,000 shares of stock options, of which 500,000 shares are performance-based stock options. Options are generally granted with an exercise price equal to the market price of the Company's stock at the date of the grant; those option awards generally vest based on 5 years of continuous service and have 10-year contractual terms for non-controlling participants as defined by the Incentive Plan, and forfeiture of unexercised options upon termination of employment with the Company. Other grant terms can vary for controlling participants as defined by the Incentive Plan. Restricted share awards generally vest after 4 years of continuous service. The terms of the Incentive Plan include a provision whereby all unearned non-performance options and restricted shares become immediately exercisable and fully vested upon a change in control. The vesting of a performance-based stock option is contingent upon a change of control and the achievement of specific performance criteria or other objectives set at the grant date.
During 2013, the Company awarded 1,000 restricted shares, 10,000 nonperformance-based stock options and 10,000 performance-based stock options. During 2012, the Company awarded 16,000 restricted shares, 57,500 nonperformance-based stock options and 62,500 performance-based stock options.
Stock based compensation expense is measured based upon the fair market value of the award at the grant date and is recognized ratably over the period during which the shares are earned (the requisite service period). For the years ended December 31, 2013, 2012 and 2011, approximately $323, $255 and $207, respectively, was recognized in the accompanying consolidated statements of income. As of December 31, 2013, there was approximately $1,670 of unrecognized compensation expense related to non-vested share-based compensation awards that is expected to be recognized over the remaining requisite service periods of the options granted.
The fair value of each option award is estimated on the grant date using the Black-Scholes option-pricing model with the following assumptions used for the grants:
| |
December 31, | |||
|---|---|---|---|---|
| |
2013 | 2012 | ||
Dividend yield |
0.00% | 0.00% | ||
Expected life |
10 years | 10 years | ||
Expected volatility |
4.00% | 4.00% | ||
Risk-free interest rate |
2.05% to 2.75% | 1.47% to 2.03% | ||
The expected life is based on the expected amount of time that options granted are expected to be outstanding. The dividend yield assumption is based on the Company's history. The expected volatility
F-82
VERITEX HOLDINGS, INC. AND SUBSIDIARY
Notes to Consolidated Financial Statements (Continued)
(Dollars in thousands, except for per share amounts)
18. Stock Incentive Plan (Continued)
is based on historical volatility of the Company. The risk-free interest rates are based upon yields of U.S. Treasury issues with a term equal to the expected life of the option being valued.
A summary of option activity under the Incentive Plan as of December 31, 2013 and 2012, and changes during the years then ended is presented below:
| |
2013 | |||||||||||||||
|---|---|---|---|---|---|---|---|---|---|---|---|---|---|---|---|---|
| |
Nonperformance-based stock options | Performance-based stock options | ||||||||||||||
| |
Shares Underlying Options |
Weighted Exercise Price |
Weighted Average Contractual Term |
Shares Underlying Options |
Weighted Average Exercise Price |
Weighted Average Contractual Term |
||||||||||
Outstanding at beginning of year |
332,500 | $ | 10.00 | 8.18 years | 432,500 | $ | 10.00 | 8.0 years | ||||||||
| | | | | | | | | | | | | | | | | |
| | | | | | | | | | | | | | | | | |
Granted during the year |
10,000 | 10.85 | 10,000 | 10.85 | ||||||||||||
Forfeited during the year |
(15,000 | ) | 10.00 | (20,000 | ) | 10.00 | ||||||||||
Exercised during the year |
— | — | — | — | ||||||||||||
| | | | | | | | | | | | | | | | | |
Outstanding at the end of year |
327,500 | $ | 10.03 | 7.69 years | 422,500 | $ | 10.02 | 8.0 years | ||||||||
| | | | | | | | | | | | | | | | | |
| | | | | | | | | | | | | | | | | |
Options exercisable at end of year |
115,500 | $ | 10.00 | 7.02 years | — | $ | — | — | ||||||||
| | | | | | | | | | | | | | | | | |
| | | | | | | | | | | | | | | | | |
Weighted average fair value of options granted during the year |
$ | 2.51 | $ | 2.51 | ||||||||||||
| | | | | | | | | | | | | | | | | |
| | | | | | | | | | | | | | | | | |
| |
2012 | |||||||||||||||
|---|---|---|---|---|---|---|---|---|---|---|---|---|---|---|---|---|
| |
Nonperformance-based stock options | Performance-based stock options | ||||||||||||||
| |
Shares Underlying Options |
Weighted Exercise Price |
Weighted Average Contractual Term |
Shares Underlying Options |
Weighted Average Exercise Price |
Weighted Average Contractual Term |
||||||||||
Outstanding at beginning of year |
302,500 | $ | 10.00 | 9.08 years | 397,500 | $ | 10.00 | 9.08 years | ||||||||
| | | | | | | | | | | | | | | | | |
| | | | | | | | | | | | | | | | | |
Granted during the year |
57,500 | 10.00 | 62,500 | 10.00 | ||||||||||||
Forfeited during the year |
(27,500 | ) | 10.00 | (27,500 | ) | 10.00 | ||||||||||
Exercised during the year |
— | — | — | — | ||||||||||||
| | | | | | | | | | | | | | | | | |
Outstanding at the end of year |
332,500 | $ | 10.00 | 8.18 years | 432,500 | $ | 10.00 | 8.0 years | ||||||||
| | | | | | | | | | | | | | | | | |
| | | | | | | | | | | | | | | | | |
Options exercisable at end of year |
55,000 | $ | 10.00 | 7.83 years | — | $ | — | — | ||||||||
| | | | | | | | | | | | | | | | | |
| | | | | | | | | | | | | | | | | |
Weighted average fair value of options granted during the year |
$ | 1.61 | $ | 1.59 | ||||||||||||
| | | | | | | | | | | | | | | | | |
| | | | | | | | | | | | | | | | | |
As of December 31, 2013 and 2012, the aggregate intrinsic value was $939 and $283, respectively, for outstanding nonperformance-based options and $335 and $47, respectively, for exercisable nonperformance-based stock options.
As of December 31, 2013 and 2012, the aggregate intrinsic value was $1,216 and $368, respectively for performance-based stock options. No performance-based stock options were exercisable as of December 31, 2013 and 2012.
F-83
VERITEX HOLDINGS, INC. AND SUBSIDIARY
Notes to Consolidated Financial Statements (Continued)
(Dollars in thousands, except for per share amounts)
18. Stock Incentive Plan (Continued)
As of December 31, 2013, 2012, and 2011, there was $1,520, $1,699, and $1,631, respectively, of total unrecognized compensation expense related to non-vested option shares, of which $402, $555, and $609, respectively, was related to the nonperformance-based stock options. The nonperformance-based stock option expense will be recognized over the remaining weighted average requisite service period of 2.33 years. Expense associated with the performance-based stock options is based on the probability of future changes in control and other market conditions. During 2013, management determined that one performance condition had been met and expensed a portion of the performance-based option expense. Total unrecognized compensation expense related to these performance-based options as of December 31, 2013 was approximately $349, and is expected to be recognized over the remaining weighted average requisite service period of 7 years. Management does not anticipate meeting the other market conditions in the foreseeable future; therefore, no performance-based stock option expense related to these conditions was recorded for the year ended December 31, 2013.
A summary of the status of the Company's restricted shares as of December 31, 2013 and 2012, and changes during the years then ended is as follows:
| |
2013 | 2012 | |||||||||||
|---|---|---|---|---|---|---|---|---|---|---|---|---|---|
| |
Shares | Weighted Average Grant Date Fair Value |
Shares | Weighted Average Grant Date Fair Value |
|||||||||
Nonvested at January 1, |
40,000 | $ | 10.00 | 26,000 | $ | 10.00 | |||||||
Granted during the year |
1,000 | 10.85 | 16,000 | 10.00 | |||||||||
Vested during the year |
— | — | — | — | |||||||||
Forfeited during the year |
(6,000 | ) | 10.00 | (2,000 | ) | 10.00 | |||||||
| | | | | | | | | | | | | | |
Nonvested at December 31, |
35,000 | $ | 10.02 | 40,000 | $ | 10.00 | |||||||
| | | | | | | | | | | | | | |
| | | | | | | | | | | | | | |
As of December 31, 2013, 2012 and 2011, there was $150, $239 and $176, respectively, of total unrecognized compensation expense related to nonvested restricted shares. The compensation expense is expected to be recognized over the remaining weighted average requisite service period of 1.81 years.
19. Significant Concentrations of Credit Risk
Most of the Company's business activity is with customers located within the Dallas Metropolitan area. Such customers are normally also depositors of the Company.
The distribution of commitments to extend credit approximates the distribution of loans outstanding. Commercial and standby letters of credit were granted primarily to commercial borrowers.
The contractual amounts of credit related financial instruments such as commitments to extend credit, credit card arrangements, and letters of credit represent the amounts of potential accounting loss should the contract be fully drawn upon, the customer default, and the value of any existing collateral become worthless.
F-84
VERITEX HOLDINGS, INC. AND SUBSIDIARY
Notes to Consolidated Financial Statements (Continued)
(Dollars in thousands, except for per share amounts)
20. Related Party Transactions
In the ordinary course of business, the Company has and expects to continue to have transactions, including borrowings, with its employees, officers, directors and their affiliates. In the opinion of management, such transactions are on the same terms, including interest rates and collateral requirements, as those prevailing at the time for comparable transactions with unaffiliated persons. The aggregate amounts of such loans were approximately $16,699 and $18,384 as of December 31, 2013 and 2012, respectively. During the year ended December 31, 2013, new advances of approximately $7,102 were made with approximately $8,787 principal payments received. There were $8,787 and $1,213 in unfunded commitments to related parties as of December 31, 2013 and 2012, respectively.
Deposits received from related parties as of December 31, 2013 and 2012 totaled approximately $15,511 and $6,873, respectively.
As disclosed in Note 12, the Company issued $5,000 in subordinated notes to two entities controlled by a certain affiliate of the Company.
21. Preferred Stock
In connection with the acquisition of Fidelity Resources Company, the Company acquired 3,000 shares of Fidelity Resources Company Fixed Rate Cumulative Perpetual Preferred Stock, Series A (Series A Preferred Stock) with a liquidation preference of $1 per share for $3,000 and 150 warrant shares issued to the U.S. Treasury Department (Treasury) in connection with the Troubled Asset Relief Program (TARP) Capital Purchase Program established as part of the Emergency Economic Stabilization Act of 2008. The Series A Preferred Stock initially paid quarterly dividends at a five percent annual rate that was to increase to nine percent after five years from issuance. The warrant shares were issued in the form of 150 shares of Fixed Rate Cumulative Perpetual Preferred Stock, Series B (Series B Preferred Stock). The Series B Preferred Stock had an exercise price of $.01 per share with a liquidation preference of $1 per share for $150. The warrants were exercised immediately and the purchase discount was accreted using the level yield method. The Series B Preferred Stock paid quarterly dividends at a nine percent annual rate.
On August 25, 2011 the Company entered into a Small Business Lending Fund-Securities Purchase Agreement (SBLF Purchase Agreement) with the Secretary of the Treasury, pursuant to which the Company (i) sold 8,000 shares of the Company's Senior Non-Cumulative Perpetual Preferred Stock, Series C (the SBLF Preferred Stock) to the Secretary of the Treasury for a purchase price of $8,000. The issuance was pursuant to the SBLF program, a fund established under the Small Business Jobs Act of 2010 that was created to encourage lending to small business by providing capital to qualified community banks. As required by the SBLF Purchase Agreement, approximately $3,155 of the proceeds from the sale of the SBLF Preferred Stock were used to redeem the 3,000 shares of the Company's Series A Preferred Stock and the 150 shares of Series B Preferred Stock, issued to the Treasury, plus the accrued dividends owed the Treasury in connection with the TARP preferred shares.
The SBLF Preferred Stock qualifies as Tier 1 capital and pays non-cumulative dividends quarterly, on each January 1, April 1, July 1 and October 1. The dividend rate, as a percentage of the liquidation amount, can fluctuate on a quarterly basis during the first 10 quarters during which the SBLF Preferred Stock is outstanding, based upon changes in the level of "Qualified Small Business Lending" or "QBSL" (as defined in the SBLF Purchase Agreement) by the Bank. Based upon the increase in the
F-85
VERITEX HOLDINGS, INC. AND SUBSIDIARY
Notes to Consolidated Financial Statements (Continued)
(Dollars in thousands, except for per share amounts)
21. Preferred Stock (Continued)
Bank's level of QBSL over the baseline level calculated under the terms of the SBLF Purchase Agreement, the dividend rate for the initial dividend period for the Company was set at 1.00%. For the tenth calendar quarter through four and one half years after issuance, the dividend rate will be fixed and as of December 31, 2013 was set at one percent (1%) based upon the increase in QBSL as compared to the baseline. After four and one half years from issuance, the dividend rate will increase to 9% (including a quarterly lending incentive fee of 0.5%).
The SBLF Preferred Stock is non-voting, except in limited circumstances. In the event that the Company misses five dividend payments, whether or not consecutive, the holder of the SBLF Preferred Stock will have the right, but not the obligation, to appoint a representative as an observer on the Company's Board of Directors. The right expires when full dividends have been paid for four consecutive dividend periods. The SBLF Preferred Stock may be redeemed at any time at the Company's option, at a redemption price of 100% of the liquidation amount plus accrued but unpaid dividends to the date of redemption for the current period, subject to the approval of its federal banking regulator.
22. Capital Requirements and Restrictions on Retained Earnings
Under banking law, there are legal restrictions limiting the amount of dividends the Company can declare. Approval of the regulatory authorities is required if the effect of the dividends declared would cause regulatory capital of the Company to fall below specified minimum levels.
The Bank is subject to various regulatory capital requirements administered by federal banking agencies. Failure to meet minimum capital requirements can initiate certain mandatory and possibly additional discretionary actions by regulators that, if undertaken, could have a direct material effect on the Bank's financial statements. Under capital adequacy guidelines and the regulatory framework for prompt corrective action, the Bank must meet specific capital guidelines that involve quantitative measures of the Bank's assets, liabilities, and certain off balance sheet items as calculated under regulatory accounting practices. The Bank's capital amounts and classification are also subject to qualitative judgments by the regulators about components, risk weightings, and other factors.
Quantitative measures established by regulation to ensure capital adequacy require the Bank to maintain minimum amounts and ratios (set forth in the table below) of total and Tier 1 capital (as defined in the regulations) to risk weighted assets (as defined), and of Tier 1 capital (as defined) to average assets (as defined). Management believes, as of December 31, 2013 and 2012, that the Bank met all capital adequacy requirements to which it was subject.
As of December 31, 2013 and 2012, the Bank's capital ratios exceeded those levels necessary to be categorized as "well capitalized" under the regulatory framework for prompt corrective action. To be categorized as "well capitalized", the Bank must maintain minimum total risk-based, Tier 1 risk-based and Tier 1 leverage ratios as set forth in the table. There are no conditions or events since December 31, 2013 that management believes have changed the Bank's category.
F-86
VERITEX HOLDINGS, INC. AND SUBSIDIARY
Notes to Consolidated Financial Statements (Continued)
(Dollars in thousands, except for per share amounts)
22. Capital Requirements and Restrictions on Retained Earnings (Continued)
A comparison of the Company's and Bank's actual capital amounts and ratios to required capital amounts and ratios is presented in the following table:
| |
Actual | |
For Capital Adequacy Purposes |
|
To Be Well Capitalized Under Prompt Corrective Action Provisions |
||||||||||||||||||||||
|---|---|---|---|---|---|---|---|---|---|---|---|---|---|---|---|---|---|---|---|---|---|---|---|---|---|---|---|
| |
Amount | Ratio | |
Amount | |
Ratio | |
Amount | |
Ratio | |||||||||||||||||
As of December 31, 2013: |
|||||||||||||||||||||||||||
Total capital (to risk weighted assets) |
|||||||||||||||||||||||||||
Company |
$ | 59,100 | 11.74 | % | ³ | $ | 40,288 | ³ | 8.0 | % | ³ | N/A | ³ | N/A | |||||||||||||
Bank |
$ | 57,275 | 11.37 | % | ³ | $ | 40,296 | ³ | 8.0 | % | ³ | $ | 38,817 | ³ | 10.0 | % | |||||||||||
Tier 1 capital (to risk weighted assets) |
|||||||||||||||||||||||||||
Company |
$ | 49,103 | 9.75 | % | ³ | $ | 20,144 | ³ | 4.0 | % | ³ | N/A | ³ | N/A | |||||||||||||
Bank |
$ | 52,257 | 10.37 | % | ³ | $ | 20,148 | ³ | 4.0 | % | ³ | $ | 23,290 | ³ | 6.0 | % | |||||||||||
Tier 1 capital (to average assets) |
|||||||||||||||||||||||||||
Company |
$ | 49,103 | 8.06 | % | ³ | $ | 24,373 | ³ | 4.0 | % | ³ | N/A | ³ | N/A | |||||||||||||
Bank |
$ | 52,257 | 8.58 | % | ³ | $ | 24,369 | ³ | 4.0 | % | ³ | $ | 24,762 | ³ | 5.0 | % | |||||||||||
As of December 31, 2012: |
|
|
|
|
|||||||||||||||||||||||
Total capital (to risk weighted assets) |
|||||||||||||||||||||||||||
Company |
$ | 47,301 | 12.17 | % | ³ | $ | 31,085 | ³ | 8.0 | % | ³ | N/A | ³ | N/A | |||||||||||||
Bank |
$ | 45,360 | 11.69 | % | ³ | $ | 31,053 | ³ | 8.0 | % | ³ | $ | 38,817 | ³ | 10.0 | % | |||||||||||
Tier 1 capital (to risk weighted assets) |
|||||||||||||||||||||||||||
Company |
$ | 44,063 | 11.34 | % | ³ | $ | 15,543 | ³ | 4.0 | % | ³ | N/A | ³ | N/A | |||||||||||||
Bank |
$ | 42,122 | 10.85 | % | ³ | $ | 15,527 | ³ | 4.0 | % | ³ | $ | 23,290 | ³ | 6.0 | % | |||||||||||
Tier 1 capital (to average assets) |
|||||||||||||||||||||||||||
Company |
$ | 44,063 | 8.81 | % | ³ | $ | 20,013 | ³ | 4.0 | % | ³ | N/A | ³ | N/A | |||||||||||||
Bank |
$ | 42,122 | 8.51 | % | ³ | $ | 19,810 | ³ | 4.0 | % | ³ | $ | 24,762 | ³ | 5.0 | % | |||||||||||
23. Mergers and Acquisitions
The acquisitions described below were accounted for under the purchase method of accounting in accordance with FASB ASC 805, "Business Combinations". The purchased assets and assumed liabilities were recorded at their respective estimated fair values as of the date of acquisition with the excess of the cost of the acquisition over the fair value of the net tangible and intangible assets acquired recorded as goodwill. None of the goodwill is expected to be deducted for federal income tax purposes.
The operating results of the acquired companies are included with the Company's results of operations since their date of acquisition. There were no acquisitions during the years ended 2013 or 2012.
F-87
VERITEX HOLDINGS, INC. AND SUBSIDIARY
Notes to Consolidated Financial Statements (Continued)
(Dollars in thousands, except for per share amounts)
23. Mergers and Acquisitions (Continued)
2011 Business Combinations
During 2010, the Company entered into a definitive agreement to acquire Fidelity Resources Company, (FRC), a Texas bank holding company, and its wholly owned subsidiary, Fidelity Bank, a state chartered bank located in Dallas, Texas. On March 23, 2011, pursuant to the terms of the agreement, the Company purchased all of the issued and outstanding (i) common stock, $1.00 par value, (ii) Fixed Rate Cumulative Perpetual Preferred Stock, Series A, $0.01 par value and (iii) Fixed Rate Cumulative Perpetual Preferred Stock, Series B, $0.01 par value of FRC for approximately $23,860. The purchase price includes approximately $16,624 in cash and approximately $7,236 in an exchange of Company stock. Simultaneously with the merger, FRC was dissolved which resulted in the Company owning all of the stock of Fidelity. The fair value of $10 per share of the Company's common stock was determined based upon the sales price as stated in the Company's private offering which concluded on May 15, 2011.
During 2011, the Company through its banking subsidiary entered in an agreement and plan of merger to acquire Bank of Las Colinas (BOLC), a federal savings bank located in Irving, Texas. On October 26, 2011, pursuant to the terms of the agreement, the Company purchased all of the outstanding shares of BOLC for approximately $7,781 in cash.
The following table summarizes the fair value of the assets and liabilities acquired during 2011:
| |
Fidelity Bank March 23, 2011 |
Bank of Las Colinas October 26, 2011 |
|||||
|---|---|---|---|---|---|---|---|
Cash and cash equivalents |
$ | 36,665 | $ | 10,561 | |||
Investment securities |
4,256 | — | |||||
Non-marketable securities |
147 | 128 | |||||
Loans |
108,055 | 40,354 | |||||
Bank premises and equipment |
6,687 | 306 | |||||
Other real estate owned |
720 | — | |||||
Intangible assets |
1,079 | 498 | |||||
Goodwill |
7,752 | 987 | |||||
Other assets |
921 | 966 | |||||
| | | | | | | | |
Total assets acquired |
$ | 166,282 | $ | 53,800 | |||
| | | | | | | | |
| | | | | | | | |
Deposits |
$ | 138,657 | $ | 45,780 | |||
Junior subordinated debentures |
3,093 | — | |||||
Other liabilities |
672 | 239 | |||||
| | | | | | | | |
Total liabilities assumed |
$ | 142,422 | $ | 46,019 | |||
| | | | | | | | |
| | | | | | | | |
Net assets acquired |
$ | 23,860 | $ | 7,781 | |||
| | | | | | | | |
| | | | | | | | |
As a result of the Fidelity Bank acquisition, the Company recorded the loan portfolio at a discount of approximately $1,913 based upon its fair value. The accretable discount is being accreted into income using the interest method over the life of the loans which have estimated remaining lives ranging from 3.6 to 4 years. The net effect on net income before taxes as of December 31, 2011 was
F-88
VERITEX HOLDINGS, INC. AND SUBSIDIARY
Notes to Consolidated Financial Statements (Continued)
(Dollars in thousands, except for per share amounts)
23. Mergers and Acquisitions (Continued)
approximately $415 and is included in interest income in the accompanying consolidated statements of income.
As a result of the Bank of Las Colinas acquisition, the Company recorded the loan portfolio at a discount of approximately $592 based upon its fair value. The accretable discount is being accreted into income using the interest method over the life of the loans which have estimated remaining lives ranging from 2.48 to 3.57 years. No accretion was recorded as of December 31, 2011.
As of their respective acquisition dates, the fair value of loans, not subject to the requirements of FASB ASC 310-30, acquired in the 2011 business combinations noted above was approximately $145,796. The gross contractual amounts receivable was approximately $164,707, of which management estimates the Company will not realize interest income of approximately $4,251 due to anticipated loan prepayments.
The Company incurred expenses related to the acquisitions of approximately $394 during the year ended December 31, 2011, which are included in legal and other professional fees in the consolidated statements of income.
Pro forma net income for the year ended December 31, 2011 would have been $927 and revenues would have been $19,540 had the acquisitions occurred as of January 1, 2011. The operations of Fidelity Bank and Bank of Las Colinas were merged into Veritex Community Bank as of the date of acquisition. Separate revenue and earnings of the former Fidelity Bank and Bank of Las Colinas are not available subsequent to the business combination.
The acquisitions of Fidelity Bank and Bank of Las Colinas are consistent with the Company's plan to enhance its competitive position in the Dallas, Texas metropolitan area. These acquisitions provided for expansion in the Greater Dallas, Texas markets specifically in North Dallas, Plano, and Irving areas. Fidelity Bank operated three branches and Bank of Las Colinas operated one, which all became branches of the Company's banking subsidiary. The Company believes it is well-positioned to deliver superior customer service, achieve stronger financial performance and enhance shareholder value through the synergies of combined operations, all of which contributed to the resulting goodwill associated with the transactions.
24. Subsequent Events
The Company has evaluated subsequent events through July 22, 2014, which was the date the consolidated financial statements were available to be issued and noted no subsequent events requiring financial statement recognition or disclosure, except as noted below.
During January 2014, the Company engaged in a private offering of up to 500,000 shares of its common stock, par value $0.01 per share, at $10.85 per share. As of February 21, 2014, the Company had issued 490,773 shares of the offering generating total proceeds of approximately $5,325 and had offering costs of approximately $60. The Company intends to use the proceeds from the offering to support the growth of the Company.
On January 2, 2014, the Company originated a loan in the approximate amount of $500 to the Company's Employee Stock Ownership Plan for the purpose of purchasing 46,082 shares of the Company's common stock.
F-89
VERITEX HOLDINGS, INC. AND SUBSIDIARY
Notes to Consolidated Financial Statements (Continued)
(Dollars in thousands, except for per share amounts)
25. Parent Company Only Financial Statements
The following balance sheets, statements of income and statements of cash flows for Veritex Holdings, Inc. should be read in conjunction with the consolidated financial statements and the notes thereto.
| |
December 31, | ||||||
|---|---|---|---|---|---|---|---|
| |
2013 | 2012 | |||||
Assets |
|||||||
Cash and cash equivalents |
$ | 2,018 | $ | 1,166 | |||
Investment in subsidiaries |
72,579 | 63,104 | |||||
Other assets |
300 | 689 | |||||
| | | | | | | | |
Total assets |
$ | 74,897 | $ | 64,959 | |||
| | | | | | | | |
| | | | | | | | |
Liabilities and Stockholders' Equity |
|||||||
Other liabilities |
$ | 586 | $ | 6 | |||
Other borrowings |
8,072 | 3,093 | |||||
| | | | | | | | |
Total liabilities |
8,658 | 3,099 | |||||
| | | | | | | | |
Stockholders' equity |
|||||||
Preferred stock |
8,000 | 8,000 | |||||
Common stock |
58 | 57 | |||||
Additional paid-in capital |
55,303 | 53,750 | |||||
Retained earnings (accumulated deficit) |
2,922 | (426 | ) | ||||
Less: Treasury stock |
(70 | ) | — | ||||
Less: Accumulated other comprehensive income |
26 | 479 | |||||
| | | | | | | | |
Total stockholders' equity |
66,239 | 61,860 | |||||
| | | | | | | | |
Total liabilities and stockholders' equity |
$ | 74,897 | $ | 64,959 | |||
| | | | | | | | |
| | | | | | | | |
F-90
VERITEX HOLDINGS, INC. AND SUBSIDIARY
Notes to Consolidated Financial Statements (Continued)
(Dollars in thousands, except for per share amounts)
25. Parent Company Only Financial Statements (Continued)
| |
Years Ended December 31, | |||||||||
|---|---|---|---|---|---|---|---|---|---|---|
| |
2013 | 2012 | 2011 | |||||||
Interest income: |
||||||||||
Other |
$ | 2 | $ | 8 | $ | 5 | ||||
Interest expense: |
||||||||||
Interest on borrowings |
63 | 73 | 162 | |||||||
| | | | | | | | | | | |
Net interest expense |
(61 | ) | (65 | ) | (157 | ) | ||||
Noninterest expense: |
||||||||||
Salaries and employee benefits |
162 | — | 15 | |||||||
Professional fees |
76 | 50 | 432 | |||||||
Other |
— | — | 14 | |||||||
| | | | | | | | | | | |
Total noninterest expense |
238 | 50 | 461 | |||||||
| | | | | | | | | | | |
Loss before income tax benefit and equity in undistributed |
||||||||||
Income of subsidiaries |
(299 | ) | (115 | ) | (618 | ) | ||||
Income tax benefit |
(102 | ) | (504 | ) | (210 | ) | ||||
| | | | | | | | | | | |
(Loss) Income before equity in undistributed income of subsidiaries |
(197 | ) | 389 | (408 | ) | |||||
Equity in undistributed income of subsidiaries |
3,605 | 1,090 | 517 | |||||||
| | | | | | | | | | | |
Net income |
$ | 3,408 | $ | 1,479 | $ | 109 | ||||
| | | | | | | | | | | |
| | | | | | | | | | | |
F-91
VERITEX HOLDINGS, INC. AND SUBSIDIARY
Notes to Consolidated Financial Statements (Continued)
(Dollars in thousands, except for per share amounts)
25. Parent Company Only Financial Statements (Continued)
| |
Years Ended December 31, | |||||||||
|---|---|---|---|---|---|---|---|---|---|---|
| |
2013 | 2012 | 2011 | |||||||
Cash flows from operating activities: |
||||||||||
Net income |
$ | 3,408 | $ | 1,479 | $ | 109 | ||||
Adjustments to reconcile net income to net cash provided by |
||||||||||
(used in) operating activities: |
||||||||||
Equity in undistributed net income of Bank |
(3,605 | ) | (1,090 | ) | (517 | ) | ||||
Decrease (increase) in other assets |
389 | (428 | ) | (30 | ) | |||||
Increase (decrease) in other liabilities |
580 | (26 | ) | 30 | ||||||
| | | | | | | | | | | |
Net cash provided by (used in) operating activities |
772 | (65 | ) | (408 | ) | |||||
| | | | | | | | | | | |
Cash flows from investing activities: |
||||||||||
Capital investment in subsidiaries |
(6,000 | ) | (1,000 | ) | (6,700 | ) | ||||
Acquisition of Fidelity Resource Company |
— | — | (16,615 | ) | ||||||
| | | | | | | | | | | |
Net cash used in investing activities |
(6,000 | ) | (1,000 | ) | (23,315 | ) | ||||
| | | | | | | | | | | |
Cash flows from financing activities: |
||||||||||
Proceeds from issuance of preferred stock Series C |
— | — | 8,000 | |||||||
Redemption of preferred stock Series A and B |
— | — | (3,150 | ) | ||||||
Proceeds from issuance of common stock, net |
1,210 | 1,398 | 12,776 | |||||||
Purchase of common stock held in treasury |
(70 | ) | — | — | ||||||
Dividends paid on preferred stock |
(60 | ) | (100 | ) | (76 | ) | ||||
Issuance of subordinated notes |
5,000 | — | — | |||||||
| | | | | | | | | | | |
Net cash provided by financing activities |
6,080 | 1,298 | 17,550 | |||||||
| | | | | | | | | | | |
Net increase (decrease) in cash and cash equivalents |
852 | 233 | (6,173 | ) | ||||||
Cash and cash equivalents at beginning of year |
1,166 | 933 | 7,106 | |||||||
| | | | | | | | | | | |
Cash and cash equivalents at end of year |
$ | 2,018 | $ | 1,166 | $ | 933 | ||||
| | | | | | | | | | | |
| | | | | | | | | | | |
F-92
2,700,000 Shares
Veritex Holdings, Inc.
Common Stock
PROSPECTUS
| Sandler O'Neill + Partners, L.P. | Stephens Inc. | |
Sterne Agee |
||
The date of this prospectus is , 2014
Until , 2014, all dealers that effect transactions in our common stock, whether or not participating in this offering, may be required to deliver a prospectus. This is in addition to the dealers' obligation to deliver a prospectus when acting as underwriters and with respect to any unsold allotments or subscriptions.
PART II
Information Not Required In Prospectus
ITEM 13. Other Expenses of Issuance and Distribution
The following table sets forth the costs and expenses, other than underwriting discounts and commissions, payable by Veritex Holdings, Inc., or the Registrant, in connection with the issuance and distribution of the securities being registered. All amounts shown are estimates, except the SEC registration fee, the FINRA filing fee and the stock exchange listing fees. All fees below are payable by the Registrant.
SEC registration fee |
$ | 5,599 | ||
FINRA filing fee |
6,500 | |||
NASDAQ listing fee |
25,000 | |||
Printing and engraving costs |
150,000 | |||
Legal fees and expenses |
700,000 | |||
Underwriter expenses |
450,000 | |||
Accountants' fees and expenses |
415,000 | |||
Transfer agent fees |
5,000 | |||
Miscellaneous |
99,553 | |||
| | | | | |
Total |
$ | 1,856,652 | ||
| | | | | |
| | | | | |
ITEM 14. Indemnification of Directors and Officers
At the time of this offering, the Registrant's amended and restated certificate of formation will provide that the Registrant's directors and officers will be indemnified by the Registrant to the fullest extent permitted by the Texas Business Organizations Code and applicable federal law and regulation against all expenses incurred in connection with their service for or on behalf of the Registrant.
At the time of this offering, the Registrant's amended and restated certificate of formation will provide that the personal liability of the directors and officers of the Registrant for monetary damages will be eliminated to the fullest extent permitted by the Texas Business Organizations Code and applicable federal laws and regulations.
At the time of this offering, the Registrant will have entered into indemnification agreements with the members of its board of directors and officers, each an "indemnitee." Each indemnification agreement requires the Registrant to indemnify each indemnitee as described above. The Registrant will also, among other things, advance costs and expenses subject to the condition that an indemnitee will reimburse the indemnitor for all amounts paid if a final judicial determination is made that the indemnitee is not entitled to be so indemnified under applicable law.
The Registrant also maintains directors' and officers' liability insurance.
The form of Underwriting Agreement to be filed as Exhibit 1.1 hereto obligates the underwriters to indemnify our directors, officers and controlling persons under limited circumstances against certain liabilities under the Securities Act.
ITEM 15. Recent Sales of Unregistered Securities
In the three years preceding the filing of this registration statement, the Registrant has issued the following securities:
- •
- Between July 1, 2011 and the filing of this registration statement, we sold 970,137 shares of our common stock in a series of private transactions to a total of 83 purchasers for aggregate consideration of $10.2 million;
II-1
- •
- Between July 1, 2011 and the filing of this registration statement, we sold 53,893 shares of our common stock to
our Employee Stock Ownership Plan for aggregate consideration of $584,739;
- •
- On August 25, 2011, we issued 8,000 shares of our Series C preferred stock, $1,000 liquidation value per
share, to the U.S. Treasury in connection with our participation in the U.S. Treasury's SBLF program for aggregate consideration of $8.0 million;
- •
- On December 23, 2013, we sold $5.0 million in aggregate principal amount of subordinated promissory notes
to two purchasers in a private transaction and, in connection therewith, we also issued to those investors warrants to purchase an aggregate of 25,000 shares of our common stock at an exercise price
of $11.00 per share; and
- •
- We periodically issue grants of certain equity based awards to our executive officers, directors and other key employees pursuant to our 2010 Stock Option Plan. Between July 1, 2011 and the filing of this registration statement, pursuant to such plan, we granted (i) options to purchase an aggregate of 253,000 shares of our common stock at exercise prices ranging from $10.00 to $12.90 per share and (ii) 45,500 shares of restricted common stock.
The issuances of securities described in the preceding paragraphs were made in reliance upon the exemption from registration under Section 4(2) or its successor 4(a)(2) of the Securities Act of 1933, as amended, or Rule 701 promulgated under Section 3(b) of the Securities Act as transactions by an issuer not involving any public offering or pursuant to benefit plans and contracts relating to compensation. All of the foregoing securities are deemed restricted securities for purposes of the Securities Act. The recipients of securities in the transactions exempt under Section 4(2) or its successor 4(a)(2) of the Securities Act represented their intention to acquire the securities for investment purposes only and not with a view to or for sale in connection with any distribution thereof and appropriate legends were affixed to the stock certificates and instruments issued in such transactions.
ITEM 16. Exhibits and Financial Statements Schedules
- (a)
- Exhibits
See the Exhibit Index on the page immediately following the signature page for a list of exhibits filed as part of this Registration Statement on Form S-1, which Exhibit Index is incorporated herein by reference.
- (b)
- Financial Statement Schedules
All schedules are omitted because the required information is either not present, not present in material amounts or is presented within the consolidated financial statements included in the prospectus that is part of this Registration Statement.
The undersigned Registrant hereby undertakes to provide to the underwriters at the closing specified in the underwriting agreement, certificates in such denominations and registered in such names as required by the underwriters to permit prompt delivery to each purchaser.
Insofar as indemnification for liabilities arising under the Securities Act may be permitted to the directors, officers and controlling persons of the Registrant pursuant to the foregoing provisions, or otherwise, the Registrant has been advised that in the opinion of the SEC such indemnification is against public policy as expressed in the Securities Act and is, therefore, unenforceable. In the event that a claim for indemnification against such liabilities (other than the payment by the Registrant of expenses incurred or paid by a director, officer or controlling person of the Registrant in the successful defense of any action, suit or proceeding) is asserted by such director, officer or controlling person in
II-2
connection with the securities being registered, the Registrant will, unless in the opinion of its counsel the matter has been settled by controlling precedent, submit to a court of appropriate jurisdiction the question whether such indemnification by it is against public policy as expressed in the Securities Act and will be governed by the final adjudication of such issue.
The undersigned Registrant hereby undertakes that:
(i) for purposes of determining any liability under the Securities Act, the information omitted from the form of prospectus filed as part of this Registration Statement in reliance upon Rule 430A and contained in a form of prospectus filed by the Registrant pursuant to Rule 424(b)(1) or (4) or 497(h) under the Securities Act shall be deemed to be part of this Registration Statement as of the time it was declared effective.
(ii) for the purpose of determining any liability under the Securities Act, each post-effective amendment that contains a form of prospectus shall be deemed to be a new Registration Statement relating to the securities offered therein, and the offering of such securities at that time shall be deemed to be the initial bona fide offering thereof.
II-3
Pursuant to the requirements of the Securities Act of 1933, as amended, the Registrant has duly caused this Amendment No. 2 to the Registration Statement on Form S-1 to be signed on its behalf by the undersigned, thereunto duly authorized, in the City of Dallas, State of Texas, on September 29, 2014.
| Veritex Holdings, Inc. | ||||||
By: |
/s/ C. MALCOLM HOLLAND, III |
|||||
| Name: | C. Malcolm Holland, III | |||||
| Title: | Chairman and Chief Executive Officer | |||||
Pursuant to the requirements of the Securities Act, this Amendment No. 2 to the Registration Statement has been signed below by the following persons in the capacities and on the dates indicated below.
Name
|
Title
|
Date
|
||||
|---|---|---|---|---|---|---|
| /s/ C. MALCOLM HOLLAND, III C. Malcolm Holland, III |
Chairman and Chief Executive Officer (Principal Executive Officer) |
September 29, 2014 | ||||
* William C. Murphy |
Vice Chairman |
September 29, 2014 |
||||
* Noreen E. Skelly |
Chief Financial Officer (Principal Financial and Principal Accounting Officer) |
September 29, 2014 |
||||
* Pat S. Bolin |
Director |
September 29, 2014 |
||||
* Blake Bozman |
Director |
September 29, 2014 |
||||
* Mark Griege |
Director |
September 29, 2014 |
||||
* Michael D. Ilagan |
Director |
September 29, 2014 |
||||
II-4
Name
|
Title
|
Date
|
||||
|---|---|---|---|---|---|---|
| * Michael Kowalski |
Director | September 29, 2014 | ||||
* John Sughrue |
Director |
September 29, 2014 |
||||
* Ray W. Washburne |
Director |
September 29, 2014 |
||||
*By: |
/s/ C. MALCOLM HOLLAND, III C. Malcolm Holland, III Attorney-in-Fact |
|||||
II-5
EXHIBIT INDEX
| Exhibit Number |
Description | ||
|---|---|---|---|
| 1.1 | ** | Form of Underwriting Agreement | |
| 3.1 | Second Amended and Restated Certificate of Formation of Veritex Holdings, Inc. | ||
| 3.2 | ** | Third Amended and Restated Bylaws of Veritex Holdings, Inc. | |
| 4.1 | Specimen Common Stock Certificate | ||
| 4.2 | ** | Form of Common Stock Purchase Warrant | |
| 4.3 | ** | Statement of Designations of Senior Non-Cumulative Perpetual Preferred Stock, Series C of Veritex Holdings, Inc., as filed with the Office of the Secretary of State of Texas on August 22, 2011. | |
| 4.4 | The other instruments defining rights of holders of the long-term debt securities of the Registrant and its subsidiaries are omitted pursuant to section (b)(4)(iii)(A) of Item 601 of Regulation S-K. The Registrant hereby agrees to furnish copies of these instruments to the SEC upon request. | ||
| 5.1 | Opinion of Bracewell & Giuliani LLP | ||
| 10.1 | ** | Retention and Nonsolicitation Agreement dated March 23, 2011 by and among Veritex Community Bank, Veritex Holdings, Inc. and William C. Murphy. | |
| 10.2 | ** | Change in Control Agreement dated June 18, 2012 by and among Veritex Community Bank, Veritex Holdings, Inc. and Noreen E. Skelly. | |
| 10.3 | ** | Veritex Holdings, Inc. First Amended 2010 Stock Option and Equity Incentive Plan (including form of stock option agreement and stock award agreement) | |
| 10.4 | ** | Omnibus Incentive Plan for Veritex Holdings, Inc. | |
| 10.5 | ** | Veritex Community Bank Employee Stock Ownership Plan Adoption Agreement dated December 31, 2012. | |
| 10.6 | ** | Securities Purchase Agreement dated August 25, 2011, by and between Veritex Holdings, Inc. and the U.S. Secretary of the Treasury. | |
| 10.7 | ** | Form of Subordinated Promissory Note, dated December 23, 2013 issued by Veritex Holdings, Inc. (including associated terms and conditions) | |
| 10.8 | Form of Director and Officer Indemnification Agreement | ||
| 10.9 | ** | Registration Rights Agreement among Veritex Holdings, Inc., SunTx Veritex Holdings, L.P. and WCM Parkway, Ltd. | |
| 10.10 | ** | Director Nomination Agreement among Veritex Holdings, Inc. and SunTx Veritex Holdings, L.P. | |
| 23.1 | Consent of Grant Thornton LLP | ||
| 23.2 | Consent of JonesBaggett LLP | ||
| 23.3 | Consent of Bracewell & Giuliani LLP (contained in its opinion filed as Exhibit 5.1 hereto) | ||
| 24.1 | ** | Powers of Attorney (included on signature page to the Registration Statement filed on August 29, 2014 and as exhibits 24.2 and 24.3 to the Registration Statement filed on September 22, 2014) | |
- *
- To
be filed by amendment.
- **
- Previously filed
II-6