Attached files
| file | filename |
|---|---|
| 8-K - 8-K - SOUTH JERSEY INDUSTRIES INC | a8k-sjiinvestorpresentatio.htm |
September 29 – October 1

Certain statements contained in this presentation may qualify as “forward-looking statements” within the meaning of Section 27A of the Securities Act of 1933 and Section 21E of the Securities Exchange Act of 1934. All statements other than statements of historical fact included in this Report should be considered forward-looking statements made in good faith by South Jersey Industries (SJI or the Company) and are intended to qualify for the safe harbor from liability established by the Private Securities Litigation Reform Act of 1995. When used in this presentation, or any other of the Company's documents or oral presentations, words such as “anticipate,” “believe,” “expect,” “estimate,” “forecast,” “goal,” “intend,” “objective,” “plan,” “project,” “seek,” “strategy” and similar expressions are intended to identify forward-looking statements. Such forward-looking statements are subject to risks and uncertainties that could cause actual results to differ materially from those expressed or implied in the statements. These risks and uncertainties include, but are not limited to the risks set forth under “Risk Factors” in Part I, Item 1A of our Annual Report on Form 10-K. These cautionary statements should not be construed by you to be exhaustive and they are made only as of the date of this Report. While the Company believes these forward-looking statements to be reasonable, there can be no assurance that they will approximate actual experience or that the expectations derived from them will be realized. Further, SJI undertakes no obligation to update or revise any of its forward-looking statements whether as a result of new information, future events or otherwise. Forward Looking Statements 2
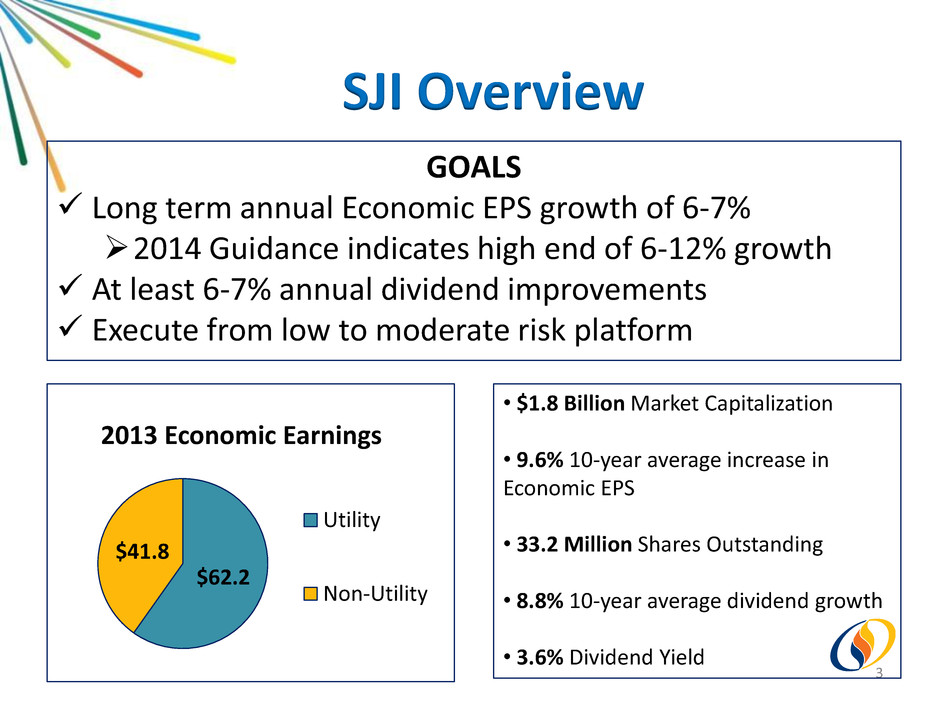
GOALS Long term annual Economic EPS growth of 6-7% 2014 Guidance indicates high end of 6-12% growth At least 6-7% annual dividend improvements Execute from low to moderate risk platform 3 SJI Overview • $1.8 Billion Market Capitalization • 9.6% 10-year average increase in Economic EPS • 33.2 Million Shares Outstanding • 8.8% 10-year average dividend growth • 3.6% Dividend Yield $62.2 $41.8 2013 Economic Earnings Utility Non-Utility
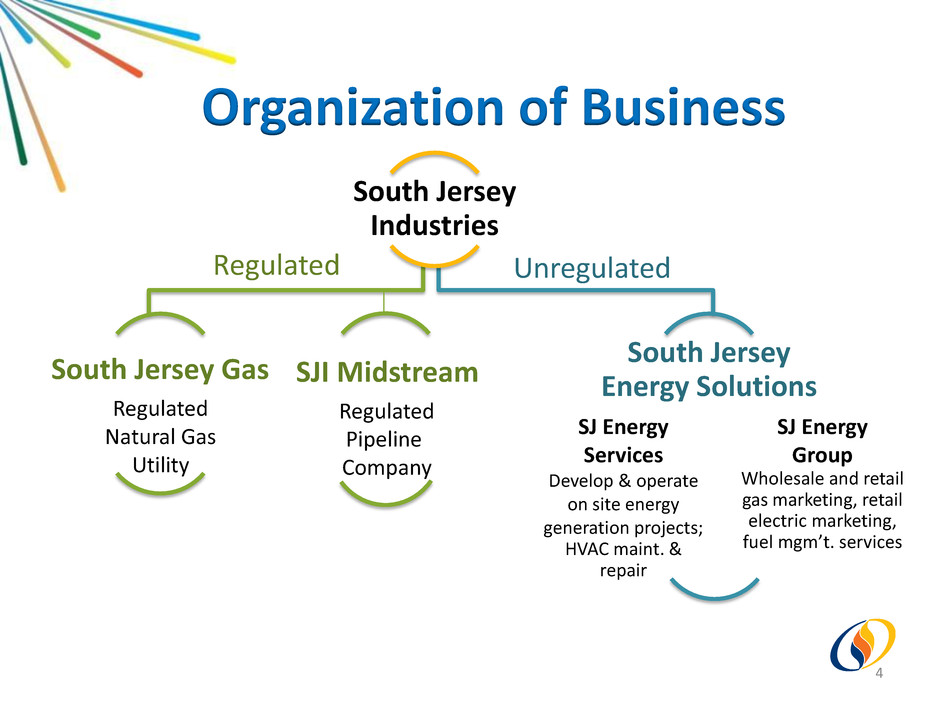
Organization of Business 4 South Jersey Industries South Jersey Gas SJI Midstream South Jersey Energy Solutions Regulated Natural Gas Utility Regulated Pipeline Company SJ Energy Services Develop & operate on site energy generation projects; HVAC maint. & repair SJ Energy Group Wholesale and retail gas marketing, retail electric marketing, fuel mgm’t. services Regulated Unregulated
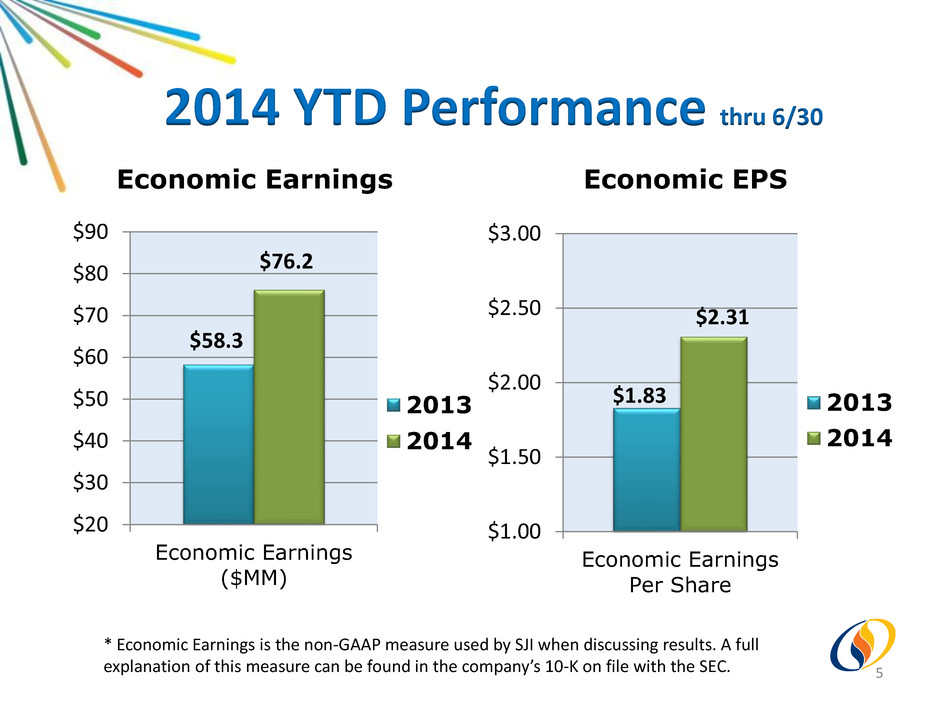
2014 YTD Performance thru 6/30 5 Economic Earnings $20 $30 $40 $50 $60 $70 $80 $90 Economic Earnings ($MM) 2013 2014 $58.3 $76.2 Economic EPS $1.00 $1.50 $2.00 $2.50 $3.00 Economic Earnings Per Share 2013 2014 $1.83 $2.31 * Economic Earnings is the non-GAAP measure used by SJI when discussing results. A full explanation of this measure can be found in the company’s 10-K on file with the SEC.
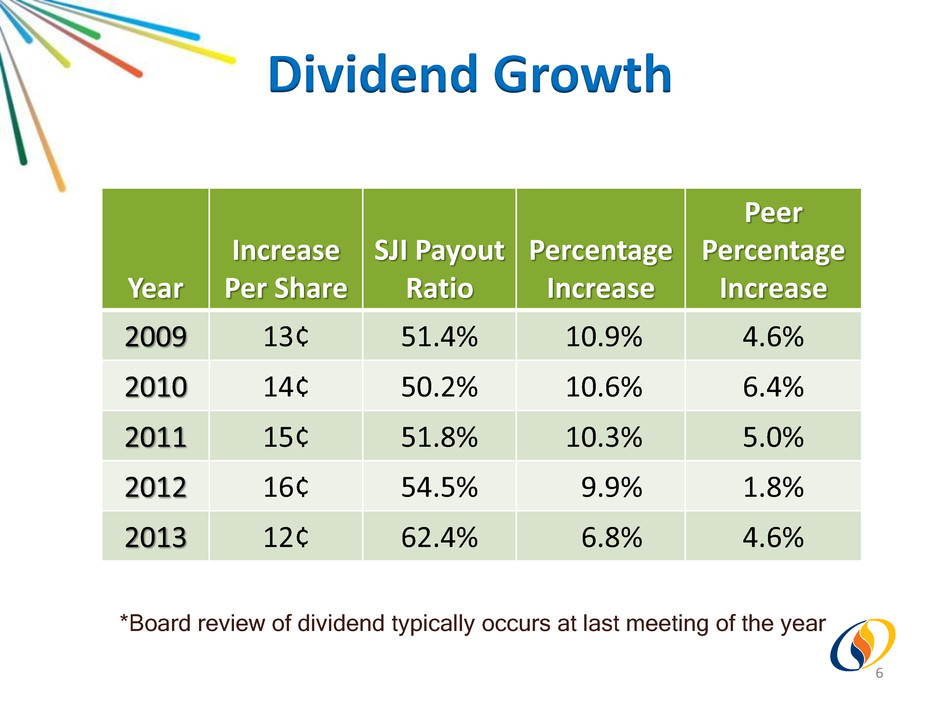
*Board review of dividend typically occurs at last meeting of the year Year Increase Per Share SJI Payout Ratio Percentage Increase Peer Percentage Increase 2009 13¢ 51.4% 10.9% 4.6% 2010 14¢ 50.2% 10.6% 6.4% 2011 15¢ 51.8% 10.3% 5.0% 2012 16¢ 54.5% 9.9% 1.8% 2013 12¢ 62.4% 6.8% 4.6% Dividend Growth 6

Regulated Businesses 7
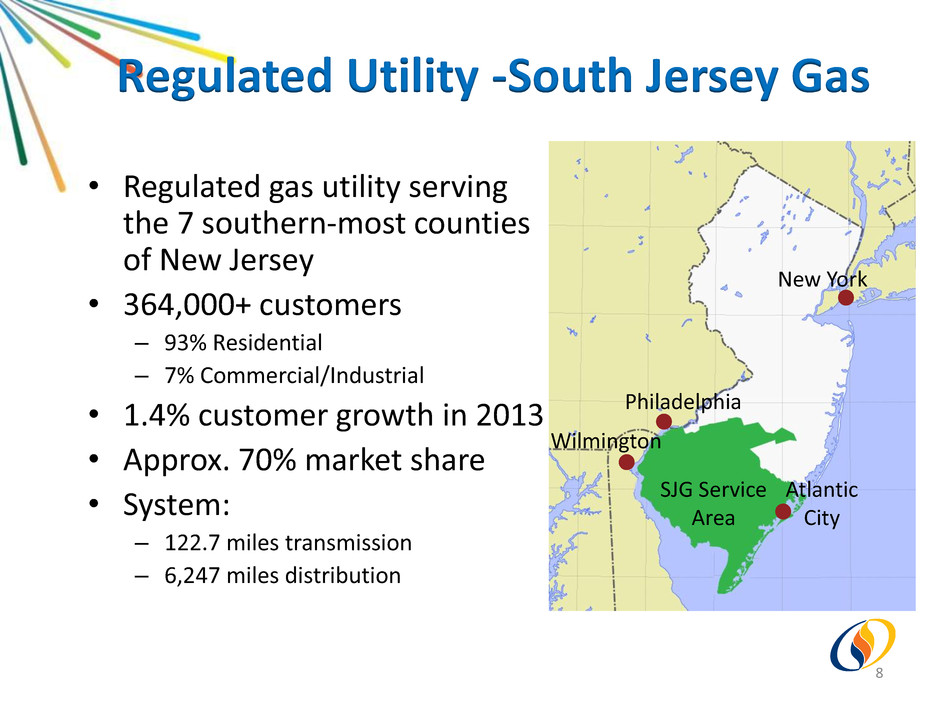
Regulated Utility -South Jersey Gas 8 • Regulated gas utility serving the 7 southern-most counties of New Jersey • 364,000+ customers – 93% Residential – 7% Commercial/Industrial • 1.4% customer growth in 2013 • Approx. 70% market share • System: – 122.7 miles transmission – 6,247 miles distribution SJG Service Area New York Atlantic City Philadelphia Wilmington
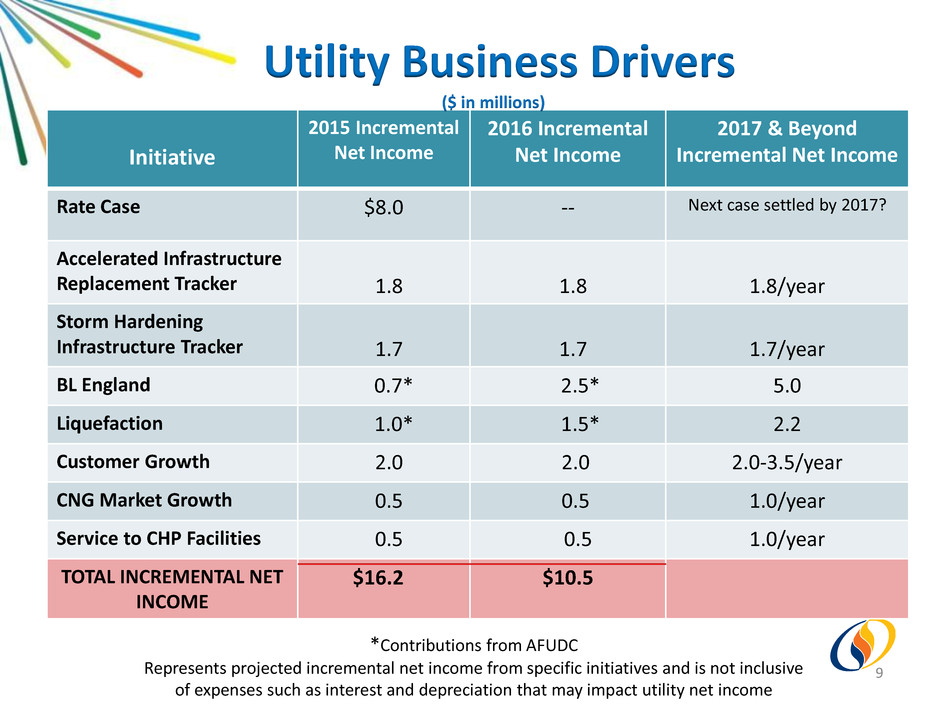
Initiative 2015 Incremental Net Income 2016 Incremental Net Income 2017 & Beyond Incremental Net Income Rate Case $8.0 -- Next case settled by 2017? Accelerated Infrastructure Replacement Tracker 1.8 1.8 1.8/year Storm Hardening Infrastructure Tracker 1.7 1.7 1.7/year BL England 0.7* 2.5* 5.0 Liquefaction 1.0* 1.5* 2.2 Customer Growth 2.0 2.0 2.0-3.5/year CNG Market Growth 0.5 0.5 1.0/year Service to CHP Facilities 0.5 0.5 1.0/year TOTAL INCREMENTAL NET INCOME $16.2 $10.5 9 Utility Business Drivers ($ in millions) *Contributions from AFUDC Represents projected incremental net income from specific initiatives and is not inclusive of expenses such as interest and depreciation that may impact utility net income
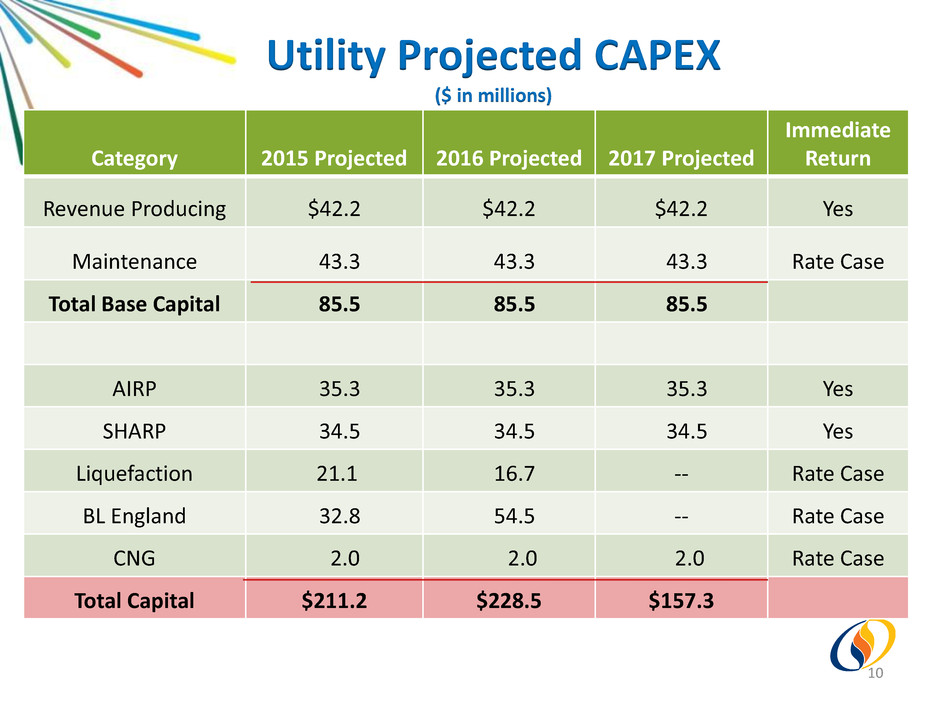
Utility Projected CAPEX ($ in millions) 10 Category 2015 Projected 2016 Projected 2017 Projected Immediate Return Revenue Producing $42.2 $42.2 $42.2 Yes Maintenance 43.3 43.3 43.3 Rate Case Total Base Capital 85.5 85.5 85.5 AIRP 35.3 35.3 35.3 Yes SHARP 34.5 34.5 34.5 Yes Liquefaction 21.1 16.7 -- Rate Case BL England 32.8 54.5 -- Rate Case CNG 2.0 2.0 2.0 Rate Case Total Capital $211.2 $228.5 $157.3
Base Rate Case • 9/30 BPU Vote • $10.5MM - $11.5MM projected net income value, with Q4 2014 impact AIRP • $35.3MM annual investment to replace bare steel and cast iron • $1.8MM net income impact projection per year through 2021 (with program extensions) SHARP • $34.5MM annual investment for 3 years to replace low pressure distribution in coastal communities • Incremental annual net income contribution of up to $1.7MM through 2021 (with program extensions) 11 Utility Infrastructure Growth
Utility Customer Growth 12 Near term net margin growth from: • Net customer addition target of 7,000 in 2014 • Increased demand from large commercial/industrial customers • Increased valuation of residential and small customers via a base rate case Longer term net margin growth from: • Average annual customer growth of 2% per year • Consistent non-residential consumption • Potential to for next base rate case to be settled by 2017
BL England • Distribution pipeline intended for system redundancy and service to a repowering generator in utility service area • Projected investment totaling $90 million $55 MM investment in system redundancy Net income from AFUDC = $0.7MM in 2015 and $2.5MM in 2016; $3.0MM net income in 2017 and beyond $35MM investment in customer dedicated line $2.0MM net income in 2017 and beyond Liquefaction • $43 million investment in liquefier at existing LNG storage site Net income from AFUDC = $1.0MM in 2015 and $1.5MM in 2016; $2.2MM net income in 2017 and beyond • Potential to add net income from limited sale of excess LNG Utility Initiatives 13
CNG Expansion Margin Growth Expectation • 90,000 fleet potential 10% anticipated market penetration • Average vehicle payback period of 4.5 years compels conversion by fleet owners • $500 per vehicle margin – based on throughput Station ROI + Vehicle Margin ≈ $0.5MM -$1.0MM / year Incremental Net Income 14

• New business line • Investing in PennEast Partnership 105-mile interstate pipeline from Marcellus region of PA to Transco’s Trenton-Woodbury NJ lateral SJI is one of five equity partners Projected total project cost of $1 billion • ≈$200 million investment by SJI is projected, with FERC level return 15 Regulated Pipeline – SJI Midstream
• Several utility and energy affiliates of project sponsors are committed as foundation shippers with 15-year agreements on over 600K dekatherms • Open season produced binding commitments totaling 965K dekatherms on 1BCF available capacity pipeline • Targeted in-service date of late 2017 16 Regulated Pipeline – SJI Midstream

Unregulated Businesses 17

Initiative 2014 – 2016 Projected Contribution to Net Income 2017 & Beyond Projected Contribution to Net Income Energy Group 6-8% 10-12% • Fuel manager contracts • Retail commodity volume growth • Additional transportation capacity Energy Services 30-35% 15-20% • Solar REC values increasing • Improving solar operating performance • CHP portfolio growth • Targeted solar development Anticipated % of Total Net Income 36% - 43% 25% - 32% 18 Unregulated Business Drivers
Fuel Manager Contracts • Annuity-like income stream from multi-year agreements • Fixed monthly fee, with index+ based commodity price sets baseline margin • Incremental margin potential from optimizing contract loads against our assets and Marcellus position • 6 fuel manager contracts currently executed, expected to generate $8-$10 million through 2017 Wholesale Commodity Marketing 19
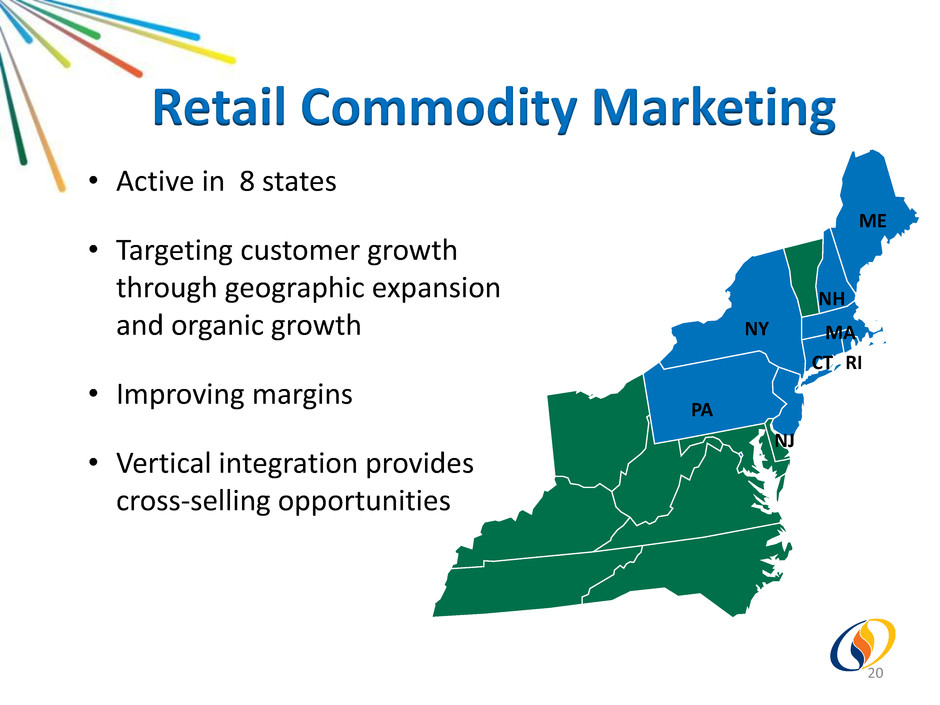
Retail Commodity Marketing NJ PA NY ME NH MA CT RI • Active in 8 states • Targeting customer growth through geographic expansion and organic growth • Improving margins • Vertical integration provides cross-selling opportunities 20
Project Characteristics • ROE averages 15% - 20% • Equity component of 20% - 30% • Typically project financed under 50/50 joint venture • 335 MW of high potential project targets in NJ (prisons, hospitals, higher ed) • Support from federal and state level funding incentives, including 10% ITC and grant funds Combined Heat and Power (CHP) 21
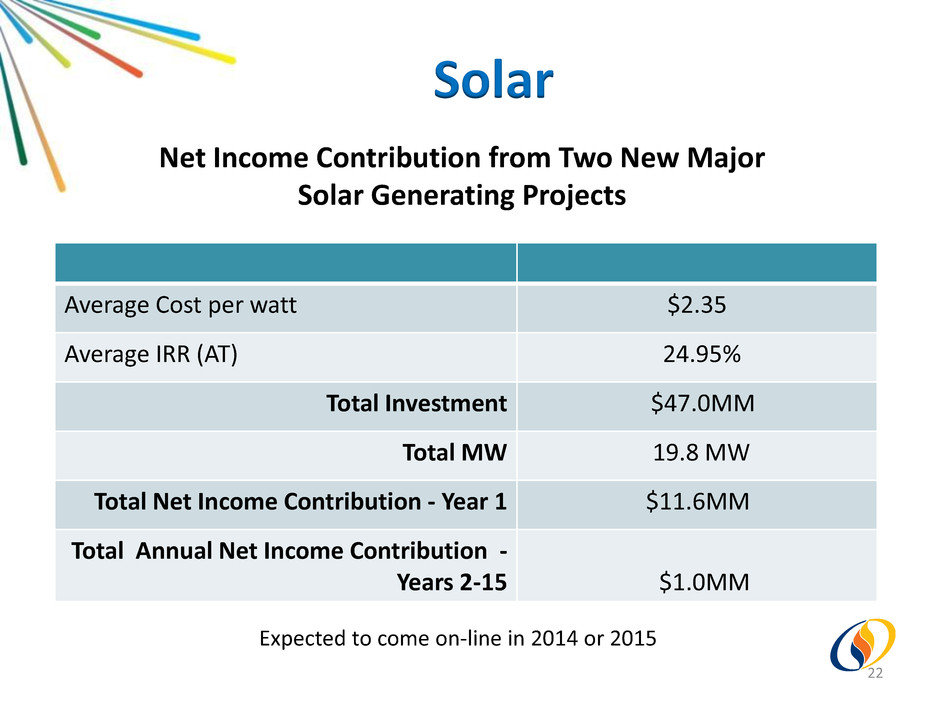
Average Cost per watt $2.35 Average IRR (AT) 24.95% Total Investment $47.0MM Total MW 19.8 MW Total Net Income Contribution - Year 1 $11.6MM Total Annual Net Income Contribution - Years 2-15 $1.0MM Solar Net Income Contribution from Two New Major Solar Generating Projects Expected to come on-line in 2014 or 2015 22

2014 - 2016 Expected Contribution to Earnings 2017 & Beyond Expected Contribution to Earnings Regulated 58% - 65% 65% - 75% Unregulated – Annuity Return 8% - 12% 8% - 12% Total Regulated & Fixed Return Earnings Composition 66% - 77% 73% - 87% Unregulated - Competitive 23% - 34% 13% - 27% Earnings Drivers 23

Appendix 24
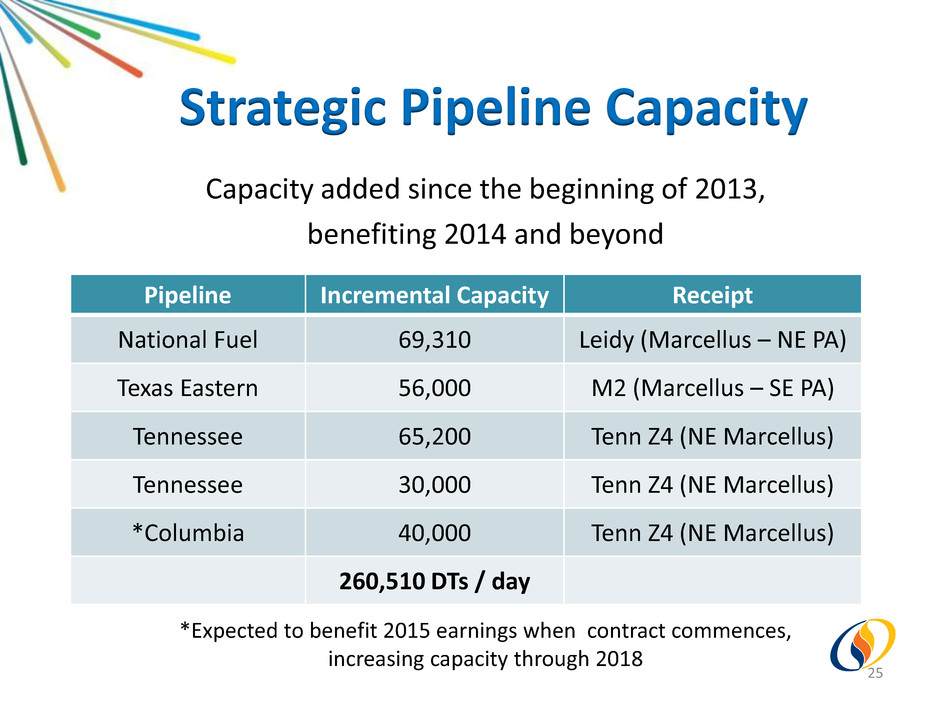
Capacity added since the beginning of 2013, benefiting 2014 and beyond Strategic Pipeline Capacity Pipeline Incremental Capacity Receipt National Fuel 69,310 Leidy (Marcellus – NE PA) Texas Eastern 56,000 M2 (Marcellus – SE PA) Tennessee 65,200 Tenn Z4 (NE Marcellus) Tennessee 30,000 Tenn Z4 (NE Marcellus) *Columbia 40,000 Tenn Z4 (NE Marcellus) 260,510 DTs / day 25 *Expected to benefit 2015 earnings when contract commences, increasing capacity through 2018
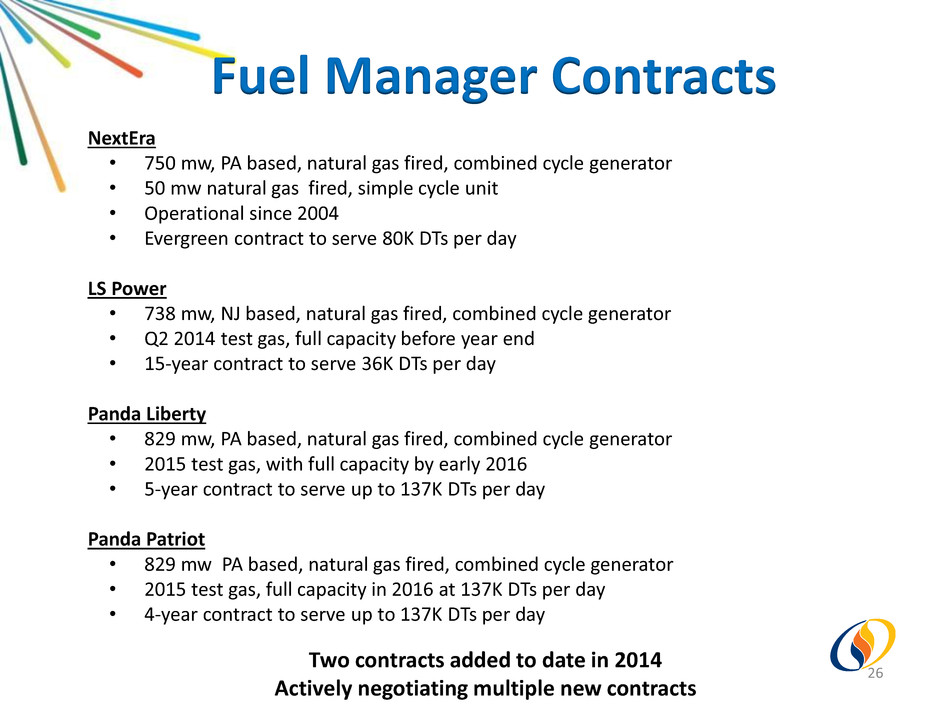
NextEra • 750 mw, PA based, natural gas fired, combined cycle generator • 50 mw natural gas fired, simple cycle unit • Operational since 2004 • Evergreen contract to serve 80K DTs per day LS Power • 738 mw, NJ based, natural gas fired, combined cycle generator • Q2 2014 test gas, full capacity before year end • 15-year contract to serve 36K DTs per day Panda Liberty • 829 mw, PA based, natural gas fired, combined cycle generator • 2015 test gas, with full capacity by early 2016 • 5-year contract to serve up to 137K DTs per day Panda Patriot • 829 mw PA based, natural gas fired, combined cycle generator • 2015 test gas, full capacity in 2016 at 137K DTs per day • 4-year contract to serve up to 137K DTs per day Two contracts added to date in 2014 Actively negotiating multiple new contracts Fuel Manager Contracts 26
