Attached files
| file | filename |
|---|---|
| 8-K - CURRENT REPORT - AMERICAN EAGLE ENERGY Corp | v390199_8k.htm |
Exhibit 99.1
American Eagle Energy Corp (NYSE MKT: “AMZG”) September 2014 Williston Basin (Three Forks / Bakken ) Oil Focused Operator PROVEN: EXPERTISE PROVEN: RESULTS
F ORWARD L OOKING I NFORMATION 2 This presentation contains forward - looking statements within the meaning of Section 27A of the Securities Act of 1933, as amended (the “Securities Act”), and Section 21 E o f the Securities Exchange Act of 1934, as amended (the “Exchange Act”). You can identify forward - looking statements by the use of forward - looking words, such as “expects,” “projects,” “predicts,” “believes,” “plans,” “anticipates,” “estimates,” “may,” “will,” “possible,” “goal,” “target,” “should,” or “intends” or the negative of those words or similar wo rds . Forward - looking statements involve inherent risks and uncertainties regarding events, conditions, and financial trends that may affect our business, financial condition, liquidity, and results of operations. Forward - looking statements include, but are not limited to, statements about: speculative nature of oil and natural gas exploration, particularly in the Bakken and Three Forks formations on which we are foc used; substantial capital requirements and ability to access additional capital; ability to meet our drilling and well - completion schedules; uncertainty of drilling results; results of acquisitions; relationships with partners and service providers; ability to acquire additional leasehold interests or other oil and natural gas properties; defects in title to our leasehold interests or other oil and natural gas properties; inability to manage growth in our business; ability to control properties that we do not operate; lack of geographic diversification; competition in the oil and natural gas industry; global financial conditions; oil and natural gas realized prices; ability to market and distribute oil and natural gas produced ; seasonal weather conditions; government regulation of the oil and natural gas industry, including potential regulations affecting hydraulic stimulation an d e nvironmental regulations, such as climate change regulations; and uninsured or underinsured risks. We have based these forward - looking statements on our current expectations and assumptions about future events. While our manage ment considers these expectations and assumptions to be reasonable, they are inherently subject to significant business, economic, competitive, regulatory, and other risks, continge nci es, and uncertainties, most of which are difficult to predict and many of which are beyond our control. Accordingly, results actually achieved may differ materially from expected results in these sta tem ents. Forward - looking statements speak only as of the date they are made. We do not undertake, and specifically disclaim, any obligation to update any forward - looking statements to reflect events or cir cumstances occurring after the date of such statements, other than as may be required by applicable law or regulation. Readers are urged not to place undue reliance on these forward - looking statements. Readers are also urged to review carefully and to consider the various disclosures made by us in our reports filed with the SEC, which attempt to advise interested parties of the risks and factors th at may affect our business, financial condition, results of operations, and cash flows. If one or more of these risks or uncertainties materialize, or if the underlying assumptions prove incorrect, our actu al results may vary materially from those expected or projected.
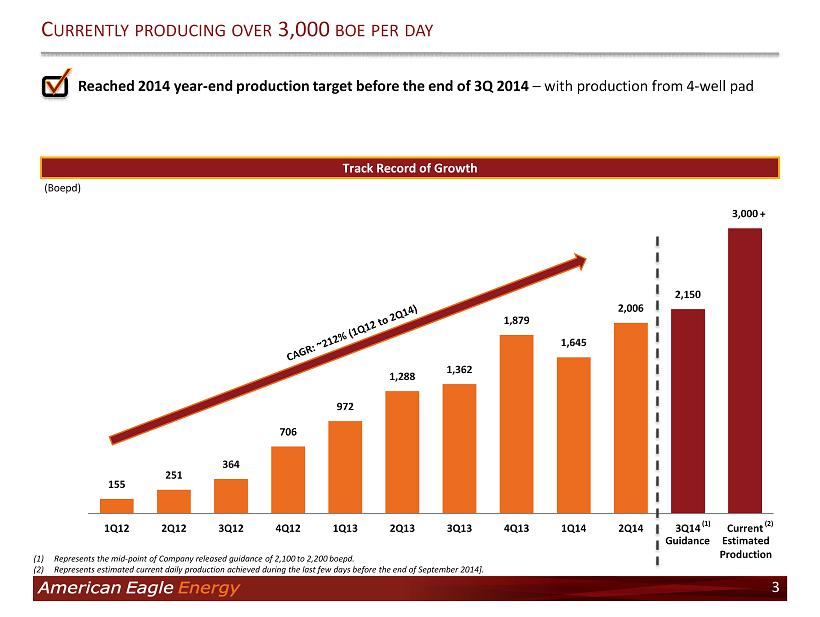
155 251 364 706 972 1,288 1,362 1,879 1,645 2,006 2,150 3,000 1Q12 2Q12 3Q12 4Q12 1Q13 2Q13 3Q13 4Q13 1Q14 2Q14 3Q14 Current ■ Reached 2014 year - end production target before the end of 3 Q 2014 – with production from 4 - well pad C URRENTLY PRODUCING OVER 3,000 BOE PER DAY 3 Track Record of Growth ( Boepd ) Guidance Estimated Production (1) Represents the mid - point of Company released guidance of 2 , 100 to 2 , 200 boepd . (2) Represents estimated current daily production achieved during the last few days before the end of September 2014 ] . ( 1 ) + ( 2 )
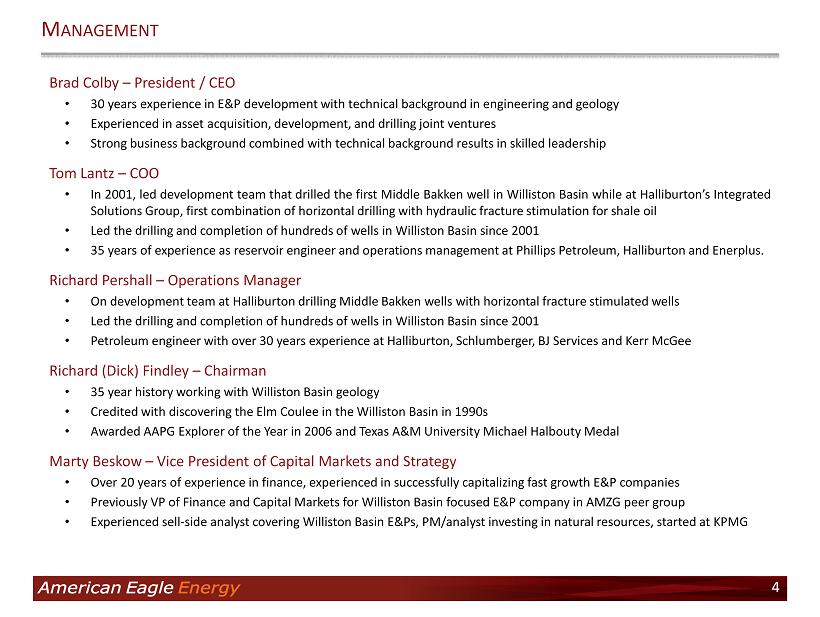
Brad Colby – President / CEO • 30 years experience in E&P development with technical background in engineering and geology • Experienced in asset acquisition, development, and drilling joint ventures • Strong business background combined with technical background results in skilled leadership Tom Lantz – COO • In 2001 , led development team that drilled the first Middle Bakken well in Williston Basin while at Halliburton’s Integrated Solutions Group, first combination of horizontal drilling with hydraulic fracture stimulation for shale oil • Led the drilling and completion of hundreds of wells in Williston Basin since 2001 • 35 years of experience as reservoir engineer and operations management at Phillips Petroleum, Halliburton and Enerplus . Richard Pershall – Operations Manager • On development team at Halliburton drilling Middle Bakken wells with horizontal fracture stimulated wells • Led the drilling and completion of hundreds of wells in Williston Basin since 2001 • Petroleum engineer with over 30 years experience at Halliburton, Schlumberger, BJ Services and Kerr McGee Richard (Dick) Findley – Chairman • 35 year history working with Williston Basin geology • Credited with discovering the Elm Coulee in the Williston Basin in 1990 s • Awarded AAPG Explorer of the Year in 2006 and Texas A&M University Michael Halbouty Medal Marty Beskow – Vice President of Capital Markets and Strategy • Over 20 years of experience in finance, experienced in successfully capitalizing fast growth E&P companies • Previously VP of Finance and Capital Markets for Williston Basin focused E&P company in AMZG peer group • Experienced sell - side analyst covering Williston Basin E&Ps, PM/analyst investing in natural resources, started at KPMG M ANAGEMENT 4

Ticker Symbol (NYSE MKT): AMZG Common Shares Outstanding (1) : 30.4 MM Market Capitalization (1) : $130 MM Net Debt (2) : $108 MM Enterprise Value (1)(2) : $238 MM Liquidity (2) : 1P Pre - Tax PV - 10 (3) : $127 MM $336 MM 1P Reserves (3) : 15.4 Mmboe (89% oil) Net Acreage (4) : ~46,800 (66% Operated, 65% HBP ) Independent Reserve Engineer: Ryder Scott American Eagle Energy Corporation (“AMZG”, “American Eagle Energy” or the “Company”) is a Denver, Colorado based exploration & production operator focused in the Williston Basin (Bakken and Three Forks Formations) ( 1 ) As of market close on September 25 , 2014 . Excludes 1 . 9 MM stock options that have been granted, some of which have not yet vested . ( 2 ) As of June 30 , 2014 . Pro forma for the August 2014 senior secured notes offering for $ 175 million of 11 % 5 - year notes and $ 67 million of cash plus $ 60 million of undrawn availability on revolver . ( 3 ) Based on June 30 , 2014 mid - year Ryder Scott reserve report . ( 4 ) Excludes other non - core acreage (mostly Sheridan and Daniels Counties, MT) of 7 , 450 acres . HBP based on operated acreage . 5 W ILLISTON B ASIN FOCUSED OPERATOR WITH SUBSTANTIAL POSITION IN D IVIDE C OUNTY , ND Company Overview Asset Map Montana North Dakota Canada Saskatchewan Divide Williams Burke Sheridan North Dakota Mountrail Montana

0 100 200 300 400 500 600 700 0 5,000 10,000 15,000 20,000 25,000 30,000 35,000 40,000 45,000 2009 2010 2011 2012 2013 2014 Production Active wells O UR S PYGLASS P ROJECT A REA STACKS UP WITH THE “C ORE ” OF THE W ILLISTON 6 AMZG’s Spyglass Well Results mirror the Williston “Core” ■ Wells with 12 - month oil production greater than 200 Bopd extend from the Williston Core into AMZG’s Spyglass Project Area ■ As a result of its desirable economics, drilling in Divide County, ND has picked up substantially in recent years Divide County’s Drilling and Production Growth ( Bopd ) (wells) Source: North Dakota Industrial Commission. . Sources : Drilling Info .

98% 90% 84% 78% 70% 67% 56% 56% 52% 52% 47% 42% 40% 39% 39% 39% 36% 36% 33% 33% 33% 33% 31% 30% 30% 29% 29% 27% 27% 26% 24% 24% 21% 20% 19% 18% ■ Shallower drill depth – lower drilling cost and faster drill times ■ Superior rock quality – reduced proppant volumes, no ceramic required ■ Relatively high EUR wells – shallow decline curve ➔ relatively high EUR ■ High oil content – 89% oil with ~$10 / bbl differential locked in for 2015 T HE D IVIDE C OUNTY A DVANTAGE 7 AMZG’s Spyglass Project area in Divide County, ND stacks up favorably to the leading plays in North America Three Forks Long Lateral (based on Ryder Scott assumptions) ■ $6.4 MM D&C costs ■ ~400 Mboe EUR ■ $50+ / Boe cash margin ■ 45% – 50% IRRs Source: Wall Street research estimates. Notes: AMZG IRR is based on WTI of $100.11 / bbl while research estimates are based on WTI NYMEX strip of $103.21 / bbl.

R ESERVE S UMMARY 8 1P Reserves By Reserve Category 1P Reserves By Commodity 1P PV - 10 B y Reserve Category Oil Gas Total PV-10 Category (Mbbls) (Mmcf) (Mboe) ($MM) PDP 4,671 3,480 5,251 $169 PDNP 699 485 780 26 Total Proved Developed 5,370 3,965 6,031 $195 PUD 8,373 6,078 9,386 $141 Total proved (1P) 13,743 10,043 15,416 $336 Probable reserves 2,222 1,624 2,493 27 Total proved + probable reserves (2P) 15,965 11,667 17,910 $363 Net proved reserves as of June 30, 2014 PDP 34% PDNP 5% PUD 61% Reserves Overview Total: 15.4 M mboe Source: Based on June 30, 2014 mid - year Ryder Scott reserve report. Numbers may not add due to rounding. Gas 11% Oil 89% PDP 50% PDNP 8% PUD 42% Total: 15.4 M mboe Total: $336 MM

155 251 364 706 972 1,288 1,362 1,879 1,645 2,006 2,250 1Q12 2Q12 3Q12 4Q12 1Q13 2Q13 3Q13 4Q13 1Q14 2Q14 Jul-14 1.6 5.8 6.5 13.5 15.4 $36 $119 $170 $308 $336 $- $50 $100 $150 $200 $250 $300 $350 $400 0 2 4 6 8 10 12 14 16 18 Reserves PV-10 Reserves PV-10 Reserves PV-10 Reserves PV-10 Reserves PV-10 YE:2011 YE:2012 MY:2013 YE:2013 MY:2014 ■ Ryder Scott engineered 2014 mid - year proved reserves of 15 . 4 Mmboe with PV - 10 of $ 336 MM ■ Internal 2014 mid - year estimates show continuation of reserve growth trajectory ▬ Management believes the full potential of multiple wells brought online during late June 2014 are not being fully recognized in Ryder Scott mid - year report ■ Since year end 2011 AMZG has added 13 Mmboe of 1 P reserves mainly through extensions and discoveries ▬ The small proportion of acquired reserves have come from working interest purchases from JV Partner ■ Pro forma for March 2014 acquisition implies 2013 finding and development cost of $ 16 . 00 per Boe ■ Since 1 Q 12 AMZG has achieved 212 % CAGR on its average daily production ; concurrent growth in reserves provides AMZG 21 years of reserve life ( 3 ) T RACK R ECORD OF G ROWTH Production Growth Proved Reserves Highlights Proved Reserve / PV - 10 Growth 9 (Mmboe; $MM) (Boepd) (1) Reserve and PV - 10 data from year end 2011 and 2012 were prepared by MHA Petroleum Consultants. (2) Based on June 30, 2014 mid - year Ryder Scott reserve report. (3) Based on 2Q 2014 production (2) (1) (1)
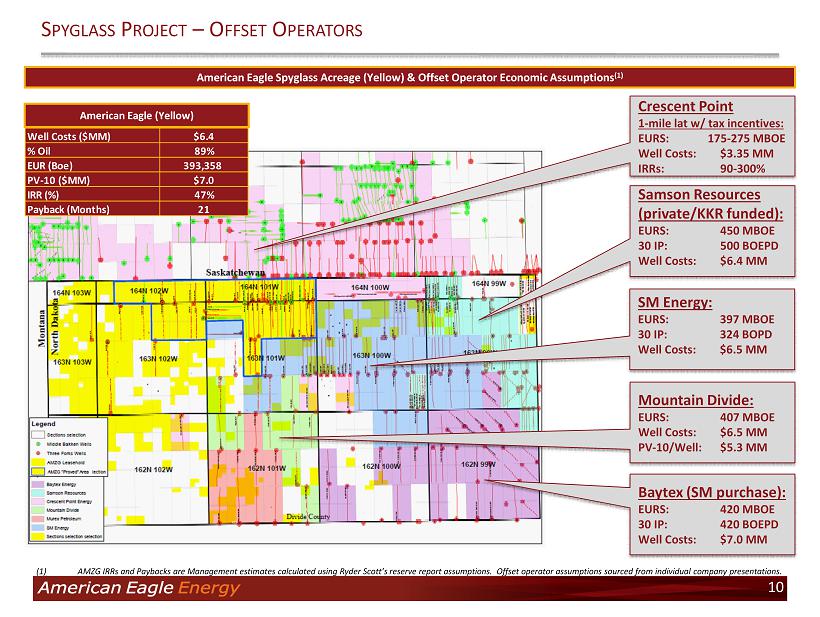
S PYGLASS P ROJECT – O FFSET O PERATORS American Eagle Spyglass Acreage (Yellow) & Offset Operator Economic Assumptions (1) 10 (1) AMZG IRRs and Paybacks are Management estimates calculated using Ryder Scott’s reserve report assumptions. Offset operator assumptions sourced from individual com pan y presentations. American Eagle (Yellow) Crescent Point 1 - mile lat w/ tax incentives: EURS: 175 - 275 MBOE Well Costs: $3.35 MM IRRs: 90 - 300% Samson Resources (private/KKR funded): EURS: 450 MBOE 30 IP: 500 BOEPD Well Costs: $6.4 MM SM Energy: EURS: 397 MBOE 30 IP: 324 BOPD Well Costs: $6.5 MM Mountain Divide: EURS: 407 MBOE Well Costs: $6.5 MM PV - 10/Well: $5.3 MM Baytex (SM purchase): EURS: 420 MBOE 30 IP: 420 BOEPD Well Costs: $7.0 MM Well Costs ($MM) $6.4 % Oil 89% EUR (Boe) 393,358 PV-10 ($MM) $7.0 IRR (%) 47% Payback (Months) 21
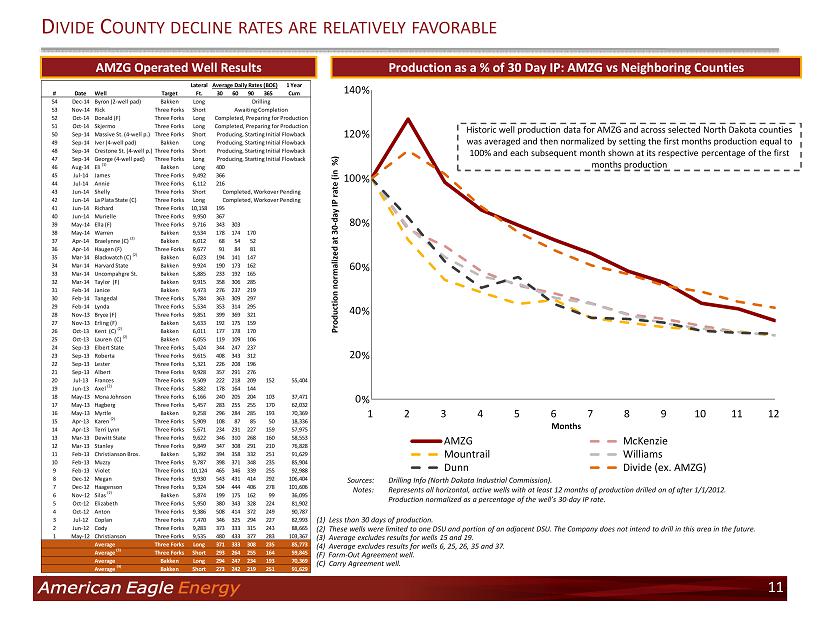
0 20 40 60 80 100 120 140 1 2 3 4 5 6 7 8 9 10 11 12 Production normalized at 30 - day IP rate (in %) AMZG McKenzie Mountrail Williams Dunn Divide (ex. AMZG) D IVIDE C OUNTY DECLINE RATES ARE RELATIVELY FAVORABLE Production as a % of 30 Day IP: AMZG vs Neighboring Counties AMZG Operated Well Results 11 (1) Less than 30 days of production. (2) These wells were limited to one DSU and portion of an adjacent DSU. T he Company does not intend to drill in this area in the future. (3) Average excludes results for wells 15 and 19. (4) Average excludes results for wells 6, 25, 26, 35 and 37. (F) Farm - Out Agreement well. (C) Carry Agreement well. Sources : Drilling Info (North Dakota Industrial Commission) . Notes : Represents all horizontal, active wells with at least 12 months of production drilled on of after 1 / 1 / 2012 . Production normalized as a percentage of the well’s 30 - day IP rate . % % % % % % Historic well production data for AMZG and across selected North Dakota counties was averaged and then normalized by setting the first months production equal to 100% and each subsequent month shown at its respective percentage of the first months production % % Months Lateral 1 Year # Date Well Target Ft. 30 60 90 365 Cum 54 Dec-14 Byron (2-well pad) Bakken Long 53 Nov-14 Rick Three Forks Short 52 Oct-14 Donald (F) Three Forks Long 51 Oct-14 Skjermo Three Forks Long 50 Sep-14 Massive St. (4-well p.) Three Forks Short 49 Sep-14 Iver (4-well pad) Bakken Long 48 Sep-14 Crestone St. (4-well p.)Three Forks Short 47 Sep-14 George (4-well pad) Three Forks Long 46 Aug-14 Eli (1) Bakken Long 400 45 Jul-14 James Three Forks 9,492 366 44 Jul-14 Annie Three Forks 6,112 216 43 Jun-14 Shelly Three Forks Short 42 Jun-14 La Plata State (C) Three Forks Long 41 Jun-14 Richard Three Forks 10,158 195 40 Jun-14 Murielle Three Forks 9,950 367 39 May-14 Ella (F) Three Forks 9,716 343 303 38 May-14 Warren Bakken 9,534 178 174 170 37 Apr-14 Braelynne (C) (2) Bakken 6,012 68 54 52 36 Apr-14 Haugen (F) Three Forks 9,677 91 84 81 35 Mar-14 Blackwatch (C) (2) Bakken 6,023 194 141 147 34 Mar-14 Harvard State Bakken 9,924 190 173 162 33 Mar-14 Uncompahgre St. Bakken 5,885 233 192 165 32 Mar-14 Taylor (F) Bakken 9,915 358 306 285 31 Feb-14 Janice Bakken 9,473 276 237 219 30 Feb-14 Tangedal Three Forks 5,784 363 309 297 29 Feb-14 Lynda Three Forks 5,534 353 314 295 28 Nov-13 Bryce (F) Three Forks 9,851 399 369 321 27 Nov-13 Erling (F) Bakken 5,633 192 175 159 26 Oct-13 Kent (C) (2) Bakken 6,011 177 178 170 25 Oct-13 Lauren (C) (2) Bakken 6,055 119 109 106 24 Sep-13 Elbert State Three Forks 5,424 344 247 237 23 Sep-13 Roberta Three Forks 9,615 408 343 312 22 Sep-13 Lester Three Forks 5,321 226 208 196 21 Sep-13 Albert Three Forks 9,928 357 291 276 20 Jul-13 Frances Three Forks 9,509 222 218 209 152 55,404 19 Jun-13 Axel (2) Three Forks 5,882 178 164 144 18 May-13 Mona Johnson Three Forks 6,166 240 205 204 103 37,471 17 May-13 Hagberg Three Forks 5,457 283 255 255 170 62,032 16 May-13 Myrtle Bakken 9,258 296 284 285 193 70,369 15 Apr-13 Karen (2) Three Forks 5,909 108 87 85 50 18,336 14 Apr-13 Terri Lynn Three Forks 5,671 234 231 227 159 57,975 13 Mar-13 Dewitt State Three Forks 9,622 346 310 268 160 58,553 12 Mar-13 Stanley Three Forks 9,849 347 308 291 210 76,828 11 Feb-13 Christianson Bros. Bakken 5,392 394 358 332 251 91,629 10 Feb-13 Muzzy Three Forks 9,787 398 371 348 235 85,904 9 Feb-13 Violet Three Forks 10,124 465 346 339 255 92,988 8 Dec-12 Megan Three Forks 9,930 543 431 414 292 106,404 7 Dec-12 Haagenson Three Forks 9,324 504 444 406 278 101,606 6 Nov-12 Silas (2) Bakken 5,874 199 175 162 99 36,095 5 Oct-12 Elizabeth Three Forks 5,950 380 343 328 224 81,902 4 Oct-12 Anton Three Forks 9,386 508 414 372 249 90,787 3 Jul-12 Coplan Three Forks 7,470 346 325 294 227 82,993 2 Jun-12 Cody Three Forks 9,283 373 333 315 243 88,665 1 May-12 Christianson Three Forks 9,535 480 433 377 283 103,367 Average Three Forks Long 371 333 308 235 85,773 Average (3) Three Forks Short 293 264 255 164 59,845 Average Bakken Long 294 247 234 193 70,369 Average (4) Bakken Short 273 242 219 251 91,629 Average Daily Rates (BOE) Completed, Workover Pending Producing, Starting Initial Flowback Completed, Preparing for Production Completed, Workover Pending Producing, Starting Initial Flowback Producing, Starting Initial Flowback Producing, Starting Initial Flowback Awaiting Completion Completed, Preparing for Production Drilling

■ AMZG’s relatively higher quality reservoir allows them to complete 30 – 40 stage fracks with only ~2.5 million pounds of proppant ■ Majority of wells in the core of the basin require 4 – 5 million pounds of proppant, often times with more costly ceramics vs. the standard frack sand that AMZG uses ■ In AMZG’s Spyglass Project Area, the Bakken and Three Forks formations occur at depths of approximately 8,000 vs. 10,000 – 11,000 feet in core areas of the Williston ■ Shallower depths allow for faster drilling and lower completion costs for AMGZ L OWER DRILL DEPTH AND BETTER ROCK QUALITY LEAD TO LOWER D&C COSTS 12 Divide County’s shallower reservoir depths Low D&C costs driven by Sources : North Dakota geologic survey 1,778 8,955 - 2,000 4,000 6,000 8,000 10,000 12,000 - 1,000 2,000 3,000 4,000 5,000 6,000 Lateral length (ft) Proppant (000's of lbs) Divide: Proppant (mlbs) Divide: Proppant average Divide: Lateral length Divide: Lateral average Sources : North Dakota geologic survey and EERC survey

F OCUS ON EFFICIENCY HAS REDUCED DRILLING DAYS OVER TIME 13 0 5 10 15 20 25 30 35 40 45 Days 55% Reduced Drill Time Spud to Rig Release Fishing Days Spud To Rig R elease Days Since March 2012 2012 2013 2014
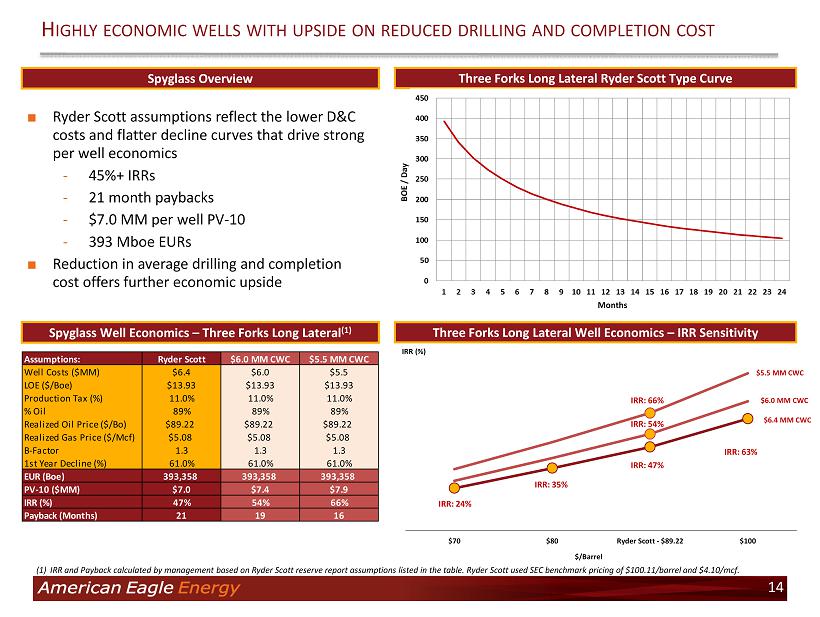
$70 $80 Ryder Scott - $89.22 $100 H IGHLY ECONOMIC WELLS WITH UPSIDE ON REDUCED DRILLING AND COMPLETION COST Spyglass Well Economics – Three Forks Long Lateral (1) Three Forks Long Lateral Well Economics – IRR Sensitivity ■ Ryder Scott assumptions reflect the lower D&C costs and flatter decline curves that drive strong per well economics - 45%+ IRRs - 21 month paybacks - $7.0 MM per well PV - 10 - 393 M boe EURs ■ Reduction in average drilling and completion cost offers further economic upside Spyglass Overview Three Forks Long Lateral Ryder Scott Type Curve IRR: 24% IRR: 35% IRR: 47% IRR: 63% $5.5 MM CWC $6.0 MM CWC BOE / Day IRR (%) $/Barrel 14 $6.4 MM CWC (1) IRR and Payback calculated by management based on Ryder Scott reserve report assumptions listed in the table. Ryder Scott used SEC benchmark pricing of $100.11/barrel and $4.10/ mcf . Assumptions: Ryder Scott $6.0 MM CWC $5.5 MM CWC Well Costs ($MM) $6.4 $6.0 $5.5 LOE ($/Boe) $13.93 $13.93 $13.93 Production Tax (%) 11.0% 11.0% 11.0% % Oil 89% 89% 89% Realized Oil Price ($/Bo) $89.22 $89.22 $89.22 Realized Gas Price ($/Mcf) $5.08 $5.08 $5.08 B-Factor 1.3 1.3 1.3 1st Year Decline (%) 61.0% 61.0% 61.0% EUR (Boe) 393,358 393,358 393,358 PV-10 ($MM) $7.0 $7.4 $7.9 IRR (%) 47% 54% 66% Payback (Months) 21 19 16 Months IRR: 54% IRR: 66%

– 500 1,000 1,500 2,000 2,500 3,000 2011 2012 2013 2014 2015 2016 Pipeline - Operational Rail - Operational Pipeline - Purposed Rail - Purposed Basin Production (Boepd) 15 AMZG’s access to infrastructure Gas gathering and takeaway infrastructure W ILLISTON B ASIN INFRASTRUCTURE AND TAKEAWAY CAPACITY CONTINUES TO MATURE (Mboepd) Oil gathering and transportation ■ Oil takeaway capacity currently handled by trucking AMZG’s oil production to rail terminals ■ Current rail capacity in the Williston totals over 1 . 0 Mmbopd with additional projects under evaluation ■ Pipeline capacity is expected to exceed 1 . 5 Mmbopd by year end 2016 , which combined with existing and expected rail projects would provide nearly 3 . 0 Mmbopd of oil takeaway capacity ▬ Transportation costs likely to further decline as additional pipeline infrastructure is built out Gas gathering system ■ Our JV partner is currently laying a gas gathering system in NW Divide County, ND to connect multiple operators, including AMZG to the Hess Tioga gas plant ▬ NextEra has partnered with Hess to expand throughput capacity ; thus securing throughput volume at the plant ▬ The lateral line connecting AMZG operating area to the Hess Tioga gas plant is expected to be operational in 4 Q 2014 , following which the company’s gas capture rate would increase from ~ 85 % to ~ 100 % ▬ The existing initial phase gas processing facility is expected to be converted into a compressor station for the gathering system u pon completion of the lateral line connection to the Hess Tioga gas plant ■ Multiple other midstream companies are also developing infrastructure in the area including ONEOK Partners (“OKS”) who is constructing a 270 mile natural gas gathering system and related infrastructure in Divide County, ND Electricity ■ Electrical infrastructure expected to reach AMZG’s operating area by year end 2014 Source: Company filings and press releases. Takeaway capacity as per June 26, 2014, North Dakota Pipeline Authority oil transportatio n r eport. Growing Williston Basin takeaway capacity Saskatchewan Williams Burke Sheridan North Dakota Mountrail Divide Proposed lateral to Tioga Plant Hess Tioga Gas Plant Capacity: 300 Mmcf /d
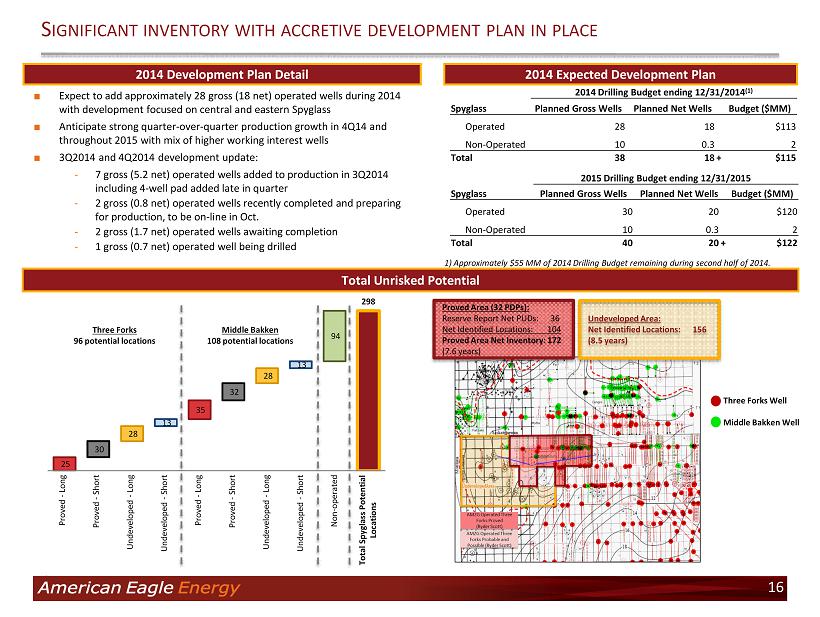
25 30 28 13 35 32 28 13 94 298 1 2 3 4 5 6 7 8 9 10 Proved - Long Proved - Long Proved - Short Proved - Short U ndeveloped - Long U ndeveloped - Long U ndeveloped - Short U ndeveloped - Short Non - operated Three Forks 96 potential locations Middle Bakken 108 potential locations Total Spyglass Potential Locations ■ Expect to add approximately 28 gross (18 net) operated wells during 2014 with development focused on central and eastern Spyglass ■ Anticipate strong quarter - over - quarter production growth in 4Q14 and throughout 2015 with mix of higher working interest wells ■ 3Q2014 and 4Q2014 development update: - 7 gross (5.2 net) operated wells added to production in 3Q2014 including 4 - well pad added late in quarter - 2 gross (0.8 net) operated wells recently completed and preparing for production, to be on - line in Oct. - 2 gross (1.7 net) operated wells awaiting completion - 1 gross (0.7 net) operated well being drilled S IGNIFICANT INVENTORY WITH ACCRETIVE DEVELOPMENT PLAN IN PLACE 16 2014 Expected Development Plan 2014 Development Plan Detail 2014 Drilling Budget ending 12/31/2014 (1) Spyglass Planned Gross Wells Planned Net Wells Budget ($MM) Operated 28 18 $113 Non - Operated 10 0.3 2 Total 38 18 + $ 115 Total Unrisked Potential Proved Area (32 PDPs): Reserve Report Net PUDs: 36 Net Identified Locations: 104 Proved Area Net Inventory: 172 (7.6 years) Undeveloped Area: Net Identified Locations: 156 ( 8 .5 years) Three Forks Well Middle Bakken Well 2015 Drilling Budget ending 12/31/2015 Spyglass Planned Gross Wells Planned Net Wells Budget ($MM) Operated 30 20 $120 Non - Operated 10 0.3 2 Total 40 20 + $122 1) Approximately $55 MM of 2014 Drilling Budget remaining during second half of 2014.
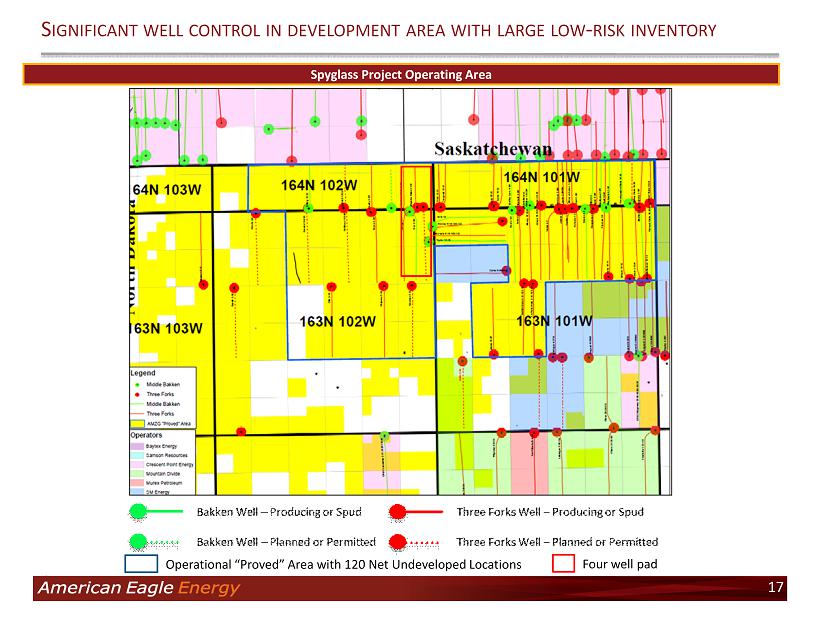
S IGNIFICANT WELL CONTROL IN DEVELOPMENT AREA WITH LARGE LOW - RISK I NVENTORY 17 Spyglass Project Operating Area Operational “Proved” Area with 120 Net Undeveloped Locations Four well pad
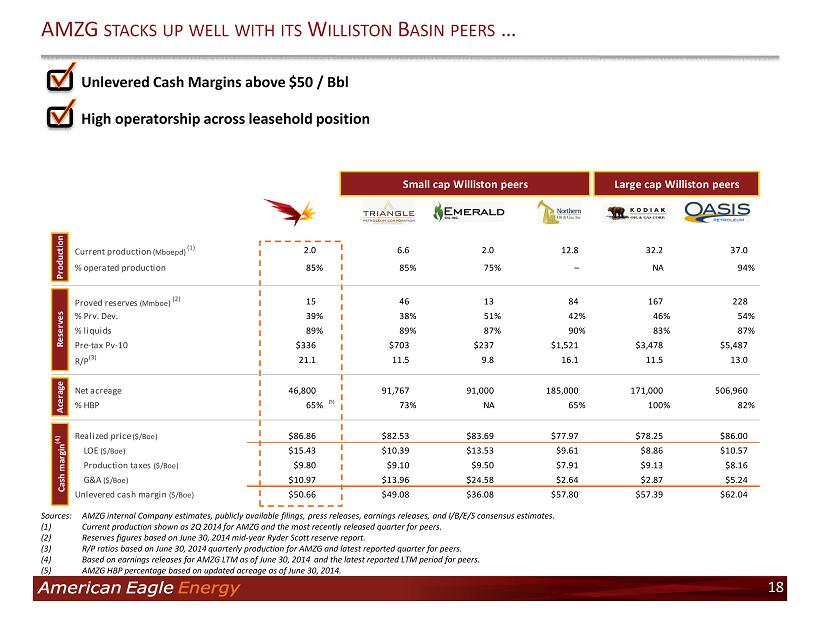
AMZG STACKS UP WELL WITH ITS W ILLISTON B ASIN PEERS … 18 Sources : AMZG internal Company estimates, publicly available filings, press releases, earnings releases, and I/B/E/S consensus estimates . ( 1 ) Current production shown as 2 Q 2014 for AMZG and the most recently released quarter for peers . ( 2 ) Reserves figures based on June 30 , 2014 mid - year Ryder Scott reserve report . ( 3 ) R/P ratios based on June 30 , 2014 quarterly production for AMZG and latest reported quarter for peers . ( 4 ) Based on earnings releases for AMZG LTM as of June 30 , 2014 and the latest reported LTM period for peers . ( 5 ) AMZG HBP percentage based on updated acreage as of June 30 , 2014 . ■ Unlevered Cash Margins above $50 / Bbl ■ High operatorship across leasehold position AMZG TPLM EOX NOG KOG OAS Current production (Mboepd) (1) 2.0 6.6 2.0 12.8 32.2 37.0 % operated production 85% 85% 75% – NA 94% Proved reserves (Mmboe) (2) 15 46 13 84 167 228 % Prv. Dev. 39% 38% 51% 42% 46% 54% % liquids 89% 89% 87% 90% 83% 87% Pre-tax Pv-10 $336 $703 $237 $1,521 $3,478 $5,487 R/P (3) 21.1 11.5 9.8 16.1 11.5 13.0 Net acreage 46,800 91,767 91,000 185,000 171,000 506,960 % HBP 65% (5) 73% NA 65% 100% 82% Realized price ($/Boe) $86.86 $82.53 $83.69 $77.97 $78.25 $86.00 LOE ($/Boe) $15.43 $10.39 $13.53 $9.61 $8.86 $10.57 Production taxes ($/Boe) $9.80 $9.10 $9.50 $7.91 $9.13 $8.16 G&A ($/Boe) $10.97 $13.96 $24.58 $2.64 $2.87 $5.24 Unlevered cash margin ($/Boe) $50.66 $49.08 $36.08 $57.80 $57.39 $62.04 Large cap Williston peers Acerage Reserves Production Cash margin (4) Small cap Williston peers

Small Cap Williston Peers Large Cap Williston Peers Peer Average as of the most recently reported quarter( except share price, as of 41907) Premium / discount to peers Current stock price $10.95 $6.39 $13.48 $41.71 $4.27 Shares outstanding 101.3 66.7 278.2 101.2 30.4 Market cap $1,108.7 $426.5 $3,750.3 $4,219.1 $130.0 $499.9 $172.5 $2,374.6 $2,300.0 $175.0 – – – – – (+) Debt + pref $499.9 $172.5 $2,374.6 $2,300.0 $175.0 (-) Cash $107.5 $70.0 $11.2 $27.0 $67.0 (-) Value of non-reserve assets $220.0 Enterprise value $1,281.0 $529.0 $6,113.6 $6,492.2 $6,302.9 $238.0 Production (2Q14 boed) 10,638 3,730 38,166 43,547 2,006 Production value ($80k per boe) $851.0 $298.4 $3,053.3 $3,483.8 $160.5 Production (Consensus 4Q14E boed) 12,510 4,695 45,841 53,288 2,698 Production value ($80k per boe) $1,000.8 $375.6 $3,667.3 $4,263.0 $215.9 Net Williston Basin Acreage 135 120 171 507 339 47 Other acreage adjustment (42) Value per acre of other acreage $0.75 Adjusted Williston net acreage 93 120 171 507 339 47 Value of acreage (net of 2Q14 boed) $398.5 $230.6 $3,060.3 $3,008.4 $77.5 EV / acre (adj.) $4,296 $1,916 $17,897 $5,934 $11,915 $1,657 (86%) EV / 1P reserves $24.17 $35.39 $36.55 $29.64 $33.10 $15.44 (53%) EV / PV10% 1.4x 1.5x 1.4x 1.2x 1.3x 0.7x (45%) EV / 2Q14 daily production $117,460 $141,843 $160,184 $149,084 $154,634 $118,651 (23%) EV / 4Q14E Consensus daily production $99,885 $112,666 $133,366 $121,833 $127,599 $88,206 (31%) Valuation O&G asset analysis Metrics … YET TRADES AT A DISCOUNT 19 ■ AMZG’s market valuation is at a deep discount to it’s Williston peers, despite the Company’s operational performance
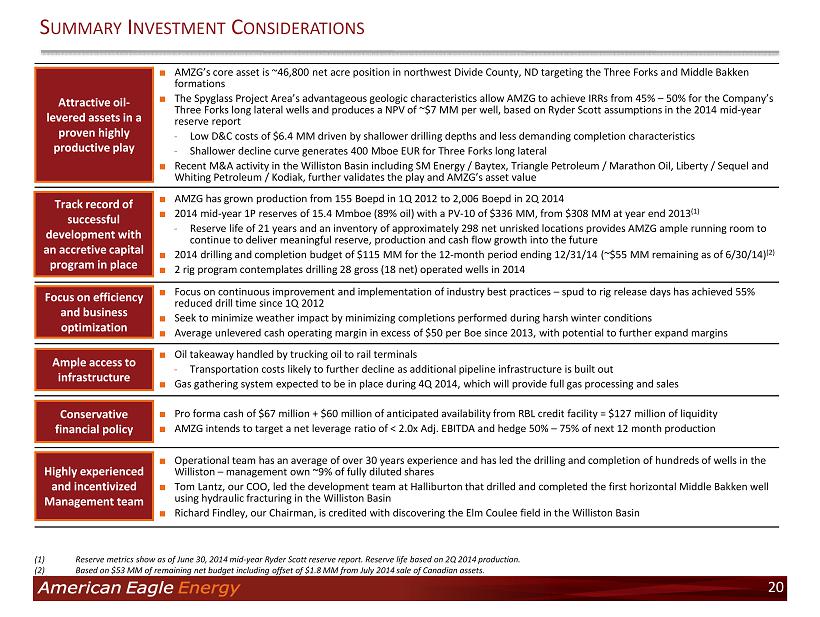
■ AMZG’s core asset is ~46,800 net acre position in northwest Divide County, ND targeting the Three Forks and Middle Bakken formations ■ The Spyglass Project Area’s advantageous geologic characteristics allow AMZG to achieve IRRs from 45% – 50% for the Company’s Three Forks long lateral wells and produces a NPV of ~$7 MM per well, based on Ryder Scott assumptions in the 2014 mid - year reserve report - Low D&C costs of $6.4 MM driven by shallower drilling depths and less demanding completion characteristics - Shallower decline curve generates 400 Mboe EUR for Three Forks long lateral ■ Recent M&A activity in the Williston Basin including SM Energy / Baytex , Triangle Petroleum / Marathon Oil, Liberty / Sequel and Whiting Petroleum / Kodiak, further validates the play and AMZG’s asset value ■ AMZG has grown production from 155 Boepd in 1Q 2012 to 2,006 Boepd in 2Q 2014 ■ 2014 mid - year 1P reserves of 15.4 Mmboe (89% oil) with a PV - 10 of $336 MM, from $308 MM at year end 2013 (1) - Reserve life of 21 years and an inventory of approximately 298 net unrisked locations provides AMZG ample running room to continue to deliver meaningful reserve, production and cash flow growth into the future ■ 2014 drilling and completion budget of $115 MM for the 12 - month period ending 12/31/14 (~$55 MM remaining as of 6/30/14) (2) ■ 2 rig program contemplates drilling 28 gross (18 net) operated wells in 2014 ■ Focus on continuous improvement and implementation of industry best practices – spud to rig release days has achieved 55% reduced drill time since 1Q 2012 ■ Seek to minimize weather impact by minimizing completions performed during harsh winter conditions ■ Average unlevered cash operating margin in excess of $50 per Boe since 2013, with potential to further expand margins ■ Oil takeaway handled by trucking oil to rail terminals - Transportation costs likely to further decline as additional pipeline infrastructure is built out ■ Gas gathering system expected to be in place during 4Q 2014, which will provide full gas processing and sales ■ Pro forma cash of $67 million + $60 million of anticipated availability from RBL credit facility = $127 million of liquidity ■ AMZG intends to target a net leverage ratio of < 2.0x Adj. EBITDA and hedge 50% – 75% of next 12 month production ■ Operational team has an average of over 30 years experience and has led the drilling and completion of hundreds of wells in t he Williston – management own ~9% of fully diluted shares ■ Tom Lantz, our COO, led the development team at Halliburton that drilled and completed the first horizontal Middle Bakken wel l using hydraulic fracturing in the Williston Basin ■ Richard Findley, our Chairman, is credited with discovering the Elm Coulee field in the Williston Basin Highly experienced and incentivized Management team Attractive oil - levered assets in a proven highly productive play S UMMARY I NVESTMENT C ONSIDERATIONS Track record of successful development with an accretive capital program in place 20 Conservative financial policy (1) Reserve metrics show as of June 30, 2014 mid - year Ryder Scott reserve report. Reserve life based on 2Q 2014 production. (2) Based on $53 MM of remaining net budget including offset of $1.8 MM from July 2014 sale of Canadian assets. Focus on efficiency and business optimization Ample access to infrastructure
21 C ONTACT I NFORMATION Marty Beskow, CFA Vice President of Capital Markets & Strategy American Eagle Energy Corporation 2549 West Main Street, Suite 202 Littleton, CO 80120 720 - 330 - 8378 martybeskow@amzgcorp.com
22 A PPENDIX

■ Senior management and advisors with exceptional experience in developing projects in the Bakken and Three Forks formations - Chairman of the Board credited with mapping the “Sleeping Giant” porosity trend within the Middle Bakken Formation and subsequent development of the field in partnership with Lyco Energy and Halliburton - Operations Team with background in drilling, completion, development and production, including the economic exploitation of the Elm Coulee Field ■ Chief executive with proven abilities to execute strategy and increase performance, as evident through our JV partnership with a ~$45 BN utility company ■ A dedicated capital markets and strategy professional with depth of experience in both financial and corporate strategy H IGHLY EXPERIENCED AND INCENTIVIZED M ANAGEMENT TEAM 23 Management and Technical Team Prior Company Experience Brad Colby President and Chief Executive Officer 30 + years experience Richard Findley Chairman of the Board 35+ years experience Kirk Stingley Chief Financial Officer 25+ years experience Tom Lantz Chief Operations Officer 35 + years experience Marty Beskow VP of Capital Markets and Strategy 20 + years experience Richard Pershall Operations Manager 3 0 + years experience

Strategies Ability to Execute 2014 Year End Goals ■ Continue to validate our Spyglass Area through strong operated well results and increasing well economics ■ Plan on drilling 18 net (28 gross) wells in 2014 with 40% to 60% IRRs (1) ■ Decreased long - lateral well cost from $6.8 MM at mid - year 2013 to $6.4 MM at 2013 year - end ■ To trade in - line with our Williston peer group on a proved reserve, $/Acre, and PV - 10 basis ■ Reduce long - lateral well costs to under $6.0 MM ■ Significantly increase reserves and production through drill bit execution ■ Plans to run 2 rigs in 2014 ■ Experienced technical teams to execute drilling plan most efficiently ■ Drill 18 net operated wells in Spyglass Area ■ Grow total production to >3,000 Boepd ■ Continue accretive acreage acquisition in Spyglass Area ■ Track record of accretive acreage and production acquisition ■ Acquired assets from our JV partner – a ~$45 BN utility company – for $47 MM in March 2014 ■ Increase net acreage to ~45,600 net acres (achieved 3/31/14), currently at ~46,800 ■ Maintain strong liquidity position and conservative balance sheet ■ $67 MM of cash (2) ■ Successful track record of structuring acreage and well development deals ■ Execute value accretive acquisitions to meet strategic objectives above ■ Implement hedging program to limit commodity price sensitivity 24 S TRATEGY & 2014 Y EAR E ND G OALS (1) IRRs are Management estimates based on Ryder Scott reserve report assumptions. ( 2) Estimate as of June 30, 2014, as adjusted for the senior secured notes offering that closed August 27, 2014.

W ILLISTON B ASIN – S TRATIGRAPHY 25

Selected Three Forks long lateral operated well results validate Ryder Scott type curve and ~400 B oe EURs AMZG T HREE F ORKS O PERATED R ESULTS V S . R YDER S COTT T YPE C URVE AMZG Operated Three Forks Long Lateral Well Results Vs. The Ryder Scott Type Curve (Oil Only) 26 - 100 200 300 400 500 600 700 800 900 1,000 - 100 200 300 400 500 600 700 800 Christianson 15-12 Cody 15-11 Coplan 1-3 Anton 3-4 Megan 14-12 Haagenson 3-2 Violet 3-3 Roberta 1-3 Muzzy 15-33S Type Curve Boepd Days
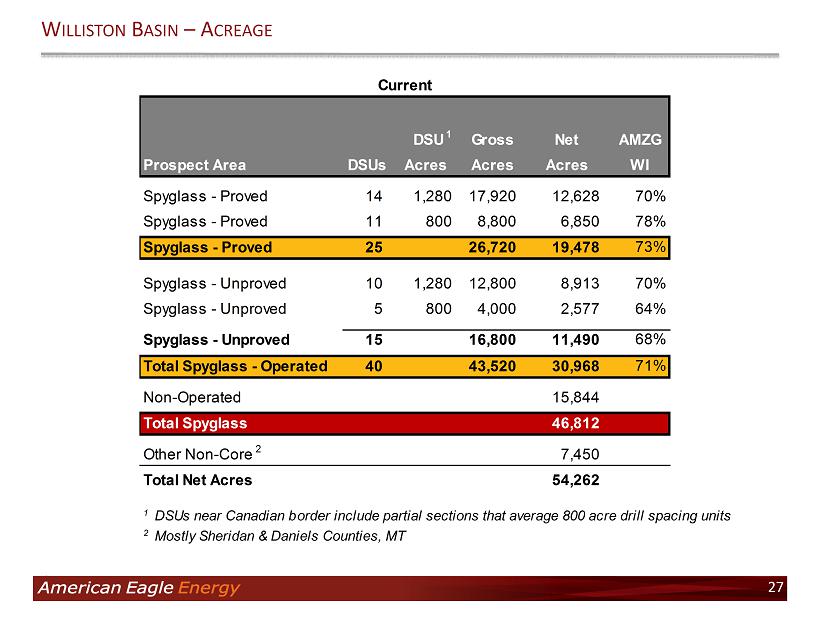
W ILLISTON B ASIN – A CREAGE 27 DSU 1 Gross Net AMZG Prospect Area DSUs Acres Acres Acres WI Spyglass - Proved 14 1,280 17,920 12,628 70% Spyglass - Proved 11 800 8,800 6,850 78% Spyglass - Proved 25 26,720 19,478 73% Spyglass - Unproved 10 1,280 12,800 8,913 70% Spyglass - Unproved 5 800 4,000 2,577 64% Spyglass - Unproved 15 16,800 11,490 68% Total Spyglass - Operated 40 43,520 30,968 71% Non-Operated 15,844 Total Spyglass 46,812 Other Non-Core 2 7,450 Total Net Acres 54,262 1 DSUs near Canadian border include partial sections that average 800 acre drill spacing units 2 Mostly Sheridan & Daniels Counties, MT Current

A DJUSTED EBITDA RECONCILIATION 28 ($ in 000's) 2013 2012 2011 2014 2013 2014 2013 Reconcilitation of Net Income (Loss) to EBITDA: Net Income $1,594 ($9,293) $4,454 ($3,900) $2,637 ($4,928) $2,993 Less: Interest and dividend income ($81) ($72) ($75) ($12) ($18) ($28) ($39) Add: Interest expense 5,356 1 – 3,251 415 6,466 833 Add: Income tax expense (benefit) 1,769 (1,240) 99 (2,103) 1,193 (2,742) 2,285 Add: Depreciation, depletion and amortization 10,073 2,860 97 5,707 2,116 9,343 3,391 EBITDA $18,711 $7,744 $4,575 $2,943 $6,343 $8,111 $9,463 Add: stock-base compensation $1,203 $822 $31 $445 $287 $899 $525 Add: Change in fair value of derivatives 815 123 – 6,200 (187) 8,023 (159) Add: Loss on early exstinguishment of debt 3,714 – – – – – – – – Add: Impairment of oil and gas properties 1,732 10,631 – – – – – – 1,525 Add: Gain on sale of oil and gas properties – – (6,395) – – – – Adjusted EBITDA $26,175 $3,832 ($1,789) $9,588 $6,443 $17,033 $11,354 For the Year Ended December 31, For the Three-Month Period Ended June 30, For the Six-Month Period Ended June 30,