Attached files
| file | filename |
|---|---|
| 8-K - 8-K - CMS ENERGY CORP | a14-21531_18k.htm |
Exhibit 99.1
|
|
Barclays Select 2014 Series – U.S. Utility CEO Asia Week September 29, 2014 Content How it Works Upsides Partners Investment Passion to Improve |
|
|
Barclays Select 2014 Series – U.S. Utility CEO Asia Week October 1, 2014 Content How it Works Upsides Partners Investment Passion to Improve |

|
|
This presentation is made as of the date hereof and contains “forward-looking statements” as defined in Rule 3b-6 of the Securities Exchange Act of 1934, Rule 175 of the Securities Act of 1933, and relevant legal decisions. The forward-looking statements are subject to risks and uncertainties. All forward-looking statements should be considered in the context of the risk and other factors detailed from time to time in CMS Energy’s and Consumers Energy’s Securities and Exchange Commission filings. Forward-looking statements should be read in conjunction with “FORWARD-LOOKING STATEMENTS AND INFORMATION” and “RISK FACTORS” sections of CMS Energy’s and Consumers Energy’s Form 10-K for the year ended December 31, 2013 and as updated in subsequent 10-Qs. CMS Energy’s and Consumers Energy’s “FORWARD-LOOKING STATEMENTS AND INFORMATION” and “RISK FACTORS” sections are incorporated herein by reference and discuss important factors that could cause CMS Energy’s and Consumers Energy’s results to differ materially from those anticipated in such statements. CMS Energy and Consumers Energy undertake no obligation to update any of the information presented herein to reflect facts, events or circumstances after the date hereof. The presentation also includes non-GAAP measures when describing CMS Energy’s results of operations and financial performance. A reconciliation of each of these measures to the most directly comparable GAAP measure is included in the appendix and posted on our website at www.cmsenergy.com. CMS Energy provides historical financial results on both a reported (Generally Accepted Accounting Principles) and adjusted (non-GAAP) basis and provides forward-looking guidance on an adjusted basis. Management views adjusted earnings as a key measure of the company’s present operating financial performance, unaffected by discontinued operations, asset sales, impairments, regulatory items from prior years, or other items. These items have the potential to impact, favorably or unfavorably, the company's reported earnings in future periods. Investors and others should note that CMS Energy and Consumers Energy post important financial information using the investor relations section of the CMS Energy website, www.cmsenergy.com and Securities and Exchange Commission filings. 1 |
|
|
2 Content 3 CMS Energy at a Glance 4 Model 5 Consumers Energy 6 O&M Cost Control 7 Customer-Focused O&M Reinvestment 8 Michigan’s Recovery 9 Governor’s Race 10 Energy Law 11 Ten-Year Plan 12 Capacity Opportunities 13 Capacity Price Increases 14 Passion to Improve Detailed Update Quick Update 17 Consumers Energy 18 Model 19 Catch-Up 20 Ten-Year Plan 21 Customer-Driven Investment 22 Capacity Opportunities 23 New Capacity Ops 24 MISO Zone 7 25 Michigan’s Recovery 26 Sales Growth 27 Economic Growth 28-29 O&M Cost Control 30-31 Customer-Focused O&M Reinvestment 32 Energy Law 33 Governor’s Race 34 Constructive Regulation 35 Customer Satisfaction 36 Sustainability 37 Passion to Improve 38 Mindset 39-55 Appendix 56-58 GAAP |
|
|
Targeting twelfth year of industry-leading financial performance $15 billion investment plan ahead – self-funded! Strong cost control – a top performer! Conservative planning – upsides not in plan Supportive regulation – top tier 2008 visionary Energy Law – improvements in 2014/2015 3 CMS Energy at a Glance . . . . . . . . visible, predictable long-term growth. a Adjusted EPS (non-GAAP) excluding MTM in 2004-2006 EPS a “Real” Growth (No “Resets”) $2 Target 5% - 7% Actual EPS = 7% +11% +7% +12% +12% +4% +7% +7% +7% +8% +7% +6% +7% +5% Consistent Performance EPS + Dividend Yield = 11% EPS + Dividend Yield = 11% Target 6% - 8% Actual EPS = 8% |

|
|
4 HOW IT WORKS -- Model . . . . Investment Ten year - $15 billion Small, bite size projects None “Bet The Company” Self-funded Catalysts Capex >$15 billion PPA’s expire = 2,000 MW Zone 7 capacity shortfall Capacity price increases Conservative sales planning Continuous cost reductions Self-Imposed Limits Sustainable base rates < 2% inflation Investment “Needed Not Wanted” RESULTS Consistent Predictable . . . . benefits customers AND owners. |

|
|
5 HOW IT WORKS -- Consumers Energy . . . . Electric Utility 1.8 million electric customers 8,600 MW of capacity Gas Utility 1.7 million gas customers 312 TBtu gas storage (3rd biggest in US) Territory . . . . one of largest investors and employers in Michigan. Lake Winds Energy Park Fourth largest combination utility in the United States! Overview Fourth largest combination utility in the United States! Premium Regulatory Environment Jackson Cross Winds Energy Park |

|
|
UPSIDES -- Include O&M Cost Control . . . . . . . . which allows us to make customer-focused investments. Average Annual O&M Change +6% -2% -2% _ _ _ _ _ a -8% Before reinvestment +2% CMS CMS CMS CMS CMS -1% Upside? _ _ _ _ _ a O&M change excluding 2013 major storms Amount (mils) 2012 2013 2014 Cost reduction Reinvest Cost reduction Reinvest $1,050 Continuous Cost Reductions +5% Plan Conservatively 6 Peers Peers Peers |
|
|
7 UPSIDES -- Customer-Focused O&M Reinvestment . . . . Adjusted EPS (non-GAAP) . . . . maximizes benefit for customers AND investors. 2013 2013 Cold Winter & Cost Savings $1.66 +7% 2012 Warm Winter 2012 Cost Saving +13¢ 2012 Hot Summer Reinvested earlier -13¢ 2012 Icy Late December O&M B/(W) Than Forecast (mils) Storm(total $50 M) $(37) Insurance 16 Lower contributions 9 Sales-weather 12 Total $ 0 2013 Reinvestment Reinvestment Amount EPS (mils) Electric reliability $14 3¢ Gas reliability 16 4 Generation & Corp “pull-aheads” 7 2 Service restoration cost & other 21 5 Subtotal - pre-Nov/Dec Storms $58 14¢ November Service Restoration 15 3 |

|
|
8 UPSIDES -- Michigan’s Recovery . . . . . . . . among the best in the nation. Gross Domestic Product – 2010 through 2013 Source: U.S. Department of Commerce – bea.gov, real GDP 2009 chained dollars, 2013 advance and 2009 – 2012 revised, 6/12/14 Highest quintile Fourth quintile Third quintile Second quintile Lowest quintile WA 8.8 OR 17.3 CA 7.6 NV 3.2 MT 11.6 ID 5.5 WY 4.3 UT 14.5 AZ 7.6 NM 3.6 CO 10.3 ND 54.9 SD 11.3 NE 13.1 KS 9.4 OK 11.8 TX 18.9 MN 11.5 IA 10.3 MO 3.0 AR 9.4 LA 5.8 WI 7.4 IL 5.4 MS 5.2 AL 6.9 TN 8.9 MI 11.4 IN 12.1 OH 10.5 KY 9.3 VA 5.0 WV 9.2 PA 5.7 MD 5.9 DE 3.5 NJ 4.1 NY 6.5 CT 1.7 RI 5.0 NH 6.2 MA 9.8 ME 1.7 DC 3.5 HI 7.7 AK 3.2 FL 4.0 GA 5.1 SC 7.6 NC 7.4 VT 9.8 U.S. Total = 8.4% Grand Rapids 15.3% Top 10% of All Cities! Michigan Top 10 state |
|
|
9 PARTNERS -- Michigan Governor’s Race . . . . . . . . focus on non-energy issues. Mark Schauer Democrat, Challenger Rick Snyder Republican, Incumbent Campaign Issues Education Jobs Roads Detroit On Energy On ROA As Senate Democratic Leader, Mark played a key role in the successful passage of the 2008 Energy Law. “Choice creates a lot of challenges and problems, essentially trying to arbitrage markets.” -Governor Rick Snyder |

|
|
PARTNERS -- Michigan Energy Law Update . . . . Historical test year 12-18 months regulatory lag No cap on ROA 10% renewables by 2015 Energy efficiency standards File-and-implement 10% ROA cap Adaptability Reliability Affordability Environmental protection Before 2008 TODAY 2015 Improvements . . . . builds on visionary 2008 Law! Gov. signed new rate design bill Legislative workgroups formed to study 2015 Energy Law improvements Update 10 |
|
|
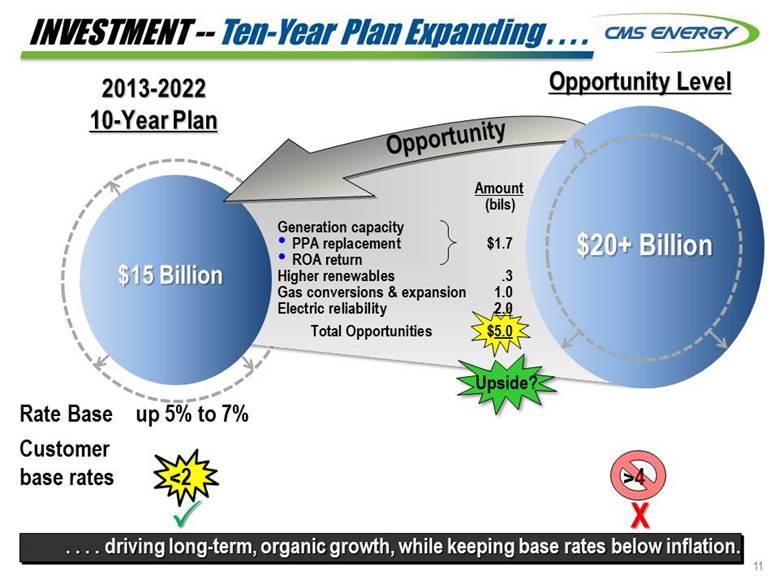
INVESTMENT -- Ten-Year Plan Expanding . . . . . . . . driving long-term, organic growth, while keeping base rates below inflation. 2013-2022 10-Year Plan Opportunity Level $15 Billion $15 Billion X Rate Base up 5% to 7% Customer base rates <2 >4 $20+ Billion Opportunity Amount (bils) Generation capacity PPA replacement $1.7 ROA return Higher renewables .3 Gas conversions & expansion 1.0 Electric reliability 2.0 Total Opportunities $5.0 Upside? 11 |
|
|
INVESTMENT -- Capacity Opportunities . . . . . . . . emerging with replacement not yet in plan. Capacity Growth Over Next Ten Years ~800 MW 1,240 MW MW PPA 2,600 capacity ~30% ~8,600 MW 540 MW 410 MW Shortfall Owned 6,000 780 MW 900 MW Potential for ~3,000 MW of owned capacity 2,000 MW 11,000 Further Upside PPA’s Expire Owned 8,820 PPA 580 Not in plan 12 |
|
|
13 INVESTMENT -- Capacity Price Increases . . . . . . . . could add value to the 700 MW “DIG” plant. Capacity price ($ kW per month) Today (mils) Future Scenarios (mils) $55 $35 +$50 Opportunity Recent Contracts DIG “energy” contract 9 years 250 MW @ $4.06 kW per month < +$30 $5 Upside: Capacity and energy contracts layered in over time |
|
|
14 PASSION TO IMPROVE -- Includes Lasting . . . . . . . . premier cost control, customer satisfaction, and employee engagement. Customer Satisfaction Employee Engagement Residential First Second Fourth 2011 2014 2016 Cost Control Utility O&M 2011 2013 2018 Second Third Fourth 1st Quartile 2011 2012 2013 1st Quartile 1st Quartile Third +15% Gas Electric Down 10% 2014-2018 CMS Peers Down 5% |
|
|
15 |
|
|
September 29, 2014 Content How it Works Investment Upsides Partners Passion to Improve Barclays Select 2014 Series – U.S. Utility CEO Asia Week |
|
|
October 1, 2014 Content How it Works Investment Upsides Partners Passion to Improve Barclays Select 2014 Series – U.S. Utility CEO Asia Week |

|
|
17 HOW IT WORKS -- Consumers Energy . . . . Electric Utility 1.8 million electric customers 8,600 MW of capacity Gas Utility 1.7 million gas customers 312 TBtu gas storage (3rd biggest in US) Territory . . . . one of largest investors and employers in Michigan. Lake Winds Energy Park Fourth largest combination utility in the United States! Overview Fourth largest combination utility in the United States! Premium Regulatory Environment Jackson Cross Winds Energy Park |
|
|
18 HOW IT WORKS -- Model . . . . Investment Ten year - $15 billion Small, bite size projects None “Bet The Company” Self-funded Catalysts Capex >$15 billion PPA’s expire = 2,000 MW Zone 7 capacity shortfall Capacity price increases Conservative sales planning Continuous cost reductions Self-Imposed Limits Sustainable base rates < 2% inflation Investment “Needed Not Wanted” RESULTS Consistent Predictable . . . . benefits customers AND owners. |

|
|
19 INVESTMENT -- “Catch-Up” . . . . . . . . creating an opportunity for the next ten years. Amount (billions) $1.8 CMS Peers _ _ _ _ _ Source: 10K; actual amounts through 2013 smoothed for illustration Restructuring Catch-Up $1.5 per year Investment Criteria: Reduces fuel cost Lowers O&M Adds customer value Meets state & federal mandates |

|
|
INVESTMENT -- Ten-Year Plan Expanding . . . . . . . . driving long-term, organic growth, while keeping base rates below inflation. 2013-2022 10-Year Plan Opportunity Level $15 Billion $15 Billion X Rate Base up 5% to 7% Customer base rates <2 >4 $20+ Billion Opportunity Amount (bils) Generation capacity PPA replacement $1.7 ROA return Higher renewables .3 Gas conversions & expansion 1.0 Electric reliability 2.0 Total Opportunities $5.0 Upside? 20 |

|
|
21 INVESTMENT -- Customer-Driven . . . . Clean Power $2.3 Billion Reliability $4.2 Billion . . . . remains small and incremental, with no big bets. Renewable energy Jackson gas plant Gas storage Propane switching Gas transmission Gas distribution Electric reliability Consumers Smart Energy Electric distribution Capacity $1.6 Billion Infrastructure $5.4 Billion Environmental Gas conversion Ludington Pumped Storage Opportunity $5 Billion Gas combined cycle Gas infrastructure Higher renewables |
|
|
22 INVESTMENT -- Capacity Opportunities . . . . . . . . emerging with replacements not yet in plan! ~800 MW 1,240 MW MW PPA 2,600 capacity ~30% ~8,600 MW 540 MW 410 MW Shortfall Owned 6,000 780 MW 900 MW Potential for ~3,000 MW of owned capacity 2,000 MW 11,000 Further Upside PPA’s Expire Owned 8,820 PPA 580 Not in plan Capacity Growth Over Next Ten Years |

|
|
23 INVESTMENT -- New Capacity Ops . . . . Replace PPA With New Build Full Year Impact Customer Bill Investor (mils) (EPS) 1,000 MW of PPA’s expire - $325 0 ¢ Add 1,000 MW owned capacity + 325 + 5 Impact Flat Incremental Step-up Not in Plan 2 points Build - Thetford Expand - Zeeland Buy - ? LT PPA . . . . add earnings growth, without increasing bills! + 5¢ Upside: Capacity Options |

|
|
24 INVESTMENT -- MISO Zone 7 Capacity . . . . . . . . shortfall expected to be 2,000 MW in 2016. As of June 2, 2014 (in GW) 22.8 3.2 21.6 24.8 Reserves Demand 2.0 _ _ _ _ _ Source: MISO MISO Zones 7 |
|
|
25 UPSIDES -- Michigan’s Recovery . . . . . . . . among the best in the nation. Gross Domestic Product – 2010 through 2013 Source: U.S. Department of Commerce – bea.gov, real GDP 2009 chained dollars, 2013 advance and 2009 – 2012 revised, 6/12/14 Highest quintile Fourth quintile Third quintile Second quintile Lowest quintile WA 8.8 OR 17.3 CA 7.6 NV 3.2 MT 11.6 ID 5.5 WY 4.3 UT 14.5 AZ 7.6 NM 3.6 CO 10.3 ND 54.9 SD 11.3 NE 13.1 KS 9.4 OK 11.8 TX 18.9 MN 11.5 IA 10.3 MO 3.0 AR 9.4 LA 5.8 WI 7.4 IL 5.4 MS 5.2 AL 6.9 TN 8.9 MI 11.4 IN 12.1 OH 10.5 KY 9.3 VA 5.0 WV 9.2 PA 5.7 MD 5.9 DE 3.5 NJ 4.1 NY 6.5 CT 1.7 RI 5.0 NH 6.2 MA 9.8 ME 1.7 DC 3.5 HI 7.7 AK 3.2 FL 4.0 GA 5.1 SC 7.6 NC 7.4 VT 9.8 U.S. Total = 8.4% Grand Rapids 15.3% Top 10% of All Cities! Michigan Top 10 state |
|
|
26 UPSIDES -- Sales Growth . . . . . . . . planned conservatively. Annual Electric Salesa Economic Indicators Grand Rapids Michigan U.S Building Permits* +42% +18% +9% GDP (real) 2010 thru 2013 15.3 11.4 8.4 Population 2010 Census thru July 2013 3 0 2 Unemployment July 2014 5.3 7.7 6.2 *Annualized numbers thru July 2014 _ _ _ _ _ a Weather normalized vs prior year b Negative with “E1” Growth Upside? Upside? 8% |
|
|
27 UPSIDES -- Economic Growth . . . . . . . . almost 2% of sales growth, layered in over time. Electric Gas Combination Brembo 24 MW Enbridge Energy 19 GM Assembly 10 MSU FRIB 9 WKW Roof Rack Systems 8 Betz Industries 8 Dart Container 5 MACI 5 Magna-Cosma Casting 4 Durolast Roofing 4 Betz MSU FRIB Total 96 MW ~ Continental Dairy Durolast Roofing GM Assembly Examples of New Business Top Ten (MW) Dicastal North America, Inc. World’s largest maker of alloy wheels 300 new jobs $140 million investment Production begins in 2015 Recent Annoucement Plasan Carbon Composites High performance auto body parts 620 new jobs $29 million investment Phased in next 3 years Recent Annoucement Enbridge MACI Dart Brembo Denso WKW Post Magna-Cosma |
|
|
28 UPSIDES -- O&M Cost Control . . . . . . . . allows us to make customer-focused investments. Average Annual O&M Change +6% -2% -2% _ _ _ _ _ a -8% Before reinvestment +2% CMS CMS CMS CMS CMS -1% Upside? _ _ _ _ _ a O&M change excluding 2013 major storms Amount (mils) 2012 2013 2014 Cost reduction Reinvest Cost reduction Reinvest $1,050 Continuous Cost Reductions +5% Plan Conservatively Peers Peers Peers |
|
|
29 UPSIDES -- O&M Cost Control . . . . Average Annual O&M Change +6% -2% -2% Plan Conservatively Upside? _ _ _ _ _ a -8% Before reinvestment +2% CMS CMS CMS CMS CMS Future Examples Fuel Mix Benefits MW Employees 2016 Retire Coal - 950 - 300 2016 Add GCC + 540 + 20 Total -410 - 280 Future Savings (mils) $25 2002-2012 Actions completed $25 2013 EGWP, OPEB & other 50 $75 Fuel and Benefits $100 . . . . provides headroom for conservative planning ahead. CMS -1% Future Savings 2014 - 2018 Peers Peers Peers |
|
|
30 UPSIDES -- Customer-Focused O&M Reinvestment . . . . Adjusted EPS (non-GAAP) . . . . maximizes benefit for customers AND investors. 2013 2013 Cold Winter & Cost Savings $1.66 +7% 2012 Warm Winter 2012 Cost Saving +13¢ 2012 Hot Summer Reinvested earlier -13¢ 2012 Icy Late December O&M B/(W) Than Forecast (mils) Storm(total $50 M) $(37) Insurance 16 Lower contributions 9 Sales-weather 12 Total $ 0 2013 Reinvestment Reinvestment Amount EPS (mils) Electric reliability $14 3¢ Gas reliability 16 4 Generation & Corp “pull-aheads” 7 2 Service restoration cost & other 21 5 Subtotal - pre-Nov/Dec Storms $58 14¢ November Service Restoration 15 3 |

|
|
31 UPSIDES -- Customer-Focused O&M Reinvestment . . . . . . . . delivers for both customers AND owners. 2014 2013 Adjusted EPS (non-GAAP) Guidance January March 31 June 30 December +9¢ +14¢ +18¢ +9¢ +15¢ 2nd QTR 7%- 6% Good choices ahead (3)¢ O&M Reinvestment: Reliability (2) Parent debt prefunding (3) Weather 22¢ Cost savings 4 Reinvest & other (11) Total 15¢ Sales & other 2¢ |

|
|
32 PARTNERS -- Michigan Energy Law Update . . . . Historical test year 12-18 months regulatory lag No cap on ROA 10% renewables by 2015 Energy efficiency standards File-and-implement 10% ROA cap Adaptability Reliability Affordability Environmental protection Before 2008 TODAY 2015 Improvements . . . . builds on visionary 2008 Law! Gov. signed new rate design bill Legislative workgroups formed to study 2015 Energy Law improvements Update |
|
|
33 PARTNERS -- Michigan Governor’s Race . . . . . . . . focus on non-energy issues. Mark Schauer Democrat, Challenger Rick Snyder Republican, Incumbent Campaign Issues Education Jobs Roads Detroit On Energy On ROA As Senate Democratic Leader, Mark played a key role in the successful passage of the 2008 Energy Law. “Choice creates a lot of challenges and problems, essentially trying to arbitrage markets.” -Governor Rick Snyder |
|
|
34 PARTNERS -- Constructive Regulation . . . . . . . . is supported by a quality Commission and a strong Law. Tier 1 State Ranking Barclays Research Michigan John Quackenbush (R), Chairman Term Ends: July 2, 2017 Greg White (I) Term Ends: July 2, 2015 Sally Talberg (I) Term Ends: July 2, 2019 Commission |
|
|
PASSION TO IMPROVE -- Customer Satisfaction . . . . . . . . the most improved gas utility in the U.S.! Consumers 2014 JD Power Survey - 2014 Results by Category 2014 Midwest Average +33 744 634 625 589 742 1st Quartile! 1st Quartile! 1st Quartile! 2014 Improvement Comm- unication 950 +46 +37 +31 +31 +23 Gas Residential Customers Consumers 2013 Points 35 |
|
|
PASSION TO IMPROVE -- Sustainability . . . . 36 . . . . Consumers Energy ranks among top energy providers in the world. Sustainalytics Overall Score 20% Improvement 80 Recent Performance Ranked 14th out of 226 energy providers worldwide Improvement in all categories: Social Environment Governance +12 +10 + 2 _ _ _ _ _ Sustainalytics is an independent research firm that provides information to investors 2013 Average 61 Points |
|
|
37 PASSION TO IMPROVE -- Includes Lasting . . . . . . . . premier cost control, customer satisfaction, and employee engagement. Customer Satisfaction Employee Engagement Residential First Second Third Fourth 2011 2014 2016 Cost Control Utility O&M 2011 2013 2018 Second Third Fourth 1st Quartile 2011 2012 2013 1st Quartile 1st Quartile Third +15% Gas Electric Down 10% 2014-2018 CMS Peers Down 5% |

|
|
38 Mindset . . . . . . . . drives consistent “no excuse” growth, without resets. $0.81 _ _ _ _ _ Adjusted EPS (non-GAAP) excluding MTM in 2004-2006 a $1.25 excluding discontinued Exeter operations and accounting changes related to convertible debt and restricted stock Int’l Sale a 10-Year Actual 7% CAGR Dividend Payout 0% 25% 30% 40% 49% 58% 62% 62% 60%-70% 32% 27% 14% 39% 80% Peers 4% 6% 5% - 7% 5% - 7% $1.66 Future Dividend EPS |
|
|
Appendix |
|
|
40 Environmental Agreement with EPA . . . . . . . . keeping our promise to make it better than we found it. Environmental Strategy Agreement CMS is moving towards a balanced generation portfolio with more gas and renewables, reducing our carbon footprint Plan to have full controls on all five larger coal plants: Mercury Sulfur Nitrogen oxide Particulate matter Plan to comply with all state and federal regulations Full reserve established in 2013 Potential to capitalize No impact to 2014 guidance No change to 10-year capex plan Financial Impact Settlement Spending $2 billion in upgrades at power plants Invest $7.7 million in environmental mitigation projects Pay $2.75 million penalty |
|
|
41 2015 Gas Rate Case . . . . Overview Rate Base (bils) XX ROE XX Equity - Regulatory XX Equity - Financial XX Residential Gas Customer Cost . . . . supports capital investment offset partially by lower costs. Amount (Mils) Capital Investment $ Cost & Other (56) Request $ 88 2016-2017 Investment Recovery Mechanism $ 92 Existing $3.14 10.3% 41.3 50.9 144 Request $3.65 10.7% 41.7 52.5 Amount $3.00 2.00 1.00 June 2012 June 2015 1.04 1.40 $2.44 1.12 1.12 $2.24 Projected 9% decrease! (per day) GCR Base rate (2012) (2015) |

|
|
42 Regulation & Self-Initiated Steps . . . . Self-initiated Rate design, regulatory ROA Policy, legislation Consumers higher than Midwest peer avg Below Midwest peers . . . . being taken to maintain competitive bills & improve industrial rates. House Bill 5476 Industrial Electric Rate (vs Midwest Average) Signed into law on June 17th, 2014 Directs MPSC to develop cost of service allocation and rate design methods Company to include new rate design in next electric rate case MPSC to approve rate design within 270 days |
|
|
43 Consumers Appears . . . . . . . . to be in a good carbon position. Carbon Tonnage Reduction (Preliminary) Million Tons of CO2 Consumers Energy 2014 2030 2020 2025 2029 Clean Power Plan Projected emission level “Implied” EPA Target |
|
|
44 Capacity Diversity . . . . . . . . evolving to cleaner generation while becoming more cost competitive. 2005 2017 2014 |
|
|
45 Generation Strategy: New Supply Sources . . . . . . . . combined cycle gas is the most attractive new source of supply. Levelized cost of new build (¢/kWh) Gas price= $3.00 $4.50 $6.00 W/ tax credit W/o tax credit W/ emission controls Today $3.00 per watt 5¢ 6¢ 7¢ 6¢ 9¢ 10¢ 12¢ 22¢ 8¢ Back -up 11¢ Back -up 6¢ Wind Combined Cycle Gas Plant Residential Solar 15¢ Future $2.00 per watt? Consumers Energy Sources 5¢ 7¢ 5.5¢ New Build Zeeland Cross Winds 6¢ Big 5 Palisades |

|
|
46 Electric Distribution . . . . Demand $ 1.0 Billion . . . . investing $2 billion over the next 5 years. Reliability $ 0.7 Billion Capacity $ 0.3 Billion Total $ 2.0 Billion Circuits In service 2,253 Upgrade 603 Transformers In service 663,044 Replace 16,175 Poles In service 1,554,309 40 years old 761,711 Replace 50,763 Meters In service 2,039,283 Replace 1,732,393 |
|
|
47 Cleaner Generation . . . . . . . . puts us in a good position to meet carbon regulations. Cross Winds Energy Park 105 MW Jackson Plant, 540 MW Ludington Pumped Storage Plant 1,872 MW Campbell Generating Plant, 1,455 MW Karn Generating Plant, 515 MW Diverse Capacity Balanced Portfolio Renewables Lake Winds Energy Park 100 MW Capacity % Gas Clean Coal Clean Coal Renewables Pumped Storage 2005 Coal Gas Pumped Storage Renewables Oil Nuclear Purchases 10% 47% Gas & Renewables 2017 |
|
|
48 Credit Ratings . . . . . . . . just upgraded, more ahead? Consistent Performance Less Risk Customer Focus Constructive Regulation Good Energy Policy Reflects Present Prior 2002 Scale S&P / Fitch Moody’s S&P (March) Moody’s (January) Fitch (February) A+ A1 A A2 Consumers Secured A- A3 BBB+ Baa1 BBB Baa2 BBB- Baa3 BB+ Ba1 CMS Unsecured BBB Baa2 BBB- Baa3 BB+ Ba1 BB Ba2 BB- Ba3 B+ B1 B B2 B- B3 Outlook Positive Stable Stable |
|
|
49 Operating Cash Flow Growth . . . . Amount (bils) $ Investment Cash flow before dividend _ _ _ _ _ a Non-GAAP NOLs & Credits $0.7 $0.6 $0.4 $0.5 $0.4 $0.2 $0.1 Gross operating cash flowa up $0.1 billion per year . . . . self-funds investment and strategy. Up $0.5 Billion $2.1 Interest Working capital and taxes $1.6 $1.9 $2.0 $1.7 $1.8 $1.45 $2.2 $1.4 $1.5 2012 2013 2014 2015 2016 2017 2018 |
|
|
50 Electric Customer Base Diversified . . . . . . . . “autos” 5% of 2013 electric gross margin. Hemlock Semiconductor (zero margin) General Motors Nexteer Automotive Corporation Gerdau Macsteel Denso International America Meijer Packaging Corp of America State of Michigan Spectrum Health AT&T Top Ten Customers $2.1 Billion 2013 Electric Gross Margin Residential, 50% Commercial, 32% Industrial, 14% Percentage of electric gross margin is 2.5% Other 4% 2013 ranked by deliveries |
|
|
51 Capital Expenditures 2013-2017 2018-2022 Total 2013 2014 2015 2016 2017 Subtotal Subtotal 2013-2022 (mils) (mils) (mils) (mils) (mils) (mils) (mils) (mils) New Generation (includes Renewables) $136 $222 $61 $213 $44 $676 $1,105 $1,781 Environmental 314 280 201 122 114 1,031 420 1,451 Gas 172 227 237 215 188 1,039 1,435 2,474 Smart Energy 69 84 134 174 120 581 - 581 Electric Reliability 160 244 259 157 179 999 1,405 2,404 Maintenance 601 600 605 601 598 3,005 3,645 6,650 Total $1,452 $1,657 $1,497 $1,482 $1,243 $7,331 $8,010 $15,341 Electric $1,049 $1,212 $1,004 $1,003 $797 $5,065 $5,378 $10,443 Gas 403 445 493 479 446 $2,266 2,632 4,898 Total $- $1,452 $- $1,657 $- $1,497 $- $1,482 $- $1,243 $- $7,331 $- $- $8,010 $- $15,341 |
|
|
52 |
|
|
53 |
|
|
54 |
|
|
55 |
|
|
GAAP Reconciliation |
|
|
57 2003 2004 2005 2006 2007 2008 2009 2010 2011 2012 2013 Reported earnings (loss) per share - GAAP ($0.30) $0.64 ($0.44) ($0.41) ($1.02) $1.20 $0.91 $1.28 $1.58 $1.42 $1.66 After-tax items: Electric and gas utility 0.21 (0.39) - - (0.07) 0.05 0.33 0.03 - 0.17 - Enterprises 0.74 0.62 0.04 (0.02) 1.25 (0.02) 0.09 (0.03) (0.11) (0.01) * Corporate interest and other 0.16 (0.03) 0.04 0.27 (0.32) (0.02) 0.01 * (0.01) * * Discontinued operations (income) loss (0.16) 0.02 (0.07) (0.03) 0.40 (*) (0.08) 0.08 (0.01) (0.03) * Asset impairment charges, net - - 1.82 0.76 0.60 - - - - - - Cumulative accounting changes 0.16 0.01 - - - - - - - - - Adjusted earnings per share, including MTM - non-GAAP $0.81 $0.87 $1.39 $0.57 $0.84 $1.21 (a) $1.26 $1.36 $1.45 $1.55 $1.66 Mark-to-market impacts 0.03 (0.43) 0.51 Adjusted earnings per share, excluding MTM - non-GAAP NA $0.90 $0.96 $1.08 NA NA NA NA NA NA NA * Less than $500 thousand or $0.01 per share. (a) $1.25 excluding discontinued Exeter operations and accounting changes related to convertible debt and restricted stock. Earnings Per Share By Year GAAP Reconciliation (Unaudited) |
|
|
58 2012 2013 2014 2015 2016 2017 2018 Consumers Operating Income + Depreciation & Amortization 1,635 $ (a) 1,740 $ 1,820 $ 1,876 $ 1,952 $ 2,054 $ 2,162 $ Enterprises Project Cash Flows 17 16 25 30 28 35 36 Gross Operating Cash Flow 1,652 $ 1,756 $ 1,845 $ 1,906 $ 1,980 $ 2,089 $ 2,198 $ (411) (335) (395) (356) (730) (739) (748) Net cash provided by operating activities 1,241 $ 1,421 $ 1,450 $ 1,550 $ 1,250 $ 1,350 $ 1,450 $ (a) excludes $(59) million 2012 disallowance related to electric decoupling CMS Energy Reconciliation of Gross Operating Cash Flow to GAAP Operating Activities (unaudited) (mils) Other operating activities including taxes, interest payments and working capital |