Attached files
Table of Contents
As filed with the Securities and Exchange Commission on September 25, 2014.
Registration No. 333-198458
UNITED STATES
SECURITIES AND EXCHANGE COMMISSION
Washington, D.C. 20549
Amendment No. 1
to
FORM S-1
REGISTRATION STATEMENT
UNDER
THE SECURITIES ACT OF 1933
Great Western Bancorp, Inc.
(Exact Name of Registrant as Specified in Its Charter)
| Delaware | 6022 | 47-1308512 | ||
| (State or Other Jurisdiction of Incorporation or Organization) |
(Primary Standard Industrial Classification Code Number) |
(IRS Employer Identification Number) |
100 North Phillips Avenue
Sioux Falls, South Dakota 57104
(605) 334-2548
(Address, Including Zip Code, and Telephone Number, Including Area Code, of Registrant’s Principal Executive Offices)
Donald J. Straka
General Counsel
Great Western Bancorp, Inc.
100 North Phillips Avenue
Sioux Falls, South Dakota 57104
(605) 334-2548
(Name, Address, Including Zip Code, and Telephone Number, Including Area Code, of Agent for Service)
Copies to:
| Mark J. Menting Catherine M. Clarkin Sullivan & Cromwell LLP 125 Broad Street New York, NY 10004 (212) 558-4000 |
Craig E. Chapman James O’Connor Sidley Austin LLP 787 Seventh Avenue New York, NY 10019 (212) 839-5300 |
Approximate date of commencement of proposed sale to the public: As soon as practicable after the effective date of this Registration Statement.
If any of the securities being registered on this form are to be offered on a delayed or continuous basis pursuant to Rule 415 under the Securities Act of 1933, check the following box. ¨
If this form is filed to register additional securities for an offering pursuant to Rule 462(b) under the Securities Act, check the following box and list the Securities Act registration statement number of the earlier effective registration statement for the same offering. ¨
If this form is a post-effective amendment filed pursuant to Rule 462(c) under the Securities Act, check the following box and list the Securities Act registration statement number of the earlier effective registration statement for the same offering. ¨
If this form is a post-effective amendment filed pursuant to Rule 462(d) under the Securities Act, check the following box and list the Securities Act registration statement number of the earlier effective registration statement for the same offering. ¨
Indicate by check mark whether the registrant is a large accelerated filer, an accelerated filer, a non-accelerated filer, or a smaller reporting company. See the definitions of “large accelerated filer,” “accelerated filer” and “smaller reporting company” in Rule 12b-2 of the Securities Exchange Act of 1934.
(Check one):
| Large accelerated filer | ¨ | Accelerated filer | ¨ | |||
| Non-accelerated filer | x (Do not check if a smaller reporting company) | Smaller reporting company | ¨ |
CALCULATION OF REGISTRATION FEE
|
| ||||
| Title of each class of securities to be registered |
Proposed maximum aggregate offering price(1)(2) |
Amount of registration fee(3) | ||
| Common stock, par value $0.01 per share |
$100,000,000 | $12,880 | ||
|
| ||||
|
| ||||
| (1) | Includes shares of common stock that the underwriters have the option to purchase from National Americas Holdings LLC. |
| (2) | Estimated solely for purposes of computing the amount of the registration fee pursuant to Rule 457(o) under the Securities Act of 1933. |
| (3) | Previously paid. |
The Registrant hereby amends this Registration Statement on such date or dates as may be necessary to delay its effective date until the Registrant shall file a further amendment which specifically states that this Registration Statement shall thereafter become effective in accordance with Section 8(a) of the Securities Act of 1933 or until the Registration Statement shall become effective on such date as the Commission, acting pursuant to said Section 8(a), may determine.
Table of Contents
The information in this preliminary prospectus is not complete and may be changed. The selling stockholder may not sell these securities until the registration statement filed with the Securities and Exchange Commission is effective. This preliminary prospectus is not an offer to sell, nor does it seek an offer to buy, these securities in any jurisdiction where such offer or sale is not permitted.
Subject to Completion
Preliminary Prospectus dated September 25, 2014
PROSPECTUS
Shares

Common Stock
This is the initial public offering of shares of common stock of Great Western Bancorp, Inc. All of the shares are being sold by a subsidiary of National Australia Bank Limited, or NAB, our parent company, and we will not receive any of the proceeds from the sale of shares by the NAB selling stockholder. Prior to this offering, there has been no public market for our common stock. We currently estimate that the initial public offering price per share of our common stock will be between $ and $ per share. We intend to apply to list our common stock on the New York Stock Exchange under the symbol “GWB.”
After the completion of this offering, NAB will hold % of the voting power of all outstanding shares of our common stock.
We are an “emerging growth company” as defined in the Jumpstart our Business Startups Act of 2012 and have elected to take advantage of certain reduced public company reporting and disclosure requirements in this prospectus, and we may take advantage of those reduced reporting and disclosure requirements in future filings.
Shares of our common stock are not saving accounts or deposits and are not insured by the Federal Deposit Insurance Corporation or any other government agency.
Investing in our common stock involves significant risks. See “Risk Factors” beginning on page 24 of this prospectus for a discussion of certain risks you should consider before deciding to invest in our common stock.
| Per Share |
Total | |||||||
| Public offering price |
$ | $ | ||||||
| Underwriting discount* |
$ | $ | ||||||
| Proceeds, before expenses, to the NAB selling stockholder |
$ | $ | ||||||
| * | We refer you to “Underwriting” beginning on page 207 of this prospectus for additional information regarding underwriting compensation. |
The NAB selling stockholder has granted the underwriters an option to purchase up to an additional shares of our common stock from the NAB selling stockholder at the initial public offering price less the underwriting discount, within 30 days from the date of this prospectus.
Neither the Securities and Exchange Commission nor any other regulatory body has approved or disapproved of these securities or passed upon the accuracy or adequacy of this prospectus. Any representation to the contrary is a criminal offense.
The shares of common stock will be ready for delivery on or about , 2014.
Joint Book-Running Managers
| Deutsche Bank Securities | BofA Merrill Lynch | |
The date of this prospectus is , 2014.
Table of Contents
| 1 | ||||
| 17 | ||||
| Summary Historical Consolidated Financial and Operating Information |
19 | |||
| 24 | ||||
| 59 | ||||
| 61 | ||||
| 62 | ||||
| 64 | ||||
| 65 | ||||
| Selected Historical Consolidated Financial and Operating Information |
66 | |||
| Management’s Discussion and Analysis of Financial Condition and Results of Operations |
68 | |||
| 125 | ||||
| 128 | ||||
| 150 | ||||
| 163 | ||||
| 174 | ||||
| 187 | ||||
| Our Relationship with NAB and Certain Other Related Party Transactions |
188 | |||
| 199 | ||||
| 204 | ||||
| Material U.S. Federal Tax Considerations for Non-U.S. Holders of Our Common Stock |
206 | |||
| 209 | ||||
| 216 | ||||
| 216 | ||||
| 216 | ||||
| F-1 |
Explanatory Note
Unless we state otherwise or the context otherwise requires, references in this prospectus to:
| • | “we,” “our,” “us” and our “company” refer to: |
| • | GWBI and its consolidated subsidiaries, for all periods prior to the completion of the Formation Transactions; and |
| • | Great Western Bancorp, Inc., a newly formed Delaware corporation, and its consolidated subsidiaries, for all periods after the completion of the Formation Transactions, after giving effect to the Formation Transactions; |
| • | “Great Western” refer to: |
| • | GWBI but not its consolidated subsidiaries, for all periods prior to the completion of the Formation Transactions; and |
| • | Great Western Bancorp, Inc., a newly formed Delaware corporation, excluding its consolidated subsidiaries, for all periods after the completion of the Formation Transactions; |
| • | “GWBI” refer to Great Western Bancorporation, Inc., an Iowa corporation; |
| • | our “bank” refer to Great Western Bank, a South Dakota banking corporation; |
| • | “NAB” refer to National Australia Bank Limited, an Australian public company and our ultimate parent company; |
| • | “NAB selling stockholder” refer to National Americas Holdings LLC, a Delaware limited liability company and wholly owned, indirect subsidiary of NAB that, immediately after the completion of the Formation Transactions, will own all of our issued and outstanding shares of capital stock; |
i
Table of Contents
| • | “NAI” refer to National Americas Investment, Inc., a Delaware corporation and wholly owned, indirect subsidiary of NAB; |
| • | our “stock” refer to our common stock and our non-voting common stock; |
| • | our “states” refer to the seven states (South Dakota, Iowa, Nebraska, Colorado, Arizona, Kansas and Missouri) in which we currently conduct our businesses; |
| • | our “markets” and our “footprint” refer to the geographic markets within our states in which we currently conduct our businesses; |
| • | “fiscal year” refer to our fiscal year, which is based on a twelve-month period ending September 30 of each year (e.g., fiscal year 2013 refers to the twelve-month period ending September 30, 2013); |
| • | our “peers” refer, collectively, to all publicly listed U.S. bank holding companies with total assets between $5 billion and $15 billion at June 30, 2014, and all peer data is obtained from SNL Financial LC, or SNL Financial; and |
| • | the “Formation Transactions” refer to the transactions described in “Prospectus Summary—Our Structure and Formation Transactions—Formation Transactions,” pursuant to which Great Western Bancorp, Inc. was formed and GWBI will merge with and into Great Western Bancorp, Inc., with Great Western Bancorp, Inc. continuing as the surviving corporation and succeeding to all the assets, liabilities and businesses of GWBI, among other related transactions. |
About this Prospectus
We, NAB, the NAB selling stockholder and the underwriters have not authorized anyone to provide any information other than that contained in this prospectus or in any free writing prospectus prepared by or on behalf of us or to which we have referred you. We, NAB, the NAB selling stockholder and the underwriters take no responsibility for, and can provide no assurance as to the reliability of, any other information that others may give you. We are not, and NAB, the NAB selling stockholder and the underwriters are not, making an offer of these securities in any jurisdiction where the offer is not permitted. You should not assume that the information contained in this prospectus is accurate as of any date other than the date on the front of this prospectus.
We have proprietary rights to trademarks, trade names and service marks appearing in this prospectus that are important to our business. This prospectus also contains additional trademarks, trade names and service marks belonging to NAB or one of its affiliates. Solely for convenience, the trademarks, trade names and service marks appearing in this prospectus are without the ® and TM symbols, but such references are not intended to indicate, in any way, that we will not assert, to the fullest extent under applicable law, our rights or the rights of the applicable licensors to these trademarks, trade names and service marks. All trademarks, trade names and service marks appearing in this prospectus are the property of their respective owners.
Any discrepancies included in this prospectus between totals and the sums of the percentages and dollar amounts presented are due to rounding.
Industry and Market Data
Within this prospectus, we reference certain industry and sector information and statistics. We have obtained this information and statistics from various independent, third party sources. Nothing in the data used or derived from third party sources should be construed as advice. Some data and other information are also based on our good faith estimates, which are derived from our review of internal surveys and independent sources. We believe that these external sources and estimates are reliable, but have not independently verified them. Statements as to our market position are based on market data currently available to us. Although we are not aware of any misstatements regarding the demographic, economic, employment, industry and trade association data presented herein, these estimates involve inherent risks and uncertainties and are based on assumptions that are subject to change.
ii
Table of Contents
Implications of Being an Emerging Growth Company
As a company with less than $1.0 billion in revenues during our last fiscal year, we qualify as an “emerging growth company” under the Jumpstart Our Business Startups Act of 2012, or the JOBS Act. An emerging growth company may take advantage of reduced reporting requirements and is relieved of certain other significant requirements that are otherwise generally applicable to public companies. As an emerging growth company:
| • | we may present only two years of audited financial statements and only two years of related management discussion and analysis of financial condition and results of operations; |
| • | we are exempt from the requirement to obtain an attestation and report from our auditors on management’s assessment of our internal control over financial reporting under the Sarbanes-Oxley Act of 2002; |
| • | we are permitted to provide less extensive disclosure about our executive compensation arrangements; and |
| • | we are not required to give our stockholders non-binding advisory votes on executive compensation or golden parachute arrangements. |
We have elected to take advantage of the scaled disclosure requirements and other relief described above in this prospectus and may take advantage of these exemptions for so long as we remain an emerging growth company. We will remain an emerging growth company until the earliest of (i) the end of the fiscal year during which we have total annual gross revenues of $1.0 billion or more, (ii) the end of the fiscal year following the fifth anniversary of the completion of this offering, (iii) the date on which we have, during the previous three-year period, issued more than $1.0 billion in non-convertible debt and (iv) the end of the fiscal year in which the market value of our equity securities that are held by non-affiliates exceeds $700 million as of June 30 of that year.
In addition to scaled disclosure and the other relief described above, the JOBS Act permits us an extended transition period for complying with new or revised accounting standards affecting public companies. We do not intend to take advantage of this extended transition period, which means that the financial statements included in this prospectus, as well as any financial statements that we file in the future, will be subject to all new or revised accounting standards generally applicable to public companies.
iii
Table of Contents
This summary provides a brief overview of important information regarding key aspects of the offering contained elsewhere in this prospectus. This summary does not contain all of the information that you should consider before deciding to invest in our common stock. You should read this entire prospectus carefully, including the more detailed information regarding the risks of purchasing our common stock in the sections titled “Risk Factors” and “Management’s Discussion and Analysis of Financial Condition and Results of Operations” and our consolidated financial statements and the related notes thereto, before making an investment decision.
Our Business
We are a full-service regional bank holding company focused on relationship-based business and agribusiness banking. We serve our customers through 162 branches in attractive markets in seven states: South Dakota, Iowa, Nebraska, Colorado, Arizona, Kansas and Missouri. We were established more than 70 years ago and have achieved strong market positions by developing and maintaining extensive local relationships in the communities we serve. By leveraging our business and agribusiness focus, presence in attractive markets, highly efficient operating model and robust approach to risk management, we have achieved significant and profitable growth—both organically and through disciplined acquisitions. We have successfully completed eight acquisitions since 2006, including our 2010 Federal Deposit Insurance Corporation, or FDIC, assisted acquisition of TierOne Bank, which represented approximately $2.5 billion in acquired assets. Our net income was $77.1 million for the nine months ended June 30, 2014 and $96.2 million for the twelve months ended September 30, 2013, representing a compound annual growth rate, or CAGR, of 21% from fiscal year 2009 to fiscal year 2013 and a 32% increase from fiscal year 2012 to fiscal year 2013. Our cash net income, which is our net income excluding amortization and related tax effects associated with intangible assets, was $88.1 million for the nine months ended June 30, 2014 and $112.3 million for fiscal year 2013, representing a 26% increase from fiscal year 2012 to fiscal year 2013. Our total assets were $9.29 billion at June 30, 2014, and on an annualized basis, our net charge-offs for the nine months ended June 30, 2014 represented 14 basis points of our average total loans. Since fiscal year 2009, we have also operated with efficiency ratios superior to our peer median.(1) For fiscal year 2013, we achieved a return on average total assets of 1.07% and a return on average tangible common equity of 17.5%. For more information on our cash net income and return on average tangible common equity, see “—Summary Historical Consolidated Financial and Operating Information.”
The following table illustrates our net income over the periods indicated:
Net Income ($MM)(2)

| (1) | For a discussion of the manner in which our efficiency ratios are calculated, see “—Our Competitive Strengths—Highly Efficient Operating Model.” |
| (2) | For the fiscal years ended September 30, except as otherwise indicated. |
1
Table of Contents
We focus on business and agribusiness banking, complemented by retail banking and wealth management services. Our loan portfolio consists primarily of business loans, comprised of commercial and industrial, which we refer to as C&I or commercial non-real estate, and commercial real estate, or CRE, loans, and agribusiness loans. At June 30, 2014, our business and agribusiness loans collectively accounted for 85% of our total loan portfolio. In addition, 61% of our aggregate loan portfolio, comprising our CRE loans (representing 36% of our aggregate loan portfolio), residential real estate loans (representing 14% of our aggregate loan portfolio) and agriculture real estate loans (representing 11% of our aggregate loan portfolio), was primarily secured by interests in real estate predominantly located in the states in which we operate at June 30, 2014, and some of our other lending occasionally involves taking real estate as primary or secondary collateral. We offer small and mid-sized businesses a focused suite of financial products and have established strong relationships across a diversified range of sectors, including key areas supporting regional growth such as agribusiness services, freight and transport, healthcare and tourism. We have developed extensive expertise in agribusiness lending, which serves one of the most prominent industries across our markets, and we offer a variety of financial services designed to meet the specific needs of our agribusiness customers. We also provide a range of deposit and loan products to our retail customers through several channels, including our branch network, online banking system, mobile banking applications and customer care centers. In our wealth management business, we seek to expand our private banking, financial planning, investment management and insurance operations to better position us to capture an increased share of the business of managing the private wealth of many of our business and agribusiness customers.
Our banking model seeks to balance the best of being a “big enough” & “small enough” bank, providing capabilities typical of a much larger bank, such as diversified product specialists, customized banking solutions and multiple delivery channels, with a customer-focused culture usually associated with smaller banks. Our focus on balancing these capabilities with a service-oriented culture is embedded within our operations and is enhanced by focusing on our core competencies. We are well recognized within our markets for our relationship-based banking model that provides for local, efficient decision making. We believe we serve our customers in a manner that is responsive, flexible and accessible. Our relationship bankers strive to build deep, long-term relationships with customers and understand the customers’ specific needs to identify appropriate financial solutions. We believe we have been successful in attracting customers from larger competitors because of our flexible approach and the speed and efficiency with which we provide customers with banking solutions while maintaining disciplined underwriting standards.
2
Table of Contents
Market Opportunity
We operate 162 branches located in 116 communities in seven states. In 2007, we began operating in Arizona with our acquisition of Sunstate Bank. In 2009, we expanded our footprint into Colorado through our acquisition of First Community Bank’s Colorado franchise. In 2010, we significantly expanded our presence in Nebraska through our acquisition of TierOne Bank.
Geographic Footprint
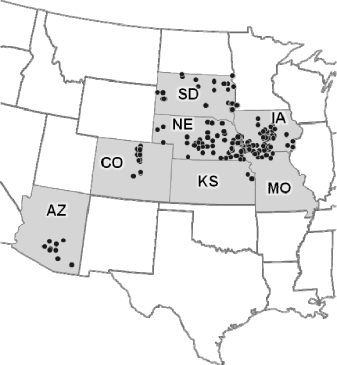
We believe that the states in which we operate present attractive opportunities for our banking model.
The economies of Nebraska, Iowa and South Dakota are growing. According to the Bureau of Economic Analysis of the U.S. Department of Commerce, or the Bureau of Economic Analysis, real GDP growth in these states from 2009 to 2013 has been faster than national real GDP growth, with real GDP in these states growing at a CAGR of 2.7% compared to 2.0% for the nation. According to the Bureau of Labor Statistics of the U.S. Department of Labor, overall unemployment rates for July 2014 in these states were also below the 6.2% U.S. national seasonally adjusted unemployment rate for July 2014, with Nebraska tied for 2nd lowest, South Dakota tied for 4th lowest and Iowa tied for 9th lowest seasonally adjusted unemployment rate in the country.
Markets in each of Arizona and Colorado are recognized as fast-growing and dynamic economies. For example, according to data from SNL Financial, the populations of Phoenix and Denver are expected to grow by 5.3% and 9.9%, respectively, from 2014 through 2019. The U.S. Census Bureau estimates that, as of July 1, 2013, Phoenix had a population of 1.5 million and was the sixth-largest city in the United States. According to Moody’s Analytics, Arizona ranks first among U.S. states for projected employment growth from 2013 through 2018 and Colorado ranks fifth.
Nebraska, Iowa, South Dakota, Arizona and Colorado are each home to a number of small and mid-sized businesses across a diverse range of sectors and together serve as the corporate headquarters for several Fortune
3
Table of Contents
500 companies. The economies within these states represent a diverse range of industries, with manufacturing, trade, agriculture, professional and business services, finance and insurance, and government accounting for approximately 56% of real GDP in these states in 2013 according to the Bureau of Economic Analysis. We expect strong population and job growth will lead to an increased need for business banking services, more deposits and an increased credit demand to fund ongoing capital investments and working capital, cash management solutions and credit cards, among other products and services. We believe integrated banking support is important to providing a focused suite of services to meet the evolving needs of business customers in our markets.
Agribusiness customers in Nebraska, Iowa, South Dakota, Arizona and Colorado produce and raise a variety of grains, proteins and other produce, including corn, soybeans, wheat, dairy products, beef cattle, hogs and vegetables. These products are consumed globally as foods and also serve as inputs for goods made by other industries. Agriculture, as defined by the Bureau of Economic Analysis, has grown faster than the U.S. economy as a whole, with real agricultural GDP growing at a CAGR of 3.4% nationally from 2009 to 2013 compared to a CAGR of 2.0% for the United States over the same period. The value of U.S. agricultural exports is also expected to grow by 26% from 2014 through 2023 according to the United States Department of Agriculture, or USDA. In addition, there has been a growing emphasis on research and development and technology in the agricultural sector, with consumers and producers focused on sustainable methods of food production, particularly with a view to decreasing their reliance on non-renewable inputs.
We believe increasing demand for agricultural products and changing agricultural industry dynamics will continue to drive the need for banking services in our markets, particularly from banks such as ours that understand, and provide products and services that specifically address, the unique needs of our agribusiness customers. We believe that we are well positioned to continue to serve the banking needs of small and mid-sized businesses and the agribusiness sector.
Our Competitive Strengths
We attribute our success to the following competitive strengths, among others:
Focus on Business Banking
We focus on business banking, and this focus contributes significantly to our profitability and growth. As of June 30, 2014, business banking accounted for approximately 60% of our loan portfolio, with C&I loans representing 24%, owner-occupied CRE loans representing 17% and other CRE loans representing 19% of our total loan portfolio. From September 30, 2009 through June 30, 2014, our business banking loan portfolio has grown by over 80%. We believe we have developed a strong brand and market reputation in business banking within the markets we serve by focusing on our core competencies. We provide business banking services to small and mid-sized businesses across a diverse range of industries that support economic growth in the markets in which our business banking customers operate. We offer our business banking customers focused banking services designed to meet the specific needs of their businesses. We have a significant presence in attractive markets, particularly markets such as Omaha, Des Moines and Sioux Falls, which we believe are located in growing economies and present opportunities to increase our business banking activities.
Specialized Agribusiness Expertise
In addition to business banking, we focus on agribusiness banking. According to the American Bankers Association, at June 30, 2014, we were ranked the eighth-largest farm lender bank in the United States measured by total dollar volume of farm loans. We have been providing banking services to the agricultural community since our bank was founded in 1935. We have developed extensive expertise and brand recognition in agribusiness lending, which is one of the fastest growing industries in our markets and is the largest single industry sector that we serve. At June 30, 2014, our agribusiness loan portfolio was balanced among the major
4
Table of Contents
types of agricultural production in our footprint—grains (primarily corn, soybeans and wheat) representing 38% of our agribusiness loan portfolio, proteins (primarily beef cattle, dairy products and hogs) representing 47% of our agribusiness loan portfolio, and other (including cotton and vegetables) representing 15% of our agribusiness loan portfolio. We have grown our agribusiness lending significantly in recent years through our focus on expansion within the markets in our footprint and the recruitment of specialist relationship bankers with a deep understanding of, and strong relationships with customers in, the agriculture industry. Our agribusiness loan portfolio represented 25% of our total loan portfolio at June 30, 2014, having grown at a CAGR of 24% from September 30, 2009 to September 30, 2013. In our most recent fiscal year, our agribusiness loan portfolio grew 14% from September 30, 2012 to September 30, 2013. In addition, we estimate that 10% of our C&I loans and owner-occupied CRE loans are agriculture-related loans, as of June 30, 2014.
Track Record of Strong and Disciplined Growth
We have a track record of combining organic expansion with strategic acquisitions to achieve strong overall growth. Our record of steadily growing and successfully operating our business is demonstrated by our:
| • | Balance sheet growth: From September 30, 2009 to September 30, 2013, we have grown our total assets at a CAGR of 15%, our loan portfolio at a CAGR of 17% and our deposit base at a CAGR of 16%. This growth was primarily generated by our acquisition of TierOne Bank in 2010, which represented approximately $2.5 billion of our $3.1 billion total asset growth in fiscal year 2010. From September 30, 2012 to September 30, 2013 our total assets, loan portfolio and deposit base grew by 1%, 4% and 1%, respectively, as our loan growth drove continued asset growth, despite being offset by a reduction in the size of our investment portfolio. At June 30, 2014, we had $9.29 billion in total assets, $6.68 billion in loans and $7.07 billion in deposits, representing growth of 2%, 5% and 2%, respectively, compared with September 30, 2013; |
| • | Earnings growth: We have increased our net income to $96.2 million for fiscal year 2013, representing a CAGR of 21% from fiscal year 2009 and an increase of 32% from fiscal year 2012. Our net income was $77.1 million for the nine months ended June 30, 2014, an increase of 10% compared with the same period in fiscal year 2013; and |
| • | Return on assets and equity: For fiscal year 2013, we achieved a 1.07% return on average total assets and a 17.5% return on average tangible common equity. |
For more information on our return on average tangible common equity, see “—Summary Historical Consolidated Financial and Operating Information.”
We have achieved organic growth by increasing our market share in select markets and entering new markets. We have been successful at recruiting and retaining relationship bankers with extensive industry expertise. We have also developed streamlined processes that allow us to be responsive, flexible and accessible to our customers, which we believe has allowed us to attract new customers and grow our loan portfolio and deposit base. We have achieved this growth while maintaining strong asset quality, with annual net charge-offs peaking at 88 basis points of average loans for fiscal year 2011 and declining to 44 basis points of average loans for fiscal year 2013.
Our organic growth has been supplemented by our disciplined acquisition strategy led by our experienced management team. We seek to maximize the success of our acquisitions through a well-established integration process. We have successfully leveraged our business banking model with our specialized agribusiness expertise to expand our footprint through eight acquisitions since 2006, including our 2010 FDIC-assisted acquisition of TierOne Bank, which represented approximately $2.5 billion in acquired assets. We expect to continue to opportunistically pursue acquisitions consistent with our strategic objectives, although we do not have any current agreements, arrangements or understandings regarding future acquisitions.
5
Table of Contents
The following chart shows our loan portfolio and the portion of our loans acquired through acquisitions completed since September 30, 2009:
Loans ($BN)(1)

| (1) | At September 30 of each year, other than 3Q 2014 information, which is at June 30, 2014. |
| (2) | Acquired loans includes all loans acquired in acquisitions completed after September 30, 2009. |
Through organic growth and acquisitions, we have grown our total loan portfolio to $6.68 billion at June 30, 2014. As illustrated above, from September 30, 2009 to June 30, 2014 our total loan portfolio, less acquired loans, has grown from $3.4 billion to $6.1 billion, representing a CAGR of 13%.
Highly Efficient Operating Model
We believe our highly efficient and scalable operating model has enabled us to operate profitably, remain competitive, increase market share and develop new business. We emphasize company-wide operating principles focused on proactive expense management, targeted investment, disciplined lending practices and focused product offerings. We have achieved cost efficiencies by consolidating our branch network through the closure of less profitable locations and through our demonstrated success in acquiring and integrating banks. We have also achieved significant cost efficiencies through the use of the Kaizen & Lean principles, which are management techniques for improving processes and reducing waste, to eliminate redundancies and improve the efficient allocation of resources throughout our operations. We believe our focus on operating efficiency has contributed significantly to our return on equity, return on assets and net income and is reflected in our efficiency ratios presented below.
6
Table of Contents
Efficiency Ratios(1)
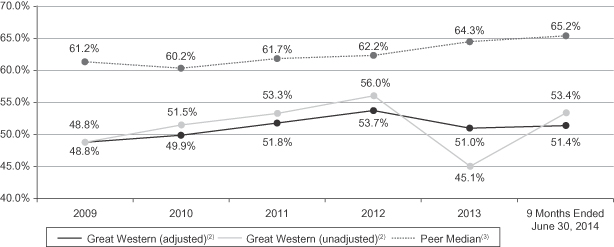
Peer Median Source: SNL Financial.
| (1) | For the twelve months ended September 30, except as otherwise indicated. |
| (2) | One financial measure we use to evaluate our operational efficiency is our efficiency ratio. The graph presents our efficiency ratio calculated on both an adjusted and unadjusted basis. We compute our adjusted efficiency ratio as the ratio of our noninterest expense, which excludes amortization of core deposits and other intangible assets, to our total revenue (equal to the sum of net interest income and noninterest income) on a fully taxable equivalent basis. For purposes of calculating our adjusted efficiency ratio, our noninterest expense and total revenue exclude the effects of changes in the fair value related to fluctuations in interest rates on certain of our long-term fixed-rate loans and related interest rate swaps used to manage the interest rate risk associated with these loans, each of which is accounted for at fair value. Any changes in fair value related to interest rates of our long-term fixed-rate loans and related interest rate swaps associated with interest rate fluctuations are completely offset in our results of operations. Changes in fair value related to interest rates attributable to fixed-rate loans subject to fair value accounting are recorded in interest income and changes attributable to the derivatives hedging these loans are recorded in noninterest expense. Our unadjusted efficiency ratio, by contrast, is calculated in a manner consistent with that of our peer group described below and does not adjust for the effects of these changes in fair value. Including these amounts increases or decreases both our interest income and noninterest expense in a way we believe does not reflect our results of our operations, materially distorting our efficiency ratio and the related trends. Even without adjusting for the effects of these changes in fair value related to interest rate fluctuations, our unadjusted efficiency ratio continues to be below the peer group median for each period presented. For more information on each of these measures, including a reconciliation to the most directly comparable GAAP financial measure, see “—Summary Historical Consolidated Financial and Operating Information.” |
| (3) | Our “peers” refer, collectively, to all publicly listed U.S. bank holding companies with total assets between $5 billion and $15 billion at June 30, 2014. For each period, the peer group excludes any bank holding company for which data was not available for such period. SNL Financial calculates peer efficiency ratios for all twelve-month periods as the ratio of noninterest expense, which excludes amortization of intangible assets, to the sum of net interest income on a fully taxable equivalent basis and noninterest income. We calculated peer efficiency ratios for the nine months ended June 30, 2014 based on the same methodology, with data obtained from SNL Financial. As discussed above, our unadjusted efficiency ratio is also calculated in the same manner for each period presented in the graph while our methodology for calculating our adjusted efficiency ratios is different from SNL Financial’s because we exclude the effects of changes in the fair value related to fluctuations in interest rates on certain of our long-term fixed-rate loans and related interest rate swaps used to manage the interest rate risk associated with these loans, each of which is accounted for at fair value. Including these amounts would increase or decrease either our interest income or noninterest expense in a way we believe does not reflect the results of our operations, materially distorting our efficiency ratio and the related trends. Therefore, our adjusted efficiency ratio and those of our peers may not be directly comparable. |
7
Table of Contents
Disciplined Risk Management
Risk management is a core competency of our business, and we believe that our risk management approach is more robust than that of most U.S. banks our size. Following the acquisition of us by NAB, we expanded our risk management staff significantly to conform to NAB’s global standards. We have also implemented comprehensive policies and procedures for credit underwriting and monitoring of our loan portfolio, including strong credit practices among our relationship bankers, allowing credit decisions to be made efficiently on a local basis consistent with our underwriting standards. We were able to remain profitable while maintaining strong asset quality through the financial crisis, in part due to our focus on our core business and adherence to our disciplined risk management. We believe our robust approach to risk management has enabled us to grow our loan portfolio without compromising credit quality. By focusing on our core areas of expertise, we largely avoided higher-risk lending practices that impacted other lenders in the industry during 2009 to 2011.
The following chart shows our annual net charge-offs as a percentage of average loans for fiscal year 2009 through fiscal year 2013, and for the nine months ended June 30, 2014, compared to the median of our peers:
Annual Net Charge-offs as a Percentage of Average Loans(1)
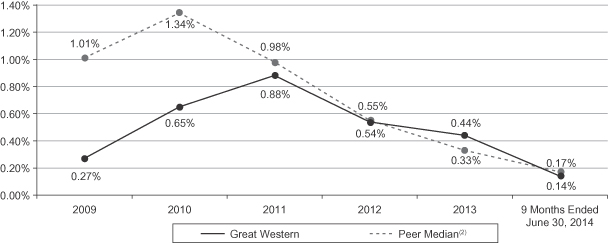
Peer Median Source: SNL Financial.
| (1) | For the twelve months ended September 30, except as otherwise indicated. Information for the nine months ended June 30, 2014 is computed on an annualized basis. For each period, the peer group excludes any bank holding company for which data was not available for such period. |
| (2) | Our “peers” refer, collectively, to all publicly listed U.S. bank holding companies with total assets between $5 billion and $15 billion at June 30, 2014. |
Experienced Management Team With Local Market Experience
Our senior management team, led by Ken Karels, our President and Chief Executive Officer, has a long and successful history of managing financial institutions in the region and, in particular, significant experience in business and agribusiness lending, with an average of over 25 years of banking experience. Our senior management team has a demonstrated track record of managing profitable growth, successfully executing and integrating acquisitions, improving operating efficiencies, maintaining a strong risk management culture and implementing a relationship-based and service-focused approach to banking.
8
Table of Contents
Our Business Strategy
We believe that stable long-term growth and profitability are the result of building strong customer relationships while maintaining disciplined underwriting standards. We plan to focus on originating high-quality loans and growing our low-cost deposit base through our relationship-based business and agribusiness banking. We believe that continuing to focus on our core strengths will enable us to gain market share, continue to improve our operational efficiency and increase profitability. The key components of our strategy for continued success and future growth include the following:
Attract and Retain High-Quality Relationship Bankers
A key component of our growth in our existing markets and entry into new markets has been our ability to attract and retain high-quality relationship bankers. We have recruited approximately 40 new business and agribusiness relationship bankers since January 1, 2011 (out of a total of approximately 160 business and agribusiness relationship bankers at June 30, 2014), with average industry experience of over 15 years when hired. We believe we have been successful in recruiting qualified relationship bankers due primarily to our decentralized management approach, focused product suite and flexible and customer-focused culture while continuing to provide sophisticated banking capabilities to serve our customers’ needs. We intend to continue to hire experienced relationship bankers to execute our relationship-driven banking model. We utilize a variable compensation structure designed to incentivize our relationship bankers by tying their compensation to their individual overall performance and the performance of the loans that they help originate, which we measure based on revenues, return on assets and asset quality/risk, among other things. We believe this structure establishes the appropriate incentives to maximize performance and satisfy our risk management objectives. By leveraging the strong networks and reputation of our experienced relationship bankers, we believe we can continue to grow our loan portfolio and deposit base as well as cross-sell other products and services.
Optimize Footprint in Existing and Complementary Markets
We pursue attractive growth opportunities to expand within our existing footprint and enter new markets aligned with our business model and strategic plans. We believe we can increase our presence in under-represented areas in our existing markets and broaden our footprint in attractive markets adjacent and complementary to our current markets by continuing our emphasis on business and agribusiness banking. Our branch strategy is guided by our ability to recruit experienced relationship bankers in under-represented and new markets. These bankers expand our banking relationships into these markets prior to opening a branch, which increases our likelihood of expanding profitably by developing an asset base before we establish a branch in that market. We will continue to opportunistically consider opening new branches. We intend to capitalize on growth opportunities we believe exist in growing economies in and adjacent to our existing markets.
Deepen Customer Relationships
We believe that our reputation, expertise and relationship-based banking model enables us to deepen our relationships with our customers. We look to leverage our relationships with existing customers by cross-selling our products and services. We have sought to grow our low-cost customer deposit base by attracting more deposits from our business and agribusiness customers. We offer alternative cash management solutions intended to help retain business customers. We seek to expand and enhance our wealth management platform through focused product offerings that we believe will appeal to our more affluent customers. We intend to continue to capitalize on opportunities to capture more business from existing customers throughout our banking network.
9
Table of Contents
Continue to Improve Efficiency and Lower Costs
We believe that our focus on operational efficiency, even in light of incremental costs from being a public company, is critical to our profitability and future growth. We intend to carefully manage our cost structure and continuously refine and implement internal processes to create further efficiencies and enhance our earnings. We continue to optimize our branch network and have commenced reviews of additional internal processes and our vendor relationships, with a view to identifying opportunities to further improve efficiency and enhance earnings. We are also continuing our efforts to shift our deposit base to lower-cost customer deposits, a strategic initiative that has been primarily responsible for driving our cost of deposit funding down since September 30, 2012. We believe our scalable systems, risk management infrastructure and operating model will better enable us to achieve further operational efficiencies as we grow our business.
Opportunistically Pursue Acquisitions
Our management team has extensive expertise and a successful track record in evaluating, executing and integrating attractive, franchise-enhancing acquisitions. We will continue to consider acquisitions that are consistent with our business strategy and financial model as opportunities arise. Illustrated below, as of September 30 of each indicated year, is the growth in our total assets as a result of our acquisitions in that fiscal year.
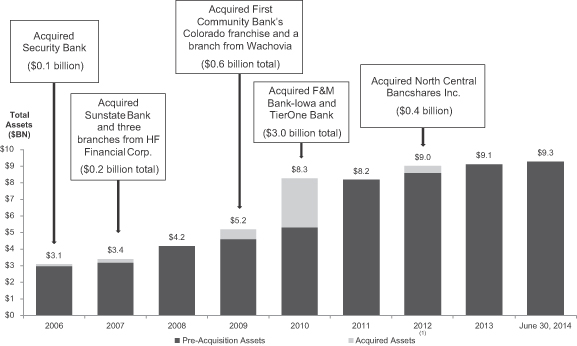
| (1) | Acquired assets are the total of the fair value of assets acquired and the net cash and cash equivalents received at the time of acquisition in each indicated year. |
We believe acquisition opportunities will continue to arise within our markets, as well as in familiar and complementary markets.
10
Table of Contents
Our Structure and Formation Transactions
Our Structure
Great Western Bancorp, Inc. is an indirect, wholly owned subsidiary of National Australia Bank Limited, or NAB. National Australia Bank Limited traces its history back to the establishment of the Bank of Australasia in 1858. NAB is a large Australian financial institution incorporated in 1893 and listed on the Australian Securities Exchange. NAB operates in Australia, New Zealand, the United Kingdom, the United States and parts of Asia.
Other than our business, NAB’s U.S. operations primarily consist of wholesale banking operations used by NAB to obtain financing for its Australian operations and facilitate the provision of financing and risk management products to its Australian clients and international clients with significant Australian operations. NAB’s wealth management business also has operations in the U.S. designed to facilitate access to U.S. investment opportunities by NAB’s Australian clients.
In July 2014, the NAB selling stockholder formed Great Western Bancorp, Inc., a Delaware corporation, to be the publicly traded holding company for our bank. Great Western Bancorp, Inc. holds no assets other than the nominal amount of cash contributed as equity to it in connection with its formation and has not engaged in any business or other activities other than in connection with its formation and as the registrant for this offering.
The diagram below depicts our organizational structure at the date of this prospectus. Each entity in the diagram is a wholly owned subsidiary of the entity in the box directly above it. The diagram does not show NAB’s other subsidiaries, none of which hold an ownership interest in us.
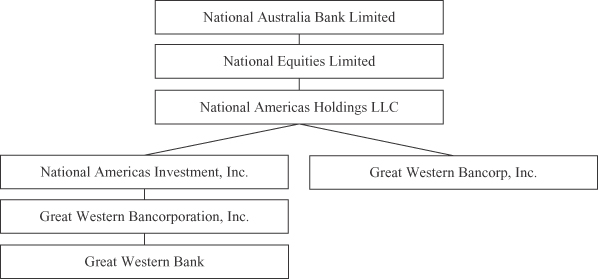
National Equities Limited, or NEL, is a wholly owned subsidiary of NAB and an Australian company incorporated in 1972. NEL currently serves as a holding company for banking and other financial services businesses of NAB in New Zealand, the United Kingdom and the United States.
National Americas Holdings LLC, or the NAB selling stockholder, is a wholly owned subsidiary of NEL and a Delaware limited liability company formed in 2008 to facilitate NAB’s purchase of our bank in 2008. The NAB selling stockholder currently serves as a holding company for investments by NAB in the United States.
National Americas Investment, Inc., or NAI, is a wholly owned subsidiary of the NAB selling stockholder and a Delaware corporation formed in 1998 to serve as a holding company for certain banking investments by NAB in the United States. NAI’s primary asset is its investment in the common stock of Great Western.
11
Table of Contents
Great Western Bancorporation, Inc., or GWBI, is a wholly owned subsidiary of NAI and an Iowa corporation formed in 1962 and has been the direct holding company for Great Western Bank. Prior to May 2006, GWBI filed public reports in connection with trust preferred securities listed on the American Stock Exchange.
Formation Transactions
Prior to the consummation of this offering, the following transactions will be taken in the order listed below:
| • | the NAB selling stockholder will contribute all outstanding capital stock in NAI to Great Western Bancorp, Inc., resulting in NAI becoming a wholly owned subsidiary of Great Western Bancorp, Inc.; |
| • | NAI will merge with and into Great Western Bancorp, Inc., with Great Western Bancorp, Inc. continuing as the surviving corporation and succeeding to all the assets, liabilities and business of NAI; and |
| • | GWBI will merge with and into Great Western Bancorp, Inc., with Great Western Bancorp, Inc. continuing as the surviving corporation and succeeding to all the assets, liabilities and business of GWBI. |
As a result of these transactions, Great Western Bancorp, Inc. will succeed to the business of GWBI, whose consolidated financial statements and related notes thereto are included in this prospectus.
The Formation Transactions will not result in a change in our business or our management team.
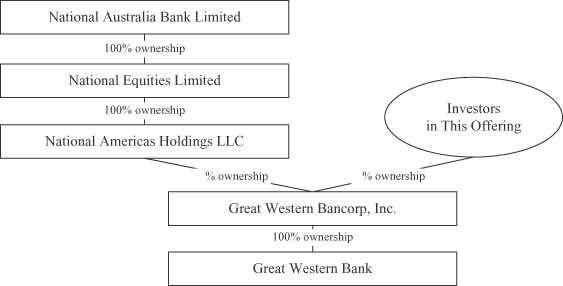
Following the completion of the Formation Transactions and this offering, we will be a publicly traded bank holding company and will directly own all outstanding capital stock issued by our bank. The diagram below depicts our organizational structure immediately following the Formation Transactions and the completion of this offering.
Separation from and Relationship with NAB
Separation from NAB
On August 29, 2014 in Australia, NAB announced that it intends to divest itself of our bank over time, subject to market conditions. NAB’s announced divestiture of our bank is consistent with its strategy of focusing on its core Australian and New Zealand franchises. This offering of shares of our common stock by the
12
Table of Contents
NAB selling stockholder, representing % of its ownership interest in our outstanding capital stock, is the first stage of NAB’s planned divestment. After the completion of this offering, NAB will beneficially own % of our outstanding common stock (or % if the underwriters’ option to purchase additional shares of common stock from the NAB selling stockholder is exercised in full). The timing of any subsequent sales by NAB of shares of our common stock is unknown at this time and will be subject to market conditions and the lock-up agreement entered into by the NAB selling stockholder and the underwriters in connection with this offering.
Relationship with NAB
As an indirect, wholly owned subsidiary of NAB, we historically have received financial and administrative support from NAB and its affiliates and have engaged in business transactions with them. Among other transactions, we and NAI have each borrowed from NAB from time to time, including through a revolving credit agreement and through certain subordinated capital notes. In addition, NAB London Branch (a branch of National Australia Bank Limited), or NAB London Branch, acts as our counterparty on interest rate swaps on a regular basis. We expect that, following this offering, Great Western Bancorp, Inc. will continue to use NAB London Branch as a swaps counterparty, as described under “Our Relationship with NAB and Certain Other Related Party Transactions—Relationship with NAB—Transitional Services Agreement.” Prior to the completion of the Formation Transactions, NAI intends to prepay in full the outstanding principal amounts of the subordinated capital notes it issued to NAB New York Branch, and Great Western Bancorp, Inc. intends to assume a subordinated capital note issued by GWBI to NAB New York Branch and GWBI’s revolving credit agreement with NAB through an amended and restated agreement generally consistent with the agreement’s current terms. We also purchase securities from NAB from time to time in its role as dealer, and certain of our employees are or have been NAB employees or compensated in part with NAB securities. For more information on these and other transactions with NAB, see “Our Relationship with NAB and Certain Other Related Party Transactions—Related Party Transactions with NAB.”
In connection with this offering, we and NAB intend to enter into certain agreements that will provide a framework for our ongoing relationship, including a Stockholder Agreement governing NAB’s rights as a stockholder until such time as NAB ceases to control us for purposes of the U.S. Bank Holding Company Act of 1956, as amended, or the BHC Act, a Transitional Services Agreement pursuant to which NAB will agree to continue to provide us with certain services for a transition period and a Registration Rights Agreement requiring that we register shares of our common stock beneficially owned by NAB under certain circumstances. Prior to the completion of this offering, we intend to enter into these arrangements to formalize our relationship with NAB following this offering. For further information regarding these agreements with NAB, see “Our Relationship with NAB and Certain Other Related Party Transactions—Relationship with NAB.”
Forms of the agreements summarized below have been filed as exhibits to the registration statement of which this prospectus forms a part.
Stockholder Agreement. We intend to enter into a Stockholder Agreement with NAB in connection with this offering that will provide NAB with certain consent and other rights with respect to our business until NAB ceases to control us for purposes of the BHC Act. As a result, NAB will continue to have significant control over us following this offering. See “Our Relationship with NAB and Certain Other Related Party Transactions—Relationship with NAB—Stockholder Agreement.” The Stockholder Agreement will provide NAB with the following rights, among others:
| • | the ability to nominate candidates for election to our board of directors (with the number of designees depending on the level of NAB’s beneficial ownership of our outstanding common and non-voting common stock, as described below); |
| • | the right to have its designees to our board of directors serve on committees of the board of directors in certain circumstances; |
13
Table of Contents
| • | consent rights giving NAB the ability to veto mergers, acquisitions, changes to our capital stock, business activities, corporate governance and various other significant corporate actions, such as incurring or guaranteeing certain additional indebtedness, entering into or terminating joint venture relationships, amending our constituent documents, amending or terminating certain material contracts, settling material litigation or entering into material written agreements with a regulatory agency, we may pursue; |
| • | the right to continue to access our internal information and to be consulted on our public disclosures and filings before we publish them; and |
| • | the right to exchange shares of our common stock for shares of our non-voting common stock, which will permit NAB to reduce its voting interest in our common stock and corresponding ability to control us for U.S. bank regulatory purposes. |
Prior to the earlier of the one-year anniversary of the first date when NAB ceases to directly or indirectly beneficially own at least 50% of our outstanding common stock and the date NAB ceases to control us for purposes of the BHC Act, NAB will have the right to designate for nomination and election a majority of our board of directors. Following such one-year anniversary until NAB ceases to control us for purposes of the BHC Act, NAB will have the right to designate for nomination and election a number of individuals equal to the number of independent directors nominated to serve on our board of directors (other than any independent directors who have been designated by NAB) minus two. After NAB ceases to control us for purposes of the BHC Act, NAB will have the right to designate one nominee for election to our board of directors as long as NAB continues to beneficially own at least 5% of our outstanding common stock and non-voting common stock.
Transitional Services Agreement. We intend to enter into a Transitional Services Agreement with NAB prior to the completion of this offering. The Transitional Services Agreement will govern the continued provision of certain services to us by NAB or its affiliates for the applicable transition period, including continuing to act as a counterparty to us on interest rate swaps consistent with past practice and providing fair value calculations related to specified loans and interest rate swaps, access to certain reporting systems and applications, certain risk, credit rating and tax oversight currently provided to us by a branch of NAB and certain insurance coverage under NAB’s group-wide insurance policies. The fees for each of these services have been negotiated on arms’-length terms and are consistent with the fees we currently pay to NAB and its affiliates for these services as part of NAB’s consolidated group. We currently expect to incur aggregate annual costs of approximately $1.8 million for all services provided by NAB under the Transitional Services Agreement, though our actual costs may vary. Unless earlier terminated by us or NAB, the Transitional Services Agreement will terminate with respect to each service to be provided thereunder on the dates specified in the agreement, which range in duration. Generally, most services to be provided by NAB or its affiliates will terminate on the date NAB ceases to control us for purposes of the BHC Act or the one-year anniversary of the first date when NAB ceases to directly or indirectly beneficially own at least 50% of our outstanding common stock. See “Our Relationship with NAB and Certain Other Related Party Transactions—Relationship with NAB—Transitional Services Agreement.”
Registration Rights Agreement. We intend to enter into a Registration Rights Agreement with NAB prior to the completion of the offering. Pursuant to the Registration Rights Agreement, upon NAB’s request, we must use our reasonable best efforts to file a registration statement for, and affect the registration under applicable federal and state securities laws of, any shares of our common stock beneficially owned by NAB following this offering. We will be generally responsible for all registration expenses, including expenses incurred by NAB, in connection with the registration, offer and sale of securities under the Registration Rights Agreement, other than any applicable underwriting discounts or commissions. See “Our Relationship with NAB and Certain Other Related Party Transactions—Relationship with NAB—Registration Rights Agreement.”
NAB’s Control After This Offering. NAB’s beneficial ownership of approximately % of our common stock (or % if the underwriters’ option to purchase additional shares of common stock is
14
Table of Contents
exercised in full), along with its rights under the agreements summarized above, will result in NAB having significant control over us. NAB’s concentration of voting power and veto rights, together with its control of our board of directors, could deprive stockholders of an opportunity to receive a premium for their shares of common stock as part of a sale of our company, among other opportunities. See “Risk Factors—Risks Related to Our Controlling Stockholder—NAB will continue to have significant control over us following the completion of this offering, and its interests may conflict with ours or yours in the future.”
Current NAB Employees and Appointees. Currently, two of our senior executive officers and two of our credit executives are employees of NAB or Bank of New Zealand, a NAB subsidiary, who were temporarily seconded to work with us. In connection with this offering, we have entered into employment agreements with our Chief Financial Officer and Chief Risk Officer, and their employment with NAB or Bank of New Zealand, as applicable, will terminate and transfer to us when the agreements become effective upon the completion of this offering. The secondments of our Chief Credit Officer and Head of Credit—Agribusiness from NAB and Bank of New Zealand, respectively, will terminate on December 31, 2014 in accordance with their current arrangements. See “Our Relationship with NAB and Certain Other Related Party Transactions—Related Party Transactions with NAB.” Further, five of Great Western Bancorp, Inc.’s directors were nominated by NAB. See “Management—Directors and Executive Officers.”
Historical Transactions with NAB. NAB and its affiliates have provided certain services to us historically, including acting as counterparty, pursuant to an ISDA master agreement with our bank, on approximately $946.8 million in total notional amount of interest rate swaps outstanding at June 30, 2014 and providing the services discussed above that will be provided pursuant to the Transitional Services Agreement. In addition, we and NAI have each borrowed from NAB from time to time, including through a revolving credit agreement and through certain subordinated capital notes. See “Our Relationship with NAB and Certain Other Related Party Transactions—Related Party Transactions with NAB.” Notwithstanding these historical funding transactions, we will not be reliant on NAB and its affiliates to satisfy future funding requirements associated with our business.
Risk Relating to Our Company
An investment in our common stock involves substantial risks and uncertainties. Investors should carefully consider all of the information in this prospectus, including the detailed discussion of these risks under “Risk Factors” beginning on page 23, prior to investing in our common stock. Some of the more significant risks include the following:
| • | Our business may be adversely affected by conditions in the financial markets and economic conditions in the markets in which we and our customers operate generally and in the Midwest region in particular. |
| • | We focus on originating business and agricultural loans, both of which may involve greater risk than residential mortgage lending and are dependent for repayment on various factors outside of the borrower’s control. |
| • | Repayment of our agricultural loans is dependent on the successful operation of the farm property and on the health of the agricultural industry. |
| • | Our business depends on our ability to successfully manage risk. |
| • | Severe weather, natural disasters, acts of war or terrorism or other external events could significantly impact our business. |
| • | Our allowance for loan losses and our credit marks on acquired loan portfolios may be insufficient. |
| • | We may not be able to attract and retain key personnel and other skilled employees, successfully execute our strategic plan or manage our growth. |
15
Table of Contents
| • | We operate in a highly competitive industry and market area. |
| • | We may not be able to report our future financial results accurately and timely as a publicly listed company if we fail to maintain an effective system of disclosure controls and procedures and internal control over financial reporting, or if we fail to remediate the material weakness identified relating to the design and operation of our internal control over financial reporting. |
| • | NAB, through its wholly owned subsidiary, will be our controlling stockholder and will have certain approval rights with respect to our business, and its interests may conflict with ours or yours in the future. |
| • | Our stock price could decline due to the number of outstanding shares of our common stock eligible for future sale and NAB’s stated intent to sell its remaining ownership interest in us over time, although the timing of such sale or sales is uncertain. |
| • | Our amended and restated certificate of incorporation will designate the Court of Chancery of the State of Delaware as the sole and exclusive forum for certain types of stockholder-initiated actions and proceedings, which could limit our stockholders’ ability to obtain a favorable judicial forum for disputes with us or our directors, officers, employees or agents. |
| • | We are subject to extensive regulation, and legislative or regulatory actions, including possible enforcement actions, taken now or in the future could have a significant adverse effect on our operations. |
Our Corporate Information
Our principal executive office is located at 100 N. Phillips Ave, Sioux Falls, South Dakota 57104. Our telephone number is (605) 334-2548, and our website address is greatwesternbank.com. The information contained on our website is not a part of, or incorporated by reference into, this prospectus.
16
Table of Contents
| Common stock offered by the NAB selling stockholder |
shares |
| Option to purchase additional shares from the NAB selling stockholder |
shares |
| Common and non-voting common stock outstanding |
shares of common stock and no shares of non-voting common stock |
| Use of proceeds |
We will not receive any of the proceeds from the sale of the shares of common stock being sold in this offering. All of the shares in this offering are being sold by the NAB selling stockholder. |
| Voting rights |
Each holder of our common stock will be entitled to one vote per share on all matters on which our stockholders generally are entitled to vote. Holders of our non-voting common stock, when our non-voting common stock is issued, will not be entitled to vote, except in certain limited circumstances. See “Description of Capital Stock” for more information. |
| Dividend policy |
The declaration of dividends will be at the discretion of our board of directors and will depend on many factors, including the financial condition, earnings and liquidity requirements of our company and Great Western Bank, regulatory constraints, corporate law and contractual restrictions, and any other factors that our board of directors deems relevant in making such a determination. Our ability to pay dividends is subject to restrictions under applicable banking laws and regulations. In addition, dividends from Great Western Bank are the principal source of funds for the payment of dividends on our stock. Our bank is subject to certain restrictions under banking laws and regulations that may limit its ability to pay dividends to us. Therefore, there can be no assurance that we will pay any dividends to holders of our stock, or as to the amount of any such dividends. |
| Following this offering, we intend to pay quarterly cash dividends on our common stock. Subject to the sole discretion of our board of directors and the considerations discussed under “Dividend Policy and Dividends,” we intend to pay quarterly cash dividends on our common stock at an initial amount of approximately $ per share. See “Dividend Policy and Dividends” for more information. |
| Controlling stockholder |
We are an indirect, wholly owned subsidiary of NAB. Upon completion of this offering, NAB will indirectly hold % of the voting power of all outstanding shares of our common stock (or % if the underwriters’ option to purchase additional shares of common stock from the NAB selling stockholder is exercised in full). Pursuant to a Registration Rights Agreement we intend to enter into with NAB |
17
Table of Contents
| in connection with this offering, NAB may require us to register for resale all of the additional shares of our common stock beneficially owned by NAB following this offering. |
| For additional information regarding our relationship with NAB following completion of this offering, see “Our Relationship with NAB and Certain Other Related Party Transactions—Relationship with NAB.” |
| Preemptive rights |
Purchasers of our common stock sold in this offering will not have any preemptive rights. |
| Listing |
We intend to apply to list our common stock on the New York Stock Exchange, or NYSE, under the symbol “GWB.” |
| Risk factors |
Investing in our common stock involves significant risks. See “Risk Factors” beginning on page 23 for a discussion of certain risks that you should consider before deciding to invest in our common stock. |
All share information, other than share information presented in our consolidated financial statements, reflects a -for-1 stock split of our common stock that will occur prior to completion of this offering. The stock split will increase the number of shares of our common stock to an amount consistent with a publicly traded company with broad stock ownership. Unless otherwise noted, references in this prospectus to the number of shares of our common stock outstanding after this offering exclude shares of common stock that may be granted under the equity incentive plans we intend to adopt in connection with this offering, including certain grants to our named executive officers as described further under “Executive and Director Compensation—New Employment Arrangements.” Unless we specifically state otherwise, the information in this prospectus assumes no exercise of the underwriters’ option to purchase additional shares of our common stock from the NAB selling stockholder and assumes that the common stock to be sold in this offering is sold at $ per share, which is the midpoint of the price range set forth on the front cover of this prospectus.
18
Table of Contents
SUMMARY HISTORICAL CONSOLIDATED FINANCIAL AND OPERATING INFORMATION
You should read the summary historical consolidated financial and operating data set forth below in conjunction with the sections titled “Management’s Discussion and Analysis of Financial Condition and Results of Operations” and “Capitalization,” as well as our consolidated financial statements and the related notes included elsewhere in this prospectus. The historical financial information as of and for the fiscal years ended September 30, 2013 and 2012 is derived from our audited financial statements included elsewhere in this prospectus. The historical financial information as of and for the nine-month periods ended June 30, 2014 and 2013 is derived from our unaudited financial statements included elsewhere in this prospectus, which have been prepared on the same basis as our audited consolidated financial statements. Our historical results may not be indicative of our future performance. In addition, results for the nine-month periods ended June 30, 2014 and 2013 may not be indicative of the results that may be expected for the full fiscal year. The historical financial information below also contains non-GAAP financial measures, which have not been audited.
| Nine months ended June 30, | Fiscal year ended September 30, | |||||||||||||||
| 2014 | 2013 | 2013 | 2012 | |||||||||||||
| (dollars in thousands) | ||||||||||||||||
| Income Statement Data: |
||||||||||||||||
| Interest and dividend income |
$ | 261,764 | $ | 210,559 | $ | 294,257 | $ | 344,304 | ||||||||
| Interest expense |
24,337 | 30,349 | 39,161 | 50,971 | ||||||||||||
|
|
|
|
|
|
|
|
|
|||||||||
| Net interest income |
237,427 | 180,210 | 255,096 | 293,333 | ||||||||||||
| Provision (recovery) for loan losses |
(2,065 | ) | 14,034 | 11,574 | 30,145 | |||||||||||
|
|
|
|
|
|
|
|
|
|||||||||
| Net interest income, after provision (recovery) for loan losses |
239,492 | 166,176 | 243,522 | 263,188 | ||||||||||||
| Noninterest income |
45,583 | 59,614 | 77,692 | 88,975 | ||||||||||||
| Noninterest expense |
166,436 | 116,188 | 171,073 | 235,010 | ||||||||||||
|
|
|
|
|
|
|
|
|
|||||||||
| Income before income taxes |
118,639 | 109,602 | 150,141 | 117,153 | ||||||||||||
| Provision for income taxes |
41,562 | 39,682 | 53,898 | 44,158 | ||||||||||||
|
|
|
|
|
|
|
|
|
|||||||||
| Net income |
$ | 77,077 | $ | 69,920 | $ | 96,243 | $ | 72,995 | ||||||||
|
|
|
|
|
|
|
|
|
|||||||||
| Cash net income(1) |
$ | 88,092 | $ | 82,087 | $ | 112,289 | $ | 89,397 | ||||||||
|
|
|
|
|
|
|
|
|
|||||||||
| Other Financial Info / Performance Ratios: |
||||||||||||||||
| Net interest margin(2) |
3.93 | % | 3.07 | % | 3.24 | % | 3.98 | % | ||||||||
| Adjusted net interest margin(2), (3) |
3.73 | % | 3.78 | % | 3.76 | % | 3.72 | % | ||||||||
| Adjusted efficiency ratio(4) |
51.4 | % | 50.4 | % | 51.0 | % | 53.7 | % | ||||||||
| Return on average total assets(2) |
1.12 | % | 1.04 | % | 1.07 | % | 0.85 | % | ||||||||
| Return on average common equity(2) |
7.30 | % | 6.79 | % | 6.97 | % | 5.40 | % | ||||||||
| Return on average tangible common equity(1), (2) |
17.1 | % | 17.3 | % | 17.5 | % | 15.0 | % | ||||||||
| June 30, 2014 |
September 30, | |||||||||||
| 2013 | 2012 | |||||||||||
| (dollars in thousands) | ||||||||||||
| Balance Sheet Data: |
||||||||||||
| Loans(5) |
$ | 6,678,501 | $ | 6,362,673 | $ | 6,138,574 | ||||||
| Allowance for loan losses |
47,038 | 55,864 | 71,878 | |||||||||
| Securities |
1,395,768 | 1,480,449 | 1,581,875 | |||||||||
| Goodwill |
697,807 | 697,807 | 697,807 | |||||||||
| Total assets |
9,292,283 | 9,134,258 | 9,008,252 | |||||||||
| Total deposits |
7,067,112 | 6,948,208 | 6,884,515 | |||||||||
| Total liabilities |
7,861,319 | 7,717,044 | 7,619,689 | |||||||||
| Total stockholder’s equity |
1,430,964 | 1,417,214 | 1,388,563 | |||||||||
19
Table of Contents
| At and for the nine months ended June 30, 2014 |
At and for the fiscal year ended September 30, |
|||||||||||
| 2013 | 2012 | |||||||||||
| Asset Quality Ratios: |
||||||||||||
| Nonperforming loans / total loans(6) |
0.64 | % | 1.28 | % | 1.53 | % | ||||||
| Allowance for loan losses / total loans |
0.70 | % | 0.88 | % | 1.17 | % | ||||||
| Net charge-offs / average total loans(2) |
0.14 | % | 0.44 | % | 0.54 | % | ||||||
| Capital Ratios: |
||||||||||||
| Tier 1 capital ratio |
12.1 | % | 12.4 | % | 11.9 | % | ||||||
| Total capital ratio |
13.1 | % | 13.8 | % | 13.7 | % | ||||||
| Tier 1 leverage ratio |
9.3 | % | 9.2 | % | 8.3 | % | ||||||
| Tangible common equity to tangible assets(7) |
8.3 | % | 8.2 | % | 7.8 | % | ||||||
| (1) | Two of the financial measures we use to evaluate our profitability and performance are cash net income and return on average tangible common equity, which are not presented in accordance with U.S. generally accepted accounting principles, or GAAP. We compute our cash net income by adding to net income (and thereby effectively excluding) amortization expense relating to intangible assets and related tax effects that have accumulated as a result of the acquisition of us by NAB and our various acquisitions of other institutions as described in “Management’s Discussion and Analysis of Financial Condition and Results of Operations—Key Factors Affecting Our Business and Financial Statements—Goodwill and Amortization of Other Intangibles.” We compute our return on average tangible common equity as the ratio of our cash net income to our average tangible common equity, which is calculated by subtracting (and thereby effectively excluding) amounts related to the effect of goodwill and other intangible assets described above from our average common equity. We believe each of these measures is helpful in highlighting trends associated with our financial condition and results of operations by providing net income and return information based on our cash payments and receipts during the applicable period. The following table shows our cash net income and return on average tangible common equity as well as reconciliations to our net income and return on average common equity, respectively, for the periods indicated: |
| Nine months ended June 30, | Fiscal year ended Sept. 30 | |||||||||||||||
| 2014 | 2013 | 2013 | 2012 | |||||||||||||
| (dollars in thousands) | ||||||||||||||||
| Cash net income and return on average tangible common equity: |
||||||||||||||||
| Net income |
$ | 77,077 | $ | 69,920 | $ | 96,243 | $ | 72,995 | ||||||||
| Add: Amortization of intangible assets |
13,448 | 14,600 | 19,290 | 19,646 | ||||||||||||
| Add: Tax on amortization of intangible assets |
(2,433 | ) | (2,433 | ) | (3,244 | ) | (3,244 | ) | ||||||||
|
|
|
|
|
|
|
|
|
|||||||||
| Cash net income |
$ | 88,092 | $ | 82,087 | $ | 112,289 | $ | 89,397 | ||||||||
|
|
|
|
|
|
|
|
|
|||||||||
| Annualized net income |
$ | 103,050 | $ | 93,483 | ||||||||||||
| Annualized cash net income |
$ | 117,777 | $ | 109,750 | ||||||||||||
| Average common equity |
$ | 1,411,137 | $ | 1,376,259 | $ | 1,380,296 | $ | 1,352,069 | ||||||||
| Less: Average goodwill and other intangible assets |
721,630 | 740,576 | 738,140 | 756,149 | ||||||||||||
|
|
|
|
|
|
|
|
|
|||||||||
| Average tangible common equity |
$ | 689,507 | $ | 635,683 | $ | 642,156 | $ | 595,920 | ||||||||
|
|
|
|
|
|
|
|
|
|||||||||
| Return on average common equity* |
7.30 | % | 6.79 | % | 6.97 | % | 5.40 | % | ||||||||
| Return on average tangible common equity* |
17.1 | % | 17.3 | % | 17.5 | % | 15.0 | % | ||||||||
| * | Calculated as an annualized percentage for the nine months ended June 30, 2014 and 2013. |
20
Table of Contents
| (2) | Calculated as an annualized percentage for the nine months ended June 30, 2014 and 2013, as applicable. |
| (3) | One of the financial measures we use to evaluate our profitability and efficiency is adjusted net interest margin, which is not presented in accordance with GAAP. We compute our adjusted net interest margin by adding to net interest income changes in fair value related to interest rates associated with certain of our fixed-rate loans measured at fair value as described in “Management’s Discussion and Analysis of Financial Condition and Results of Operations—Key Factors Affecting Our Business and Financial Statements—Loans and Interest Rate Swaps Accounted for at Fair Value.” The changes in fair value related to interest rates of these loans are offset by changes in fair value associated with the related fixed-to-floating interest rate swaps we enter into to manage our interest rate risk on these loans. We believe that our adjusted net interest margin is helpful in highlighting trends in our business that may not otherwise be apparent when relying solely on our GAAP-calculated results by eliminating these matching and offsetting changes in fair value. The following table shows our adjusted net interest margin as well as a reconciliation to our net interest margin for the periods indicated: |
| Nine months ended June 30, | Fiscal year ended Sept. 30, | |||||||||||||||
| 2014 | 2013 | 2013 | 2012 | |||||||||||||
| (dollars in thousands) | ||||||||||||||||
| Adjusted net interest income and adjusted net interest margin: |
||||||||||||||||
| Net interest income |
$ | 237,427 | $ | 180,210 | $ | 255,096 | $ | 293,333 | ||||||||
| Less: Loan FV adjustment related to interest rates |
12,119 | (41,635 | ) | (40,305 | ) | 19,369 | ||||||||||
|
|
|
|
|
|
|
|
|
|||||||||
| Adjusted net interest income |
$ | 225,308 | $ | 221,845 | $ | 295,401 | $ | 273,964 | ||||||||
|
|
|
|
|
|
|
|
|
|||||||||
| Average interest-earning assets |
$ | 8,067,544 | $ | 7,839,914 | $ | 7,862,860 | $ | 7,367,085 | ||||||||
| Net interest margin* |
3.93 | % | 3.07 | % | 3.24 | % | 3.98 | % | ||||||||
| Adjusted net interest margin* |
3.73 | % | 3.78 | % | 3.76 | % | 3.72 | % | ||||||||
| * | Calculated as annualized percentages for the nine months ended June 30, 2014 and 2013. |
| (4) | One of the financial measures we use to evaluate our operational efficiency is our efficiency ratio, which is not presented in accordance with GAAP. In this prospectus, we present our efficiency ratio on both an adjusted and unadjusted basis, however, our management computes our efficiency ratio on an adjusted basis when analyzing trends in our operational efficiency. We compute our adjusted efficiency ratio as the ratio of our noninterest expense to our total revenue (equal to the sum of our net interest income and noninterest income). For purposes of this computation, each of our noninterest expense and total revenue are adjusted from their GAAP computation by excluding changes in fair value related to interest rates associated with certain of our fixed-rate loans measured at fair value and the matching fixed-to-floating interest rate swaps as described in “Management’s Discussion and Analysis of Financial Condition and Results of Operations—Key Factors Affecting Our Business and Financial Statements—Loans and Interest Rate Swaps Accounted for at Fair Value.” Our noninterest expense is also adjusted to exclude amounts related to the amortization of core deposits and other intangibles, which are non-cash expense items, and our total revenue is adjusted to include the tax-related benefit associated with our tax-advantaged loans and investments. We believe that our adjusted efficiency ratio is helpful in highlighting trends in our business that may not otherwise be apparent when relying solely on our GAAP-calculated results by eliminating fluctuations resulting from these matching and offsetting changes in fair value related to interest rates and from non-cash expense items which do not represent cash flow expenditures during the relevant period, and by reflecting all tax-related benefits associated with our loan and investment portfolio. |
21
Table of Contents
In this prospectus, we also present our unadjusted efficiency ratio. Our unadjusted efficiency ratio is calculated in the same manner as our adjusted efficiency ratio, except that we do not exclude from our noninterest expense and total revenue the effects of changes in fair value related to fluctuations in interest rates on certain of our long-term fixed rate loans and related interest rate swaps as discussed above. Including these amounts increases or decreases both our interest income and noninterest expense in a way we believe does not reflect our results of our operations, materially distorting our efficiency ratio and the related trends.
The following table shows our adjusted and unadjusted efficiency ratios as well as a reconciliation with the components used in the calculation of each for the periods indicated:
| Nine months ended June 30, |
Fiscal year ended Sept. 30, | |||||||||||||||||||||||||||
| 2014 | 2013 | 2013 | 2012 | 2011 | 2010 | 2009 | ||||||||||||||||||||||
| (dollars in thousands) | ||||||||||||||||||||||||||||
| Adjusted noninterest expense, unadjusted efficiency ratio and adjusted efficiency ratio: |
||||||||||||||||||||||||||||
| Total revenue |
$ | 283,010 | $ | 239,824 | $ | 332,788 | $ | 382,308 | $ | 389,434 | $ | 300,832 | $ | 186,434 | ||||||||||||||
| Plus: Tax equivalent adjustment |
3,340 | 2,449 | 3,541 | 2,111 | 1,265 | 1,152 | 1,253 | |||||||||||||||||||||
|
|
|
|
|
|
|
|
|
|
|
|
|
|
|
|||||||||||||||
| Total revenue (FTE) |
$ | 286,350 | $ | 242,273 | $ | 336,329 | $ | 384,419 | $ | 390,699 | $ | 301,984 | $ | 187,687 | ||||||||||||||
| Less: Loan FV adjustment related to interest rates |
12,119 | (41,635 | ) | (40,305 | ) | 19,369 | 12,248 | 9,839 | — | |||||||||||||||||||
|
|
|
|
|
|
|
|
|
|
|
|
|
|
|
|||||||||||||||
| Adjusted revenue |
$ | 274,231 | $ | 283,908 | $ | 376,634 | $ | 365,050 | $ | 378,451 | $ | 292,145 | $ | 187,687 | ||||||||||||||
|
|
|
|
|
|
|
|
|
|
|
|
|
|
|
|||||||||||||||
| Noninterest expense |
$ | 166,436 | $ | 116,188 | $ | 171,073 | $ | 235,010 | $ | 228,645 | $ | 170,025 | $ | 101,621 | ||||||||||||||
| Less: Amortization of core deposit and other intangibles |
13,448 | 14,600 | 19,290 | 19,646 | 20,429 | 14,488 | 9,940 | |||||||||||||||||||||
|
|
|
|
|
|
|
|
|
|
|
|
|
|
|
|||||||||||||||
| Tangible noninterest expense |
$ | 152,988 | $ | 101,588 | $ | 151,783 | $ | 215,364 | $ | 208,216 | $ | 155,537 | $ | 91,681 | ||||||||||||||
| Less: Derivatives, net (gain) loss |
12,119 | (41,635 | ) | (40,305 | ) | 19,369 | 12,248 | 9,839 | — | |||||||||||||||||||
|
|
|
|
|
|
|
|
|
|
|
|
|
|
|
|||||||||||||||
| Adjusted noninterest expense |
$ | 140,869 | $ | 143,223 | $ | 192,088 | $ | 195,995 | $ | 195,968 | $ | 145,698 | $ | 91,681 | ||||||||||||||
|
|
|
|
|
|
|
|
|
|
|
|
|
|
|
|||||||||||||||
| Adjusted efficiency ratio* |
51.4 | % | 50.4 | % | 51.0 | % | 53.7 | % | 51.8 | % | 49.9 | % | 48.8 | % | ||||||||||||||
| Unadjusted efficiency ratio** |
53.4 | % | 41.9 | % | 45.1 | % | 56.0 | % | 53.3 | % | 51.5 | % | 48.8 | % | ||||||||||||||
| * | Calculated as ratio of adjusted noninterest expense to adjusted revenue. |
| ** | Calculated as ratio of tangible noninterest expense to total revenue (FTE). |
| (5) | Loans include unpaid principal balance net of unamortized discount on acquired loans and unearned net deferred fees and costs and loans in process. |
| (6) | Numerator excludes loans subject to FDIC loss-sharing arrangements. See “Management’s Discussion and Analysis of Financial Condition and Results of Operations—Key Factors Affecting Our Business and Financial Statements—Asset Quality and Loss-Sharing Arrangements.” |
| (7) | One of the financial measures we use to evaluate our financial condition is our tangible common equity to tangible assets ratio, which is not presented in accordance with GAAP. We compute this figure as the ratio of our tangible common equity to our tangible assets, each of which we calculate by subtracting (and thereby effectively excluding) the value of our goodwill and other intangible assets. We believe this measure is helpful in highlighting the common equity component of our capital and because of its focus by federal bank regulators when reviewing the health and strength of financial institutions in recent years, and when considering regulatory approvals for certain actions, including capital actions. |
22
Table of Contents
The following table shows our tangible common equity to tangible assets ratio as well as a reconciliation with the components used in its calculation for the periods indicated:
| June 30, | Sept. 30, | |||||||||||||||
| 2014 | 2013 | 2013 | 2012 | |||||||||||||
| (dollars in thousands) | ||||||||||||||||
| Tangible common equity and tangible common equity to tangible assets: |
||||||||||||||||
| Total stockholder’s equity |
$ | 1,430,964 | $ | 1,398,533 | $ | 1,417,214 | $ | 1,388,563 | ||||||||
| Less: Goodwill, core deposits and other intangibles |
714,803 | 732,941 | 728,251 | 747,552 | ||||||||||||
|
|
|
|
|
|
|
|
|
|||||||||
| Tangible common equity |
$ | 716,161 | $ | 665,592 | $ | 688,963 | $ | 641,011 | ||||||||
|
|
|
|
|
|
|
|
|
|||||||||
| Total assets |
$ | 9,292,283 | $ | 9,120,569 | $ | 9,134,258 | $ | 9,008,252 | ||||||||
| Less: Goodwill, core deposits and other intangibles |
714,803 | 732,941 | 728,251 | 747,552 | ||||||||||||
|
|
|
|
|
|
|
|
|
|||||||||
| Tangible assets |
$ | 8,577,480 | $ | 8,387,628 | $ | 8,406,007 | $ | 8,260,700 | ||||||||
|
|
|
|
|
|
|
|
|
|||||||||
| Tangible common equity to tangible assets |
8.3 | % | 7.9 | % | 8.2 | % | 7.8 | % | ||||||||
23
Table of Contents
Investing in our common stock involves a significant degree of risk. The material risks and uncertainties that management believes affect us are described below. Before investing in our common stock, you should carefully consider the risks and uncertainties described below, in addition to the other information contained in this prospectus. Any of the following risks, as well as risks that we do not know or currently deem immaterial, could have a material adverse effect on our business, financial condition or results of operations. As a result, the trading price of our common stock could decline, and you could lose some or all of your investment. Further, to the extent that any of the information in this prospectus constitutes forward-looking statements, the risk factors below are cautionary statements identifying important factors that could cause actual results to differ materially from those expressed in any forward-looking statements made by us or on our behalf. See “Cautionary Note Regarding Forward-Looking Statements.”
Risks Related to Our Business
Our business may be adversely affected by conditions in the financial markets and economic conditions generally and in our states in particular.
Our financial performance generally, and in particular the ability of our borrowers to pay interest on and repay principal of outstanding loans and the value of collateral securing those loans, as well as demand for loans and other products and services we offer and whose success we rely on to drive our future growth, is highly dependent upon the business environment in the markets in which we operate, principally in our states, and in the United States as a whole. Unlike larger banks that are more geographically diversified, we provide banking and financial services to customers in South Dakota, Iowa, Nebraska, Colorado, Arizona, Kansas and Missouri. The economic conditions in these local markets may be different from, and in some instances worse than, the economic conditions in the United States as a whole. Some elements of the business environment that affect our financial performance include short-term and long-term interest rates, the prevailing yield curve, inflation and price levels (particularly for agricultural commodities), monetary policy, unemployment and the strength of the domestic economy and the local economy in the markets in which we operate. Unfavorable market conditions can result in a deterioration in the credit quality of our borrowers and the demand for our products and services, an increase in the number of loan delinquencies, defaults and charge-offs, additional provisions for loan losses, adverse asset values and an overall material adverse effect on the quality of our loan portfolio. Unfavorable or uncertain economic and market conditions can be caused by declines in economic growth, business activity or investor or business confidence; limitations on the availability or increases in the cost of credit and capital; increases in inflation or interest rates; high unemployment; natural disasters; state or local government insolvency; or a combination of these or other factors.
In recent years, the U.S. economy has faced a severe economic crisis including a major recession from which it is slowly recovering. Business growth across a wide range of industries and regions in the United States remains reduced, and local governments and many businesses continue to experience financial difficulty. Since the recession, economic growth has been slow and uneven, unemployment levels generally remain elevated and there are continuing concerns related to the level of U.S. government debt and fiscal actions that may be taken to address that debt. There can be no assurance that economic conditions will continue to improve, and these conditions could worsen. Economic pressure on consumers and uncertainty regarding continuing economic improvement may result in changes in consumer and business spending, borrowing and saving habits. Such conditions could have a material adverse effect on the credit quality of our loans or our business, financial condition or results of operations.
The agricultural economy in our states has been affected by recent declines in prices and the rates of price growth for various crops. Weaker crop prices themselves could increase the risk of default on agricultural loans. Similarly, weaker crop prices could reduce the cash flows generated by farms and the value of agricultural land in our local markets and thereby increase the risk of default by our borrowers or reduce the foreclosure value of agricultural land and equipment that serve as collateral for certain of our loans. Moreover, weaker crop prices
24
Table of Contents
might threaten farming operations in the United States, reducing market demand for agricultural lending. In particular, farm income has seen recent declines as a result of lower crop prices and some drought conditions. In line with the downturn in farm income, farmland prices are coming under pressure.
In addition, certain local economies in our states rely to varying extents on manufacturing, which has experienced steep declines in the United States over the last decade. Declines in agriculture or manufacturing in these local economies may cause the local commercial environment to decline, which may impact the credit quality of our borrowers or reduce the demand for our products or services. Further, because unemployment is now slightly lower in certain of our states than nationwide, the economies of our states may not improve as much as the economies of other regions in any nationwide economic recovery.
We focus on originating business loans (in the form of commercial and industrial loans and commercial real estate loans), which may involve greater risk than residential mortgage lending.
As of June 30, 2014, our business lending, which consists of our C&I and CRE loans, represented approximately $4.03 billion, or 60%, of our loan portfolio. Our C&I loans and CRE loans secured by borrower-occupied property, or owner-occupied CRE loans, which together form the core of our business banking focus, totaled approximately $2.74 billion, or 41%, of our loan portfolio at June 30, 2014, with undisbursed loan commitments for these loans amounting to an additional $704 million. We also had approximately $1.29 billion of other CRE loans (i.e., construction and development loans, multifamily residential real estate loans and CRE loans secured by commercial property that is not borrower-occupied) at June 30, 2014, or 19% of our loan portfolio, including construction and development loans representing approximately 21% of our other CRE loans. Because payments on C&I loans, owner-occupied CRE loans and other CRE loans are often dependent on the successful operation or development of the property or business involved, repayment of such loans may be more sensitive than other types of loans to adverse conditions in the real estate market or the general economy. These types of loans may have a greater risk of loss than residential mortgage lending, in part because these loans are generally larger or more complex to underwrite than residential mortgages. In particular, real estate construction, acquisition and development loans have certain risks not present in other types of loans, including risks associated with construction cost overruns, project completion risk, general contractor credit risk and risks associated with the ultimate sale or use of the completed construction. If a decline in economic conditions or other issues cause difficulties for our borrowers of these types of business loans, if we fail to evaluate the credit of these loans accurately when we underwrite them or if we do not continue to monitor adequately the performance of these loans, our lending portfolio could experience delinquencies, defaults and credit losses that could have a material adverse effect on our business, financial condition or results of operations.
In addition to business loans, much of our lending is agricultural, and agricultural loans are dependent for repayment on the successful operation and management of the farm property, the health of the agricultural industry broadly, and in the location of the borrower in particular, and other factors outside of the borrower’s control.
At June 30, 2014, our agricultural loans, consisting primarily of agricultural operating loans (e.g., loans to farm and ranch owners and operators) and agricultural real estate loans, were $1.65 billion, representing 25% of our total loan portfolio. At June 30, 2014, agricultural operating loans totaled $890 million, or 13% of our loan portfolio; and agricultural real estate loans totaled $759 million, or 11%, of our loan portfolio. The primary livestock of our customers to whom we have extended agricultural loans include dairy cows, hogs and feeder cattle, and the primary crops of our customers to whom we have extended agricultural loans include corn, soybeans and, to a lesser extent, cotton and wheat. In addition, we estimate that 10% of our C&I loans and owner-occupied CRE loans were agriculture-related loans at June 30, 2014.
Agricultural markets are highly sensitive to real and perceived changes in the supply and demand of agricultural products. As over 80% of our agricultural lending (excluding C&I loans and owner-occupied CRE loans) is to farms producing grain, beef cattle, dairy products or hogs, our performance is closely related to the
25
Table of Contents
performance of, and supply and demand in, these agricultural sub-sectors. Weaker crop prices, particularly for grains, could reduce the value of agricultural land in our local markets and thereby increase the risk of default by our borrowers or reduce the foreclosure value of agricultural land and equipment that serves as collateral for certain of our loans.
Our agricultural loans are dependent on the profitable operation and management of the farm property securing the loan and its cash flows. The success of a farm property may be affected by many factors outside the control of the borrower, including:
| • | adverse weather conditions (such as hail, drought and floods), restrictions on water supply or other conditions that prevent the planting of a crop or limit crop yields; |
| • | loss of crops or livestock due to disease or other factors; |
| • | declines in the market prices or demand for agricultural products (both domestically and internationally), for any reason; |
| • | increases in production costs (such as the costs of labor, rent, feed, fuel and fertilizer); |
| • | adverse changes in interest rates, currency exchange rates, agricultural land values or other factors that may affect delinquency levels and credit losses on agricultural loans; |
| • | the impact of government policies and regulations (including changes in price supports, subsidies, government-sponsored crop insurance, minimum ethanol content requirements for gasoline, tariffs, trade barriers and health and environmental regulations); |
| • | access to technology and the successful implementation of production technologies; and |
| • | changes in the general economy that could affect the availability of off-farm sources of income and prices of real estate for borrowers. |
In addition, many farms are dependent on a limited number of key individuals whose injury or death could significantly affect the successful operation of the farm. If the cash flow from a farming operation is diminished, the borrower’s ability to repay the loan may be impaired. Consequently, agricultural loans may involve a greater degree of risk than residential mortgage lending, particularly in the case of loans that are unsecured or secured by rapidly depreciating assets such as farm equipment (some of which is highly specialized) or assets such as livestock or crops. In such cases, any repossessed collateral for a defaulted agricultural operating loan may not provide an adequate source of repayment of the outstanding loan balance as a result of the greater likelihood of damage, loss or depreciation or because the assessed value of the collateral exceeds the eventual realization value.
Our business is significantly dependent on the real estate markets where we operate, as a significant portion of our loan portfolio is secured by real estate.
At June 30, 2014, 61% of our aggregate loan portfolio, comprising our CRE loans (representing 36% of our aggregate loan portfolio), residential real estate loans (representing 14% of our aggregate loan portfolio) and agriculture real estate loans (representing 11% of our aggregate loan portfolio), was primarily secured by interests in real estate predominantly located in the states in which we operate. In addition, some of our other lending occasionally involves taking real estate as primary or secondary collateral. Real property values in these states may be different from, and in some instances worse than, real property values in other markets or in the United States as a whole, and may be affected by a variety of factors outside of our control and the control of our borrowers, including national and local economic conditions generally. Declines in real property prices, including prices for homes, commercial properties and farmland, in the states in which we operate could result in a deterioration of the credit quality of our borrowers, an increase in the number of loan delinquencies, defaults and charge-offs, and reduced demand for our products and services generally. Our CRE loans, in particular, totaled approximately $2.41 billion at June 30, 2014, or 36% of our loan portfolio, and may have a greater risk of loss than residential mortgage loans, in part because these loans are generally larger or more complex to
26
Table of Contents
underwrite. Agricultural real estate loans may be affected by similar factors to those that affect agricultural loans generally, including adverse weather conditions, disease and declines in the market prices for agricultural products or farm real estate. In addition, declines in real property values in the states in which we operate could reduce the value of any collateral we realize following a default on these loans and could adversely affect our ability to continue to grow our loan portfolio consistent with our underwriting standards. Our failure to effectively mitigate these risks could have a material adverse effect on our business, financial condition or results of operations.
Our business depends on our ability to successfully manage credit risk.
The operation of our business requires us to manage credit risk. As a lender, we are exposed to the risk that our borrowers will be unable to repay their loans according to their terms, and that the collateral securing repayment of their loans, if any, may not be sufficient to ensure repayment. In addition, there are risks inherent in making any loan, including risks with respect to the period of time over which the loan may be repaid, risks relating to proper loan underwriting, risks resulting from changes in economic and industry conditions and risks inherent in dealing with individual borrowers. In order to successfully manage credit risk, we must, among other things, maintain disciplined and prudent underwriting standards and ensure that our bankers follow those standards. The weakening of these standards for any reason, such as an attempt to attract higher yielding loans, a lack of discipline or diligence by our employees in underwriting and monitoring loans, the inability of our employees to adequately adapt policies and procedures to changes in economic or any other conditions affecting borrowers and the quality of our loan portfolio, may result in loan defaults, foreclosures and additional charge-offs and may necessitate that we significantly increase our allowance for loan losses, each of which could adversely affect our net income. As a result, our inability to successfully manage credit risk could have a material adverse effect on our business, financial condition or results of operations.
Severe weather, natural disasters, acts of war or terrorism or other external events could significantly impact our business.
Severe weather, natural disasters, widespread disease or pandemics, acts of war or terrorism or other adverse external events could have a significant impact on our ability to conduct business. In addition, such events could affect the stability of our deposit base, impair the ability of borrowers to repay outstanding loans, impair the value of collateral securing loans, cause significant property damage, result in loss of revenue or cause us to incur additional expenses. Because of the concentration of agricultural loans in our lending portfolio and the volume of our borrowers in regions dependent on agriculture, we could be disproportionally affected relative to others in the case of external events such as floods, droughts, and hail effecting the agricultural conditions in the markets we serve. The occurrence of any of these events in the future could have a material adverse effect on our business, financial condition or results of operations.
Our allowance for loan losses, our fair value adjustments related to credit on loans for which we have elected the fair value option and our credit marks (which reduce the fair value) on acquired loan portfolios may be insufficient, which could lead to additional losses on loans beyond those currently anticipated.
We maintain an allowance for loan losses, which is a reserve established through a provision for loan losses charged to expense representing management’s best estimate of probable losses that have been incurred within our existing portfolio of loans, fair value adjustments related to credit risk on our loans for which we have elected the fair value option and credit marks, which are estimates of expected credit losses that reduce the fair value of certain loans acquired through acquisitions. The allowance, in the judgment of management, is necessary to reserve for estimated loan losses and risks inherent in the portfolio. The level of the allowance reflects management’s continuing evaluation of specific credit risks; the quality of the loan portfolio; the value of the underlying collateral; the level of nonaccruing loans; and economic, political and regulatory conditions. The determination of the appropriate level of the allowance for loan losses inherently involves a high degree of
27
Table of Contents
subjectivity and requires us to make significant estimates of current credit risks, all of which may undergo material changes. We also establish fair value adjustments related to our estimates of expected credit losses for loans accounted for using the fair value option.
The application of the acquisition method of accounting in our acquisitions has impacted our allowance for loan losses. Under the acquisition method of accounting, loans we acquired were recorded in our consolidated financial statements at their fair value at the time of acquisition and the related allowance for loan loss was eliminated because credit quality, among other factors, was considered in the determination of fair value. To the extent that our estimates of fair value are too high, we will incur losses (some of which may be covered by our loss-sharing arrangements with the FDIC) associated with the acquired loans.
Although our management has established an allowance for loan losses it believes is adequate to absorb probable and reasonably estimable losses in our loan portfolio, this allowance may not be adequate. We could sustain credit losses that are significantly higher than the amount of our allowance for loan losses. Higher credit losses could arise for a variety of reasons, such as growth in our loan portfolio, changes in economic conditions affecting borrowers, new information regarding our loans and other factors within and outside our control. For example, if agricultural commodity prices or real estate values were to decline or if economic conditions in one or more of our principal markets were to deteriorate unexpectedly, additional loan losses not incorporated in the existing allowance for loan losses might occur. Losses in excess of the existing allowance for loan losses will reduce our net income and could have a material adverse effect on our business, financial condition or results of operations.
In addition, bank regulatory agencies will periodically review our allowance for loan losses and the value attributed to nonaccrual loans or to real estate we acquire through foreclosure. Such regulatory agencies may require us to adjust our determination of the value for these items, increase our allowance for loan losses or reduce the carrying value of owned real estate, reducing our net income. Further, if charge-offs in future periods exceed the allowance for loan losses, we will need additional adjustments to increase the allowance for loan losses. These adjustments could have a material adverse effect on our business, financial condition or results of operations.
We may not be able to attract and retain key personnel and other skilled employees.
Our success depends, in large part, on the skills of our management team and our ability to retain, recruit and motivate key officers and employees. Our senior management team has significant industry experience, and their knowledge and relationships would be difficult to replace. Leadership changes will occur from time to time, and we cannot predict whether significant resignations will occur or whether we will be able to recruit additional qualified personnel. Competition for senior executives and skilled personnel in the financial services and banking industry is intense, which means the cost of hiring, incentivizing and retaining skilled personnel may continue to increase. We need to continue to attract and retain key personnel and to recruit qualified individuals to succeed existing key personnel to ensure the continued growth and successful operation of our business. In addition, as a provider of relationship-based commercial and agribusiness banking services, we must attract and retain qualified banking personnel to continue to grow our business, and competition for such personnel can be intense. Our ability to effectively compete for senior executives and other qualified personnel by offering competitive compensation and benefit arrangements may be restricted by applicable banking laws and regulations as discussed in “Supervision and Regulation—Incentive Compensation.” The loss of the services of any senior executive or other key personnel, or the inability to recruit and retain qualified personnel in the future, could have a material adverse effect on our business, financial condition or results of operations. In addition, to attract and retain personnel with appropriate skills and knowledge to support our business, we may offer a variety of benefits, which could reduce our earnings or have a material adverse effect on our business, financial condition or results of operations.
28
Table of Contents
We operate in a highly competitive industry and market area.
We operate in the highly competitive financial services industry and face significant competition for customers from financial institutions located both within and beyond our principal markets. We compete with commercial banks, savings banks, credit unions, non-bank financial services companies and other financial institutions operating within or near the areas we serve, particularly nationwide and regional banks and larger community banking institutions that target the same customers we do. We also face competition for agricultural loans from participants in the nationwide Farm Credit System and global banks. In addition, as customer preferences and expectations continue to evolve, technology has lowered barriers to entry and made it possible for non-banks to offer products and services traditionally provided by banks, such as automatic transfer and automatic payment systems. Customer loyalty can be influenced by a competitor’s new products, especially offerings that could provide cost savings or a higher return to the customer. We may not be able to compete successfully with other financial institutions in our market, and we may have to pay higher interest rates to attract deposits, accept lower yields to attract loans and pay higher wages for new employees, resulting in reduced profitability. Further, increased lending activity by competing banks following the recent recession has led to increased competitive pressures on loan rates and terms for high-quality credits. Continued loan pricing pressure could have a further negative effect on our loan yields and net interest margin.
Many of our non-bank competitors are not subject to the same extensive regulations that govern our activities and may have greater flexibility in competing for business. Several of our competitors are also larger and have significantly more resources, greater name recognition and larger market shares than we do, enabling them to maintain numerous banking locations, provide technology-based banking tools we do not provide, maintain a wider range of product offerings, mount extensive promotional and advertising campaigns and be more aggressive than us in competing for loans and deposits. The financial services industry could become even more competitive as a result of legislative, regulatory and technological changes and continued consolidation. In addition, some of our current commercial banking customers may seek alternative banking sources as they develop needs for credit facilities larger than we may be able to accommodate. Our inability to compete successfully in the markets in which we operate could have a material adverse effect on our business, financial condition or results of operations.
We may not be able to successfully execute our strategic plan or manage our growth.
Our growth strategy requires us to manage several different elements simultaneously. Sustainable growth requires that we manage our risks by following prudent loan underwriting standards, balancing loan and deposit growth without increasing interest rate risk or compressing our net interest margin, maintaining more than adequate capital at all times, hiring and retaining qualified employees and successfully implementing strategic projects and initiatives. Our growth strategy may also change from time to time as a result of various internal and external factors. Our inability to manage our growth successfully could have a material adverse effect on our business, financial condition or results of operations.
We may be adversely affected by risks associated with completed and potential acquisitions.
We plan to continue to grow our business organically. However, from time to time, we may consider potential acquisition opportunities that we believe support our business strategy and may enhance our profitability. Acquisitions involve numerous risks, including:
| • | incurring time and expense associated with identifying and evaluating potential acquisitions and negotiating potential transactions, resulting in management’s attention being diverted from the operation of our existing business; |
| • | using inaccurate estimates and judgments to evaluate credit, operations, management and market risks with respect to the target institution or assets; |
| • | the risk that the acquired business will not perform to our expectations; |
29
Table of Contents
| • | difficulties, inefficiencies or cost overruns in integrating and assimilating the organizational cultures, operations, technologies, services and products of the acquired business with ours; |
| • | the risk of key vendors not fulfilling our expectations or not accurately converting data; |
| • | entering geographic and product markets in which we have limited or no direct prior experience; |
| • | the potential loss of key employees; |
| • | the potential for liabilities and claims arising out of the acquired businesses; and |
| • | the risk of not receiving required regulatory approvals or such approvals being restrictively conditional. |
In addition, we face significant competition from numerous other financial services institutions, many of which will have greater financial resources than we do, when considering acquisition opportunities. Accordingly, attractive acquisition opportunities may not be available to us. There can be no assurance that we will be successful in identifying or completing any future acquisitions.
Acquisitions of financial institutions also involve operational risks and uncertainties, and acquired companies may have unknown or contingent liabilities with no corresponding accounting allowance, exposure to unexpected asset quality problems that require write-downs or write-offs (as well as restructuring and impairment or other charges), difficulty retaining key employees and customers and other issues that could negatively affect our business. We may not be able to realize any projected cost savings, synergies or other benefits associated with any such acquisition we complete. Acquisitions typically involve the payment of a premium over book and market values and, therefore, some dilution of our tangible book value and net income per common share may occur in connection with any future transaction. Failure to successfully integrate the entities we acquire into our existing operations could increase our operating costs significantly and have a material adverse effect on our business, financial condition and results of operations.
Failed bank acquisitions involve risks similar to acquiring operating banks even though the FDIC might provide assistance to mitigate certain risks, such as sharing in exposure to loan losses and providing indemnification against certain liabilities of the failed institution. However, because these acquisitions are typically conducted by the FDIC in a manner that does not allow the time typically taken for a due diligence review or for preparing the integration of an acquired institution, we may face additional risks in transactions with the FDIC. These risks include, among other things, accuracy or completeness of due diligence materials, the loss of customers and core deposits, strain on management resources related to collection and management of problem loans and problems related to integration and retention of personnel and operating systems. There can be no assurance that we will be successful in overcoming these risks or any other problems encountered in connection with acquisitions (including FDIC-assisted transactions), nor that any FDIC-assisted opportunities will be available to us in our markets. Our inability to overcome these risks could have a material adverse effect on our business, financial condition or results of operations.
In addition, we must generally satisfy a number of meaningful conditions prior to completing any acquisition, including, in certain cases, federal and state bank-regulatory approval. Bank regulators consider a number of factors when determining whether to approve a proposed transaction, including the effect of the transaction on financial stability and the ratings and compliance history of all institutions involved, including the Community Reinvestment Act of 1977, or the CRA, examination results and anti-money laundering and Bank Secrecy Act compliance records of all institutions involved. The process for obtaining required regulatory approvals has become substantially more difficult as a result of the financial crisis, which could affect our future business. We may fail to pursue, evaluate or complete strategic and competitively significant business opportunities as a result of our inability, or our perceived inability, to obtain any required regulatory approvals in a timely manner or at all.
Any proposed acquisition must in certain circumstances be approved by NAB pursuant to the Stockholder Agreement we intend to enter into with NAB in connection with this offering, and, until such time as we cease to
30
Table of Contents
be a subsidiary of NAB for purposes of the Corporations Act 2001 (Cth), the Australian Prudential Regulation Authority, or APRA. In addition, as long as NAB controls us for purposes of the BHC Act, NAB’s regulatory status may impact our regulatory status, and hence our ability to expand by acquisition or engage in new activities, and NAB would be required to obtain BHC Act approvals for such acquisitions or activities as well. See “Our Relationship with NAB and Certain Other Related Party Transactions—Relationship with NAB—Stockholder Agreement,” as well as “Supervision and Regulation—Regulatory Impact of Control by NAB.”
New lines of business, products, product enhancements or services may subject us to additional risks.
From time to time, we may implement or acquire new lines of business or offer new products and product enhancements as well as new services within our existing lines of business. There are substantial risks and uncertainties associated with these efforts, particularly in instances where the markets are not fully developed. In acquiring, developing or marketing new lines of business, products, product enhancements or services, we may invest significant time and resources, although we may not assign the appropriate level of resources or expertise necessary to make these new lines of business, products, product enhancements or services successful or to realize their expected benefits. Further, initial timetables for the introduction and development of new lines of business, products, product enhancements or services may not be achieved, and price and profitability targets may not prove feasible. External factors, such as compliance with regulations, competitive alternatives and shifting market preferences, may also impact the ultimate implementation of a new line of business or offerings of new products, product enhancements or services. Furthermore, any new line of business, product, product enhancement or service could have a significant impact on the effectiveness of our system of internal controls. Any material change from the scope of our business immediately prior to this offering must also be approved by our parent, NAB, pursuant to the Stockholder Agreement we intend to enter into with NAB in connection with this offering. See “Our Relationship with NAB and Certain Other Related Party Transactions—Relationship with NAB—Stockholder Agreement.” Failure to successfully manage these risks in the development and implementation of new lines of business or offerings of new products, product enhancements or services could have a material adverse effect on our business, financial condition or results of operations.
If our techniques for managing risk are ineffective, we may be exposed to material unanticipated losses.
In order to manage the significant risks inherent in our business, we must maintain effective policies, procedures and systems that enable us to identify, monitor and control our exposure to material risks, such as credit, operational, legal and reputational risks. Our risk management methods may prove to be ineffective due to their design, their implementation or the degree to which we adhere to them, or as a result of the lack of adequate, accurate or timely information or otherwise. If our risk management efforts are ineffective, we could suffer losses that could have a material adverse effect on our business, financial condition or results of operations. In addition, we could be subject to litigation, particularly from our customers, and sanctions or fines from regulators. Our techniques for managing the risks we face may not fully mitigate the risk exposure in all economic or market environments, including exposure to risks that we might fail to identify or anticipate.
We are subject to interest rate risk.
Fluctuations in interest rates may negatively impact our banking business and may weaken demand for some of our products. Our earnings and cash flows are largely dependent on net interest income, which is the difference between the interest income we receive from interest-earning assets (e.g., loans and investment securities) and the interest expense we pay on interest-bearing liabilities (e.g., deposits and borrowings). The level of net interest income is primarily a function of the average balance of interest-earning assets, the average balance of interest-bearing liabilities and the spread between the yield on such assets and the cost of such liabilities. These factors are influenced by both the pricing and mix of interest-earning assets and interest-bearing liabilities. Interest rates are volatile and highly sensitive to many factors that are beyond our control, such as economic conditions and policies of various governmental and regulatory agencies, and, in particular the monetary policy of the Federal Open Market Committee of the Federal Reserve System, or the FOMC. Changes
31
Table of Contents
in monetary policy, including changes in interest rates, could influence not only the interest we receive on loans and securities and the amount of interest we pay on deposits and borrowings, but also our ability to originate loans and deposits. Historically, there has been an inverse correlation between the demand for loans and interest rates. Loan origination volume usually declines during periods of rising or high interest rates and increases during periods of declining or low interest rates. Changes in interest rates also have a significant impact on the carrying value of certain of our assets, including loans, real estate and investment securities, on our balance sheet. We may incur debt in the future and that debt may also be sensitive to interest rates.
The cost of our deposits is largely based on short-term interest rates, the level of which is driven primarily by the FOMC’s actions. However, the yields generated by our loans and securities are often difficult to re-price and are typically driven by longer-term interest rates, which are set by the market or, at times, the FOMC’s actions, and vary over time. The level of net interest income is therefore influenced by movements in such interest rates and the pace at which such movements occur. If the interest rates paid on our deposits and other borrowings increase at a faster pace than the interest rates on our loans and other investments, our net interest income may decline and, with it, a decline in our earnings may occur. Our net interest income and earnings would be similarly affected if the interest rates on our interest-earning assets declined at a faster pace than the interest rates on our deposits and other borrowings. Any substantial, unexpected, prolonged change in market interest rates could have a material adverse effect on our business, financial condition or results of operations.
Changes in interest rates can also affect the level of loan refinancing activity, which impacts the amount of prepayment penalty income we receive on loans we hold. Because prepayment penalties are recorded as interest income when received, the extent to which they increase or decrease during any given period could have a significant impact on the level of net interest income and net income we generate during that time. A decrease in our prepayment penalty income resulting from any change in interest rates or as a result of regulatory limitations on our ability to charge prepayment penalties could therefore adversely affect our net interest income, net income or results of operations.
Changes in interest rates can also affect the slope of the yield curve. A decline in the current yield curve or a flatter or inverted yield curve could cause our net interest income and net interest margin to contract, which could have a material adverse effect on our net income and cash flows, as well as the value of our assets. An inverted yield curve may also adversely affect the yield on investment securities by increasing the prepayment risk of any securities purchased at a premium.
Changes in interest rates could also have a negative impact on our results of operation by reducing the ability of borrowers to repay their current loan obligations or by reducing our margins and profitability. As of June 30, 2014, 44.4% of our loans were advanced to our customers on a variable or adjustable-rate basis. As a result, an increase in interest rates could result in increased loan defaults, foreclosures and charge-offs and could necessitate further increases to the allowance for loan losses, any of which could have a material adverse effect on our business, financial condition or results of operations. In addition, a decrease in interest rates could negatively impact our margins and profitability.
As of June 30, 2014, we had $1.29 billion of noninterest-bearing demand deposits and $3.95 billion of interest-bearing demand deposits. The prohibition restricting depository institutions from paying interest on demand deposits, such as checking accounts, was repealed effective on July 21, 2011 as part of the Dodd-Frank Wall Street Reform and Consumer Protection Act, or the Dodd-Frank Act. We then began offering interest-bearing corporate checking accounts. Current interest rates for this product are very low because of current market conditions and, so far, the impact of the repeal has not been significant to us. However, we do not know what market rates will eventually be and, therefore, we cannot estimate at this time the long-term impact of the repeal on our interest expense on deposits. If we need to offer higher interest rates on checking accounts to maintain current clients or attract new clients, our interest expense will increase, perhaps materially. Furthermore, if we fail to offer interest in a sufficient amount to keep these demand deposits, our core deposits may be reduced, which would require us to obtain funding in other ways or risk slowing our future asset growth.
32
Table of Contents
We are subject to liquidity risk that may affect our ability to meet our obligations and grow our business.
Liquidity risk is the risk that we will not be able to meet our obligations, including financial commitments, as they come due and is inherent in our operations. This risk can increase due to a number of factors, including an over-reliance on a particular source of funding (including, for example, short-term and overnight funding) or market-wide phenomena such as market dislocation and major disasters. Like many banking companies, we rely on customer deposits to meet a considerable portion of our funding, and we continue to seek customer deposits to maintain this funding base. We obtain deposits directly from retail and commercial customers and through brokerage firms that offer our deposit products to their customers. As of June 30, 2014, we had $6.83 billion in direct deposits (which includes deposits from banks and financial institutions and deposits related to prepaid cards) and $236.7 million in deposits originated through brokerage firms (including network deposit sweeps). A key part of our liquidity plan and funding strategy is to expand our direct deposits as a source of funding. However, these deposits are subject to potentially dramatic fluctuations in availability or price due to certain factors outside our control, such as a loss of confidence by customers in us or the banking sector generally, customer perceptions of our financial health and general reputation, increasing competitive pressures from other financial services firms for retail or corporate customer deposits, changes in interest rates and returns on other investment classes, which could result in significant outflows of deposits within short periods of time or significant changes in pricing necessary to maintain current or attract additional deposits.
Competition among U.S. banks for customer deposits is intense, may increase the cost of retaining current deposits or procuring new deposits and may otherwise negatively affect our ability to grow our deposit base. Any changes we make to the rates offered on our deposit products to remain competitive with other financial institutions may adversely affect our profitability and liquidity. In addition, our ability to originate and maintain deposits could be adversely affected by the loss of our association with NAB following this offering and NAB’s strategic plan to reduce its ownership in our business. The demand for the deposit products we offer may also be reduced due to a variety of factors, such as demographic patterns, changes in customer preferences, reductions in consumers’ disposable income, regulatory actions that decrease customer access to particular products or the availability of competing products. An inability to grow, or any material decrease in, our deposits could have a material adverse effect on our cost of funds and our ability to satisfy our liquidity needs. Further, the consequences of our liquidity risk may be more severe than other institutions because we do not currently have a credit rating from any major agency.
Maintaining a diverse and appropriate funding strategy remains challenging, and any tightening of credit markets could have a material adverse impact on us. In particular, our funding from corporate and financial institution counterparties may cease to be available if such counterparties seek to reduce their credit exposures to banks and other financial institutions, which could be reflected, for example, in reductions in unsecured deposits supplied by these counterparties. Under such circumstances, we may need to seek funds from alternative sources, potentially at higher costs than our current sources.
Reductions in interchange fees would reduce our associated income.
An interchange fee is a fee merchants pay to the interchange network in exchange for the use of the network’s infrastructure and payment facilitation, and which is paid to debit, credit and prepaid card issuers to compensate them for the costs associated with card issuance and operation. In the case of credit cards, this includes the risk associated with lending money to customers. We earn interchange fees on these card transactions, including $4.4 million in fees during the nine months ended June 30, 2014. Merchants, trying to decrease their operating expenses, have sought to, and have had some success at, lowering interchange rates. In particular, the Durbin Amendment to the Dodd-Frank Act limited the amount of interchange fees that may be charged for debit and prepaid card transactions. Several recent events and actions indicate a continuing focus on interchange fees by both regulators and merchants. Beyond pursuing litigation, legislation and regulation, merchants are also pursuing alternate payment platforms as a means to lower payment processing costs. To the extent interchange fees are further reduced, our income from those fees will be reduced, which could have a
33
Table of Contents
material adverse effect on our business and results of operations. In addition, the payment card industry is subject to the operating regulations and procedures set forth by payment card networks, and our failure to comply with these operating regulations, which may change from time to time, could subject us to various penalties or fees or the termination of our license to use the payment card networks, all of which could have a material adverse effect on our business, financial condition or results of operations.
Operational risks are inherent in our business.
Our operations depend on our ability to process a very large number of transactions efficiently and accurately while complying with applicable laws and regulations. Operational risk and losses can result from internal and external fraud; errors by employees or third parties; failure to document transactions properly or to obtain proper authorization; failure to comply with applicable regulatory requirements and conduct of business rules; equipment failures, including those caused by natural disasters or by electrical, telecommunications or other essential utility outages; business continuity and data security system failures, including those caused by computer viruses, cyber-attacks or unforeseen problems encountered while implementing major new computer systems or upgrades to existing systems; or the inadequacy or failure of systems and controls, including those of our suppliers or counterparties. Although we have implemented risk controls and loss mitigation actions, and substantial resources are devoted to developing efficient procedures, identifying and rectifying weaknesses in existing procedures and training staff, it is not possible to be certain that such actions have been or will be effective in controlling each of the operational risks faced by us. Any weakness in these systems or controls, or any breaches or alleged breaches of such laws or regulations, could result in increased regulatory scrutiny, enforcement actions or legal proceedings and could have an adverse impact on our business, financial condition or results of operations.
Cyber-attacks or other security breaches could have a material adverse effect on our business.
In the normal course of business, we collect, process and retain sensitive and confidential information regarding our customers. We also have arrangements in place with other third parties through which we share and receive information about their customers who are or may become our customers. Although we devote significant resources and management focus to ensuring the integrity of our systems through information security and business continuity programs, our facilities and systems, and those of third party service providers, are vulnerable to external or internal security breaches, acts of vandalism, computer viruses, misplaced or lost data, programming or human errors or other similar events.
Information security risks for financial institutions like us have increased recently in part because of new technologies, the use of the Internet and telecommunications technologies (including mobile devices) to conduct financial and other business transactions and the increased sophistication and activities of organized crime, perpetrators of fraud, hackers, terrorists and others. In addition to cyber-attacks or other security breaches involving the theft of sensitive and confidential information, hackers recently have engaged in attacks against large financial institutions, particularly denial of service attacks, that are designed to disrupt key business services, such as customer-facing web sites. We are not able to anticipate or implement effective preventive measures against all security breaches of these types, especially because the techniques used change frequently and because attacks can originate from a wide variety of sources. We employ detection and response mechanisms designed to contain and mitigate security incidents, but early detection may be thwarted by sophisticated attacks and malware designed to avoid detection.
We also face risks related to cyber-attacks and other security breaches in connection with credit card transactions that typically involve the transmission of sensitive information regarding our customers through various third parties, including merchant acquiring banks, payment processors, payment card networks (e.g., Visa, MasterCard) and our processors. Some of these parties have in the past been the target of security breaches and cyber-attacks, and because the transactions involve third parties and environments such as the point of sale that we do not control or secure, future security breaches or cyber-attacks affecting any of these third parties
34
Table of Contents
could impact us through no fault of our own, and in some cases we may have exposure and suffer losses for breaches or attacks relating to them. We also rely on numerous other third party service providers to conduct other aspects of our business operations and face similar risks relating to them. While we regularly conduct security assessments on these third parties, we cannot be sure that their information security protocols are sufficient to withstand a cyber-attack or other security breach.
The access by unauthorized persons to, or the improper disclosure by us of, confidential information regarding our customers or our own proprietary information, software, methodologies and business secrets could result in significant legal and financial exposure, supervisory liability, damage to our reputation or a loss of confidence in the security of our systems, products and services, which could have a material adverse effect on our business, financial condition or results of operations. In addition, recently there have been a number of well-publicized attacks or breaches affecting others in our industry that have heightened concern by consumers generally about the security of using credit cards, which have caused some consumers, including our customers, to use our credit cards less in favor of alternative methods of payment and has led to increased regulatory focus on, and potentially new regulations relating to, these matters. Further cyber-attacks or other breaches in the future, whether affecting us or others, could intensify consumer concern and regulatory focus and result in reduced use of our cards and increased costs, all of which could have a material adverse effect on our business. To the extent we are involved in any future cyber-attacks or other breaches, our brand and reputation could be affected, would could also have a material adverse effect on our business, financial condition or results of operations.
Our information systems may experience an interruption or breach in security.
Our communications, information and technology systems supporting our operations are important to our efficiency and vulnerable to unforeseen problems. Our operations depend on our ability, as well as that of third party service providers, to protect computer systems and network infrastructure against damage from fires, other natural disasters or pandemics; power or telecommunications failures; acts of terrorism or wars or other catastrophic events; or other physical break-ins. Any damage or failure that causes interruptions in operations or disruptions in our business could result in liability to clients, regulatory intervention or reputational harm and, thus, could have a material adverse effect on our business, financial condition or results of operations.
We rely heavily on communications and information systems to conduct our business. Any failure, interruption or breach in security of these systems could result in failures or disruptions in our customer relationship management, general ledger, deposit, loan or other systems. Moreover, if any such failures, interruptions or security breaches do occur, they may not be adequately addressed. If we experience a disruption in the provision of any functions or services performed by third parties, we may have difficulty in finding alternate providers on terms favorable to us and in reasonable timeframes. The occurrence of any failures, interruptions or security breaches of our communications and information systems could damage our reputation, result in a loss of customer business, subject us to additional regulatory scrutiny or expose us to civil litigation and possible financial liability, any of which could have a material adverse effect on our business, financial condition or results of operations.
We continually encounter technological change.
The financial services industry is continually undergoing rapid technological change with frequent introductions of new, technology-driven products and services. The effective use of technology increases efficiency and enables financial institutions to better serve customers and to reduce costs. Our future success depends, in part, upon our ability to address the needs of our customers by using technology to provide products and services that will satisfy customer demands, as well as to create additional efficiencies in our operations. Many of our competitors have substantially greater resources to invest in technological improvements than we do. We may not be able to effectively implement new, technology-driven products and services or be successful in marketing these products and services to our customers. In addition, the implementation of technological
35
Table of Contents
changes and upgrades to maintain current systems and integrate new ones may also cause service interruptions, transaction processing errors and system conversion delays and may cause us to fail to comply with applicable laws. Failure to successfully keep pace with technological change affecting the financial services industry and avoid interruptions, errors and delays could have a material adverse effect on our business, financial condition or results of operations.
We expect that new technologies and business processes applicable to the consumer credit industry will continue to emerge, and these new technologies and business processes may be better than those we currently use. Because the pace of technological change is high and our industry is intensely competitive, we cannot assure you that we will be able to sustain our investment in new technology as critical systems and applications become obsolete or as better ones become available. A failure to maintain current technology and business processes could cause disruptions in our operations or cause our products and services to be less competitive, all of which could have a material adverse effect on our business, financial condition or results of operations.
Our ability to maintain, attract and retain customer relationships is highly dependent on our reputation.
Our customers rely on us to deliver superior, personalized financial services with the highest standards of ethics, performance, professionalism and compliance. Damage to our reputation could undermine the confidence of our current and potential customers in our ability to provide high-quality financial services. Such damage could also impair the confidence of our counterparties and vendors and ultimately affect our ability to effect transactions. Maintenance of our reputation depends not only on our success in maintaining our service-focused culture and controlling and mitigating the various risks described herein, but also on our success in identifying and appropriately addressing issues that may arise in areas such as potential conflicts of interest, anti-money laundering, client personal information and privacy issues, customer and other third party fraud, record-keeping, regulatory investigations and any litigation that may arise from the failure or perceived failure of us to comply with legal and regulatory requirements. Maintaining our reputation also depends on our ability to successfully prevent third parties from infringing on the “Great Western Bank” brand and associated trademarks and our other intellectual property. Defense of our reputation, trademarks and other intellectual property, including through litigation, could result in costs that could have a material adverse effect on our business, financial condition or results of operations.
Employee misconduct could expose us to significant legal liability and reputational harm.
We are vulnerable to reputational harm because we operate in an industry in which integrity and the confidence of our customers are of critical importance. Our employees could engage in misconduct that adversely affects our business. For example, if an employee were to engage in fraudulent, illegal or suspicious activities, we could be subject to regulatory sanctions and suffer serious harm to our reputation (as a consequence of the negative perception resulting from such activities), financial position, customer relationships and ability to attract new customers. Our business often requires that we deal with confidential information. If our employees were to improperly use or disclose this information, even if inadvertently, we could suffer serious harm to our reputation, financial position and current and future business relationships. It is not always possible to deter employee misconduct, and the precautions we take to detect and prevent this activity may not always be effective. Misconduct by our employees, or even unsubstantiated allegations of misconduct, could result in a material adverse effect on our business, financial condition or results of operations.
We may be adversely affected by changes in the actual or perceived soundness or condition of other financial institutions.
Financial services institutions that deal with each other are interconnected as a result of trading, investment, liquidity management, clearing, counterparty and other relationships. Within the financial services industry, loss of public confidence, including through default by any one institution, could lead to liquidity challenges or to defaults by other institutions. Concerns about, or a default by, one institution could lead to significant liquidity
36
Table of Contents
problems and losses or defaults by other institutions, as the commercial and financial soundness of many financial institutions is closely related as a result of these credit, trading, clearing and other relationships. Even the perceived lack of creditworthiness of, or questions about, a counterparty may lead to market-wide liquidity problems and losses or defaults by various institutions. This systemic risk may adversely affect financial intermediaries, such as clearing agencies, banks and exchanges with which we interact on a daily basis or key funding providers such as the Federal Home Loan Banks, any of which could have a material adverse effect on our access to liquidity or otherwise have a material adverse effect on our business, financial condition or results of operations.
We may need to raise additional capital in the future, and such capital may not be available when needed or at all.
We may need to raise additional capital, in the form of additional debt or equity, in the future to have sufficient capital resources and liquidity to meet our commitments and fund our business needs and future growth, particularly if the quality of our assets or earnings were to deteriorate significantly. Our ability to raise additional capital, if needed, will depend on, among other things, conditions in the capital markets at that time, which are outside of our control, and our financial condition. Economic conditions and a loss of confidence in financial institutions may increase our cost of funding and limit access to certain customary sources of capital, including inter-bank borrowings, repurchase agreements and borrowings from the discount window of the Federal Reserve System.
We cannot assure you that such capital will be available on acceptable terms—or at all. Any occurrence that may limit our access to the capital markets, such as a decline in the confidence of debt purchasers, depositors of our bank or counterparties participating in the capital markets or other disruption in capital markets, may adversely affect our capital costs and our ability to raise capital and, in turn, our liquidity. Further, if we need to raise capital in the future, we may have to do so when many other financial institutions are also seeking to raise capital and would then have to compete with those institutions for investors. An inability to raise additional capital on acceptable terms when needed could have a material adverse effect on our business, financial condition or results of operations.
The value of our securities in our investment portfolio may decline in the future.
As of June 30, 2014, we owned $1.40 billion of investment securities. The fair value of our investment securities may be adversely affected by market conditions, including changes in interest rates, and the occurrence of any events adversely affecting the issuer of particular securities in our investments portfolio. We analyze our securities on a quarterly basis to determine if an other-than-temporary impairment has occurred. The process for determining whether impairment is other-than-temporary usually requires complex, subjective judgments about the future financial performance of the issuer in order to assess the probability of receiving all contractual principal and interest payments on the security. Because of changing economic and market conditions affecting issuers, we may be required to recognize other-than-temporary impairment in future periods, which could have a material adverse effect on our business, financial condition or results of operations.
The value of our goodwill and other intangible assets may decline in the future.
As of June 30, 2014, we had $714.8 million of goodwill and other intangible assets. Goodwill represents the cost in excess of the fair value of net assets acquired (including identifiable intangibles) in transactions accounted for as business acquisitions. We review our goodwill for impairment at least annually, or more frequently if events or changes in circumstances indicate that the carrying value of the asset might be impaired. We determine impairment by comparing the implied fair value of the goodwill with the carrying amount of that goodwill. If the carrying amount of the goodwill exceeds the implied fair value of that goodwill, an impairment loss is recognized in an amount equal to the excess. A significant decline in our expected future cash flows, a material change in interest rates, a significant adverse change in the business climate, slower growth rates or a significant or
37
Table of Contents
sustained decline in the price of our common stock, when and if a market for our common stock is established, may necessitate taking charges in the future related to the impairment of our goodwill and other intangible assets. We cannot assure you that we will not be required to record any charges for goodwill impairment in the future. If we conclude that such a write-down of goodwill and other intangible assets has become necessary, we will record the appropriate charge in the period in which it becomes known to us, which could have a material adverse effect on our business, financial condition or results of operations.
We rely on the mortgage secondary market for some of our liquidity.
We originate and sell mortgage loans and their servicing rights, including $146.3 million of mortgage loans sold during the nine months ended June 30, 2014. We rely on Federal National Mortgage Association, or FNMA, and other purchasers to purchase loans in order to reduce our credit risk and provide funding for additional loans we desire to originate. We cannot provide assurance that these purchasers will not materially limit their purchases from us due to capital constraints or other factors, including, with respect to FNMA, a change in the criteria for conforming loans. In addition, various proposals have been made to reform the U.S. residential mortgage finance market, including the role of FNMA. The exact effects of any such reforms are not yet known, but may limit our ability to sell conforming loans to FNMA. In addition, mortgage lending is highly regulated, and our inability to comply with all federal and state regulations and investor guidelines regarding the origination, underwriting documentation and servicing of mortgage loans may also impact our ability to continue selling mortgage loans. If we are unable to continue to sell loans in the secondary market, our ability to fund, and thus originate, additional mortgage loans may be adversely affected, which could have a material adverse effect on our business, financial condition or results of operations.
We are subject to a variety of risks in connection with any sale of loans we may conduct.
When we sell mortgage loans we are required to make customary representations and warranties to the purchaser about the mortgage loans and the manner in which they were originated and serviced. If any of these representations and warranties are incorrect, we may be required to indemnify the purchaser for any related losses, or we may be required to repurchase or provide substitute mortgage loans for part or all of the affected loans. We may also be required to repurchase loans as a result of borrower fraud or in the event of early payment default by the borrower on a loan we have sold. If the level of repurchase and indemnity activity becomes material, it could have a material adverse effect on our liquidity, business, financial condition or results of operations.
Mortgage lending is highly regulated. Our inability to comply with all federal and state regulations and investor guidelines regarding the origination, underwriting documentation and servicing of mortgage loans may impact our ability to continue selling mortgage loans.
In addition, we must report as held for sale any loans which we have undertaken to sell, whether or not a purchase agreement for the loans has been executed. We may therefore be unable to ultimately complete a sale for part or all of the loans we classify as held for sale. We must exercise our judgment in determining when loans must be reclassified from held for investment status to held for sale status under applicable accounting guidelines. Any failure to accurately report loans as held for sale could result in regulatory investigations and monetary penalties. Any of these actions could have a material adverse effect on our business, financial condition or results of operations. Our policy is to carry loans held for sale at the lower of cost or fair value. As a result, prior to being sold, any loans classified as held for sale may be adversely affected by market conditions, including changes in interest rates, and by changes in the borrower’s creditworthiness, and the value associated with these loans, including any loans originated for sale in the secondary market, may decline prior to being sold. We may be required to reduce the value of any loans we mark held for sale as a result, which could have a material adverse effect on our business, financial condition or results of operations.
38
Table of Contents
The appraisals and other valuation techniques we use in evaluating and monitoring loans secured by real property may not accurately describe the net value of the collateral that we can realize.
In considering whether to make a loan secured by real property, we generally require an appraisal of the property. However, an appraisal is only an estimate of the value of the property at the time the appraisal is made, and, as real estate values may change significantly in value in relatively short periods of time (especially in periods of heightened economic uncertainty), this estimate may not accurately describe the net value of the real property collateral after the loan is made. As a result, we may not be able to realize the full amount of any remaining indebtedness when we foreclose on and sell the relevant property. In addition, we rely on appraisals and other valuation techniques to establish the value of our other real estate owned portfolio, or OREO, and to determine certain loan impairments. If any of these valuations are inaccurate, our consolidated financial statements may not reflect the correct value of our OREO, and our allowance for loan losses may not reflect accurate loan impairments. This could have a material adverse effect on our business, financial condition or results of operations.
Our operations could be interrupted if certain external vendors on which we rely experience difficulty, terminate their services or fail to comply with banking laws and regulations.
We depend to a significant extent on relationships with third party service providers. Specifically, we utilize third party core banking services and receive credit card and debit card services, branch capture services, Internet banking services and services complementary to our banking products from various third party service providers. If these third party service providers experience difficulties or terminate their services and we are unable to replace them with other service providers, our operations could be interrupted. It may be difficult for us to replace some of our third party vendors, particularly vendors providing our core banking, credit card and debit card services, in a timely manner if they were unwilling or unable to provide us with these services in the future for any reason. If an interruption were to continue for a significant period of time, it could have a material adverse effect on our business, financial condition or results of operations. Even if we are able to replace them, it may be at higher cost to us, which could have a material adverse effect on our business, financial condition or results of operations. In addition, if a third party provider fails to provide the services we require, fails to meet contractual requirements, such as compliance with applicable laws and regulations, or suffers a cyber-attack or other security breach, our business could suffer economic and reputational harm that could have a material adverse effect on our business, financial condition or results of operations.
We rely on dividends and other payments from our bank for substantially all of our revenue.
We are a separate and distinct legal entity from our bank, and we receive substantially all of our revenue from dividends and other payments from our bank. These dividends and payments are the principal source of funds to pay dividends on our capital stock and interest and principal on any debt we may have. Various federal and state laws and regulations limit the amount of dividends that our bank may pay to us. Also, our right to participate in a distribution of assets upon a subsidiary’s liquidation or reorganization is subject to the prior claims of the subsidiary’s creditors. In the event our bank is unable to pay dividends to us, we may not be able to service debt, pay obligations, or pay dividends on our common stock. The inability to receive dividends from our bank could have a material adverse effect on our business, financial condition or results of operations.
Loans that we make through certain federal programs are dependent on the federal government’s continuation and support of these programs and on our compliance with their requirements.
We participate in various U.S. government agency guarantee programs, including programs operated by the United States Department of Agriculture, Small Business Administration, Farm Service Administration and the United States Department of the Interior. We are responsible for following all applicable U.S. government agency regulations, guidelines and policies whenever we originate loans as part of these guarantee programs. If we fail to follow any applicable regulations, guidelines or policies associated with a particular guarantee program, any loans we originate as part of that program may lose the associated guarantee, exposing us to credit risk we would not
39
Table of Contents
otherwise be exposed to or underwritten as part of our origination process for U.S. government agency guaranteed loans, or result in our inability to continue originating loans under such programs. The loss of any guarantees for loans we have extended under U.S. government agency guarantee programs or the loss of our ability to participate in such programs could have a material adverse effect on our business, financial condition or results of operations.
We depend on the accuracy and completeness of information about clients and counterparties.
In deciding whether to extend credit or enter into other transactions, we may rely on information furnished by or on behalf of customers and counterparties, including financial statements, credit reports and other financial information. We may also rely on representations of those customers or counterparties or of other third parties, such as independent auditors, as to the accuracy and completeness of that information. Reliance on inaccurate, fraudulent or misleading financial statements, credit reports or other financial information could result in loan losses, reputational damage or other effects that could have a material adverse effect on our business, financial condition or results of operations.
Downgrades to the credit rating of the U.S. government or of its securities or any of its agencies by one or more of the credit ratings agencies could have a material adverse effect on general economic conditions, as well as our business.
On August 5, 2011, Standard & Poor’s cut the credit rating of the U.S. federal government’s long-term sovereign debt from AAA to AA+, while also keeping its outlook negative. Moody’s had lowered its own outlook for the same debt to “Negative” on August 2, 2011, and Fitch also lowered its outlook for the same debt to “Negative,” on November 28, 2011. Last year, both Moody’s and Standard & Poor’s revised their outlooks from “Negative” to “Stable,” and on March 21, 2014, Fitch revised its outlook from “Negative” to “Stable.” Further downgrades of the U.S. federal government’s sovereign credit rating, and the perceived creditworthiness of U.S. government-backed obligations, could impact our ability to obtain funding that is collateralized by affected instruments and our ability to access capital markets on favorable terms. Such downgrades could also affect the pricing of funding, when funding is available. A downgrade of the credit rating of the U.S. government, or of its agencies, government-sponsored enterprises or related institutions, agencies or instrumentalities, may also adversely affect the market value of such instruments and, further, exacerbate the other risks to which we are subject and any related adverse effects on our business, financial condition or results of operations.
Our internal controls, processes and procedures may fail or be circumvented.
Our internal controls, disclosure controls, processes and procedures, and corporate governance policies and procedures are based in part on certain assumptions and can provide only reasonable (not absolute) assurances that the objectives of the system are met. Any failure or circumvention of our controls, processes and procedures or failure to comply with regulations related to controls, processes and procedures could necessitate changes in those controls, processes and procedures, which may increase our compliance costs, divert management attention from our business or subject us to regulatory actions and increased regulatory scrutiny. Any of these could have a material adverse effect on our business, financial condition or results of operations.
Our accounting estimates and risk management processes rely on analytical and forecasting techniques and models.
Our accounting policies and methods are fundamental to how we record and report our financial condition and results of operations. Our management must exercise judgment in selecting and applying many of these accounting policies and methods so they comply with GAAP and reflect management’s judgment of the most appropriate manner to report our financial condition and results. In some cases, management must select the accounting policy or method to apply from two or more alternatives, any of which may be reasonable under the circumstances, yet which may result in our reporting materially different results than would have been reported under a different alternative.
40
Table of Contents
Certain accounting policies are critical to presenting our financial condition and results. They require management to make difficult, subjective or complex judgments about matters that are uncertain. Materially different amounts could be reported under different conditions or using different assumptions or estimates. These critical accounting policies include credit risk management, the allowance for loan losses and unfunded commitments, FDIC indemnification asset and clawback liability, goodwill, core deposits and other intangibles and income taxes. Because of the uncertainty of estimates involved in these matters, we may be required to do one or more of the following: significantly increase the allowance for loan losses or sustain loan losses that are significantly higher than the reserve provided; recognize significant impairment on goodwill and other intangible asset balances; reduce the carrying value of an asset measured at fair value; or significantly increase our accrued tax liability. Any of these could have a material adverse effect on our business, financial condition or results of operations. For a discussion of our critical accounting policies, see “Management’s Discussion and Analysis of Financial Condition and Results of Operations—Critical Accounting Policies and the Impact of Accounting Estimates.”
We rely extensively on models in managing many aspects of our business, and these models may be inaccurate or misinterpreted.
We rely extensively on models in managing many aspects of our business, including liquidity and capital planning, customer selection, credit and other risk management, pricing, reserving and collections management. The models may prove in practice to be less predictive than we expect for a variety of reasons, including errors in constructing, interpreting or using the models or inaccurate assumptions (e.g., failures to update assumptions appropriately or in a timely manner). Our assumptions may be inaccurate for many reasons as they often involve matters that are inherently difficult to predict and beyond our control (e.g., macroeconomic conditions and their impact on behavior) and often involve complex interactions between a number of variables, factors and other assumptions. The errors or inaccuracies in our models may be material, and could lead us to make wrong or sub-optimal decisions in managing our business, and this could have a material adverse effect on our business, financial condition or results of operations.
We may have exposure to tax liabilities that are larger than we anticipate.
The tax laws applicable to our business activities, including the laws of the United States, South Dakota and other jurisdictions, are subject to interpretation and may change over time. From time to time, legislative initiatives, such as proposals for fundamental federal tax reform and corporate tax rate changes, which may impact our effective tax rate and could adversely affect our deferred tax assets or our tax positions or liabilities. The taxing authorities in the jurisdictions in which we operate may challenge our tax positions, which could increase our effective tax rate and harm our financial position and results of operations. In addition, our future income taxes could be adversely affected by earnings being higher than anticipated in jurisdictions that have higher statutory tax rates or by changes in tax laws, regulations or accounting principles. We are subject to audit and review by U.S. federal and state tax authorities. Any adverse outcome of such a review or audit could have a negative effect on our financial position and results of operations. In addition, the determination of our provision for income taxes and other liabilities requires significant judgment by management. Although we believe that our estimates are reasonable, the ultimate tax outcome may differ from the amounts recorded in our financial statements and could have a material adverse effect on our financial results in the period or periods for which such determination is made.
Fulfilling our public company financial reporting and other regulatory obligations will be expensive and time consuming and may strain our resources.
As a public company, we will be subject to the reporting requirements of the Securities Exchange Act of 1934, as amended, or the Exchange Act, and will be required to implement specific corporate governance practices and adhere to a variety of reporting requirements under the Sarbanes-Oxley Act of 2002, or Sarbanes-Oxley, and the related rules and regulations of the SEC, as well as the rules of the NYSE. The Exchange Act will require us to file
41
Table of Contents
annual, quarterly and current reports with respect to our business and financial condition. Sarbanes-Oxley will require, among other things, that we maintain effective disclosure controls and procedures and internal control over financial reporting. Compliance with these requirements will place significant additional demands on our legal, accounting and finance staff and on our accounting, financial and information systems and will increase our legal and accounting compliance costs as well as our compensation expense as we may be required to hire additional accounting, tax, finance and legal staff. As a public company we may also need to enhance our investor relations and corporate communications functions and attract additional qualified board members. These additional efforts may strain our resources and divert management’s attention from other business concerns, which could have a material adverse effect on our business, financial condition or results of operations.
In accordance with Section 404 of Sarbanes-Oxley, our management will be required to conduct an annual assessment of the effectiveness of our internal control over financial reporting and include a report on these internal controls in the annual reports we will file with the SEC on Form 10-K. Our independent registered public accounting firm will not be required to formally attest to the effectiveness of our internal controls until the later of the year following the first annual report required to be filed with the SEC and the date on which we are no longer an “emerging growth company.” When required, this process will require significant documentation of policies, procedures and systems, review of that documentation by our internal auditing and accounting staff and our outside independent registered public accounting firm, and testing of our internal control over financial reporting by our internal auditing and accounting staff and our outside independent registered public accounting firm. This process will involve considerable time and attention, may strain our internal resources, and will increase our operating costs. We may experience higher than anticipated operating expenses and outside auditor fees during the implementation of these changes and thereafter. If our independent registered public accounting firm is unable to express an opinion as to the effectiveness of our internal control over financial reporting, investors may lose confidence in the accuracy and completeness of our financial reports and the market price of our common stock could be negatively affected, and we could become subject to investigations by the NYSE, the SEC or other regulatory authorities, which could require additional financial and management resources.
We are in the process of reviewing our internal control over financial reporting and are establishing formal policies, processes and practices related to financial reporting and to the identification of key financial reporting risks, assessment of their potential impact and linkage of those risks to specific areas and controls within our organization. If we are not able to implement the requirements of Section 404 in a timely and capable manner, we may be subject to adverse regulatory consequences and there could be a negative reaction in the financial markets due to a loss of investor confidence in us and the reliability of our financial statements. This could have a material adverse effect on business, financial condition or results of operations.
We may not be able to report our future financial results accurately and timely as a publicly listed company if we fail to maintain an effective system of disclosure controls and procedures and internal control over financial reporting, or if we fail to remediate the material weakness identified relating to the design and operation of our internal control over financial reporting.
As a result of this offering, we will transition from being a wholly owned subsidiary of a large public entity listed in Australia to becoming a public company in our own right listed in the United States. As such we are now subject to the heightened financial reporting standards under GAAP and SEC rules, including more extensive levels of disclosure, which require enhancements to the design and operation of our internal control over financial reporting. In the process of preparing additional disclosures required by the SEC for public companies contained within our consolidated financial statements under these heightened requirements in connection with this offering, during the third quarter of fiscal 2014, we concluded a material weakness existed in the design and operation of our internal control over financial reporting. A material weakness is a deficiency, or combination of deficiencies, in internal control over financial reporting such that there is a reasonable possibility that a material misstatement of our financial statements will not be prevented or detected on a timely basis. The material weakness identified resulted primarily from a lack of sufficient resources and personnel within the accounting function engaged in the preparation and review of our consolidated financial statements and a lack of formal
42
Table of Contents
controls and procedures with respect to our internal review of the accuracy and completeness of our application of SEC rules to our consolidated financial statements. See “Management’s Discussion and Analysis of Financial Condition and Results of Operations—Internal Control Over Financial Reporting” for more information. The material weakness did not affect our reported net income or stockholder’s equity for any financial reporting period or materially affect our reported total assets and total liabilities for any financial reporting period.
Following identification of the material weakness, we implemented a number of controls and procedures designed to improve our control environment. In particular, we included additional members of our accounting and financial reporting staff in the preparation and review of interim consolidated financial statements at and for the nine months ended June 30, 2014 included in this prospectus and have implemented a more formal preparation and review hierarchy designed to identify and resolve potential errors on a timely basis. We have also contracted with two independent consulting firms to assist us in the preparation of our consolidated financial statements, and we plan to hire and utilize additional experienced, qualified personnel within our financial reporting function in the future to assist with the preparation and review of future financial statements. Management continues to evaluate the design and operating effectiveness of these changes to our control environment, and we believe that further reporting periods, including the fiscal year end 2014 reporting cycle, are required to confirm the remediation of the previously identified material weakness as well as the ongoing effectiveness of the revised control environment. We therefore cannot assure you that we will be successful in implementing all remedial measures we may undertake or that these measures will significantly improve or remediate the material weakness identified in the design and operating effectiveness of our internal control over financial reporting, which, in future periods, could impact our ability to report our financial results accurately or on a timely basis.
More generally, if we are unable to meet the demands that will be placed upon us as a public company, including the requirements of Sarbanes-Oxley, we may be unable to accurately report our financial results in future periods, or report them within the timeframes required by law or stock exchange regulations. Failure to comply with Sarbanes-Oxley, when and as applicable, could also potentially subject us to sanctions or investigations by the SEC or other regulatory authorities. Under such circumstances, we cannot assure you that we will be able to implement the necessary internal controls in a timely manner, or at all, or that future material weaknesses will not exist or otherwise be discovered. If we fail to implement the necessary improvements, or if material weaknesses or other deficiencies occur, our ability to accurately and timely report our financial position could be impaired, which could result in late filings of our annual and quarterly reports under the Exchange Act, restatements of our consolidated financial statements, a decline in our stock price, suspension or delisting of our common stock from the NYSE, and could have a material adverse effect on our business, results of operations or financial condition. Even if we are able to report our financial statements accurately and in a timely manner, any failure in our efforts to implement the improvements or disclosure of material weaknesses in our future filings with the SEC could cause our reputation to be harmed and our stock price to decline significantly.
We have not performed an evaluation of our internal control over financial reporting, as contemplated by Section 404 of Sarbanes-Oxley, nor have we engaged our independent registered public accounting firm to perform an audit of our internal control over financial reporting as of any balance sheet date reported in our financial statements. Had we performed such an evaluation or had our independent registered public accounting firm performed an audit of our internal control over financial reporting, additional control deficiencies, including additional material weaknesses and significant deficiencies, may have been identified. In addition, the JOBS Act provides that, so long as we qualify as an “emerging growth company,” we will be exempt from the provisions of Section 404(b) of Sarbanes-Oxley, which would require that our independent registered public accounting firm provide an attestation report on the effectiveness of our internal control over financial reporting. We may take advantage of this exemption so long as we qualify as an “emerging growth company.”
43
Table of Contents
We are an emerging growth company within the meaning of the Securities Act, and if we decide to take advantage of certain exemptions from various reporting and other requirements applicable to emerging growth companies, our common stock could be less attractive to investors.
For as long as we remain an “emerging growth company,” as defined in the JOBS Act, we will have the option to take advantage of certain exemptions from various reporting and other requirements that are applicable to other public companies that are not emerging growth companies, including not being required to comply with the auditor attestation requirements of Section 404 of Sarbanes-Oxley, reduced disclosure obligations regarding executive compensation in our periodic reports and proxy statements and exemptions from the requirements of holding a nonbinding advisory vote on executive compensation and stockholder approval of any golden parachute payments not previously approved. We may take advantage of these and other exemptions until we are no longer an emerging growth company. Further, the JOBS Act allows us to present only two years of audited financial statements and only two years of related management’s discussion and analysis of financial condition and results of operations and provide less than five years of selected financial data in this prospectus.
The JOBS Act provides that an emerging growth company can take advantage of the extended transition period provided in Section 7(a)(2)(B) of the Securities Act of 1933, as amended, or the Securities Act, for complying with new or revised accounting standards. However, we are choosing to “opt out” of such extended transition period, and as a result, we will comply with new or revised accounting standards on the relevant dates on which adoption of such standards is required for non-emerging growth companies. Our decision to opt out of the extended transition period is irrevocable.
We will remain an emerging growth company until the earliest of (i) the end of the fiscal year during which we have total annual gross revenues of $1.0 billion or more, (ii) the end of the fiscal year following the fifth anniversary of the completion of this offering, (iii) the date on which we have, during the previous three-year period, issued more than $1.0 billion in non-convertible debt and (iv) the end of the fiscal year in which the market value of our equity securities that are held by non-affiliates exceeds $700 million as of June 30 of that year.
We are subject to environmental liability risk associated with our bank branches and any real estate collateral we acquire upon foreclosure.
During the ordinary course of business, we may foreclose on and take title to properties securing certain loans that we have originated or acquired. We also have an extensive branch network, owning separate branch locations throughout the areas we serve. For any real property that we may possess, there is a risk that hazardous or toxic substances could be found on these properties. If hazardous or toxic substances are found, we may be liable for remediation costs, as well as for personal injury and property damage and costs of complying with applicable environmental regulatory requirements. Failure to comply with such requirements can result in penalties. Environmental laws may require us to incur substantial expenses and may materially reduce the affected property’s value or limit our ability to use or sell the affected property. In addition, future laws or more stringent interpretations or enforcement policies with respect to existing laws may increase our exposure to environmental liability. Environmental reviews of real property before initiating foreclosure actions may not be sufficient to detect all potential environmental hazards. The remediation costs and any other financial liabilities associated with an environmental hazard could have a material adverse effect on our business, financial condition or results of operations.
We may be alleged to have infringed upon intellectual property rights owned by others, or may be unable to protect our intellectual property.
Competitors or other third parties may allege that we, or consultants or other third parties retained or indemnified by us, infringe on their intellectual property rights. We also may face allegations that our employees have misappropriated intellectual property of their former employers or other third parties. Given the complex,
44
Table of Contents
rapidly changing and competitive technological and business environment in which we operate, and the potential risks and uncertainties of intellectual property-related litigation, an assertion of an infringement claim against us may cause us to spend significant amounts to defend the claim (even if we ultimately prevail); to pay significant money damages; to lose significant revenues; to be prohibited from using the relevant systems, processes, technologies or other intellectual property; to cease offering certain products or services or to incur significant license, royalty or technology development expenses. Moreover, it has become common in recent years for individuals and groups to purchase intellectual property assets for the sole purpose of making claims of infringement and attempting to extract settlements from companies like ours. Even in instances where we believe that claims and allegations of intellectual property infringement against us are without merit, defending against such claims is time consuming and expensive and could result in the diversion of time and attention of our management and employees. In addition, although in some cases a third party may have agreed to indemnify us for such costs, such indemnifying party may refuse, or be unable, to uphold its contractual obligations.
Moreover, we rely on a variety of measures to protect our intellectual property and proprietary information, including copyrights, trademarks, patents and controls on access and distribution. These measures may not prevent misappropriation or infringement of our intellectual property or proprietary information and a resulting loss of competitive advantage, and in any event, we may be required to litigate to protect our intellectual property and proprietary information from misappropriation or infringement by others, which is expensive, could cause a diversion of resources and may not be successful. Third parties may challenge, invalidate or circumvent our intellectual property, or our intellectual property may not be sufficient to provide us with competitive advantages. In addition, the usage of branding that could be confused with ours could create negative perceptions and risks to our brand and reputation. Our competitors or other third parties may independently design around or develop technology similar to ours or otherwise duplicate our services or products such that we could not assert our intellectual property rights against them. In addition, our contractual arrangements may not effectively prevent disclosure of our intellectual property or confidential and proprietary information or provide an adequate remedy in the event of an unauthorized disclosure.
We may be subject to claims and litigation pertaining to our fiduciary responsibilities.
Some of the services we provide, such as trust and investment services, require us to act as fiduciaries for our customers and others. From time to time, third parties make claims and take legal action against us pertaining to the performance of our fiduciary responsibilities. If these claims and legal actions are not resolved in a manner favorable to us, we may be exposed to significant financial liability or our reputation could be damaged. Either of these results may adversely impact demand for our products and services or otherwise have a material adverse effect on our business, financial condition or results of operations.
Changes in our accounting policies or in accounting standards could materially affect how we report our financial results and condition.
From time to time, the Financial Accounting Standards Board, or the FASB, and SEC change the financial accounting and reporting standards that govern the preparation of our financial statements. As a result of changes to financial accounting or reporting standards, whether promulgated or required by the FASB or other regulators, we could be required to change certain of the assumptions or estimates we have previously used in preparing our financial statements, which could negatively impact how we record and report our results of operations and financial condition generally. For additional information on the key areas for which assumptions and estimates are used in preparing our financial statements, see “Management’s Discussion and Analysis of Financial Condition and Results of Operations—Critical Accounting Policies and the Impact of Accounting Estimates.”
45
Table of Contents
Risks Related to the Regulatory Oversight of Our Business
The banking industry is highly regulated, and the regulatory framework, together with any future legislative or regulatory changes, may have a significant adverse effect on our operations.
The banking industry is extensively regulated and supervised under both federal and state laws and regulations that are intended primarily for the protection of depositors, customers, federal deposit insurance funds and the banking system as a whole, not for the protection of our stockholders and creditors. We are subject to regulation and supervision by the Board of Governors of the Federal Reserve System, or the Federal Reserve, and our bank is subject to regulation and supervision by the FDIC and the Division of Banking of the South Dakota Department of Labor and Regulation, or the South Dakota Division of Banking. The laws and regulations applicable to us govern a variety of matters, including permissible types, amounts and terms of loans and investments we may make, the maximum interest rate that may be charged, the amount of reserves our bank must hold against deposits it takes, the types of deposits our bank may accept and the rates it may pay on such deposits, maintenance of adequate capital and liquidity, changes in the control of us and our bank, restrictions on dividends and establishment of new offices by our bank. We must obtain approval from our regulators before engaging in certain activities, and there can be no assurance that any regulatory approvals we may require will be obtained, either in a timely manner or at all. Our regulators also have the ability to compel us to, or restrict us from, taking certain actions entirely, such as actions that our regulators deem to constitute an unsafe or unsound banking practice. Our failure to comply with any applicable laws or regulations, or regulatory policies and interpretations of such laws and regulations, could result in sanctions by regulatory agencies, civil money penalties or damage to our reputation, all of which could have a material adverse effect on our business, financial condition or results of operations.
Since the recent financial crisis, federal and state banking laws and regulations, as well as interpretations and implementations of these laws and regulations, have undergone substantial review and change. In particular, the Dodd-Frank Act drastically revised the laws and regulations under which we operate. Financial institutions generally have also been subjected to increased scrutiny from regulatory authorities. These changes and increased scrutiny may result in increased costs of doing business, decreased revenues and net income, may reduce our ability to effectively compete to attract and retain customers, or make it less attractive for us to continue providing certain products and services. Any future changes in federal and state law and regulations, as well as the interpretations and implementations of such laws and regulations, could affect us in substantial and unpredictable ways, including those listed above or other ways that could have a material adverse effect on our business, financial condition or results of operations.
We will be subject to heightened regulatory requirements if we exceed $10 billion in assets.
Based on our historic organic growth rates, we expect that our total assets and our bank’s total assets could exceed $10 billion over the next two to five years, or sooner if we engage in any acquisitions. The Dodd-Frank Act and its implementing regulations impose various additional requirements on bank holding companies with $10 billion or more in total assets, including compliance with portions of the Federal Reserve’s enhanced prudential oversight requirements and annual stress testing requirements. In addition, banks with $10 billion or more in total assets are primarily examined by the Consumer Financial Protection Bureau, or CFPB, with respect to various federal consumer financial protection laws and regulations. Currently, our bank is subject to regulations adopted by the CFPB, but the FDIC is primarily responsible for examining our bank’s compliance with consumer protection laws and those CFPB regulations. As a relatively new agency with evolving regulations and practices, there is uncertainty as to how the CFPB’s examination and regulatory authority might impact our business.
Compliance with these requirements may necessitate that we hire additional compliance or other personnel, design and implement additional internal controls, or incur other significant expenses, any of which could have a material adverse effect on our business, financial condition or results of operations. Compliance with the annual stress testing requirements, part of which must be publicly disclosed, may also be misinterpreted by the market generally or our customers and, as a result, may adversely affect our stock price or our ability to retain our
46
Table of Contents
customers or effectively compete for new business opportunities. To ensure compliance with these heightened requirements when effective, our regulators may require us to fully comply with these requirements or take actions to prepare for compliance even before our or our bank’s total assets equal or exceed $10 billion. As a result, we may incur compliance-related costs before we might otherwise be required, including if we do not continue to grow at the rate we expect or at all. Our regulators may also consider our preparation for compliance with these regulatory requirements when examining our operations generally or considering any request for regulatory approval we may make, even requests for approvals on unrelated matters.
We continue to be subject to regulation and supervision as a subsidiary of NAB.
As long as we continue to be controlled by NAB for purposes of the BHC Act, NAB’s regulatory status may impact our regulatory status and hence our ability to expand by acquisition or engage in new activities. For example, unsatisfactory examination ratings or enforcement actions regarding NAB could impact our ability or preclude us from obtaining any necessary approvals or informal clearance for the foregoing. Furthermore, to the extent that we are required to obtain regulatory approvals under the BHC Act to make acquisitions or expand our activities, as long as NAB controls us, NAB would also be required to obtain BHC Act approvals for such acquisitions or activities as well. In addition, because we will continue to be partially owned by NAB for a period of time following completion of this offering, we are also subject to indirect regulation and supervision by APRA through APRA’s broad powers to give legally enforceable directions to NAB in certain circumstances. See “Supervision and Regulation—Regulatory Impact of Control by NAB” for more information.
We are required to act as a source of financial and managerial strength for our bank in times of stress.
Under federal law and longstanding Federal Reserve policy, we are expected to act as a source of financial and managerial strength to our bank, and to commit resources to support our bank if necessary. We may be required to commit additional resources to our bank at times when we may not be in a financial position to provide such resources or when it may not be in our, or our stockholders’ or creditors’, best interests to do so. Providing such support is more likely during times of financial stress for us and our bank, which may make any capital we are required to raise to provide such support more expensive than it might otherwise be. In addition, any capital loans we make to our bank are subordinate in right of payment to depositors and to certain other indebtedness of our bank. In the event of our bankruptcy, any commitment by us to a federal banking regulator to maintain the capital of our bank will be assumed by the bankruptcy trustee and entitled to priority of payment.
We may be subject to more stringent capital requirements in the future.
We are subject to regulatory requirements specifying minimum amounts and types of capital that we must maintain. From time to time, the regulators change these regulatory capital adequacy guidelines. If we fail to meet these minimum capital guidelines and other regulatory requirements, we or our subsidiaries may be restricted in the types of activities we may conduct and we may be prohibited from taking certain capital actions, such as paying dividends and repurchasing or redeeming capital securities.
In particular, the capital requirements applicable to us under the recently adopted capital rules implementing the Basel III capital framework in the United States will begin to be phased-in starting in 2015. Once these new rules take effect, we will be required to satisfy additional, more stringent, capital adequacy standards than we have in the past. In addition, if we become subject to annual stress testing requirements, our stress test results may have the effect of requiring us to comply with even greater capital requirements. While we expect to meet the requirements of the new Basel III-based capital rules, we may fail to do so. In addition, these requirements could have a negative impact on our ability to lend, grow deposit balances, make acquisitions or make capital distributions in the form of dividends or share repurchases. Higher capital levels could also lower our return on equity.
47
Table of Contents
Litigation and regulatory actions, including possible enforcement actions, could subject us to significant fines, penalties, judgments or other requirements resulting in increased expenses or restrictions on our business activities.
Our business is subject to increased litigation and regulatory risks as a result of a number of factors, including the highly regulated nature of the financial services industry and the focus of state and federal prosecutors on banks and the financial services industry generally. This focus has only intensified since the recent financial crisis, with regulators and prosecutors focusing on a variety of financial institution practices and requirements, including foreclosure practices, compliance with applicable consumer protection laws (including, in foreign jurisdictions, products similar to our fixed-term tailored business loan products), classification of held for sale assets and compliance with anti-money laundering statutes, the Bank Secrecy Act and sanctions imposed by the Office of Foreign Assets Control of the U.S. Department of the Treasury.
In the normal course of business, from time to time, we are or have been named as a defendant in various legal actions, including arbitrations, class actions and other litigation, arising in connection with our business activities. Certain of the legal actions included claims for substantial compensatory or punitive damages or claims for indeterminate amounts of damages. In addition, while the arbitration provisions in certain of our customer agreements historically have limited our exposure to consumer class action litigation, there can be no assurance that we will be successful in enforcing our arbitration clause in the future. We may also, from time to time, be the subject of subpoenas, requests for information, reviews, investigations and proceedings (both formal and informal) by governmental agencies regarding our business. Any such legal or regulatory actions may subject us to substantial compensatory or punitive damages, significant fines, penalties, obligations to change our business practices or other requirements resulting in increased expenses, diminished income and damage to our reputation. Our involvement in any such matters, even if the matters are ultimately determined in our favor, could also cause significant harm to our reputation and divert management attention from the operation of our business. Further, any settlement, consent order or adverse judgment in connection with any formal or informal proceeding or investigation by government agencies may result in litigation, investigations or proceedings as other litigants and government agencies begin independent reviews of the same activities. As a result, the outcome of legal and regulatory actions could be material to our business, results of operations, financial condition and cash flows depending on, among other factors, the level of our earnings for that period, and could have a material adverse effect on our business, financial condition or results of operations.
Increases in FDIC insurance premiums may adversely affect our earnings.
Our bank’s deposits are insured by the FDIC up to legal limits and, accordingly, our bank is subject to FDIC deposit insurance assessments. We generally cannot control the amount of premiums our bank will be required to pay for FDIC insurance. Once our bank exceeds $10 billion in assets, the method for calculating its FDIC assessments will change and we expect our bank’s FDIC assessments will increase as a result. See “Supervision and Regulation—Deposit Insurance.” In addition, the FDIC recently increased the deposit insurance fund’s target reserve ratio to 2.0% of insured deposits following the Dodd-Frank Act’s elimination of the 1.5% cap on the insurance fund’s reserve ratio and has put in place a restoration plan to restore the deposit insurance fund to its 1.35% minimum reserve ratio mandated by the Dodd-Frank Act by September 30, 2020. Additional increases in assessment rates may be required in the future to achieve this targeted reserve ratio. In addition, higher levels of bank failures in recent years and increases in the statutory deposit insurance limits have increased resolution costs to the FDIC and put pressure on the deposit insurance fund. In response, the FDIC increased assessment rates on insured institutions, charged a special assessment to all insured institutions as of June 30, 2009, and required banks to prepay three years’ worth of premiums on December 30, 2009. If there are additional financial institution failures, our bank may be required to pay even higher FDIC insurance premiums than the recently increased levels, or the FDIC may charge additional special assessments. Future increases of FDIC insurance premiums or special assessments could have a material adverse effect on our business, financial condition or results of operations.
48
Table of Contents
We are subject to the CRA and fair lending laws, and our failure to comply with these laws could lead to material penalties.
The CRA, the Equal Credit Opportunity Act, the Fair Housing Act and other fair lending laws and regulations impose nondiscriminatory lending requirements on financial institutions. The U.S. Department of Justice and other federal agencies are responsible for enforcing these laws and regulations. A successful challenge to an institution’s performance under the CRA or fair lending laws and regulations could result in a wide variety of sanctions, including the required payment of damages and civil money penalties, injunctive relief, imposition of restrictions on mergers and acquisitions activity and restrictions on expansion. Private parties may also have the ability to challenge an institution’s performance under fair lending laws in private class action litigation. The costs of defending, and any adverse outcome from, any such challenge could damage our reputation or could have a material adverse effect on our business, financial condition or results of operations.
Regulations relating to privacy, information security and data protection could increase our costs, affect or limit how we collect and use personal information and adversely affect our business opportunities.
We are subject to various privacy, information security and data protection laws, including requirements concerning security breach notification, and we could be negatively impacted by these laws. For example, our business is subject to the Gramm-Leach-Bliley Act which, among other things: (i) imposes certain limitations on our ability to share nonpublic personal information about our customers with nonaffiliated third parties; (ii) requires that we provide certain disclosures to customers about our information collection, sharing and security practices and afford customers the right to “opt out” of any information sharing by us with nonaffiliated third parties (with certain exceptions) and (iii) requires we develop, implement and maintain a written comprehensive information security program containing safeguards appropriate based on our size and complexity, the nature and scope of our activities, and the sensitivity of customer information we process, as well as plans for responding to data security breaches. Various state and federal banking regulators and states have also enacted data security breach notification requirements with varying levels of individual, consumer, regulatory or law enforcement notification in certain circumstances in the event of a security breach. Moreover, legislators and regulators in the United States are increasingly adopting or revising privacy, information security and data protection laws that potentially could have a significant impact on our current and planned privacy, data protection and information security-related practices, our collection, use, sharing, retention and safeguarding of consumer or employee information, and some of our current or planned business activities. This could also increase our costs of compliance and business operations and could reduce income from certain business initiatives. This includes increased privacy-related enforcement activity at the federal level, by the Federal Trade Commission, as well as at the state level, such as with regard to mobile applications.
Compliance with current or future privacy, data protection and information security laws (including those regarding security breach notification) affecting customer or employee data to which we are subject could result in higher compliance and technology costs and could restrict our ability to provide certain products and services, which could have a material adverse effect on our business, financial conditions or results of operations. Our failure to comply with privacy, data protection and information security laws could result in potentially significant regulatory or governmental investigations or actions, litigation, fines, sanctions and damage to our reputation, which could have a material adverse effect on our business, financial condition or results of operations.
Our use of third party vendors and our other ongoing third party business relationships are subject to increasing regulatory requirements and attention.
We regularly use third party vendors as part of our business. We also have substantial ongoing business relationships with other third parties. These types of third party relationships are subject to increasingly demanding regulatory requirements and attention by our federal bank regulators. Recent regulation requires us to enhance our due diligence, ongoing monitoring and control over our third party vendors and other ongoing third party business relationships. In certain cases we may be required to renegotiate our agreements with these
49
Table of Contents
vendors to meet these enhanced requirements, which could increase our costs. We expect that our regulators will hold us responsible for deficiencies in our oversight and control of our third party relationships and in the performance of the parties with which we have these relationships. As a result, if our regulators conclude that we have not exercised adequate oversight and control over our third party vendors or other ongoing third party business relationships or that such third parties have not performed appropriately, we could be subject to enforcement actions, including civil money penalties or other administrative or judicial penalties or fines as well as requirements for customer remediation, any of which could have a material adverse effect our business, financial condition or results of operations.
Risks Related to Our FDIC-Assisted Acquisition of TierOne Bank
Our bank has purchased certain assets and assumed certain liabilities of TierOne Bank in an FDIC-assisted transaction.
On June 4, 2010, our bank acquired certain assets and assumed certain liabilities of TierOne Bank from the FDIC in an assisted transaction, which could present additional risks to our business. Although this transaction provides for FDIC assistance to our bank to mitigate certain risks, such as sharing exposure to loan losses and providing indemnification against certain liabilities of the former TierOne Bank, we are still subject to some of the same risks we face in acquiring another bank in a negotiated transaction, including risks associated with maintaining customer relationships and failure to realize the anticipated acquisition benefits in the amounts and within the timeframes we expect.
Our decisions regarding the fair value of assets acquired and our estimated loss-sharing indemnification asset may be inaccurate.
We make various assumptions and judgments about the collectability of acquired loan portfolios, including the creditworthiness of borrowers and the value of the real estate and other assets serving as collateral for the repayment of secured loans. In the FDIC-assisted transaction, we recorded a fair value adjustment and a related loss-sharing indemnification asset, representing 80% of expected credit losses. We have subsequently analyzed the portfolio on a regular basis, taking into account historical loss experience, volume and classification of loans, volume and trends in delinquencies and nonaccruals, local economic conditions and other pertinent information. As a result of these analyses, we have recorded allowance for loan losses, partially offset by additional indemnification assets, to address subsequent impairment in certain loans and pools of loans. While we believe that our current levels of fair value adjustments and allowance for loan losses are adequate to absorb future losses that may occur in the acquired loan portfolio, if our assumptions are incorrect, our actual losses could be higher than estimated and increased loss reserves may be needed to respond to different economic conditions or adverse developments in the acquired loan portfolio. Any increase in future loan losses could have a material adverse effect on our business, financial condition or results of operations.
Our ability to obtain reimbursement under the loss-sharing agreements on covered assets depends on our compliance with the terms of the loss-sharing agreements.
The loss-sharing agreements contain specific terms and conditions regarding the management of the covered assets that our bank must follow to receive reimbursement on losses from the FDIC. As of June 30, 2014, $259.7 million of loans and $14.0 million of OREO was eligible for reimbursement to our bank. Under the loss-sharing agreements, our bank must, among other things:
| • | manage and administer the covered assets in a manner consistent with its usual and prudent business and banking practices and, with respect to single family shared-loss loans, the procedures (including collection procedures) customarily employed by our bank in servicing and administering mortgage loans for its own account and the servicing procedures established by FNMA or the Federal Home Loan Mortgage Corporation, as in effect from time to time, and in accordance with accepted mortgage servicing practices of prudent lending institutions; |
| • | exercise its best judgment in managing, administering and collecting amounts on covered assets; |
50
Table of Contents
| • | use commercially reasonable efforts to maximize recoveries with respect to losses on single family shared-loss assets and best efforts to maximize collections with respect to commercial shared-loss assets; |
| • | retain sufficient staff to perform the duties under the loss-sharing agreements; |
| • | adopt and implement accounting, reporting, record-keeping and similar systems with respect to the commercial shared-loss assets; |
| • | comply with the terms of the modification guidelines approved by the FDIC or another federal agency for any single-family shared-loss loan; |
| • | provide notice with respect to proposed transactions pursuant to which a third party or affiliate will manage, administer or collect any commercial shared-loss assets; |
| • | file monthly and quarterly certificates with the FDIC specifying the amount of losses, charge-offs and recoveries; |
| • | undergo periodic reviews by the FDIC and their agents to assess our bank’s operations and compliance with these requirements; and |
| • | maintain books and records sufficient to ensure and document compliance with the terms of the loss- sharing agreements. |
The terms of the loss-sharing agreements are extensive and failure to comply with any of the guidelines could result in a specific asset or group of assets permanently losing their loss-sharing coverage. No assurances can be given that we will manage the covered assets in such a way as to always maintain loss-sharing coverage on all such assets and fully recover the value of our loss-sharing asset, and any loss-sharing coverage could have a material adverse effect on our business, financial condition or results of operations.
Risks Related to Our Controlling Stockholder
NAB will continue to have significant control over us following the completion of this offering, and its interests may conflict with ours or yours in the future.
Immediately following this offering, NAB will indirectly beneficially own approximately % of our common stock (or % if the underwriters’ option to purchase additional shares of common stock is exercised in full). As a result, NAB will have significant control over us. Going forward, NAB’s degree of control will depend on, among other things, its level of ownership of our common stock and its ability to exercise certain rights under the terms of the Stockholder Agreement that we will enter into with NAB in connection with this offering.
Under the Stockholder Agreement, NAB will be entitled to designate nominees for election to our board of directors (the number of which will depend on its level of ownership) and make certain appointments to committees of our board. For so long as NAB controls more than 50% of our outstanding common stock, it will be able to determine the outcome of all matters requiring approval of stockholders, cause or prevent a change of control of our company and preclude all unsolicited acquisitions of our company, including transactions that may be in the best interests of our stockholders. Further, for the period following the completion of this offering until the one-year anniversary of the date when NAB ceases to directly or indirectly beneficially own 50% of our outstanding common stock, NAB will have the right to designate a majority of the nominees for election to our board of directors. In addition, for so long as NAB continues to control us for purposes of the BHC Act, we will still be required to obtain NAB’s prior written approval before undertaking (or permitting or authorizing any of our subsidiaries to undertake) various significant corporate actions, including engaging in certain business activities, entrance into mergers or consolidations, entrance into amendments to or terminations of material agreements, issuance of capital stock (subject to certain exceptions), incurrence or guarantee of indebtedness in excess of certain thresholds (subject to certain exceptions), termination of our or our bank’s Chief Executive
51
Table of Contents
Officer or Chief Financial Officer (other than for cause) and certain other significant transactions. NAB’s concentration of voting power and veto rights could deprive stockholders of an opportunity to receive a premium for their shares of common stock as part of a sale of our company, and could affect the market price of our common stock. In addition, NAB’s interests may differ from our interests or those of our other stockholders. NAB will have access to our internal information in the same manner and to the same extent as we provided immediately prior to this offering and may affect the management of our business, or exercise its voting power, consent rights or information access in a manner unfavorable to our other stockholders. See “Our Relationship with NAB and Certain Other Related Party Transactions—Relationship with NAB—Stockholder Agreement.” We will also continue to be subject to the regulatory supervision applicable to NAB and companies under its control. See “—Risks Related to the Regulatory Oversight of Our Business.” Accordingly, NAB’s control over us and the consequences of such control could have a material adverse effect on our business and business prospects and negatively impact the trading price of our common stock.
We may fail to replicate or replace functions, systems and infrastructure provided by NAB before this offering, and NAB may fail to perform the services provided for in the Transitional Services Agreement.
Although, historically, we have operated largely as a standalone company without significant services being received from NAB, NAB has provided certain financial, personnel and administrative support to us. Following this offering, NAB will have no obligation to provide any support to us other than the limited services that will be provided pursuant to a Transitional Services Agreement described in “Our Relationship with NAB and Certain Other Related Party Transactions—Relationship with NAB—Transitional Services Agreement.” Under this agreement, NAB has agreed to continue to provide us with certain services currently provided to us by NAB for the applicable transitional period, including continuing to act as a counterparty to us on interest rate swaps and providing fair value calculations related to specified loans and interest rate swaps consistent with past practice, access to certain reporting systems and applications, certain risk, credit rating and tax oversight currently provided to us by NAB and certain insurance coverage under NAB’s group-wide insurance policies, for a period of time following the offering. NAB has also agreed to continue to provide us with access to NAB systems required for us to continue reporting to NAB financial and other information consistent with our status immediately following this offering as a consolidated NAB subsidiary. We currently expect to incur aggregate annual costs of approximately $1.8 million for all services provided by NAB under the Transitional Services Agreement, though our actual costs may vary. We do not intend to enter into transitional arrangements with NAB concerning other services necessary in connection with our transition to operation as a public company which have not historically been provided to us by NAB, such as external financial reporting, external communications or investor relations services.
We are currently expanding our infrastructure to replicate or replace the services provided by NAB under the Transitional Services Agreement that we will continue to need in the operation of our business following the termination of that agreement. Although we have negotiated the terms of the Transitional Services Agreement on an arms’-length basis, we cannot assure you that we could obtain these services at the same or better levels or at the same or lower costs from third party providers. As a result, when NAB ceases providing these services to us, either as a result of the termination of the Transitional Services Agreement or a failure by NAB to perform its obligations under the Transitional Services Agreement, our costs of procuring these services or comparable replacement services may increase, may result in service interruptions and may divert management attention from other aspects of our operations. In particular, our cost of procuring insurance coverage for our business could increase following the termination of the Transitional Services Agreement as we lose the ability to leverage NAB’s relationships with insurance providers. While we do not expect any increase in cost associated with replicating and replacing services provided to us under the Transitional Services Agreement to be material, there is a risk that these costs could have a material adverse effect on our business, financial condition or results of operations.
52
Table of Contents
As long as NAB owns a majority of our common stock, we will rely on certain of the exemptions from the corporate governance requirements of the NYSE available for “controlled companies.”
Upon the completion of this offering, we will be a “controlled company” within the meaning of the corporate governance listing standards of the NYSE because NAB will continue to own more than 50% of our outstanding common stock. A controlled company may elect not to comply with certain corporate governance requirements of the NYSE. Consistent with this, the Stockholder Agreement will provide that, so long as we are a controlled company, we will not be required to comply with the requirements to have a majority of independent directors or to have the corporate governance and nominating committee and compensation committee of our board of directors consist entirely of independent directors. Upon completion of this offering, as many as six of our nine directors, including at least one member of each of the corporate governance and nominating committee and compensation committee of our board of directors may not qualify as “independent directors” under the applicable rules of the NYSE. As a result, you will not have certain of the protections afforded to stockholders of companies that are subject to all of the corporate governance requirements of the NYSE.
NAB may not complete the divestiture of our common stock that it owns as planned or at all.
On August 29, 2014 in Australia, NAB announced that it intends to divest itself of our bank over time, subject to market conditions. NAB’s announced divestiture of our bank is consistent with its strategy of focusing on its core Australian and New Zealand franchises. This offering of shares of our common stock by the NAB selling stockholder, representing % of its ownership interest in our outstanding capital stock, is the first stage of NAB’s planned divestment. After the completion of this offering, NAB will beneficially own % of our outstanding common stock (or % if the underwriters’ option to purchase additional shares of common stock from the NAB selling stockholder is exercised in full). The timing of any subsequent sales by NAB of shares of our common stock is unknown at this time and will be subject to market conditions and the lock-up agreement entered into by the NAB selling stockholder and the underwriters in connection with this offering.
Although NAB has indicated that it intends to divest 100% of its ownership in our company over time, subject to market conditions and other considerations, it may not be able to do so. Any delay by NAB in completing, or uncertainty about its ability or intention to complete, the divestiture of our common stock that it owns on the planned timetable, on the contemplated terms (including at the contemplated capital and liquidity levels), or at all, could have a material adverse effect on our company and the market price for our common stock.
Conflicts of interest and other disputes may arise between NAB and us that may be resolved in a manner unfavorable to us and our other stockholders.
Conflicts of interest and other disputes may arise between NAB and us in connection with our past and ongoing relationships, and any future relationships we may establish in a number of areas, including, but not limited to, the following:
| • | Contractual Arrangements. We intend to enter into several agreements with NAB prior to the completion of this offering that will provide a framework for our ongoing relationship with NAB, including a Stockholder Agreement, Transitional Services Agreement and Registration Rights Agreement. The Stockholder Agreement will provide NAB with certain governance rights, including board and committee membership rights, and approval rights over our business, as well as obligate us to comply with certain covenants including certain information rights, access privileges and confidentiality matters. For example, we will be required to obtain the written consent of NAB prior to engaging in certain acquisitions and similar transactions, acquiring or disposing of assets, liabilities or securities with a value in excess of $5 million or entering into, terminating or modifying a material contract, among other matters relating to our business and structure. The Transitional Services Agreement will govern the continued provision of certain services to us by NAB for specified transition periods. The Registration Rights Agreement will govern our obligation to register shares of |
53
Table of Contents
| our common stock beneficially owned by NAB under certain circumstances following this offering. Disagreements regarding the rights and obligations of NAB or us under each of these agreements could create conflicts of interest for certain of our directors and officers, as well as actual disputes that may be resolved in a manner unfavorable to us and our other stockholders. Interruptions to or problems with services provided under the Transitional Services Agreement could result in conflicts between us and NAB that increase our costs both for the processing of business and the potential remediation of disputes. Although we believe each of these agreements contains commercially reasonable terms, the terms of these agreements may later prove not to be in the best interests of our future stockholders or may contain terms more or less favorable than we could obtain from third parties. In addition, certain of our officers negotiating these agreements may appear to have conflicts of interest as a result of their current employment with NAB or Bank of New Zealand. However, we have entered into employment agreements with these individuals, and their employment with NAB or Bank of New Zealand, as applicable, will terminate and transfer to us when the agreements become effective upon the completion of this offering. For a detailed description of these agreements, see “Our Relationship with NAB and Certain Other Related Party Transactions—Relationship with NAB.” |
| • | Competing Business Activities. In the ordinary course of its business, NAB may also engage in activities where NAB’s interests conflict or are competitive with our or our other stockholders’ interests. These activities may include NAB’s interests in any transactions it conducts with us (including any interest rate swaps we may enter into with NAB to manage the interest rate risk associated with certain of our long-term fixed-rate loans), any exercise by NAB of its rights to register and sell additional stock under the Registration Rights Agreement, any sale by NAB of a controlling interest in us to a third party or, subject to the terms of the Stockholder Agreement, any investments by NAB in, or business activities conducted by NAB for, one or more of our competitors. Any of these disputes or conflicts of interests that arise may be resolved in a manner adverse to us or to our stockholders other than NAB and its affiliates. Subject to the non-competition restrictions contained in the Stockholder Agreement, NAB also may pursue acquisition and other opportunities that may be part of or complementary to our business, and, as a result, those acquisition opportunities may not be available to us. As a result, our future competitive position and growth potential could be adversely affected. |
| • | Cross Officerships, Directorships and Stock Ownership. Those members of our board of directors nominated by NAB may have, or appear to have, conflicts of interest with respect to certain of our operations as a result of any roles they may have as officers or employees of NAB or any of its affiliates or any investments or interests they may own in companies that compete with our business. The ownership interests of our directors or executive officers in the common stock of NAB could create, or appear to create, conflicts of interest when directors and executive officers are faced with decisions that could have different implications for the two companies. For example, these decisions could relate to (i) the nature, quality and cost of services rendered to us by NAB, (ii) disagreement over the desirability of a potential business or acquisition opportunity or business plans, (iii) employee retention or recruiting or (iv) our dividend policy. |
| • | Business Opportunities. Our Amended and Restated Certificate of Incorporation provides that, to the fullest extent permitted by law, none of NAB or any of its affiliates will have any duty to refrain from (i) engaging in a corporate opportunity in the same or similar lines of business in which we or our affiliates now engage or propose to engage or (ii) otherwise competing with us or our affiliates. As a result of these charter provisions, our future competitive position and growth potential could be adversely affected. See “Description of Capital Stock.” |
These and other conflicts of interest and potential disputes could have a material adverse effect on our business, financial condition, results of operations or on the market price of our common stock.
54
Table of Contents
Risks Related to Our Common Stock
No prior public market exists for our common stock, and one may not develop.
Before this offering, there has not been a public trading market for our common stock, and an active trading market may not develop or be sustained after this offering. If an active trading market does not develop, you may have difficulty selling your shares of common stock at an attractive price—or at all. The initial public offering price for our common stock sold in this offering will be determined by negotiations among the selling stockholder and the underwriters. This price may not be indicative of the price at which our common stock will trade after this offering. The market price of our common stock may decline below the initial offering price, and you may not be able to sell your common stock at or above the price you paid in this offering—or at all.
Our stock price may be volatile, and you could lose part or all of your investment as a result.
Stock price volatility may make it more difficult for you to resell your common stock when you want and at prices you find attractive. Our stock price may fluctuate significantly in response to a variety of factors including, among other things:
| • | actual or anticipated variations in our quarterly results of operations; |
| • | recommendations or research reports about us or the financial services industry in general published by securities analysts; |
| • | the failure of securities analysts to cover, or continue to cover, us after this offering; |
| • | operating and stock price performance of other companies that investors deem comparable to us; |
| • | news reports relating to trends, concerns and other issues in the financial services industry; |
| • | perceptions in the marketplace regarding us, our competitors or other financial institutions; |
| • | future sales of our common stock; |
| • | departure of our management team or other key personnel; |
| • | new technology used, or services offered, by competitors; |
| • | significant acquisitions or business combinations, strategic partnerships, joint ventures or capital commitments by or involving us or our competitors; |
| • | failure to integrate acquisitions or realize anticipated benefits from acquisitions; |
| • | changes or proposed changes in laws or regulations, or differing interpretations thereof affecting our business, or enforcement of these laws and regulations; |
| • | litigation and governmental investigations; and |
| • | geopolitical conditions such as acts or threats of terrorism or military conflicts. |
If any of the foregoing occurs, it could cause our stock price to fall and may expose us to litigation that, even if our defense is successful, could distract our management and be costly to defend. General market fluctuations, industry factors and general economic and political conditions and events—such as economic slowdowns or recessions, interest rate changes or credit loss trends—could also cause our stock price to decrease regardless of operating results.
We may not pay dividends on our common stock in the future.
Holders of our common stock are entitled to receive only such dividends as our board of directors may declare out of funds legally available for such payments. Our board of directors may, in its sole discretion, change the amount or frequency of dividends or discontinue the payment of dividends entirely. In addition, we are a bank
55
Table of Contents
holding company, and our ability to declare and pay dividends is dependent on certain federal regulatory considerations, including the guidelines of the Federal Reserve regarding capital adequacy and dividends. See “Dividend Policy and Dividends” and “Supervision and Regulation—Dividends; Stress Testing.” As a consequence of these various limitations and restrictions, we may not be able to make, or may have to reduce or eliminate, the payment of dividends on our common stock. Any change in the level of our dividends or the suspension of the payment thereof could have a material adverse effect on the market price of our common stock.
Future sales of our common stock in the public market, including expected sales by NAB, could lower our stock price, and any additional capital raised by us through the sale of equity or convertible securities may dilute your ownership in us.
The market price of our common stock could decline as a result of sales of a large number of shares of our common stock available for sale after completion of this offering or from the perception that such sales could occur. These sales, or the possibility that these sales may occur, also may make it more difficult for us to raise additional capital by selling equity securities in the future, at a time and price that we deem appropriate. Upon completion of this offering we will have a total of outstanding shares of common stock. Of the outstanding shares, the shares sold in this offering (or shares if the underwriters exercise their option to purchase additional shares in full) will be freely tradable without restriction or further registration under the Securities Act, except that any shares held by our affiliates, as that term is defined under Rule 144 of the Securities Act, may be sold only in compliance with the limitations described in “Shares Eligible for Future Sale.”
The remaining shares outstanding (or shares if the underwriters exercise their option to purchase additional shares in full) beneficially owned by NAB after this offering, will be subject to certain restrictions on resale. We have agreed with the underwriters not to offer, pledge, sell, or otherwise dispose of or hedge any shares of our common stock, subject to certain exceptions, for the 180-day period following the date of this prospectus, without the prior consent of Deutsche Bank Securities Inc. and Merrill Lynch, Pierce, Fenner & Smith Incorporated. The selling stockholder and our officers and directors have entered into similar lock-up agreements with the underwriters. The underwriters may, at any time, release us, the selling stockholder or any of our officers or directors from this lock-up agreement and allow us to sell shares of our common stock within this 180-day period. In addition, any shares purchased through the directed share program described in this prospectus are subject to the same 180-day lockup period. See “Underwriting—No Sales of Similar Securities.”
Upon the expiration of the lock-up agreements described above, all of such shares will be eligible for resale in a public market, subject, in the case of shares held by our affiliates, to volume, manner of sale and other limitations under Rule 144. We expect that NAB will be considered an affiliate 180 days after this offering based on its expected share ownership, as well as its rights under the Stockholder Agreement we intend to enter into with NAB prior to the completion of this offering.
We intend to enter into a registration rights agreement with NAB prior to the completion of this offering that will grant NAB demand and “piggyback” registration rights with respect to the shares of our common stock that NAB will be holding following the completion of this offering. NAB may exercise its demand and piggyback registration rights at any time, subject to certain limitations, and any shares of our common stock registered pursuant to NAB’s registration rights will be freely tradable in the public market, other than any shares acquired by any of our affiliates. NAB has announced that this offering is the first stage of its planned divestment of its U.S. retail banking operations and that, subject to market conditions and other considerations, it intends to divest 100% of its ownership in our company over time.
As restrictions on resale end, the market price of our shares of common stock could drop significantly. The timing and manner of the sale of NAB’s remaining ownership of our common stock remains uncertain, and we have no control over the manner in which NAB may seek to divest such remaining shares. NAB could elect to sell its common stock in a number of different ways, including in a number of tranches via future registrations or, alternatively, by the sale of all or a significant tranche of such remaining shares to a single third party purchaser.
56
Table of Contents
Any such sale would impact the price of our shares of common stock and there can be no guarantee that the price at which NAB is willing to sell its remaining shares will be at a level that our board of directors would be prepared to recommend to holders of our common stock or that you determine adequately values our shares of common stock.
We also intend to file a registration statement to register shares of our common stock for issuance pursuant to awards granted under our omnibus incentive plan that we plan to adopt in connection with this offering. We may increase the number of shares registered for this purpose from time to time. Once we register and issue these shares, their holders will be able to sell them in the public market.
We cannot predict the size of future issuances or sales of our common stock or the effect, if any, that future issuances or sales of shares of our common stock may have on the market price of our common stock. Sales or distributions of substantial amounts of our common stock (including shares issued in connection with an acquisition), or the perception that such sales could occur, may cause the market price of our common stock to decline. See “Shares Eligible for Future Sale.”
NAB may sell a controlling interest in us to a third party in a private transaction, which may not lead to your realization of any change-of-control premium on shares of our common stock and may subject us to the control of a presently unknown third party.
Following the completion of this offering, NAB will continue to beneficially own a significant equity interest of our company. NAB will have the ability, should it choose to do so, to sell some or all of its shares of our common stock in a privately negotiated transaction, which, if sufficient in size, could result in a change of control of our company.
The ability of NAB to privately sell its shares of our common stock, with no requirement for a concurrent offer to be made to acquire all of the shares of our outstanding common stock that will be publicly traded hereafter, could prevent you from realizing any change-of-control premium on your shares of our common stock that may accrue to NAB on its private sale of our common stock. In addition, if NAB privately sells its significant equity interest in our company, we may become subject to the control of a presently unknown third party. Such third party may have interests that conflict with those of other stockholders. In addition, if a third party acquires a controlling interest in us, NAB may terminate the Transitional Services Agreement and other transitional arrangements, and our other commercial agreements and relationships could be impacted, all of which may adversely affect our ability to run our business as described in this prospectus and could have a material adverse effect on our business, financial condition or results of operations.
Certain banking laws and certain provisions of our certificate of incorporation may have an anti-takeover effect.
Provisions of federal banking laws, including regulatory approval requirements, could make it difficult for a third party to acquire us, even if doing so would be perceived to be beneficial to our stockholders. Acquisition of 10% or more of any class of voting stock of a bank holding company or depository institution, including shares of our common stock following completion of this offering, generally creates a rebuttable presumption that the acquirer “controls” the bank holding company or depository institution. Also, a bank holding company must obtain the prior approval of the Federal Reserve before, among other things, acquiring direct or indirect ownership or control of more than 5% of the voting shares of any bank, including our bank.
There also are provisions in our amended and restated certificate of incorporation and amended and restated bylaws to be effective prior to the completion of this offering, such as limitations on the ability to call a special meeting of our stockholders, and the classification of our board of directors into three separate classes each serving for three-year terms, that may be used to delay or block a takeover attempt. In addition, our board of directors will be authorized under our amended and restated certificate of incorporation to issue shares of our
57
Table of Contents
preferred stock, and determine the rights, terms conditions and privileges of such preferred stock, without stockholder approval. These provisions may effectively inhibit a non-negotiated merger or other business combination, which, in turn, could have a material adverse effect on the market price of our common stock.
Our amended and restated certificate of incorporation will designate the Court of Chancery of the State of Delaware as the sole and exclusive forum for certain types of actions and proceedings that may be initiated by our stockholders, which could limit our stockholders’ ability to obtain a favorable judicial forum for disputes with us or our directors, officers, employees or agents.
Our amended and restated certificate of incorporation to be effective prior to the completion of this offering will provide that, unless we consent in writing to an alternative forum, the Court of Chancery of the State of Delaware will be the sole and exclusive forum for (i) any derivative action or proceeding brought on our behalf, (ii) any action asserting a claim of breach of a fiduciary duty owed by any of our directors, officers, employees or agents to us or our stockholders, (iii) any action asserting a claim arising pursuant to any provision of the Delaware General Corporation Law, or DGCL, our amended and restated certificate of incorporation or our amended and restated bylaws or (iv) any action asserting a claim that is governed by the internal affairs doctrine, in each case subject to the Court of Chancery having personal jurisdiction over the indispensable parties named as defendants therein and the claim not being one which is vested in the exclusive jurisdiction of a court or forum other than the Court of Chancery or for which the Court of Chancery does not have subject matter jurisdiction. Any person purchasing or otherwise acquiring any interest in any shares of our capital stock shall be deemed to have notice of and to have consented to this provision of our amended and restated certificate of incorporation. This choice of forum provision may limit our stockholders’ ability to bring a claim in a judicial forum that it finds favorable for disputes with us or our directors, officers, employees or agents, which may discourage such lawsuits against us and our directors, officers, employees and agents even though an action, if successful, might benefit our stockholders. Stockholders who do bring a claim in the Court of Chancery could face additional litigation costs in pursuing any such claim, particularly if they do not reside in or near Delaware. The Court of Chancery may also reach different judgments or results than would other courts, including courts where a stockholder considering an action may be located or would otherwise choose to bring the action, and such judgments or results may be more favorable to us than to our stockholders. Alternatively, if a court were to find this provision of our amended and restated certificate of incorporation inapplicable to, or unenforceable in respect of, one or more of the specified types of actions or proceedings, we may incur additional costs associated with resolving such matters in other jurisdictions, which could have a material adverse effect on our business, financial condition or results of operations.
58
Table of Contents
CAUTIONARY NOTE REGARDING FORWARD-LOOKING STATEMENTS
This prospectus contains forward-looking statements within the meaning of Section 27A of the Securities Act and Section 21E of the Exchange Act. These forward-looking statements reflect our current views with respect to, among other things, future events and our financial performance. These statements are often, but not always, made through the use of words or phrases such as “may,” “might,” “should,” “could,” “predict,” “potential,” “believe,” “expect,” “continue,” “will,” “anticipate,” “seek,” “estimate,” “intend,” “plan,” “projection,” “would,” “annualized” and “outlook,” or the negative version of those words or other comparable words or phrases of a future or forward-looking nature. These forward-looking statements are not historical facts, and are based on current expectations, estimates and projections about our industry, management’s beliefs and certain assumptions made by management, many of which, by their nature, are inherently uncertain and beyond our control. Accordingly, we caution you that any such forward-looking statements are not guarantees of future performance and are subject to risks, assumptions, estimates and uncertainties that are difficult to predict. Although we believe that the expectations reflected in these forward-looking statements are reasonable as of the date made, actual results may prove to be materially different from the results expressed or implied by the forward-looking statements.
A number of important factors could cause our actual results to differ materially from those indicated in these forward-looking statements, including those factors identified in “Risk Factors” or “Management’s Discussion and Analysis of Financial Condition and Results of Operations” or the following:
| • | current and future economic and market conditions in the United States generally or in our states in particular, including the rate of growth and employment levels; |
| • | changes in market interest rates; |
| • | the geographic concentration of our operations, and our concentration on originating business and agribusiness loans; |
| • | the relative strength or weakness of the agricultural and commercial credit sectors and of the real estate markets in the markets in which our borrowers are located; |
| • | declines in the market prices for agricultural products for any reason; |
| • | our ability to effectively execute our strategic plan and manage our growth; |
| • | our ability to successfully manage our credit risk and the sufficiency of our allowance for loan loss; |
| • | our ability to attract and retain skilled employees or changes in our management personnel; |
| • | our ability to effectively compete with other financial services companies and the effects of competition in the financial services industry on our business; |
| • | changes in the demand for our products and services; |
| • | the effectiveness of our risk management and internal disclosure controls and procedures; |
| • | fluctuations in the values of our assets and liabilities and off-balance sheet exposures; |
| • | our ability to attract and retain customer deposits; |
| • | our access to sources of liquidity and capital to address our liquidity needs; |
| • | possible changes in trade, monetary and fiscal policies of, and other activities undertaken by, governments, agencies, central banks and similar organizations; |
| • | our ability to identify and address cyber-security risks; |
| • | any failure or interruption of our information and communications systems; |
| • | our ability to keep pace with technological changes; |
59
Table of Contents
| • | our ability to successfully develop and commercialize new or enhanced products and services; |
| • | possible impairment of our goodwill and other intangible assets, or any adjustment of the valuation of our deferred tax assets; |
| • | the effects of problems encountered by other financial institutions; |
| • | the effects of geopolitical instability, including war, terrorist attacks, and man-made and natural disasters; |
| • | the effects of the failure of any component of our business infrastructure provided by a third party; |
| • | the impact of, and changes in applicable laws, regulations and accounting standards and policies; |
| • | market perceptions associated with our separation from NAB and other aspects of our business; |
| • | our likelihood of success in, and the impact of, litigation or regulatory actions; |
| • | our inability to receive dividends from our bank and to service debt, pay dividends to our common stockholders and satisfy obligations as they become due; |
| • | the effect of NAB’s control over us following completion of this offering; |
| • | the incremental costs of operating as a standalone public company; |
| • | our ability to retain service providers to perform oversight or control functions or services that have otherwise been performed in the past by NAB; and |
| • | damage to our reputation from any of the factors described above, in “Risk Factors” or in “Management’s Discussion and Analysis of Financial Condition and Results of Operations.” |
The foregoing factors should not be considered an exhaustive list and should be read together with the other cautionary statements included in this prospectus. If one or more events related to this or other risks or uncertainties materialize, or if our underlying assumptions prove to be incorrect, actual results may differ materially from what we anticipate. Accordingly, you should not place undue reliance on any such forward-looking statements. Any forward-looking statement speaks only as of the date on which it is made, and we do not undertake any obligation to update or review any forward-looking statement, whether as a result of new information, future developments or otherwise.
60
Table of Contents
We will not receive any of the proceeds from the sale of the shares of common stock being sold in this offering. All of the shares in this offering are being sold by the NAB selling stockholder. See “Principal and Selling Stockholder.” All proceeds from the sale of these shares, net of underwriters’ discounts and offering expenses, will be received by the NAB selling stockholder, a subsidiary of NAB.
61
Table of Contents
Dividend Policy
Following this offering, we intend to pay quarterly cash dividends on our common stock at an initial amount of approximately $ per share.
Although we expect to pay dividends according to our dividend policy, we may elect not to pay dividends. Any declarations of dividends will be at the discretion of our board of directors. In determining the amount of any future dividends, our board of directors will take into account: (i) our financial results; (ii) our available cash, as well as anticipated cash requirements (including debt servicing); (iii) our capital requirements and the capital requirements of our subsidiaries (including our bank); (iv) contractual, legal, tax and regulatory restrictions on, and implications of, the payment of dividends by us to our stockholders or by our bank to us; (v) general economic and business conditions; and (vi) any other factors that our board of directors may deem relevant. Therefore, there can be no assurance that we will pay any dividends to holders of our stock, or as to the amount of any such dividends. See “Risk Factors—Risks Related to Our Common Stock—We may not pay dividends on our common stock in the future” and “Material U.S. Federal Tax Considerations for Non-U.S. Holders of Our Common Stock—Dividends.”
Our ability to declare and pay dividends on our stock is also subject to numerous limitations applicable to bank holding companies under federal and state banking laws, regulations and policies. Federal bank regulators are authorized to determine under certain circumstances relating to the financial condition of a bank holding company or a bank that the payment of dividends would be an unsafe or unsound practice and to prohibit payment thereof. In addition, under the DGCL, we may only pay dividends from legally available surplus or, if there is no such surplus, out of our net profits for the fiscal year in which the dividend is declared and the preceding fiscal year. Surplus is generally defined as the excess of the fair value of our total assets over the sum of the fair value of our total liabilities plus the aggregate par value of our issued and outstanding capital stock.
Because we are a holding company and do not engage directly in other business activities of a material nature, our ability to pay dividends on our stock depends primarily upon our receipt of dividends from our bank, the payment of which is subject to numerous limitations under federal and state banking laws, regulations and policies. In general, dividends by our bank may only be declared from its net profits and may be declared no more than once per calendar quarter. The approval of the South Dakota Director of Banking is required if our bank seeks to pay aggregate dividends during any calendar year that would exceed the sum of its net profits from the year to date and retained net profits from the preceding two years, minus any required transfers to surplus. Moreover, under the Federal Deposit Insurance Act, or FDIA, an insured depository institution may not pay any dividends if the institution is undercapitalized or if the payment of the dividend would cause the institution to become undercapitalized. In addition, the federal bank regulatory agencies have issued policy statements providing that FDIC-insured depository institutions and their holding companies should generally pay dividends only out of their current operating earnings. See “Supervision and Regulation—Dividends; Stress Testing” for more information on federal and state banking laws, regulations and policies limiting our and our bank’s ability to declare and pay dividends. The current and future dividend policy of our bank is also subject to the discretion of its board of directors. Our bank is not obligated to pay dividends to us. For additional information, see “Risk Factors—Risks Related to Our Business—We rely on dividends and other payments from our bank for substantially all of our revenue” and “Risk Factors—Risks Related to Our Common Stock—We may not pay dividends on our common stock in the future.”
None of the indentures governing our outstanding junior subordinated debentures contain covenants limiting our ability or the ability of our subsidiaries to pay dividends, absent a default under the terms of the indenture, or under our guarantee of the trust preferred securities issued by our affiliate that owns the applicable debentures, or a deferral of the payment of interest on such debentures in accordance with the terms of the applicable indenture.
62
Table of Contents
Under our amended and restated certificate of incorporation to be effective prior to the completion of this offering, holders of our common stock and non-voting common stock will be equally entitled to receive ratably such dividends as may be declared from time to time by our board of directors out of legally available funds. No shares of our non-voting common stock will be outstanding immediately following this offering.
Our Historical Dividends
Prior to this offering, GWBI declared and paid dividends to NAI, as the sole beneficial owner of its common stock, on a semi-annual basis. GWBI declared and paid to NAI $68.0 million, $41.4 million and $41.8 million in aggregate dividends during the first nine months of fiscal year 2014 and during fiscal years 2013 and 2012, respectively. We expect that GWBI will declare and pay to NAI an aggregate dividend of $34.0 million (related to our earnings during the second half of fiscal year 2014) during our fourth fiscal quarter prior to completion of the Formation Transactions.
63
Table of Contents
The following table shows our capitalization, including regulatory capital ratios, on a consolidated basis at June 30, 2014, on an actual basis, before giving effect to the Formation Transactions, and on an as adjusted basis after giving effect to the Formation Transactions and the effectiveness of our amended and restated certificate of incorporation. You should read the following table in conjunction with the sections titled “Selected Historical Consolidated Financial and Operating Information” and “Management’s Discussion and Analysis of Financial Condition and Results of Operations” and our consolidated financial statements and related notes appearing elsewhere in this prospectus.
| At June 30, 2014 | ||||||||
| Actual | As Adjusted | |||||||
| (dollars in thousands) | ||||||||
| Debt: |
||||||||
| Short-Term Borrowings |
||||||||
| Securities sold under agreements to repurchase |
$ | 181,898 | $ | 181,898 | ||||
| Related party notes payable |
5,500 | 5,500 | ||||||
| FHLB advances and other short-term borrowings |
55,097 | 55,097 | ||||||
|
|
|
|
|
|||||
| Total short-term borrowings |
$ | 242,495 | $ | 242,495 | ||||
| Long-Term Borrowings |
||||||||
| Securities sold under agreements to repurchase |
$ | 3,722 | 3,722 | |||||
| FHLB advances |
380,000 | $ | 380,000 | |||||
| Related party notes payable |
35,795 | 35,795 | ||||||
| Subordinated debentures |
56,083 | 56,083 | ||||||
|
|
|
|
|
|||||
| Total long-term borrowings |
$ | 475,600 | $ | 475,600 | ||||
| Stockholder’s Equity: |
||||||||
| Common stock, par value $1 per share on an actual basis (250,000 shares authorized, 198,731 shares outstanding) and par value $0.01 per share on an as adjusted basis ( shares authorized, shares outstanding) |
$ | 199 | $ | |||||
| Non-voting common stock, par value $0.01 per share on an as adjusted basis ( shares authorized, no shares outstanding) |
— | |||||||
| Additional paid-in capital |
1,260,504 | |||||||
| Retained earnings |
172,669 | |||||||
| Accumulated other comprehensive (loss) |
(2,408 | ) | ||||||
|
|
|
|
|
|||||
| Total stockholder’s equity |
1,430,964 | |||||||
|
|
|
|
|
|||||
| Total capitalization(1) |
$ | 2,149,059 | $ | |||||
|
|
|
|
|
|||||
| Capital Ratios: |
||||||||
| Tier 1 capital ratio |
12.1 | % | 12.1 | % | ||||
| Total capital ratio |
13.1 | % | 13.1 | % | ||||
| Tier 1 leverage ratio |
9.3 | % | 9.3 | % | ||||
| Tangible common equity to tangible assets(2) |
8.3 | % | 8.3 | % | ||||
| (1) | Excludes shares of our common stock reserved for future issuance under our equity incentive plans. |
| (2) | Our tangible common equity to tangible assets ratio is a non-GAAP financial measure. For more information on this financial measure, including a reconciliation to the most directly comparable GAAP financial measure, see “Prospectus Summary—Summary Historical Consolidated Financial and Operating Information.” |
64
Table of Contents
All shares of our common stock being sold in this offering were issued and outstanding prior to completion of this offering. As a result, this offering will not have a dilutive effect on our stockholders. Dilution results from the fact that the per share offering price of our common stock is substantially in excess of the net tangible book value attributable to the existing equity holders. Our net tangible book value represents the amount of total tangible assets less total liabilities, and our net tangible book value per share represents net tangible book value divided by the number of shares of common stock outstanding. Our net tangible book value per share of our common stock, after giving effect to the Formation Transactions, will not be affected by the sale of shares of our common stock in this offering by the NAB selling stockholder and will be $ immediately prior to and following the completion of this offering.
The following table summarizes, at and after giving effect to the Formation Transactions, the number of shares of common stock purchased from us, the total consideration paid to us and the average price per share paid by the NAB selling stockholder and by investors participating in this offering, based upon an assumed initial public offering price of $ per share, the mid-point of the range on the cover of this prospectus, and before deducting estimated underwriting discounts and commissions and estimated offering expenses payable by us.
|
Shares Purchased |
Total Consideration | Average Price Per Share | ||||||||
| Number | Percentage | Amount | Percentage | |||||||
| Existing stockholder |
||||||||||
| Purchasers in this offering |
||||||||||
|
|
|
|
|
| ||||||
| Total |
||||||||||
|
|
|
|
|
| ||||||
Effective upon the completion of this offering, an additional shares of our common stock will be reserved for future issuance under our equity incentive plans. As of the date of this prospectus, we estimate that, in connection with and as soon as practicable following the completion of this offering, we will grant new awards under our equity incentive plans representing approximately shares of our common stock, assuming the public offering price per share in this offering is at $ per share, which is the midpoint of the price range set forth on the front cover of this prospectus. To the extent that new awards are issued under our equity incentive plans or we issue additional shares of common stock in the future, there may be dilution to investors participating in this offering.
65
Table of Contents
SELECTED HISTORICAL CONSOLIDATED FINANCIAL AND OPERATING INFORMATION
You should read the selected historical consolidated financial and operating data set forth below in conjunction with the sections titled “Management’s Discussion and Analysis of Financial Condition and Results of Operations” and “Capitalization,” as well as our consolidated financial statements and the related notes included elsewhere in this prospectus. The historical financial information as of and for the fiscal years ended September 30, 2013 and 2012 is derived from our audited financial statements included elsewhere in this prospectus. The historical financial information as of and for the nine-month periods ended June 30, 2014 and 2013 is derived from our unaudited financial statements included elsewhere in this prospectus, which have been prepared on the same basis as our audited consolidated financial statements. Our historical results may not be indicative of our future performance. In addition, results for the nine-month periods ended June 30, 2014 and 2013 may not be indicative of the results that may be expected for the full fiscal year. The historical financial information below also contains non-GAAP financial measures, which have not been audited.
| Nine months ended June 30, | Fiscal year ended September 30, | |||||||||||||||
| 2014 | 2013 | 2013 | 2012 | |||||||||||||
| (dollars in thousands) | ||||||||||||||||
| Income Statement Data: |
||||||||||||||||
| Interest and dividend income |
$ | 261,764 | $ | 210,559 | $ | 294,257 | $ | 344,304 | ||||||||
| Interest expense |
24,337 | 30,349 | 39,161 | 50,971 | ||||||||||||
|
|
|
|
|
|
|
|
|
|||||||||
| Net interest income |
237,427 | 180,210 | 255,096 | 293,333 | ||||||||||||
| Provision (recovery) for loan losses |
(2,065 | ) | 14,034 | 11,574 | 30,145 | |||||||||||
|
|
|
|
|
|
|
|
|
|||||||||
| Net interest income, after provision (recovery) for loan losses |
239,492 | 166,176 | 243,522 | 263,188 | ||||||||||||
| Noninterest income |
45,583 | 59,614 | 77,692 | 88,975 | ||||||||||||
| Noninterest expense |
166,436 | 116,188 | 171,073 | 235,010 | ||||||||||||
|
|
|
|
|
|
|
|
|
|||||||||
| Income before income taxes |
118,639 | 109,602 | 150,141 | 117,153 | ||||||||||||
| Provision for income taxes |
41,562 | 39,682 | 53,898 | 44,158 | ||||||||||||
|
|
|
|
|
|
|
|
|
|||||||||
| Net income |
$ | 77,077 | $ | 69,920 | $ | 96,243 | $ | 72,995 | ||||||||
|
|
|
|
|
|
|
|
|
|||||||||
| Cash net income(1) |
$ | 88,092 | $ | 82,087 | $ | 112,289 | $ | 89,397 | ||||||||
|
|
|
|
|
|
|
|
|
|||||||||
| Other Financial Info / Performance Ratios: |
||||||||||||||||
| Net interest margin(2) |
3.93 | % | 3.07 | % | 3.24 | % | 3.98 | % | ||||||||
| Adjusted net interest margin(1), (2) |
3.73 | % | 3.78 | % | 3.76 | % | 3.72 | % | ||||||||
| Adjusted efficiency ratio(1) |
51.4 | % | 50.4 | % | 51.0 | % | 53.7 | % | ||||||||
| Return on average total assets(2) |
1.12 | % | 1.04 | % | 1.07 | % | 0.85 | % | ||||||||
| Return on average common equity(2) |
7.30 | % | 6.79 | % | 6.97 | % | 5.40 | % | ||||||||
| Return on average tangible common equity(1), (2) |
17.1 | % | 17.3 | % | 17.5 | % | 15.0 | % | ||||||||
| June 30, 2014 |
September 30, | |||||||||||
| 2013 | 2012 | |||||||||||
| (dollars in thousands) | ||||||||||||
| Balance Sheet Data: |
||||||||||||
| Loans(3) |
$ | 6,678,501 | $ | 6,362,673 | $ | 6,138,574 | ||||||
| Allowance for loan losses |
47,038 | 55,864 | 71,878 | |||||||||
| Securities |
1,395,768 | 1,480,449 | 1,581,875 | |||||||||
| Goodwill |
697,807 | 697,807 | 697,807 | |||||||||
| Total assets |
9,292,283 | 9,134,258 | 9,008,252 | |||||||||
| Total deposits |
7,067,112 | 6,948,208 | 6,884,515 | |||||||||
| Total liabilities |
7,861,319 | 7,717,044 | 7,619,689 | |||||||||
| Total stockholder’s equity |
1,430,964 | 1,417,214 | 1,388,563 | |||||||||
66
Table of Contents
| At and for the nine months ended June 30, 2014 |
At and for the fiscal year ended September 30, |
|||||||||||
| 2013 | 2012 | |||||||||||
| Asset Quality Ratios: |
||||||||||||
| Nonperforming loans / total loans(4) |
0.64 | % | 1.28 | % | 1.53 | % | ||||||
| Allowance for loan losses / total loans |
0.70 | % | 0.88 | % | 1.17 | % | ||||||
| Net charge-offs / average total loans(2) |
0.14 | % | 0.44 | % | 0.54 | % | ||||||
| Capital Ratios: |
||||||||||||
| Tier 1 capital ratio |
12.1 | % | 12.4 | % | 11.9 | % | ||||||
| Total capital ratio |
13.1 | % | 13.8 | % | 13.7 | % | ||||||
| Tier 1 leverage ratio |
9.3 | % | 9.2 | % | 8.3 | % | ||||||
| Tangible common equity to tangible assets(1) |
8.3 | % | 8.2 | % | 7.8 | % | ||||||
| (1) | This is a non-GAAP financial measure. For more information on this non-GAAP financial measure, including a reconciliation to the most directly comparable GAAP financial measure, see “Prospectus Summary—Summary Historical Consolidated Financial and Operating Information.” |
| (2) | Calculated as an annualized percentage for the nine months ended June 30, 2014 and 2013, as applicable. |
| (3) | Loans include unpaid principal balance net of unamortized discount on acquired loans and unearned net deferred fees and costs and loans in process. |
| (4) | Numerator excludes loans subject to FDIC loss-sharing arrangements. See “Management’s Discussion and Analysis of Financial Condition and Results of Operations—Key Factors Affecting Our Business and Financial Statements—Asset Quality and Loss-Sharing Arrangements.” |
67
Table of Contents
MANAGEMENT’S DISCUSSION AND ANALYSIS
OF FINANCIAL CONDITION AND RESULTS OF OPERATIONS
The historical consolidated financial data discussed below reflects our historical results of operations and financial condition and should be read in conjunction with our financial statements and related notes thereto presented elsewhere in this prospectus. In addition to historical financial data, this discussion includes certain forward-looking statements regarding events and trends that may affect our future results. Such statements are subject to risks and uncertainties that could cause our actual results to differ materially. See “Cautionary Note Regarding Forward-Looking Statements.” For a more complete discussion of the factors that could affect our future results, see “Risk Factors.”
Overview
We are a full-service regional bank holding company focused on relationship-based business and agribusiness banking. We serve our customers through 162 branches in attractive markets in seven states: South Dakota, Iowa, Nebraska, Colorado, Arizona, Kansas and Missouri. We were established more than 70 years ago and have achieved strong market positions by developing and maintaining extensive local relationships in the communities we serve. By leveraging our business and agribusiness focus, presence in attractive markets, highly efficient operating model and robust approach to risk management, we have achieved significant and profitable growth—both organically and through disciplined acquisitions. We provide financial results based on a fiscal year ending September 30 and as a single reportable segment.
Growth in our loan portfolio, which totaled $6.68 billion at June 30, 2014, has driven growth in our total assets during fiscal year 2013 and the first half of fiscal year 2014. From September 30, 2009 to September 30, 2013, we have grown our total assets at a CAGR of 15%, our loan portfolio at a CAGR of 17% and our deposit base at a CAGR of 16%. This growth was primarily generated by our acquisition of TierOne Bank in 2010, which represented approximately $2.5 billion of our $3.1 billion total asset growth in fiscal year 2010. From September 30, 2012 to September 30, 2013, our total assets, loan portfolio and deposit base grew by 1%, 4% and 1%, respectively, as our loan growth drove continued asset growth, despite being offset by a reduction in the size of our investment portfolio. We achieved this overall loan growth while simultaneously increasing our percentage of commercial non-real estate and agricultural loans as part of our overall loan portfolio. Our commercial non-real estate loans represent a range of sectors, including key areas such as agribusiness services, freight and transport, healthcare and tourism. Our agriculture loan portfolio remains well diversified across the range of crops and livestock produced in our markets, including grains (primarily corn, soybeans and wheat), proteins (primarily beef cattle, dairy products and hogs) and other (including cotton and vegetables). Adjusted for the effect of fixed-to-floating interest rate swaps matching certain of our fixed-rate loans, our loan portfolio generally has a short duration, with an average tenor of 1.4 years.
Our asset quality remains strong with continuing declines in nonperforming loans despite our overall loan growth. Total nonperforming loans, which we define as loans on nonaccrual status excluding loans acquired as part of our acquisition of TierOne Bank subject to FDIC loss-sharing arrangements, have decreased from $93.8 million on September 30, 2012 to $81.5 million on September 30, 2013 and $42.5 million on June 30, 2014. Excluding charge-offs on acquired loans subject to purchase accounting fair value adjustments, net charge-offs as a percentage of average total loans have also declined from 54 basis points for fiscal year 2012 to 44 basis points for fiscal year 2013 and 14 basis points (annualized) for the nine months ended June 30, 2014. We had $259.7 million book value of loans subject to FDIC loss-sharing arrangements at June 30, 2014, and we continue to run off portions of these loans that we do not consider core to our ongoing operations. To date, we have not had any indemnity claims arising from the FDIC loss-sharing arrangements rejected by the FDIC.
Net income was $77.1 million for the first nine months of fiscal year 2014, an increase of $7.2 million, or 10%, compared with the first nine months of fiscal year 2013, and net income was $96.2 million for fiscal year 2013, an increase of $23.2 million, or 32%, compared with fiscal year 2012. Our net interest margin increased to 3.93% (annualized) during the first nine months of fiscal year 2014 from 3.07% during the same period in fiscal
68
Table of Contents
year 2013. On an adjusted basis excluding offsetting changes in fair value related to interest rates associated with certain of our loans and interest rate swaps, our adjusted net interest margin of 3.73% (annualized) represented a decline of 5 basis points between the first nine months of fiscal year 2014 and the same period in fiscal year 2013, primarily due to competition for loan pricing across our footprint that was partially offset by improvements in our deposit funding cost. Our noninterest income declined during the first nine months of fiscal year 2014 primarily as a result of slower home mortgage activity, particularly refinancings and the absence of gains on sales of investment securities. For more information on our adjusted net interest margin, including a reconciliation to the most directly comparable GAAP financial measure, see “Prospectus Summary—Summary Historical Consolidated Financial and Operating Information.”
We believe our operating efficiency is a key component of our growth and profitability. We continue to monitor salary and benefits costs, optimize our branch network (which resulted in the net closure of 17 branches between June 30, 2013 and June 30, 2014) and focus on our core business and agribusiness banking competencies. Our adjusted efficiency ratio increased to 51.4% for the first nine months of fiscal year 2014, compared to 50.4% for the same period in fiscal year 2013 driven by lower noninterest income, while adjusted noninterest expenses declined by 2% over the same period. Our operating efficiency helped drive returns on average total assets and average tangible common equity for the first nine months of fiscal year 2014 which were 1.12% and 17.1%, respectively, compared to 1.04% and 17.3%, respectively, in the first nine months of fiscal year 2013. While we expect to incur additional costs associated with operating as a public company following this offering, we believe our efficiency initiatives, including continuing to optimize our branch network, will allow us to continue our historically efficient operations. For more information on our return on average tangible common equity, including a reconciliation to the most directly comparable GAAP financial measure, see “Prospectus Summary—Summary Historical Consolidated Financial and Operating Information.”
We have achieved significant and profitable growth organically and through disciplined acquisitions. We have successfully completed eight acquisitions since 2006, including our 2010 FDIC-assisted acquisition of TierOne Bank, which represented approximately $2.5 billion in acquired assets.
We maintain a solid funding position supported substantially by customer deposits, which have continued to grow in recent years. Our deposit balances were $7.07 billion at June 30, 2014, an increase of $118.9 million compared with September 30, 2013 and of $182.6 million compared with September 30, 2012. In fiscal year 2013, we began a strategic initiative to transition the composition of our deposit portfolio away from higher-cost term deposits (such as certificates of deposit, or CDs) toward more cost-effective transaction accounts (such as negotiable order of withdrawal, or NOW, accounts, money market deposit accounts, or MMDAs, and savings accounts). As a result, CDs have decreased to 27% of our average deposits for the nine months ended June 30, 2014 compared to 37% for the nine months ended June 30, 2013. The effects of this initiative have included declines in our deposit-related interest expense, with average cost of deposits at 0.37% for the nine months ended June 30, 2014, a decline of 11 basis points compared with the twelve months ended September 30, 2013 and 31 basis points compared with the twelve months ended September 30, 2012. We expect to continue to drive a transformation in our funding by focusing on attracting business deposits by leveraging our agribusiness and business banking relationships.
Our capital position has remained strong, with Tier 1 capital, total capital and Tier 1 leverage ratios of 12.1%, 13.1% and 9.3%, respectively, at June 30, 2014, compared to 12.4%, 13.8% and 9.2%, respectively, as of September 30, 2013. Our tangible common equity to tangible assets ratio was 8.3% at June 30, 2014 and 8.2% at September 30, 2013. For more information on our tangible common equity to tangible assets ratio, including a reconciliation to the most directly comparable GAAP financial measure, see “Prospectus Summary—Summary Historical Consolidated Financial and Operating Information.”
We are a wholly owned subsidiary of NAB, and our results have been part of NAB’s consolidated business operations since NAB acquired us in 2008. NAB is a large financial institution incorporated in Australia and listed on the Australian Securities Exchange with operations in Australia, New Zealand, the United Kingdom, the
69
Table of Contents
United States and parts of Asia. Historically, NAB and its affiliates have provided financial and administrative support to us. In connection with this offering, we and NAB intend to enter into certain agreements that will provide a framework for our ongoing relationship, including a Stockholder Agreement governing NAB’s rights as a controlling stockholder and a Transitional Services Agreement pursuant to which NAB will agree to continue to provide us with certain services for a transition period. We do not expect our costs associated with these services to be significant. These arrangements are described in greater detail below under “Our Relationship with NAB and Certain Other Related Party Transactions.”
Formation Transactions
Following the formation of Great Western Bancorp, Inc. and prior to the consummation of this offering, the following transactions will be taken in the order listed below:
| • | the NAB selling stockholder will contribute all outstanding capital stock in NAI to Great Western Bancorp, Inc., resulting in NAI becoming a wholly owned subsidiary of Great Western Bancorp, Inc.; |
| • | NAI will merge with and into Great Western Bancorp, Inc., with Great Western Bancorp, Inc. continuing as the surviving corporation and succeeding to all the assets, liabilities and business of NAI; and |
| • | GWBI will merge with and into Great Western Bancorp, Inc., with Great Western Bancorp, Inc. continuing as the surviving corporation and succeeding to all the assets, liabilities and business of GWBI. |
As a result of these transactions, Great Western Bancorp, Inc. will succeed to the business of GWBI, whose consolidated financial statements and related notes thereto are included in this prospectus. The Formation Transactions will not result in a change in our business or our management team.
Following the completion of the Formation Transactions and this offering, we will be a publicly traded bank holding company and will directly own all outstanding capital stock issued by our bank. See “Prospectus Summary—Our Structure and Formation Transactions.”
Key Factors Affecting Our Business and Financial Statements
Economic Conditions
Our loan portfolio can be affected in several ways by changes in economic conditions in our local markets and across the country. For example, declining local economic prospects can reduce borrowers’ willingness to take out new loans or our expectations of their ability to repay existing loans, while declining national conditions can limit the markets for our commercial and agribusiness borrowers’ products. Conversely, rising consumer and business confidence can increase demand for loans to fund consumption and investments, which can lead to opportunities for us to grant new loans and further develop our banking relationships with our customers. Some elements of the business environment that affect our financial performance include short-term and long-term interest rates, inflation and price levels (particularly for agricultural commodities), monetary policy, unemployment and the strength of the domestic economy and the local economy in the markets in which we operate. Because commercial non-real estate and owner-occupied CRE borrowers are particularly exposed to external economic conditions such as consumer sentiment, repayment of commercial non-real estate loans and owner-occupied CRE loans may be more sensitive than other types of loans to adverse conditions in the real estate market or the general economy. These loans totaled approximately $2.74 billion, or 41%, of our loan portfolio as of June 30, 2014. In addition, agricultural loans, which comprised 25% of our loan portfolio as of June 30, 2014, depend on the health of the agricultural industry broadly and in the location of the borrower in particular and on commodity prices. Overall, our markets continue to experience moderate economic growth, although leading indicators point to some softening. Farm income has seen recent declines as a result of lower crop prices and some drought conditions. The United States Department of Agriculture expects farm income to
70
Table of Contents
fall in 2014 but remain relatively high by historical standards. In line with the downturn in farm income, farmland prices are coming under pressure. Declines in economic conditions in our local markets, or in farm incomes or farmland prices, could negatively impact our financial results.
See “Risk Factors—Risks Related to Our Business—Our business may be adversely affected by conditions in the financial markets and economic conditions generally and in our states in particular.”
Interest Rates
Net interest income is our largest source of income and is the difference between the interest income we receive from interest-earning assets (e.g., loans and investment securities) and the interest expense we pay on interest-bearing liabilities (e.g., deposits and borrowings). The level of net interest income is primarily a function of the average balance of interest-earning assets, the average balance of interest-bearing liabilities and the spread between the yield on such assets and the cost of such liabilities. These factors are influenced by both the pricing and mix of interest-earning assets and interest-bearing liabilities. Interest rates can be volatile and are highly sensitive to many factors beyond our control, such as economic conditions, the policies of various governmental and regulatory agencies and, in particular, the monetary policy of the FOMC.
The cost of our deposits and short-term borrowings is largely based on short-term interest rates, the level of which is driven primarily by the Federal Reserve’s actions. However, the yields generated by our loans and securities are typically driven by longer-term interest rates, which are dictated by the market or, at times, the Federal Reserve’s actions, and generally vary from day to day. The level of net interest income is therefore influenced by movements in such interest rates, the changing mix in our funding sources and the pace at which such movements occur. In 2013 and 2014, short-term and long-term interest rates were very low by historical standards, with many benchmark rates, such as the federal funds rate and one- and three-month LIBOR, near zero. Further declines in the yield curve or a decline in longer-term yields relative to short-term yields (a flatter yield curve) would have an adverse impact on our net interest margin and net interest income. Increases in the yield curve or an increase in longer-term yields relative to short-term yields (a steeper yield curve) would have a positive impact on our net interest margin and net interest income.
See “Risk Factors—Risks Related to Our Business—We are subject to interest rate risk” and “Quantitative and Qualitative Disclosures About Market Risk.”
Asset Quality and Loss-Sharing Arrangements
Our asset quality remained strong during the first nine months of fiscal year 2014 with continued declines in total nonperforming loans, net charge-offs and allowance for loan losses. These declines helped drive reductions in our pre-tax provision for loan losses. We continue to run off assets from our acquisition of TierOne Bank that are not part of our core lending business, including non-owner-occupied CRE loans and construction and development loans, particularly those outside our footprint. At June 30, 2014, we had approximately $290.0 million of loans acquired as part of the TierOne Bank acquisition. The majority of our loans acquired from TierOne Bank are subject to loss-sharing arrangements with the FDIC where we are indemnified by the FDIC for 80% of our losses associated with any covered loans. Our ability to seek indemnification under the commercial loss-sharing arrangement, which covered $129 million in loans at June 30, 2014, terminates in June of 2015, and the single-family loss-sharing arrangement, which covered $131 million in loans at June 30, 2014, terminates in June of 2020. The amount of reimbursement we receive as a result of these indemnity payments, and the amount of income derived from the underlying loans, has decreased over time as the volume of covered loans we continue to hold declines. To date, we have not had any indemnity claims arising from the FDIC loss-sharing arrangements rejected by the FDIC. Future indemnity claims may be denied if we fail to comply with the requirements of our loss-sharing arrangements with the FDIC, which could result in additional losses and charge-offs related to these loans. See “Risk Factors—Risks Related to Our FDIC-Assisted Acquisition of TierOne Bank—Our ability to obtain reimbursement under the loss-sharing agreements on covered assets depends on our compliance with the terms of the loss-sharing agreements.”
71
Table of Contents
Banking Laws and Regulations
We are subject to extensive supervision and regulation under federal and state banking laws. See “Supervision and Regulation” and “Risk Factors—Risks Related to the Regulatory Oversight of Our Business.” Financial institutions have been subject to increased regulatory scrutiny in recent years as significant structural changes in the bank regulatory framework have been adopted in response to the recent financial crisis. In particular, federal bank regulators have increased regulatory expectations generally and with respect to consumer compliance, economic sanctions, anti-money laundering and Bank Secrecy Act requirements. As a result of these heightened expectations, we may incur additional costs associated with legal compliance that may affect our financial results in the future.
Payment of Interest on Demand Deposits. In addition, effective July 2011, the Dodd-Frank Act repealed the prohibition restricting depository institutions from paying interest on demand deposits, such as checking accounts. We have begun offering an interest-bearing corporate checking account, but interest rates on this product remain low due to current market conditions. Consequently, this change has not significantly affected our financial results. If interest rates on this product increase in the future, our business may be affected.
Basel III and Its Implementing Regulations. In July 2013, the federal bank regulators approved new regulations implementing the Basel III capital framework and various provisions of the Dodd-Frank Act. These regulations will become effective for us on January 1, 2015, subject to phase-in of various provisions. The most significant changes from the current risk-based capital guidelines applicable to us will be the revisions affecting the numerator in regulatory capital calculations and the increased risk weightings for higher-volatility CRE loans, for revolving lines of credit of less than one year in duration and for past-due and impaired loans. See “—Capital” for further information.
Interchange Fees. We are currently subject to the interchange fee cap adopted under the Durbin Amendment to the Dodd-Frank Act as a result of NAB’s ownership of us. Once NAB no longer controls us for bank regulatory purposes, we may be able to qualify for the small issuer exemption from the interchange fee cap depending on our total assets at the time. The small issuer exemption applies to any debit card issuer that, together with its affiliates, has total assets of less than $10 billion as of the end of the previous calendar year. In the event we qualify for the small issuer exemption, we will once again become subject to the interchange fee cap beginning July 1 following the time when our total assets reach or exceed $10 billion. Reliance on the small issuer exemption would not exempt us from federal regulations prohibiting network exclusivity arrangements or from routing restrictions, however, and those regulations have negatively affected the interchange income we have received from our debit card network.
Heightened Prudential Requirements. We and our bank both currently have less than $10 billion in total consolidated assets. Following the fourth consecutive quarter (and any applicable phase-in period) where we or our bank exceeds this threshold, as applicable, we or our bank, as applicable, will become subject to a number of additional requirements (such as annual stress testing requirements implemented pursuant to the Dodd-Frank Act and general oversight by the CFPB) that will impose additional compliance costs on our business. See “Supervision and Regulation—Heightened Requirements for Bank Holding Companies with $10 Billion or More in Assets.” While neither we nor our bank is currently subject to these requirements, we have begun analyzing these rules to ensure we are prepared to comply with the rules when and if they become applicable. For example, we have begun running periodic and selective stress tests on liquidity, interest rates and certain areas of our loan portfolio to prepare for compliance with FDIC stress testing requirements.
Competition
Our profitability and growth are affected by the highly competitive nature of the financial services industry. We compete with commercial banks, savings banks, credit unions, non-bank financial services companies and other financial institutions operating within the areas we serve, particularly nationwide and regional banks and larger community banks that target the same customers we do. We also face competition for agribusiness loans
72
Table of Contents
from participants in the nationwide Farm Credit System and global banks. Recently, we have seen increased competitive pressures on loan rates and terms for high-quality credits, driven in part by the prolonged low-interest rate environment. Continued loan pricing pressure may continue to affect our financial results in the future. See “Risk Factors—Risks Related to Our Business—We operate in a highly competitive industry and market area.”
Operational Efficiency
We believe that our focus on operational efficiency is critical to our profitability and future growth, and our management has adopted numerous processes to improve our level of operational efficiency. In contrast to some competitor banks, our business offers a focused range of profitable products. In addition, instead of using multiple information technology solutions, we have increased the efficiency of our operations by using a single integrated third party core processing system across all of our locations. We continue to optimize our branch network and have commenced reviews of additional internal processes and our vendor relationships, with a view to identifying opportunities to further improve efficiency and enhance earnings. We are also continuing our efforts to shift our deposit base to lower-cost customer deposits, a strategic initiative that has been primarily responsible for driving our cost of deposit funding down since September 30, 2012. To foster a culture of operational efficiency, we have implemented the management principles of Kaizen & Lean across all of our front-office and back-office operations. We feel that appropriate use of these management principles both encourages efficiency and contributes to the efficient integration of acquired businesses.
Following the completion of this offering, we expect to incur additional one-time and recurring expenses to support our operations as a standalone public company, including expenses related to compliance with applicable legal and financial reporting standards and expansion of our investor relations and corporate communications functions. These expenses will adversely affect our future financial results. See “Risk Factors—Risks Related to Our Business—Fulfilling our public company financial reporting and other regulatory obligations will be expensive and time consuming and may strain our resources.”
Goodwill and Amortization of Other Intangibles
Since 2006, we have completed eight acquisitions. We accounted for these transactions using the acquisition method of accounting, under which the acquired company’s net assets are recorded at fair value at the date of acquisition and the difference between the purchase price and fair value of the net assets acquired is recorded as goodwill, if positive, and as bargain purchase gain, if negative. At June 30, 2014, we had $697.8 million of goodwill, the majority of which relates to the acquisition of us by NAB in 2008, with the balance relating to subsequent acquisitions completed by us.
Under relevant accounting guidance, we are required to review goodwill for impairment annually, or more frequently if events or circumstances indicate that the fair value of our business may be less than its carrying value. The valuation of goodwill is dependent on forward-looking expectations related to nationwide and local economic conditions and our associated financial performance. A significant decline in our expected future cash flows, a material change in interest rates, a significant adverse change in the business climate, slower growth rates or a significant or sustained decline in the price of our common stock, when and if a market for our common stock is established, may necessitate taking charges in the future related to the impairment of our intangible assets. Our recognition of any such impairment could adversely affect our future financial results. See “Risk Factors—Risks Related to Our Business—The value of our goodwill and other intangible assets may decline in the future.”
As a result of these acquisitions, including the acquisition of us by NAB in 2008, we also have recorded intangible assets related to core deposits, brand intangibles, customer relationships and other intangibles. Each of these intangible assets is amortized as noninterest expense according to a specified schedule. The most significant component of these intangibles relates to our core deposits, of which $11.6 million was amortized as
73
Table of Contents
noninterest expense during the nine months ended June 30, 2014. Total scheduled amortization for all intangible assets includes approximately $16 million for fiscal year 2014, approximately $7 million for fiscal year 2015, approximately $3 million for fiscal year 2016 and immaterial amounts for fiscal years 2017 through 2023. For additional information on these intangible assets and their respective amortization schedules, see “Note 1. Nature of Operations and Summary of Significant Accounting Policies—Core Deposits and Other Intangibles” and “Note 13. Core Deposits and Other Intangibles” contained in our audited consolidated financial statements included elsewhere in this prospectus.
Loans and Interest Rate Swaps Accounted for at Fair Value
In the normal course of business, we enter into fixed-rate loans having original maturities of 5 years or greater (typically between 5 and 15 years) with certain of our business and agribusiness banking customers to assist them in facilitating their risk management strategies. We mitigate our interest rate risk associated with these loans by entering into equal and offsetting fixed-to-floating interest rate swap agreements for these loans with NAB London Branch. We have elected to account for the loans at fair value under Accounting Standards Codification, or ASC, 825 Fair Value Option. Changes in the fair value of these loans are recorded in earnings as a component of interest income in the relevant period. We also record an adjustment for credit risk in interest income based on our loss history for similar loans, adjusted for our assessment of existing market conditions for the specific portfolio of loans. If a specific relationship becomes impaired, we measure the estimated credit loss and record that amount through the credit risk adjustment.
The related interest rate swaps are recognized as either assets or liabilities in our financial statements and any gains or losses on these swaps are recorded in earnings as a component of noninterest expense. The hedges are fully effective from an interest rate risk perspective, as gains and losses on our swaps are directly offset by changes in fair value of the hedged loans (i.e., swap interest rate risk adjustments are directly offset by associated loan interest rate risk adjustments). Consequently, any changes in interest income associated with changes in fair value resulting from interest rate movement, as opposed to changes in credit quality, on the loans are directly offset by equal and opposite charges to, or reductions in, noninterest expense for the related interest rate swap. To ensure the correlation of movements in fair value between the interest rate swap and the related loan, we pass on all economic costs associated with our hedging activity resulting from loan customer prepayments (partial or full) to the borrower. For additional information about the treatment of interest rate swaps and related loans in our financial statements, see “Note 23. Fair Value of Financial Instruments and Interest Rate Risk” in our audited consolidated financial statements and “Note 16. Fair Value of Financial Instruments and Interest Rate Risk” in our unaudited interim consolidated financial statements included elsewhere in this prospectus.
Certain Key Performance Indicators
When we review our results of operations and financial condition, we focus on the indicators described below, among other measures:
| At and for the nine months ended June 30, |
At and for the fiscal year ended Sept. 30, |
|||||||||||||||
| 2014 | 2013 | 2013 | 2012 | |||||||||||||
| (dollars in thousands) | ||||||||||||||||
| Adjusted net interest income |
$ | 225,308 | $ | 221,845 | $ | 295,401 | $ | 273,964 | ||||||||
| Adjusted noninterest expense |
$ | 140,869 | $ | 143,223 | $ | 192,088 | $ | 195,995 | ||||||||
| Cash net income |
$ | 88,092 | $ | 82,087 | $ | 112,289 | $ | 89,397 | ||||||||
| Adjusted net interest margin(1) |
3.73 | % | 3.78 | % | 3.76 | % | 3.72 | % | ||||||||
| Adjusted efficiency ratio(2) |
51.4 | % | 50.4 | % | 51.0 | % | 53.7 | % | ||||||||
| Return on average tangible common equity(1) |
17.1 | % | 17.3 | % | 17.5 | % | 15.0 | % | ||||||||
| Tangible common equity / tangible assets |
8.3 | % | 7.9 | % | 8.2 | % | 7.8 | % | ||||||||
| (1) | Calculated as an annualized percentage for the nine months ended June 30, 2014 and 2013. |
| (2) | We compute our adjusted efficiency ratio as the ratio of our noninterest expense to our total revenue (equal to the sum of our net interest income and noninterest income), in each case adjusted as discussed in “Prospectus Summary—Summary Historical Consolidated Financial and Operating Information.” |
74
Table of Contents
Each of these measures is a non-GAAP financial measure. We believe that each of these measures is helpful in highlighting trends in our business that may not otherwise be apparent when relying solely on our GAAP-calculated results. For more information on these non-GAAP financial measures, including a reconciliation to the most directly comparable GAAP financial measures, see “Prospectus Summary—Summary Historical Consolidated Financial and Operating Information.”
Results of Operations—Nine Months Ended June 30, 2014 and June 30, 2013
Overview
The following table highlights certain key financial and performance information at and for the periods indicated:
| Nine months ended June 30, |
||||||||
| 2014 | 2013 | |||||||
| (dollars in thousands) | ||||||||
| Operating Data: |
||||||||
| Interest and dividend income |
$ | 261,764 | $ | 210,559 | ||||
| Interest expense |
24,337 | 30,349 | ||||||
| Noninterest income |
45,583 | 59,614 | ||||||
| Noninterest expense |
166,436 | 116,188 | ||||||
| Provision (recovery) for loan losses |
(2,065 | ) | 14,034 | |||||
| Net income |
77,077 | 69,920 | ||||||
| Cash net income(1) |
88,092 | 82,087 | ||||||
| Performance Ratios: |
||||||||
| Net interest margin(2) |
3.93 | % | 3.07 | % | ||||
| Adjusted net interest margin(1), (2) |
3.73 | % | 3.78 | % | ||||
| Return on average total assets(2) |
1.12 | % | 1.04 | % | ||||
| Return on average tangible common equity(1), (2) |
17.1 | % | 17.3 | % | ||||
| Adjusted efficiency ratio(1) |
51.4 | % | 50.4 | % | ||||
| At and for the nine months ended June 30, 2014 |
At and for the fiscal year ended Sept. 30, 2013 |
|||||||
| (dollars in thousands) | ||||||||
| Balance Sheet and Other Information: |
||||||||
| Total assets |
$ | 9,292,283 | $ | 9,134,258 | ||||
| Loans(3) |
6,678,501 | 6,362,673 | ||||||
| Allowance for loan losses |
47,038 | 55,864 | ||||||
| Deposits |
7,067,112 | 6,948,208 | ||||||
| Stockholder’s equity |
1,430,964 | 1,417,214 | ||||||
| Tangible common equity(1) |
716,161 | 688,963 | ||||||
| Tier 1 capital ratio |
12.1 | % | 12.4 | % | ||||
| Total capital ratio |
13.1 | % | 13.8 | % | ||||
| Tier 1 leverage ratio |
9.3 | % | 9.2 | % | ||||
| Tangible common equity / tangible assets(1) |
8.3 | % | 8.2 | % | ||||
| Nonperforming loans / total loans(4) |
0.64 | % | 1.28 | % | ||||
| Net charge-offs / average total loans(2) |
0.14 | % | 0.44 | % | ||||
| Allowance for loan losses / total loans |
0.70 | % | 0.88 | % | ||||
| (1) | This is a non-GAAP financial measure. For more information on this non-GAAP financial measure, including a reconciliation to the most directly comparable GAAP financial measure, see “Prospectus Summary—Summary Historical Consolidated Financial and Operating Information.” |
| (2) | Calculated as an annualized percentage for the nine months ended June 30, 2014 and 2013. |
| (3) | Loans include unpaid principal balance net of unamortized discount on acquired loans and unearned net deferred fees and costs and loans in process. |
| (4) | Nonperforming loans excludes loans covered by FDIC loss-sharing arrangements. |
75
Table of Contents
Our total assets were $9.29 billion at June 30, 2014 compared to $9.13 billion at September 30, 2013. The increase in total assets from September 30, 2013 was principally attributable to organic loan growth, partially offset by a decline in the total carrying value of our investment portfolio. Loans as shown above increased approximately 5% from September 30, 2013 to $6.68 billion at June 30, 2014, primarily due to growth in agricultural and commercial lending. Deposit balances increased by $0.12 billion from $6.95 billion at September 30, 2013 to $7.07 billion at June 30, 2014.
For the nine months ended June 30, 2014:
| • | net income was $77.1 million, an increase of $7.2 million, or 10%, compared with the nine months ended June 30, 2013, and cash net income was $88.1 million, an increase of $6.0 million, or 7%, compared with the nine months ended June 30, 2013, in each case due in large part to continued improvement in the overall credit quality of our lending portfolio, leading to lower net charge-offs compared to the nine months ended June 30, 2013 and a $16.1 million pre-tax reduction in the provision for loan losses; |
| • | net interest margin was 3.93% (annualized), an increase of 86 basis points compared with the nine months ended June 30, 2013, although our adjusted net interest margin was relatively flat, decreasing 5 basis points to 3.73% (annualized) compared with the nine months ended June 30, 2013. The increase in our net interest margin was primarily attributable to changes in fair value associated with certain of our long-term loans measured at fair value where we have entered into interest rate swaps, while the decline in our adjusted net interest margin reflects declining asset yields, primarily due to pressure on loan pricing across our footprint that was partially offset by strategic efforts undertaken to transition the composition of our deposit portfolio away from higher-cost term deposits toward more cost-effective transaction accounts, which lowered the overall cost of deposits; |
| • | net interest income was $237.4 million, an increase of $57.2 million, or 32%, compared with the nine months ended June 30, 2013, and adjusted net interest income was $225.3 million, a 2% increase from $221.8 million for the nine months ended June 30, 2013. The increase in net interest income was primarily driven by a significant net increase related to the fair value of certain of our fixed-rate loans where we have entered into matching fixed-to-floating interest rate swaps, while the increase in adjusted net interest income was driven by growth in interest-earning assets compared to interest-bearing liabilities and a relatively stable adjusted net interest margin; |
| • | provision (recovery) for loan losses was ($2.1) million, a decrease of $16.1 million, or 115%, compared with the nine months ended June 30, 2013. The decrease was driven by continued improvement in our incurred loss history and reductions in impaired loans requiring specific reserves for loan losses; |
| • | noninterest income was $45.6 million, a decrease of $14.0 million, or 24%, compared with the nine months ended June 30, 2013, driven by a 65% decrease in gain on sale of loans based on lower home mortgage activity (particularly in connection with refinancings), the absence of any gains on sales of investment securities and a reduction in vendor incentive payments recognized; |
| • | noninterest expense was $166.4 million, an increase of $50.2 million, or 43%, compared with the nine months ended June 30, 2013, and our adjusted noninterest expense decreased 2% compared with the nine months ended June 30, 2013. The increase in our noninterest expense was primarily attributable to changes in the fair value of the derivatives associated with certain of our long-term loans, while the decrease in our adjusted noninterest expense was driven primarily by lower salary and benefit costs; and |
| • | return on average total assets (annualized) was 1.12%, an 8-basis point increase from 1.04% for the nine months ended June 30, 2013, while return on average tangible common equity (annualized) was 17.1%, compared to 17.3% for the nine months ended June 30, 2013. |
Our cash net income, adjusted net interest margin, adjusted net interest income, adjusted noninterest expense and return on average tangible common equity discussed above are all non-GAAP financial measures. For more information on these financial measures, including a reconciliation to the most directly comparable GAAP financial measures, see “Prospectus Summary—Summary Historical Consolidated Financial and Operating Information.”
76
Table of Contents
Net Interest Income
The following table presents net interest income, net interest margin and adjusted net interest margin for the nine months ended June 30, 2014 and 2013:
| Nine months ended June 30, |
||||||||
| 2014 | 2013 | |||||||
| (dollars in thousands) | ||||||||
| Net interest income: |
||||||||
| Total interest and dividend income |
$ | 261,764 | $ | 210,559 | ||||
| Less: Total interest expense |
24,337 | 30,349 | ||||||
|
|
|
|
|
|||||
| Net interest income |
237,427 | 180,210 | ||||||
| Less: Provision (recovery) for loan losses |
(2,065 | ) | 14,034 | |||||
|
|
|
|
|
|||||
| Net interest income after provision (recovery) for loan losses |
$ | 239,492 | $ | 166,176 | ||||
|
|
|
|
|
|||||
| Net interest margin and adjusted net interest margin: |
||||||||
| Average interest-earning assets |
$ | 8,067,544 | $ | 7,839,914 | ||||
| Average interest-bearing liabilities |
$ | 7,734,558 | $ | 7,535,863 | ||||
| Net interest margin(1) |
3.93 | % | 3.07 | % | ||||
| Adjusted net interest margin(1), (2) |
3.73 | % | 3.78 | % | ||||
| (1) | Calculated as an annualized percentage for the nine months ended June 30, 2014 and 2013. |
| (2) | This is a non-GAAP financial measure. For more information on this non-GAAP financial measure, including a reconciliation to the most directly comparable GAAP financial measure, see “Prospectus Summary—Summary Historical Consolidated Financial and Operating Information.” |
Net interest income was $237.4 million for the nine months ended June 30, 2014, an increase of $57.2 million, or 32%, compared with $180.2 million for the nine months ended June 30, 2013. Average interest-earning assets for the first nine months of fiscal year 2014 increased 3% compared with the same period in fiscal year 2013, and the average yield increased 75 basis points to 4.34% (annualized). Average interest-bearing liabilities for the first nine months of fiscal year 2014 increased 3% compared with the same period in fiscal year 2013, and the average rate decreased 12 basis points to 0.42% (annualized). The impact of these changes to the net interest margin for the first nine months of fiscal year 2014 was an increase of 86 basis points to 3.93% (annualized), compared with 3.07% (annualized) for the first nine months of fiscal year 2013. Net interest margin is calculated as annualized net interest income divided by average total interest-earning assets. Adjusted net interest margin remained relatively flat, decreasing 5 basis points to 3.73% (annualized) compared with the nine months ended June 30, 2013. For more information on our adjusted net interest margin, including a reconciliation to the most directly comparable GAAP financial measure, see “Prospectus Summary—Summary Historical Consolidated Financial and Operating Information.”
The following table presents the distribution of average assets, liabilities and equity, interest income and resulting yields on average interest-earning assets, and interest expense and rates on average interest-bearing liabilities for each of the nine months ended June 30, 2014 and 2013. Loans on nonaccrual status, totaling $42.5 million and $75.3 million at June 30, 2014 and June 30, 2013, respectively, are included in the average balances below. Any interest that had accrued as of the date of nonaccrual is immediately reversed as contra-interest income, while any interest subsequently recovered is recorded in the period of recovery. Tax exempt loans and securities, totaling $412.5 million at June 30, 2014 and $306.2 million at June 30, 2013, are typically entered at lower interest rate arrangements than comparable non-exempt loans and securities. Interest income earned on these assets is presented below at the contractual rate, as opposed to a tax equivalent yield concept, with any tax benefit realized presented in the provision for income taxes and reflected in the effective tax rate for the period. Loans acquired with deteriorated credit quality represent loans accounted for in accordance with ASC
77
Table of Contents
310-30 Accounting for Purchased Loans that were credit impaired at the time we acquired them. Loans other than loans acquired with deteriorated credit quality represent loans we have originated and loans we have acquired that were not credit impaired at the time we acquired them.
| Nine months ended June 30, | ||||||||||||||||||||||||
| 2014 | 2013 | |||||||||||||||||||||||
| Average Balance |
Interest | Yields/ Rates(1) |
Average Balance |
Interest | Yields/ Rates(1) |
|||||||||||||||||||
| (dollars in thousands) | ||||||||||||||||||||||||
| Assets: |
||||||||||||||||||||||||
| Cash and due from banks |
$ | 197,450 | $ | 400 | 0.27 | % | $ | 151,980 | $ | 262 | 0.23 | % | ||||||||||||
| Investment securities |
1,427,707 | 21,002 | 1.97 | % | 1,570,263 | 21,631 | 1.84 | % | ||||||||||||||||
| Loans, other than loans acquired with deterioriated credit quality, net(2) |
6,239,191 | 236,036 | 5.06 | % | 5,826,250 | 175,074 | 4.02 | % | ||||||||||||||||
| Loans, acquired with deteriorated credit quality, net |
203,196 | 4,326 | 2.85 | % | 291,421 | 13,592 | 6.24 | % | ||||||||||||||||
| Loans, net |
6,442,387 | 240,362 | 4.99 | % | 6,117,671 | 188,666 | 4.12 | % | ||||||||||||||||
|
|
|
|
|
|
|
|
|
|||||||||||||||||
| Total interest-earning assets |
8,067,544 | 261,764 | 4.34 | % | 7,839,914 | 210,559 | 3.59 | % | ||||||||||||||||
| Other noninterest-earning assets |
1,155,291 | — | % | 1,153,948 | — | % | ||||||||||||||||||
|
|
|
|
|
|||||||||||||||||||||
| Total Assets |
$ | 9,222,835 | $ | 261,764 | 3.79 | % | $ | 8,993,862 | $ | 210,559 | 3.13 | % | ||||||||||||
|
|
|
|
|
|
|
|
|
|||||||||||||||||
| Liabilities and Equity: |
||||||||||||||||||||||||
| Non-interest demand deposits |
$ | 1,232,354 | $ | 1,155,126 | ||||||||||||||||||||
| NOW, MMDA and savings deposits |
3,943,543 | $ | 6,942 | 0.24 | % | 3,230,469 | $ | 5,096 | 0.21 | % | ||||||||||||||
| CDs |
1,952,901 | 12,687 | 0.87 | % | 2,526,838 | 20,879 | 1.10 | % | ||||||||||||||||
|
|
|
|
|
|
|
|
|
|||||||||||||||||
| Total deposits |
7,128,798 | 19,629 | 0.37 | % | 6,912,433 | 25,975 | 0.50 | % | ||||||||||||||||
|
|
|
|
|
|
|
|
|
|||||||||||||||||
| Securities sold under agreements to repurchase |
196,371 | 442 | 0.30 | % | 230,164 | 489 | 0.28 | % | ||||||||||||||||
| FHLB advances and other borrowings |
312,011 | 2,591 | 1.11 | % | 295,888 | 2,158 | 0.98 | % | ||||||||||||||||
| Related party notes payable |
41,295 | 690 | 2.23 | % | 41,295 | 714 | 2.31 | % | ||||||||||||||||
| Subordinated debentures and other |
56,083 | 985 | 2.35 | % | 56,083 | 1,013 | 2.42 | % | ||||||||||||||||
|
|
|
|
|
|
|
|
|
|||||||||||||||||
| Total borrowings |
605,760 | 4,708 | 1.04 | % | 623,430 | 4,374 | 0.94 | % | ||||||||||||||||
|
|
|
|
|
|
|
|
|
|||||||||||||||||
| Total interest-bearing liabilities |
7,734,558 | 24,337 | 0.42 | % | 7,535,863 | 30,349 | 0.54 | % | ||||||||||||||||
|
|
|
|
|
|||||||||||||||||||||
| Noninterest-bearing other liabilities |
77,140 | 81,740 | ||||||||||||||||||||||
| Equity |
1,411,137 | 1,376,259 | ||||||||||||||||||||||
|
|
|
|
|
|||||||||||||||||||||
| Total Liabilities and Equity |
$ | 9,222,835 | $ | 8,993,862 | ||||||||||||||||||||
|
|
|
|
|
|||||||||||||||||||||
| Net interest spread |
3.37 | % | 2.59 | % | ||||||||||||||||||||
| Net interest income and net interest margin |
$ | 237,427 | 3.93 | % | $ | 180,210 | 3.07 | % | ||||||||||||||||
|
|
|
|
|
|||||||||||||||||||||
| Adjusted net interest income and adjusted net interest margin(3) |
$ | 225,308 | 3.73 | % | $ | 221,845 | 3.78 | % | ||||||||||||||||
|
|
|
|
|
|||||||||||||||||||||
| (1) | Calculated as annualized percentages. |
| (2) | Interest income includes $12.1 million and $(41.6) million for the nine months ended June 30, 2014 and 2013, respectively, resulting from changes in fair value of certain of our fixed-rate loans where we have entered into matching fixed-to-floating interest rate swaps, and $1.7 million and $0.9 million for the nine months ended June 30, 2014 and 2013, respectively, resulting from accretion of purchase accounting discount associated with acquired loans. |
| (3) | These are non-GAAP financial measures. For more information on these non-GAAP financial measures, including a reconciliations to the most directly comparable GAAP financial measures, see “Prospectus Summary—Summary Historical Consolidated Financial and Operating Information.” |
78
Table of Contents
Interest and Dividend Income
The following table presents interest and dividend income for the nine months ended June 30, 2014 and 2013:
| Nine months ended June 30, |
||||||||
| 2014 | 2013 | |||||||
| (dollars in thousands) | ||||||||
| Interest and dividend income: |
||||||||
| Loans |
$ | 240,362 | $ | 188,666 | ||||
| Taxable securities |
20,190 | 20,817 | ||||||
| Nontaxable securities |
61 | 113 | ||||||
| Dividends on securities |
751 | 701 | ||||||
| Federal funds sold and other |
400 | 262 | ||||||
|
|
|
|
|
|||||
| Total interest and dividend income |
$ | 261,764 | $ | 210,559 | ||||
|
|
|
|
|
|||||
Total interest and dividend income consists primarily of interest income on loans and interest and dividend income on our investment portfolio. Total interest and dividend income for the nine months ended June 30, 2014 increased by $51.2 million, or 24%, to $261.8 million from $210.6 million for the nine months ended June 30, 2013. Significant components of interest and dividend income are described in further detail below.
Loans. Interest income on all loans increased $51.7 million, or 27%, to $240.4 million for the nine months ended June 30, 2014 from $188.7 million for the nine months ended June 30, 2013. In particular, interest income on our loans, other than loans acquired with deteriorated credit quality, increased $62.0 million, or 35%, to $236.0 million for the nine months ended June 30, 2014 from $174.1 million for the nine months ended June 30, 2013. The most significant driver of this increase in interest income was a $53.8 million net increase related to the fair value of certain of our fixed-rate loans where we have entered into matching fixed-to-floating interest rate swaps. Adjusted for the impact related to the net increase in fair value of these loans involving matching fixed-to-floating interest rate swaps, our interest income on loans, other than loans acquired with deteriorated credit quality, increased $8.2 million, or 3%, primarily as a result of growth in this portion of our loan portfolio. Interest income on loans acquired with deteriorated credit quality decreased $9.3 million, or 68%, to $4.3 million for the nine months ended June 30, 2014 from $13.6 million for the nine months ended June 30, 2013, primarily as a result of continued runoff in this portion of our loan portfolio.
Our yield on loans is affected by market rates, the level of adjustable rate loan indices, interest rate floors and caps, customer repayment activity, the level of loans held for sale, portfolio mix, movement in the fair value of long-term fixed-rate loans accounted for under ASC 825 Fair Value Option and the level of nonaccrual loans. The average yield on loans, other than loans acquired with deteriorated credit quality, was 5.06% for the first nine months of fiscal year 2014, an increase of 1.04% from 4.02% for the same period in fiscal year 2013. Adjusted for the impact related to the fair value of certain of our fixed-rate loans where we have entered into matching fixed-to-floating interest rate swaps, the average yield on our loans, other than loans acquired with deteriorated credit quality, for the first nine months of fiscal year 2014 was 4.80%, a decrease of 17 basis points from 4.97% during the same period in fiscal year 2013. This decrease is attributable to the competitive interest rate environment for high quality commercial and agricultural credits across our footprint. The average yield on loans acquired with deteriorated credit quality was 2.85% for the first nine months of fiscal year 2014, a decrease of 3.39% from 6.24% during the same period in fiscal year 2013. This significant decrease represents the impact of accelerated amortization of the related FDIC indemnification assets as the overall portfolio performance has continued to improve resulting in lower indemnification amounts expected from the FDIC.
Average net loan balances for the nine months ended June 30, 2014 were $6.44 billion, compared to $6.12 billion for the nine months ended June 30, 2013, an increase of $0.32 billion, or 5%. The increase is attributable to continued organic growth in our agriculture and commercial non-real estate lending classes, partially offset by runoff of loans acquired as part of our acquisition of TierOne Bank that are not considered core to our ongoing operations primarily because they are located outside our footprint.
79
Table of Contents
Loan-related fee income of $6 million is included in interest income for the nine months ended June 30, 2014, compared to $7 million for the nine months ended June 30, 2013. In addition, certain fees collected at loan origination are considered to be a component of yield on the underlying loans and are deferred and recognized into income over the life of the loans. Amortization related to the FDIC indemnification assets of $12.0 million and $11.1 million for the nine months ended June 30, 2014 and 2013, respectively, is included as a reduction to interest income.
Investment Portfolio. Interest and dividend income on investments includes income earned on investment securities and FHLB stock. For the first nine months of fiscal year 2014, our investment portfolio consisted primarily of mortgage-backed securities, substantially all of which were residential agency mortgage-backed securities, and U.S. Treasury securities. Interest and dividend income on investments decreased $0.6 million to $21.0 million for the nine months ended June 30, 2014 from $21.6 million for the nine months ended June 30, 2013. The decrease is due to a 9% reduction in the average balance of our investment portfolio, partially offset by a 13 basis point increase in portfolio yield.
Interest Expense
The following table presents interest expense for the nine months ended June 30, 2014 and 2013:
| Nine months ended June 30, |
||||||||
| 2014 | 2013 | |||||||
| (dollars in thousands) | ||||||||
| Interest expense: |
||||||||
| Deposits |
$ | 19,629 | $ | 25,975 | ||||
| Securities sold under agreements to repurchase |
442 | 489 | ||||||
| FHLB advances and other borrowings |
2,591 | 2,158 | ||||||
| Related party notes payable |
690 | 714 | ||||||
| Subordinated debentures and other |
985 | 1,013 | ||||||
|
|
|
|
|
|||||
| Total interest expense |
$ | 24,337 | $ | 30,349 | ||||
|
|
|
|
|
|||||
Total interest expense consists primarily of interest expense on five components: deposits, securities sold under agreements to repurchase, FHLB advances and other borrowings, borrowings from NAB and its affiliates (referred to as related party notes payable), and our outstanding subordinated debentures. Total interest expense for the nine months ended June 30, 2014 decreased by $6.0 million, or 20%, to $24.3 million from $30.3 million for the nine months ended June 30, 2013. During the period, we continued to transition the composition of our deposit portfolio away from higher-cost term deposits toward more cost-effective transaction accounts, which lowered the overall cost of deposits. The average cost of total interest-bearing liabilities for the nine months ended June 30, 2014 and 2013 was 0.42% and 0.54%, respectively. Significant components of interest expense are described in further detail below.
Deposits. Interest expense on deposits, consisting of checking accounts, MMDAs, NOW accounts, savings accounts and CDs, decreased $6.3 million, or 24%, to $19.6 million for the nine months ended June 30, 2014 from $26.0 million for the nine months ended June 30, 2013. The average cost of deposits decreased 13 basis points to 0.37% for the nine months ended June 30, 2014 from 0.50% for the nine months ended June 30, 2013, while average deposit balances increased 3% to $7.13 billion for the first nine months of fiscal 2014 from $6.91 billion for the same period in fiscal year 2013. At June 30, 2014, our total deposits were $7.07 billion, compared with $6.95 billion at September 30, 2013.
Average noninterest-bearing demand account balances accounted for 17% of average total deposits for the nine months ended June 30, 2014 and 2013. Total average other liquid accounts, consisting of MMDAs, NOW accounts and savings accounts, were 56% of average total deposits for the nine months ended June 30, 2014 and 46% for the nine months ended June 30, 2013. CDs were 27% of average total deposits for the nine months ended June 30, 2014 and 37% for the nine months ended June 30, 2013, and the average rate on these deposits decreased 23 basis points from 1.10% to 0.87%. This shift in our deposit composition accounted for much of the improvement in the cost of our deposit funding between these two periods.
80
Table of Contents
FHLB Advances and Other Borrowings. For the nine months ended June 30, 2014 and 2013, interest expense on FHLB advances and other borrowings was $2.6 million and $2.2 million, respectively, representing weighted average cost of 1.11% and 0.98%, respectively. Our total outstanding FHLB advances were $435.0 million at June 30, 2014, and $390.5 million at September 30, 2013. The weighted average contractual rate on our FHLB advances was 0.77% at June 30, 2014, a decrease of 3 basis points compared with 0.80% at June 30, 2013. The average tenor of our FHLB advances was 43 months and 18 months at June 30, 2014 and 2013, respectively. The amount of other borrowings and related interest expense are immaterial in both periods.
We must collateralize FHLB advances by pledging residential real estate loans and investments. We pledge more assets than required by our current level of borrowings in order to maintain additional borrowing capacity. Although we may substitute other loans for such pledged loans, we are restricted in our ability to sell or otherwise pledge these loans without substituting collateral or prepaying a portion of the FHLB advances. At June 30, 2014, we had pledged $2.10 billion of loans to the FHLB.
Subordinated Debentures and Other. Interest expense on our outstanding subordinated debentures was $1.0 million for the nine months ended June 30, 2014 and 2013. At June 30, 2014 and September 30, 2013, the weighted average contractual rate on outstanding subordinated notes was 2.29% and 2.31%, respectively.
Securities Sold Under Agreements to Repurchase; Related Party Notes Payable. Securities sold under agreements to repurchase represent retail purchase agreements with customers and, together with our related party notes payable, represent a small portion of our overall funding profile. The interest expense associated with these two classes of liabilities remained largely consistent period-over-period.
Rate and Volume Variances
Net interest income is affected by changes in both volume and interest rates. Volume changes are caused by increases or decreases during the year in the level of average interest-earning assets and average interest-bearing liabilities. Rate changes result from increases or decreases in the yields earned on assets or the rates paid on liabilities.
81
Table of Contents
The following table presents for the nine months ended June 30, 2014 a summary of the changes in interest income and interest expense resulting from changes in the volume of average asset and liability balances and changes in the average yields or rates compared with the nine months ended June 30, 2013. If significant, the change in interest income or interest expense due to both volume and rate has been prorated between the volume and the rate variances based on the dollar amount of each variance. The table illustrates a trend of continued balance sheet growth, while margins remain under pressure, particularly on the asset side of the balance sheet. The rate impact related to loans in the nine months ended June 30, 2014 is exacerbated by the impact of the change in fair value of fixed-rate loans where we have entered into matching interest rate swaps; absent this change, we experienced continued pressure on loan pricing as a result of strong competition in the markets where we operate and the prolonged low-interest rate environment. The table also illustrates the continuing favorable impact to rate and volume attributes of strategic efforts undertaken to shift the balance of our deposit portfolio away from CDs toward more cost-effective NOW accounts, MMDAs and savings accounts and to more closely monitor deposit pricing and exceptions to rates set internally for specific deposit products.
| Nine months ended June 30, 2014 vs. nine months ended June 30, 2013 |
||||||||||||
| Volume | Rate | Total | ||||||||||
| (dollars in thousands) | ||||||||||||
| Increase (decrease) in interest income: |
||||||||||||
| Cash and due from banks |
$ | 88 | $ | 50 | $ | 138 | ||||||
| Investment securities |
(2,492 | ) | 1,863 | (629 | ) | |||||||
| Loans, other than loans acquired with deteriorated credit quality |
13,099 | 47,863 | 60,962 | |||||||||
| Loans acquired with deteriorated credit quality |
(3,315 | ) | (5,951 | ) | (9,266 | ) | ||||||
| Loans |
9,784 | 41,912 | 51,696 | |||||||||
|
|
|
|
|
|
|
|||||||
| Total increase (decrease) |
7,380 | 43,825 | 51,205 | |||||||||
|
|
|
|
|
|
|
|||||||
| Increase (decrease) in interest expense: |
||||||||||||
| NOW, MMDA & savings accounts |
1,210 | 636 | 1,846 | |||||||||
| CDs |
(4,220 | ) | (3,972 | ) | (8,192 | ) | ||||||
| Securities sold under agreements to repurchase |
(79 | ) | 32 | (47 | ) | |||||||
| FHLB advances and other borrowings |
122 | 311 | 433 | |||||||||
| Related party notes payable |
— | (24 | ) | (24 | ) | |||||||
| Subordinated debentures |
— | (28 | ) | (28 | ) | |||||||
|
|
|
|
|
|
|
|||||||
| Total increase (decrease) |
(2,967 | ) | (3,045 | ) | (6,012 | ) | ||||||
|
|
|
|
|
|
|
|||||||
| Increase (decrease) in net interest income |
$ | 10,347 | $ | 46,870 | $ | (57,217 | ) | |||||
|
|
|
|
|
|
|
|||||||
Provision for Loan Losses
We recognized a net recovery of provision for loan losses of $2.1 million for the nine months ended June 30, 2014 compared to a provision for loan losses of $14.0 million for the nine months ended June 30, 2013, a change of $16.1 million or 115%. The net recovery for the nine months ended June 30, 2014 was driven by a variety of factors, including reductions in incurred loss history and impaired loans requiring specific reserves leading to a $0.1 million credit to expense related to the portion of our loan portfolio that is not subject to purchase accounting implications or for which we have elected the fair value option and a $1.9 million improvement associated with loans acquired with deteriorated credit quality. All loans acquired with deteriorated credit quality for which we recognized an improvement are covered by FDIC loss-sharing arrangements; we had no provision associated with our loans covered by FDIC loss-sharing arrangements other than loans acquired with deteriorated credit quality during the nine months ended June 30, 2014. We believe the reductions in incurred loss history and impaired loans requiring specific reserves during the nine months ended June 30, 2014 are representative of the continued improvement in the overall credit quality of our loan portfolio.
82
Table of Contents
Noninterest Income
The following table presents noninterest income for the nine months ended June 30, 2014 and 2013:
| Nine months ended June 30, |
||||||||
| 2014 | 2013 | |||||||
| (dollars in thousands) | ||||||||
| Noninterest income: |
||||||||
| Service charges and other fees |
$ | 29,728 | $ | 30,927 | ||||
| Net gain on sale of loans |
3,885 | 11,108 | ||||||
| Casualty insurance commissions |
877 | 955 | ||||||
| Investment center income |
1,757 | 2,050 | ||||||
| Net gain on sale of securities |
6 | 1,741 | ||||||
| Trust department income |
2,847 | 2,601 | ||||||
| Net gain from sale of repossessed property and other assets |
2,413 | 2,235 | ||||||
| Other |
4,070 | 7,997 | ||||||
|
|
|
|
|
|||||
| Total noninterest income |
$ | 45,583 | $ | 59,614 | ||||
|
|
|
|
|
|||||
Noninterest income for the nine months ended June 30, 2014 decreased $14.0 million, or 24%, to $45.6 million from $59.6 million for the nine months ended June 30, 2013. The principal drivers of the decrease were a decline in gain on sale of loans stemming from lower mortgage origination volumes as a result of rising interest rates and a decline in gains on sale of investment securities. Significant components of noninterest income are described in further detail below.
Service Charges and Other Fees. Service charges and other fees are primarily fees charged to deposit customers, including overdrawn/non-sufficient funds, or OD/NSF, fees, commercial deposit account analysis and other charges, and ATM interchange and foreign activity fees. Service charges and other fees decreased to $29.7 million in the nine months ended June 30, 2014 from $30.9 million in the nine months ended June 30, 2013, a decrease of 4%. The decrease was primarily driven by a $1.7 million reduction in net OD/NSF fees, partially offset by higher commercial checking fee income. As a subsidiary of NAB, we are subject to the limitations on permissible interchange fees contained in the Durbin Amendment to the Dodd-Frank Act, and its implementing regulations, which are reflected in the ATM interchange income we generated during the first nine months of fiscal years 2014 and 2013. We estimate that the annual impact of this limitation is approximately $6.0 million.
Net Gain on Sale of Loans. The net gain on the sale of $146.3 million in aggregate principal balance of loans was $3.9 million for the nine months ended June 30, 2014. In comparison, the net gain on sale of loans was $11.1 million on loan sales of $355.4 million for the nine months ended June 30, 2013. Our average net gain as a percentage of loans sold decreased nearly 20% between the two periods. Our loan sale activity in 2014 and 2013 has primarily been the sale of conforming residential mortgage loans to FNMA, other commercial banks and, to a lesser extent, various state-sponsored first-time homebuyer programs. Net gain on sales of loans fluctuates with the volume of loans sold, the type of loans sold and market conditions, such as the current interest rate environment. The volume of loans that we sell depends upon conditions in the mortgage origination, loan securitization and secondary loan sale markets. We have seen a substantial decline in overall mortgage loan volumes for the nine months ended June 30, 2014 compared to the nine months ended June 30, 2013. The decline is primarily related to refinance volumes, which we believe are impacted by an increase in national mortgage interest rates and in home prices across our footprint and by our customers’ ability and willingness to refinance based on these factors. Specifically, we believe that the majority of our existing and potential customers with qualifying home equity took advantage of historically low mortgage rates from 2011 through mid-2013 to refinance and lock in lower rates on fixed-rate loans; as rates have risen, fewer potential borrowers have incentive to refinance. Volumes for home purchase transactions have remained much more consistent over the same periods.
83
Table of Contents
Net Gain on Sale of Securities. Net gain on sale of securities represents the difference between gross sale proceeds and carrying value at amortized cost of investment securities sold during the period. We received total proceeds of $49.4 million related to security sales during the nine months ended June 30, 2013, generating net gains of $1.7 million, compared to proceeds of $4.5 million generating a negligible net gain in the nine months ended June 30, 2014.
Net Gain from Sale of Repossessed Property and Other Assets. Our net gain on the sale of repossessed property and other assets was $2.4 million for the nine months ended June 30, 2014, an increase of $0.2 million from $2.2 million for the nine months ended June 30, 2013. The total value of assets sold and average sales price relative to carrying value remained consistent between the two periods.
Other income. Other income includes rental income derived from leasing certain portions of bank-owned real estate, vendor incentive payments and other miscellaneous income items. Other income decreased to $4.1 million in the nine months ended June 30, 2014 from $8.0 million in the nine months ended June 30, 2013, a decrease of 49%. The decrease was primarily driven by a decline in vendor incentive payments recognized and lower rental income.
Noninterest Expense
The following table presents noninterest expense for the nine months ended June 30, 2014 and 2013:
| Nine months ended June 30, |
||||||||
| 2014 | 2013 | |||||||
| (dollars in thousands) | ||||||||
| Noninterest expense: |
||||||||
| Salaries and employee benefits |
$ | 71,176 | $ | 76,123 | ||||
| Occupancy expenses, net |
13,613 | 13,919 | ||||||
| Data processing |
14,105 | 13,749 | ||||||
| Equipment expenses |
3,099 | 3,361 | ||||||
| Advertising |
3,385 | 4,684 | ||||||
| Communication expenses |
3,402 | 3,585 | ||||||
| Professional fees |
9,623 | 8,855 | ||||||
| Derivatives, net (gain) loss |
12,119 | (41,635 | ) | |||||
| Amortization of core deposits and other intangibles |
13,448 | 14,600 | ||||||
| Other |
22,466 | 18,947 | ||||||
|
|
|
|
|
|||||
| Total noninterest expense |
$ | 166,436 | $ | 116,188 | ||||
|
|
|
|
|
|||||
Our noninterest expense consists primarily of salaries and employee benefits, net occupancy expenses, data processing, professional fees, net gain or loss on derivatives and the amortization of core deposits and other intangibles. Noninterest expense increased by $50.2 million, or 43%, to $166.4 million for the nine months ended June 30, 2014 from $116.2 million for the nine months ended June 30, 2013. The increase was driven by a $53.8 million change in derivatives, net (gain) loss, which is offset by a corresponding increase in net interest income related to our fair value loans. Adjusted for this variance, our adjusted noninterest expenses decreased 2% to $140.9 million for the nine months ended June 30, 2014 from $143.2 million for the nine months ended June 30, 2013, and our adjusted efficiency ratio was 51.4% for the nine months ended June 30, 2014, compared with 50.4% for the nine months ended June 30, 2013. For more information on these non-GAAP financial measures, including a reconciliation of each to the most directly comparable GAAP financial measures, see “Prospectus Summary—Summary Historical Consolidated Financial and Operating Information.” The remaining portion of the reduction in noninterest expenses was driven by focused expense control across our organization, most notably a $4.9 million reduction in salaries and benefit costs due to a net closure of 17 branches between June 30, 2013 and June 30, 2014, and efforts to streamline our retail structure. Significant components of noninterest expense are described in further detail below.
84
Table of Contents
Salaries and Employee Benefits. Salaries and related benefits is the largest component of noninterest expense and includes the cost of incentive compensation, benefit plans, health insurance and payroll taxes. These expenses were $71.2 million for the nine months ended June 30, 2014, a 6% decrease from $76.1 million for the nine months ended June 30, 2013. The decrease was primarily due to lower salary costs driven by the net closure of 17 branches, as previously discussed, and disciplined management of staffing levels across our business.
Occupancy Expenses, Net. Occupancy costs were $13.6 million for the nine months ended June 30, 2014, a 2% decrease from $13.9 million for the nine months ended June 30, 2013. Occupancy expenses relate to our branch network and administrative office locations throughout our footprint, including both owned and leased locations. Both rent expense and depreciation expense declined period-over-period, primarily as a result of the net closure of 17 branch locations as previously discussed.
Data Processing. These expenses include payments to vendors who provide software, data processing and services on an outsourced basis, costs related to supporting and developing Internet-based activities and depreciation of bank-owned hardware and software. Expenses for data processing were $14.1 million for the nine months ended June 30, 2014, a 3% increase from $13.7 million for the nine months ended June 30, 2013. The increase was attributable to higher software expenses, primarily related to mobile and online product offerings, and higher credit card processing charges due to increased volume.
Advertising. Advertising expenses have declined by $1.3 million to $3.4 million for the nine months ended June 30, 2014. The decrease was a result of more focused marketing campaigns and altered timing of spending.
Professional Fees. Professional fees include legal services required to complete transactions, resolve legal matters or delinquent loans, our FDIC and FICO assessments and the cost of accountants and other consultants. These expenses were $9.6 million for the nine months ended June 30, 2014, compared to $8.9 million for the same period of fiscal year 2013, an increase of 9%, as lower legal fees were offset by costs related to preparing for this offering and new assessments imposed by NAB in connection with compliance costs associated with rules implementing various provisions of the Dodd-Frank Act incurred by NAB or its other U.S. subsidiaries.
Derivatives, Net (Gain) Loss. In the normal course of business, we use interest rate swaps to manage our interest rate risk. These interest rate swap agreements are entered into in order to facilitate the risk management strategies of a small number of commercial real estate, commercial non-real estate and agriculture fixed-rate loan customers with original maturities of 5 years or greater, and typically 5 to 15 years. We mitigate this risk by entering into equal and offsetting interest rate swap agreements with NAB. The related interest rate swaps are recognized as either assets or liabilities in our financial statements, and any gains or losses on these swaps are recorded in earnings as a component of noninterest expense. These arrangements resulted in a $12.1 million net loss for the nine months ended June 30, 2014 compared to a $41.6 million net gain for the nine months ended June 30, 2013, a fluctuation of $53.8 million, which is offset by a corresponding change in net interest income related to our fair value loans. For more information on these accounting arrangements, including the accounting for the related fixed-term loans, see “—Key Factors Affecting Our Business and Financial Statements—Loans and Interest Rates Swaps Accounted for at Fair Value.”
Amortization of Core Deposits and Other Intangibles. Amortization of core deposits and other intangibles represents the scheduled amortization of specifically identifiable intangible assets arising from acquisitions, including NAB’s acquisition of us as well as subsequent acquisitions completed by us. The most significant component of amortization of core deposits and other intangibles relates to core deposit intangible assets, which represented $11.6 million for the nine months ended June 30, 2014 compared to $12.8 million for the nine months ended June 30, 2013. Total scheduled amortization for all intangible assets includes approximately $16 million for the full fiscal year 2014, approximately $7 million for fiscal year 2015, approximately $3 million for fiscal year 2016 and immaterial amounts for fiscal years 2017 through 2023.
Other. Other noninterest expenses include costs related to OREO, business development and professional membership fees, travel and entertainment costs and costs specific to integrating newly-acquired banks. Other
85
Table of Contents
noninterest expenses increased from $18.9 million for the nine months ended June 30, 2013 to $22.5 million for the nine months ended June 30, 2014, an increase of 19%. The increase was primarily driven by a $7.0 million increase in net OREO costs, from $3.7 million for the nine months ended June 30, 2013 to $10.7 million for the nine months ended June 30, 2014, largely related to the valuation of a single longstanding development loan that was foreclosed during fiscal year 2014, and was partially offset by lower travel and entertainment and office supply costs as well as a reduction in costs related to developing an enhanced customer rating system and methodology.
Provision for Income Taxes
Our provision for income taxes varies due to the amount of taxable income, the availability of tax-advantaged income and tax credits and the rates charged by federal and state authorities. Our provision for income taxes of $41.6 million for the nine months ended June 30, 2014 represents an effective tax rate of 35.0%, compared with $39.7 million or 36.2% for the nine months ended June 30, 2013, with the decrease in rate primarily due to a larger amount of tax-exempt interest and the mix of state and local taxes we recognized. We have historically calculated our provision for income taxes as though we were a standalone company. As a result, we do not expect any material changes in our provisioning for income taxes following the completion of this offering.
86
Table of Contents
Results of Operations—Fiscal Years Ended September 30, 2013 and September 30, 2012
Overview
The following table highlights certain key financial and performance information at and for the years ended September 30, 2013 and 2012:
| Fiscal year ended September 30, |
||||||||
| 2013 | 2012 | |||||||
| (dollars in thousands) | ||||||||
| Operating Data: |
||||||||
| Interest and dividend income |
$ | 294,257 | $ | 344,304 | ||||
| Interest expense |
39,161 | 50,971 | ||||||
| Noninterest income |
77,692 | 88,975 | ||||||
| Noninterest expense |
171,073 | 235,010 | ||||||
| Provision for loan losses |
11,574 | 30,145 | ||||||
| Net income |
96,243 | 72,995 | ||||||
| Cash net income(1) |
112,289 | 89,397 | ||||||
| Performance Ratios: |
||||||||
| Net interest margin |
3.24 | % | 3.98 | % | ||||
| Adjusted net interest margin(1) |
3.76 | % | 3.72 | % | ||||
| Return on average total assets |
1.07 | % | 0.85 | % | ||||
| Return on average tangible common equity(1) |
17.5 | % | 15.0 | % | ||||
| Adjusted efficiency ratio(1) |
51.0 | % | 53.7 | % | ||||
| At and for the fiscal year ended September 30, |
||||||||
| 2013 | 2012 | |||||||
| (dollars in thousands) | ||||||||
| Balance Sheet and Other Information: |
||||||||
| Total assets |
$ | 9,134,258 | $ | 9,008,252 | ||||
| Loans(2) |
6,362,673 | 6,138,574 | ||||||
| Allowance for loan losses |
55,864 | 71,878 | ||||||
| Deposits |
6,948,208 | 6,884,515 | ||||||
| Stockholder’s equity |
1,417,214 | 1,388,563 | ||||||
| Tangible common equity(1) |
642,156 | 595,920 | ||||||
| Tier 1 capital ratio |
12.4 | % | 11.9 | % | ||||
| Total capital ratio |
13.8 | % | 13.7 | % | ||||
| Tier 1 leverage ratio |
9.2 | % | 8.3 | % | ||||
| Tangible common equity / tangible assets(1) |
8.2 | % | 7.8 | % | ||||
| Nonperforming loans / total loans(3) |
1.28 | % | 1.53 | % | ||||
| Net charge-offs / average total loans |
0.44 | % | 0.54 | % | ||||
| Allowance for loan losses / total loans |
0.88 | % | 1.17 | % | ||||
| (1) | This is a non-GAAP financial measure. For more information on this non-GAAP financial measure, including a reconciliation to the most directly comparable GAAP financial measure, see “Prospectus Summary—Summary Historical Consolidated Financial and Operating Information.” |
| (2) | Loans include unpaid principal balance net of unamortized discount on acquired loans and unearned net deferred fees and costs and loans in process. |
| (3) | Nonperforming loans excludes loans covered by FDIC loss-sharing arrangements. |
Our total assets were $9.13 billion at September 30, 2013, compared with $9.01 billion at September 30, 2012. The increase in total assets from September 30, 2012 was principally attributable to organic loan growth, partially offset by a reduction in the investment portfolio. At September 30, 2013, loans as shown above were $6.36 billion,
87
Table of Contents
an increase of $224.1 million, or 4%, from $6.14 billion for the fiscal year ended September 30, 2012, primarily due to growth in agricultural and commercial lending. In our most recent fiscal year, total deposits grew 1% to $6.95 billion from September 30, 2012 to September 30, 2013.
For the fiscal year ended September 30, 2013:
| • | net income was $96.2 million, an increase of $23.2 million, or 32%, compared with fiscal year 2012, and cash net income was $112.3 million, an increase of $22.9 million from $89.4 million for fiscal year 2012, in each case due in large part to continued improvement in the overall credit quality of our lending portfolio, leading to lower net charge-offs compared to fiscal year 2012 and an $18.6 million pre-tax reduction in provision for loan losses; |
| • | net interest margin was 3.24%, a decrease of 74 basis points compared with fiscal year 2012, however, our adjusted net interest margin increased 4 basis points to 3.76% compared with fiscal year 2012. The decrease in our net interest margin was primarily attributable to changes in fair value associated with certain of our long-term loans measured at fair value where we have entered into interest rate swaps, while the increase in our adjusted net interest margin was primarily due to cost reductions from our strategic efforts undertaken to transition the composition of our deposit portfolio away from higher- cost term deposits toward more cost-effective transaction accounts; |
| • | net interest income was $255.1 million, a decrease of $38.2 million, or 13%, compared with fiscal year 2012, and our adjusted net interest income was $295.4 million, an 8% increase compared with fiscal year 2012. The increase in our adjusted net interest income is primarily due to 7% growth in average interest-earning assets, which outpaced 6% growth in interest-bearing liabilities. The decline in our net interest income was primarily attributable to changes in fair value associated with certain of our long- term loans measured at fair value where we have entered into interest rate swaps; |
| • | provision for loan losses was $11.6 million, a decrease of $18.6 million, or 62%, compared with fiscal year 2012. The decrease was driven by continued improvement in our incurred loss history and reductions in impaired loans requiring specific reserves for loan losses; |
| • | noninterest income was $77.7 million, a decrease of $11.3 million, or 13%, compared with fiscal year 2012, due in large part to a $6.4 million decrease in gains on sales of investment securities and a $4.0 million bargain purchase gain recorded on the purchase of North Central Bancshares, Inc. in fiscal year 2012, which was not a recurring item; |
| • | noninterest expense was $171.1 million, a decrease of $63.9 million, or 27%, compared with fiscal year 2012, and our adjusted noninterest expense decreased 2% compared with fiscal year 2012, driven in each case by our focus on right-sizing our branch footprint, continued devotion of resources to process improvement initiatives across the organization and a decrease in our net OREO carrying costs and, in the case of our noninterest expense, by changes in fair value associated with certain of our interest rate swaps used to manage interest rate risk associated with some of our long-term loans measured at fair value; and |
| • | return on average total assets increased 22 basis points, from 0.85% for fiscal year 2012 to 1.07% for fiscal year 2013, while return on average tangible common equity increased from 15.0% to 17.5% over the same period. |
Our cash net income, adjusted net interest margin, adjusted net interest income, adjusted noninterest expense and return on average tangible common equity discussed above are all non-GAAP financial measures. For more information on these financial measures, including a reconciliation to the most directly comparable GAAP financial measures, see “Prospectus Summary—Summary Historical Consolidated Financial and Operating Information.”
88
Table of Contents
Net Interest Income
The following table presents net interest income, net interest margin and adjusted net interest margin for fiscal years 2013 and 2012:
| Fiscal year ended September 30, |
||||||||
| 2013 | 2012 | |||||||
| (dollars in thousands) | ||||||||
| Net interest income: |
||||||||
| Total interest and dividend income |
$ | 294,257 | $ | 344,304 | ||||
| Less: Total interest expense |
39,161 | 50,971 | ||||||
|
|
|
|
|
|||||
| Net interest income |
255,096 | 293,333 | ||||||
| Less: Provision for loan losses |
11,574 | 30,145 | ||||||
|
|
|
|
|
|||||
| Net interest income after provisions for loan losses |
$ | 243,522 | $ | 263,188 | ||||
|
|
|
|
|
|||||
| Net interest margin and adjusted net interest margin: |
||||||||
| Average interest-earning assets |
$ | 7,862,860 | $ | 7,367,085 | ||||
| Average interest-bearing liabilities |
7,560,749 | 7,149,294 | ||||||
| Net interest margin |
3.24 | % | 3.98 | % | ||||
| Adjusted net interest margin(1) |
3.76 | % | 3.72 | % | ||||
| (1) | This is a non-GAAP financial measure. For more information on this financial measure, including a reconciliation to the most directly comparable GAAP financial measure, see “Prospectus Summary—Summary Historical Consolidated Financial and Operating Information.” |
Net interest income was $255.1 million in fiscal year 2013, a decrease of $38.2 million, or 13%, from $293.3 million in fiscal year 2012. Net of the impact of the change in fair value on fixed-rate loans measured at fair value where we have entered into matching interest rate swaps, adjusted net interest income increased to $295.4 million in fiscal year 2013 from $274.0 million in fiscal year 2012, an increase of 8%. Our average interest-earning assets grew 7% in fiscal year 2013, while our average interest-bearing liabilities grew 6% during the period. In fiscal year 2013, the average yield on interest-earning assets decreased 93 basis points to 3.74% while the average rate on interest-bearing liabilities decreased 19 basis points to 0.52%. Net interest margin was 3.24% in fiscal year 2013, compared with 3.98% in fiscal year 2012. Adjusted net interest margin remained relatively flat, increasing 4 basis points to 3.76% compared with the fiscal year 2012. For more information on our adjusted net interest margin, including a reconciliation to the most directly comparable GAAP financial measure, see “Prospectus Summary—Summary Historical Consolidated Financial and Operating Information.”
The following table presents the distribution of average assets, liabilities and equity, interest income and resulting yields on average interest-earning assets, and interest expense and rates on average interest-bearing liabilities for each of the last three fiscal years. Loans on nonaccrual status, totaling $81.5 million at September 30, 2013, $93.8 million at September 30, 2012 and $143.2 million at September 30, 2011 are included in the average balances below. Any interest that had accrued as of the date of nonaccrual is immediately reversed as a reduction to interest income, while any interest subsequently recovered is recorded in the period of recovery. Tax-exempt loans and securities, totaling $340.2 million at September 30, 2013, $273.9 million at September 30, 2012 and $95.1 million at September 30, 2011, are typically entered at lower interest rate arrangements than comparable non-exempt loans and securities. Interest income earned on these assets is presented below at contractual rate, as opposed to a tax equivalent yield concept, with any tax benefit realized presented in the provision for income taxes and reflected in the effective tax rate for the period. Loans acquired with deteriorated credit quality represent loans accounted for in accordance with ASC 310-30 Accounting for Purchased Loans that were credit impaired at the time we acquired them. Loans other than loans acquired with deteriorated credit quality represent loans we have originated and loans we have acquired that were not credit impaired at the time we acquired them.
89
Table of Contents
| Fiscal year ended September 30, | ||||||||||||||||||||||||||||||||||||
| 2013 | 2012 | 2011 | ||||||||||||||||||||||||||||||||||
| Average Balance |
Interest | Yields/ Rates |
Average Balance |
Interest | Yields/ Rates |
Average Balance |
Interest | Yields/ Rates |
||||||||||||||||||||||||||||
| (dollars in thousands) | ||||||||||||||||||||||||||||||||||||
| Assets: |
||||||||||||||||||||||||||||||||||||
| Cash and due from banks |
$ | 132,517 | $ | 336 | 0.25 | % | $ | 141,722 | $ | 331 | 0.23 | % | $ | 183,603 | $ | 682 | 0.37 | % | ||||||||||||||||||
| Investment securities |
1,575,343 | 29,588 | 1.88 | % | 1,746,789 | 33,791 | 1.93 | % | 1,607,413 | 38,977 | 2.42 | % | ||||||||||||||||||||||||
| Loans, other than acquired with deteriorated credit quality, net(1) |
5,876,116 | 249,527 | 4.25 | % | 5,093,013 | 291,692 | 5.73 | % | 4,536,907 | 288,997 | 6.37 | % | ||||||||||||||||||||||||
| Loans acquired with deteriorated credit quality, net |
278,884 | 14,806 | 5.31 | % | 385,561 | 18,490 | 4.80 | % | 631,714 | 49,102 | 7.77 | % | ||||||||||||||||||||||||
|
|
|
|
|
|
|
|
|
|
|
|
|
|||||||||||||||||||||||||
| Loans, net |
6,155,000 | 264,333 | 4.29 | % | 5,478,574 | 310,182 | 5.66 | % | 5,168,621 | 338,099 | 6.54 | % | ||||||||||||||||||||||||
|
|
|
|
|
|
|
|
|
|
|
|
|
|||||||||||||||||||||||||
| Total interest-earning assets |
7,862,860 | 294,257 | 3.74 | % | 7,367,085 | 344,304 | 4.67 | % | 6,959,637 | 377,758 | 5.43 | % | ||||||||||||||||||||||||
| Other noninterest-earning assets |
1,158,231 | 1,210,866 | 1,319,781 | |||||||||||||||||||||||||||||||||
|
|
|
|
|
|
|
|||||||||||||||||||||||||||||||
| Total Assets |
$ | 9,021,091 | $ | 294,257 | 3.26 | % | $ | 8,577,951 | $ | 344,304 | 4.01 | % | $ | 8,279,418 | $ | 377,758 | 4.56 | % | ||||||||||||||||||
|
|
|
|
|
|
|
|
|
|
|
|
|
|||||||||||||||||||||||||
| Liabilities and Equity: |
||||||||||||||||||||||||||||||||||||
| Non-interest demand deposits |
$ | 1,159,581 | $ | 973,551 | $ | 792,392 | ||||||||||||||||||||||||||||||
| NOW, MMDA and savings deposits |
3,296,745 | $ | 6,921 | 0.21 | % | 2,748,001 | $ | 6,967 | 0.25 | % | 2,430,520 | $ | 7,925 | 0.33 | % | |||||||||||||||||||||
| CDs |
2,447,553 | 26,196 | 1.07 | % | 2,799,666 | 37,449 | 1.34 | % | 3,222,237 | 51,784 | 1.61 | % | ||||||||||||||||||||||||
|
|
|
|
|
|
|
|
|
|
|
|
|
|||||||||||||||||||||||||
| Total deposits |
6,903,879 | 33,117 | 0.48 | % | 6,521,218 | 44,416 | 0.68 | % | 6,445,149 | 59,709 | 0.93 | % | ||||||||||||||||||||||||
|
|
|
|
|
|
|
|
|
|
|
|
|
|||||||||||||||||||||||||
| Securities sold under agreements to repurchase |
230,516 | 644 | 0.28 | % | 226,955 | 1,014 | 0.45 | % | 267,296 | 1,253 | 0.47 | % | ||||||||||||||||||||||||
| FHLB advances and other borrowings |
328,976 | 3,103 | 0.94 | % | 303,743 | 3,098 | 1.02 | % | 140,297 | 2,962 | 2.11 | % | ||||||||||||||||||||||||
| Related party notes payable |
41,295 | 950 | 2.30 | % | 41,295 | 1,007 | 2.44 | % | 48,295 | 930 | 1.93 | % | ||||||||||||||||||||||||
| Subordinated debentures and other |
56,083 | 1,347 | 2.40 | % | 56,083 | 1,436 | 2.56 | % | 56,083 | 1,369 | 2.44 | % | ||||||||||||||||||||||||
|
|
|
|
|
|
|
|
|
|
|
|
|
|||||||||||||||||||||||||
| Total borrowings |
656,870 | 6,044 | 0.92 | % | 628,076 | 6,555 | 1.04 | % | 511,971 | 6,514 | 1.27 | % | ||||||||||||||||||||||||
|
|
|
|
|
|
|
|
|
|
|
|
|
|||||||||||||||||||||||||
| Total interest-bearing liabilities |
7,560,749 | 39,161 | 0.52 | % | 7,149,294 | 50,971 | 0.71 | % | 6,957,120 | 66,223 | 0.95 | % | ||||||||||||||||||||||||
|
|
|
|
|
|
|
|||||||||||||||||||||||||||||||
| Noninterest-bearing other liabilities |
80,047 | 76,587 | 78,320 | |||||||||||||||||||||||||||||||||
| Equity |
1,380,295 | 1,352,070 | 1,243,978 | |||||||||||||||||||||||||||||||||
|
|
|
|
|
|
|
|||||||||||||||||||||||||||||||
| Total Liabilities and Equity |
$ | 9,021,091 | $ | 8,577,951 | $ | 8,279,418 | ||||||||||||||||||||||||||||||
|
|
|
|
|
|
|
|||||||||||||||||||||||||||||||
| Net interest spread |
2.73 | % | 3.30 | % | 3.61 | % | ||||||||||||||||||||||||||||||
| Net interest income and net interest margin |
$ | 255,096 | 3.24 | % | $ | 293,333 | 3.98 | % | $ | 311,535 | 4.48 | % | ||||||||||||||||||||||||
|
|
|
|
|
|
|
|||||||||||||||||||||||||||||||
| Adjusted net interest income and adjusted net interest margin(2) |
$ | 295,401 | 3.76 | % | $ | 273,964 | 3.72 | % | $ | 299,287 | 4.30 | % | ||||||||||||||||||||||||
|
|
|
|
|
|
|
|||||||||||||||||||||||||||||||
| (1) | Interest income includes ($40.3) million, $19.4 million and $12.2 million for fiscal years 2013, 2012 and 2011, respectively, resulting from changes in fair value of certain of our fixed-rate loans where we have entered into matching fixed-to-floating interest rate swaps, and $1.1 million, $6.3 million and $12.2 million for fiscal years 2013, 2012 and 2011, respectively, resulting from accretion of purchase accounting discount associated with acquired loans. |
| (2) | These are non-GAAP financial measures. For more information on these financial measures, including a reconciliation to the most directly comparable GAAP financial measures, see “Prospectus Summary—Summary Historical Consolidated Financial and Operating Information.” |
90
Table of Contents
Interest and Dividend Income
The following table presents interest and dividend income for fiscal years 2013 and 2012:
| Fiscal year ended September 30, |
||||||||
| 2013 | 2012 | |||||||
| (dollars in thousands) | ||||||||
| Interest and dividend income: |
||||||||
| Loans |
$ | 264,333 | $ | 310,182 | ||||
| Taxable securities |
28,552 | 32,581 | ||||||
| Nontaxable securities |
127 | 180 | ||||||
| Dividends on securities |
909 | 1,030 | ||||||
| Federal funds sold and other |
336 | 331 | ||||||
|
|
|
|
|
|||||
| Total interest and dividend income |
$ | 294,257 | $ | 344,304 | ||||
|
|
|
|
|
|||||
Total interest and dividend income consists primarily of interest income on loans and interest and dividend income on our investment portfolio. Total interest and dividend income for fiscal year 2013 decreased by $50.0 million, or 15%, to $294.3 million from $344.3 million for fiscal year 2012. Significant components of interest and dividend income are described in further detail below.
Loans. Interest income on all loans decreased to $264.3 million in fiscal year 2013 from $310.2 million in fiscal year 2012, a decrease of 15% during fiscal year 2013. In particular, interest income on our loans, other than loans acquired with deteriorated credit quality, decreased $42.2 million, or 14%, to $249.5 million for fiscal year 2013 from $291.7 million for fiscal year 2012. The most significant driver of the decrease in interest income on loans was a $59.7 million difference in the net fair value change due to movements in interest rates on fixed-rate loans measured at fair value where we had entered into matching interest rate swaps. Adjusted for the impact related to the net increase in fair value of these loans involving matching fixed-to-floating interest rate swaps, our interest income on loans, other than loans acquired with deteriorated credit quality, increased $17.5 million, or 6%, primarily as a result of growth in this portion of our loan portfolio. Interest income on loans acquired with deteriorated credit quality decreased $3.7 million, or 20%, to $14.8 million for fiscal year 2013 from $18.5 million for fiscal year 2012, primarily as a result of continued runoff in this portion of our loan portfolio.
Our yield on loans is affected by market rates, the level of adjustable-rate loan indices, interest rate floors and caps, customer repayment activity, the level of loans held for sale, portfolio mix, movement in the fair value of long-term fixed-rate loans accounted for under ASC 825 Fair Value Option, and the level of nonaccrual loans. The average yield on loans, other than loans acquired with deteriorated credit quality, was 4.25% for fiscal year 2013, a decrease of 148 basis points from 5.73% for fiscal year 2012. Adjusted for the impact related to the fair value of certain of our fixed-rate loans where we have entered into matching fixed-to-floating interest rate swaps, the average yield on our loans, other than loans acquired with deteriorated credit quality, for fiscal year 2013 was 4.93%, a decrease of 42 basis points from 5.35% for fiscal year 2012. This decrease is attributable to the competitive interest rate environment for high quality commercial and agricultural credits across our footprint. The average yield on loans acquired with deteriorated credit quality was 5.31% for fiscal year 2013, an increase of 51 basis points from 4.80% for fiscal year 2012.
Average net loan balances for fiscal year 2013 were $6.16 billion, compared to $5.48 billion for fiscal year 2012, an increase of $676.4 million, or 12%. Growth in our loan portfolio is attributable to our acquisition of North Central Bancshares, Inc. in June 2012, which contributed approximately $311.6 million of outstanding loan balances, as well as organic growth through the year, primarily in our agriculture and commercial non-real estate loan categories.
Loan-related fee income of $9 million is included in interest income for fiscal year 2013 compared to $8 million for fiscal year 2012. In addition, certain fees collected at loan origination are considered to be a component of yield on
91
Table of Contents
the underlying loans and are deferred and recognized into income over the life of the loans. Amortization related to the FDIC indemnification assets of $17.6 million and $21.7 million for fiscal years 2013 and 2012, respectively, is included as a reduction to interest income.
Investment Portfolio. Interest and dividend income on investments includes income earned on investment securities and FHLB stock. In fiscal year 2013, our investment portfolio consisted primarily of mortgage-backed securities, substantially all of which were residential agency mortgage-backed securities. Interest and dividend income on investments decreased to $29.6 million in fiscal year 2013, from $33.8 million in fiscal year 2012, a decrease of 12%. The average balance in our investment portfolio was $1.58 billion in fiscal year 2013 and $1.75 billion in fiscal year 2012, a decrease of 10%, while the average yield decreased from 1.93% to 1.88%, a decrease of five basis points. The volume decrease is due to overall balance sheet composition, as the loan portfolio grew faster than the deposit portfolio, with the investment portfolio decreased to balance liquidity and funding requirements. Due to the rate environment and specific securities available in the market, funds from maturing securities and new funds available for investment in fiscal year 2012 and the first half of fiscal year 2013 were invested in purchases of new holdings of investment securities that generated much lower yields than the previous return levels in the portfolio, leading to lower total income and lower weighted yields. The weighted average life of the portfolio was 3.9 years and 2.6 years at September 30, 2013 and 2012, respectively. Average investments in fiscal years 2013 and 2012 were 20% and 24%, respectively, of total average interest-earning assets. As of September 30, 2013, the carrying value of investment securities and FHLB stock was $1.51 billion compared with $1.61 billion as of September 30, 2012.
Interest Expense
The following table presents interest expense for fiscal years 2013 and 2012:
| Fiscal year ended September 30, |
||||||||
| 2013 | 2012 | |||||||
| (dollars in thousands) | ||||||||
| Interest expense: |
||||||||
| Deposits |
$ | 33,117 | $ | 44,416 | ||||
| Securities sold under agreements to repurchase |
644 | 1,014 | ||||||
| FHLB advances and other borrowings |
3,103 | 3,098 | ||||||
| Related party notes payable |
950 | 1,007 | ||||||
| Subordinated debentures and other |
1,347 | 1,436 | ||||||
|
|
|
|
|
|||||
| Total interest expense |
$ | 39,161 | $ | 50,971 | ||||
|
|
|
|
|
|||||
Total interest expense consists primarily of interest expense on five components: deposits, securities sold under agreements to repurchase, FHLB advances and other borrowings, related party notes payable and our outstanding subordinated debentures. Total interest expense decreased to $39.2 million in fiscal year 2013, from $51.0 million in fiscal year 2012, a decrease of $11.8 million, or 23%. Average interest-bearing liabilities increased to $7.56 billion in fiscal year 2013 from $7.15 billion in fiscal year 2012, an increase of $0.41 billion, or 6%. The average cost of total interest-bearing liabilities decreased to 0.52% in fiscal year 2013, compared with 0.71% in fiscal year 2012. Significant components of interest expense are described in further detail below.
Deposits. Interest expense on deposits, consisting of checking accounts, MMDAs, NOW accounts, savings accounts and CDs, was $33.1 million in fiscal year 2013 compared with $44.4 million in fiscal year 2012, a decrease of $11.3 million, or 25%. Average deposit balances were $6.90 billion in fiscal year 2013, compared with $6.52 billion for fiscal year 2012. Our average deposits increased 6% during fiscal year 2013, and the average rate paid on deposits decreased 20 basis points to 0.48% during fiscal year 2013. At September 30, 2013, our total deposits were $6.95 billion, an increase of 1% compared to September 30, 2012.
92
Table of Contents
Average non-interest-bearing demand account balances comprised 17% of average total deposits for fiscal year 2013, compared with 15% for fiscal year 2012. Total average other liquid accounts, consisting of money market and savings accounts, increased in fiscal year 2013 to 48% of total average deposits from 42% in fiscal year 2012, while CD accounts decreased in fiscal year 2013 to 35% of total average deposits from 43% in fiscal year 2012. This shift in our deposit composition accounted for much of the improvement in the cost of our deposit funding between these two periods.
FHLB Advances and Other Borrowings. Interest expense on FHLB advances and other borrowings was $3.1 million for both fiscal year 2013 and fiscal year 2012, reflecting weighted average cost of 0.94% and 1.02%, respectively. Our average balance for FHLB advances and other borrowings increased to $329.0 million in fiscal year 2013 from $303.7 million in fiscal year 2012, an increase of 8%. The average rate paid on these liabilities decreased 8 basis points in fiscal year 2013 to 0.94%. Average FHLB advances and other borrowings as a proportion of total average interest-bearing liabilities were 4% for both fiscal year 2013 and for fiscal year 2012. The average rate paid on FHLB advances is impacted by market rates and the various terms and repricing frequency of the specific outstanding borrowings in each year. Our total outstanding FHLB advances were $390.5 million at September 30, 2013 compared with $305.5 million at September 30, 2012. The weighted average contractual rate paid on our FHLB advances was 1.05% at September 30, 2013 and 1.04% at September 30, 2012, an increase of one basis point over the year. The average tenor of our FHLB advances was 25 months and 10 months at September 30, 2013 and 2012, respectively. The amount of other borrowings and related interest expense are immaterial in both periods.
We must collateralize FHLB advances by pledging real estate loans or investments. We pledge more assets than required by our current level of borrowings in order to maintain additional borrowing capacity. Although we may substitute other loans for such pledged loans, we are restricted in our ability to sell or otherwise pledge these loans without substituting collateral or prepaying a portion of the FHLB advances. At September 30, 2013, we had pledged $1.99 billion of loans to the FHLB, against which we had borrowed $390.5 million.
Subordinated Debentures and Other. Interest expense on our outstanding subordinated debentures was $1.3 million and $1.4 million for fiscal years 2013 and 2012, respectively. At September 30, 2013 and September 30, 2012, the weighted average contractual rate on outstanding subordinated notes was 2.31% and 2.45%, respectively.
Securities Sold Under Agreements to Repurchase; Related Party Notes Payable. Securities sold under agreements to repurchase represent retail repurchase agreements with customers and, together, with our related party notes payable, represent a small portion of our overall funding profile. The interest expense associated with these two classes of liabilities remained largely consistent period-over-period.
Rate and Volume Variances
Net interest income is affected by changes in both volume and interest rates. Volume changes are caused by increases or decreases during the year in the level of average interest-earning assets and average interest-bearing liabilities. Rate changes result from increases or decreases in the yields earned on assets or the rates paid on liabilities.
The following table presents for each of the last two fiscal years a summary of the changes in interest income and interest expense resulting from changes in the volume of average asset and liability balances and changes in the average yields or rates compared with the preceding fiscal year. If significant, the change in interest income or interest expense due to both volume and rate has been prorated between the volume and the rate variances based on the dollar amount of each variance. The table illustrates a trend of continued balance sheet growth over the last two fiscal years, while margins remain under pressure, particularly on the asset side of the balance sheet. The rate impact related to loans in fiscal year 2013 is exacerbated by the impact of the change in fair value of fixed-rate loans where we have entered into matching interest rate swaps, whereas the rate impact
93
Table of Contents
is muted in fiscal year 2012; absent this change, we experienced continued pressure on loan pricing as a result of strong competition in the markets where we operate and the prolonged low-interest rate environment. The table also illustrates the favorable impact to rate and volume attributes of strategic efforts undertaken in fiscal year 2013 to shift the balance of our deposit portfolio away from CDs toward more cost-effective NOW accounts, MMDAs and savings accounts and to more closely monitor deposit pricing and exceptions to rates set internally for specific deposit products.
| 2013 vs. 2012 | 2012 vs. 2011 | |||||||||||||||||||||||
| Volume | Rate | Total | Volume | Rate | Total | |||||||||||||||||||
| (dollars in thousands) | ||||||||||||||||||||||||
| Increase (decrease) in interest income: |
||||||||||||||||||||||||
| Cash and due from banks |
$ | (16 | ) | $ | 21 | $ | 5 | $ | (134 | ) | $ | (217 | ) | $ | (351 | ) | ||||||||
| Investment securities |
(3,242 | ) | (961 | ) | (4,203 | ) | 3,893 | (9,079 | ) | (5,186 | ) | |||||||||||||
| Loans, other than acquired with deteriorated credit quality |
61,865 | (104,030 | ) | (42,165 | ) | 33,463 | (30,768 | ) | 2,695 | |||||||||||||||
| Loans, acquired with deteriorated credit quality |
(6,009 | ) | 2,325 | (3,684 | ) | (15,437 | ) | (15,175 | ) | (30,612 | ) | |||||||||||||
| Loans |
55,856 | (101,705 | ) | (45,849 | ) | 18,026 | (45,943 | ) | (27,917 | ) | ||||||||||||||
|
|
|
|
|
|
|
|
|
|
|
|
|
|||||||||||||
| Total increase (decrease) |
52,598 | (102,645 | ) | (50,047 | ) | 21,785 | (55,239 | ) | (33,454 | ) | ||||||||||||||
|
|
|
|
|
|
|
|
|
|
|
|
|
|||||||||||||
| Increase (decrease) in interest expense: |
||||||||||||||||||||||||
| NOW, MMDA & savings accounts |
(330 | ) | 284 | (46 | ) | 1,363 | (2,321 | ) | (958 | ) | ||||||||||||||
| CDs |
(4,346 | ) | (6,906 | ) | (11,252 | ) | (6,291 | ) | (8,044 | ) | (14,335 | ) | ||||||||||||
| Securities sold under agreements to repurchase |
16 | (386 | ) | (370 | ) | (182 | ) | (56 | ) | (238 | ) | |||||||||||||
| FHLB advances and other borrowings |
56 | (51 | ) | 5 | 245 | (109 | ) | 136 | ||||||||||||||||
| Related party notes payable |
— | (57 | ) | (57 | ) | (92 | ) | 169 | 77 | |||||||||||||||
| Subordinated debentures |
— | (90 | ) | (90 | ) | — | 67 | 67 | ||||||||||||||||
|
|
|
|
|
|
|
|
|
|
|
|
|
|||||||||||||
| Total increase (decrease) |
(4,604 | ) | (7,206 | ) | (11,810 | ) | (4,957 | ) | (10,294 | ) | (15,251 | ) | ||||||||||||
|
|
|
|
|
|
|
|
|
|
|
|
|
|||||||||||||
| Increase (decrease) in net interest income |
$ | 57,202 | $ | (95,439 | ) | $ | (38,237 | ) | $ | 26,742 | $ | (44,945 | ) | $ | (18,203 | ) | ||||||||
|
|
|
|
|
|
|
|
|
|
|
|
|
|||||||||||||
Provision for Loan Losses
We recognized a provision for loan losses of $11.6 million for fiscal year 2013 compared to a provision for loan losses of $30.1 million for fiscal year 2012, a reduction of $18.5 million, or 62%. A reduction in both the level of impaired loans requiring specific reserves and in our incurred loss history resulted in a $13.7 million provision for loan losses for fiscal year 2013 related to the portion of our loan portfolio that is not subject to purchase accounting implications or for which we have elected the fair value option, which represented a reduction of $2.7 million, or 17%, related to this portion of the portfolio compared to fiscal year 2012. We believe the reduction in provision for loan losses compared to the prior fiscal year, despite continued growth in this portion of the portfolio and the level of charge-offs that we recognized during fiscal year 2013, is representative of improvement in the overall credit quality of the portfolio. We also recorded an improvement of $2.1 million during fiscal year 2013 associated with loans acquired with deteriorated credit quality. This compares to provision for loan losses of $13.8 million related to this portion of the portfolio recorded in fiscal year 2012, a reduction of $15.9 million. All loans acquired with deteriorated credit quality for which we recognized an improvement in fiscal year 2013 are covered by FDIC loss-sharing arrangements; we had no provision associated with our loans covered by FDIC loss-sharing arrangements other than loans acquired with deteriorated credit quality during fiscal year 2013. The change in the amount of provision for loan losses related to this portion of the portfolio was driven by improvements in the level of customer principal and interest cash flows that we received and expect to receive in future periods.
94
Table of Contents
Noninterest Income
The following table presents noninterest income for fiscal years 2013 and 2012:
| Fiscal year ended September 30, |
||||||||
| 2013 | 2012 | |||||||
| (dollars in thousands) | ||||||||
| Noninterest income: |
||||||||
| Service charges and other fees |
$ | 41,692 | $ | 38,937 | ||||
| Net gain on sale of loans |
13,724 | 11,794 | ||||||
| Casualty insurance commissions |
1,426 | 1,383 | ||||||
| Investment center income |
3,137 | 1,847 | ||||||
| Net gain on sale of securities |
917 | 7,305 | ||||||
| Trust department income |
3,545 | 3,241 | ||||||
| Net gain from sale of repossessed property and other assets |
2,788 | 6,822 | ||||||
| Gain on acquisition of business |
— | 3,950 | ||||||
| Other |
10,463 | 13,696 | ||||||
|
|
|
|
|
|||||
| Total noninterest income |
$ | 77,692 | $ | 88,975 | ||||
|
|
|
|
|
|||||
Noninterest income was $77.7 million for fiscal year 2013, compared with $89.0 million for fiscal year 2012, a decrease of 13%. The principal drivers of the decrease were declines in gains on sales of investment securities and a $4.0 million bargain purchase gain recorded on the purchase of North Central Bancshares, Inc. in fiscal year 2012 that was not a recurring item. Significant components of noninterest income are described in further detail below.
Service Charges and Other Fees. Service charges and other fees are primarily fees charged to deposit customers, including OD/NSF fees, commercial deposit account analysis and other charges, and ATM interchange and foreign activity fees. Service charges and other fees increased to $41.7 million in fiscal year 2013 from $38.9 million in fiscal year 2012, an increase of 7%. The increase was primarily driven by higher ATM usage volumes, an increase in customer OD/NSF fees, and charges generated from the launch of a new fee-based consumer checking product offering. As a subsidiary of NAB, we are subject to the limitations on permissible interchange fees contained in the Durbin Amendment to the Dodd-Frank Act, and the implementing regulations, which are reflected in the ATM interchange income we generated during the fiscal years 2013 and 2012. We estimate that the annual impact of this limitation is approximately $6.0 million.
Net Gain on Sale of Loans. The net gain on the sale of $450.0 million in aggregate principal balance of loans was $13.7 million in fiscal year 2013. In comparison, the net gain on sale of loans was $11.8 million on loan sales of $417.0 million in fiscal year 2012. Our average gain as a percentage of loans sold increased approximately 20 basis points in fiscal year 2013 compared to fiscal year 2012, as we focused on improving pricing, timing and delivery to the market. Our loan sale activity in fiscal years 2013 and 2012 was primarily the sale of conforming residential mortgage loans to FNMA, other commercial banks and, to a lesser extent, various state-sponsored first-time homebuyer programs. Net gain on sales of loans fluctuates with the volume of loans sold, the type of loans sold and market conditions such as the current interest rate environment. The volume of loans that we sell depends upon conditions in the mortgage origination, loan securitization and secondary loan sale markets. We experienced similar volumes in fiscal year 2013 and fiscal year 2012 but capitalized on better pricing outcomes on sales into the secondary market to deliver a more favorable revenue outcome in fiscal year 2013.
Investment Center Income. Investment center income consists of revenues from the investment advisory and wealth management services, other than trust services, we make available to our customers. Investment center income increased to $3.1 million for fiscal year 2013, a $1.3 million increase from $1.8 million for fiscal year 2012. This increase was primarily the result of an increase in assets under management based on positive market conditions and trends.
95
Table of Contents
Net Gain on Sale of Securities. Net gain on sale of securities represents the difference between gross sale proceeds and carrying value at amortized cost of investment securities sold during the period. We received total proceeds related to security sales of $542.8 million during fiscal year 2012, generating net gains of $7.3 million, compared to the $0.9 million of gains on the sale of securities on total proceeds of $72.4 million during fiscal year 2013. The decrease in fiscal year 2013 is primarily attributable to lower volumes of security sales in fiscal year 2013 compared to fiscal year 2012.
Net Gain from Sale of Repossessed Property and Other Assets. Our net gain on the sale of repossessed property and other assets was $2.8 million for fiscal year 2013, a decline of $4.0 million from $6.8 million for fiscal year 2012. This decline was primarily the result of a decrease in the number and carrying value of properties held as OREO and available for sale, resulting in fewer sales and lower cumulative gains in fiscal year 2013 compared to fiscal year 2012.
Other income. Other income includes rental income derived from leasing certain portions of bank-owned real estate, vendor incentive payments and other miscellaneous income items. Other income decreased to $10.5 million in fiscal year 2013 from $13.7 million in fiscal year 2012, a decrease of 24%.
Noninterest Expense
The following table presents noninterest expense for fiscal years 2013 and 2012:
| Fiscal year ended September 30, |
||||||||
| 2013 | 2012 | |||||||
| (dollars in thousands) | ||||||||
| Noninterest expense: |
||||||||
| Salaries and employee benefits |
$ | 100,660 | $ | 97,689 | ||||
| Occupancy expenses, net |
18,532 | 17,366 | ||||||
| Data processing |
18,980 | 15,270 | ||||||
| Equipment expenses |
4,518 | 5,438 | ||||||
| Advertising |
6,267 | 8,169 | ||||||
| Communication expenses |
4,609 | 4,826 | ||||||
| Professional fees |
12,547 | 13,049 | ||||||
| Derivatives, net (gain) loss |
(40,305 | ) | 19,369 | |||||
| Amortization of core deposits and other intangibles |
19,290 | 19,646 | ||||||
| Other |
25,975 | 34,188 | ||||||
|
|
|
|
|
|||||
| Total noninterest expense |
$ | 171,073 | $ | 235,010 | ||||
|
|
|
|
|
|||||
Our noninterest expense consists primarily of salaries and employee benefits, net occupancy expenses, data processing, professional fees, net gain or loss on derivatives and amortization of core deposits and other intangibles. Noninterest expense decreased to $171.1 million in fiscal year 2013 from $235.0 million in fiscal year 2012, a decrease of 27%. A substantial portion of the decrease was driven by a $59.7 million change in derivatives, net (gain) loss, which is offset by a corresponding loss in net interest income related to our fair value loans. Adjusted for this variance, our adjusted noninterest expenses decreased 2% from $215.6 million in fiscal year 2012 to $211.4 million in fiscal year 2013. Our adjusted efficiency ratio was 51.0% for fiscal year 2013 and 53.7% for fiscal year 2012, a decrease of 3%. For more information on these non-GAAP financial measures, including a reconciliation of each to the most directly comparable GAAP financial measures, see “Prospectus Summary—Summary Historical Consolidated Financial and Operating Information.” The remaining portion of the reduction in noninterest expense was driven primarily by decreases in costs related to OREO, including valuation declines and property maintenance and protection, and integration expenses. Significant components of noninterest expense are described in further detail below.
96
Table of Contents
Salaries and Employee Benefits. Salaries and employee benefits are the largest component of noninterest expense and include the cost of incentive compensation, benefit plans, health insurance and payroll taxes. These expenses were $100.7 million for fiscal year 2013, a 3% increase from $97.7 million for fiscal year 2012. The increase was driven primarily by the impact of a standard annual increase in wages and higher costs of employee benefits including health insurance, retirement plan contributions and other fringe benefits.
Occupancy Expenses. Occupancy costs were $18.5 million for fiscal year 2013, a 7% increase from $17.4 million for fiscal year 2012. Occupancy expenses relate to our branch network and administrative office locations throughout our footprint, including both owned and leased locations. Although on average the footprint remained substantially consistent year-over-year, all classes of expenses increased marginally, including utilities, rent,
insurance and real estate taxes.
Data Processing. These expenses include payments to vendors who provide software, data processing, and services on an outsourced basis, costs related to supporting and developing Internet-based activities, and depreciation of bank-owned hardware and software. Expenses for data processing were $19.0 million for fiscal year 2013, a 24% increase from $15.3 million for fiscal year 2012. The year-over-year increase was primarily driven by higher depreciation and third party vendor expenditures, mostly related to online and mobile applications, and higher credit card processing expenses on increased volumes.
Advertising. Advertising expenses declined by $1.9 million to $6.3 million for fiscal year 2013. The decrease was a result of more focused marketing campaigns.
Professional Fees. Professional fees include legal services required to complete transactions, resolve legal matters or delinquent loans, our FDIC and FICO assessments, and the cost of accountants and other consultants. These expenses were $12.5 million for fiscal year 2013, a 4% decrease from $13.0 million for fiscal year 2012. The decrease was primarily driven by a 66% decline in consulting fees resulting from a renewed focus on controlling third party expenses.
Derivatives, Net (Gain) Loss. In the normal course of business, we use interest rate swaps to manage our interest rate risk. The interest rate swap agreements are entered into in order to facilitate the risk management strategies of a small number of commercial real estate, commercial non-real estate and agriculture fixed-rate loan customers with original maturities 5 years or greater, and typically 5 to 15 years. We mitigate this risk by entering into equal and offsetting interest rate swap agreements with NAB. The related interest rate swaps are recognized as either assets or liabilities in our financial statements and any gains or losses on these swaps are recorded in earnings as a component of noninterest expense. These arrangements resulted in a $40.3 million net gain in fiscal year 2013 compared to a $19.4 million net loss in fiscal year 2012, a fluctuation of $59.7 million, which is offset by a corresponding loss in net interest income related to our fair value loans. For more information on these accounting arrangements, including the accounting for the related fixed-term loans, see “—Key Factors Affecting Our Business and Financial Statements—Loans and Interest Rates Swaps Accounted for at Fair Value.”
Amortization of Core Deposits and Other Intangibles. Amortization of core deposits and other intangibles represents the scheduled amortization of specifically-identifiable intangible assets arising from acquisitions, including NAB’s acquisition of us as well as subsequent acquisitions completed by us. The most significant component of amortization of core deposits and other intangibles relates to core deposit intangible assets, which represented $16.8 million in fiscal year 2013 compared to $17.2 million in fiscal year 2012. The intangible assets currently recorded are scheduled to amortize through May 2023. Total scheduled amortization for all intangible assets includes approximately $16 million for fiscal year 2014, approximately $7 million for fiscal year 2015, approximately $3 million for fiscal year 2016 and immaterial amounts for fiscal years 2017 through 2023.
Other. Other noninterest expenses include costs related to OREO, business development and professional membership fees, travel and entertainment costs and costs specific to integrating newly acquired banks. Other
97
Table of Contents
noninterest expenses decreased from $34.2 million in fiscal year 2012 to $26.0 million in fiscal year 2013, a decrease of 24%. The decrease was driven primarily by a $6.5 million decrease in net OREO costs and a $7.1 million decrease in integration expenses, partially offset by a $2.5 million increase related to the FDIC clawback liability recorded in conjunction with our FDIC loss-sharing arrangements.
Provision for Income Taxes
The provision for income taxes varies due to the amount of taxable income, the investments in tax-advantaged securities and tax credit funds and the rates charged by federal and state authorities. The provision for income taxes of $53.9 million in fiscal year 2013 represents an effective tax rate of 35.9%, compared with $44.2 million or 37.7% for fiscal year 2012, with the decrease in rate primarily due to a larger amount of tax exempt interest and the mix of state and local taxes we recognized. We have historically calculated our provision for income taxes as though we were a standalone company. As a result, we do not expect any material changes in our provisioning for income taxes following the completion of this offering.
Return on Assets and Equity
The table below presents our return on average total assets, return on average common equity, dividend payout ratio, average common equity to average assets ratio and net income per average common share on an actual and pro forma basis at and for the dates presented:
| At and for the fiscal year ended Sept. 30, |
||||||||||||
| 2013 | 2012 | 2011 | ||||||||||
| Return on average total assets |
1.07 | % | 0.85 | % | 0.76 | % | ||||||
| Return on average common equity |
6.97 | % | 5.40 | % | 5.04 | % | ||||||
| Dividend payout ratio |
43 | % | 57 | % | 60 | % | ||||||
| Average common equity to average assets ratio |
15.30 | % | 15.76 | % | 15.02 | % | ||||||
| Net income per average common share |
$ | 484.29 | $ | 367.31 | $ | 315.76 | ||||||
| Pro forma net income per average common share(1) |
$ | $ | $ | |||||||||
| (1) | Calculated on a pro forma basis giving effect to the Formation Transactions and the -for-1 stock split, each to be completed prior to the completion of this offering. |
98
Table of Contents
Analysis of Financial Condition
Loan Portfolio
The following table presents our loan portfolio by category at the end of the most recent quarter and each of the last five fiscal years:
| June 30, 2014 |
Sept. 30, | |||||||||||||||||||||||
| 2013 | 2012 | 2011 | 2010 | 2009 | ||||||||||||||||||||
| (dollars in thousands) | ||||||||||||||||||||||||
| Unpaid principal balance: |
||||||||||||||||||||||||
| Commercial non-real estate(1) |
||||||||||||||||||||||||
| Loans, other than loans acquired with deteriorated credit quality |
$ | 1,612,236 | $ | 1,469,834 | $ | 1,334,760 | $ | 941,009 | $ | 875,458 | $ | 590,623 | ||||||||||||
| Loans acquired with deteriorated credit quality |
9,713 | 11,922 | 19,042 | 29,859 | 83,343 | — | ||||||||||||||||||
|
|
|
|
|
|
|
|
|
|
|
|
|
|||||||||||||
| Total |
1,621,949 | 1,481,756 | 1,353,802 | 970,868 | 958,801 | 590,623 | ||||||||||||||||||
| Agriculture(1) |
||||||||||||||||||||||||
| Loans, other than loans acquired with deteriorated credit quality |
$ | 1,648,856 | $ | 1,587,248 | $ | 1,396,472 | $ | 1,091,755 | $ | 923,015 | $ | 662,634 | ||||||||||||
| Loans acquired with deteriorated credit quality |
— | — | — | — | — | — | ||||||||||||||||||
|
|
|
|
|
|
|
|
|
|
|
|
|
|||||||||||||
| Total |
1,648,856 | 1,587,248 | 1,396,472 | 1,091,755 | 923,015 | 662,634 | ||||||||||||||||||
| Commercial real estate(1) |
||||||||||||||||||||||||
| Loans, other than loans acquired with deteriorated credit quality |
$ | 2,332,388 | $ | 2,208,816 | $ | 2,196,543 | $ | 2,083,289 | $ | 2,113,863 | $ | 1,566,411 | ||||||||||||
| Loans acquired with deteriorated credit quality |
74,537 | 103,158 | 167,556 | 259,179 | 430,498 | — | ||||||||||||||||||
|
|
|
|
|
|
|
|
|
|
|
|
|
|||||||||||||
| Total |
2,406,925 | 2,311,974 | 2,364,099 | 2,342,468 | 2,544,361 | 1,566,411 | ||||||||||||||||||
| Residential real estate |
||||||||||||||||||||||||
| Loans, other than loans acquired with deteriorated credit quality |
$ | 793,966 | $ | 765,390 | $ | 757,947 | $ | 532,198 | $ | 616,412 | $ | 427,784 | ||||||||||||
| Loans acquired with deteriorated credit quality |
117,347 | 141,079 | 182,278 | 244,498 | 376,128 | — | ||||||||||||||||||
|
|
|
|
|
|
|
|
|
|
|
|
|
|||||||||||||
| Total |
911,313 | 906,469 | 940,225 | 776,696 | 992,540 | 427,784 | ||||||||||||||||||
| Consumer |
||||||||||||||||||||||||
| Loans, other than loans acquired with deteriorated credit quality |
$ | 88,652 | $ | 97,874 | $ | 119,644 | $ | 87,409 | $ | 103,825 | $ | 85,930 | ||||||||||||
| Loans acquired with deteriorated credit quality |
2,267 | 3,603 | 7,592 | 15,742 | 65,645 | — | ||||||||||||||||||
|
|
|
|
|
|
|
|
|
|
|
|
|
|||||||||||||
| Total |
90,919 | 101,477 | 127,236 | 103,151 | 169,470 | 85,930 | ||||||||||||||||||
| Other lending |
||||||||||||||||||||||||
| Loans, other than loans acquired with deteriorated credit quality |
$ | 30,323 | $ | 24,630 | $ | 15,028 | $ | 7,814 | $ | 21,684 | $ | 90,595 | ||||||||||||
| Loans acquired with deteriorated credit quality |
40 | 81 | 386 | 456 | 524 | — | ||||||||||||||||||
|
|
|
|
|
|
|
|
|
|
|
|
|
|||||||||||||
| Total |
30,363 | 24,711 | 15,414 | 8,270 | 22,208 | 90,595 | ||||||||||||||||||
|
|
|
|
|
|
|
|
|
|
|
|
|
|||||||||||||
| Total loans, other than loans acquired with deteriorated credit quality |
$ | 6,506,421 | $ | 6,153,792 | $ | 5,820,394 | $ | 4,743,474 | $ | 4,654,257 | $ | 3,423,977 | ||||||||||||
| Total loans acquired with deterioriated credit quality |
203,904 | 259,843 | 376,854 | 549,734 | 956,138 | — | ||||||||||||||||||
|
|
|
|
|
|
|
|
|
|
|
|
|
|||||||||||||
| Total unpaid principal balance |
6,710,325 | 6,413,635 | 6,197,248 | 5,293,208 | 5,610,395 | 3,423,977 | ||||||||||||||||||
|
|
|
|
|
|
|
|
|
|
|
|
|
|||||||||||||
| Less: Unamortized discount on acquired loans |
(27,732 | ) | (34,717 | ) | (55,836 | ) | (94,475 | ) | (184,622 | ) | — | |||||||||||||
| Less: Unearned net deferred fees and costs and loans in process |
(4,092 | ) | (16,245 | ) | (2,838 | ) | (4,692 | ) | (5,053 | ) | (3,573 | ) | ||||||||||||
|
|
|
|
|
|
|
|
|
|
|
|
|
|||||||||||||
| Total loans |
6,678,501 | 6,362,673 | 6,138,574 | 5,194,041 | 5,420,720 | 3,420,404 | ||||||||||||||||||
| Allowance for loan losses |
(47,038 | ) | (55,864 | ) | (71,878 | ) | (71,543 | ) | (55,620 | ) | (33,762 | ) | ||||||||||||
|
|
|
|
|
|
|
|
|
|
|
|
|
|||||||||||||
| Loans, net |
$ | 6,631,463 | $ | 6,306,809 | $ | 6,066,696 | $ | 5,122,498 | $ | 5,365,100 | $ | 3,386,642 | ||||||||||||
|
|
|
|
|
|
|
|
|
|
|
|
|
|||||||||||||
| (1) | Unpaid principal balance for commercial non-real estate, agriculture and commercial real estate loans includes fair value adjustments associated with long-term fixed-rate loans where we have entered into interest rate swaps to hedge our interest rate risk. See “—Key Factors Affecting Our Business and Financial Statements—Loans and Interest Rate Swaps Accounted for at Fair Value” for more information. |
99
Table of Contents
From September 30, 2010 to September 30, 2013, net of the change in the balance of acquired credit-impaired loans from our acquisition of TierOne Bank that are accounted for in accordance with ASC 310-30 Accounting for Purchased Loans, our loan portfolio grew at a CAGR of 11%. During the first nine months of fiscal year 2014 and all of fiscal year 2013, we continued to focus growth efforts on our commercial non-real estate and agriculture loan categories. Over the same time period, CRE loan balances remained mostly static but declined as a percentage of the overall portfolio, while residential real estate and consumer loans are gradually running off in real dollar terms and as a percentage of the portfolio. A large portion of those loans are acquired and continue to run off faster than we originate similar loans.
The following tables present an analysis of the unpaid principal balance of our loan portfolio at June 30, 2014 and September 30, 2013, by borrower and collateral type and by each of the four major geographic areas we use to manage our markets.
| June 30, 2014 | ||||||||||||||||||||||||||||
| Nebraska | Iowa / Kansas / Missouri |
South Dakota | Arizona / Colorado |
Other(2) | Total | % | ||||||||||||||||||||||
| (dollars in thousands) | ||||||||||||||||||||||||||||
| Commercial non-real estate(1) |
$ | 380,098 | $ | 712,837 | $ | 301,579 | $ | 188,910 | $ | 38,525 | $ | 1,621,949 | 24.2 | % | ||||||||||||||
| Agriculture(1) |
137,988 | 437,278 | 575,544 | 494,176 | 3,870 | 1,648,856 | 24.6 | % | ||||||||||||||||||||
| Commercial real estate(1) |
518,432 | 687,614 | 682,039 | 451,888 | 66,952 | 2,406,925 | 35.9 | % | ||||||||||||||||||||
| Residential real estate |
226,477 | 321,272 | 160,904 | 132,578 | 70,082 | 911,313 | 13.6 | % | ||||||||||||||||||||
| Consumer |
25,047 | 30,191 | 26,668 | 6,130 | 2,883 | 90,919 | 1.4 | % | ||||||||||||||||||||
| Other lending |
— | — | — | — | 30,363 | 30,363 | 0.5 | % | ||||||||||||||||||||
|
|
|
|
|
|
|
|
|
|
|
|
|
|
|
|||||||||||||||
| Total |
$ | 1,288,042 | $ | 2,189,192 | $ | 1,746,734 | $ | 1,273,682 | $ | 212,675 | $ | 6,710,325 | 100 | % | ||||||||||||||
|
|
|
|
|
|
|
|
|
|
|
|
|
|
|
|||||||||||||||
| % by location |
19.2 | % | 32.6 | % | 26.0 | % | 19.0 | % | 3.2 | % | 100 | % | ||||||||||||||||
| (1) | Unpaid principal balance for commercial non-real estate, agriculture and commercial real estate loans includes fair value adjustments associated with long-term fixed-rate loans where we have entered into interest rate swaps to hedge our interest rate risk. See “—Key Factors Affecting Our Business and Financial Statements—Loans and Interest Rate Swaps Accounted for at Fair Value” for more information. |
| (2) | Balances in this column represent acquired workout loans and certain other loans managed by our staff, commercial and consumer credit card loans, fair value adjustments related to acquisitions and loans for which we have elected the fair value option, which could result in a negative carrying amount in the event of a net negative fair value adjustment. |
100
Table of Contents
| September 30, 2013 | ||||||||||||||||||||||||||||
| Nebraska | Iowa / Kansas / Missouri |
South Dakota | Arizona / Colorado |
Other(2) | Total | % | ||||||||||||||||||||||
| (dollars in thousands) | ||||||||||||||||||||||||||||
| Commercial non-real estate(1) |
$ | 374,530 | $ | 594,063 | $ | 279,006 | $ | 197,395 | $ | 36,762 | $ | 1,481,756 | 23.1 | % | ||||||||||||||
| Agriculture(1) |
139,829 | 458,128 | 518,214 | 459,998 | 11,079 | 1,587,248 | 24.7 | % | ||||||||||||||||||||
| Commercial real estate(1) |
483,074 | 641,439 | 703,569 | 387,941 | 95,951 | 2,311,974 | 36.0 | % | ||||||||||||||||||||
| Residential real estate |
218,928 | 343,844 | 150,812 | 107,057 | 85,828 | 906,469 | 14.1 | % | ||||||||||||||||||||
| Consumer |
26,311 | 34,809 | 29,501 | 6,983 | 3,873 | 101,477 | 1.6 | % | ||||||||||||||||||||
| Other lending |
— | — | — | — | 24,711 | 24,711 | 0.4 | % | ||||||||||||||||||||
|
|
|
|
|
|
|
|
|
|
|
|
|
|
|
|||||||||||||||
| Total |
$ | 1,242,672 | $ | 2,072,283 | $ | 1,681,102 | $ | 1,159,374 | $ | 258,504 | $ | 6,413,635 | 100 | % | ||||||||||||||
|
|
|
|
|
|
|
|
|
|
|
|
|
|
|
|||||||||||||||
| % by location |
19.4 | % | 32.3 | % | 26.2 | % | 18.1 | % | 4.0 | % | 100 | % | ||||||||||||||||
| (1) | Unpaid principal balance for commercial non-real estate, agriculture and commercial real estate loans includes fair value adjustments associated with long-term fixed-rate loans where we have entered into interest rate swaps to hedge our interest rate risk. See “—Key Factors Affecting Our Business and Financial Statements—Loans and Interest Rate Swaps Accounted for at Fair Value” for more information. |
| (2) | Balances in this column represent acquired workout loans and certain other loans managed by our staff, commercial and consumer credit card loans, fair value adjustments related to acquisitions and loans for which we have elected the fair value option, which could result in a negative carrying amount in the event of a net negative fair value adjustment. |
The following table presents additional detail regarding our agriculture, CRE and residential real estate loans at June 30, 2014 and September 30, 2013:
| June 30, 2014 |
Sept. 30, 2013 |
|||||||
| (dollars in thousands) | ||||||||
| Commercial non-real estate |
$ | 1,621,949 | $ | 1,481,756 | ||||
| Agriculture real estate |
758,528 | 699,479 | ||||||
| Agriculture operating loans |
890,328 | 887,769 | ||||||
|
|
|
|
|
|||||
| Agriculture |
1,648,856 | 1,587,248 | ||||||
| Construction and development |
273,970 | 294,314 | ||||||
| Owner-occupied CRE |
1,116,507 | 1,010,159 | ||||||
| Non-owner-occupied CRE |
877,024 | 820,916 | ||||||
| Multifamily residential real estate |
139,424 | 186,585 | ||||||
|
|
|
|
|
|||||
| Commercial real estate |
2,406,925 | 2,311,974 | ||||||
| Home equity lines of credit |
338,537 | 318,092 | ||||||
| Closed-end first lien |
444,968 | 445,899 | ||||||
| Closed-end junior lien |
67,721 | 80,230 | ||||||
| Residential construction |
60,087 | 62,248 | ||||||
|
|
|
|
|
|||||
| Residential real estate |
911,313 | 906,469 | ||||||
| Consumer |
90,919 | 101,477 | ||||||
| Other |
30,363 | 24,711 | ||||||
|
|
|
|
|
|||||
| Total unpaid principal balance |
$ | 6,710,325 | $ | 6,413,635 | ||||
|
|
|
|
|
|||||
Commercial Non-Real Estate. Commercial non-real estate, or business lending, represents one of our core competencies. We believe that providing a tailored range of integrated products and services, including lending, to small- and medium-enterprise customers is the business at which we excel and through which we can generate favorable returns for our stockholders. We offer a number of different products including working capital and
101
Table of Contents
other shorter-term lines of credit, fixed-rate loans over a wide range of terms including our tailored business loans, for which we enter into matching interest rate swaps that give us floating payments for all deals over five years, and variable-rate loans with varying terms.
Agriculture. Agriculture loans include farm operating loans and loans collateralized by farm land. According to the American Bankers Association, at June 30, 2014, we were ranked the eighth-largest farm lender bank in the United States measured by total dollar volume of farm loans, and we take great pride in our knowledge of the agricultural industry across our footprint. We consider agriculture lending one of our core competencies. In 2008, agriculture loans comprised approximately 15% of our overall loan portfolio, compared to 25% as of June 30, 2014. We target a 20% to 35% portfolio composition for agriculture loans according to our risk appetite statement approved by our board of directors. Within our agriculture portfolio, we are further diversified across a wide range of subsectors with the majority of the portfolio concentrated within various types of grain, livestock and dairy products, and across different geographical segments within our footprint. Total agriculture lending grew by approximately $191 million, or 14%, during fiscal year 2013, from September 30, 2012 to September 30, 2013, consistent with our strategic initiatives and focused investment in agriculture lending growth.
Commercial Real Estate. CRE includes both owner-occupied CRE and non-owner-occupied CRE and construction and development lending. While CRE lending will remain a significant component of our overall loan portfolio, we are committed to managing our exposure to riskier construction and development deals specifically, and to CRE lending in general, by targeting relationships with relatively low loan-to-value positions, priced to reflect the amount of risk we accept as the lender. This focus on rebalancing the portfolio is reflected in the fact that CRE lending comprised nearly 50% of the portfolio at the time of the NAB acquisition in 2008, compared to 36% as of June 30, 2014. During fiscal year 2013, outstanding CRE lending decreased by 2%, from $2.36 billion at September 30, 2012 to $2.31 billion at September 30, 2013, then returned to $2.41 billion at June 30, 2014. Construction and development loans totaled $274.0 million at June 30, 2014, a decline of $20.3 million, or 7%, from $294.3 million at September 30, 2013.
Residential Real Estate. Residential real estate lending reflects 1-to-4-family real estate construction loans, closed-end first-lien mortgages (primarily single-family long-term first mortgages resulting from acquisitions of other banks), closed-end junior-lien mortgages and home equity lines of credit, or HELOCs. Our closed-end first-lien mortgages include a small percentage of single-family first mortgages that we originate and cannot subsequently sell into the secondary market, including jumbo products, adjustable-rate mortgages and rural home mortgages. Conversely, a large percentage of our total single-family first mortgage originations are sold into the secondary market in order to meet our interest rate risk management objectives.
Consumer. Our consumer lending offering comprises a relatively small portion of our total loan portfolio, and predominantly reflects small-balance secured and unsecured products marketed by our retail branches.
Other Lending. Other lending includes all other loan relationships that do not fit within the categories above, primarily consumer and commercial credit cards and customer deposit account overdrafts.
The following table presents the maturity distribution of our loan portfolio as of September 30, 2013. The maturity dates were determined based on the contractual maturity date of the loan:
| 1 Year or Less | >1 Through 5 Years |
>5 Years | Total | |||||||||||||
| (dollars in thousands) | ||||||||||||||||
| Maturity distribution: |
||||||||||||||||
| Commercial non-real estate |
$ | 538,471 | $ | 522,329 | $ | 420,956 | $ | 1,481,756 | ||||||||
| Agriculture |
767,346 | 552,224 | 267,678 | 1,587,248 | ||||||||||||
| Commercial real estate |
385,901 | 1,012,831 | 913,242 | 2,311,974 | ||||||||||||
| Residential real estate |
126,432 | 357,560 | 422,477 | 906,469 | ||||||||||||
| Consumer |
18,338 | 61,369 | 21,770 | 101,477 | ||||||||||||
| Other lending |
24,711 | — | — | 24,711 | ||||||||||||
|
|
|
|
|
|
|
|
|
|||||||||
| Total |
$ | 1,861,199 | $ | 2,506,313 | $ | 2,046,123 | $ | 6,413,635 | ||||||||
|
|
|
|
|
|
|
|
|
|||||||||
102
Table of Contents
The following table presents the distribution, as of September 30, 2013, of our loans that were due after one year between fixed and variable interest rates:
| Fixed | Variable | Total | ||||||||||
| (dollars in thousands) | ||||||||||||
| Maturity distribution: |
||||||||||||
| Commercial non-real estate |
$ | 629,545 | $ | 313,740 | $ | 943,285 | ||||||
| Agriculture |
607,393 | 212,509 | 819,902 | |||||||||
| Commercial real estate |
1,051,769 | 874,304 | 1,926,073 | |||||||||
| Residential real estate |
240,888 | 539,149 | 780,037 | |||||||||
| Consumer |
74,161 | 8,978 | 83,139 | |||||||||
|
|
|
|
|
|
|
|||||||
| Total |
$ | 2,603,756 | $ | 1,948,680 | $ | 4,552,436 | ||||||
|
|
|
|
|
|
|
|||||||
OREO
In the normal course of business, we obtain title to parcels of real estate and other assets when borrowers are unable to meet their contractual obligations and we initiate foreclosure proceedings, or via deed in lieu of foreclosure actions. OREO assets are considered nonperforming assets. When we obtain title to an asset, we evaluate how best to maintain and protect our interest in the property and seek to liquidate the assets at an acceptable price in a timely manner. Our total OREO carrying value was $54.2 million as of June 30, 2014, a decrease of $3.2 million compared to September 30, 2013. The amount of OREO covered by FDIC loss-sharing arrangements was $14.0 million as of June 30, 2014 and $24.4 million as of September 30, 2013. The following table presents our OREO balances for the periods indicated:
| Nine months ended June 30, 2014 |
Fiscal year ended Sept. 30, | |||||||||||
| 2013 | 2012 | |||||||||||
| (dollars in thousands) | ||||||||||||
| Beginning balance |
$ | 57,422 | $ | 68,526 | $ | 99,640 | ||||||
| Additions to OREO |
31,493 | 28,980 | 62,158 | |||||||||
| Valuation adjustments and other |
(13,035 | ) | (6,884 | ) | (14,060 | ) | ||||||
| Sales |
(21,690 | ) | (33,200 | ) | (79,212 | ) | ||||||
|
|
|
|
|
|
|
|||||||
| Ending balance |
$ | 54,190 | $ | 57,422 | $ | 68,526 | ||||||
|
|
|
|
|
|
|
|||||||
Investments
The following table presents the amortized cost of each category of our investment portfolio at the dates indicated:
| June 30, 2014 |
Sept. 30, | |||||||||||||||
| 2013 | 2012 | 2011 | ||||||||||||||
| (dollars in thousands) | ||||||||||||||||
| U.S. Treasury securities |
$ | 148,733 | $ | — | $ | 5,005 | $ | 5,012 | ||||||||
| Mortgage-backed securities: |
||||||||||||||||
| Government National Mortgage Association |
1,235,906 | 1,470,822 | 1,502,442 | 1,450,250 | ||||||||||||
| Federal National Mortgage Association |
1 | 1 | 1 | 1 | ||||||||||||
| States and political subdivision securities |
2,218 | 3,513 | 5,757 | 6,561 | ||||||||||||
| Corporate debt securities |
11,771 | 11,889 | 32,878 | 15,700 | ||||||||||||
| Other |
1,007 | 5,449 | 5,449 | 5,449 | ||||||||||||
|
|
|
|
|
|
|
|
|
|||||||||
| Total |
$ | 1,399,636 | $ | 1,491,674 | $ | 1,551,532 | $ | 1,482,973 | ||||||||
|
|
|
|
|
|
|
|
|
|||||||||
We have historically invested excess deposits in high-quality, liquid investment securities including residential agency mortgage-backed securities and, to a lesser extent, U.S. Treasury securities, corporate debt securities and issuances of U.S. states and political subdivisions. Our investment portfolio serves as a means to
103
Table of Contents
collateralize FHLB borrowings and public funds deposits, to earn net spread income on excess deposits and to maintain liquidity and balance interest rate risk. As of June 30, 2014, September 30, 2013, and for fiscal years 2011 through 2013, the portfolio composition was heavily weighted toward Government National Mortgage Association residential agency mortgage-backed securities to fit the risk appetite and financial return targets of NAB; however, we rebalanced approximately $150 million of the portfolio into U.S. Treasury securities in the third quarter of fiscal year 2014 to balance our interest rate risk exposures. During fiscal year 2013, the total amortized cost of the portfolio decreased by $59.9 million, from September 30, 2012 to September 30, 2013, as our loan portfolio growth outpaced deposit growth and certain holdings were liquidated to ensure interest rate risk metrics remained within policy limits.
The following tables present the aggregate amortized cost of each investment category of the investment portfolio and the weighted average yield for each investment category for each maturity period at June 30, 2014 and September 30, 2013. Maturities of mortgage-backed securities may differ from contractual maturities because the mortgages underlying the securities may be called or prepaid without any penalties. The weighted-average yield on these assets is presented below based on the contractual rate, as opposed to a tax equivalent yield concept.
| June 30, 2014 | ||||||||||||||||||||||||||||||||||||||||||||||||||||||||
| Due in one year or less | Due after one year through five years |
Due after five years through ten years |
Due after ten years | Mortgage-backed securities |
Securities without contractual maturities |
Total | ||||||||||||||||||||||||||||||||||||||||||||||||||
| Amount | Weighted average rate |
Amount | Weighted average rate |
Amount | Weighted average rate |
Amount | Weighted average rate |
Amount | Weighted average rate |
Amount | Weighted average rate |
Amount | Weighted average rate |
|||||||||||||||||||||||||||||||||||||||||||
| (dollars in thousands) | ||||||||||||||||||||||||||||||||||||||||||||||||||||||||
| U.S. Treasury securities |
$ | — | — | % | $ | 148,733 | 1.17 | % | $ | — | — | % | $ | — | — | % | $ | — | — | % | $ | — | — | % | $ | 148,733 | 1.17 | % | ||||||||||||||||||||||||||||
| Mortgage-backed securities |
— | — | % | — | — | % | — | — | % | — | — | % | 1,235,907 | 1.89 | % | — | — | % | 1,235,907 | 1.89 | % | |||||||||||||||||||||||||||||||||||
| States and political subdivision securities |
470 | 5.78 | % | 444 | 3.31 | % | 1,304 | 5.30 | % | — | — | % | — | — | % | — | — | % | 2,218 | 5.00 | % | |||||||||||||||||||||||||||||||||||
| Corporate debt securities |
6,776 | 2.41 | % | — | — | % | 4,995 | 1.75 | % | — | — | % | — | — | % | — | — | % | 11,771 | 2.13 | % | |||||||||||||||||||||||||||||||||||
| Other |
— | — | % | — | — | % | — | — | % | — | — | % | — | — | % | 1,007 | — | % | 1,007 | — | % | |||||||||||||||||||||||||||||||||||
|
|
|
|
|
|
|
|
|
|
|
|
|
|
|
|||||||||||||||||||||||||||||||||||||||||||
| Total |
$ | 7,246 | 2.63 | % | $ | 149,177 | 1.17 | % | $ | 6,299 | 2.48 | % | $ | — | — | % | $ | 1,235,907 | 1.89 | % | $ | 1,007 | — | % | $ | 1,399,636 | 1.82 | % | ||||||||||||||||||||||||||||
|
|
|
|
|
|
|
|
|
|
|
|
|
|
|
|||||||||||||||||||||||||||||||||||||||||||
| September 30, 2013 | ||||||||||||||||||||||||||||||||||||||||||||||||||||||||
| Due in one year or less | Due after one year through five years |
Due after five years through ten years |
Due after ten years | Mortgage-backed securities |
Securities without contractual maturities |
Total | ||||||||||||||||||||||||||||||||||||||||||||||||||
| Amount | Weighted average rate |
Amount | Weighted average rate |
Amount | Weighted average rate |
Amount | Weighted average rate |
Amount | Weighted average rate |
Amount | Weighted average rate |
Amount | Weighted average rate |
|||||||||||||||||||||||||||||||||||||||||||
| (dollars in thousands) | ||||||||||||||||||||||||||||||||||||||||||||||||||||||||
| Mortgage-backed securities |
$ | — | — | % | $ | — | — | % | $ | — | — | % | $ | — | — | % | $ | 1,470,823 | 2.08 | % | $ | — | — | % | $ | 1,470,823 | 2.08 | % | ||||||||||||||||||||||||||||
| States and political subdivision securities |
1,497 | 4.23 | % | 94 | 4.60 | % | 1,922 | 3.71 | % | — | — | % | — | — | % | — | — | % | 3,513 | 3.95 | % | |||||||||||||||||||||||||||||||||||
| Corporate debt securities |
— | — | % | 6,894 | 2.41 | % | 4,995 | 1.77 | % | — | — | % | — | — | % | — | — | % | 11,889 | 2.14 | % | |||||||||||||||||||||||||||||||||||
| Other |
— | — | % | — | — | % | — | — | % | — | — | % | — | — | % | 5,449 | — | % | 5,449 | — | % | |||||||||||||||||||||||||||||||||||
|
|
|
|
|
|
|
|
|
|
|
|
|
|
|
|||||||||||||||||||||||||||||||||||||||||||
| Total |
$ | 1,497 | 4.23 | % | $ | 6,988 | 2.44 | % | $ | 6,917 | 2.31 | % | $ | — | — | % | $ | 1,470,823 | 2.08 | % | $ | 5,449 | — | % | $ | 1,491,674 | 2.08 | % | ||||||||||||||||||||||||||||
|
|
|
|
|
|
|
|
|
|
|
|
|
|
|
|||||||||||||||||||||||||||||||||||||||||||
Asset Quality
We place an asset on nonaccrual status when any installment of principal or interest is more than 90 days past due (except for loans that are well secured and in the process of collection) or earlier when management determines the ultimate collection of all contractually due principal or interest to be unlikely. Restructured loans for which we grant payment or significant interest rate concessions are placed on nonaccrual status until collectability improves and a satisfactory payment history is established, generally by the receipt of at least six consecutive payments. Our collection policies related to delinquent and charged-off loans are highly focused on individual relationships, and we believe that these policies are in compliance with all applicable laws and regulations.
104
Table of Contents
The following table presents the dollar amount of nonaccrual loans, OREO, restructured performing loans and accruing loans over 90 days past due, at the end of the dates indicated. Loans covered by FDIC loss-sharing arrangements are generally pooled with other similar loans and are generally accreting purchase discount into income each period. Subject to compliance with the applicable loss-sharing agreement, we are generally indemnified by the FDIC at a rate of 80% for any future credit losses on loans covered by FDIC loss-sharing arrangements through June 4, 2015 for commercial loans and June 4, 2020 for single-family real estate loans.
| June 30, 2014 |
Sept. 30, | |||||||||||||||||||||||
| 2013 | 2012 | 2011 | 2010 | 2009 | ||||||||||||||||||||
| (dollars in thousands) | ||||||||||||||||||||||||
| Nonaccrual loans(1) |
||||||||||||||||||||||||
| Commercial non-real estate |
||||||||||||||||||||||||
| Loans covered by FDIC loss-sharing arrangements |
$ | 2,365 | $ | 2,947 | $ | 9,898 | $ | 18,223 | $ | 43,774 | $ | — | ||||||||||||
| Loans not covered by FDIC loss-sharing arrangements |
4,380 | 6,641 | 7,394 | 12,359 | 14,168 | 12,322 | ||||||||||||||||||
|
|
|
|
|
|
|
|
|
|
|
|
|
|||||||||||||
| Total |
6,745 | 9,588 | 17,292 | 30,582 | 57,942 | 12,322 | ||||||||||||||||||
| Agriculture |
||||||||||||||||||||||||
| Loans covered by FDIC loss-sharing arrangements |
$ | — | $ | — | $ | — | $ | — | $ | 2,197 | $ | — | ||||||||||||
| Loans not covered by FDIC loss-sharing arrangements |
11,381 | 8,236 | 3,757 | 6,200 | 5,109 | 299 | ||||||||||||||||||
|
|
|
|
|
|
|
|
|
|
|
|
|
|||||||||||||
| Total |
11,381 | 8,236 | 3,757 | 6,200 | 7,306 | 299 | ||||||||||||||||||
| Commercial real estate |
||||||||||||||||||||||||
| Loans covered by FDIC loss-sharing arrangements |
$ | 23,759 | $ | 31,151 | $ | 48,822 | $ | 120,141 | $ | 179,341 | $ | — | ||||||||||||
| Loans not covered by FDIC loss-sharing arrangements |
19,978 | 57,652 | 71,455 | 116,465 | 45,741 | 12,196 | ||||||||||||||||||
|
|
|
|
|
|
|
|
|
|
|
|
|
|||||||||||||
| Total |
43,737 | 88,803 | 120,277 | 236,606 | 225,082 | 12,196 | ||||||||||||||||||
| Residential real estate |
||||||||||||||||||||||||
| Loans covered by FDIC loss-sharing arrangements |
$ | 12,221 | $ | 13,401 | $ | 16,890 | $ | 21,513 | $ | 37,323 | $ | — | ||||||||||||
| Loans not covered by FDIC loss-sharing arrangements |
6,615 | 8,746 | 10,798 | 7,377 | 6,334 | 7,188 | ||||||||||||||||||
|
|
|
|
|
|
|
|
|
|
|
|
|
|||||||||||||
| Total |
18,836 | 22,147 | 27,688 | 28,890 | 43,657 | 7,188 | ||||||||||||||||||
| Consumer |
||||||||||||||||||||||||
| Loans covered by FDIC loss-sharing arrangements |
$ | — | $ | — | $ | — | $ | 17 | $ | 1,173 | $ | — | ||||||||||||
| Loans not covered by FDIC loss-sharing arrangements |
139 | 226 | 401 | 823 | 686 | 789 | ||||||||||||||||||
|
|
|
|
|
|
|
|
|
|
|
|
|
|||||||||||||
| Total |
139 | 226 | 401 | 840 | 1,859 | 789 | ||||||||||||||||||
| Other lending |
||||||||||||||||||||||||
| Loans covered by FDIC loss-sharing arrangements |
$ | — | $ | — | $ | — | $ | — | $ | — | $ | — | ||||||||||||
| Loans not covered by FDIC loss-sharing arrangements |
— | — | — | — | — | — | ||||||||||||||||||
|
|
|
|
|
|
|
|
|
|
|
|
|
|||||||||||||
| Total |
— | — | — | — | — | — | ||||||||||||||||||
|
|
|
|
|
|
|
|
|
|
|
|
|
|||||||||||||
105
Table of Contents
| June 30, 2014 |
Sept. 30, | |||||||||||||||||||||||
| 2013 | 2012 | 2011 | 2010 | 2009 | ||||||||||||||||||||
| (dollars in thousands) | ||||||||||||||||||||||||
| Total nonaccrual loans covered by FDIC loss-sharing arrangements |
$ | 38,345 | $ | 47,499 | $ | 75,610 | $ | 159,894 | $ | 263,808 | $ | — | ||||||||||||
| Total nonaccrual loans not covered by FDIC loss-sharing arrangements |
42,493 | 81,501 | 93,805 | 143,224 | 72,038 | 32,794 | ||||||||||||||||||
|
|
|
|
|
|
|
|
|
|
|
|
|
|||||||||||||
| Total nonaccrual loans |
80,838 | 129,000 | 169,415 | 303,118 | 335,846 | 32,794 | ||||||||||||||||||
| OREO |
54,190 | 57,422 | 68,526 | 99,640 | 132,988 | 5,355 | ||||||||||||||||||
|
|
|
|
|
|
|
|
|
|
|
|
|
|||||||||||||
| Total nonperforming assets |
135,028 | 186,422 | 237,941 | 402,758 | 468,834 | 38,149 | ||||||||||||||||||
| Restructured performing loans |
37,434 | 39,130 | 40,009 | 14,244 | — | — | ||||||||||||||||||
|
|
|
|
|
|
|
|
|
|
|
|
|
|||||||||||||
| Total nonperforming and restructured assets |
$ | 172,462 | $ | 225,552 | $ | 277,950 | $ | 417,002 | $ | 468,834 | $ | 38,149 | ||||||||||||
|
|
|
|
|
|
|
|
|
|
|
|
|
|||||||||||||
| Accruing loans 90 days or more past due |
$ | — | $ | 227 | $ | 1,832 | $ | 352 | $ | 203 | $ | 39 | ||||||||||||
| Nonperforming restructured loans included in total nonaccrual loans |
$ | 29,844 | $ | 63,140 | $ | 50,305 | $ | 14,244 | * | * | ||||||||||||||
| Nonaccretable difference outstanding related to loans acquired with deteriorated credit quality |
$ | 72,769 | $ | 92,541 | $ | 179,199 | $ | 303,413 | $ | 495,665 | $ | — | ||||||||||||
| Percent of total assets |
||||||||||||||||||||||||
| Nonaccrual loans(1) |
||||||||||||||||||||||||
| Loans not covered by FDIC loss-sharing arrangements |
0.46 | % | 0.89 | % | 1.04 | % | 1.75 | % | 0.87 | % | 0.63 | % | ||||||||||||
| Total |
0.87 | % | 1.41 | % | 1.88 | % | 3.70 | % | 4.05 | % | 0.63 | % | ||||||||||||
| OREO |
0.58 | % | 0.63 | % | 0.76 | % | 1.22 | % | 1.61 | % | 0.10 | % | ||||||||||||
| Nonperforming assets(2) |
1.45 | % | 2.04 | % | 2.64 | % | 4.92 | % | 5.66 | % | 0.73 | % | ||||||||||||
| Nonperforming and restructured assets(2) |
1.86 | % | 2.47 | % | 3.09 | % | 5.09 | % | 5.66 | % | 0.73 | % | ||||||||||||
| * | Information not available for periods indicated. |
| (1) | Includes nonperforming restructured loans. |
| (2) | Includes nonaccrual loans, which includes nonperforming restructured loans. |
At September 30, 2013, our nonperforming assets were approximately 2.04% of total assets, compared to 2.64% at September 30, 2012. At June 30, 2014, our nonperforming assets totaled $135.0 million, or 1.45% of total assets.
Excluding loans covered by FDIC loss-sharing arrangements, we had simple average nonaccrual loans of $87.6 million outstanding during fiscal year 2013. Based on the average loan portfolio yield for these loans for the year of 4.29%, we estimate that we would have received approximately $3 million to $4 million of additional interest income during the year if that entire portion of the portfolio had been performing. During the same period, the amount of net interest income that we recorded on these loans was immaterial.
We have experienced a decline in nonaccrual loans and total nonperforming assets in both total-dollar terms and as a percentage of total assets since both measures peaked in fiscal year 2011. Most notably, nonaccrual commercial real estate loans not covered by FDIC loss-sharing arrangements have declined from $116.5 million at September 30, 2011 to $20.0 million at June 30, 2014, a reduction of 83%. This change was driven by our focused workout through restructure and foreclosure of a number of problem loans that were written primarily prior to 2009, supported by our overall focus on managing our exposure to construction and development loans, in particular, which we believe are relatively riskier than other types of CRE loans, including owner-occupied
CRE loans. Nonaccrual agriculture loans not covered by FDIC loss-sharing arrangements have increased since
106
Table of Contents
the end of fiscal year 2011; however, this increase was driven by a small number of specific loans that we do not believe are representative of our broader agriculture lending portfolio. Further, this increase is proportionate to growth in our overall agriculture loan portfolio since September 30, 2011. Our OREO assets decreased by $3.2 million from September 30, 2013 to June 30, 2014.
Nonaccrual loans covered by FDIC loss-sharing arrangements have declined by 85% since peaking after our acquisition of TierOne Bank in fiscal year 2010, and we expect these loans to continue to decline due to the expiration of the commercial loss-sharing arrangement on June 4, 2015 and the natural runoff through payment or foreclosure of the underlying assets.
We consistently monitor all loans internally rated “watch” or worse because that rating indicates we have identified some potential weakness emerging; but loans rated “watch” will not necessarily become problem loans or become impaired. Aside from the loans on the watch list, we do not believe we have any potential problem loans that are not already identified as nonaccrual, past due or restructured as it is our policy to promptly reclassify loans as soon as we become aware of doubts as to the borrowers’ ability to meet repayment terms. We do not have any material interest-bearing assets that would be disclosed as nonperforming loans or restructured performing loans if they were loans.
When we grant concessions to borrowers that we would not otherwise grant if not for the borrowers’ financial difficulties, such as reduced interest rates or extensions of loan periods, we consider these modifications troubled debt restructurings, or TDRs. The table below outlines total TDRs, split between performing and nonperforming loans, at each of the dates indicated:
| June 30, 2014 |
Sept. 30, | |||||||||||
| 2013 | 2012 | |||||||||||
| (dollars in thousands) | ||||||||||||
| Commercial non-real estate |
||||||||||||
| Performing TDRs |
$ | 6,312 | $ | 4,769 | $ | 14,235 | ||||||
| Nonperforming TDRs |
1,606 | 5,007 | 5,719 | |||||||||
|
|
|
|
|
|
|
|||||||
| Total |
7,918 | 9,776 | 19,954 | |||||||||
| Agriculture |
||||||||||||
| Performing TDRs |
$ | 1,032 | $ | 4,326 | $ | 410 | ||||||
| Nonperforming TDRs |
8,723 | 7,268 | 352 | |||||||||
|
|
|
|
|
|
|
|||||||
| Total |
9,755 | $ | 11,594 | $ | 762 | |||||||
| Commercial real estate |
||||||||||||
| Performing TDRs |
$ | 29,165 | $ | 29,373 | $ | 25,323 | ||||||
| Nonperforming TDRs |
18,728 | 49,736 | 41,955 | |||||||||
|
|
|
|
|
|
|
|||||||
| Total |
47,893 | $ | 79,109 | $ | 67,278 | |||||||
| Residential real estate |
||||||||||||
| Performing TDRs |
$ | 884 | $ | 662 | $ | 41 | ||||||
| Nonperforming TDRs |
773 | 1,100 | 2,279 | |||||||||
|
|
|
|
|
|
|
|||||||
| Total |
1,657 | $ | 1,762 | $ | 2,320 | |||||||
| Consumer |
||||||||||||
| Performing TDRs |
$ | 41 | $ | — | $ | — | ||||||
| Nonperforming TDRs |
14 | 29 | — | |||||||||
|
|
|
|
|
|
|
|||||||
| Total |
55 | $ | 29 | $ | — | |||||||
| Other lending |
||||||||||||
| Performing TDRs |
$ | — | $ | — | $ | — | ||||||
| Nonperforming TDRs |
— | — | — | |||||||||
|
|
|
|
|
|
|
|||||||
| Total |
— | — | — | |||||||||
|
|
|
|
|
|
|
|||||||
| Total performing TDRs |
$ | 37,434 | $ | 39,130 | $ | 40,009 | ||||||
| Total nonperforming TDRs |
29,844 | 63,140 | 50,305 | |||||||||
|
|
|
|
|
|
|
|||||||
| Total TDRs |
$ | 67,278 | $ | 102,270 | $ | 90,314 | ||||||
|
|
|
|
|
|
|
|||||||
107
Table of Contents
We entered into loss-sharing arrangements with the FDIC related to certain assets (loans and OREO) acquired from TierOne Bank on June 4, 2010. We are generally indemnified by the FDIC at a rate of 80% for any future credit losses through June 4, 2015 for commercial loans and OREO and June 4, 2020 for single-family real estate loans and OREO. The table below presents nonaccrual loans, TDRs, and OREO covered by loss-sharing arrangements; a rollforward of the allowance for loan losses for loans covered by loss-sharing arrangements; a rollforward of allowance for loan losses for only those loans purchased with deteriorated credit quality covered by loss-sharing arrangements; and a rollforward of OREO covered by loss-sharing arrangements at and for the periods presented.
| At and for the nine months ended June 30, 2014 |
At and for the fiscal year ended Sept. 30, | |||||||||||||||||||||||
| 2013 | 2012 | 2011 | 2010 | 2009 | ||||||||||||||||||||
| (dollars in thousands) | ||||||||||||||||||||||||
| Assets covered by FDIC loss-sharing arrangements |
||||||||||||||||||||||||
| Nonaccrual loans(1) |
$ | 38,345 | $ | 47,499 | $ | 75,610 | $ | 159,894 | $ | 263,808 | $ | — | ||||||||||||
| TDRs |
9,530 | 6,145 | 1,939 | 1,859 | — | — | ||||||||||||||||||
| OREO |
13,967 | 24,412 | 44,332 | 83,417 | 108,578 | — | ||||||||||||||||||
| Allowance for loan losses, loans covered by FDIC loss-sharing arrangements(2) |
||||||||||||||||||||||||
| Balance at beginning of period |
$ | 7,246 | $ | 14,470 | $ | 12,542 | $ | — | $ | — | $ | — | ||||||||||||
| Additional impairment recorded |
1,142 | 2,509 | 20,232 | 18,841 | — | — | ||||||||||||||||||
| Recoupment of previously-recorded impairment |
(3,082 | ) | (4,585 | ) | (6,387 | ) | (874 | ) | — | — | ||||||||||||||
| Charge-offs |
(777 | ) | (4,638 | ) | (11,917 | ) | (5,425 | ) | — | — | ||||||||||||||
| Recoveries |
— | (510 | ) | — | — | — | — | |||||||||||||||||
|
|
|
|
|
|
|
|
|
|
|
|
|
|||||||||||||
| Balance at end of period |
$ | 4,529 | $ | 7,246 | $ | 14,470 | $ | 12,542 | $ | — | $ | — | ||||||||||||
|
|
|
|
|
|
|
|
|
|
|
|
|
|||||||||||||
| OREO covered by FDIC loss-sharing arrangement |
||||||||||||||||||||||||
| Balance at beginning of period |
$ | 24,412 | $ | 44,332 | $ | 83,417 | $ | 108,578 | $ | — | $ | — | ||||||||||||
| Additions to OREO |
917 | 6,100 | 28,395 | 66,299 | 123,167 | — | ||||||||||||||||||
| Valuation adjustments and other |
(3,439 | ) | (3,754 | ) | (11,851 | ) | (33,280 | ) | (7,749 | ) | — | |||||||||||||
| Sales |
(7,923 | ) | (22,266 | ) | (55,629 | ) | (58,180 | ) | (6,840 | ) | — | |||||||||||||
|
|
|
|
|
|
|
|
|
|
|
|
|
|||||||||||||
| Balance at end of period |
$ | 13,967 | $ | 24,412 | $ | 44,332 | $ | 88,417 | $ | 108,578 | $ | — | ||||||||||||
|
|
|
|
|
|
|
|
|
|
|
|
|
|||||||||||||
| (1) | Includes nonperforming restructured loans. |
| (2) | All loans represented in the allowance for loans covered by FDIC loss-sharing arrangements are loans acquired with deteriorated credit quality. |
Allowance for Loan Losses
We establish an allowance for the inherent risk of probable losses within our loan portfolio. The allowance for loan losses is management’s best estimate of probable credit losses that are incurred in the loan portfolio. We determine the allowance for loan losses based on an ongoing evaluation, driven primarily by monitoring changes in loan risk grades, delinquencies and other credit risk indicators, which is an inherently subjective process. We consider the uncertainty related to certain industry sectors and the extent of credit exposure to specific borrowers within the portfolio. In addition, we consider concentration risks associated with the various loan portfolios and current economic conditions that might impact the portfolio. All of these estimates are susceptible to significant change. Changes to the allowance for loan losses are made by charges to the provision for loan losses. Loans deemed to be uncollectible are charged off against the allowance for loan losses. Recoveries of amounts previously charged-off are credited to the allowance for loan losses.
108
Table of Contents
Our allowance for loan losses consists of two components. For non-impaired loans, we calculate a weighted average ratio of 12-, 36- and 60-month historical realized losses by collateral type; adjust as necessary for our interpretation of current economic conditions and current portfolio trends including credit quality, concentrations, aging of the portfolio and/or significant policy and underwriting changes not entirely covered by the calculated historical loss rates; and apply the loss rates to outstanding loan balances in each collateral category. We calculate the weighted average ratio of 12-, 36- and 60-month historical realized losses for each collateral type by dividing the average net annual charge-offs by the average outstanding loans of such type subject to the calculation for each of the 12-, 36- and 60-month periods, then averaging those three results. For impaired loans, we estimate our exposure for each individual relationship, given the current payment status of the loan, the present value of expected payments and the value of the underlying collateral as supported by third party appraisals, broker’s price opinions, and/or the borrower’s audited financial statements, each adjusted for liquidation costs. Any shortfall between the liquidation value of the underlying collateral and the recorded investment value of the loan is considered the required specific reserve amount. Actual losses in any period may exceed allowance amounts. We evaluate and adjust our allowance for loan losses, and the allocation of the allowance between loan categories, each month.
The following table presents an analysis of our allowance for loan losses, including provisions for loan losses, charge-offs and recoveries, for the periods indicated:
| At and for the nine months ended June 30, 2014 |
At and for the fiscal year ended Sept. 30, |
|||||||||||||||||||||||
| 2013 | 2012 | 2011 | 2010 | 2009 | ||||||||||||||||||||
| (dollars in thousands) | ||||||||||||||||||||||||
| Allowance for loan losses: |
||||||||||||||||||||||||
| Balance at beginning of period |
$ | 55,864 | $ | 71,878 | $ | 71,543 | $ | 55,620 | $ | 33,762 | $ | 26,047 | ||||||||||||
| Provision charged to expense |
(125 | ) | 13,650 | 16,300 | 43,810 | 48,711 | 13,870 | |||||||||||||||||
| Purchase accounting adjustment |
— | — | — | — | — | 1,813 | ||||||||||||||||||
| Impairment of loans acquired with deteriorated credit quality |
(1,940 | ) | (2,076 | ) | 13,845 | 17,967 | — | — | ||||||||||||||||
| Charge-offs: |
||||||||||||||||||||||||
| Commercial non-real estate |
(2,883 | ) | (3,636 | ) | (7,304 | ) | (9,482 | ) | (10,966 | ) | (4,101 | ) | ||||||||||||
| Agriculture |
(2,652 | ) | (4,069 | ) | (49 | ) | (1,075 | ) | (1,155 | ) | (15 | ) | ||||||||||||
| Commercial real estate |
(3,733 | ) | (19,648 | ) | (24,854 | ) | (32,862 | ) | (11,911 | ) | (3,119 | ) | ||||||||||||
| Residential real estate |
(581 | ) | (1,766 | ) | (1,625 | ) | (3,900 | ) | (5,207 | ) | (1,252 | ) | ||||||||||||
| Consumer |
(191 | ) | (244 | ) | (1,137 | ) | (526 | ) | (192 | ) | (538 | ) | ||||||||||||
| Other lending |
(1,154 | ) | (1,851 | ) | (1,764 | ) | (1,521 | ) | (1,044 | ) | (875 | ) | ||||||||||||
|
|
|
|
|
|
|
|
|
|
|
|
|
|||||||||||||
| Total charge-offs |
(11,194 | ) | (31,214 | ) | (36,733 | ) | (49,366 | ) | (30,475 | ) | (9,900 | ) | ||||||||||||
|
|
|
|
|
|
|
|
|
|
|
|
|
|||||||||||||
| Recoveries: |
||||||||||||||||||||||||
| Commercial non-real estate |
1,228 | 1,206 | 1,386 | 1,156 | 1,853 | 653 | ||||||||||||||||||
| Agriculture |
29 | 22 | 160 | 201 | 3 | — | ||||||||||||||||||
| Commercial real estate |
1,521 | 689 | 3,268 | 761 | 830 | 407 | ||||||||||||||||||
| Residential real estate |
190 | 279 | 630 | 379 | 218 | 76 | ||||||||||||||||||
| Consumer |
136 | 396 | 226 | 241 | 27 | 130 | ||||||||||||||||||
| Other lending |
1,329 | 1,034 | 1,253 | 774 | 691 | 666 | ||||||||||||||||||
|
|
|
|
|
|
|
|
|
|
|
|
|
|||||||||||||
| Total recoveries |
4,433 | 3,626 | 6,923 | 3,512 | 3,622 | 1,932 | ||||||||||||||||||
|
|
|
|
|
|
|
|
|
|
|
|
|
|||||||||||||
| Net loan (charge-offs) recoveries |
(6,761 | ) | (27,588 | ) | (29,810 | ) | (45,854 | ) | (26,853 | ) | (7,968 | ) | ||||||||||||
|
|
|
|
|
|
|
|
|
|
|
|
|
|||||||||||||
| Balance at end of period |
$ | 47,038 | $ | 55,864 | $ | 71,878 | $ | 71,543 | $ | 55,620 | $ | 33,762 | ||||||||||||
|
|
|
|
|
|
|
|
|
|
|
|
|
|||||||||||||
| Average total loans for the period(1) |
$ | 6,442,387 | $ | 6,223,009 | $ | 5,549,685 | $ | 5,226,325 | $ | 4,147,054 | $ | 2,906,490 | ||||||||||||
| Total loans at period end(1) |
$ | 6,678,501 | $ | 6,362,673 | $ | 6,138,574 | $ | 5,194,041 | $ | 5,420,720 | $ | 3,420,404 | ||||||||||||
| Ratios |
||||||||||||||||||||||||
| Net charge-offs (recoveries) to average total loans(2) |
0.14 | % | 0.44 | % | 0.54 | % | 0.88 | % | 0.65 | % | 0.27 | % | ||||||||||||
| Allowance for loan losses to: |
||||||||||||||||||||||||
| Total loans |
0.70 | % | 0.88 | % | 1.17 | % | 1.38 | % | 1.03 | % | 0.99 | % | ||||||||||||
| Nonaccruing loans(3) |
110.70 | % | 68.54 | % | 76.62 | % | 49.95 | % | 77.21 | % | 102.95 | % | ||||||||||||
| (1) | Loans include unpaid principal balance net of unamortized discount on acquired loans and unearned net deferred fees and costs and loans in process. |
| (2) | Calculated as an annualized percentage for the nine months ended June 30, 2014, as applicable. |
| (3) | Nonaccruing loans excludes loans covered by FDIC loss-sharing arrangements. |
109
Table of Contents
In fiscal year 2013, we recorded net charge-offs of $27.6 million, compared to net charge-offs of $29.8 million in fiscal year 2012. Net charge-offs as a percentage of average total loans were 0.44% in fiscal year 2013 compared to 0.54% in fiscal year 2012. In the first nine months of fiscal year 2014, we recorded net charge-offs of $6.8 million. Net charge-offs as a percentage of average total loans were 0.14% (annualized) in the first nine months of fiscal year 2014.
Total charge-offs and net charge-offs have each decreased since fiscal year 2011. The majority of charge-offs in fiscal years 2011, 2012 and 2013 were related to commercial real estate loans, primarily loans that were written prior to 2009. We believe this continued decline is reflective of our focus on managing our exposure to non-owner-occupied commercial real estate and construction and development loans, which we believe are relatively riskier than owner-occupied CRE loans, and represents that the majority of our most problematic commercial real estate loans have been worked out of our portfolio. Agriculture charge-offs increased in fiscal year 2013 and the first nine months of fiscal year 2014; however, these increases are related to a small number of specific loans and, we believe, are not representative of underlying issues in our broader agriculture portfolio.
At September 30, 2013, the allowance for loan losses was 0.88% of our total loan portfolio, compared with 1.17% at September 30, 2012. At June 30, 2014, our allowance for loan losses was 0.70% of total loans. Our allowance for loan losses, both in total dollars and as a percentage of total loans, has declined since September 30, 2012. Since that point in time we have experienced a consistent decline in annual net charge-offs as a percentage of total loans which impacts the allowance calculation for non-impaired loans, a reduction in nonperforming (and typically impaired) loans which generally require higher specific reserves, and a reduction in our relative exposure to commercial real estate loans which have historically driven a large proportion of our net charge-offs. Additionally, certain of our loans which are carried at fair value, totaling $932 million and $842 million at June 30, 2014 and September 30, 2013, respectively, have no associated allowance for loan losses, but rather have a fair value adjustment related to credit risk, which is reflected in interest income, thus driving the overall ratio of allowance for loan losses to total loans lower. The amount of fair value adjustment related to credit risk on these loans was $4.6 million and $6.0 million at June 30, 2014 and September 30, 2013, respectively.
The following tables present management’s historical allocation of the allowance for loan losses by loan category, in both dollars and percentage of our total allowance for loan losses, to specific loans in those categories at the dates indicated:
| June 30, 2014 |
Sept. 30, | |||||||||||||||||||||||
| 2013 | 2012 | 2011 | 2010 | 2009 | ||||||||||||||||||||
| (dollars in thousands) | ||||||||||||||||||||||||
| Allocation of allowance for loan losses: |
||||||||||||||||||||||||
| Commercial non-real estate |
$ | 9,587 | $ | 11,222 | $ | 18,979 | $ | 16,450 | $ | 14,687 | $ | 17,945 | ||||||||||||
| Agriculture |
7,740 | 9,296 | 6,906 | 2,509 | 2,298 | 1,469 | ||||||||||||||||||
| Commercial real estate |
18,055 | 22,562 | 30,234 | 40,733 | 31,593 | 9,927 | ||||||||||||||||||
| Residential real estate |
10,414 | 11,779 | 14,761 | 10,758 | 6,026 | 1,869 | ||||||||||||||||||
| Consumer |
392 | 312 | 542 | 832 | 624 | 2,313 | ||||||||||||||||||
| Other lending |
850 | 693 | 456 | 261 | 392 | 239 | ||||||||||||||||||
|
|
|
|
|
|
|
|
|
|
|
|
|
|||||||||||||
| Total |
$ | 47,038 | $ | 55,864 | $ | 71,878 | $ | 71,543 | $ | 55,620 | $ | 33,762 | ||||||||||||
|
|
|
|
|
|
|
|
|
|
|
|
|
|||||||||||||
| June 30, 2014 |
Sept. 30, | |||||||||||||||||||||||
| 2013 | 2012 | 2011 | 2010 | 2009 | ||||||||||||||||||||
| Allocation of allowance for loan losses: |
||||||||||||||||||||||||
| Commercial non-real estate |
20.4 | % | 20.1 | % | 26.4 | % | 23.0 | % | 26.4 | % | 53.2 | % | ||||||||||||
| Agriculture |
16.5 | % | 16.6 | % | 9.6 | % | 3.5 | % | 4.1 | % | 4.4 | % | ||||||||||||
| Commercial real estate |
38.4 | % | 40.4 | % | 42.1 | % | 56.9 | % | 56.8 | % | 29.4 | % | ||||||||||||
| Residential real estate |
22.1 | % | 21.1 | % | 20.5 | % | 15.0 | % | 10.8 | % | 5.5 | % | ||||||||||||
| Consumer |
0.8 | % | 0.6 | % | 0.8 | % | 1.2 | % | 1.1 | % | 6.8 | % | ||||||||||||
| Other lending |
1.8 | % | 1.2 | % | 0.6 | % | 0.4 | % | 0.8 | % | 0.7 | % | ||||||||||||
110
Table of Contents
Management will continue to evaluate the loan portfolio and assess economic conditions in order to determine future allowance levels and the amount of loan loss provisions. We review the appropriateness of our allowance for loan losses on a monthly basis. Management monitors closely all past due and restructured loans in assessing the appropriateness of its allowance for loan losses. In addition, we follow procedures for reviewing and grading all substantial commercial and agriculture relationships at least annually. Based predominantly upon the review and grading process, we determine the appropriate level of the allowance in response to our assessment of the probable risk of loss inherent in our loan portfolio. Management will make additional loan loss provisions when the results of its problem loan assessment methodology or overall allowance appropriateness test indicate additional provisions are required.
The review of problem loans is an ongoing process during which management may determine that additional charge-offs are required or additional loans should be placed on nonaccrual status. We recorded a release of provision for loan losses of $2.1 million during the first nine months of fiscal year 2014. We recorded provisions for loan losses of $11.6 million and $30.1 million during fiscal years 2013 and 2012, respectively. We have also recorded an allowance for unfunded lending-related commitments that represents our estimate of incurred losses on the portion of lending commitments that borrowers have not advanced. The balance of the allowance for unfunded lending-related commitments was $0.4 million at June 30, 2014 and September 30, 2013.
Deposits
We obtain funds from depositors by offering consumer and business demand deposit accounts, MMDAs, NOW accounts, savings accounts and term CDs. At June 30, 2014 and September 30, 2013, our total deposits were $7.07 billion and $6.95 billion, respectively. Deposits increased 2% at June 30, 2014 as compared to September 30, 2013. Our accounts are federally insured by the FDIC up to the legal maximum. We advertise in newspapers, on the Internet and on television and radio to attract deposits and perform limited direct telephone solicitation of potential institutional depositors such as investment managers, public depositors and pension plans. We have significantly shifted the composition of our deposit portfolio away from CDs toward demand, NOW, MMDA and savings accounts over the last 18 months. This has dramatically reduced our overall cost of deposit funding, in addition to the fact that we have greatly increased adherence to internally published rate offerings for various types of deposit account offerings. The following table presents the balances and weighted average cost of our deposit portfolio at the following dates:
| Sept. 30 | ||||||||||||||||||||||||||||||||
| June 30, 2014 | 2013 | 2012 | 2011 | |||||||||||||||||||||||||||||
| Amount | Weighted Avg. Cost |
Amount | Weighted Avg. Cost |
Amount | Weighted Avg. Cost |
Amount | Weighted Avg. Cost |
|||||||||||||||||||||||||
| (dollars in thousands) | ||||||||||||||||||||||||||||||||
| Non-interest-bearing demand |
$ | 1,294,131 | — | % | $ | 1,199,427 | — | % $ | 1,076,437 | — | % | $ | 848,414 | — | % | |||||||||||||||||
| NOW accounts, money market and savings |
3,951,996 | 0.23 | % | 3,601,796 | 0.21 | % | 3,037,382 | 0.22 | % | 2,532,143 | 0.26 | % | ||||||||||||||||||||
| Time certificates, $100,000 or more |
712,952 | 0.98 | % | 850,817 | 1.04 | % | 1,178,095 | 1.36 | % | 1,106,665 | 1.53 | % | ||||||||||||||||||||
| Other time certificates |
1,108,033 | 0.85 | % | 1,296,168 | 0.97 | % | 1,592,601 | 1.27 | % | 1,784,527 | 1.45 | % | ||||||||||||||||||||
|
|
|
|
|
|
|
|
|
|||||||||||||||||||||||||
| Total |
$ | 7,067,112 | 0.36 | % | $ | 6,948,208 | 0.42 | % | $ | 6,884,515 | 0.62 | % | $ | 6,271,749 | 0.79 | % | ||||||||||||||||
|
|
|
|
|
|
|
|
|
|||||||||||||||||||||||||
Municipal public deposits constituted $873 million of our deposit portfolio at September 30, 2013, of which $666 million were required to be collateralized, which has contributed to declines in our overall cost of deposits. Municipal public deposits constituted $982 million of our deposit portfolio at June 30, 2014, against which we were required to hold $728 million of collateral. Our top 10 depositors were responsible for 8% of our total deposits at June 30, 2014 and 9% at September 30, 2013.
111
Table of Contents
The following table presents deposits by region:
| June 30, 2014 |
Sept. 30, | |||||||||||
| 2013 | 2012 | |||||||||||
| (dollars in thousands) | ||||||||||||
| Nebraska |
$ | 2,422,553 | $ | 2,455,229 | $ | 2,481,965 | ||||||
| Iowa / Kansas / Missouri |
2,113,663 | 2,103,593 | 1,827,833 | |||||||||
| South Dakota |
1,342,709 | 1,315,652 | 1,428,004 | |||||||||
| Arizona / Colorado |
1,140,309 | 1,038,201 | 1,100,562 | |||||||||
| Corporate and other |
47,878 | 35,533 | 46,151 | |||||||||
|
|
|
|
|
|
|
|||||||
| Total deposits |
$ | 7,067,112 | $ | 6,948,208 | $ | 6,884,515 | ||||||
|
|
|
|
|
|
|
|||||||
We fund a portion of our assets with CDs that have balances of $100,000 or more and that have maturities generally in excess of six months. At June 30, 2014 and September 30, 2013, our CDs of $100,000 or more totaled $713 million and $851 million, respectively. The following table presents the maturities of our CDs of $100,000 or more and less than $100,000 in size at September 30, 2013:
| Greater than or equal to $100,000 |
Less than $100,000 | |||||||
| (dollars in thousands) | ||||||||
| Remaining maturity: |
||||||||
| Three months or less |
$ | 199,049 | $ | 270,769 | ||||
| Over three through six months |
116,418 | 249,901 | ||||||
| Over six through twelve months |
224,609 | 308,915 | ||||||
| Over twelve months |
310,741 | 466,583 | ||||||
|
|
|
|
|
|||||
| Total |
$ | 850,817 | $ | 1,296,168 | ||||
|
|
|
|
|
|||||
| Percent of total deposits |
12.2 | % | 18.7 | % | ||||
At June 30, 2014 and September 30, 2013, the average remaining maturity of all CDs was approximately 13 months. The average CD amount per account was approximately $28,599 and $29,538 at June 30, 2014 and September 30, 2013, respectively.
We have acquired term CDs that matured prior to June 30, 2014 from a source that was deemed to be a broker. The total amount of these deposits was approximately $0.4 million September 30, 2013. We no longer acquire deposits from this source.
Derivatives
In the normal course of business, we enter into fixed-rate loans having original maturities of 5 years or greater (typically between 5 and 15 years) with certain of our commercial and agribusiness banking customers to assist them in facilitating their risk management strategies. We mitigate our interest rate risk associated with these loans by entering into equal and offsetting fixed-to-floating interest rate swap agreements for these loans with NAB London Branch. We have elected to account for the loans at fair value under ASC 825 Fair Value Option. Changes in the fair value of these loans are recorded in earnings as a component of interest income in the relevant period. The related interest rate swaps are recognized as either assets or liabilities in our financial statements and any gains or losses on these swaps are recorded in earnings as a component of noninterest expense. The economic hedges are fully effective from an interest rate risk perspective, as gains and losses on our swaps are directly offset by changes in fair value of the hedged loans (i.e., swap interest rate risk adjustments are directly offset by associated loan interest rate risk adjustments). Consequently, any changes in interest income associated with changes in fair value resulting from interest rate movement, as opposed to changes in credit quality, on the loans are directly offset by equal and opposite charges to or reductions in noninterest expense for the related interest rate swap. To ensure the
112
Table of Contents
correlation of movements in fair value between the interest rate swap and the related loan, we pass on all economic costs associated with our hedging activity resulting from loan customer prepayments (partial or full) to the customer.
Short-Term Borrowings
Our primary sources of short-term borrowings include securities sold under repurchase agreements and certain FHLB advances maturing within 12 months. Our short-term borrowings position did not change materially between September 30, 2013 and June 30, 2014. The following table presents certain information with respect to only our borrowings with original maturities less than 12 months at fiscal year-end for each of our last three fiscal years:
| As of and for the nine months ended June 30, 2014 |
As of and for the fiscal year ended Sept. 30, |
|||||||||||||||
| 2013 | 2012 | 2011 | ||||||||||||||
| (dollars in thousands) |
||||||||||||||||
| Short-term borrowings: |
||||||||||||||||
| FHLB advances |
$ | 55,000 | $ | 50,000 | $ | 150,000 | $ | — | ||||||||
| Securities sold under agreements to repurchase |
181,898 | 213,940 | 231,247 | 207,621 | ||||||||||||
| Related party notes payable |
5,500 | 5,500 | 5,500 | 12,500 | ||||||||||||
| Other short-term borrowings |
97 | 107 | 121 | 884 | ||||||||||||
|
|
|
|
|
|
|
|
|
|||||||||
| Total short-term borrowings |
$ | 242,495 | $ | 269,547 | $ | 386,868 | $ | 221,005 | ||||||||
|
|
|
|
|
|
|
|
|
|||||||||
| Maximum amount outstanding at any month-end during the period |
$ | 264,345 | $ | 387,769 | $ | 447,274 | $ | 416,115 | ||||||||
| Average amount outstanding during the period |
$ | 214,466 | $ | 315,611 | $ | 347,937 | $ | 282,108 | ||||||||
| Weighted average rate for the period(1) |
0.30 | % | 0.30 | % | 0.36 | % | 0.37 | % | ||||||||
| Weighted average rate as of date indicated |
0.34 | % | 0.29 | % | 0.34 | % | 0.36 | % | ||||||||
| (1) | Calculated as an annualized percentage for the nine months ended June 30, 2014. |
Great Western also has a $10 million revolving line of credit issued by NAB that is due on demand. There were outstanding advances of $5.5 million on this line of credit at each of June 30, 2014 and September 30, 2013. For more information on this line of credit, see “Our Relationship with NAB and Certain Other Related Party Transactions—Related Party Transactions with NAB—Indebtedness Held by NAB and Its Affiliates.”
Other Borrowings
Great Western has outstanding $56.1 million of junior subordinated debentures to affiliated trusts in connection with the issuance of trust preferred securities by such trusts as of June 30, 2014, September 30, 2013, and September 30, 2012. We are permitted under applicable laws and regulations to count these trust preferred securities as part of our Tier 1 capital.
Great Western also has outstanding a subordinated capital note issued to NAB New York Branch having an aggregate principal amount of approximately $35.8 million maturing in 2018. For more information on this note, see “Our Relationship with NAB and Certain Other Related Party Transactions—Related Party Transactions with NAB—Indebtedness Held by NAB and Its Affiliates.”
113
Table of Contents
Off-Balance Sheet Commitments, Commitments, Guarantees and Contractual Obligations
The following table summarizes the maturity of our contractual obligations and other commitments to make future payments at September 30, 2013. Customer deposit obligations categorized as “not determined” include noninterest-bearing demand accounts, NOW accounts, MMDAs and passbook accounts.
| Less Than 1 Year |
1 to 2 Years | 2 to 5 Years |
> 5 Years | Not Determined |
Total | |||||||||||||||||||
| (dollars in thousands) | ||||||||||||||||||||||||
| Contractual Obligations: |
||||||||||||||||||||||||
| Customer deposits |
$ | 1,369,276 | $ | 448,934 | $ | 307,557 | $ | 21,218 | $ | 4,801,223 | $ | 6,948,208 | ||||||||||||
| Securities sold under agreement to repurchase |
214,023 | 805 | 2,734 | — | — | 217,562 | ||||||||||||||||||
| FHLB advances and other borrowings |
160,607 | 65,000 | 140,000 | 25,000 | — | 390,607 | ||||||||||||||||||
| Related party notes payable |
5,500 | — | — | 35,795 | — | 41,295 | ||||||||||||||||||
| Subordinated debentures(1) |
— | — | — | 56,083 | — | 56,083 | ||||||||||||||||||
| Accrued interest payable |
6,790 | — | — | — | — | 6,790 | ||||||||||||||||||
| Operating leases, net of sublease income |
4,324 | 3,644 | 7,265 | 2,327 | — | 17,560 | ||||||||||||||||||
| Interest on FHLB advances |
3,207 | 2,700 | 4,224 | 4,423 | — | 14,554 | ||||||||||||||||||
| Interest on related party notes payable(1) |
827 | 827 | 2,266 | — | — | 3,920 | ||||||||||||||||||
| Other Commitments: |
||||||||||||||||||||||||
| Commitments to extend credit—non-credit card |
$ | 1,153,512 | $ | 91,715 | $ | 252,042 | $ | 91,488 | $ | 16,614 | $ | 1,605,371 | ||||||||||||
| Commitments to extend credit—credit card |
— | — | — | — | 108,498 | 108,498 | ||||||||||||||||||
| Letters of credit |
51,893 | — | — | — | — | 51,893 | ||||||||||||||||||
| (1) | The outstanding balance on our $10 million line of credit with NAB New York Branch and our subordinated debentures can be prepaid at any time without penalty; therefore, no future interest payments, other than those already accrued, are reflected. |
Instruments with Off-Balance Sheet Risk
In the normal course of business, we enter into various transactions that are not included in our consolidated financial statements in accordance with GAAP. These transactions include commitments to extend credit to our customers and letters of credit. Commitments to extend credit are agreements to lend to a customer provided there is no violation of any condition established in the commitment. Since many of the commitments are expected to expire without being drawn upon, the total commitment amounts do not necessarily represent future cash requirements. Letters of credit are conditional commitments issued primarily to support or guarantee the performance of a customer’s obligations to a third party. The credit risk involved in issuing letters of credit is essentially the same as originating a loan to the customer. We manage the risks associated with these arrangements by evaluating each customer’s creditworthiness prior to issuance through a process similar to that used by us in deciding whether to extend credit to the customer.
The following table presents the total notional amounts of all commitments by us to extend credit and letters of credit as of the dates indicated:
| Sept. 30, | ||||||||||||
| June 30, 2014 | 2013 | 2012 | ||||||||||
| (dollars in thousands) | ||||||||||||
| Commitments to extend credit |
$ | 1,764,808 | $ | 1,713,869 | $ | 1,451,680 | ||||||
| Letters of credit |
54,238 | 51,893 | 61,111 | |||||||||
|
|
|
|
|
|
|
|||||||
| Total |
$ | 1,819,046 | $ | 1,765,762 | $ | 1,512,791 | ||||||
|
|
|
|
|
|
|
|||||||
114
Table of Contents
Liquidity
Liquidity refers to our ability to maintain cash flow that is adequate to fund operations and meet present and future financial obligations through either the sale or maturity of existing assets or by obtaining additional funding through liability management. We consider the effective and prudent management of liquidity to be fundamental to our health and strength. Our objective is to manage our cash flow and liquidity reserves so that they are adequate to fund our obligations and other commitments on a timely basis and at a reasonable cost.
Our liquidity risk is managed through a comprehensive framework of policies and limits overseen by our bank’s asset and liability committee. We continuously monitor and make adjustments to our liquidity position by adjusting the balance between sources and uses of funds as we deem appropriate. Our primary measures of liquidity include monthly cash flow analyses under ordinary business activities and conditions and under situations simulating a severe run on our bank. We also monitor our bank’s deposit to loan ratio to ensure high quality funding is available to support our strategic lending growth objectives, and have internal management targets for the FDIC’s liquidity ratio, net short-term non-core funding dependence ratio and non-core liabilities to total assets ratio. The results of these measures and analyses are incorporated into our contingency funding plan, which provides the basis for the identification of our liquidity needs.
Great Western. Great Western’s primary source of liquidity is cash obtained from dividends by our bank. We primarily use our cash for the payment of dividends, when and if declared by our board of directors, and the payment of interest on our outstanding junior subordinated debentures and related party notes payable. We also use cash, as necessary, to satisfy the needs of our bank through equity contributions and for acquisitions. At June 30, 2014, Great Western had $4.3 million of cash. We expect that GWBI will declare and pay to NAI an aggregate dividend of $34.0 million (related to our earnings in the second half of fiscal year 2014) during our fourth fiscal quarter prior to completion of the Formation Transactions. The outstanding amounts under our revolving line of credit with NAB and subordinated capital note issued to NAB New York Branch together totaled $41.3 million at June 30, 2014. Our management believes that the sources of available liquidity are adequate to meet all reasonably foreseeable short-term and intermediate-term demands.
Great Western Bank. Our bank maintains sufficient liquidity by maintaining minimum levels of excess cash reserves (measured on a daily basis), a sufficient amount of unencumbered, highly liquid assets and access to contingent funding with the FHLB. At June 30, 2014, our bank had cash of $230.8 million and $1.40 billion of highly-liquid securities held in our investment portfolio, of which $1.17 billion were pledged as collateral on public deposits, securities sold under agreements to repurchase, and for other purposes as required or permitted by law. The balance could be sold to meet liquidity requirements. Our bank also had $435.0 million in FHLB borrowings at June 30, 2014, with additional available lines of $806.2 million. Our bank primarily uses liquidity to meet loan requests and commitments (including commitments under letters of credit), to accommodate outflows in deposits and to take advantage of interest rate market opportunities. At June 30, 2014, we had a total of $1.82 billion of outstanding exposure under commitments to extend credit and issued letters of credit. Our management believes that the sources of available liquidity are adequate to meet all our bank’s reasonably foreseeable short-term and intermediate-term demands.
Capital
As a bank holding company, we must comply with the capital requirements established by the Federal Reserve, and our bank must comply with the capital requirements established by the FDIC. The current risk-based guidelines applicable to us and our bank are based on the Basel I framework, as implemented by the federal bank regulators. See “Supervision and Regulation—Regulatory Capital Requirements.”
115
Table of Contents
The following table presents our regulatory capital ratios at June 30, 2014 and the standards for both well-capitalized depository institutions and minimum capital requirements. Our capital ratios exceeded applicable regulatory requirements.
| Actual | Minimum Capital Requirement Ratio |
Well Capitalized Ratio |
||||||||||||||
| Capital Amount | Ratio | |||||||||||||||
| (dollars in thousands) | ||||||||||||||||
| Great Western |
||||||||||||||||
| Tier 1 capital |
$ | 785,919 | 12.1 | % | 4.0 | % | 6.0 | % | ||||||||
| Total capital |
854,433 | 13.1 | % | 8.0 | % | 10.0 | % | |||||||||
| Tier 1 leverage |
785,919 | 9.3 | % | 4.0 | % | 5.0 | % | |||||||||
| Great Western Bank |
||||||||||||||||
| Tier 1 capital |
$ | 818,677 | 12.6 | % | 4.0 | % | 6.0 | % | ||||||||
| Total capital |
865,715 | 13.3 | % | 8.0 | % | 10.0 | % | |||||||||
| Tier 1 leverage |
818,677 | 9.6 | % | 4.0 | % | 5.0 | % | |||||||||
At June 30, 2014 and September 30, 2013, our Tier 1 capital included an aggregate of $56.1 million of trust preferred securities issued by our subsidiaries. At June 30, 2014, our Tier 2 capital included $47.0 million of the allowance for loan losses and $21.5 million of an intercompany subordinated capital note, subject to phase-out and a current haircut of 60%. At September 30, 2013, our Tier 2 capital included $55.9 million of the allowance for loan losses and $28.6 million of subordinated intercompany notes payable, subject to phase-out and a current haircut of 80%. Our total risk-weighted assets were $6.52 billion at June 30, 2014.
In July 2013, the federal bank regulators approved the New Capital Rules (as defined and discussed in “Supervision and Regulation—Regulatory Capital Requirements”), which implement the Basel III capital framework and various provisions of the Dodd-Frank Act. We and our bank will be required to comply with these rules beginning on January 1, 2015, subject to the phase-in of certain provisions. In addition to other changes, the New Capital Rules establish a new common equity Tier 1 capital ratio. At June 30, 2014, calculated on a fully phased-in basis, our common equity Tier 1 capital ratio would have been 10.8%, which exceeds the 4.5% minimum ratio requirement in the rules (and the 7.0% minimum ratio requirement after including the full phase-in of the capital conservation buffer). At June 30, 2014, calculated on a fully phased-in basis, our bank’s common equity Tier 1 capital ratio would have been 12.1%.
The New Capital Rules also make changes to the calculation of Tier 1 capital and total capital, as well as changing the risk weightings associated with calculating our risk weighted assets. We believe the most significant changes from the current risk-based capital guidelines currently applicable to us will be the increased risk weightings for higher-volatility CRE, revolving lines of credit with less than a one year term and on past-due and impaired loans. In addition, our outstanding trust preferred securities will continue to qualify as additional Tier 1 capital under the New Capital Rules until we exceed $15 billion in consolidated total assets. At June 30, 2014, calculated on a fully phased-in basis, our Tier 1 capital ratio calculated under the New Capital Rules was 11.6%, and our bank’s Tier 1 capital ratio calculated under the New Capital Rules was 12.1%. We believe that, as of June 30, 2014, we and our bank would meet all capital adequacy requirements under the New Capital Rules on a fully phased-in basis as if such requirements were then in effect.
The common equity Tier 1 capital and Tier 1 capital ratio calculated under the New Capital Rules for both us and our bank are unaudited, non-GAAP financial measures. These ratios are calculated based on our estimates of the required adjustments under the New Capital Rules to the current regulatory-required calculation of risk-weighted assets and estimates of the application of provisions of the New Capital Rules to be phased in over time. We believe these estimates are reasonable, but they may ultimately be incorrect as we finalize our calculations under the New Capital Rules. A reconciliation our and our bank’s common equity Tier 1 capital and
116
Table of Contents
Tier 1 capital ratio calculated under the New Capital Rules at June 30, 2014 to our and our bank’s current regulatory-required Tier 1 capital ratios are presented in the table below:
| June 30, 2014 | ||||||||
| Great Western |
Great Western Bank |
|||||||
| (dollars in thousands) | ||||||||
| Common equity Tier 1 capital: |
||||||||
| Total Tier 1 capital |
$ | 785,919 | $ | 818,677 | ||||
| Less: Trust preferred securities |
56,083 | |||||||
|
|
|
|||||||
| Total common equity Tier 1 capital |
$ | 729,836 | $ | 818,677 | ||||
|
|
|
|||||||
| Risk-weighted assets |
$ | 6,517,451 | $ | 6,516,556 | ||||
| Add: Net change in risk-weighted assets |
253,000 | 253,000 | ||||||
|
|
|
|
|
|||||
| Basel III risk-weighted assets |
$ | 6,770,451 | $ | 6,769,556 | ||||
|
|
|
|
|
|||||
| Current regulatory Tier 1 capital ratio |
12.1 | % | 12.6 | % | ||||
| Common equity Tier 1 capital ratio |
10.8 | % | 12.1 | % | ||||
| Basel III Tier 1 capital ratio |
11.6 | % | 12.1 | % | ||||
Internal Control Over Financial Reporting
We are a wholly owned subsidiary of NAB, and our results have been included in NAB’s consolidated financial statements since NAB acquired us in 2008. As a result, we have historically reported our financial results to NAB under International Financial Reporting Standards (“IFRS”), which are applicable to us as a wholly owned subsidiary of NAB. In accordance with the terms of the Stockholder Agreement we intend to enter into with NAB prior to the completion of this offering, we will be required to report our financial results to NAB under IFRS until such time as NAB is no longer required under IFRS to account in its financial statements for its holdings in our business under an equity method of accounting (unless our obligation is terminated earlier by NAB). In addition, as regulated financial institutions, we and our bank have also reported our financial results under GAAP for an extended period of time, as required under the financial reporting regulatory regime applicable to financial institutions and their holding companies in the U.S. We are required to report financial results under GAAP to the Federal Reserve, and our bank is required to report financial results under GAAP to the FDIC and the South Dakota Division of Banking.
As a result of this offering, we will transition from being a wholly owned subsidiary of a large public entity listed in Australia to becoming a public company in our own right listed in the United States. As such we are now subject to the heightened financial reporting standards under GAAP and SEC rules, including more extensive levels of disclosure, which require enhancements to the design and operation of our internal control over financial reporting. In the process of preparing additional disclosures required by the SEC for public companies contained within our consolidated financial statements under these heightened requirements in connection with this offering, during the third quarter of fiscal 2014, we concluded a material weakness existed in the design and operation of our internal control over financial reporting. A material weakness is a deficiency, or combination of deficiencies, in internal control over financial reporting such that there is a reasonable possibility that a material misstatement of our financial statements will not be prevented or detected on a timely basis. The material weakness identified resulted primarily from a lack of sufficient resources and personnel within the accounting function engaged in the preparation and review of our consolidated financial statements and a lack of formal controls and procedures with respect to our internal review of the accuracy and completeness of our application of SEC rules to our consolidated financial statements. In an effort to maintain the confidentiality of the offering process, only a subset of our accounting and financial reporting staff were involved in the preparation of our consolidated financial statements. We also had not implemented a control framework sufficient to ensure a complete and independent review of the additional disclosures applicable to us pursuant to the SEC’s heightened financial reporting requirements for public
117
Table of Contents
companies. The material weakness did not affect our reported net income or stockholder’s equity for any financial reporting period or materially affect our reported total assets and total liabilities for any fiscal reporting period.
Following identification of the material weakness, we implemented a number of controls and procedures designed to improve our control environment. In particular, we included additional members of our accounting and financial reporting staff in the preparation and review of interim consolidated financial statements at and for the nine months ended June 30, 2014 included in this prospectus and have implemented a more formal preparation and review hierarchy designed to identify and resolve potential errors on a timely basis. We have also contracted with two independent consulting firms to assist us in the preparation of our consolidated financial statements, and we plan to hire and utilize additional experienced, qualified personnel within our financial reporting function in the future to assist with the preparation and review of future financial statements. As a result of the additional controls and procedures, no differences were identified in connection with the review of our interim consolidated financial statements at and for the nine months ended June 30, 2014 included in this prospectus which were, individually or in the aggregate, material to our consolidated financial statements.
Management continues to evaluate the design and operating effectiveness of these changes to our control environment and we believe that further reporting periods, including the fiscal year end 2014 reporting cycle, are required to confirm the remediation of the previously identified material weakness as well as the ongoing effectiveness of the revised control environment. During the fiscal year end 2014 reporting cycle and going forward, our full accounting and financial reporting team will be included in the preparation of our consolidated financial statements, and we expect that our enhanced control environment will be fully implemented by that time. We intend to continue to monitor the design and effectiveness of our financial reporting system, a process requiring our continuous effort to anticipate and react to changes in our business and the economic and regulatory environment in which we operate. We therefore cannot assure you that we will be successful in implementing all remedial measures we may undertake or that these measures will significantly improve or remediate the material weakness identified in the design and operating effectiveness of our internal control over financial reporting, which, in future periods, could impact our ability to report our financial results accurately or on a timely basis. See “Risk Factors—Risks Relating to Our Business—We may not be able to report our future financial results accurately and timely as a publicly listed company if we fail to maintain an effective system of disclosure controls and procedures and internal control over financial reporting, or if we fail to remediate the material weakness identified relating to the design and operation of our internal control over financial reporting.”
Impact of Inflation and Changing Prices
Our financial statements included in this prospectus have been prepared in accordance with GAAP, which requires us to measure financial position and operating results primarily in terms of historic dollars. Changes in the relative value of money due to inflation or recession generally are not considered. The primary effect of inflation on our operations is reflected in increased operating costs. In our management’s opinion, changes in interest rates affect the financial condition of a financial institution to a far greater degree than changes in the inflation rate. While interest rates are greatly influenced by changes in the inflation rate, they do not necessarily change at the same rate or in the same magnitude as the inflation rate. Interest rates are highly sensitive to many factors that are beyond our control, including changes in the expected rate of inflation, the influence of general and local economic conditions and the monetary and fiscal policies of the United States government, its agencies and various other governmental regulatory authorities.
Recent Accounting Pronouncements
In December 2011, the FASB issued Accounting Standards Update, or ASU, 2011-11 Disclosures about Offsetting Assets and Liabilities. Under the ASU, an entity is required to disclose both gross and net information about instruments and transactions eligible for offset in the balance sheet, as well as instruments and transactions subject to an agreement similar to a master netting agreement. In January 2013, the FASB released ASU 2013-01 Clarifying the Scope of Disclosures about Offsetting Assets and Liabilities, which amended ASU 2011-11 to
118
Table of Contents
specifically include only derivatives accounted for under Topic 815, repurchase and reverse repurchase agreements, and securities borrowing and lending transactions that are either offset or subject to an enforceable master netting arrangement. The disclosure requirements became effective for annual reporting periods beginning on or after January 1, 2013, and interim periods therein, with retrospective application required. The adoption of these accounting pronouncements did not have a material impact on our consolidated financial statements.
In October 2012, the FASB released ASU 2012-06 Subsequent Accounting for an Indemnification Asset Recognized at the Acquisition Date as a Result of a Government-Assisted Acquisition of a Financial Institution. The new guidance clarifies that when a reporting entity recognizes an indemnification asset as a result of a government-assisted acquisition of a financial institution and subsequently a change in the cash flows expected to be collected on the indemnification asset occurs, the reporting entity should account for the change in the measurement of the indemnification asset on the same basis as the change in the assets subject to indemnification. Any amortization of changes in value should be limited to the lesser of the contractual term of the indemnification agreement or the remaining life of the indemnified assets. This guidance became effective for annual reporting periods beginning on or after December 15, 2012, and interim periods therein. The Company previously accounted for its indemnification asset in accordance with this guidance; accordingly, the adoption of this guidance did not have a material impact on our consolidated financial position, results of operations or cash flows.
In February 2013, the FASB issued ASU 2013-02 Comprehensive Income (Topic 220): Reporting of Amounts Reclassified Out of Accumulated Other Comprehensive Income. The update amends existing literature to require an entity to provide information about the amounts reclassified out of other comprehensive income by component, and it also requires enhanced disclosure and cross reference on items reclassified out of accumulated other comprehensive income during the reporting period. The update became effective for reporting periods beginning after December 15, 2012. The adoption of the update did not have a significant impact on our consolidated financial statements.
In January 2014, the FASB issued ASU 2014-04 Receivables—Troubled Debt Restructurings by Creditors (Subtopic 310-40): Reclassification of Residential Real Estate Collateralized Consumer Mortgage Loans upon Foreclosure. The update amends existing literature to eliminate diversity in practice by clarifying and defining when an in substance repossession or foreclosure occurs. The terms “in substance a repossession or foreclosure” and “physical possession” are not currently defined in the accounting literature, resulting in diversity in practice when a creditor derecognizes a loan receivable and recognizes the real estate property collateralizing the loan receivable as an asset. Additionally, the update requires interim and annual disclosures of both the amount of foreclosed residential real estate property and the recorded investment in consumer mortgage loans collateralized by residential real estate property that are in the process of foreclosure. The update is effective for annual periods and the interim periods within those annual periods beginning after December 15, 2014. The adoption of the update to existing standards is not expected to have a material impact on our consolidated financial statements.
In May 2014, the FASB issued ASU 2014-09 Revenue from Contracts with Customers (Topic 606), which does not apply to financial instruments. The core principle of the guidance is that an entity should recognize revenue to depict the transfer of promised goods or services to customers in an amount that reflects the consideration to which the entity expects to be entitled in exchange for those goods and services. ASU 2014-09 is effective for annual reporting periods beginning after December 15, 2016, including interim periods within that reporting period. The amendments can be applied retrospectively to each prior reporting period or retrospectively with the cumulative effect of initially applying this update recognized at the date of initial application. Early application is not permitted. The Company is assessing the impact of ASU 2014-09 on its accounting and disclosures.
Critical Accounting Policies and the Impact of Accounting Estimates
Our discussion and analysis of our financial condition and results of operations are based on our financial statements, which have been prepared in accordance with GAAP. The preparation of these financial statements
119
Table of Contents
requires us to make estimates and judgments that affect the reported amounts of assets, liabilities, revenues and expenses and related disclosure of contingent assets and liabilities. On an ongoing basis, we evaluate our estimates, including those related to allowance for loan losses, credit risks, estimated loan lives, interest rate risk, investments, intangible assets, income taxes, contingencies, litigation and other operational risks. We base these estimates on our historical experience and on various other assumptions that we believe are reasonable under the circumstances, the results of which form the basis for making judgments about the carrying values of assets and liabilities that are not readily apparent from other sources. Actual results may differ from these estimates under different assumptions or conditions.
Credit Risk Management
Our strategy for credit risk management includes well-defined, centralized credit policies, uniform underwriting criteria and ongoing risk monitoring and review processes for all credit exposures. The strategy also emphasizes diversification on a geographic, industry and customer level; regular credit examinations; and management reviews of loans exhibiting deterioration of credit quality. The credit risk management strategy also includes a credit risk assessment process that performs assessments of compliance with commercial and consumer credit policies, risk ratings, and other critical credit information. Loan decisions are documented with respect to the borrower’s business, purpose of the loan, evaluation of the repayment source and the associated risks, evaluation of collateral, covenants and monitoring requirements and risk rating rationale.
For purposes of managing credit risk, we separate our loan portfolio into a number of classes, including: commercial non-real estate, agriculture, CRE, residential real estate, consumer and other lending.
The commercial non-real estate lending class includes loans made to small and middle market businesses and loans made to public sector customers. Loans in this class are secured by the operations and cash flows of the borrowers, and any guarantors. Historical loss history and updated loan-to-value information on collateral-dependent loans are the primary factors in determining the allowance for loan losses for the commercial non real estate lending class. Key risk characteristics relevant to the commercial non real estate lending class include the industry and geography of the borrower’s business, purpose of the loan, repayment source, borrower’s debt capacity and financial performance, loan covenants and nature of pledged collateral. We consider these risk characteristics in assigning risk ratings and estimating environmental factors considered in determining the allowance for loan losses.
The agriculture lending class includes loans made to small and mid-size agricultural individuals and businesses. Loans in this class are secured by agricultural real estate, production, cash flows and any guarantors. Historical loss history and updated loan-to-value information on collateral-dependent loans are the primary factors in determining the allowance for loan losses for the agriculture lending class. Key risk characteristics relevant to the agriculture lending class include the geography of the borrower’s operations, commodity prices and weather patterns, purpose of the loan, repayment source, borrower’s debt capacity and financial performance, loan covenants, and nature of pledged collateral. We consider these risk characteristics in assigning risk ratings and estimating environmental factors considered in determining the allowance for loan losses.
The CRE lending class includes loans made to small and middle market businesses, including multifamily properties. Loans in this class are secured by CRE. Historical loss history and updated loan-to-value information on collateral-dependent loans are the primary factors in determining the allowance for loan losses for the CRE lending class. Key risk characteristics relevant to the CRE lending class include the industry and geography of the borrower’s business, purpose of the loan, repayment source, borrower’s debt capacity and financial performance, loan covenants, and nature of pledged collateral. We consider these risk characteristics in assigning risk ratings and estimating environmental factors considered in determining the allowance for loan losses.
The residential real estate lending class includes loans made to consumer customers including residential mortgages, residential construction loans and home equity loans and lines. These loans are typically fixed-rate
120
Table of Contents
loans secured by residential real estate. Home equity lines are revolving accounts giving the borrower the ability to draw and repay balances repeatedly, up to a maximum commitment, and are secured by residential real estate. Home equity lines typically have variable-rate terms that are benchmarked to a prime rate. Historical loss history is the primary factor in determining the allowance for loan losses for the residential real estate lending class. Key risk characteristics relevant to residential real estate lending class loans primarily relate to the borrower’s capacity and willingness to repay and include unemployment rates and other economic factors, and customer payment history. These risk characteristics, among others, are reflected in the environmental factors considered in determining the allowance for loan losses.
The consumer lending class includes loans made to consumer customers including loans secured by automobiles and other installment loans, and the other lending class includes credit card loans and unsecured revolving credit lines. Historical loss history is the primary factor in determining the allowance for loan losses for the consumer and other lending classes. Key risk characteristics relevant to loans in the consumer and other lending classes primarily relate to the borrower’s capacity and willingness to repay and include unemployment rates and other economic factors, and customer payment history. These risk characteristics, among others, are reflected in the environmental factors considered in determining the allowance for loan losses.
We classify all non-consumer loans by credit quality ratings. These ratings are Pass, Watch, Substandard, Doubtful, and Loss. Loans with a Pass and Watch rating represent those loans not classified on our rating scale for problem credits, with loans with a Watch rating being monitored and updated at least quarterly by management. Substandard loans are those where a well-defined weakness has been identified that may put full collection of contractual cash flows at risk. Doubtful loans are those where a well-defined weakness has been identified and a loss of contractual cash flows is known. Substandard and doubtful loans are monitored and updated monthly. All loan risk ratings are updated and monitored on a continuous basis. We generally do not risk rate consumer loans unless a default event such as bankruptcy or extended nonperformance takes place. Alternatively, standard credit scoring systems are used to assess credit risks of consumer loans.
Allowance for Loan Losses and Unfunded Commitments
We maintain an allowance for loan losses at a level management believes is appropriate to reserve for credit losses inherent in our loan portfolio. The allowance for loan losses is determined based on an ongoing evaluation, driven primarily by monitoring changes in loan risk grades, delinquencies and other credit risk indicators, that is inherently subjective.
We consider the uncertainty related to certain industry sectors and the extent of credit exposure to specific borrowers within the portfolio. In addition, consideration is given to concentration risks associated with the various loan portfolios and current economic conditions that might impact the portfolio. We also consider changes, if any, in underwriting activities, the loan portfolio composition (including product mix and geographic, industry, or customer-specific concentrations), trends in loan performance, the level of allowance coverage relative to similar banking institutions and macroeconomic factors, such as changes in unemployment rates, gross domestic product and consumer bankruptcy filings.
All of these estimates are susceptible to significant change. Changes to the allowance for loan losses are made by charges to the provision for loan losses, which is reflected in the consolidated statement of comprehensive income. Loans deemed to be uncollectible are charged off against the allowance for loan losses. Recoveries of amounts previously charged-off are credited to the allowance for loan losses.
The allowance for loan losses consists of reserves for probable losses that have been identified related to specific borrowing relationships that are individually evaluated for impairment, which we refer to in this prospectus as the “specific reserve,” as well as probable losses inherent in our loan portfolio that are not specifically identified, which we refer to in this prospectus as the “collective reserve.”
121
Table of Contents
The specific reserve relates to impaired loans. A loan is impaired when, based on current information and events, it is probable that we will be unable to collect all amounts due (interest as well as principal) according to the contractual terms of the loan agreement. Specific reserves are determined on a loan-by-loan basis based on management’s best estimate of our exposure, given the current payment status of the loan, the present value of expected payments, and the value of any underlying collateral. Impaired loans also include loans modified in troubled debt restructurings where concessions have been granted to borrowers experiencing financial difficulties. These concessions could include a reduction in the interest rate on the loan, payment extensions, forgiveness of principal, forbearance or other actions intended to maximize collection. Generally, the impairment related to troubled debt restructurings is measured based on the fair value of the collateral, less cost to sell, or the present value of expected payments relative to the unpaid principal balance. If the impaired loan is identified as collateral dependent, then the fair value of the collateral method of measuring the amount of the impairment is used. This method requires obtaining an independent appraisal of the collateral and applying a discount factor to the appraised value, if necessary, and including costs to sell.
Management’s estimate for collective reserves reflects losses incurred in the loan portfolio as of the consolidated balance sheet reporting date. Incurred loss estimates are primarily based on historical loss experience and portfolio mix. Incurred loss estimates may be adjusted to reflect current economic conditions and current portfolio trends including credit quality, concentrations, aging of the portfolio, and/or significant policy and underwriting changes.
While management uses the best information available to establish the allowance for loan losses, future adjustments may be necessary if economic conditions differ substantially from the assumptions used in performing the estimates.
Unfunded residential mortgage loan commitments entered into in connection with mortgage loans to be held for sale are considered derivatives and recorded at fair value on the consolidated balance sheet with changes in fair value recorded in other interest income. All other unfunded loan commitments are generally related to providing credit facilities to customers and are not considered derivatives. For purchased loans, the fair value of the unfunded credit commitments is considered in determination of the fair value of the loans recorded at the date of acquisition. Reserves for credit exposure on all other unfunded credit commitments are recorded in other liabilities.
FDIC Indemnification Asset and Clawback Liability
We entered into two loss-sharing agreements with the FDIC in connection with our FDIC-assisted acquisition of TierOne Bank, one covering certain single family residential mortgage loans and one covering commercial loans and other assets. The agreements cover a portion of realized losses on loans, foreclosed real estate and certain other assets. We have recorded assets on the consolidated balance sheets—that is, indemnification assets—representing estimated future amounts recoverable from the FDIC.
Fair values of loans covered by the loss-sharing agreements at the acquisition date were estimated based on projected cash flows available based on the expected probability of default, default timing and loss given default, the expected reimbursement rates (generally 80%) from the FDIC and other relevant terms of the loss-sharing agreements. The initial fair value was established by discounting these expected cash flows with a market discount rate for instruments with like maturity and risk characteristics.
The loss-sharing assets are measured separately from the related loans and foreclosed real estate and recorded as an FDIC indemnification asset on the consolidated balance sheets because they are not contractually embedded in the loans and are not transferrable with the loans should we choose to dispose of them. Subsequent to the acquisition date, reimbursements received from the FDIC for actual incurred losses reduce the carrying amount of the loss-sharing assets. Reductions to expected losses, to the extent such reductions to expected losses are the result of an improvement to the actual or expected cash flows from the covered assets, also reduce the carrying amount of the loss-sharing assets. Additional expected losses, to the extent such expected losses result in
122
Table of Contents
the recognition of an allowance for loan losses, increase the carrying amount of the loss-sharing assets. The corresponding accretion or amortization is recorded as a component of interest income on the consolidated statements of comprehensive income. Although these assets are contractual receivables from the FDIC, there are no contractual interest rates.
As part of the loss-sharing agreements, we also assumed a liability, which we refer to as the FDIC Clawback Liability, to be paid within 45 days subsequent to the maturity or termination of the loss-sharing agreements that is contingent upon actual losses incurred over the life of the agreements relative to expected losses considered in the consideration paid at acquisition date and the amount of losses reimbursed to us under the loss-sharing agreements. The liability was recorded at fair value as of the acquisition date. The fair value was based on a discounted cash flow calculation that considered the formula defined in the loss-sharing agreements and projected losses. The difference between the fair value at acquisition date and the projected losses is amortized through other noninterest expense. As projected losses and reimbursements are updated, as described above, the FDIC Clawback Liability is adjusted and a gain or loss is recorded in other noninterest expense.
Goodwill
Goodwill represents the cost in excess of the fair value of net assets acquired (including identifiable intangibles) in transactions accounted for as business acquisitions. Goodwill is evaluated annually for impairment on the basis of a single reportable segment, consistent with how we prepare and evaluate our financial results. We perform our impairment evaluation in the fourth quarter of each fiscal year. If the implied fair value of goodwill is lower than its carrying amount, goodwill impairment is indicated and goodwill is written down to its implied fair value. Subsequent increases in goodwill are not recognized in the consolidated financial statements.
Core Deposits and Other Intangibles
Intangible assets consist of core deposits, brand intangible, customer relationships and other intangibles. Core deposits represent the identifiable intangible value assigned to core deposit bases arising from purchase acquisitions. Brand intangible represents the value associated with our bank’s charter and our name. Customer relationships intangible represents the identifiable intangible value assigned to customer relationships arising from a purchase acquisition. Other intangibles represent contractual franchise arrangements under which the franchiser grants the franchisee the right to perform certain functions within a designated geographical area.
The methods and lives used to amortize intangible assets are as follows:
| Intangible |
Method |
Years | ||
| Core deposit | Straight-line or effective yield | 4.75–6.20 | ||
| Brand intangible | Straight-line | 15 | ||
| Customer relationships | Straight-line | 8.5 | ||
| Other intangibles | Straight-line | 5 |
Intangible assets are evaluated for impairment if indicators of impairment are identified.
Income Taxes
We file a consolidated income tax return with NAI (a wholly owned subsidiary of NAB). Income taxes are allocated pursuant to a tax-sharing arrangement, whereby we pay federal and state income taxes as if we were filing on a standalone basis. Income tax expense includes two components: current and deferred. Current income tax expense reflects taxes to be paid or refunded for the current period by applying the provisions of the enacted tax law to the taxable income or excess of deductions over income. We determine deferred income taxes using the liability, or balance sheet, method. Under this method, the net deferred tax asset or liability is based on the tax effects of the differences between the book and tax basis of assets and liabilities, and enacted changes in tax rates
123
Table of Contents
and laws are recognized in the period in which they occur. Deferred income tax expense results from changes in deferred tax assets and liabilities between periods.
Deferred tax assets are reduced by a valuation allowance if, based on the weight of evidence available, it is more likely than not that some portion or all of a deferred tax asset will not be realized.
Liabilities related to uncertain tax positions are recognized if it is more likely than not, based on the technical merits, that the tax position will be realized or sustained upon examination (including upon resolution of the related appeals or litigation processes, if any). References to “more likely than not” refer to a likelihood of more than 50 percent. A tax position that meets the more-likely-than-not recognition threshold is initially and subsequently measured as the largest amount of tax benefit that has a greater than 50 percent likelihood of being realized upon settlement with a taxing authority that has full knowledge of all relevant information.
The determination of whether or not a tax position has met the more-likely-than-not recognition threshold considers the facts, circumstances, and information available at the reporting date and is subject to management’s judgment.
We recognize interest and/or penalties related to income tax matters in other interest and noninterest expense.
124
Table of Contents
QUANTITATIVE AND QUALITATIVE DISCLOSURES ABOUT MARKET RISK
Our primary market risk is interest rate risk, which is defined as the risk of loss of net interest income or net interest margin because of changes in interest rates.
We seek to measure and manage the potential impact of interest rate risk. Interest rate risk occurs when interest-earning assets and interest-bearing liabilities mature or re-price at different times, on a different basis or in unequal amounts. Interest rate risk also arises when our assets, liabilities and off-balance sheet contracts each respond differently to changes in interest rates, including as a result of explicit and implicit provisions in agreements related to such assets and liabilities and in off-balance sheet contracts that alter the applicable interest rate and cash flow characteristics as interest rates change. The two primary examples of such provisions that we are exposed to are the duration and rate sensitivity associated with indeterminate-maturity deposits (e.g., non-interest-bearing checking accounts, NOW accounts, savings accounts and MMDAs) and the rate of prepayment associated with fixed-rate lending and mortgage-backed securities. Interest rates may also affect loan demand, credit losses, mortgage origination volume and other items affecting earnings.
Our management of interest rate risk is overseen by our bank’s asset and liability committee based on a risk management infrastructure approved by our board of directors that outlines reporting and measurement requirements. In particular, this infrastructure sets limits and management targets, calculated monthly, for various metrics, including our economic value sensitivity, our economic value of equity and net interest income simulations involving parallel shifts in interest rate curves, steepening and flattening yield curves, and various prepayment and deposit duration assumptions. Our risk management infrastructure also requires a periodic review of all key assumptions used, such as identifying appropriate interest rate scenarios, setting loan prepayment rates based on historical analysis, non-interest-bearing and interest-bearing demand deposit durations based on historical analysis, and the targeted investment term of capital.
We manage the interest rate risk associated with our interest-bearing liabilities by managing the interest rates and tenors associated with our borrowings from the FHLB and deposits from our customers that we rely on for funding. In particular, from time to time we use special offers on deposits to alter the interest rates and tenors associated with our interest-bearing liabilities. We manage the interest rate risk associated with our interest-earning assets by managing the interest rates and tenors associated with our investment and loan portfolios, from time to time purchasing and selling investment securities and selling residential mortgage loans in the secondary market.
We rely on interest rate swaps to hedge our interest rate exposure on commercial non-real estate, CRE and agricultural loans with fixed interest rates of more than 5 years, such as our tailored business loans. As of June 30, 2014, we had a notional amount of $946.8 million of interest rate swaps outstanding. The overall effectiveness of our hedging strategies is subject to market conditions, the quality of our execution, the accuracy of our valuation assumptions, the associated counterparty credit risk and changes in interest rates.
We do not engage in speculative trading activities relating to interest rates, foreign exchange rates, commodity prices, equities or credit.
We do not maintain a portfolio of mortgage servicing rights.
Evaluation of Interest Rate Risk
We use a net interest income simulation model to measure and evaluate potential changes in our net interest income. We run various hypothetical interest rate scenarios at least monthly and compare these results against a scenario with no changes in interest rates. Our net interest income simulation model incorporates various assumptions, which we believe are reasonable but which may have a significant impact on results such as: (1) the timing of changes in interest rates, (2) shifts or rotations in the yield curve, (3) re-pricing characteristics for
125
Table of Contents
market-rate-sensitive instruments on and off balance sheet, (4) differing sensitivities of financial instruments due to differing underlying rate indices, (5) varying loan prepayment speeds for different interest rate scenarios, (6) the effect of interest rate limitations in our assets, such as floors and caps, (7) the effect of our interest rate swaps, and (8) overall growth and repayment rates and product mix of assets and liabilities. Because of limitations inherent in any approach used to measure interest rate risk, simulation results are not intended as a forecast of the actual effect of a change in market interest rates on our results but rather as a means to better plan and execute appropriate asset-liability management strategies and manage our interest rate risk.
Potential changes to our net interest income in hypothetical rising and declining rate scenarios calculated as of September 30, 2013 are presented in the following table. The projections assume (1) immediate, parallel shifts downward of the yield curve of 100 basis points and immediate, parallel shifts upward of the yield curve of 100, 200, 300 and 400 basis points and (2) gradual shifts downward of 100 basis points over 12 months and gradual shifts upward of 100, 200, 300 and 400 basis points over 12 months. In the current interest rate environment, a downward shift of the yield curve of 200, 300 and 400 basis points does not provide us with meaningful results. In a downward parallel shift of the yield curve, interest rates at the short-end of the yield curve are not modeled to decline any further than 0%. For the immediate-shift scenarios, we assume short-term rates follow a forward yield curve throughout the forecast period that is dictated by the instantaneously shocked yield curve from the as of date. In the gradual-shift scenarios, we take each rate across the yield curve from the as of date and shock it by 1/12th of the total change in rates each month for twelve months.
| Estimated Increase (Decrease) in Net Interest Income |
||||||||
| Change in Market Interest Rates as of September 30, 2013 |
Fiscal Year Ending September 30, 2014 |
Fiscal Year Ending September 30, 2015 |
||||||
| Immediate Shifts |
||||||||
| +400 basis points |
22.11 | % | 17.61 | % | ||||
| +300 basis points |
16.48 | % | 13.30 | % | ||||
| +200 basis points |
10.75 | % | 8.89 | % | ||||
| +100 basis points |
5.03 | % | 4.48 | % | ||||
| -100 basis points |
(4.56 | )% | (5.13 | )% | ||||
| Gradual Shifts |
||||||||
| +400 basis points |
5.91 | % | ||||||
| +300 basis points |
4.21 | % | ||||||
| +200 basis points |
2.59 | % | ||||||
| +100 basis points |
1.06 | % | ||||||
| -100 basis points |
(0.77 | )% | ||||||
126
Table of Contents
We primarily use interest rate swaps to ensure that long-term fixed-rate loans are effectively re-priced as short-term rates change, which we believe would allow us to achieve these results. We believe recent changes in the composition of our deposit base and our loan prepayment expectations have resulted in a shift in our net interest income sensitivity since the end of fiscal year 2013 shown above. In particular, we believe the average duration of our deposit mix has shifted since the end of fiscal year 2013 as portions of our deposits have shifted from time deposits, which are less interest rate sensitive as a result of their fixed duration and interest rate, to demand and money market deposits, which re-price more rapidly in a changing interest rate environment and are more interest rate sensitive. We also expect a reduction in the rate of loan prepayments compared with our expectations at the end of fiscal year 2013 in an environment with gradually rising interest rates. Potential changes to our net interest income in hypothetical rising and declining scenarios as of June 30, 2014 are presented in the following table using the same interest rate shifts and assumptions as used for the presentation as of September 30, 2013 above.
| Estimated Increase (Decrease) in Net Interest Income |
||||||||
| Change in Market Interest Rates as of June 30, 2014 |
Twelve Months Ending June 30, 2015 |
Twelve Months Ending June 30, 2016 |
||||||
| Immediate Shifts |
||||||||
| +400 basis points |
16.28 | % | 9.17 | % | ||||
| +300 basis points |
12.24 | % | 7.10 | % | ||||
| +200 basis points |
8.05 | % | 4.90 | % | ||||
| +100 basis points |
3.84 | % | 2.61 | % | ||||
| -100 basis points |
(2.33 | )% | (2.38 | )% | ||||
| Gradual Shifts |
||||||||
| +400 basis points |
2.04 | % | ||||||
| +300 basis points |
1.30 | % | ||||||
| +200 basis points |
0.63 | % | ||||||
| +100 basis points |
0.10 | % | ||||||
| -100 basis points |
(0.44 | )% | ||||||
The results of this simulation analysis are hypothetical, and a variety of factors might cause actual results to differ substantially from what is depicted. For example, if the timing and magnitude of interest rate changes differ from those projected, our net interest income might vary significantly. Non-parallel yield curve shifts such as a flattening or steepening of the yield curve or changes in interest rate spreads, would also cause our net interest income to be different from that depicted. An increasing interest rate environment could reduce projected net interest income if deposits and other short-term liabilities re-price faster than expected or faster than our assets re-price. Actual results could differ from those projected if we grow assets and liabilities faster or slower than estimated, if we experience a net outflow of deposit liabilities or if our mix of assets and liabilities otherwise changes. Actual results could also differ from those projected if we experience substantially different repayment speeds in our loan portfolio than those assumed in the simulation model. Finally, these simulation results do not contemplate all the actions that we may undertake in response to potential or actual changes in interest rates, such as changes to our loan, investment, deposit, funding or hedging strategies.
127
Table of Contents
Our Business
We are a full-service regional bank holding company focused on relationship-based business and agribusiness banking. We serve our customers through 162 branches in attractive markets in seven states: South Dakota, Iowa, Nebraska, Colorado, Arizona, Kansas and Missouri. We were established more than 70 years ago and have achieved strong market positions by developing and maintaining extensive local relationships in the communities we serve. By leveraging our business and agribusiness focus, presence in attractive markets, highly efficient operating model and robust approach to risk management, we have achieved significant and profitable growth—both organically and through disciplined acquisitions. We have successfully completed eight acquisitions since 2006, including our 2010 FDIC-assisted acquisition of TierOne Bank, which represented approximately $2.5 billion in acquired assets. Our net income was $77.1 million for the nine months ended June 30, 2014 and $96.2 million for the twelve months ended September 30, 2013, representing a CAGR of 21% from fiscal year 2009 to fiscal year 2013 and a 32% increase from fiscal year 2012 to fiscal year 2013. Our cash net income, which is our net income excluding amortization and related tax effects associated with intangible assets, was $88.1 million for the nine months ended June 30, 2014 and $112.3 million for fiscal year 2013, representing a 26% increase from fiscal year 2012 to fiscal year 2013. Our total assets were $9.29 billion at June 30, 2014, and on an annualized basis, our net charge-offs for the nine months ended June 30, 2014 represented 14 basis points of our average total loans. Since fiscal year 2009, we have also operated with efficiency ratios superior to our peer median.(1) For fiscal year 2013, we achieved a return on average total assets of 1.07% and a return on average tangible common equity of 17.5%. For more information on our cash net income and return on average tangible common equity, see “—Summary Historical Consolidated Financial and Operating Information.”
The following table illustrates our net income over the periods indicated:
Net Income ($MM)(2)
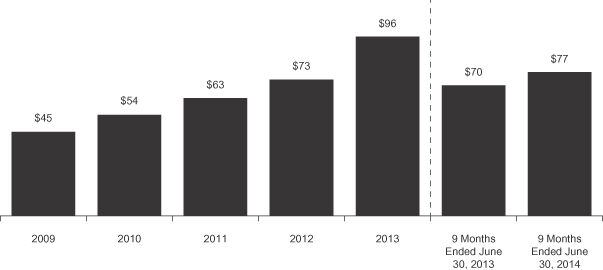
| (1) | For a discussion of the manner in which our efficiency ratios are calculated, see “—Our Competitive Strengths—Highly Efficient Operating Model.” |
| (2) | For the fiscal years ended September 30, except as otherwise indicated. |
128
Table of Contents
We focus on business and agribusiness banking, complemented by retail banking and wealth management services. Our loan portfolio consists primarily of business loans, comprised of C&I loans and CRE loans, and agribusiness loans. At June 30, 2014, our business and agribusiness loans collectively accounted for 85% of our total loan portfolio. In addition, 61% of our aggregate loan portfolio, comprising our CRE loans (representing 36% of our aggregate loan portfolio), residential real estate loans (representing 14% of our aggregate loan portfolio) and agriculture real estate loans (representing 11% of our aggregate loan portfolio), was primarily secured by interests in real estate predominantly located in the states in which we operate at June 30, 2014, and some of our other lending occasionally involves taking real estate as primary or secondary collateral. We offer small and mid-sized businesses a focused suite of financial products and have established strong relationships across a diversified range of sectors, including key areas supporting regional growth such as agribusiness services, freight and transport, healthcare and tourism. We have developed extensive expertise in agribusiness lending, which serves one of the most prominent industries across our markets, and we offer a variety of financial services designed to meet the specific needs of our agribusiness customers. We also provide a range of deposit and loan products to our retail customers through several channels, including our branch network, online banking system, mobile banking applications and customer care centers. In our wealth management business, we seek to expand our private banking, financial planning, investment management and insurance operations to better position us to capture an increased share of the business of managing the private wealth of many of our business and agribusiness customers.
Our banking model seeks to balance the best of being a “big enough” & “small enough” bank, providing capabilities typical of a much larger bank, such as diversified product specialists, customized banking solutions and multiple delivery channels, with a customer-focused culture usually associated with smaller banks. Our focus on balancing these capabilities with a service-oriented culture is embedded within our operations and is enhanced by focusing on our core competencies. We are well recognized within our markets for our relationship-based banking model that provides for local, efficient decision making. We believe we serve our customers in a manner that is responsive, flexible and accessible. Our relationship bankers strive to build deep, long-term relationships with customers and understand the customers’ specific needs to identify appropriate financial solutions. We believe we have been successful in attracting customers from larger competitors because of our flexible approach and the speed and efficiency with which we provide customers with banking solutions while maintaining disciplined underwriting standards.
129
Table of Contents
Market Opportunity
We operate 162 branches located in 116 communities in seven states. In 2007, we began operating in Arizona with our acquisition of Sunstate Bank. In 2009, we expanded our footprint into Colorado through our acquisition of First Community Bank’s Colorado franchise. In 2010, we significantly expanded our presence in Nebraska through our acquisition of TierOne Bank.
Geographic Footprint
We believe that the states in which we operate present attractive opportunities for our banking model.
The economies of Nebraska, Iowa and South Dakota are growing. According to the Bureau of Economic Analysis, real GDP growth in these states from 2009 to 2013 has been faster than national real GDP growth, with real GDP in these states growing at a CAGR of 2.7% compared to 2.0% for the nation. According to the Bureau of Labor Statistics of the U.S. Department of Labor, overall unemployment rates for July 2014 in these states were also below the 6.2% U.S. national seasonally adjusted unemployment rate for July 2014, with Nebraska tied for 2nd lowest, South Dakota tied for 4th lowest and Iowa tied for 9th lowest seasonally adjusted unemployment rate in the country.
Markets in each of Arizona and Colorado are recognized as fast-growing and dynamic economies. For example, according to data from SNL Financial, the populations of Phoenix and Denver are expected to grow by 5.3% and 9.9%, respectively, from 2014 through 2019. The U.S. Census Bureau estimates that, as of July 1, 2013, Phoenix had a population of 1.5 million and was the sixth-largest city in the United States. According to Moody’s Analytics, Arizona ranks first among U.S. states for projected employment growth from 2013 through 2018 and Colorado ranks fifth.
130
Table of Contents
Nebraska, Iowa, South Dakota, Arizona and Colorado are each home to a number of small and mid-sized businesses across a diverse range of sectors and together serve as the corporate headquarters for several Fortune 500 companies. The economies within these states represent a diverse range of industries, with manufacturing, trade, agriculture, professional and business services, finance and insurance, and government accounting for approximately 56% of real GDP in these states in 2013 according to the Bureau of Economic Analysis. We expect strong population and job growth will lead to an increased need for business banking services, more deposits and an increased credit demand to fund ongoing capital investments and working capital, cash management solutions and credit cards, among other products and services. We believe integrated banking support is important to providing a focused suite of services to meet the evolving needs of business customers in our markets.
Agribusiness customers in Nebraska, Iowa, South Dakota, Arizona and Colorado produce and raise a variety of grains, proteins and other produce, including corn, soybeans, wheat, dairy products, beef cattle, hogs and vegetables. These products are consumed globally as foods and also serve as inputs for goods made by other industries. Agriculture, as defined by the Bureau of Economic Analysis, has grown faster than the U.S. economy as a whole, with real agricultural GDP growing at a CAGR of 3.4% nationally from 2009 to 2013 compared to a CAGR of 2.0% for the United States over the same period. The value of U.S. agricultural exports is also expected to grow by 26% from 2014 through 2023 according to the USDA. In addition, there has been a growing emphasis on research and development and technology in the agricultural sector, with consumers and producers focused on sustainable methods of food production, particularly with a view to decreasing their reliance on non-renewable inputs.
We believe increasing demand for agricultural products and changing agricultural industry dynamics will continue to drive the need for banking services in our markets, particularly from banks such as ours that understand, and provide products and services that specifically address, the unique needs of our agribusiness customers. We believe that we are well positioned to continue to serve the banking needs of small and mid-sized businesses and the agribusiness sector.
Our Competitive Strengths
We attribute our success to the following competitive strengths, among others:
Focus on Business Banking
We focus on business banking, and this focus contributes significantly to our profitability and growth. As of June 30, 2014, business banking accounted for approximately 60% of our loan portfolio, with C&I loans representing 24%, owner-occupied CRE loans representing 17% and other CRE loans representing 19% of our total loan portfolio. From September 30, 2009 through June 30, 2014, our business banking loan portfolio has grown by over 80%. We believe we have developed a strong brand and market reputation in business banking within the markets we serve by focusing on our core competencies. We provide business banking services to small and mid-sized businesses across a diverse range of industries that support economic growth in the markets in which our business banking customers operate. We offer our business banking customers focused banking services designed to meet the specific needs of their businesses. We have a significant presence in attractive markets, particularly markets such as Omaha, Des Moines and Sioux Falls, which we believe are located in growing economies and present opportunities to increase our business banking activities.
Specialized Agribusiness Expertise
In addition to business banking, we focus on agribusiness banking. According to the American Bankers Association, at June 30, 2014, we were ranked the eighth-largest farm lender bank in the United States measured by total dollar volume of farm loans. We have been providing banking services to the agricultural community since our bank was founded in 1935. We have developed extensive expertise and brand recognition in agribusiness lending,
131
Table of Contents
which is one of the fastest growing industries in our markets and is the largest single industry sector that we serve. At June 30, 2014, our agribusiness loan portfolio was balanced among the major types of agricultural production in our footprint—grains (primarily corn, soybeans and wheat) representing 38% of our agribusiness loan portfolio, proteins (primarily beef cattle, dairy products and hogs) representing 47% of our agribusiness loan portfolio, and other (including cotton and vegetables) representing 15% of our agribusiness loan portfolio. We have grown our agribusiness lending significantly in recent years through our focus on expansion within the markets in our footprint and the recruitment of specialist relationship bankers with a deep understanding of, and strong relationships with customers in, the agriculture industry. Our agribusiness loan portfolio represented 25% of our total loan portfolio at June 30, 2014, having grown at a CAGR of 24% from September 30, 2009 to September 30, 2013. In our most recent fiscal year, our agribusiness loan portfolio grew 14% from September 30, 2012 to September 30, 2013. In addition, we estimate that 10% of our C&I loans and owner-occupied CRE loans are agriculture-related loans, as of June 30, 2014.
Track Record of Strong and Disciplined Growth
We have a track record of combining organic expansion with strategic acquisitions to achieve strong overall growth. Our record of steadily growing and successfully operating our business is demonstrated by our:
| • | Balance sheet growth: From September 30, 2009 to September 30, 2013, we have grown our total assets at a CAGR of 15%, our loan portfolio at a CAGR of 17% and our deposit base at a CAGR of 16%. This growth was primarily generated by our acquisition of TierOne Bank in 2010, which represented approximately $2.5 billion of our $3.1 billion total asset growth in fiscal year 2010. From September 30, 2012 to September 30, 2013, our total assets, loan portfolio and deposit base grew by 1%, 4% and 1%, respectively, as our loan growth drove continued asset growth, despite being offset by a reduction in the size of our investment portfolio. At June 30, 2014, we had $9.29 billion in total assets, $6.68 billion in loans and $7.07 billion in deposits, representing growth of 2%, 5% and 2%, respectively, compared with September 30, 2013; |
| • | Earnings growth: We have increased our net income to $96.2 million for fiscal year 2013, representing a CAGR of 21% from fiscal year 2009 and an increase of 32% from fiscal year 2012. Our net income was $77.1 million for the nine months ended June 30, 2014, an increase of 10% compared with the same period in fiscal year 2013; and |
| • | Return on assets and equity: For fiscal year 2013, we achieved a 1.07% return on average total assets and a 17.5% return on average tangible common equity. |
For more information on our return on average tangible common equity, see “Prospectus Summary—Summary Historical Consolidated Financial and Operating Information.”
We have achieved organic growth by increasing our market share in select markets and entering new markets. We have been successful at recruiting and retaining relationship bankers with extensive industry expertise. We have also developed streamlined processes that allow us to be responsive, flexible and accessible to our customers, which we believe has allowed us to attract new customers and grow our loan portfolio and deposit base. We have achieved this growth while maintaining strong asset quality, with annual net charge-offs peaking at 88 basis points of average loans for fiscal year 2011 and declining to 44 basis points of average loans for fiscal year 2013.
Our organic growth has been supplemented by our disciplined acquisition strategy led by our experienced management team. We seek to maximize the success of our acquisitions through a well-established integration process. We have successfully leveraged our business banking model with our specialized agribusiness expertise to expand our footprint through eight acquisitions since 2006, including our 2010 FDIC-assisted acquisition of TierOne Bank, which represented approximately $2.5 billion in acquired assets. We expect to continue to opportunistically pursue acquisitions consistent with our strategic objectives, although we do not have any current agreements, arrangements or understandings regarding future acquisitions.
132
Table of Contents
The following chart shows our loan portfolio and the portion of our loans acquired through acquisitions completed since September 30, 2009:
Loans ($BN)(1)
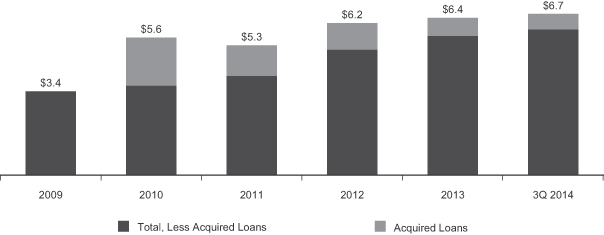
| (1) | At September 30 of each year, other than 3Q 2014 information, which is at June 30, 2014. |
| (2) | Acquired loans includes all loans acquired in acquisitions completed after September 30, 2009. |
Through organic growth and acquisitions, we have grown our total loan portfolio to $6.68 billion at June 30, 2014. As illustrated above, from September 30, 2009 to June 30, 2014 our total loan portfolio, less acquired loans, has grown from $3.4 billion to $6.1 billion, representing a CAGR of 13%.
Highly Efficient Operating Model
We believe our highly efficient and scalable operating model has enabled us to operate profitably, remain competitive, increase market share and develop new business. We emphasize company-wide operating principles focused on proactive expense management, targeted investment, disciplined lending practices and focused product offerings. We have achieved cost efficiencies by consolidating our branch network through the closure of less profitable locations and through our demonstrated success in acquiring and integrating banks. We have also achieved significant cost efficiencies through the use of the Kaizen & Lean principles, which are management techniques for improving processes and reducing waste, to eliminate redundancies and improve the efficient allocation of resources throughout our operations. We believe our focus on operating efficiency has contributed significantly to our return on equity, return on assets and net income and is reflected in our efficiency ratios presented below.
133
Table of Contents
Efficiency Ratios(1)
| Peer | Median Source: SNL Financial. |
| (1) | For the twelve months ended September 30, except as otherwise indicated. |
| (2) | One financial measure we use to evaluate our operational efficiency is our efficiency ratio. The graph presents our efficiency ratio calculated on both an adjusted and unadjusted basis. We compute our adjusted efficiency ratio as the ratio of our noninterest expense, which excludes amortization of core deposits and other intangible assets, to our total revenue (equal to the sum of net interest income and noninterest income) on a fully taxable equivalent basis. For purposes of calculating our adjusted efficiency ratio, our noninterest expense and total revenue exclude the effects of changes in the fair value related to fluctuations in interest rates on certain of our long-term fixed-rate loans and related interest rate swaps used to manage the interest rate risk associated with these loans, each of which is accounted for at fair value. Any changes in fair value related to interest rates of our long-term fixed-rate loans and related interest rate swaps associated with interest rate fluctuations are completely offset in our results of operations. Changes in fair value related to interest rates attributable to fixed-rate loans subject to fair value accounting are recorded in interest income and changes attributable to the derivatives hedging these loans are recorded in noninterest expense. Our unadjusted efficiency ratio, by contrast, is calculated in a manner consistent with that of our peer group described below and does not adjust for the effects of these changes in fair value. Including these amounts increases or decreases both our interest income and noninterest expense in a way we believe does not reflect our results of our operations, materially distorting our efficiency ratio and the related trends. Even without adjusting for the effects of these changes in fair value related to interest rate fluctuations, our unadjusted efficiency ratio continues to be below the peer group median for each period presented. For more information on each of these measures, including a reconciliation to the most directly comparable GAAP financial measure, see “Prospectus Summary—Summary Historical Consolidated Financial and Operating Information.” |
| (3) | Our “peers” refer, collectively, to all publicly listed U.S. bank holding companies with total assets between $5 billion and $15 billion at June 30, 2014. For each period, the peer group excludes any bank holding company for which data was not available for such period. SNL Financial calculates peer efficiency ratios for all twelve-month periods as the ratio of noninterest expense, which excludes amortization of intangible assets, to the sum of net interest income on a fully taxable equivalent basis and noninterest income. We calculated peer efficiency ratios for the nine months ended June 30, 2014 based on the same methodology, with data obtained from SNL Financial. As discussed above, our unadjusted efficiency ratio is also calculated in the same manner for each period presented in the graph while our methodology for calculating our adjusted efficiency ratios is different from SNL Financial’s because we exclude the effects of changes in the fair value related to fluctuations in interest rates on certain of our long-term fixed-rate loans and related interest rate swaps used to manage the interest rate risk associated with these loans, each of which is accounted for at fair value. Including these amounts would increase or decrease either our interest income or noninterest expense in a way we believe does not reflect the results of our operations, materially distorting our efficiency ratio and the related trends. Therefore, our adjusted efficiency ratio and those of our peers may not be directly comparable. |
134
Table of Contents
Disciplined Risk Management
Risk management is a core competency of our business, and we believe that our risk management approach is more robust than that of most U.S. banks our size. Following the acquisition of us by NAB, we expanded our risk management staff significantly to conform to NAB’s global standards. We have also implemented comprehensive policies and procedures for credit underwriting and monitoring of our loan portfolio, including strong credit practices among our relationship bankers, allowing credit decisions to be made efficiently on a local basis consistent with our underwriting standards. We were able to remain profitable while maintaining strong asset quality through the financial crisis, in part due to our focus on our core business and adherence to our disciplined risk management. We believe our robust approach to risk management has enabled us to grow our loan portfolio without compromising credit quality. By focusing on our core areas of expertise, we largely avoided higher-risk lending practices that impacted other lenders in the industry during 2009 to 2011.
The following chart shows our annual net charge-offs as a percentage of average loans for fiscal year 2009 through fiscal year 2013, and for the nine months ended June 30, 2014, compared to the median of our peers:
Annual Net Charge-offs as a Percentage of Average Loans(1)
Peer Median Source: SNL Financial.
| (1) | For the twelve months ended September 30, except as otherwise indicated. Information for the nine months ended June 30, 2014 is computed on an annualized basis. For each period, the peer group excludes any bank holding company for which data was not available for such period. |
| (2) | Our “peers” refer, collectively, to all publicly listed U.S. bank holding companies with total assets between $5 billion and $15 billion at June 30, 2014. |
Experienced Management Team With Local Market Experience
Our senior management team, led by Ken Karels, our President and Chief Executive Officer, has a long and successful history of managing financial institutions in the region and, in particular, significant experience in business and agribusiness lending, with an average of over 25 years of banking experience. Our senior management team has a demonstrated track record of managing profitable growth, successfully executing and integrating acquisitions, improving operating efficiencies, maintaining a strong risk management culture and implementing a relationship-based and service-focused approach to banking.
135
Table of Contents
Our Business Strategy
We believe that stable long-term growth and profitability are the result of building strong customer relationships while maintaining disciplined underwriting standards. We plan to focus on originating high-quality loans and growing our low-cost deposit base through our relationship-based business and agribusiness banking. We believe that continuing to focus on our core strengths will enable us to gain market share, continue to improve our operational efficiency and increase profitability. The key components of our strategy for continued success and future growth include the following:
Attract and Retain High-Quality Relationship Bankers
A key component of our growth in our existing markets and entry into new markets has been our ability to attract and retain high-quality relationship bankers. We have recruited approximately 40 new business and agribusiness relationship bankers since January 1, 2011 (out of a total of approximately 160 business and agribusiness relationship bankers at June 30, 2014), with average industry experience of over 15 years when hired. We believe we have been successful in recruiting qualified relationship bankers due primarily to our decentralized management approach, focused product suite and flexible and customer-focused culture while continuing to provide sophisticated banking capabilities to serve our customers’ needs. We intend to continue to hire experienced relationship bankers to execute our relationship-driven banking model. We utilize a variable compensation structure designed to incentivize our relationship bankers by tying their compensation to their individual overall performance and the performance of the loans that they help originate, which we measure based on revenues, return on assets and asset quality/risk, among other things. We believe this structure establishes the appropriate incentives to maximize performance and satisfy our risk management objectives. By leveraging the strong networks and reputation of our experienced relationship bankers, we believe we can continue to grow our loan portfolio and deposit base as well as cross-sell other products and services.
Optimize Footprint in Existing and Complementary Markets
We pursue attractive growth opportunities to expand within our existing footprint and enter new markets aligned with our business model and strategic plans. We believe we can increase our presence in under-represented areas in our existing markets and broaden our footprint in attractive markets adjacent and complementary to our current markets by continuing our emphasis on business and agribusiness banking. Our branch strategy is guided by our ability to recruit experienced relationship bankers in under-represented and new markets. These bankers expand our banking relationships into these markets prior to opening a branch, which increases our likelihood of expanding profitably by developing an asset base before we establish a branch in that market. We will continue to opportunistically consider opening new branches. We intend to capitalize on growth opportunities we believe exist in growing economies in and adjacent to our existing markets.
Deepen Customer Relationships
We believe that our reputation, expertise and relationship-based banking model enables us to deepen our relationships with our customers. We look to leverage our relationships with existing customers by cross-selling our products and services. We have sought to grow our low-cost customer deposit base by attracting more deposits from our business and agribusiness customers. We offer alternative cash management solutions intended to help retain business customers. We seek to expand and enhance our wealth management platform through focused product offerings that we believe will appeal to our more affluent customers. We intend to continue to capitalize on opportunities to capture more business from existing customers throughout our banking network.
Continue to Improve Efficiency and Lower Costs
We believe that our focus on operational efficiency, even in light of incremental costs from being a public company, is critical to our profitability and future growth. We intend to carefully manage our cost structure and continuously refine and implement internal processes to create further efficiencies and enhance our earnings. We
136
Table of Contents
continue to optimize our branch network and have commenced reviews of additional internal processes and our vendor relationships, with a view to identifying opportunities to further improve efficiency and enhance earnings. We are also continuing our efforts to shift our deposit base to lower-cost customer deposits, a strategic initiative that has been primarily responsible for driving our cost of deposit funding down since September 30, 2012. We believe our scalable systems, risk management infrastructure and operating model will better enable us to achieve further operational efficiencies as we grow our business.
Opportunistically Pursue Acquisitions
Our management team has extensive expertise and a successful track record in evaluating, executing and integrating attractive, franchise-enhancing acquisitions. We will continue to consider acquisitions that are consistent with our business strategy and financial model as opportunities arise. Illustrated below, as of September 30 of each indicated year, is the growth in our total assets as a result of our acquisitions in that fiscal year.

| (1) | Acquired assets are the total of the fair value of assets acquired and the net cash and cash equivalents received at the time of acquisition in each indicated year. |
We believe acquisition opportunities will continue to arise within our markets, as well as in familiar and complementary markets.
Our Business Lines
Business Banking
Business banking is a key focus of our business model and is one of our core competencies. We provide business banking services to small and mid-sized businesses across a diverse range of industries, including key sectors supporting regional growth such as ancillary agribusiness services (e.g., farm equipment suppliers and grain and seed merchants), freight and transport, healthcare (e.g., hospitals, physicians, care facilities and dentists) and tourism. We offer our business banking customers a focused range of financial products, including loans, lines of credit, cash management services, online business deposit and wire transfer services, in addition to
137
Table of Contents
checking and savings accounts and corporate credit cards. At June 30, 2014, business banking represented $2.08 billion in deposits and $4.03 billion in loans, representing 30% and 60%, respectively, of our total volumes.
Our business banking model is based on a fundamental understanding of the communities we serve and the banking needs of our customers. Our bank employs experienced relationship bankers across our footprint, each of whom offers our bank’s suite of business banking products and services to our customers. Our relationship bankers strive to build deep, long-term customer relationships with our banking customers and to understand our customers’ specific needs to identify appropriate financial solutions.
Our business banking lending portfolio comprises C&I and CRE loans. C&I loans represent one of our core competencies in business banking. We offer a focused range of lending products to our C&I customers, including working capital and other shorter-term lines of credit, fixed-rate loans over a wide range of terms, including our tailored business loans, and variable-rate loans with varying terms. CRE loans include both owner-occupied CRE and non-owner-occupied CRE loans, multifamily residential real estate loans and construction and development loans. CRE lending is a significant component of our overall loan portfolio, but we are focused on managing our exposure to construction and development lending, in particular, which we believe is relatively riskier than other types of CRE lending, including owner-occupied CRE lending. The composition of our business lending, as of June 30, 2014, is as follows:
| June 30, 2014 | ||||||||||||||||||||||||||||
| Nebraska | Iowa / Kansas / Missouri |
South Dakota |
Arizona / Colorado |
Other(1) | Total | % of Total Loan Unpaid Principal Balance |
||||||||||||||||||||||
| (dollars in thousands) | ||||||||||||||||||||||||||||
| C&I loans |
$ | 380,098 | $ | 712,837 | $ | 301,579 | $ | 188,910 | $ | 38,525 | $ | 1,621,949 | 24.2 | % | ||||||||||||||
| Owner-occupied CRE loans |
241,152 | 357,747 | 254,867 | 252,110 | 10,631 | 1,116,507 | 16.6 | % | ||||||||||||||||||||
| Non-owner-occupied CRE loans |
147,891 | 236,139 | 315,203 | 155,594 | 22,197 | 877,024 | 13.1 | % | ||||||||||||||||||||
| Construction and development loans |
89,795 | 69,242 | 72,950 | 23,501 | 18,482 | 273,970 | 4.1 | % | ||||||||||||||||||||
| Multifamily residential real estate loans |
39,594 | 24,486 | 39,019 | 20,683 | 15,642 | 139,424 | 2.1 | % | ||||||||||||||||||||
|
|
|
|
|
|
|
|
|
|
|
|
|
|
|
|||||||||||||||
| Total business loans |
$ | 898,530 | $ | 1,400,451 | $ | 983,618 | $ | 640,798 | $ | 105,477 | $ | 4,028,874 | 60.1 | % | ||||||||||||||
|
|
|
|
|
|
|
|
|
|
|
|
|
|
|
|||||||||||||||
| (1) | Balances in this column represent acquired workout loans and certain other loans managed by our staff, commercial credit card loans, fair value adjustments related to acquisitions and loans for which we have elected the fair value option, which could result in a negative carrying amount in the event of a net negative fair value adjustment. |
138
Table of Contents
The compositions of our C&I and CRE loan portfolios, aggregated by customer exposure as of June 30, 2014, are diversified across loan sizes, as set forth below:
C&I and CRE Loan Portfolio Compositions
| C&I | CRE | |
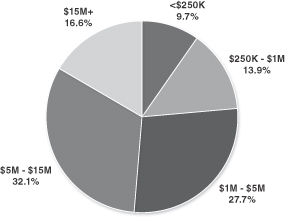
|
| |

Agribusiness Banking
In addition to business banking, we consider agribusiness lending one of our core competencies. We have developed extensive expertise in agribusiness lending and provide loans and banking services to agribusiness customers across our geographic footprint. We predominantly lend to grain and protein producers who produce a range of agricultural commodities. Our agribusiness customers range in size from small, family farms to large, commercial farming operations.
139
Table of Contents
At June 30, 2014, our gross agribusiness loan portfolio was $1.65 billion, representing 25% of our bank’s $6.71 billion in total gross lending. Our agribusiness loan portfolio is balanced among the major types of agricultural production undertaken in our footprint, with grains (primarily corn, soybeans and wheat) representing 38% of our agribusiness loan portfolio; proteins representing 47% of our agribusiness loan portfolio (primarily beef cattle, dairy products and hogs); and other products representing 15% of our agribusiness loan portfolio (including cotton, trees, fruits and nuts and vegetables, among others), as set forth below:
Agribusiness Loan Portfolio
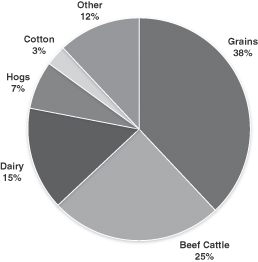
The composition of our agribusiness lending portfolio is also geographically diversified across our locations in our four business regions, as set forth below:
| June 30, 2014 | ||||||||
| Agribusiness Loans | % of Agribusiness Loan Portfolio |
|||||||
| (dollars in millions) | ||||||||
| South Dakota |
$ | 576 | 34.9 | % | ||||
| Arizona and Colorado |
494 | 30.0 | % | |||||
| Iowa, Kansas and Missouri |
437 | 26.5 | % | |||||
| Nebraska |
138 | 8.4 | % | |||||
| Other(1) |
4 | 0.2 | % | |||||
|
|
|
|
|
|||||
| Total |
$ | 1,649 | 100.0 | % | ||||
|
|
|
|
|
|||||
| (1) | Balances in this row represent acquired workout loans and certain other loans managed by our staff, fair value adjustments related to acquisitions and loans for which we have elected the fair value option, which could result in a negative carrying amount in the event of a net negative fair value adjustment. |
We offer a number of products to meet our agribusiness customers’ banking needs, from short-term working capital funding to long-term land-related lending, as well as other tailored services. Through relationships with insurance agencies, we offer and sell crop insurance that can provide farms with options for financial protection from various events, including flood, drought, hail, fire, disease, insect damage, wildfire and earthquake. We service our agribusiness customers through dedicated relationship bankers with deep industry/sector knowledge, supplemented by a team of local bankers focused on agriculture who build long-term relationships with customers.
140
Table of Contents
Retail Banking
Retail banking provides a source of low-cost funds and deposit-related fee income. Our branch network consists of 162 branch offices located in 116 communities. Our branch network enhances our ability to gather deposits, expand our brand presence, service our customers’ needs, originate loans and maintain our lending relationships.
We offer traditional banking products to our retail customers, including checking accounts, savings and money market accounts, individual retirement accounts, or IRAs, and CDs. As the banking industry continues to experience broader customer acceptance of online and mobile banking tools for conducting basic banking functions and retail customers use branch locations with less frequency than they have historically, we serve our customers through a wide range of non-branch channels, including online, telephone and mobile banking platforms. In addition, we continue to optimize our branch network and have closed less profitable branches. We continue to strive to optimize the effectiveness of our distribution channels and increase our operational efficiency to adapt to increasing customer preferences for self-service banking capabilities. We have ATMs at 155, or 96%, of our branches and have another 41 company-owned ATMs at off-site locations. We are part of the MoneyPass, SHAZAM and NETS networks, enabling our customers to take out cash surcharge-free and service charge-free at over 25,000 ATM locations across the country.
Our retail branch network is spread among our four regions as follows:
| June 30, 2014 | ||||||||
| Number of branches | % of branches | |||||||
| South Dakota |
25 | 15 | % | |||||
| Arizona and Colorado |
27 | 17 | % | |||||
| Iowa, Kansas and Missouri |
54 | 33 | % | |||||
| Nebraska |
56 | 35 | % | |||||
|
|
|
|
|
|||||
| Total |
162 | 100 | % | |||||
|
|
|
|
|
|||||
We also provide a variety of loan products to individuals. At June 30, 2014, our residential real estate and consumer portfolio was $1.00 billion, representing 15% of our total lending, and comprised residential mortgage loans, home equity loans and home equity lines of credit and general lines of credit, and auto loans and other loans. We also have a small amount of consumer credit card balances outstanding. In addition to retail loans held in our portfolio, we also originate residential mortgage loans for resale (including their servicing) on the secondary market and, in the nine months ended June 30, 2014, we originated $149.0 million of these loans. We have a retail and mortgage loan officer base of 411 individuals. Home equity originations (including residential mortgages) are sourced almost exclusively through our branch network. Our home equity loan portfolio is conservatively underwritten, including assessment of the borrower’s FICO score and the loan-to-value ratio. See “—Loans—Underwriting Principles” for discussion of our credit underwriting standards.
Wealth Management
We also provide our customers with a selection of wealth management solutions, including financial planning, private banking, investment management and trust services through associations with third party vendors, including a registered broker-dealer and investment adviser. Our investment representatives offer our customers investment management services through our branch network that entail overseeing and recommending investment allocations between asset classes based on review of a client’s risk tolerance, and they can offer and sell insurance solutions, including life insurance. We also offer trust services, including personal trusts and estate planning. At June 30, 2014 our investment representatives had $517 million in assets under management, and, through our trust services group, we had $710 million in assets under management, for a combined total of $1.23 billion in assets under management. Enhancing and expanding our wealth management business is an important component of our strategic plan, as we believe it can deepen our customer relationships, create cross-selling opportunities and drive stable and recurring revenue.
141
Table of Contents
Loans
Overview
Our loan portfolio consists primarily of C&I, CRE and agribusiness loans. We also originate residential real estate loans, personal loans, home equity loans, lines of credit, credit cards and auto loans. As described below, our loan portfolio is diversified across our customer base, and less than 1% of the portfolio is unsecured.
The following chart sets forth the composition of our loan portfolio by loan category as of June 30, 2014:
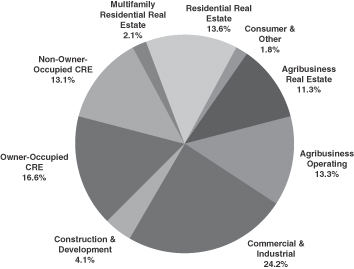
Our underwriting standards, discussed below, require portfolio diversification across geographies, industries and customers. Our lending is spread among our four geographic regions, with each region representing between 19% and 33% of our lending portfolio at June 30, 2014. Within each region, our lending is also diversified across our lending categories referenced above. We are also diversified within these categories. For example, within agribusiness lending, our portfolio is diversified across grain, protein and other types of agribusiness, and we offer our customers federally subsidized crop insurance for a range of crops. Our C&I and owner-occupied CRE lending categories are well diversified, with no individual industry comprising more than 6% of lending in these combined categories. See “—Our Business Lines—Agribusiness Banking” for information about the composition of our agribusiness loan portfolio and “—Our Business Lines—Business Banking” for information about the composition of our business banking loan portfolio. At a customer level, our largest exposure represents 1% of our total loan book, and our top ten loan exposures represent 7% of our total lending at June 30, 2014.
Underwriting Principles
General. We apply consistent credit principles in our assessment of lending proposals, whether CRE, commercial non-real estate, agriculture, residential real estate, consumer or other lending. We are cash flow-focused lenders, which means our assessment of any potential loan includes an analysis of whether the customer can generate sufficient cash flow, not only in normal operating conditions but in a range of circumstances, to ensure the likelihood that the borrowers’ repayment obligations to our bank can be fully met. Our underwriting procedures include an assessment of the borrower’s cash flow sustainability, the acceptability of the borrowing purpose, the borrower’s liquidity, collateral quality and adequacy, industry dynamics, and management capability, integrity and experience. For residential real estate, consumer and other lending, our underwriting process is intended to assess the prospective borrower’s credit standing and ability to repay (which we analyze based on the borrower’s cash flow, liquidity, credit standing, employment history and overall financial condition) and the value and adequacy of any collateral.
142
Table of Contents
We establish conservative collateral guidelines that recognize the potential effects of volatility or deterioration of the value of collateral we accept, such as real estate, inventory, receivables and machinery. We manage this risk in a number of ways, including through advance rate guidelines for the various types of collateral we typically accept. In addition, where we take real estate as collateral, and for some other specialized assets, we require assessment of value based on appropriate methodology and benchmarks. For our larger real estate commitments, this can include an independent third party appraisal review and, where appropriate, additional reviews.
We also assess the presence and viability of one or more acceptable secondary sources of repayment to mitigate potential future borrower cash flow deterioration. To improve the reliability of secondary sources of repayment, we prefer originating loans on a secured basis, and at June 30, 2014, less than 1% of our total lending was on an unsecured basis. We typically engage in unsecured lending only in situations involving long-standing customers of sound net worth and above-average liquidity with strong repayment ability (other than in connection with credit cards we issue).
We have a delegated commitment authorities framework that provides a conservative level of lending authority to our bankers commensurate with their role and lending experience. Commitments above the lending thresholds established for a banker require the approval, depending on the size of the commitment, of our regional credit managers, central credit senior managers, Chief Credit Officer or Chief Risk Officer or, for our largest commitments, our transactional credit committee. Loan analyses and decisions are documented and form part of the loan’s continual monitoring and relationship management record. We believe this framework provides the necessary separation of authority and independence in the credit underwriting process while providing flexibility to expedite appropriate credit decisions and provide competitive customer service.
Agribusiness. The underwriting principles described above generally apply to our agribusiness lending, although our assessment of cash flow sustainability, acceptability of borrowing purpose, borrower liquidity, industry environment, and management capability, integrity and experience are considered in light of the unique attributes of agribusiness lending. For example, we review the adequacy and sustainability of an agribusiness customer’s operating cash flows to determine adequate coverage of interest and principal repayments, and, generally, require a minimum of 1.25 times average coverage over a medium term of two to five years. We ensure that we understand the purpose of the loan and are willing to fund it. We work with the borrower to select the appropriate funding facility, such as working capital funding for short-term needs, medium-term borrowing to fund purchases of durables like machinery or equipment and long-term real estate loans, which are typically committed for five to ten years, with a maximum of 15 years. All of our agribusiness real estate loans are fully amortizing, based on full loan repayment over 15 to 25 years, and, for fixed-rate loans longer than five years, we typically enter into matching fixed-to-floating interest rate swaps as described in “Management’s Discussion and Analysis of Financial Condition and Results of Operations—Key Factors Affecting Our Business and Financial Statements—Loans and Interest Rate Swaps Accounted for at Fair Value.”
As described above, we establish conservative collateral guidelines for our lending that recognize the volatility of asset prices. We also tailor the structure of certain loans, apply additional policies and require appropriate covenants to ensure our bank is well protected against the key potential risks. For livestock, we adopt conservative valuations to reduce the effects of cyclical trends before applying our collateral guidelines. For growing grain crops, we generally limit our lending to the coverage provided by crop insurance.
As is the case with all types of lending, external risks beyond a customer’s business and operations can affect repayment. Our agribusiness lending, in particular, is subject to several external risks that we manage in various ways, including:
| • | Price cycles and volatility—Agricultural commodity prices are both cyclical and volatile, and we seek to manage these factors by diversifying our portfolio across a range of agribusiness customers including grain producers and protein producers (e.g., generally low grain prices assist protein producers since their businesses use grains as inputs) and by determining and applying appropriate advance rate guidelines to agricultural commodities used as collateral, as discussed above. |
143
Table of Contents
| • | Weather, disease and other perils—Severe weather, natural disasters, acts of war or terrorism and other external events could significantly impact our business and the business of our borrowers. We seek to mitigate our exposure to this risk through our geographic diversification across seven states and a number of agricultural products. Federally subsidized crop insurance coverage is also available for over 120 kinds of crops, typically of 50% to 85% of a grower’s average yield, against various agriculture-related perils, including flood, drought, hail, fire, disease, insect damage, wildlife and earthquake. |
| • | Land prices—As discussed above, we focus on cash flow lending, which helps farms to ensure that they have sufficient cash flow to service debt and support their businesses, and generally take land as secondary collateral, with conservative advance rate guidelines in assessing collateral adequacy. |
Deposits
Deposits are our primary source of funds to support our revenue-generating assets. We offer traditional deposit products to businesses and other customers with a variety of rates and terms. Deposits at our bank are insured by the FDIC up to statutory limits. We price our deposit products with a view to maximizing our share of each customer’s financial services business and prudently managing our cost of funds. At June 30, 2014, we held $7.07 billion of total deposits, which have grown at a CAGR of 15% from September 30, 2009 to September 30, 2013 (attributable primarily to growth in fiscal year 2010 as a result of our acquisition of TierOne Bank) and 9.3% in fiscal year 2013. At June 30, 2014, our deposit base consisted of $2.70 billion, or 38%, in checking accounts, $2.55 billion, or 36%, in money market checking, savings and passbook accounts, and $1.82 billion, or 26%, in CDs and IRAs.
Our deposit base is diversified across our geographic footprint, as illustrated by the following table showing the composition of our deposit base by the geographic region of our branches at June 30, 2014:
| June 30, 2014 | ||||||||||||
| State |
Number of Branches |
Deposits (in thousands) |
% of Deposits | |||||||||
| Nebraska |
56 | $ | 2,422,553 | 34.3 | % | |||||||
| Iowa, Kansas and Missouri |
54 | 2,113,663 | 29.9 | % | ||||||||
| South Dakota |
25 | 1,342,709 | 19.0 | % | ||||||||
| Arizona and Colorado |
27 | 1,140,309 | 16.1 | % | ||||||||
| Corporate and other |
— | 47,878 | 0.7 | % | ||||||||
|
|
|
|
|
|||||||||
| Total |
162 | $ | 7,067,112 | 100.0 | % | |||||||
|
|
|
|
|
|
|
|||||||
Our deposit base is also diversified by client type. As of June 30, 2014, no individual depositor represented more than 2% of our total deposits, and our top ten depositors represented only 8% of our total deposits. The composition of our deposit mix has recently changed with an increased proportion of non-interest-bearing deposits and a lower proportion of more expensive time deposits as a result of a strategic initiative launched during fiscal year 2013. This shift in deposit mix has been largely responsible for the recent declines in our average cost of deposits from 0.79% at September 30, 2011 to 0.36% at June 30, 2014. At June 30, 2014, our deposit base included $982 million of municipal deposits, against which we were required to hold $728 million of collateral. These deposits were from municipalities representing approximately 577 customers with an average balance per customer of $1.7 million.
144
Table of Contents
The graph below shows our non-interest-bearing deposits, interest-bearing demand deposits and time deposits at the end of each period, as well as weighted average costs of deposits for each period presented:
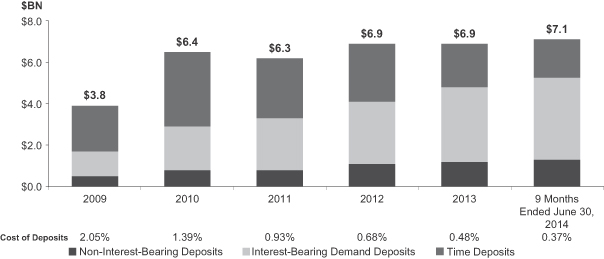
| (1) | At September 30. |
| (2) | At June 30, 2014. |
| (3) | Weighted average cost of deposits presented for the twelve months ended September 30, except as otherwise indicated. |
Risk Oversight and Management
Risk management is a core competency of our business. As a result of the acquisition of us by NAB, we have expanded our risk management staff and risk capabilities significantly in recent years. We believe that our risk management is more robust than that of most banks our size. These robust risk capabilities are embedded into our operations.
Our risk management consists of comprehensive policies and processes and seeks to emphasize personal ownership and accountability for risk with all our employees. We expect our people to focus on managing our risks, and we support this with appropriate oversight and governance and 81 risk management employees as of June 30, 2014. We delegate authority for our risk management oversight and governance to a number of executive management committees, each responsible for overseeing various aspects of our risk management process. Various board committees provide oversight over our risk management function. The roles of each of the committees of our board of directors regarding risk management are discussed under “Management—Board Oversight of Risk Management.”
Our executive risk committee is responsible for oversight and governance of all risks across the enterprise. These responsibilities include monitoring our bank’s overall risk profile to ensure it remains within the board-approved risk appetite and adjusting activities as appropriate, assessing new and emerging risks, monitoring our risk management culture, assessing acceptability of the risk impacts of any material changes (or additions) to our products, vendor relationships, partnerships or other processes and overseeing compliance with regulatory expectations and requirements. The executive risk committee is chaired by our President and Chief Executive Officer and includes our Chief Risk Officer and executives representing our business and support areas together with senior risk managers. The executive risk committee is supported by the following four subcommittees, each with specific responsibility to monitor, oversee and approve changes in their respective areas of focus relating to risks: asset & liability committee, operational risk & compliance committee, transactional credit committee and technology committee. Our transactional credit committee reviews and approves our largest lending exposures (i.e., those over $25 million).
145
Table of Contents
Our Chief Risk Officer leads our integrated risk management function that oversees all enterprise risk, including credit risk, compliance risk, regulatory risk, operational risk, legal risk, reputational risk and strategic risk, as well as overseeing ongoing enhancements to our risk management processes. Our Chief Risk Officer, a member of our executive committee, reports to our President and Chief Executive Officer and has direct access to the risk committee of our board of directors. In addition, our executive leadership team and other members of management have responsibility for oversight and management of risk across business and operational lines.
Risk Framework and Appetite
Our risk framework is structured to guide decisions regarding the appropriate balance between risk and return considerations in our business. Our risk framework is informed by our strategy, risk appetite and financial plans approved by our board of directors. This framework includes risk policies, procedures, limits and targets, and reporting. Our board of directors approves our stated risk appetites, which set forth the amount and type of risk we are willing to accept in pursuit of our strategy, business and financial objectives. Our risk appetites provide the context for our risk management tools, including, among others, risk policies, delegated authorities, limits, portfolio composition, underwriting standards and operational processes.
We manage risk through three lines of defense that allocate responsibility and accountability for risk management throughout our business. Our first line of defense is our business lines and support functions, which are accountable for being aware of and managing the risks in their respective business areas and for operating within our established risk framework and appetite. Our second line of defense is our risk team, which provides monitoring, control, oversight and advice on risk to our business lines, and our third line of defense is our internal audit function, which provides independent oversight that risks are being managed to an acceptable level and that our internal control frameworks are operating effectively.
Credit Risk Management
Credit risk is the potential for loss arising from a customer, counterparty or issuer failing to meet its contractual obligations to us. Our strategy for managing credit risk includes well-defined, centralized credit policies, uniform underwriting criteria, clearly delegated authority levels and accountability, ongoing risk monitoring and review processes for credit exposures and portfolio diversification by geography, industry and customer. We segment our loan portfolio into a number of asset classes for purposes of developing and documenting our credit risk management procedures and determining associated allowance for loan losses, including real estate, CRE, commercial non-real estate, agriculture, consumer and other lending. For a discussion of our underwriting standards, see “—Loans—Underwriting Principles.”
We emphasize regular credit examinations and management reviews of loans with deteriorating credit quality as part of our credit risk management strategy. As part of this process, we perform assessments of asset quality, compliance with commercial and consumer credit policies and other critical credit information. We also monitor and update risk ratings on our non-consumer loans on an ongoing basis. With respect to consumer loans, we typically use standard credit scoring systems to assess our credit risks. We also rely on a dedicated risk asset review team to provide independent assurance of portfolio asset quality and policy compliance.
We have well-established procedures for managing loans that either show early signs of weakness or appear to have actually weakened. These procedures include moving a loan to our “watch” list when we have early concerns. Loans on our watch list receive more intense focus, along with more senior-level monitoring and reporting, a requirement of higher credit authority approval for any further lending increase and action plans for improving the prospects for such loans. Loans that we rate “substandard” (or lower) will generally fall under the management or consultation of our strategic business services team, or SBS, our specialist loan rehabilitations, workout and OREO asset team. These loans are actively managed, with the primary goal of SBS rehabilitating the loans to “performing” status. If rehabilitation is not feasible, a loan workout strategy is developed and put into execution to maximize our bank’s recovery of loan proceeds and other costs to which it is legally entitled.
146
Table of Contents
SBS also oversees the litigation of troubled assets, when appropriate. In addition, appropriate reserves and charge-offs are made based on assessment of potential realization levels and related costs.
Our non-lending activities also give rise to credit risk, including exposures resulting from our investment in securities and our entry into interest rate swap contracts for balance sheet hedging purposes. For more information on these activities, see “Management’s Discussion and Analysis of Financial Condition and Results of Operations—Analysis of Financial Condition—Investments” and “Management’s Discussion and Analysis of Financial Condition and Results of Operations—Analysis of Financial Condition—Derivatives.”
Operational Risk
Operational risk is the risk of loss arising from inadequate or failed processes, people or systems, external events (such as natural disasters), or compliance, reputational or legal matters. We have a framework in place that includes the reporting and assessment of any operational risk events, including narrowly avoided operational risk events, and the assessment of our mitigating strategies within our key business lines. This framework is implemented through our policies, processes and reporting requirements, including those governing business and information technology continuity, information security and cyber-security, technological capability, fraud-risk management, operational risk profiling and vendor management. Our operational risk review process is a core part of our assessment of any material new or modified business or support initiative.
Our operational risks related to legal and compliance matters are heightened by the heavily regulated environment in which we operate. We have designed our processes and systems, and provide education of applicable legal and regulatory standards to our employees, to comply with these requirements. For information on the legal framework in which we operate, and which our operational risk processes and systems are designed to address, see “Supervision and Regulation.”
Competition
The financial services industry and each of the markets in which we operate in particular are highly competitive. We face strong competition in gathering deposits, making loans and obtaining client assets for management by our investment or trust operations. We compete for deposits and loans by seeking to provide a higher level of personal service than is generally offered by our larger competitors, many of whom have more assets, capital and resources and higher lending limits than we do and may be able to conduct more intensive and broader based promotional efforts to reach both commercial and retail customers. We also compete based on advertising impact and interest rates. Our principal competitors for deposits, loans and client assets for management by our investment or trust operations include U.S. Bank, Wells Fargo, Bank of America, First National Bank of Omaha and various other nationwide, regional and community banks operating in our markets.
Competition for deposits is also affected by the ease with which customers can transfer deposits from one institution to another. Our cost of funds fluctuates with market interest rates and may be affected by higher rates being offered by other financial institutions. In certain interest rate environments, additional significant competition for deposits may be expected to arise from corporate and government debt securities and money market mutual funds. Our management believes that our most direct competition for deposits comes from nationwide and regional banks, savings banks and associations, credit unions, insurance companies, money market funds, brokerage firms, other non-bank financial services companies and service-focused community banks that target the same customers we do.
We compete for loans principally through the quality of service we provide to borrowers while maintaining competitive interest rates, loan fees and other loan terms. We emphasize personalized relationship banking services and the local and efficient decision-making of our banking businesses. Because of economies of scale, our larger, nationwide competitors may offer loan pricing that is more attractive than loan pricing we can offer. Our most direct competition for loans comes from larger regional and national banks, savings banks and
147
Table of Contents
associations, credit unions, insurance companies and service-focused community banks that target the same customers we do. We also face competition for agribusiness loans from participants in the nationwide Farm Credit System and global banks.
We compete for wealth management clients on the basis of the level of investment performance, fees and personalized client service. Our competition in wealth management services comes primarily from other institutions, particularly larger regional and national banks, providing similar services, wealth management companies and brokerage firms, many of which are larger than us and provide a wider array of products and services.
Intellectual Property
In the highly competitive banking industry in which we operate, intellectual property is important to the success of our business. We own a variety of trademarks, service marks, trade names and logos and spend time and resources maintaining this intellectual property portfolio. We control access to our intellectual property through license agreements, confidentiality procedures, non-disclosure agreements with third parties, employment agreements and other contractual rights to protect our intellectual property.
Information Technology Systems
We devote significant resources to maintain stable, reliable, efficient and scalable information technology systems. We utilize a single, highly integrated core processing system from a third party vendor across our business that improves cost efficiency and acquisition integration. We work with our third party vendors to monitor and maximize the efficiency of our use of their applications. We use integrated systems to originate and process loans and deposit accounts, which reduces processing time, improves customer experience and reduces costs. Most customer records are maintained digitally. We are also currently executing several initiatives to enhance our online and mobile banking services to further improve the overall client experience. During a transition period following this offering, we will continue to rely on NAB for certain non-core banking information technology needs. See “Our Relationship with NAB and Certain Other Related Party Transactions—Relationship with NAB—Transitional Services Agreement.”
Protecting our systems to ensure the safety of our customers’ information is critical to our business. We use multiple layers of protection to control access and reduce risk, including conducting a variety of vulnerability and penetration tests on our platforms, systems and applications to reduce the risk that any attacks are successful. To protect against disasters, we have a backup offsite core processing system and recovery plans.
We invested in an enterprise data warehouse system in order to capture, analyze and report key metrics associated with customer and product profitability. Data that previously was arduous to collect across multiple systems is now available daily through standard and ad hoc reports to assist with managing our business and competing effectively in the marketplace.
Employees
As of June 30, 2014, we had 1,486 total employees, which included 1,286 full-time employees, 183 part-time employees and 17 temporary employees. Of our 1,486 employees, 1,110 are in core banking (i.e., non-line of business branch network employees, including relationship bankers), 81 employees are in lines of business (e.g., mortgage, credit cards, investments), 29 employees are in finance, 146 employees are in support services (i.e., employees in operations, IT and projects), 81 employees are in risk management and 39 employees are in other functions. We believe our relationship with our employees to be generally good. We have not experienced any material employment-related issues or interruptions of services due to labor disagreements and are not a party to any collective bargaining agreements.
148
Table of Contents
Properties
Our corporate headquarters is located at 100 N. Phillips Ave, Sioux Falls, South Dakota 57104, and we have two leased facilities in Sioux Falls for our data center and operations centers. In addition to our corporate headquarters, we operate from 162 branch offices located in 116 communities in South Dakota, Iowa, Nebraska, Colorado, Arizona, Kansas and Missouri. We lease 36 of our branch offices, all on market terms, and we own the remainder of our offices, including our main office. All of our banking offices are in free-standing, permanent facilities. We generally believe our existing and contracted-for facilities are adequate to meet our requirements.
Legal Proceedings
From time to time we are a party to various litigation matters incidental to the conduct of our business. We are not presently party to any legal proceedings the resolution of which we believe would have a material adverse effect on our business, prospects, financial condition, liquidity, results of operation, cash flows or capital levels.
149
Table of Contents
We and our subsidiaries are subject to extensive regulation under federal and state banking laws that establish a comprehensive framework for our operations. This framework may materially impact our growth potential and financial performance and is intended primarily for the protection of depositors, customers, federal deposit insurance funds and the banking system as a whole, not for the protection of our stockholders and creditors. Significant elements of the statutes, regulations and policies applicable to us and our subsidiaries are described below. This description is qualified in its entirety by reference to the full text of the statutes, regulations and policies described.
Regulatory Agencies
Great Western is a bank holding company under the BHC Act. Consequently, Great Western and its subsidiaries are subject to supervision, regulation and examination by the Federal Reserve. The BHC Act provides generally for “umbrella” regulation of bank holding companies and functional regulation of holding company subsidiaries by applicable regulatory agencies. Great Western Bank, our bank subsidiary, is an FDIC-insured commercial bank chartered under the laws of South Dakota. Our bank is not a member of the Federal Reserve System. Consequently, the FDIC and the South Dakota Division of Banking are the primary regulators of our bank and also regulate our bank’s subsidiaries. As the owner of a South Dakota-chartered bank, Great Western is also subject to supervision and examination by the South Dakota Division of Banking. Following the completion of this offering, Great Western will also be subject to the disclosure and regulatory requirements of the Exchange Act administered by the SEC, and, following the listing of our common stock, the rules adopted by the NYSE applicable to listed companies. We offer certain insurance and investment products through one of our bank’s subsidiaries that is subject to regulation and supervision by applicable state insurance regulatory agencies and by FINRA as a result of a contractual relationship we have with a third party broker-dealer relating to the provision of some of wealth management and investment services to customers.
Regulatory Impact of Control by NAB
As long as we are controlled by NAB for purposes of the BHC Act, NAB’s regulatory status may impact our regulatory status as well as our regulatory burden and hence our ability to expand by acquisition or engage in new activities. For example, unsatisfactory examination ratings or enforcement actions regarding NAB could impact our ability to obtain or preclude us from obtaining any necessary approvals or informal clearance for the foregoing. Furthermore, to the extent that we are required to obtain regulatory approvals under the BHC Act to make acquisitions or expand our activities, as long as NAB controls us, NAB would also be required to obtain BHC Act approvals for such acquisitions or activities as well. In addition, U.S. regulatory restrictions and requirements on non-U.S. banks such as NAB that have a certain amount of assets may result in additional restrictions and burdens on us that would not otherwise be applicable.
NAB is also an Australian authorized deposit-taking institution regulated by APRA under the Banking Act 1959 (Cth), or the Banking Act. NAB does not guarantee our obligations. Pursuant to the Banking Act, APRA has issued a legally enforceable prudential standard that restricts associations between an authorized deposit-taking institution (such as NAB) and its related entities. Any provision of material financial support by NAB to us or our bank would need to comply with the requirements of the prudential standard.
APRA also has broad powers under the Banking Act to give legally enforceable directions to NAB in circumstances, for example, where it considers that NAB has not complied with prudential standards or that it is in the interests of NAB’s deposit holders to do so. In the event that NAB becomes unlikely to be able to meet its obligations, APRA has the power to take control of NAB’s business or appoint an administrator for NAB’s affairs. The priority of creditors of NAB in the event that NAB is unable to meet its obligations is governed by various Australian laws, including the Banking Act. The Banking Act provides that the assets of NAB in Australia are to be available to meet liabilities to certain governmental agencies and deposit holders in Australia in priority to all other liabilities.
150
Table of Contents
Permissible Activities for Bank Holding Companies
In general, the BHC Act limits the business of bank holding companies to banking, managing or controlling banks and other activities that the Federal Reserve has determined to be so closely related to banking as to be a proper incident thereto.
Bank holding companies that qualify and elect to be treated as “financial holding companies” may engage in a broad range of additional activities that are (i) financial in nature or incidental to such financial activities or (ii) complementary to a financial activity and do not pose a substantial risk to the safety and soundness of depository institutions or the financial system generally. These activities include securities underwriting and dealing, insurance underwriting and making merchant banking investments. We have not elected to be treated as a financial holding company and currently have no plans to make a financial holding company election.
The BHC Act does not place territorial restrictions on permissible non-banking activities of bank holding companies. The Federal Reserve has the power to order any bank holding company or its subsidiaries to terminate any activity or to terminate its ownership or control of any subsidiary when the Federal Reserve has reasonable grounds to believe that continuing such activity, ownership or control constitutes a serious risk to the financial soundness, safety or stability of any bank subsidiary of the bank holding company.
Permissible Activities for Banks
As a South Dakota-chartered commercial bank, our bank’s business is generally limited to activities permitted by South Dakota law and any applicable federal laws. Under the South Dakota Banking Code, our bank may generally engage in all usual banking activities, including taking commercial and saving deposits; lending money on personal and real security; issuing letters of credit; buying, discounting, and negotiating promissory notes, bonds, drafts and other forms of indebtedness; buying and selling currency and, subject to certain limitations, certain investment securities; engaging in all facets of the insurance business; and maintaining safe deposit boxes on premises. Subject to prior approval by the Director of the South Dakota Division of Banking, our bank may also permissibly engage in any activity permissible as of January 1, 2008 for a national bank doing business in South Dakota.
South Dakota law also imposes restrictions on our bank’s activities and corporate governance requirements intended to ensure the safety and soundness of our bank. For example, South Dakota law requires our bank’s officers to be elected annually and the election of each officer to be confirmed by the Director of the South Dakota Division of Banking. In addition, South Dakota law also requires at least 75% of our bank’s board of directors be U.S. citizens. Our bank is also restricted under South Dakota law from investing in certain types of investment securities and is generally limited in the amount of money it can lend to a single borrower or invest in securities issued by a single issuer (in each case, 20% of our bank’s capital stock and surplus plus 10% of our bank’s undivided profits).
Acquisitions by Bank Holding Companies
The BHC Act, the Bank Merger Act, the South Dakota Banking Code and other federal and state statutes regulate acquisitions of commercial banks and other FDIC-insured depository institutions. We must obtain the prior approval of the Federal Reserve before (i) acquiring more than 5% of the voting stock of any FDIC-insured depository institution or other bank holding company (other than directly through our bank), (ii) acquiring all or substantially all of the assets of any bank or bank holding company or (iii) merging or consolidating with any other bank holding company. Under the Bank Merger Act, the prior approval of the FDIC is required for our bank to merge with another bank or purchase all or substantially all of the assets or assume any of the deposits of another FDIC-insured depository institution. In reviewing applications seeking approval of merger and acquisition transactions, bank regulators consider, among other things, the competitive effect and public benefits of the transactions, the capital position and managerial resources of the combined organization, the risks to the stability of the U.S. banking or financial system, the applicant’s performance record under the CRA, the
151
Table of Contents
applicant’s compliance with fair housing and other consumer protection laws and the effectiveness of all organizations involved in combating money laundering activities. In addition, failure to implement or maintain adequate compliance programs could cause bank regulators not to approve an acquisition where regulatory approval is required or to prohibit an acquisition even if approval is not required.
Dividends; Stress Testing
Great Western is a legal entity separate and distinct from its banking and other subsidiaries. As a bank holding company, Great Western is subject to certain restrictions on its ability to pay dividends under applicable banking laws and regulations. Federal bank regulators are authorized to determine under certain circumstances relating to the financial condition of a bank holding company or a bank that the payment of dividends would be an unsafe or unsound practice and to prohibit payment thereof. In particular, federal bank regulators have stated that paying dividends that deplete a banking organization’s capital base to an inadequate level would be an unsafe and unsound banking practice and that banking organizations should generally pay dividends only out of current operating earnings. In addition, in the current financial and economic environment, the Federal Reserve has indicated that bank holding companies should carefully review their dividend policy and has discouraged payment ratios that are at maximum allowable levels unless both asset quality and capital are very strong.
A significant portion of our income comes from dividends from our bank, which is also the primary source of our liquidity. In addition to the restrictions discussed above, our bank is subject to limitations under South Dakota law regarding the level of dividends that it may pay to us. In general, dividends by our bank may only be declared from its net profits and may be declared no more than once per calendar quarter. The approval of the South Dakota Director of Banking is required if our bank seeks to pay aggregate dividends during any calendar year that would exceed the sum of its net profits from the year to date and retained net profits from the preceding two years, minus any required transfers to surplus.
In October 2012, as required by the Dodd-Frank Act, the Federal Reserve and the FDIC published final rules regarding company-run stress testing. These rules require bank holding companies and banks with average total consolidated assets greater than $10 billion to conduct an annual company-run stress test of capital, consolidated earnings and losses under one base and at least two stress scenarios provided by the federal bank regulators. Although our assets are currently below this threshold, we have nevertheless commenced a project to ensure that we are able to meet these requirements in a timely fashion. Neither we nor our bank is currently subject to the stress testing requirements, but we expect that once we are subject to those requirements, the Federal Reserve, the FDIC and the South Dakota Division of Banking will consider our results as an important factor in evaluating our capital adequacy, and that of our bank, in evaluating any proposed acquisitions and in determining whether any proposed dividends or stock repurchases by us or by our bank may be an unsafe or unsound practice.
Transactions with Affiliates
Transactions between our bank and its subsidiaries, on the one hand, and Great Western or any other subsidiary, on the other hand, are regulated under federal banking law. The Federal Reserve Act imposes quantitative and qualitative requirements and collateral requirements on covered transactions by Great Western Bank with, or for the benefit of, its affiliates, and generally requires those transactions to be on terms at least as favorable to our bank as if the transaction were conducted with an unaffiliated third party. Covered transactions are defined by statute to include a loan or extension of credit, as well as a purchase of securities issued by an affiliate, a purchase of assets (unless otherwise exempted by the Federal Reserve) from the affiliate, certain derivative transactions that create a credit exposure to an affiliate, the acceptance of securities issued by the affiliate as collateral for a loan, and the issuance of a guarantee, acceptance or letter of credit on behalf of an affiliate. In general, any such transaction by our bank or its subsidiaries must be limited to certain thresholds on an individual and aggregate basis and, for credit transactions with any affiliate, must be secured by designated amounts of specified collateral.
152
Table of Contents
Federal law also limits a bank’s authority to extend credit to its directors, executive officers and 10% stockholders, as well as to entities controlled by such persons. Among other things, extensions of credit to insiders are required to be made on terms that are substantially the same as, and follow credit underwriting procedures that are not less stringent than, those prevailing for comparable transactions with unaffiliated persons. Also, the terms of such extensions of credit may not involve more than the normal risk of non-repayment or present other unfavorable features and may not exceed certain limitations on the amount of credit extended to such persons individually and in the aggregate.
Source of Strength
Federal Reserve policy and federal law require bank holding companies to act as a source of financial and managerial strength to their subsidiary banks. Under this requirement, we are expected to commit resources to support our bank, including at times when we may not be in a financial position to provide such resources, and it may not be in our, or our stockholders’ or creditors’, best interests to do so. In addition, any capital loans we make to our bank are subordinate in right of payment to depositors and to certain other indebtedness of our bank. In the event of our bankruptcy, any commitment by us to a federal bank regulatory agency to maintain the capital of our bank will be assumed by the bankruptcy trustee and entitled to priority of payment.
Regulatory Capital Requirements
Current Capital Guidelines
The Federal Reserve monitors the capital adequacy of our holding company on a consolidated basis, and the FDIC and the South Dakota Division of Banking monitor the capital adequacy of our bank. The bank regulators currently use a combination of risk-based guidelines and a leverage ratio to evaluate capital adequacy. The current risk-based capital guidelines applicable to us and our bank are based on the 1988 capital accord, known as Basel I, of the Basel Committee on Banking Supervision, or the Basel Committee, as implemented by the federal bank regulators. The current risk-based guidelines are intended to make regulatory capital requirements sensitive to differences in credit and market risk profiles among banks and bank holding companies, to account for off-balance sheet exposure and to minimize disincentives for holding liquid assets. Assets and off-balance sheet items are assigned to weighted risk categories, and capital is classified in one of the two following tiers depending on its characteristic:
| • | Tier 1 (Core) Capital—Tier 1 capital includes common equity, retained earnings, qualifying non-cumulative perpetual preferred stock, minority interests in equity accounts of consolidated subsidiaries (and, under existing standards, a limited amount of qualifying trust preferred securities at the holding company level), less goodwill, most intangible assets and certain other assets. |
| • | Tier 2 (Supplementary) Capital—Tier 2 capital includes perpetual preferred stock and trust preferred securities not meeting the definition of Tier 1 capital, qualifying mandatory convertible debt securities, qualifying subordinated debt and a limited amount of allowances for loan and lease losses. |
Under current requirements, we must maintain Tier 1 capital and total capital (that is, Tier 1 capital plus Tier 2 capital, less certain deductions) equal to at least 4% and 8%, respectively, of our total risk-weighted assets (including various off-balance sheet items such as letters of credit). Our bank must maintain similar capital ratios. To be considered “well capitalized” under the regulatory framework for a variety of purposes, we and our bank must maintain Tier 1 and total capital ratios of at least 6% and 10%, respectively. See “—Prompt Corrective Action Framework.”
Bank holding companies and banks are also currently required to comply with minimum leverage requirements, measured based on the ratio of a bank holding company’s or a bank’s, as applicable, Tier 1 capital to adjusted quarterly average total assets (as defined for regulatory purposes). These requirements generally necessitate a minimum Tier 1 leverage ratio of 4% for all bank holding companies and banks, with a lower 3% minimum for bank holding companies and banks meeting certain specified criteria, including having the highest
153
Table of Contents
composite regulatory supervisory rating. To be considered “well capitalized” under the regulatory framework for prompt corrective action, our bank must maintain minimum Tier 1 leverage ratios of at least 5%. See “—Prompt Corrective Action Framework.”
Basel III and the New Capital Rules
In July 2013, the federal bank regulators approved final rules, or the New Capital Rules, implementing the Basel Committee’s December 2010 final capital framework for strengthening international capital standards, known as Basel III, and various provisions of the Dodd-Frank Act. The New Capital Rules substantially revise the risk-based capital requirements applicable to bank holding companies and banks, including us and our bank, compared to the current risk-based capital rules. The New Capital Rules revise the components of capital and address other issues affecting the numerator in regulatory capital ratio calculations. The New Capital Rules also address risk weights and other issues affecting the denominator in regulatory capital ratio calculations, including by replacing the existing risk-weighting approach derived from Basel I with a more risk-sensitive approach based, in part, on the standardized approach adopted by the Basel Committee in its 2004 capital accords, known as Basel II. The New Capital Rules also implement the requirements of Section 939A of the Dodd-Frank Act to remove references to credit ratings from the federal bank regulators’ rules. Subject to a phase-in period for various provisions, the New Capital Rules are effective for us and for our bank beginning on January 1, 2015.
The New Capital Rules, among other things, (i) introduce a new capital measure called “Common Equity Tier 1,” or CET1, (ii) specify that Tier 1 capital consists of CET1 and “Additional Tier 1 capital” instruments meeting specified requirements, (iii) define CET1 narrowly by requiring that most deductions/adjustments to regulatory capital measures be made to CET1 and not to the other components of capital and (iv) expand the scope of the deductions/adjustments to capital as compared to existing regulations.
Under the New Capital Rules, the minimum capital ratios as of January 1, 2015 will be (i) 4.5% CET1 to risk-weighted assets, (ii) 6% Tier 1 capital (that is, CET1 plus Additional Tier 1 capital) to risk-weighted assets and (iii) 8% total capital (that is, Tier 1 capital plus Tier 2 capital) to risk-weighted assets.
The New Capital Rules also introduce a new capital conservation buffer designed to absorb losses during periods of economic stress. The capital conservation buffer is composed entirely of CET1, on top of these minimum risk-weighted asset ratios. In addition, the New Capital Rules provide for a countercyclical capital buffer applicable only to certain covered institutions. We do not expect the countercyclical capital buffer to be applicable to us or our bank. Banking institutions with a ratio of CET1 to risk-weighted assets above the minimum but below the capital conservation buffer (or below the combined capital conservation buffer and countercyclical capital buffer, when the latter is applied) will face constraints on dividends, equity repurchases and compensation based on the amount of the shortfall.
The implementation of the capital conservation buffer will begin on January 1, 2016 at the 0.625% level and will be phased in over a three-year period (increasing by 0.625% on each subsequent January 1, until it reaches 2.5% on January 1, 2019). When fully phased-in, the New Capital Rules will require us, and our bank, to maintain such additional capital conservation buffer of 2.5% of CET1, effectively resulting in minimum ratios of (i) 7% CET1 to risk-weighted assets, (ii) 8.5% Tier 1 capital to risk-weighted assets, and (iii) 10.5% total capital to risk-weighted assets. The New Capital Rules also eliminate the more permissive 3% minimum Tier 1 leverage ratio under the current capital guidelines, resulting in a 4% minimum Tier 1 leverage ratio for all bank holding companies and banks.
The New Capital Rules provide for a number of deductions from and adjustments to CET1. These include, for example, the requirement that mortgage servicing rights, certain deferred tax assets and significant investments in non-consolidated financial entities be deducted from CET1 to the extent that any one such category exceeds 10% of CET1 or all such categories in the aggregate exceed 15% of CET1. Implementation of the deductions and other adjustments to CET1 will begin on January 1, 2015 and will be phased in over a four-
154
Table of Contents
year period (beginning at 40% on January 1, 2015 and an additional 20% per year thereafter). The New Capital Rules also generally preclude certain hybrid securities, such as trust preferred securities, from being counted as Tier 1 capital for most bank holding companies. Bank holding companies such as us who had less than $15 billion in assets as of December 31, 2009 (and who continue to have less than $15 billion in assets) are permitted to include trust preferred securities issued prior to May 19, 2010 as Additional Tier 1 capital under the New Capital Rules, however.
The New Capital Rules also prescribe a new standardized approach for risk weightings that expands the risk-weighting categories from the current four Basel I-derived categories (0%, 20%, 50% and 100%) to a much larger and more risk-sensitive number of categories, depending on the nature of the assets, generally ranging from 0%, for U.S. government and agency securities, to 600%, for certain equity exposures, and resulting in higher risk weights for a variety of asset categories.
With respect to our bank, the New Capital Rules also revise the prompt corrective action regulations pursuant to Section 38 of the FDIA. See “—Prompt Corrective Action Framework.”
We believe that, as of June 30, 2014, we and our bank would meet all capital adequacy requirements under the New Capital Rules on a fully phased-in basis as if such requirements were then in effect.
Liquidity Requirements
Historically, the regulation and monitoring of bank and bank holding company liquidity has been addressed as a supervisory matter, without required formulaic measures. The Basel III final framework requires banks and bank holding companies to measure their liquidity against specific liquidity tests that, although similar in some respects to liquidity measures historically applied by banks and regulators for management and supervisory purposes, going forward would be required by regulation. One test, referred to as the liquidity coverage ratio, or LCR, is designed to ensure that the banking entity maintains an adequate level of unencumbered high-quality liquid assets equal to the entity’s expected net cash outflow for a 30-day time horizon (or, if greater, 25% of its expected total cash outflow) under an acute liquidity stress scenario. The other test, referred to as the net stable funding ratio, or NSFR, is designed to promote more medium- and long-term funding of the assets and activities of banking entities over a one-year time horizon. These requirements will incentivize banking entities to increase their holdings of U.S. Treasury securities and other sovereign debt as a component of assets and increase the use of long-term debt as a funding source.
In September 2014, the federal bank regulators approved final rules implementing the LCR for advanced approaches banking organizations (i.e., banking organizations with $250 billion or more in total consolidated assets or $10 billion or more in total on-balance sheet foreign exposure) and a modified version of the LCR for bank holding companies with at least $50 billion in total consolidated assets that are not advanced approach banking organizations, neither of which would apply to us or our bank. The federal bank regulators have not yet proposed rules to implement the NSFR, but the Federal Reserve has stated its intent to adopt a version of this measure as well.
Prompt Corrective Action Framework
The FDIA requires the federal bank regulators to take prompt corrective action in respect of depository institutions that fail to meet specified capital requirements. The FDIA establishes five capital categories (“well-capitalized,” “adequately capitalized,” “undercapitalized,” “significantly undercapitalized” and “critically undercapitalized”), and the federal bank regulators are required to take certain mandatory supervisory actions, and are authorized to take other discretionary actions, with respect to institutions that are undercapitalized, significantly undercapitalized or critically undercapitalized. The severity of these mandatory and discretionary supervisory actions depends upon the capital category in which the institution is placed. Generally, subject to a narrow exception, the FDIA requires the regulator to appoint a receiver or conservator for an institution that is critically undercapitalized.
155
Table of Contents
Currently, an insured depository institution generally will be classified in the following categories based on the capital measures indicated:
| “Well capitalized” | “Adequately capitalized” | |
| • Total capital ratio of at least 10%, |
• Total capital ratio of at least 8%, | |
| • Tier 1 capital ratio of at least 6%, |
• Tier 1 capital ratio of at least 4%, and | |
| • Tier 1 leverage ratio of at least 5%, and |
• Tier 1 leverage ratio of at least 4%. | |
| • Not subject to any order or written directive requiring a specific capital level. |
||
| “Undercapitalized” | “Significantly undercapitalized” | |
| • Total capital ratio of less than 8%, |
• Total capital ratio of less than 6%, | |
| • Tier 1 capital ratio of less than 4%, or |
• Tier 1 capital ratio of less than 3%, or | |
| • Tier 1 leverage ratio of less than 4%. |
• Tier 1 leverage ratio of less than 3%. | |
| “Critically undercapitalized” | ||
| • Tangible equity to average quarterly tangible assets of 2% or less. | ||
An institution may be downgraded to, or deemed to be in, a capital category that is lower than indicated by its capital ratios if it is determined to be in an unsafe or unsound condition or if it receives an unsatisfactory examination rating with respect to certain matters. A bank’s capital category is determined solely for the purpose of applying prompt corrective action regulations, and the capital category may not constitute an accurate representation of the bank’s overall financial condition or prospects for other purposes.
The New Capital Rules revise the current prompt corrective action requirements effective January 1, 2015 by (i) introducing a CET1 ratio requirement at each level (other than critically undercapitalized), with the required CET1 ratio being 6.5% for well-capitalized status; (ii) increasing the minimum Tier 1 capital ratio requirement for each category (other than critically undercapitalized), with the minimum Tier 1 capital ratio for well-capitalized status being 8% (as compared to the current 6%); and (iii) eliminating the current provision that provides that a bank with a composite supervisory rating of 1 may have a 3% leverage ratio and still be adequately capitalized. The New Capital Rules do not change the total risk-based capital requirement for any prompt corrective action category.
As of June 30, 2014, we and our bank were well capitalized with Tier 1 capital ratios of 12.1% and 12.6%, respectively, total capital ratios of 13.1% and 13.3%, respectively, and Tier 1 leverage ratios of 9.3% and 9.6%, respectively, in each case calculated under the currently applicable risk-based capital guidelines. As of June 30, 2014, we and our bank also had a CET1 ratio of 10.8% and 12.1%, respectively, and a Tier 1 capital ratio of 11.6% and 12.1%, respectively, each calculated as if the New Capital Rules were fully phased in as of the calculation date. The CET1 ratios and Tier 1 capital ratios calculated in accordance with the New Capital Rules presented are unaudited, non-GAAP financial measures. These ratios are calculated based on our estimates of the required adjustments under the New Capital Rules to the current regulatory-required calculation of risk-weighted assets and estimates of the application of provisions of the New Capital Rules to be phased in over time. We believe these estimates are reasonable, but they may ultimately be incorrect as we finalize our calculations under the New Capital Rules. For more information on these financial measures, including reconciliations to our and our bank’s Tier 1 capital ratio, see “Management’s Discussion and Analysis of Financial Condition and Results of Operations—Capital.”
An institution that is categorized as undercapitalized, significantly undercapitalized or critically undercapitalized is required to submit an acceptable capital restoration plan to its appropriate federal bank regulator. Under the FDIA, in order for the capital restoration plan to be accepted by the appropriate federal banking agency, a bank holding company must guarantee that a subsidiary depository institution will comply with its capital restoration plan, subject to certain limitations. The bank holding company must also provide appropriate assurances of performance. The obligation of a controlling bank holding company under the FDIA to
156
Table of Contents
fund a capital restoration plan is limited to the lesser of 5% of an undercapitalized subsidiary’s assets or the amount required to meet regulatory capital requirements. An undercapitalized institution is also generally prohibited from increasing its average total assets, making acquisitions and capital distributions, establishing any branches or engaging in any new line of business, except in accordance with an accepted capital restoration plan or with the approval of the FDIC. Institutions that are undercapitalized or significantly undercapitalized and either fail to submit an acceptable capital restoration plan or fail to implement an approved capital restoration plan may be subject to a number of requirements and restrictions, including orders to sell sufficient voting stock to become adequately capitalized, requirements to reduce total assets and cessation of receipt of deposits from correspondent banks. Critically undercapitalized depository institutions failing to submit or implement an acceptable capital restoration plan are subject to appointment of a receiver or conservator.
In addition, the FDIA prohibits an insured depository institution from accepting brokered deposits or offering interest rates on any deposits significantly higher than the prevailing rate in the bank’s normal market area or nationally (depending upon where the deposits are solicited), unless it is well capitalized or is adequately capitalized and receives a waiver from the FDIC. A depository institution that is adequately capitalized and accepts brokered deposits under a waiver from the FDIC may not pay an interest rate on any deposit in excess of 75 basis points over certain prevailing market rates.
Safety and Soundness Standards
The FDIA requires the federal bank regulators to prescribe standards, by regulations or guidelines, relating to internal controls, information systems and internal audit systems, loan documentation, credit underwriting, interest rate risk exposure, asset growth, asset quality, earnings, stock valuation and compensation, fees and benefits, and such other operational and managerial standards as the agencies deem appropriate. Guidelines adopted by the federal bank regulatory agencies establish general standards relating to internal controls and information systems, internal audit systems, loan documentation, credit underwriting, interest rate exposure, asset growth and compensation, fees and benefits. In general, these guidelines require, among other things, appropriate systems and practices to identify and manage the risk and exposures specified in the guidelines. These guidelines also prohibit excessive compensation as an unsafe and unsound practice and describe compensation as excessive when the amounts paid are unreasonable or disproportionate to the services performed by an executive officer, employee, director or principal stockholder. In addition, the agencies adopted regulations that authorize, but do not require, an agency to order an institution that has been given notice by an agency that it is not satisfying any of such safety and soundness standards to submit a compliance plan. If, after being so notified, an institution fails to submit an acceptable compliance plan or fails in any material respect to implement an acceptable compliance plan, the bank regulator must issue an order directing action to correct the deficiency and may issue an order directing other actions of the types to which an undercapitalized institution may be subject under the FDIA. See “—Prompt Corrective Action Framework.” If an institution fails to comply with such an order, the bank regulator may seek to enforce such order in judicial proceedings and to impose civil money penalties.
Deposit Insurance
FDIC Insurance Assessments
As an FDIC-insured bank, our bank must pay deposit insurance assessments to the FDIC based on its average total assets minus its average tangible equity. As an institution with less than $10 billion in assets, our bank’s assessment rates are based on its risk classification (i.e., the level of risk it poses to the FDIC’s deposit insurance fund). Institutions classified as higher risk pay assessments at higher rates than institutions that pose a lower risk. For institutions with $10 billion or more in assets, the FDIC uses a performance score and a loss-severity score that are used to calculate an initial assessment rate. In calculating these scores, the FDIC uses a bank’s capital level and regulatory supervisory ratings and certain financial measures to assess an institution’s ability to withstand asset-related stress and funding-related stress. The FDIC also has the ability to make discretionary adjustments to the total score based upon significant risk factors that are not adequately captured in the calculations. In addition to ordinary assessments described above, the FDIC has the ability to impose special assessments in certain instances.
157
Table of Contents
The FDIC’s deposit insurance fund is currently underfunded, and the FDIC has raised assessment rates and imposed special assessments on certain institutions during recent years to raise funds. Under the Dodd-Frank Act, the minimum designated reserve ratio for the deposit insurance fund is 1.35% of the estimated total amount of insured deposits. In October 2010, the FDIC adopted a restoration plan to ensure that the fund reserve ratio reaches 1.35% by September 30, 2020, as required by the Dodd-Frank Act. At least semi-annually, the FDIC will update its loss and income projections for the fund and, if needed, will increase or decrease assessment rates, following notice-and-comment rulemaking if required.
Under the FDIA, the FDIC may terminate deposit insurance upon a finding that the institution has engaged in unsafe and unsound practices, is in an unsafe or unsound condition to continue operations, or has violated any applicable law, regulation, rule, order or condition imposed by the FDIC.
Other Assessments
In addition, the Deposit Insurance Funds Act of 1996 authorized the Financing Corporation to impose assessments on deposit insurance fund applicable deposits in order to service the interest on the Financing Corporation’s bond obligations from deposit insurance fund assessments. The amount assessed on individual institutions is in addition to the amount, if any, paid for deposit insurance according to the FDIC’s risk-related assessment rate schedules. Assessment rates may be adjusted quarterly to reflect changes in the assessment base.
Heightened Requirements for Bank Holding Companies with $10 Billion or More in Assets
Various federal banking laws and regulations, including rules adopted by the Federal Reserve pursuant to the requirements of the Dodd-Frank Act, impose heightened requirements on certain large banks and bank holding companies. Most of these rules apply primarily to bank holding companies with at least $50 billion in total consolidated assets, but certain rules also apply to banks and bank holding companies with at least $10 billion in total consolidated assets. Following the fourth consecutive quarter (and any applicable phase-in period) where our or our bank’s total consolidated assets, as applicable, equal or exceed $10 billion, we or our bank, as applicable, will, among other requirements:
| • | be required to perform annual stress tests as described above in “—Dividends; Stress Testing;” |
| • | be required to establish a dedicated risk committee of our board of directors responsible for overseeing our enterprise-wide risk management policies, which must be commensurate with our capital structure, risk profile, complexity, activities, size and other appropriate risk-related factors, and including as a member at least one risk management expert; |
| • | calculate our FDIC deposit assessment base using the performance score and a loss-severity score system described above in “—Deposit Insurance;” and |
| • | be examined for compliance with federal consumer protection laws primarily by the Consumer Financial Protection Bureau, or CFPB, as described below in “—Consumer Financial Protection.” |
While neither we nor our bank currently have $10 billion or more in total consolidated assets, we have begun analyzing these rules to ensure we are prepared to comply with the rules when and if they become applicable. Upon the completion of this offering, our board of directors will have established a risk committee compliant with these rules. In addition, we have begun running periodic and selective stress tests on liquidity, interest rates and certain areas of our loan portfolio to prepare for compliance with FDIC stress testing requirements. Based on our historic organic growth rates, we expect that our total assets and our bank’s total assets could exceed $10 billion over the next two to five years, or sooner if we engage in any acquisitions.
The Volcker Rule
The Dodd-Frank Act prohibits banks and their affiliates from engaging in proprietary trading and investing in and sponsoring hedge funds and private equity funds. The statutory provision is commonly called the “Volcker
158
Table of Contents
Rule.” In December 2013, federal regulators adopted final rules to implement the Volcker Rule that became effective in April 2014. The Federal Reserve, however, issued an order extending the period that institutions have to conform their activities to the requirements of the Volcker Rule to July 21, 2015. Banks with less than $10 billion in total consolidated assets, such as our bank, that do not engage in any covered activities, other than trading in certain government, agency, state or municipal obligations, do not have any significant compliance obligations under the rules implementing the Volcker Rule. We are continuing to evaluate the effects of the Volcker Rules on our business, but we do not currently anticipate that the Volcker Rule will have a material effect on our operations.
Depositor Preference
Under federal law, depositors (including the FDIC with respect to the subrogated claims of insured depositors) and certain claims for administrative expenses of the FDIC as receiver would be afforded a priority over other general unsecured claims against such an institution in the “liquidation or other resolution” of such an institution by any receiver.
Interchange Fees
Under the Durbin Amendment to the Dodd-Frank Act, the Federal Reserve adopted rules establishing standards for assessing whether the interchange fees that may be charged with respect to certain electronic debit transactions are “reasonable and proportional” to the costs incurred by issuers for processing such transactions.
Interchange fees, or “swipe” fees, are charges that merchants pay to us and other card-issuing banks for processing electronic payment transactions. Under the final rules, the maximum permissible interchange fee is equal to no more than 21 cents plus 5 basis points of the transaction value for many types of debit interchange transactions. The Federal Reserve also adopted a rule to allow a debit card issuer to recover 1 cent per transaction for fraud prevention purposes if the issuer complies with certain fraud-related requirements required by the Federal Reserve. The Federal Reserve also has rules governing routing and exclusivity that require issuers to offer two unaffiliated networks for routing transactions on each debit or prepaid product.
On July 31, 2013, the U.S. District Court for the District of Columbia found the interchange fee cap and the exclusivity provision adopted by the Federal Reserve to be invalid. The U.S. Court of Appeals for the District of Columbia, or D.C. Circuit, reversed this decision on March 21, 2014, generally upholding the Federal Reserve’s interpretation of the Durbin Amendment and the Federal Reserve’s rules implementing it. On August 18, 2014, the plaintiffs in this litigation filed a petition for a writ of certiorari asking the U.S. Supreme Court to review the D.C. Circuit’s decision with respect to the interchange fee cap. We continue to monitor developments in the litigation surrounding these rules.
Currently, we are subject to the interchange fee cap as a result of NAB’s ownership of us. Once NAB no longer controls us for bank regulatory purposes, we may be able to qualify for the small issuer exemption from the interchange fee cap depending on our total assets at the time. The small issuer exemption applies to any debit card issuer that, together with its affiliates, has total assets of less than $10 billion as of the end of the previous calendar year. In the event we qualify for the small issuer exemption, we will once again become subject to the interchange fee cap beginning July 1 of the year following the time when our total assets reaches or exceeds $10 billion. Reliance on the small issuer exemption would not exempt us from federal regulations prohibiting network exclusivity arrangements or from routing restrictions, however, and these regulations have negatively affected the interchange income we have received from our debit card network.
Consumer Financial Protection
We are subject to a number of federal and state consumer protection laws that extensively govern our relationship with our customers. These laws include the Equal Credit Opportunity Act, the Fair Credit Reporting Act, the Truth in Lending Act, the Truth in Savings Act, the Electronic Fund Transfer Act, the Expedited Funds
159
Table of Contents
Availability Act, the Home Mortgage Disclosure Act, the Fair Housing Act, the Real Estate Settlement Procedures Act, the Fair Debt Collection Practices Act, the Service Members Civil Relief Act and these laws’ respective state-law counterparts, as well as state usury laws and laws regarding unfair and deceptive acts and practices. These and other federal laws, among other things, require disclosures of the cost of credit and terms of deposit accounts, provide substantive consumer rights, prohibit discrimination in credit transactions, regulate the use of credit report information, provide financial privacy protections, prohibit unfair, deceptive and abusive practices, restrict our ability to raise interest rates and subject us to substantial regulatory oversight. Violations of applicable consumer protection laws can result in significant potential liability from litigation brought by customers, including actual damages, restitution and attorneys’ fees. Federal bank regulators, state attorneys general and state and local consumer protection agencies may also seek to enforce consumer protection requirements and obtain these and other remedies, including regulatory sanctions, customer rescission rights, action by the state and local attorneys general in each jurisdiction in which we operate and civil money penalties. Failure to comply with consumer protection requirements may also result in our failure to obtain any required bank regulatory approval for merger or acquisition transactions we may wish to pursue or our prohibition from engaging in such transactions even if approval is not required.
The Dodd-Frank Act created a new, independent federal agency, the CFPB, which was granted broad rulemaking, supervisory and enforcement powers under various federal consumer financial protection laws. The CFPB is also authorized to engage in consumer financial education, track consumer complaints, request data and promote the availability of financial services to underserved consumers and communities. Although all institutions are subject to rules adopted by the CFPB and examination by the CFPB in conjunction with examinations by the institution’s primary federal regulator, the CFPB has primary examination and enforcement authority over institutions with assets of $10 billion or more. The FDIC has primary responsibility for examination of our bank and enforcement with respect to federal consumer protection laws so long as our bank has total consolidated assets of less than $10 billion, and state authorities are responsible for monitoring our compliance with all state consumer laws. The CFPB also has the authority to require reports from institutions with less than $10 billion in assets, such as our bank, to support the CFPB in implementing federal consumer protection laws, supporting examination activities, and assessing and detecting risks to consumers and financial markets.
The consumer protection provisions of the Dodd-Frank Act and the examination, supervision and enforcement of those laws and implementing regulations by the CFPB have created a more intense and complex environment for consumer finance regulation. The CFPB has significant authority to implement and enforce federal consumer finance laws, including the Truth in Lending Act, the Equal Credit Opportunity Act and new requirements for financial services products provided for in the Dodd-Frank Act, as well as the authority to identify and prohibit unfair, deceptive or abusive acts and practices. The review of products and practices to prevent such acts and practices is a continuing focus of the CFPB, and of banking regulators more broadly. The ultimate impact of this heightened scrutiny is uncertain but could result in changes to pricing, practices, products and procedures. It could also result in increased costs related to regulatory oversight, supervision and examination, additional remediation efforts and possible penalties. In addition, the Dodd-Frank Act provides the CFPB with broad supervisory, examination and enforcement authority over various consumer financial products and services, including the ability to require reimbursements and other payments to customers for alleged legal violations and to impose significant penalties, as well as injunctive relief that prohibits lenders from engaging in allegedly unlawful practices. The CFPB also has the authority to obtain cease and desist orders providing for affirmative relief or monetary penalties. The Dodd-Frank Act does not prevent states from adopting stricter consumer protection standards. State regulation of financial products and potential enforcement actions could also adversely affect our business, financial condition or results of operations.
Community Reinvestment Act of 1977
Under the CRA, our bank has an obligation, consistent with safe and sound operations, to help meet the credit needs of the market areas where it operates, which includes providing credit to low- and moderate-income individuals and communities. In connection with its examination of our bank, the FDIC is required to assess our
160
Table of Contents
bank’s compliance with the CRA. Our bank’s failure to comply with the CRA could, among other things, result in the denial or delay in certain corporate applications filed by us or our bank, including applications for branch openings or relocations and applications to acquire, merge or consolidate with another banking institution or holding company. Our bank received a rating of “satisfactory” in its most recently completed CRA examination.
Financial Privacy
The federal bank regulators have adopted rules limiting the ability of banks and other financial institutions to disclose non-public information about consumers to unaffiliated third parties. These limitations require disclosure of privacy policies to consumers and, in some circumstances, allow consumers to prevent disclosure of certain personal information to an unaffiliated third party. These regulations affect how consumer information is transmitted through diversified financial companies and conveyed to outside vendors.
Anti-Money Laundering and the USA PATRIOT ACT
A major focus of governmental policy on financial institutions in recent years has been aimed at combating money laundering and terrorist financing. The USA PATRIOT Act of 2001, or the USA Patriot Act, substantially broadened the scope of United States anti-money laundering laws and regulations by imposing significant new compliance and due diligence obligations, creating new crimes and penalties and expanding the extra-territorial jurisdiction of the United States. Financial institutions are also prohibited from entering into specified financial transactions and account relationships and must use enhanced due diligence procedures in their dealings with certain types of high-risk customers and implement a written customer identification program. Financial institutions must take certain steps to assist government agencies in detecting and preventing money laundering and report certain types of suspicious transactions. Regulatory authorities routinely examine financial institutions for compliance with these obligations, and failure of a financial institution to maintain and implement adequate programs to combat money laundering and terrorist financing, or to comply with all of the relevant laws or regulations, could have serious legal and reputational consequences for the institution, including causing applicable bank regulatory authorities not to approve merger or acquisition transactions when regulatory approval is required or to prohibit such transactions even if approval is not required. Regulatory authorities have imposed cease and desist orders and civil money penalties against institutions found to be violating these obligations.
Office of Foreign Assets Control Regulation
The U.S. Treasury Department’s Office of Foreign Assets Control, or OFAC, administers and enforces economic and trade sanctions against targeted foreign countries and regimes, under authority of various laws, including designated foreign countries, nationals and others. OFAC publishes lists of specially designated targets and countries. We and our bank are responsible for, among other things, blocking accounts of, and transactions with, such targets and countries, prohibiting unlicensed trade and financial transactions with them and reporting blocked transactions after their occurrence. Failure to comply with these sanctions could have serious legal and reputational consequences, including causing applicable bank regulatory authorities not to approve merger or acquisition transactions when regulatory approval is required or to prohibit such transactions even if approval is not required.
Incentive Compensation
The Dodd-Frank Act requires the federal bank regulators and the SEC to establish joint regulations or guidelines prohibiting incentive-based payment arrangements at specified regulated entities, including us and our bank, having at least $1 billion in total assets that encourage inappropriate risks by providing an executive officer, employee, director or principal stockholder with excessive compensation, fees, or benefits or that could lead to material financial loss to the entity. In addition, these regulators must establish regulations or guidelines requiring enhanced disclosure to regulators of incentive-based compensation arrangements. The agencies
161
Table of Contents
proposed such regulations in April 2011, but the regulations have not been finalized. If the regulations are adopted in the form initially proposed, they will impose limitations on the manner in which we may structure compensation for our executives.
In June 2010, the Federal Reserve and FDIC issued comprehensive final guidance on incentive compensation policies intended to ensure that the incentive compensation policies of banking organizations do not undermine the safety and soundness of such organizations by encouraging excessive risk-taking. The guidance, which covers all employees that have the ability to materially affect the risk profile of an organization, either individually or as part of a group, is based upon the key principles that a banking organization’s incentive compensation arrangements should (1) provide incentives that appropriately balance risk and financial results in a manner that does not encourage employees to expose their organizations to imprudent risk, (2) be compatible with effective internal controls and risk management and (3) be supported by strong corporate governance, including active and effective oversight by the organization’s board of directors. These three principles are incorporated into the proposed joint compensation regulations under the Dodd-Frank Act, discussed above.
The Federal Reserve will review, as part of the regular, risk-focused examination process, the incentive compensation arrangements of banking organizations, such as us, that are not “large, complex banking organizations.” These reviews will be tailored to each organization based on the scope and complexity of the organization’s activities and the prevalence of incentive compensation arrangements. The findings of the supervisory initiatives will be included in reports of examination. Deficiencies will be incorporated into the organization’s supervisory ratings, which can affect the organization’s ability to make acquisitions and take other actions. Enforcement actions may be taken against a banking organization if its incentive compensation arrangements, or related risk management control or governance processes, pose a risk to the organization’s safety and soundness and the organization is not taking prompt and effective measures to correct the deficiencies.
Future Legislation and Regulation
Congress may enact legislation from time to time that affects the regulation of the financial services industry, and state legislatures may enact legislation from time to time affecting the regulation of financial institutions chartered by or operating in those states. Federal and state regulatory agencies also periodically propose and adopt changes to their regulations or change the manner in which existing regulations are applied. The substance or impact of pending or future legislation or regulation, or the application thereof, cannot be predicted, although enactment of the proposed legislation could impact the regulatory structure under which we operate and may significantly increase our costs, impede the efficiency of our internal business processes, require us to increase our regulatory capital and modify our business strategy, and limit our ability to pursue business opportunities in an efficient manner. Our business, financial condition, results of operations or prospects may be adversely affected, perhaps materially, as a result.
162
Table of Contents
Directors and Executive Officers
The following table and the descriptions below set forth biographical information regarding Great Western Bancorp, Inc.’s directors and executive officers as of the date of this prospectus:
| Name |
Age | Position | ||||
| Ken Karels |
57 | President, Chief Executive Officer and Director | ||||
| Nathan Butler |
42 | Director | ||||
| Swati Dave |
51 | Director | ||||
| Frances Grieb |
54 | Director | ||||
| Andrew Hove |
79 | Director | ||||
| Rolfe Lakin |
53 | Director | ||||
| Richard Rauchenberger |
51 | Director | ||||
| Daniel Rykhus |
49 | Director | ||||
| Richard Sawers |
60 | Director | ||||
| Peter Chapman |
40 | Chief Financial Officer and Executive Vice President | ||||
| Stephen Ulenberg |
57 | Chief Risk Officer and Executive Vice President | ||||
| Allen Shafer |
52 | Executive Vice President of Support Services | ||||
| Doug Bass |
53 | Regional President and Executive Vice President | ||||
| Bryan Kindopp |
47 | Regional President and Executive Vice President | ||||
Ken Karels has served as GWBI’s President and Chief Executive Officer and on its board of directors since 2010, as well as the President and Chief Executive Officer and on the board of directors of Great Western Bancorp, Inc. since July 2014. Mr. Karels is also the President and Chief Executive Officer of Great Western Bank and serves on the boards of directors of Great Western Bank and our other subsidiaries. Mr. Karels’s duties include overall leadership and executive oversight of Great Western Bank. Mr. Karels has 37 years of banking experience and expertise in all areas of bank management and strategic bank acquisitions. He has served in several different capacities at Great Western Bank since February 2002, including Regional President and Chief Operating Officer for the bank’s branch distribution channel including agriculture, business and retail lending and deposits functions. During his executive tenure, Mr. Karels has helped grow Great Western Bank from $5.2 billion in assets to over $9 billion in assets today. Before joining Great Western Bank, Mr. Karels served as President and Chief Executive Officer at Marquette Bank, Milbank, SD, where he was employed for 25 years.
Mr. Karels’s qualifications to serve on Great Western Bancorp, Inc.’s board of directors include his operating, management and leadership experience as Great Western’s President and Chief Executive Officer. Mr. Karels has extensive knowledge of, and has made significant contributions to, the growth of Great Western and our bank. Mr. Karels also brings to Great Western Bancorp, Inc.’s board of directors his expertise in the banking industry. Until such time as NAB ceases to control us for purposes of the BHC Act, Mr. Karels’s service on Great Western’s board will be required pursuant to the Stockholder Agreement we intend to enter into with NAB in connection with this offering as long as he remains President and Chief Executive Officer.
Nathan Butler joined NAB in 2001 and has served as a General Counsel at NAB for several years, leading its corporate legal department since 2007 and serving as General Counsel, Governance, Corporate & Enterprise Services since 2013. He has served on Great Western Bancorp, Inc.’s board of directors since July 2014. Mr. Butler has almost 20 years of experience as a corporate and commercial lawyer and has advised boards and senior managers on a broad range of strategic matters, including mergers & acquisitions, equity financings, major litigation, regulatory inquiries and legal and regulatory reform. He also advised NAB on its acquisition of GWBI in 2007 and 2008. Mr. Butler is a member of the Corporations Committee of the Law Council of Australia and of the Advisory Board to the Asian Law Centre of the University of Melbourne and is also chairman of a number of NAB Group subsidiary companies.
163
Table of Contents
Mr. Butler’s qualifications to serve on Great Western Bancorp, Inc.’s board of directors include his operating, management and leadership experience throughout the NAB corporate organization. Mr. Butler also has extensive experience in corporate governance, financial services regulation and investigation and mergers, acquisitions and business development in multiple jurisdictions across the United States, Europe and Australasia. Mr. Butler was nominated to Great Western Bancorp, Inc.’s board of directors by NAB consistent with its anticipated rights under the Stockholder Agreement we intend to enter into with NAB in connection with this offering.
Swati Dave is currently Acting Executive General Manager of NAB’s Lending & Deposits Group. From March 2009 to July 2014, Mrs. Dave served as Executive General Manager of NAB’s Specialised Finance business and had responsibility for leading the Project and Infrastructure Finance, Asset Finance and Leasing and Export Credit Agency businesses. She has served on Great Western Bancorp, Inc.’s board of directors since July 2014. Mrs. Dave joined NAB in 2005 and has over 25 years of total commercial banking and finance experience with NAB, Deutsche Bank, AMP Henderson Global Investors, Bankers Trust Australia, Westpac Banking Corporation and Commonwealth Bank of Australia. She is a member of the NAB Product and Markets Executive Committee and the NAB Product and Markets Risk Management Committee and is a director on the NAB Wealth responsible entity boards. Mrs. Dave is also a non-executive director of Australian Hearing, an Australian authority that provides hearing health services and undertakes hearing research, and the chair of its Audit and Risk Management Committee.
Mrs. Dave’s qualifications to serve on Great Western Bancorp, Inc.’s board of directors include her operating, management and leadership experience throughout the NAB corporate organization and in the banking and finance industry more generally. Mrs. Dave was nominated to Great Western Bancorp, Inc.’s board of directors by NAB consistent with its anticipated rights under the Stockholder Agreement we intend to enter into with NAB in connection with this offering.
Frances Grieb has served on the boards of directors of Great Western Bancorp, Inc. and Great Western Bank since July 2014. Mrs. Grieb has 29 years of public accounting experience with Deloitte LLP, the international professional services firm, and five years of banking industry experience with Packers National Bank, Omaha, NE. Mrs. Grieb was a Lead Client Service Partner and Audit Partner at Deloitte LLP’s Omaha, NE office from 1994 until her retirement in 2010. She also serves on the National Advisory Board of the College of Business at the University of Nebraska at Omaha and on the Millard Public Schools Business Advisory Council.
Mrs. Grieb’s qualifications to serve on Great Western Bancorp, Inc.’s board include her 34 years of relevant business experience and with the financial services industry in particular, including banking, insurance, broker-dealer, investment company and real estate audit and consulting. She has extensive experience working closely with companies of various sizes and has focused on accounting and technical matters, internal controls and reporting requirements and has significant experience with corporate governance and regulatory matters.
Andrew Hove has served on the board of directors of Great Western Bancorp, Inc. since July 2014. Mr. Hove has also served on the board of directors of our bank since 2001. From 2001 to 2009, Mr. Hove was also a director of both Sovereign Bank, Wyomissing, PA and Sovereign Bancorporation, Philadelphia, PA. Mr. Hove has over 50 years of banking experience, with over 40 years in retail banking in our states. Before joining Great Western Bank’s board, Mr. Hove worked at Minden Exchange Bank & Trust Co., Minden, Nebraska for 30 years, including as Chairman and Chief Executive Officer, and at the FDIC for over 10 years, including as Acting Chairman for a total of three years. Mr. Hove is also a director of the Federal Home Loan Bank of Topeka and an advisory director at Promontory Financial Group, Washington, DC.
Mr. Hove’s qualifications to serve on Great Western Bancorp, Inc.’s board include his leadership experience at Great Western Bank and Great Western and organizational, management and leadership experience in the broader financial services industry. In addition to his extensive banking and bank regulatory experience, Mr. Hove also brings to Great Western Bancorp, Inc.’s board of directors his extensive personal relationships stemming from his years of experience in the financial industry and in government.
164
Table of Contents
Rolfe Lakin joined NAB in 1996 and has served as General Manager and Chief Financial Officer for NAB New York Branch, NAB London Branch and NAB’s Specialised Group Assets line of business since 2009, as well as for NAB’s U.K. CRE line of business since 2012. The businesses for which he is Chief Financial Officer primarily involve wholesale banking activities. Mr. Lakin has served on Great Western Bancorp, Inc.’s board of directors since July 2014, and on a number of boards for other NAB Group subsidiary companies since 1998, and holds a Certificate in Company Direction from the U.K. Institute of Directors. He has over 35 years of banking experience, with over 25 years in wholesale banking markets in London. Mr. Lakin also has expertise in treasury management and has served on the NAB London Branch managing Executive Committee for many years. Before working at NAB, Mr. Lakin worked at The Co-operative Bank p.l.c. for 19 years in various roles.
Mr. Lakin’s qualifications to serve on Great Western Bancorp, Inc.’s board of directors include his operating, management and leadership experience throughout the NAB corporate organization. Mr. Lakin also has extensive experience in financial services and, more specifically, wholesale banking markets. Mr. Lakin was nominated to Great Western Bancorp, Inc.’s board of directors by NAB consistent with its anticipated rights under the Stockholder Agreement we intend to enter into with NAB in connection with this offering.
Richard Rauchenberger has served on Great Western Bancorp, Inc.’s board of directors since July 2014. Mr. Rauchenberger has also served on GWBI’s board of directors, the board of directors of our bank and the boards of directors of certain affiliated companies since 2011. Mr. Rauchenberger has been the General Manager and Head of NAB New York Branch since 2009. He is directly responsible for all activities under the NAB brand in the United States, except for our business. The activities for which he is responsible primarily involve wholesale banking operations. Mr. Rauchenberger has been with NAB since 1996 and has a total of 29 years of international banking experience. He has expertise in risk management and services, having served in numerous roles, including Head of Risk and Chief Operating Officer for NAB New York Branch and NAB’s global wholesale bank, respectively. Before working at NAB, Mr. Rauchenberger worked at Lloyds Bank’s New York Branch for nine years and at National Westminster Bank USA for two years. He is a director and member of the executive committee of the Institute of International Bankers and of the American Australian Association.
Mr. Rauchenberger’s qualifications to serve on Great Western Bancorp, Inc.’s board of directors include his operating, management and leadership experience as one of Great Western’s directors and throughout the NAB corporate organization. Mr. Rauchenberger also has an extensive knowledge of our business and the financial services industry generally. Mr. Rauchenberger was nominated to Great Western Bancorp, Inc.’s board of directors in July 2014 by NAB consistent with its anticipated rights under the Stockholder Agreement we intend to enter into with NAB in connection with this offering.
Daniel Rykhus has served on Great Western Bancorp, Inc.’s board of directors since July 2014. Mr. Rykhus joined Great Western Bank as a director and Audit Committee member in 2011. He has served as President and CEO of Raven Industries, a publicly-listed corporation that manufactures plastic, electronic and specialized-apparel products, since August 2010 and has been a member of the board of directors of Raven Industries since 2008. He has worked in various managerial capacities at Raven Industries since 1991, starting as Manufacturing Manager of the Applied Technology Division and serving from 1999 to 2008 as the Division’s General Manager. From 2008 to 2010, Mr. Rykhus was the Executive Vice President of Raven Industries. In addition, Mr. Rykhus serves on the boards of directors of the Sioux Empire United Way, the Sioux Falls Chamber of Commerce and Face It Together, a nonprofit organization that employs innovative approaches to combating drug and alcohol addiction.
Mr. Rykhus’s qualifications to serve on Great Western Bancorp, Inc.’s board of directors include his 23 years of managerial experience and his three years of experience as a director and audit committee member for Great Western Bank. As the leader of a publicly listed company with a market capitalization of over $1 billion as of August 2014, Mr. Rykhus also brings several years of public company corporate governance experience to Great Western Bancorp, Inc.’s board.
165
Table of Contents
Richard Sawers has served on NAB’s Group Executive Committee since 2009, during which time he led NAB’s global Wholesale Banking business and in 2013 established NAB’s Product and Markets division. He has served on Great Western Bancorp, Inc.’s board of directors since July 2014. Mr. Sawers is a member of the NAB Group Risk and Return Management Committee and a director of National Australia Group (Europe) Limited and Clydesdale Bank PLC. He is also a board member (and former chairman) of the Australian Financial Markets Association, a senior fellow of the Financial Services Institute of Australia, a graduate member of the Australia Institute of Company Directors and a life member of the Financial Markets Foundation for Children.
Mr. Sawers has 43 years of commercial and international banking experience, including assignments in London, New York, Los Angeles, Tokyo, Sydney and Melbourne. He has successfully led a number of large frontline businesses and, in his broader role as a Group Executive at NAB, Mr. Sawers has also performed key functions in the areas of risk governance, people and culture and financial oversight. Early in his career, Mr. Sawers worked in financial markets (including capital markets, funding, liquidity and fixed income, money markets, FX and interest rate risk management) where he led trading, sales and treasury functions and, at times, was responsible for technology, operations and risk areas. He has also had assignments in retail banking, trade finance and payments.
Mr. Sawers’s qualifications to serve as chairman of Great Western Bancorp, Inc.’s board of directors include his operating, management and leadership experience throughout the NAB corporate organization and in the broader financial services industry. In addition to his extensive banking experience, Mr. Sawers also brings to Great Western Bancorp, Inc.’s board of directors his extensive personal relationships stemming from his years of experience in the financial industry. Mr. Sawers was nominated to Great Western Bancorp, Inc.’s board of directors by NAB consistent with its anticipated rights under the Stockholder Agreement we intend to enter into with NAB in connection with this offering.
Peter Chapman has served as GWBI’s Chief Financial Officer and Executive Vice President and on its board of directors since January 2013, as well as the Chief Financial Officer and Executive Vice President of Great Western Bancorp, Inc. since its formation in July 2014. Mr. Chapman is also the Chief Financial Officer and Executive Vice President of Great Western Bank. Mr. Chapman has nearly 20 years of industry experience and is responsible for all aspects of our financial and regulatory reporting together with planning and strategy and treasury management of our balance sheet. From 2010 until he was appointed as our Chief Financial Officer in November 2012, Mr. Chapman served as the General Manager, Finance Performance Management & Non Traded Businesses for NAB’s Wholesale Banking business. From 2007 to 2010, Mr. Chapman served as Head of Financial Control at NAB and was responsible for oversight and delivery of NAB’s external financial reporting and internal management reporting. From 2004 to 2007, Mr. Chapman was Manager, and then Senior Manager, in NAB’s Group Accounting Policy team. From 1995 to 2004, Mr. Chapman held various roles with Ernst & Young’s Financial Services Audit Division, including Group Manager of its Melbourne, Australia office’s Financial Services Audit practice, and he was seconded to Ernst & Young’s New York office from 1998 to 2000. Mr. Chapman has been a Chartered Accountant with the Institute of Chartered Accountants Australia since 1998 and is currently a Fellow of the Institute.
Stephen Ulenberg has served as Great Western’s Chief Risk Officer and Executive Vice President since 2012. Mr. Ulenberg has also served as the Chief Risk Officer and Executive Vice President of Great Western Bank since 2010. Mr. Ulenberg is responsible for ensuring that risk is effectively managed and overseen across our enterprise. Mr. Ulenberg has over 30 years of experience in the financial services industry, including a 24-year career with NAB and its subsidiaries, where he has worked in a number of senior positions including frontline business leadership in commercial and wholesale banking, risk management and major, cross-organizational strategic initiatives—at both Bank of New Zealand (a NAB subsidiary) and NAB. Immediately prior to joining Great Western Bank, Mr. Ulenberg was responsible for the leadership of Bank of New Zealand’s enterprise risk management capability across a $60 billion lending portfolio. In that role, Mr. Ulenberg provided related analytics, risk reporting, portfolio metrics, risk insights, asset quality information and oversight of decision analysis, managed provisioning, risk appetite and advanced Basel models and led ongoing enhancements to Bank of New Zealand’s risk management capabilities.
166
Table of Contents
Allen Shafer has served as the Executive Vice President of Support Services of Great Western Bank since August 2012. Mr. Shafer is responsible for our operations and information technology groups, along with our project management office. Mr. Shafer joined Great Western Bank in December 2002 and has held the positions of Chief Credit Officer, Regional President and Group President at Great Western Bank. Mr. Shafer has 29 years of banking experience. Prior to joining Great Western Bank, he served as Market Manager at Wells Fargo after Wells Fargo acquired Brenton Bank in Iowa. At Brenton Bank, Mr. Shafer held a variety of positions from 1991 to 2001, including President of Business Banking and Regional Manager of Commercial Banking. In 1987, Mr. Shafer joined First Interstate Bank, Seattle, WA, as a Commercial Banking Manager. Mr. Shafer began his banking career in 1985 at Citizen’s Bank and Trust, Belle Plaine, IA.
Doug Bass has served as a Regional President of Great Western Bank since 2010 and is also an Executive Vice President of Great Western Bank. Mr. Bass oversees all of our banking operations within the states of Arizona, Colorado, Iowa, Kansas and Missouri, as well as our wealth management, brokerage and mortgage banking business lines. In total, Mr. Bass has over 31 years of banking experience. Mr. Bass has worked in various capacities with Great Western Bank since 2009 and has expertise in all areas of bank management within Great Western Bank. Before joining Great Western Bank, Mr. Bass served as President of First American Bank Group. Previously Mr. Bass served in various capacities over 15 years with Firstar Corporation, which is now known as US Bank, including as President and Chief Executive Officer of Firstar’s Sioux City and Council Bluffs operations in Western Iowa and as Manager of Correspondent Banking for its Eastern Iowa operations, which also included responsibility for commercial banking and agribusiness lending.
Bryan Kindopp has served as a Regional President of Great Western Bank since 2011 and is also an Executive Vice President of Great Western Bank. Mr. Kindopp oversees all of our banking operations within the states of South Dakota and Nebraska. In these two states, Mr. Kindopp is responsible for branch operations of 83 of our locations and 600 of our employees. Mr. Kindopp has 23 years of banking experience. Mr. Kindopp has expertise in all areas of bank management and strategic bank acquisitions and has served in several different capacities at Great Western Bank since 2001. Mr. Kindopp’s roles have included Market President and Group President for our bank’s branch distribution channel for the Northeastern region of South Dakota. In these roles, Mr. Kindopp had responsibility for agriculture and commercial business and retail lending and deposit functions. Before joining Great Western Bank, Mr. Kindopp served as Vice President and Market Manager for three years at Marquette Bank, Kimball, SD, where he was employed for a total of ten years.
Status as a “Controlled Company”
Our common stock will be listed on the NYSE and, as a result, we will be subject to NYSE corporate governance listing standards. However, a listed company that satisfies the definition of a “controlled company” (i.e., a company of which more than 50% of the voting power is held by a single entity or group) may elect not to comply with certain of these requirements. As part of our separation from NAB, we intend to enter into the Stockholder Agreement, which will provide NAB with certain rights relating to the composition of our board of directors consistent with the requirements applicable to a “controlled company.” In particular, so long as NAB directly or indirectly owns more than 50% of our outstanding common stock and we are therefore a “controlled company,” and during the 12-month transition phase following the date on which we are no longer a “controlled company” as a result of NAB’s ownership of shares of our outstanding common stock, we will elect not to comply with the corporate governance standards of the NYSE requiring: (1) a majority of independent directors on the board of directors, (2) a fully independent corporate governance and nominating committee and (3) a fully independent compensation committee. As discussed below, five of our nine directors, including at least one member of each of the corporate governance and nominating committee, compensation committee and risk committee of our board of directors are directors designated by NAB and will not necessarily qualify as “independent directors” under the applicable rules of the NYSE. See “Our Relationship with NAB and Certain Other Related Party Transactions—Relationship with NAB—Stockholder Agreement.”
167
Table of Contents
Composition and Classification of Our Board of Directors
Great Western Bancorp, Inc.’s current board of directors is composed of nine members, consisting of our President and Chief Executive Officer, five directors designated for nomination and election by NAB and three other directors who will be “independent” under the listing standards of the NYSE.
Under our amended and restated certificate of incorporation to be effective prior to the completion of this offering, the number of directors constituting our board of directors will be fixed from time to time by resolution of our board of directors. The Stockholder Agreement will provide that we cannot change the size of our board of directors without NAB’s prior written approval, other than as contemplated in the Stockholder Agreement, until the Non-Control Date, as defined in “Our Relationship with NAB and Certain Other Related Party Transactions” below.
Each of our directors is currently elected for a one-year term. Prior to the completion of this offering, we intend to amend our certificate of incorporation to classify our board of directors into three staggered classes, with directors in each class serving staggered three-year terms. At each annual meeting of stockholders, upon the expiration of the term of a class of directors, the successor to each such director in the class will be elected to serve from the time of election and qualification until the third annual meeting following his or her election and until his or her successor is duly elected and qualified, in accordance with our amended and restated certificate of incorporation. Any additional directorships resulting from an increase in the number of directors will be distributed among the three classes so that, as nearly as possible, each class will consist of one-third of the directors serving on our board of directors.
Until NAB ceases to beneficially own at least 5% of our common stock and non-voting common stock, in connection with any meeting of our stockholders at which directors are to be elected, the Stockholder Agreement will provide NAB the right to designate a number of individuals for nomination and election to our board of directors determined by a formula described in the agreement. We will be required to recommend and solicit proxies in favor of, and to otherwise use our best efforts to cause the election of, each person designated by NAB whose nomination has been approved.
See “Our Relationship with NAB and Certain Other Related Party Transactions—Relationship with NAB—Stockholder Agreement” for more information.
Committees of Our Board of Directors
The standing committees of our board of directors consist of an audit committee, a corporate governance and nominating committee, a compensation committee, a risk committee and an executive committee. The responsibilities of these committees are described below. Our board of directors may also establish various other committees to assist it in its responsibilities. However, the Stockholder Agreement provides that, until the Non-Control Date, without NAB’s prior written approval, we may not form, or delegate any authority to, any new committee of our board of directors or to any subcommittee thereof.
Audit Committee. The audit committee will assist the board of directors in fulfilling its responsibilities for general oversight of the integrity of our financial statements, our compliance with legal and regulatory requirements, our independent auditors’ qualifications and independence, the performance of our internal audit function and independent auditors and our risk assessment and risk management. Among other things, the audit committee will:
| • | appoint, oversee and determine the compensation of our independent auditors; |
| • | review and discuss our financial statements and the scope of our annual audit to be conducted by our independent auditors and approve all audit fees; |
| • | review and discuss our financial reporting activities, including our annual report, and the accounting standards and principles followed in connection with those activities; |
168
Table of Contents
| • | discuss with our independent auditors and management the adequacy and effectiveness of our framework for assessing and managing our overall risk exposure (and the steps management has taken to monitor and control these risks and reviewing reports from management on the status of and changes to risk exposures, policies and practices); |
| • | pre-approve audits and non-audit services provided by our independent auditors; |
| • | meet with management and our independent auditors to review and discuss our financial statements and financial disclosure; |
| • | establish and oversee procedures for the treatment of complaints regarding accounting and auditing matters; |
| • | review the scope and staffing of our internal audit function and our disclosure and internal controls; and |
| • | monitor our legal, ethical and regulatory compliance. |
Under the Stockholder Agreement, the audit committee must consist of at least three members. These members are Mrs. Frances Grieb (Chairperson) and Messrs. Andrew Hove and Daniel Rykhus, all of whom will be “independent” under the listing standards of the NYSE and meet the requirements of Rule 10A-3 of the Exchange Act. Currently, Frances Grieb serves as the audit committee’s “audit committee financial expert.” Under the Stockholder Agreement, until the Non-Control Date, if any of the directors designated for nomination and election to our board of directors by NAB qualifies as an independent director and satisfies the requirements of Rule 10A-3 and the NYSE listing standards, at least one member of the audit committee will be a director designated for nomination and election to our board of directors by NAB.
The audit committee will adopt a written charter that specifies the scope of its rights and responsibilities, including those listed above. The charter will be available on our website at greatwesternbank.com.
Compensation Committee. The compensation committee will be responsible for discharging the responsibilities of our board of directors relating to compensation of our executives and directors (other than certain compensation decisions regarding our Chief Executive Officer, which will be made by our board of directors). Among other things, the compensation committee will:
| • | review no less than annually our compensation programs and incentive plans to determine whether they are properly coordinated and achieving their intended purposes; |
| • | review our overall compensation philosophy with a view to appropriately balancing risk and financial results in a manner that does not encourage employees to expose us to imprudent risks; is consistent with safety, soundness, the goals and objectives of these plans and the compensation practices of any relevant peer group of competitive companies; and reviewing (with input from our Chief Risk Officer) the relationship between risk management policies and practices, corporate strategy and senior executive compensation; |
| • | review and discuss with management our compensation discussion and analysis, recommend its inclusion in our annual proxy statement or report and prepare our compensation committee report; |
| • | review and oversee executive incentive compensation plans and programs, including any equity-based compensation plans; |
| • | review and recommend to our board of directors any changes in compensation for directors; and |
| • | evaluate our compensation strategies. |
Under the Stockholder Agreement, the compensation committee must consist of at least three members. These members are Messrs. Rykhus (Chairperson), Hove and Rauchenberger. Under the Stockholder Agreement, at all times prior to the date when NAB ceases to beneficially own at least 50% of our outstanding common stock, at least one of the members of the compensation committee will initially be a director designated for nomination and election to our board of directors by NAB. After NAB ceases to beneficially own at least 50% of our common stock, the compensation committee will transition to full compliance with Section 303A.05 of the
169
Table of Contents
Listed Company Manual of the NYSE, or the NYSE Manual, as follows. On or before 90 days after the date when NAB ceases to beneficially own at least 50% of our outstanding common stock, the compensation committee will consist of a majority of independent directors. On the date one year after the date that NAB ceases to beneficially own at least 50% of our outstanding common stock, the committee will consist solely of independent directors. After such time as the compensation committee transitions to full independence, but prior to the Non-Control Date, if any of the directors designated for nomination and election to our board of directors by NAB qualifies as an independent director, at least one such director will be a member of the compensation committee.
The compensation committee will adopt a written charter that specifies the scope of its rights and responsibilities, including those listed above. The charter will be available on our website at greatwesternbank.com.
Corporate Governance and Nominating Committee. The corporate governance and nominating committee will be responsible for ensuring an effective and efficient system of governance for Great Western by clarifying the roles of our board of directors and its committees; identifying, evaluating and recommending to our board of directors candidates for directorships; and reviewing and making recommendations with respect to the size and composition of our board of directors. In addition, the corporate governance and nominating committee will be responsible for reviewing and overseeing our corporate governance guidelines and for making recommendations to our board of directors concerning governance matters. Among other things, the corporate governance and nominating committee will:
| • | identify individuals qualified to be directors consistent with our corporate governance guidelines and evaluate and recommend director nominees for approval by our board of directors; |
| • | review and make recommendations to our board of directors concerning the structure and membership of board committees; |
| • | develop and annually review our corporate governance guidelines; |
| • | oversee the annual self-evaluation of our board of directors and its committees; |
| • | oversee management continuity planning; and |
| • | oversee risks related to corporate governance. |
The members of the corporate governance and nominating committee are Mr. Butler (Chairperson), Mrs. Grieb and Mr. Rykhus. Under the Stockholder Agreement, at all times prior to the date when NAB ceases to beneficially own at least 50% of our outstanding common stock, at least one member of the corporate governance and nominating committee will be a director designated for nomination and election to our board of directors by NAB. After NAB ceases to beneficially own at least 50% of our common stock, the corporate governance and nominating committee will transition to full compliance with Section 303A.04 of the NYSE Manual, as follows. On or before 90 days after the date when NAB ceases to beneficially own at least 50% of our outstanding common stock, the corporate governance and nominating committee will consist of a majority of independent directors. On the date one year after NAB ceases to be beneficial owner of at least 50% of our outstanding common stock, the committee will consist solely of independent directors. After such time as the corporate governance and nominating committee transitions to full independence, but prior to the Non-Control Date, if any of the directors designated for nomination and election to our board of directors by NAB qualifies as an independent director, at least one such director will be a member of the corporate governance and nominating committee.
The corporate governance and nominating committee will adopt a written charter that specifies the scope of its rights and responsibilities, including those listed above. The charter will be available on our website at greatwesternbank.com.
170
Table of Contents
Risk Committee. The risk committee will assist the board of directors in fulfilling its responsibilities for oversight of our enterprise-wide risk management framework, including reviewing our overall risk appetite, risk management strategy, and policies and practices established by our management to identify and manage risks we face. Among other things, the risk committee will:
| • | review reports on and oversee our enterprise-wide risk management framework, including processes and resources necessary for us to execute our risk program effectively; |
| • | consider the alignment of our risk profile with our strategic plan, goals, objectives and risk appetite; |
| • | review reports from management on any significant new business or strategic initiatives expected; |
| • | consult at least on an annual basis with the Chief Executive Officer, Chief Risk Officer and other executive management as required to review our overall risk appetite and make recommendations to our board of directors; |
| • | consider, where necessary or appropriate, communications from regulatory authorities, including those pertaining to examinations; |
| • | review minutes of all meetings of our management risk committee; |
| • | review with the Chief Risk Officer and management their assessment of our risk position and profile, matters of note, trends and emerging risks; and |
| • | assist in promoting a risk-based culture and reinforcing achievement of a balance between risk and return. |
Under the Stockholder Agreement, from the completion of this offering until one year after the date NAB ceases to beneficially own at least 50% of our outstanding common stock, the risk committee will consist of at least two members. The members of the risk committee are Mrs. Dave (Chairperson), Mrs. Grieb and Mr. Rauchenberger. Under the Stockholder Agreement, at least one of the members of the risk committee will be a director designated for nomination and election to our board of directors by NAB and at least one member of our risk committee must have experience in identifying, assessing and managing the risk exposures of large, complex firms.
The risk committee will adopt a written charter that specifies the scope of its rights and responsibilities, including those listed above. The charter will be available on our website at greatwesternbank.com.
Executive Committee. The executive committee will be responsible for providing guidance and counsel to Great Western’s management team on significant matters affecting Great Western and taking action on behalf of our board where required in exigent circumstances where it is impracticable or infeasible to convene, or obtain the unanimous written consent of, our full board of directors. Under the Stockholder Agreement, from the completion of this offering until one year after the date NAB ceases to beneficially own at least 50% of our outstanding common stock, the executive committee will consist of (i) our Chief Executive Officer, (ii) one independent director who is not a NAB independent director and (iii) two NAB Directors, one of whom is designated and treated as an alternate to serve in the absence of the other NAB-appointed member. The members of the executive committee are Messrs. Sawers (Chairperson), Karels and Hove. Mr. Rauchenberger has been appointed as alternate to Mr. Sawers as Chairperson. Until one year after the date NAB ceases to beneficially own at least 50% of our outstanding common stock, any act of the executive committee must include the consent of the acting NAB Director serving on the executive committee.
Board Leadership Structure and Qualifications
We believe that our directors should have the highest professional and personal ethics and values, consistent with our longstanding values and standards. They should have broad experience at the policy-making level in business, government or banking. They should be committed to enhancing stockholder value and should have sufficient time to carry out their duties and to provide insight and practical wisdom based on experience. Their service on boards of other companies should be limited to a number that permits them, given their individual
171
Table of Contents
circumstances, to perform responsibly all director duties. Each director must represent the interests of all stockholders. When considering potential director candidates, our board of directors also considers the candidate’s character, judgment, diversity, skills, including financial literacy, and experience in the context of our needs and those of the board of directors.
Our board of directors does not have a policy regarding the separation of the roles of Chief Executive Officer and Chairperson of the Board. Currently, our President and Chief Executive Officer does not serve as the Chairperson of the Board.
Board Oversight of Risk Management
Our board of directors believes that effective risk management and control processes are critical to our safety and soundness, our ability to predict and manage the challenges that we face and, ultimately, our long-term corporate success. Our board of directors, both directly and through its committees, is responsible for overseeing our risk management processes, with each of the committees of our board of directors assuming a different and important role in overseeing the management of the risks we face.
The risk committee of our board of directors oversees our enterprise-wide risk management framework, which establishes our overall risk appetite and risk management strategy and enables our management to understand, manage and report on the risks we face. Our risk committee also reviews and oversees policies and practices established by management to identify, assess, measure and manage key risks we face, including the risk appetite metrics developed by management and approved by our board of directors. The audit committee of our board of directors is responsible for overseeing risks associated with financial matters (particularly financial reporting, accounting practices and policies, disclosure controls and procedures and internal control over financial reporting), reviewing and discussing generally the identification, assessment, management and control of our risk exposures on an enterprise-wide basis and engaging as appropriate with our risk committee to assess our enterprise-wide risk framework. The compensation committee of our board of directors has primary responsibility for risks and exposures associated with our compensation policies, plans and practices, regarding both executive compensation and the compensation structure generally. In particular, our compensation committee, in conjunction with our President and Chief Executive Officer and Chief Risk Officer and other members of our management as appropriate, reviews our incentive compensation arrangements to ensure these programs are consistent with applicable laws and regulations, including safety and soundness requirements, and do not encourage imprudent or excessive risk-taking by our employees. The corporate governance and nominating committee of our board of directors oversees risks associated with the independence of our board of directors and potential conflicts of interest.
Our senior management is responsible for implementing and reporting to our board of directors regarding our risk management processes, including by assessing and managing the risks we face, including strategic, operational, regulatory, investment and execution risks, on a day-to-day basis. Our senior management is also responsible for creating and recommending to our board of directors for approval appropriate risk appetite metrics reflecting the aggregate levels and types of risk we are willing to accept in connection with the operation of our business and pursuit of our business objectives.
The role of our board of directors in our risk oversight is consistent with our leadership structure, with our President and Chief Executive Officer and the other members of senior management having responsibility for assessing and managing our risk exposure, and our board of directors and its committees providing oversight in connection with those efforts. We believe this division of risk management responsibilities presents a consistent, systemic and effective approach for identifying, managing and mitigating risks throughout our operations.
Compensation Committee Interlocks and Insider Participation
When our compensation committee is formed, no member of our compensation committee will be or have been one of our officers or employees, and none will have any relationships with us of the type that is required to be
172
Table of Contents
disclosed under Item 404 of Regulation S-K. None of our executive officers serves or has served as a member of the board of directors, compensation committee or other board committee performing equivalent functions of any entity that has one or more executive officers serving as one of our directors or on our compensation committee.
Corporate Governance Guidelines and Code of Ethics
Our board of directors has adopted corporate governance guidelines, which will be accessible through our principal corporate website at greatwesternbank.com, that set forth a framework within which our board of directors, assisted by board committees, will direct the company’s affairs. These guidelines address among other things, the composition and functions of our board of directors, director independence, compensation of directors, management succession and review, board committees and selection of new directors.
Our board of directors has adopted a code of ethics applicable to our principal executive, financial and accounting officers. A copy of that code will be available on our investor relations website, accessible through our principal corporate website at greatwesternbank.com. We expect that any amendments to the code, or any waivers of its requirements, will be disclosed on our principal corporate website at greatwesternbank.com as required by applicable law or listing requirements.
173
Table of Contents
EXECUTIVE AND DIRECTOR COMPENSATION
Summary Compensation Table
The following table presents compensation awarded in the fiscal year ended September 30, 2013 to our principal executive officer and our two other most highly compensated persons serving as executive officers as of September 30, 2013 or paid to or accrued for those executive officers for services rendered during fiscal 2013. We refer to these executive officers as our “named executive officers.”
| Name & Principal Position |
Fiscal year ended Sept. 30, |
Salary | Bonus(4) | Stock Awards(5), (6) |
All Other Compensation(7) |
Total | ||||||||||||||||
| Kenneth Karels(1) |
2013 | $ | 550,000 | $ | 237,187 | $ | 1,391,208 | $ | 17,234 | $ | 2,195,629 | |||||||||||
| President and Chief Executive Officer |
||||||||||||||||||||||
| Peter Chapman(1), (2) |
2013 | 358,700 | 79,099 | 177,823 | 88,989 | 704,611 | ||||||||||||||||
| Executive Vice President and Chief Financial Officer |
||||||||||||||||||||||
| Stephen Ulenberg(1), (3) |
2013 | 180,368 | 60,474 | 193,926 | 201,064 | 635,832 | ||||||||||||||||
| Executive Vice President and Chief Risk Officer |
||||||||||||||||||||||
| (1) | Mr. Chapman was seconded to us from NAB during fiscal 2013 beginning in January 2013, and Mr. Ulenberg was seconded to us from Bank of New Zealand, a wholly owned subsidiary of NAB, for all of fiscal 2013. In connection with this offering, we have entered into new employment agreements with our named executive officers, and Mr. Chapman’s and Mr. Ulenberg’s employment with NAB or Bank of New Zealand, as applicable, will be transferred to us when the agreements become effective upon the completion of this offering. See “—New Employment Arrangements” for further details. |
| (2) | In addition to amounts in the stock awards column, the following items of Mr. Chapman’s compensation for fiscal 2013 have been converted from Australian dollars to U.S. dollars using an exchange rate as of September 30, 2013 of A$1.00 = US$0.9309: base salary paid by NAB before Mr. Chapman was seconded to us, the portion of the bonus attributable to the period of the 2013 fiscal year before Mr. Chapman was seconded to us, contributions to an Australian superannuation fund, certain expatriate benefits and premiums for medical coverage. The remaining items were paid in U.S. dollars. |
| (3) | The following items were provided to Mr. Ulenberg by NAB or Bank of New Zealand for fiscal 2013 and have been converted from New Zealand dollars to U.S. dollars using an exchange rate as of September 30, 2013 of NZ$1.00 = US$0.8270: about 35% of base salary, bonus, contributions to a New Zealand superannuation fund, certain expatriate benefits and premiums for medical coverage. The remaining items (including tax equalization payments) were paid in U.S. dollars. |
| (4) | The amounts in this column represent the cash portion of each named executive officer’s 2013 annual incentive under the NAB Group Short Term Incentive Plan, or the NAB STI Plan. These amounts do not include the portion of the 2013 annual incentive that was subject to mandatory deferral and granted in February 2014 in the form of deferred shares of NAB common stock. See “—Annual Cash and Deferred Equity-Based Incentive Compensation” for further details. |
| (5) | The amounts in this column reflect the aggregate grant date fair value under FASB ASC Topic 718 of NAB equity-based awards granted to the named executive officers in fiscal 2013. For each of the named executive officers, the amounts include the portion of the 2012 annual incentive that was subject to mandatory deferral and granted in November 2012 (and, for Mr. Karels, May 2013) in the form of deferred shares of NAB common stock, with the following grant date fair values: Mr. Karels—$155,324, Mr. Chapman—$39,985, and Mr. Ulenberg—$30,400. The amounts also include: (1) for Messrs. Karels and Ulenberg, a long-term equity incentive award of performance shares of NAB common stock granted in December 2012 (with a grant date fair value of $246,805 and $114,060, respectively), which will vest based on NAB’s total stockholder return performance against two peer groups from December 2012 to December 2016, (2) for Mr. Chapman, two long-term equity incentive awards of restricted shares of NAB common stock each granted in December 2012 (with |
174
Table of Contents
| grant date fair values of $934 and $2,855) in recognition of NAB’s 2012 fiscal year performance, and (3) for each of Messrs. Karels, Chapman and Ulenberg, a special, one-time award of restricted shares of NAB common stock granted in November 2012, February 2013 and November 2012, respectively (with a grant date fair value of $989,079, $134,049 and $49,466, respectively), in recognition of their contributions. |
| (6) | The amounts in this column have been converted from Australian dollars to U.S. dollars using an exchange rate as of September 30, 2013 of A$1.00 = US$0.9309. |
| (7) | The amounts in this column include: |
| • | For Mr. Karels: a matching contribution of $6,375 and a profit sharing contribution of $10,625 under our 401(k) plan; and company-paid premiums for group life insurance of $234. |
| • | For Mr. Chapman: a contribution of $12,568 by NAB to an Australian superannuation fund; expatriate benefits in connection with his international assignment from Australia to the U.S. of $58,414 (comprised of $15,000 in housing expenses, $18,963 in airfare and $24,451 in other benefits); and premiums for medical coverage of $18,007. |
| • | For Mr. Ulenberg: a contribution of $6,662 by Bank of New Zealand to a New Zealand superannuation scheme; expatriate benefits in connection with his international assignment from New Zealand to the U.S. of $164,690 (comprised of $118,934 in tax equalization payments, $36,000 in housing expenses and $9,756 in other benefits); and premiums for medical coverage of $29,712. |
Outstanding Equity Awards at Fiscal Year End
As of September 30, 2013, none of the named executive officers held any outstanding Great Western equity-based awards. The following table provides information about the outstanding NAB equity-based awards held by each of our named executive officers as of September 30, 2013:
| Name |
Number of Shares or Units of Stock That Have Not Vested (#) |
Market Value of Shares or Units of Stock That Have Not Vested(1) |
Equity Incentive Plan Awards: Number of Unearned Shares, Units or Other Rights That Have Not Vested (#) |
Equity Incentive Plan Awards: Market or Payout Value of Unearned Shares, Units or Other Rights That Have Not Vested(1) |
||||||||||||
| Kenneth Karels |
37,871 | (2) | $ | 1,209,921 | 9,510 | (12) | $ | 303,830 | ||||||||
| 5,754 | (3) | 183,832 | 6,694 | (13) | 213,863 | |||||||||||
| 184 | (4) | 5,879 | ||||||||||||||
| 3,241 | (5) | 103,545 | ||||||||||||||
| Peter Chapman |
4,234 | (6) | 135,270 | — | — | |||||||||||
| 1,531 | (7) | 48,913 | ||||||||||||||
| 146 | (8) | 4,664 | ||||||||||||||
| 184 | (4) | 5,879 | ||||||||||||||
| 162 | (9) | 5,176 | ||||||||||||||
| Stephen Ulenberg |
1,164 | (3) | 37,188 | 4,395 | (12) | 140,414 | ||||||||||
| 1,894 | (10) | 60,510 | 2,861 | (13) | 91,405 | |||||||||||
| 230 | (11) | 7,348 | ||||||||||||||
| (1) | The market value was determined by multiplying the number of shares or units by the closing price of a share of NAB common stock on September 30, 2013, converted into U.S. dollars at an exchange rate as of September 30, 2013 of A$1.00 = US$0.9309, resulting in a value of approximately US$31.95 per share. |
| (2) | Represents a special, one-time award of restricted shares granted in November 2012 in recognition of Mr. Karels’ contributions. The shares are scheduled to vest on October 31, 2015. |
| (3) | Represents deferred shares under the NAB STI Plan granted in respect of the 2012 fiscal year in November 2012 and May 2013. 50% of the shares vested on November 7, 2013 and 50% are scheduled to vest on November 7, 2014. |
| (4) | Represents a long-term equity incentive award of restricted shares granted in respect of the 2010 fiscal year in December 2010. The shares vested on December 15, 2013. |
175
Table of Contents
| (5) | Represents deferred shares under the NAB STI Plan granted in respect of the 2011 fiscal year in November 2011. The shares vested on November 23, 2013. |
| (6) | Represents a special, one-time award of restricted shares granted in February 2013 in recognition of Mr. Chapman’s contributions. 50% of the shares vested on November 1, 2013 and 50% are scheduled to vest on November 1, 2014. |
| (7) | Represents deferred shares under the NAB STI Plan granted in respect of the 2012 fiscal year in November 2012. The shares vested on November 7, 2013. |
| (8) | Represents two long-term equity incentive awards of restricted shares granted in respect of the 2012 fiscal year in December 2012. The shares are scheduled to vest on December 12, 2015. |
| (9) | Represents two long-term equity incentive awards of restricted shares granted in respect of the 2011 fiscal year in December 2011. The shares are scheduled to vest on December 14, 2014. |
| (10) | Represents a special, one-time award of restricted shares granted in November 2012 in recognition of Mr. Ulenberg’s contributions. 50% of the shares vested on October 15, 2013 and 50% are scheduled to vest on October 15, 2015. |
| (11) | Represents two long-term equity incentive awards of restricted shares granted in respect of the 2010 fiscal year in December 2010. The shares vested on December 15, 2013. |
| (12) | Represents the maximum number of unearned performance shares granted in December 2012. The performance shares are scheduled to vest on December 19, 2016. The actual number of performance shares that vest will be based on NAB’s total stockholder return performance against two different peer groups from December 2012 to December 2016. Any performance shares that are unvested after the first performance period are scheduled to vest on December 19, 2017, based on performance from December 2012 to December 2017. Any performance shares that do not vest following the second performance period will be forfeited. |
| (13) | Represents the maximum number of unearned performance shares granted in December 2011. The performance shares are scheduled to vest on December 14, 2014. The actual number of performance shares that vest will be based on NAB’s total stockholder return performance against two different peer groups from October 2011 to September 2014. Any performance shares that do not vest following the performance period will be forfeited. |
Annual Cash and Deferred Equity-Based Incentive Compensation
For the 2013 fiscal year, our named executive officers participated in the NAB STI Plan. The NAB STI Plan rewards achievement of four key business drivers: financial and risk management; strategic projects; employees and culture; and customer and community. Each named executive officer’s target short-term incentive, or STI, was established prior to the beginning of the 2013 fiscal year, and the actual STI earned reflects both individual and business performance.
| Name |
Base Salary | STI Target Percentage |
STI Target Amount |
Business STI Multiple |
Individual STI Multiple |
Earned STI | ||||||||||||||||||
| Kenneth Karels |
$ | 550,000 | 75 | % | $ | 412,500 | 1 | 1.15 | $ | 474,375 | ||||||||||||||
| Peter Chapman(1) |
310,000 | 30 | % | 93,000 | 1 | 1.15 | 106,950 | |||||||||||||||||
| Stephen Ulenberg(2) |
206,750 | 30 | % | 62,025 | 1 | 1.30 | 80,633 | |||||||||||||||||
| (1) | Mr. Chapman received a target STI opportunity of 30% from us, pursuant to the terms of his secondment letter agreement. |
| (2) | Amounts for Mr. Ulenberg have been converted from New Zealand dollars to U.S. dollars using an exchange rate as of September 30, 2013 of NZ$1.00 = US$0.8270. |
Determination of Earned STI Award. The business STI multiple can range from 0 up to 1.3 for exceptional business performance, and was determined by NAB’s board at the end of the fiscal year after taking into account NAB’s management of business risks, stockholder expectations and the quality of NAB’s financial results. For the 2013 fiscal year, NAB’s board determined that a business STI multiple of one (1) was appropriate after considering NAB’s growth in cash earnings (increased by $503 million or 9.3% against 2012), return on equity (increased by 30 basis points to 14.5%) and achievement of NAB’s return on total allocated equity plan.
176
Table of Contents
The individual STI multiple can range from 0 up to 2.0 for outstanding performance and was determined by each named executive officer’s direct manager after assessing individual performance against pre-established metrics. The following key achievements were considered in determining the individual STI multiple for 2013: for Mr. Karels, achievement of Great Western Bank cash earnings and return on equity targets despite strong market competition, proactive leadership of risk management at Great Western Bank, implementation of a strong sales culture at Great Western Bank and development of a strong executive team; for Mr. Chapman, strong overall Great Western Bank financial results (including cash earnings of more than $112 million, representing a 13% increase over the prior fiscal year), leadership in driving refinements of Great Western Bank’s return on equity model to support long-term business objectives and growth targets, and successful development of a robust process for reporting to regulatory bodies; and for Mr. Ulenberg, successful management of Great Western Bank within risk appetite parameters, maintenance of a sound risk profile in connection with sustainable growth, and continued improvements in talent management and customer satisfaction.
In addition, our named executive officers were subject to a compliance gateway. Senior executives of NAB are subject to a reduction in their STI, either in part or in full depending on the severity of the breach, if they do not pass the compliance expectations of their role. No such reduction was applied to the STI awards earned by our named executive officers for 2013.
Mandatory Deferral of Earned STI Award. Under the NAB STI Plan, a portion of our named executive officers’ earned STI awards were subject to mandatory deferral to instill an appropriate focus on business performance beyond the current year, allow for alignment with risk outcomes, support achievement of targets, and encourage an appropriate level of shareholding by senior executives. For Mr. Karels, 50% of his earned STI award was deferred, and he was granted NAB deferred shares in February 2014 that will be payable in two equal installments on December 4, 2014 and December 4, 2015. For each of Messrs. Chapman and Ulenberg, 25% was deferred and they were granted NAB deferred shares in February 2014 that will be payable on December 4, 2014. Receipt of the deferred shares is contingent on meeting the compliance gateway described above in future years and certain performance conditions.
Current Employment Arrangements
Employment Agreement with Mr. Karels. We previously entered into an employment agreement with Mr. Karels, which became effective on January 16, 2014. The agreement will continue until terminated by us or Mr. Karels in accordance with its terms. During the term of the agreement, Mr. Karels will serve as our President and Chief Executive Officer. Material terms of the employment agreement include: an annual base salary of $550,000 (with any increase at our and NAB’s sole discretion); eligibility to participate in the NAB STI Plan with a target opportunity equal to 75% of base salary; and eligibility to participate in our executive long-term incentive plan.
If we terminate Mr. Karels’ employment without “cause,” he will be entitled to receive either fifty-two (52) weeks’ prior written notice or fifty-two (52) weeks of base salary in lieu of notice. “Cause” generally means failure to comply with the terms and conditions of the employment agreement (including, without limitation, a formal indictment or charge with any felonious criminal violation, or violent crimes; conviction of any crime or offense involving monies or other property, or commission of fraud or embezzlement; willful or continual neglect or failure to discharge his duties; or violation of any material law, or any other conduct, which reveals or demonstrates behavior or character traits which are reasonably considered detrimental to us).
If Mr. Karels becomes wholly disabled from continuing his duties of employment, he will be entitled to ninety (90) days of base salary and, at the conclusion of the ninety (90) days, will be terminated by us. If Mr. Karels’ employment is terminated due to death, his estate will be entitled to the compensation which would otherwise be payable to him up to the date of death.
The employment agreement also contains a confidentiality provision, which applies indefinitely, and non-competition restrictions which apply during the term of the employment agreement and for one year following Mr. Karels’ termination for any reason.
177
Table of Contents
International Assignment Arrangements with Messrs. Chapman and Ulenberg. Mr. Chapman was seconded to us from NAB during fiscal 2013 beginning in January 2013, and Mr. Ulenberg was seconded to us from Bank of New Zealand for all of fiscal 2013. Under their letter agreements, Messrs. Chapman and Ulenberg serve as our Chief Financial Officer and Chief Risk Officer, respectively. Material terms of their agreements include: an annual base salary of US$310,000 for Mr. Chapman and NZ$300,000 for Mr. Ulenberg; eligibility to participate in the NAB STI Plan with a target opportunity equal to 30%; and expatriate benefits in accordance with NAB’s international assignment policy. In addition, we increased Mr. Chapman’s annual base salary to US$320,012, effective January 1, 2014.
New Employment Arrangements
We entered into an employment agreement with Mr. Karels on September 15, 2014, and each of Messrs. Chapman and Ulenberg on September 12, 2014. Under the employment agreements, the executives will continue to serve in their current positions as President and Chief Executive Officer; Chief Financial Officer and Executive Vice President; and Chief Risk Officer and Executive Vice President, respectively. The employment agreements will become effective upon the completion of this offering, and the term of each employment agreement will be for an unspecified duration and constitutes “at will” employment. Once they become effective, these agreements will supersede the arrangements described under “—Current Employment Arrangements.”
Each employment agreement provides for, among other things: (i) an annual base salary of $715,000 for Mr. Karels, $345,000 for Mr. Chapman and $285,000 for Mr. Ulenberg (effective retroactive to the later of (A) August 1, 2014 and (B) the date that is six months prior to the completion of this offering), (ii) an annual incentive bonus with a target STI opportunity of 75% of base salary for Mr. Karels and 50% for Messrs. Chapman and Ulenberg (except that Mr. Ulenberg’s target STI opportunity for fiscal year 2014 will be 30%), with the actual amount earned ranging from 0% to 200% of target based on actual achievement against performance metrics, (iii) annual long-term incentive compensation awards with a value of $670,000 for Mr. Karels, $225,000 for Mr. Chapman and $175,000 for Mr. Ulenberg for the 2015 fiscal year, and eligibility to receive future annual long-term incentive compensation awards in form and amount determined in the sole discretion of the board of directors and (iv) participation in our employee benefit and welfare plans. The annual long-term incentive compensation awards for the 2015 fiscal year will be 50% in the form of time-based restricted stock units that vest in three equal annual installments on each of the first three anniversaries of the grant date and 50% in the form of performance-based restricted stock units that cliff vest based on performance over a three-year performance period. Each of Messrs. Chapman and Ulenberg will also receive an additional $10,000 per month for twelve months as they transition from their international assignments.
The executives will also receive a special one-time grant of performance-based restricted stock units (the “IPO Grant”) as soon as practicable following the completion of this offering with a value of $1,000,000 for Mr. Karels, $225,000 for Mr. Chapman and $175,000 for Mr. Ulenberg. The IPO Grant will cliff vest based on performance over a three-year performance period.
Upon a termination of any executive’s employment by the company without “cause” or by the executive for “good reason”, subject to a general release of claims in favor of the company, the executive will be entitled to: (i) a prorated annual incentive bonus for the year of termination based on actual performance, (ii) a severance payment equal to two times for Mr. Karels, and one times for Messrs. Chapman and Ulenberg, the sum of (A) the executive’s then-current annual base salary and (B) the executive’s then-current target annual incentive bonus, paid in 52 or 26 equal installments, respectively, in accordance with the company’s normal payroll practices, (iii) either (A) continued benefits under the company’s group healthcare, vision and dental plans through the second anniversary of termination of employment for Mr. Karels, and through the first anniversary for Messrs. Chapman and Ulenberg, or (B) a lump-sum payment (grossed up for applicable taxes) equal to 24 times for Mr. Karels, and 12 times for Messrs. Chapman and Ulenberg, the monthly COBRA cost of continued health and medical coverage and (iv) continued vesting of any outstanding equity compensation awards as if the executive had remained employed through the applicable vesting dates. In the event that the executive’s
178
Table of Contents
employment is terminated by the company without “cause” or by the executive for “good reason” within two years following a “change in control”, subject to a general release of claims in favor of the company, the executive will be entitled to the payments and benefits described above, except that (i) the severance payment will be paid in a lump sum and be equal to three times for Mr. Karels, and two times for Messrs. Chapman and Ulenberg, the sum of (A) the executive’s then-current annual base salary and (B) the executive’s then-current target annual incentive bonus, and (ii) in lieu of the benefits described in clause (iii) of the prior sentence, all executives will receive a lump-sum healthcare payment (grossed up for applicable taxes) equal to 24 times the monthly COBRA cost. In addition, the employment agreements provide that, notwithstanding anything to the contrary, the company will not be required to provide any payment or benefit that is prohibited by the Australian Corporations Act 2001 (Cth) in the absence of shareholder approval so long as NAB continues to hold shares of our common stock, or that would otherwise be a prohibited golden parachute payment within the meaning of Section 18(k) of the FDIA.
“Cause” generally means the executive’s: (i) conviction of, or plea of guilty or no contest to, any felony or any crime involving fraud, dishonesty or moral turpitude, (ii) engagement in gross misconduct that causes material financial or reputation harm to the company, (iii) repeated failure to substantially perform his duties and responsibilities to the company, (iv) material violation of any contract or agreement between the executive and the company or any written company policy or (v) disqualification or bar by any governmental or self-regulatory authority from serving in the capacity required by the executive’s job description, or loss of any governmental or self-regulatory license that is reasonably necessary for the executive to perform his duties or responsibilities.
“Good reason” generally means, in the absence of the executive’s written consent: (i) any material and adverse change in the executive’s position or authority with the company; (ii) the transfer of the executive’s primary work site to a new location that is more than 50 miles from that in effect immediately prior to such transfer; (iii) a diminution of the executive’s base salary by more than 10%, unless such diminution applies to all other senior executives or (iv) a material breach of the employment agreement by Great Western or our bank.
“Change in control” has the meaning defined in the Great Western Bancorp, Inc. 2014 Omnibus Incentive Plan. See “—2014 Omnibus Incentive Compensation Plan—Change in Control” for more information.
Each employment agreement also contains confidentiality and non-disparagement provisions, which apply indefinitely, and non-competition as well as client and employee non-solicitation provisions that apply during the term of the employment agreement and for one year following a termination of employment for any reason.
Potential Payments upon Termination or Change in Control
Other than the employment agreements described above, we do not currently have any agreements, plans or other arrangements that provide for payments upon termination or a change in control.
Savings Plans
We maintain the Great Western 401(k) Profit Sharing Plan and Trust, or the 401(k) Plan, which is a tax-qualified defined contribution savings plan, for the benefit of all eligible U.S. employees of the company (including Mr. Karels). Employee contributions, including after-tax contributions, are permitted by means of pay reduction. The 401(k) Plan also provides for discretionary employer matching contributions and discretionary employer profit sharing contributions. During fiscal 2013, the company matched 100% of employee contributions up to 2.5% of a participant’s plan compensation, and made a discretionary profit sharing contribution of 4.25% ($2,082,406) allocated proportionately to eligible participants based on their 2013 plan compensation. All employee contributions and earnings on employee contributions are at all times fully vested. Beginning with the second year of service, employer matching contributions and employer profit sharing contributions are vested at a rate of 25% per year of service and are completely vested after five years of service.
179
Table of Contents
In addition, during fiscal 2013, NAB contributed to a defined contribution superannuation fund on behalf all eligible Australian employees (including Mr. Chapman) in an amount equal to 10.0% of the employee’s 2013 base salary, up to the maximum contribution base determined by the Australian Taxation Office. All eligible New Zealand employees (including Mr. Ulenberg) participate in a New Zealand superannuation scheme, pursuant to which Bank of New Zealand provides an employer matching contribution equal to 5% of the employee’s 2013 base salary into a defined contribution retirement plan.
Pension Benefits; Nonqualified Deferred Compensation
We do not currently offer any defined pension plans or any nonqualified deferred compensation plans to our named executive officers.
Anticipated Changes to Our Compensation Program Following the Offering
In connection with this offering, we plan to adopt incentive plans, under which we will be permitted to grant a variety of equity-based and cash-based incentive awards. For more information on these plans, see “—2014 Omnibus Incentive Compensation Plan,” “—2014 Non-Employee Director Plan” and “—Executive Incentive Compensation Plan.” Following the completion of this offering, our employees, including the named executive officers, will no longer participate in NAB’s compensation programs and plans, except that any outstanding NAB equity-based awards held by our employees will continue to vest in accordance with their terms.
2014 Omnibus Incentive Compensation Plan
Our board of directors expects to adopt, and our stockholder expects to approve, the Great Western Bancorp, Inc. 2014 Omnibus Incentive Compensation Plan (the “2014 Plan”) in connection with this offering. The 2014 Plan will be effective on the date the 2014 Plan is approved by our stockholder.
The purposes of the 2014 Plan is to help us attract, retain and motivate key employees (including prospective employees) and consultants (other than non-employee directors of our company), align the interests of those individuals with the company’s shareholders and promote ownership of the company’s equity. To accomplish these purposes, the 2014 Plan provides for the grant of stock options (both stock options intended to be “incentive stock options” intended to meet the requirements under Section 422 of the Code and “non-qualified stock options” that do not meet such requirements), stock appreciation rights (“SARs”), restricted stock, restricted stock units, dividend equivalent rights, other equity-based, equity-related or cash-based awards (including performance share awards and performance units settled in cash) (collectively, “awards”). Incentive stock options may be granted only to employees; all other awards may be granted to employees and consultants. Our non-employee directors are not permitted to participate in the 2014 Plan.
Shares Subject to the 2014 Plan
A total of shares of our common stock will be reserved and available for issuance under the 2014 Plan. If an award granted under the 2014 Plan expires, is forfeited or is settled in cash, the shares of our common stock not acquired pursuant to the award will again become available for subsequent issuance under the 2014 Plan. Shares of our common stock subject to awards that are assumed, converted or substituted under the 2014 Plan as a result of our acquisition of another company will not be counted against the number of shares that may be granted under the 2014 Plan. The following types of shares under the 2014 Plan will not become available for the grant of new awards under the 2014 Plan: (i) shares withheld to satisfy any tax withholding obligation and (ii) shares tendered to, or withheld by, us to pay the exercise price of an option.
The aggregate number of shares of our common stock that may be granted to any employee during a fiscal year in the form of awards (other than stock options and SARs) that comply with Section 162(m) of the Code, may not exceed 1,000,000 shares. The maximum number of shares of our common stock that may be granted to any single individual during a fiscal year in the form of stock options may not exceed 1,000,000 shares. The maximum number of shares of our common stock that may be granted to any single individual during a fiscal year in the form of SARs may not exceed 1,000,000 shares.
180
Table of Contents
Administration of the 2014 Plan
The 2014 Plan will be administered by the compensation committee of our board of directors (the “compensation committee”). Subject to the terms of the 2014 Plan, the compensation committee will determine which employees and consultants will receive awards under the 2014 Plan, the dates of grant, the number and types of awards to be granted, the exercise or purchase price of each award, and the terms and conditions of the awards, including the period of their exercisability and vesting and the fair market value applicable to a stock award.
In addition, the compensation committee has the authority to determine whether any award may be settled in cash, shares of our common stock, other securities, or other awards or property. The compensation committee has the authority to interpret the 2014 Plan and may adopt any administrative rules, regulations, procedures and guidelines governing the 2014 Plan or any awards granted under the 2014 Plan as it deems to be appropriate. The compensation committee may also delegate any of its powers, responsibilities or duties to any person who is not a member of the compensation committee or any administrative group within the company. Our board of directors may also grant awards or administer the 2014 Plan.
Conditions on Awards
All of the awards described below are subject to the conditions, limitations, restrictions, vesting and forfeiture provisions determined by the compensation committee, in its sole discretion, subject to certain limitations provided in the 2014 Plan. Each award granted under the 2014 Plan will be evidenced by an award agreement, which will govern that award’s terms and conditions. To the extent necessary to do so, in the case of any conflict or potential inconsistency between the 2014 Plan and a provision of any award or award agreement with respect to an award, the 2014 Plan will govern.
The compensation committee may condition the vesting of or the lapsing of any applicable vesting restrictions or conditions on awards upon the attainment of performance goals, continuation of service, or any other term or conditions. If performance goals are established by the compensation committee in connection with the grant of an award, they will be based upon performance criteria which may include one or more of the following (“Performance Criteria”): measures of efficiency (including operating efficiency, productivity ratios or other similar measures); measures of achievement of expense targets, costs reductions, working capital, cash levels or general expense ratios; asset growth; earnings per share; enterprise value or value creation targets; combined net worth; debt to equity ratio; revenue sales net revenues or net sales measures; gross profit or operating profit measures (before or after taxes); investment performance; income or operating income measures (with or without investment income or income taxes, before or after risk adjustment, or other similar measures); cash flow; margin; net income (before or after taxes); earnings before interest, taxes, depreciation and/or amortization; return measures (including return on capital, total capital, tangible capital, expenses, tangible expenses, equity, revenue, assets or net assets or total shareholder return or similar measures); market share measures; measures of balance sheet achievements (including debt reductions, leverage ratios or other similar measures) and increase in the fair market value of the company’s common stock. The vesting conditions placed on any award need not be the same with respect to each grantee and the compensation committee will have the sole discretion to amend any outstanding award to accelerate or waive any or all restrictions, vesting provisions or conditions set forth in the award agreement. Any of the above criteria may be used with or without adjustment for extraordinary items or nonrecurring items and may be measured in absolute terms or relative to historic performance or the performance of other companies or an index, and to the extent permitted under Section 162(m) of the Code (taking into account any transition relief available thereunder), the compensation committee may provide for objectively determinable adjustments, modifications or amendments, as determined in accordance with GAAP, to any of the Performance Criteria for one or more of the items of gain, loss, profit or expense.
Types of Awards
The 2014 Plan provides for the grant of stock options intended to meet the requirements of “incentive stock options” under Section 422 of the Code as well as “non-qualified stock options” that do not meet such
181
Table of Contents
requirements, SARs, restricted stock, restricted stock units, dividend equivalent rights and other equity based, equity related or cash based awards (including performance based awards). Incentive stock options may be granted only to employees. All other awards may be granted to employees and consultants. Our non-employee directors are not permitted to participate in the 2014 Plan.
Stock Options
An award of a stock option gives a grantee the right to purchase a certain number of shares of our common stock during a specified term in the future, after a vesting period, at an exercise price equal to at least 100% of the fair market value of our common stock on the grant date. The term of a stock option may not exceed 10 years from the date of grant. Incentive stock options may only be granted from a plan that has been approved by our stockholders and will be exercisable in any fiscal year only to the extent that the aggregate fair market value of our common stock with respect to which the incentive stock options are exercisable for the first time does not exceed $100,000. No incentive stock option may be granted to any person who, at the time of the grant, owns or is deemed to own stock possessing more than 10% of our total combined voting power or that of any of our affiliates unless (i) the option exercise price is at least 110% of the fair market value of the stock subject to the option on the date of grant and (ii) the term of the incentive stock option does not exceed five years from the date of grant. The exercise price of any stock option may be paid using (i) cash, check or certified bank check, (ii) shares of our common stock, (iii) a net exercise of the stock option, (iv) other legal consideration approved by the company and permitted by applicable law and (v) any combination of the foregoing.
Stock Appreciation Rights
A SAR entitles the grantee to receive an amount equal to the difference between the fair market value of our common stock on the exercise date and the exercise price of the SAR (which may not be less than 100% of the fair market value of a share of our common stock on the grant date), multiplied by the number of shares subject to the SAR. The term of a SAR may not exceed 10 years from the date of grant. Payment to a grantee upon the exercise of a SAR may be either in cash or shares of our common stock as determined by the compensation committee.
Restricted Stock
A restricted stock award is an award of outstanding shares of our common stock that does not vest until a specified period of time has elapsed, or other vesting conditions have been satisfied as determined by the compensation committee, and which will be forfeited if the conditions to vesting are not met. The compensation committee will issue a certificate in respect to the shares of restricted stock, registered in the name of the grantee, and the company may hold the certificate until the restrictions upon the award have lapsed. During the period that any restrictions apply, the transfer of stock awards is generally prohibited. Grantees have full voting rights with respect to their restricted shares. All dividend payments will be retained by the company for the account of the relevant grantee during the vesting period. Such dividend payments will revert back to the company if the restricted share upon which such dividends were paid reverts back to the company. Upon vesting of the restricted share, any dividend payments will be paid to the grantee (without interest).
Restricted Stock Units
A restricted stock unit is an unfunded and unsecured obligation to issue a share of common stock (or an equivalent cash amount) to the grantee in the future. Restricted stock units become payable on terms and conditions determined by the compensation committee and will be settled either in cash or shares of our common stock as determined by the compensation committee.
Dividend Equivalent Rights
Dividend equivalent rights entitle the grantee to receive amounts equal to all or any of the ordinary cash dividends that are paid on the shares underlying a grant while the grant is outstanding. Dividend equivalent rights
182
Table of Contents
may be paid in cash, in shares of our common stock or in another form. The compensation committee will determine whether dividend equivalent rights will be conditioned upon the vesting or payment of the grant to which they relate and the other terms and conditions of the grant.
Other Stock-Based or Cash-Based Awards
Under the 2014 Plan, the compensation committee may grant other types of equity-based, equity-related or cash-based awards subject to such terms and conditions that the compensation committee may determine. Such awards may include the grant or offer for sale of unrestricted shares of our common stock, performance share awards, and performance units settled in cash.
Performance-Based Awards
At the discretion of the compensation committee, other stock-based or cash-based awards may be granted in a manner which is intended to be deductible by the company under Section 162(m) of the Code (taking into account any transition relief available thereunder). In such event, the performance-based award will be determined based on the attainment of written objective performance goals based on one or more of the Performance Criteria, and may be measured in absolute terms or relative to historic performance or the performance of other companies or an index. The performance goal(s) must be approved by the compensation committee for a performance period established by the compensation committee (i) while the outcome for that performance period is substantially uncertain and (ii) no more than 90 days after the commencement of the performance period to which the performance goal relates or, if the performance period is less than one year, the number of days which is equal to 25% of the relevant performance period. When setting performance goals, the compensation committee will also prescribe a formula to determine the amount of the performance-based award that may be payable upon the level of attainment of the performance goals during the performance period. Following the completion of each performance period, the compensation committee will have the sole discretion to determine whether the applicable performance goals have been met with respect to each individual, and if they have, will certify the amount of the applicable performance-based award.
Adjustments
In connection with a recapitalization, stock split, reverse stock split, stock dividend, spinoff, split up, combination, reclassification or exchange of shares, merger, consolidation, rights offering, separation, reorganization or liquidation, or any other change in the corporate structure or shares, including any extraordinary dividend or extraordinary distribution, the compensation committee will make adjustments as it deems appropriate in (i) the maximum number of shares of our common stock reserved for issuance as grants, (ii) the maximum number of stock options and SARs that any individual participating in the 2014 Plan may be granted in any fiscal year, (iii) the number and kind of shares covered by outstanding grants, (iv) the kind of shares that may be issued under the 2014 Plan and (v) the terms of any outstanding stock awards, including exercise or strike price, if applicable.
Amendment; Termination
Our board of directors or the compensation committee may amend or terminate the 2014 Plan at any time, provided that no such amendment may materially adversely impair the rights of a grantee of an award without the grantee’s consent. Our stockholders must approve any amendment if their approval is required in order to comply with the Code, applicable laws, or applicable stock exchange requirements. Unless terminated sooner by our board of directors or extended with stockholder approval, the 2014 Plan will terminate on the day immediately preceding the tenth anniversary of the date on which our stockholder approved the 2014 Plan, but any outstanding award will remain in effect until the underlying shares are delivered or the award lapses.
Change in Control
Unless the compensation committee determines otherwise, or as otherwise provided in the applicable award agreement, if a participant’s employment is terminated by us without “cause” (as defined in the 2014 Plan) or the
183
Table of Contents
participant resigns his or her employment for “good reason” (as defined in the 2014 Plan), in either case, on or within two years after a “change in control” (as defined in the 2014 Plan), (i) all outstanding awards will become fully vested (including lapsing of all restrictions and conditions), and, as applicable, exercisable, (ii) any outstanding performance-based awards will be deemed earned at target level with respect to all open performance periods and (iii) any shares deliverable pursuant to restricted stock units will be delivered promptly following the termination. In the event of a change in control, the compensation committee may also (i) provide for the assumption of or the issuance of substitute awards, (ii) provide that for a period of at least 20 days prior to the change in control, stock options or SARs that would not otherwise become exercisable prior to a change in control will be exercisable as to all shares of common stock, as the case may be, subject thereto and that any stock options or SARs not exercised prior to the consummation of the change in control will terminate and be of no further force or effect as of the consummation of the change in control, (iii) modify the terms of such awards to add events or conditions (including the termination of employment within a specified period after a change in control) upon which the vesting of such awards will accelerate, (iv) deem any performance conditions satisfied at target, maximum or actual performance through closing or provide for the performance conditions to continue (as is or as adjusted by the compensation committee) after closing or (v) settle awards for an amount (as determined in the sole discretion of the compensation committee) of cash or securities (in the case of stock options and SARs that are settled in cash, the amount paid will be equal to the in-the-money spread value, if any, of such awards).
In general terms, except in connection with any initial public offering, a change in control under the 2014 Plan occurs if following the completion of this offering:
| • | following the earlier to occur of (A) the Non-Control Date and (B) the date on which NAB owns less than 5% of our outstanding common stock, during any period of not more than 36 months, individuals who constitute the board of directors as of the beginning of the period whose appointment or election is endorsed by two-thirds of the incumbent directors no longer constitute a majority of the board; |
| • | a person, other than NAB or any of its direct or indirect subsidiaries or a transferee thereof or any of such transferee’s affiliates, becomes a beneficial owner of our capital stock representing 30% of the voting power of our outstanding capital stock; |
| • | we merge into another entity, unless (i) the business combination is with NAB or any of its direct or indirect subsidiaries or a transferee thereof or any of such transferee’s affiliates or (ii) (a) more than 50% of the combined voting power of the merged entity or its parent is represented by our voting securities that were outstanding immediately prior to the merger, (b) the board of directors prior to the merger constitutes at least 50% of the board of the merged entity or its parent following the merger and (c) no person is or becomes the beneficial owner of 30% or more of the combined voting power of the outstanding capital stock eligible to elect directors of the merged entity or its parent; |
| • | we sell or dispose of all or substantially all of our assets (other than to NAB or any of its direct or indirect subsidiaries or a transferee thereof and such transferee’s affiliates or a company affiliate); or |
| • | we are liquidated or dissolved. |
Clawback
All awards under the 2014 Plan will be subject to any clawback or recapture policy that we may adopt from time to time.
2014 Non-Employee Director Plan
Our board of directors expects to adopt, and our stockholder expects to approve, the Great Western Bancorp, Inc. 2014 Non-Employee Director Plan (the “2014 Director Plan”) in connection with this offering. The 2014 Director Plan will be effective on the date the 2014 Director Plan is approved by our stockholder.
The description of the 2014 Director Plan is the same as the description for the 2014 Plan, except for the following key differences: (i) a total of shares of our common stock will be reserved and available for
184
Table of Contents
issuance under the 2014 Director Plan; (ii) the aggregate awards that may be granted to any single non-employee director during a fiscal year, solely with respect to his or her service as a director of the board, may not exceed $1,000,000; (iii) there is no separate limit on the number of shares of our common stock that may be granted to any single individual during a fiscal year in the form of stock options or SARs; (iv) our non-employee directors are the only permitted grantees in the 2014 Director Plan; (v) incentive stock options may not be granted to non-employee directors; and (vi) unless the compensation committee determines otherwise, in the event of a change in control, all outstanding awards will become fully vested (including lapsing of all restrictions and conditions) and, as applicable, exercisable.
Executive Incentive Compensation Plan
Our board of directors expects to adopt, and our stockholder expects to approve, the Great Western Bancorp, Inc. Executive Incentive Compensation Plan (the “Bonus Plan”) in connection with this offering. The Bonus Plan will be effective on the date the Bonus Plan is approved by our stockholder.
The purposes of the Bonus Plan are to help us attract, retain and motivate participating eligible executives by providing incentive awards that ensure a strong pay-for-performance linkage, and to permit the incentive awards to qualify as performance-based compensation under Section 162(m) of the Code (taking into account any transition relief available thereunder). To accomplish these purposes, the Bonus Plan provides for the grant of cash-based or equity-based awards (collectively, “awards”) to any employee who, in the discretion of the compensation committee, is likely to be a “covered employee” under 162(m) of the Code for the year in which an award is payable and any other executives selected by the compensation committee for participation in the Bonus Plan.
Administration of the Bonus Plan
The Bonus Plan will be administered by the compensation committee. Subject to the terms of the Bonus Plan, the compensation committee will select the persons to be granted awards under the Bonus Plan, determine the time when awards will be granted, determine whether objectives and conditions for earning awards have been met, determine whether awards will be paid at the end of the performance period or deferred, and determine whether an award should be reduced or eliminated. In addition, the compensation committee will interpret the Bonus Plan and may adopt written policies or rules as it deems necessary or desirable for the implementation and administration of the Bonus Plan. The compensation committee generally may delegate its powers, responsibilities or duties to employees of the Company as it deems necessary or appropriate.
Types of Awards
Awards may be paid in cash or in the form of equity-based awards. Awards that are granted and denominated in cash may be paid under the Bonus Plan, the 2014 Plan or any other plan maintained by the Company, and awards that are granted in the form of equity-based awards will be issued pursuant to the 2014 Plan or any other plan maintained by the Company for equity-based awards at the time of grant.
Award Limitations
No participant may receive with respect to any fiscal year an award under the Bonus Plan of more than $5,000,000 or more than 1,000,000 shares. In the event the performance period for an award is more than one fiscal year, then for purposes of these limits, the award amount will be proportionately spread across the actual performance period (provided that for this purpose, the award amount may not be spread across more than four years).
Performance-Based Awards
In connection with the grant of each award under the Bonus Plan, the compensation committee will (i) establish the performance goal(s) and the performance period applicable to such award, (ii) establish the formula for determining the amounts payable based on achievement of the applicable performance goal(s), (iii) determine
185
Table of Contents
the consequences of the participant’s termination of employment or demotion or promotion during the performance period and (iv) establish such other terms and conditions for the award as the compensation committee deems appropriate. Performance goals will be based on one or more of the Performance Criteria, and may be measured in absolute terms or relative to historic performance or the performance of other companies or an index.
The foregoing will be accomplished (i) while the outcome for the performance period is substantially uncertain and (ii) no more than 90 days after the commencement of the performance period to which the performance goal relates or, if the performance period is less than one year, the number of days which is equal to 25% of the relevant performance period. Following the completion of each performance period, the compensation committee will certify in writing the degree to which the applicable performance goals have been met with respect to each participant. The award for each participant will be determined by applying the applicable formula for the performance period based upon the level of achievement of the performance goals. The compensation committee may, in its sole discretion, reduce or eliminate (but not increase) any award payable to any participant for any reason, including without limitation to reflect individual or business performance and/or unanticipated or subjective factors.
Amendment; Termination
In general, the compensation committee may amend the Bonus Plan at any time, except that no amendment may be effective without the approval of our shareholders if such approval is necessary to comply with the exemption for performance-based compensation from the limitation on deductibility imposed by Section 162(m) of the Code. The Bonus Plan will continue to be in effect until terminated by the compensation committee.
Clawback
All awards under the Bonus Plan will be subject to any clawback or recapture policy that we may adopt from time to time.
Director Compensation
Our directors were not compensated for their services on our board during fiscal 2013. In connection with this offering, we have adopted a directors’ compensation program that provides the following compensation for independent non-employee members of our board:
| • | an annual cash retainer of $30,000; |
| • | an annual equity award with a value of $40,000 in the form of immediately vested restricted stock units; |
| • | an additional annual cash retainer of $12,000 for the chair of the audit committee; |
| • | an additional annual cash retainer of $10,000 for the chair of the compensation committee; |
| • | an additional annual cash retainer of $6,000 for each of the chairs of the corporate governance and nominating committee and risk committee; and |
| • | an additional annual membership fee of $6,000 for each member of the audit committee and/or compensation committee, and of $3,000 for each member of the corporate governance and nominating committee and/or risk committee. |
Directors who are employees of us or any of our affiliate companies (including NAB) will receive no compensation for their services as directors of our board. We also expect to reimburse all directors for reasonable out-of-pocket expenses incurred in connection with the performance of their duties as directors, including without limitation travel expenses in connection with their attendance in-person at board and committee meetings. Additional details will be disclosed as the terms of our new director compensation program are finalized. We reserve the right to change the manner and amount of compensation to our non-employee directors at any time.
186
Table of Contents
PRINCIPAL AND SELLING STOCKHOLDER
Prior to the completion of this offering, all shares of our common stock were owned by the NAB selling stockholder, an indirect subsidiary of NAB. Upon completion of this offering, we will have shares of common stock issued and outstanding, of which NAB (through the NAB selling stockholder) will indirectly beneficially own approximately % (or % assuming the underwriters exercise their option to purchase additional shares of our common stock from the NAB selling stockholder in full).
The following table sets forth information, as of the date of this prospectus, regarding the beneficial ownership of our common stock, immediately prior to the consummation of this offering and as adjusted to reflect the sale of common stock in this offering by the NAB selling stockholder, by:
| • | all persons known by us to own beneficially more than 5% of our outstanding common stock; |
| • | the selling stockholder; |
| • | each of our named executive officers; |
| • | each of our directors and director nominees; and |
| • | all of our directors, director nominees and executive officers as a group. |
Beneficial ownership is determined in accordance with the rules of the SEC. These rules generally attribute beneficial ownership of securities to persons who possess sole or shared voting power or investment power with respect to such securities. Except as otherwise indicated, all persons listed below have sole voting and investment power with respect to the shares beneficially owned by them, subject to applicable community property laws. Except as otherwise indicated, the address for each stockholder listed below is c/o Great Western Bancorp, Inc., 100 N. Phillips Ave, Sioux Falls, South Dakota 57104.
| Beneficial Ownership Prior to the Completion of this Offering |
Number of Shares to be Sold in this Offering |
Beneficial Ownership After the Completion of this Offering | ||||||||||||||
| Name and Address of Beneficial Owner |
Number | Percentage | Number | Percentage | ||||||||||||
| NAB(1) |
100 | % | ||||||||||||||
| Directors and Named Executive Officers |
||||||||||||||||
| Ken Karels |
— | — | — | |||||||||||||
| Peter Chapman |
— | — | — | |||||||||||||
| Richard Rauchenberger |
— | — | — | |||||||||||||
| Stephen Ulenberg |
— | — | — | |||||||||||||
| Directors, director nominees and executive officers as a group (7 persons) |
— | — | — | |||||||||||||
| (1) | NAB, as the ultimate parent of the NAB selling stockholder, beneficially owns all shares of our common stock owned of record by the NAB selling stockholder. NAB’s investment decisions are made by its board of directors. NAB is a public company with shares listed on the Australian Securities Exchange. The address of NAB and the NAB selling stockholder is 245 Park Avenue, New York, New York 10167. |
187
Table of Contents
OUR RELATIONSHIP WITH NAB AND CERTAIN OTHER RELATED PARTY TRANSACTIONS
Relationship with NAB
We are a wholly owned subsidiary of NAB, and our results have been part of NAB’s consolidated business operations since NAB acquired us in 2008. NAB is a large financial institution incorporated in Australia and listed on the Australian Securities Exchange with operations in Australia, New Zealand, the United Kingdom, the United States and parts of Asia. Prior to this offering, our business represented NAB’s retail banking operations in the United States. Consistent with its strategy of focusing on its core Australian and New Zealand franchises, this offering represents the first stage of NAB’s planned divestment of our business. Following the offering, we expect that NAB will continue to beneficially own a majority of our outstanding common stock, and as a result NAB will continue to have significant control of our business, including pursuant to the agreements described below. See “Risk Factors—Risks Related to Our Controlling Stockholder.” In addition, we expect that, following this offering, NAB will continue to consolidate our financial results in its financial statements.
Historically, NAB and its affiliates have provided financial and administrative support to us and have engaged in business transactions with us. Among other transactions, we and NAI have each borrowed from NAB from time to time including through a revolving credit agreement and certain subordinated capital notes. We have also purchased securities from NAB in its role as dealer, and certain of our employees have been NAB employees or compensated in part with NAB securities. In addition, NAB London Branch has acted and continues to act as a counterparty for all our interest rate swaps. For more information on these and other transactions with NAB, see “—Transitional Services Agreement—Interest Rate Swaps” and “—Related Party Transactions with NAB.”
Further, in connection with this offering, we and NAB intend to enter into certain agreements that will provide a framework for our ongoing relationship, including a Stockholder Agreement governing NAB’s rights as a stockholder, a Transitional Services Agreement pursuant to which NAB will continue to provide us with certain services for a transition period, and a Registration Rights Agreement requiring that we register shares of our common stock beneficially owned by NAB under certain circumstances.
Forms of the agreements summarized below have been filed as exhibits to the registration statement of which this prospectus forms a part. The summaries of these agreements are qualified in their entirety by reference to the full text of the agreements.
Stockholder Agreement
We intend to enter into a Stockholder Agreement with NAB prior to the completion of this offering, which we refer to in this prospectus as the “Stockholder Agreement.” The Stockholder Agreement will govern the relationship between NAB and us following this offering, including matters related to our corporate governance and NAB’s right to approve certain actions we might desire to take in the future.
Corporate Governance. Until such time as NAB ceases to control us for purposes of the BHC Act as provided for in a written determination from the Federal Reserve to NAB or as provided for in a written notice by NAB to the Company to such effect, which we refer to in this prospectus as the “Non-Control Date,” NAB will be entitled to designate individuals for nomination and election to our board of directors, each, a NAB Director. The number of designees will depend on the level of NAB’s beneficial ownership of our outstanding common and non-voting common stock. Prior to the earlier of the Non-Control Date and the one-year anniversary of the first date when NAB ceases to directly or indirectly beneficially own at least 50% of our outstanding common stock, which date of share ownership cessation we refer to in this prospectus as the “Less Than Majority Holder Date,” we and NAB will together use our best efforts to ensure that a majority of our board of directors consists of NAB Directors.
188
Table of Contents
From and after the one-year anniversary of the Less Than Majority Holder Date, our board of directors will be required to consist of a majority of independent directors, consistent with NYSE listing standards. From and after the one-year anniversary of the Less Than Majority Holder Date, if the Non-Control Date has not occurred, NAB will have the right to designate for nomination and election a number of individuals equal to the number of independent directors nominated to serve on our board of directors (other than any independent directors who are NAB Directors) minus two. Our President and Chief Executive Officer will also serve as a member of our board of directors at all times following the completion of this offering until the Non-Control Date. As a result, from and after the Less Than Majority Holder Date if the Non-Control Date has not occurred, our board of directors will consist of a majority of independent directors (other than any independent directors who are NAB Directors), our President and Chief Executive Officer and the NAB Directors.
NAB will also be entitled to have its designees to our board of directors serve on the audit committee, corporate governance and nominating committee, compensation committee, risk committee and executive committee of our board of directors under certain circumstances. The composition of these committees will be as follows:
| • | until the Non-Control Date, if any of the NAB Directors satisfies the applicable independence requirements established by the SEC and the NYSE, at least one member of the audit committee will be an independent NAB Director designated by NAB; |
| • | until the Less Than Majority Holder Date, at least one member of each of the compensation committee and corporate governance and nominating committee will be a NAB Director designated by NAB. After the Less Than Majority Holder Date, the compensation and corporate governance and nominating committees will transition in accordance with NYSE rules to being comprised solely of directors satisfying the applicable independence requirements established by the SEC and the NYSE. Following this transition and until the Non-Control Date, if any of the NAB Directors satisfies the applicable independence requirements established by the SEC and the NYSE, at least one member of each of the compensation and corporate governance and nominating committees will be an independent NAB Director designated by NAB; |
| • | until the one-year anniversary of the Less Than Majority Holder Date, at least one member of the risk committee will be a NAB Director designated by NAB; and |
| • | until the one-year anniversary of the Less Than Majority Holder Date, two members of the executive committee will be NAB directors designated by NAB, one of whom will be designated and treated as an alternate. |
In addition, until the one-year anniversary of the Less Than Majority Holder Date, any act of the executive committee of our board of directors must include the consent of the acting NAB Director serving on the executive committee.
Until the one-year anniversary of the Less Than Majority Holder Date, and subject to any applicable laws or regulations, NAB will have the right to appoint up to two directors to serve on the board of directors of our bank subsidiary. The Stockholder Agreement will prohibit NAB from appointing more than 25% of the members of our bank subsidiary. Until the Non-Control Date, we will not, nor will we cause our bank subsidiary to, reduce the size of the board of directors of our bank subsidiary to fewer than eight members without the prior consent to NAB. Any NAB Director will be entitled to attend any meeting of the board of our bank subsidiary as a non-voting observer.
Following the Non-Control Date, NAB will have the right to designate one nominee for election to our board of directors as long as NAB continues to beneficially own at least 5% of our outstanding common stock and non-voting common stock. NAB has informed us that it currently intends to seek a non-control determination from the Federal Reserve with respect to NAB’s ownership interest in us at such time as it believes there is a reasonable opportunity to obtain such a non-control determination and the benefits of such a non-control determination to NAB outweigh the loss of the governance and consent rights described in this section. We and
189
Table of Contents
NAB believe that NAB will not have a reasonable opportunity to seek such a determination until NAB owns less than 25% of our outstanding common stock, although NAB’s ownership interest may need to be substantially less than 25% in order for NAB to obtain a non-control determination. In connection with obtaining any non-control determination, NAB may, in its sole discretion, agree to enter into passivity commitments with the Federal Reserve or irrevocably waive any or all of its rights discussed herein.
Stockholder Approval Rights. Until the Non-Control Date, we may not (either directly or indirectly through a subsidiary, or through one or a series of related transactions) take any of the following actions without NAB’s prior written consent:
| • | merge, consolidate or engage in any similar transaction (or any amendment to our termination of an agreement to enter into such a transaction), other than any merger, consolidation or similar transaction involving only us and one or more of our wholly owned subsidiaries; |
| • | acquire or dispose of securities, assets or liabilities involving an equity value greater than $5 million or an asset value greater than $5 million, subject to certain exceptions; |
| • | increase or decrease our authorized capital stock, or create a new class or series of our capital stock (including any class or series of preferred stock); |
| • | issue capital stock or acquire capital stock issued by us or any of our subsidiaries, subject to certain exceptions; |
| • | issue or acquire any debt security issued by us or any of our subsidiaries, in each case involving an aggregate principal amount exceeding $10 million; |
| • | incur or guaranty any debt obligation having a principal amount exceeding $5 million, other than debt obligations incurred and guaranty or similar undertakings given by our bank in the ordinary course; |
| • | enter into or terminate any joint venture arrangements involving assets having a value exceeding $5 million; |
| • | list or delist any of our capital stock then listed on a national securities exchange; |
| • | amend (or approve or recommend the amendment of) our or any of our subsidiaries’ constituent documents (i.e., certificate of incorporation and bylaws); |
| • | materially change the scope of our business as conducted immediately prior to the completion of this offering; |
| • | change our independent public accountants, except as required by applicable law or listing standards; |
| • | other than as required by applicable law, form, or delegate authority to, any new committee of our board of directors, or any subcommittee thereof, of our board of directors, or delegate authority to any existing committee or subcommittee thereof not set forth in the committee’s charter immediately prior to the completion of this offering; |
| • | enter into, terminate or make any material amendment to any material contract other than, in each case, (i) any employment agreement or (ii) any contract involving neither aggregate payments of $3 million or more nor aggregate annual payments of $1 million or more; |
| • | change our legal or ownership structure, or the legal or ownership structure of any of our subsidiaries; |
| • | settle any material litigation or proceeding (whether formal or informal) involving us or any of our subsidiaries; |
| • | change any material policy relating to loans or other risk appetite settings, investments, asset-liability management or derivatives or any other policy that could reasonably be deemed to have a material effect on our consolidated results of operations or financial condition; |
| • | enter into any material written agreement with, or any material written commitment to, a regulatory agency, or any material enforcement action; |
190
Table of Contents
| • | elect, hire or dismiss (other than a dismissal for cause) our or our bank’s Chief Executive Officer or Chief Financial Officer; |
| • | make any bankruptcy filing, petition or similar action, by or with respect to us or any of our subsidiaries, or take actions to affect our dissolution or winding-up; |
| • | increase or decrease the size of our board of directors, other than as contemplated in the Stockholder Agreement; or |
| • | enter into any agreement or commitment providing for any of the foregoing. |
Information Rights. As long as NAB is required under applicable accounting standards to consolidate our financial statements with theirs, and in any case for all financial periods commencing before the earlier of the Non-Control Date and the one-year anniversary of the Less Than Majority Holder Date, we will be required to provide to NAB information and data relating to our business and financial results, including access to our personnel, data and systems, in the same manner and to the same extent as we provided immediately prior to this offering. In addition, during this period, we and our subsidiaries will be required to maintain accounting principles, systems and reporting formats that are consistent with NAB’s financial accounting practices in effect as of the completion of this offering, and in good faith to consider any changes to such principles, systems or reporting formats requested by NAB. Furthermore, the Stockholder Agreement will require us during this time to maintain appropriate disclosure controls and procedures and internal control over financial reporting, and to provide quarterly certifications from our relevant officers and employees regarding such matters in accordance with NAB’s internal standards, and to inform NAB promptly of any events or developments that might reasonably be expected to materially affect our financial results. After NAB is no longer required to consolidate our financial statements with theirs, we must continue to provide NAB with certain information and data relating to our business and financial results, including access to our personnel, data and systems, to the extent required by NAB to meet its legal, financial or regulatory obligations or requirements (as determined by NAB in its reasonable judgment) for as long as NAB is required under applicable accounting standards to account for its investment in us under the equity accounting method.
The Stockholder Agreement will also provide that, until the Non-Control Date, NAB will have certain access and cooperation rights with respect to the independent public registered accounting firm responsible for the audit of our financial statements and to our internal audit function. We will be required, upon reasonable notice, to authorize our independent auditor to make available to NAB’s independent auditor both the personnel responsible for conducting our quarterly reviews and annual audit and work papers related to the quarterly review or annual audit, in all cases within a reasonable time after our independent auditor’s opinion date.
The Stockholder Agreement will also provide that, until the Non-Control Date, we shall consult and coordinate with NAB with respect to public disclosures and filings, including in connection with our quarterly and annual financial results. Among other requirements, we will, to the extent practicable, provide NAB with a copy of any public release at least two business days prior to publication and consider in good faith incorporating any comments provided by NAB. The Stockholder Agreement will also provide that, until the Non-Control Date, NAB will consult and coordinate with us with respect to public disclosures and filings containing material information relating to our business. Among other requirements, NAB will, to the extent practicable, provide us with a copy of any public release of material information relating to our business at least two business days prior to publication and consider in good faith incorporating any comments provided by us reasonably in advance of publication.
In addition, for a period of ten years following the Non-Control Date, subject to an extension of up to five years upon the demonstration of a legal, tax or regulatory requirement for such extension, we and NAB will have mutual rights with respect to any information and access each may require in connection with regulatory or supervisory reporting obligations or inquiries. The Stockholder Agreement will permit us to restrict access to the types of information described in this paragraph to that subset of NAB employees who NAB reasonably determines have a need to access such information.
191
Table of Contents
Share Exchange. At NAB’s option, we will be required to exchange some or all of the outstanding common stock beneficially owned by NAB for an equal number of shares of our non-voting common stock. See “Description of Capital Stock—Common Stock and Non-Voting Common Stock” for a description of the rights and preferences associated with our non-voting common stock.
Directors and Officer Indemnification and Insurance. Until at least the last day on which a NAB director, officer or employee, or a person designated by NAB to be a member of our board of directors, is our employee or officer, or a member of our board of directors, we will indemnify each such officer, employee or director indemnification to the greatest extent permitted by Section 145 of the Delaware General Corporation Law and other applicable law. This indemnification will be available irrespective of any change to our indemnification or advancement policies. In addition, under the Stockholder Agreement, we will commit to providing NAB directors, officers or employees serving as our officers or employees or as members of our board with agreed insurance coverage with respect to director and officer liability, fiduciary liability and liability under U.S. federal and state securities laws.
Indemnification. Each party to the Stockholder Agreement will indemnify the other and the other’s subsidiaries for breaches of the Stockholder Agreement. NAB will also indemnify us for certain liabilities relating to historical matters pre-dating NAI’s merger as part of the Formation Transactions.
Non-Competition. Until the two-year anniversary of the earlier of the Non-Control Date and the one-year anniversary of the Less Than Majority Holder Date, neither NAB nor any of its subsidiaries will be permitted to:
| • | control, for purposes of the BHC Act, a bank or insured institution with a main office or one or more branches in any of our states; or |
| • | own, manage or operate, or participate in the ownership, management or operation of, any business principally engaged in consumer lending to individuals or in lending to businesses in our states with total annual revenues of less than $250 million. |
These restrictions are subject to certain exceptions and will not apply to any business or activity conducted by NAB New York Branch during the fire years preceding the date of the Stockholder Agreement.
Non-Solicitation. Neither NAB nor any of its subsidiaries will be permitted to solicit for employment or hire any of our officers or employees or any officer or employee of our subsidiaries. This restriction will remain in effect until the second anniversary of the earlier of the Non-Control Date and the one-year anniversary of the Less Than Majority Holder Date and is subject to certain customary exceptions, including exceptions for general solicitations, persons no longer employed by us or our subsidiaries and persons that approach NAB and its subsidiaries on an unsolicited basis.
Other Provisions. The Stockholder Agreement will also contain covenants and provisions with respect to:
| • | confidentiality of our and NAB’s information, subject to certain exceptions permitting our directors to share information with NAB and APRA; |
| • | restrictions on our ability to take any actions that would cause NAB or any of its subsidiaries to violate any applicable law or regulation; and |
| • | our obligation to consult with NAB prior to issuing any internal communications which could reasonably be expected to be material either to NAB or to NAB’s control of us for purposes of the BHC Act. |
Each of the covenants, obligations and other agreements contained in the Stockholder Agreement will have no further effect after such covenants, obligations and other agreements are fully performed or satisfied in accordance with their terms, or are no longer required to be performed or satisfied.
192
Table of Contents
As a result of the Stockholder Agreement, NAB will have significant control over us following the completion of this offering. See “Risk Factors—Risks Related to our Controlling Stockholder—NAB will continue to have significant control over us following the completion of this offering, and its interests may conflict with ours or yours in the future.”
Registration Rights Agreement
We intend to enter into a Registration Rights Agreement with NAB prior to the completion of this offering, which we refer to in this prospectus as the “Registration Rights Agreement.” Pursuant to the Registration Rights Agreement, upon NAB’s request, we will use our reasonable best efforts to file a registration statement for, and effect the registration under applicable federal and state securities laws of, any shares of our common stock beneficially owned by NAB or its wholly owned subsidiaries following this offering. The rights of NAB and its majority-owned subsidiaries under the Registration Rights Agreement will remain in effect with respect to all shares covered by the agreement until those shares are sold pursuant to an effective registration statement under the Securities Act, sold pursuant to Rule 144 of the Securities Act to someone other than NAB or its wholly owned subsidiaries, transferred in a transaction where subsequent public distribution of the shares would not require registration under the Securities Act or no longer outstanding.
Demand Registration. NAB will be able to request registration under the Securities Act of all or any portion of our shares covered by the agreement and we will be obligated, subject to limited exceptions, to use reasonable best efforts to register such shares as requested by NAB. NAB will be able to request that we complete five demand registrations while the agreement is in effect subject to limitations on, among other things, minimum offering size. NAB will be able to designate the terms of each offering effected pursuant to a demand registration, subject to market “cut-back” exceptions regarding the size of the offering.
Subject to certain exceptions, we may delay the filing of a registration statement after a demand request has been made if at the time of such request our board of directors determines that such registration or offering would materially interfere with or jeopardize any pending or proposed material transaction or would materially adversely affect us.
Piggyback Registration. Prior to the Non-Control Date, we may only register common stock for our own account in limited circumstances. If we, at any time after the Non-Control Date, intend to file on our behalf or on behalf of any of our other security holders a registration statement in connection with a public offering of any of our securities on a form and in a manner that would permit the registration for the offer and sale of our common stock held by NAB, NAB will have the right to include its shares of our common stock in that offering if we continue to pursue it. NAB’s ability to participate in any such offering will be subject to market “cut-back” exceptions.
S-3 Registration. When we are eligible to use a registration statement on Form S-3 under the Securities Act, or a Form S-3, NAB will be able to request such registration and we will be obligated, subject to limited exceptions, to use reasonable best efforts to file the Form S-3 and cause it to become effective. NAB will be able to request that we complete three S-3 registrations while the agreement is in effect subject to limitations on, among other things, minimum offering size. NAB will be able to sell shares of our common stock that it beneficially owns upon not less than three business days’ prior notice to us, subject to market “cut-back” exceptions regarding the size of the offering.
Subject to certain exceptions, we may delay the filing of a registration statement after an S-3 registration request has been made in the same circumstances as we may do so for demand registrations.
Registration Procedures Expenses. We will be generally responsible for all registration expenses, including expenses incurred by NAB, in connection with the registration, offer and sale of securities under the Registration Rights Agreement. NAB will be responsible for any applicable underwriting discounts or commissions. The Registration Rights Agreement will set forth customary registration procedures, including an agreement by us to
193
Table of Contents
make our management available for road show presentations in connection with any underwritten offerings. We will also agree to indemnify NAB and its permitted transferees with respect to liabilities resulting from untrue statements or omissions in any registration statement used in any such registration, other than untrue statements or omissions resulting from information furnished to us for use in the registration statement by NAB or wholly owned subsidiaries of NAB.
Transitional Services Agreement
We intend to enter into a Transitional Services Agreement with NAB prior to the completion of this offering, which we refer to in this prospectus as the “Transitional Services Agreement.” The Transitional Services Agreement will govern the continued provision of certain services to us by NAB for the applicable transition period, including the provision of the following services:
| • | access to computer databases and risk modeling applications and simulations that we deploy as part of our risk management framework; |
| • | continuing to act as counterparty to us on any interest rate swaps we may desire to obtain for purposes of hedging our loan portfolio; |
| • | daily and month-end fair value calculations for use in our month-end accounting of certain of our loans and interest rate swaps; |
| • | access to systems and applications used to report financial information and risk positions to NAB for consolidation in NAB’s overall financial results and risk management processes; |
| • | certain risk, credit rating and tax oversight currently provided to us by NAB New York Branch through its systems; |
| • | certain insurance coverage for us and our operations under NAB’s group-wide insurance policies; and |
| • | access to a specialized data circuit used for our computer systems. |
We do not intend to enter into transitional arrangements with NAB regarding other matters such as external financial reporting, external communications or investor relations services, which we will source internally or through third party service providers. In addition, we generally expect to hire personnel or contract with third party vendors to provide the services NAB will provide under the Transitional Services Agreement prior to the expiration of the applicable transition period.
Interest Rate Swaps. NAB London Branch currently acts as counterparty for all our interest rate swaps. As of June 30, 2014, the total notional amount of swaps outstanding was approximately $946.8 million. Based upon a periodic review we have undertaken in consultation with a third party alternative pricing source, we believe these swaps were entered into on commercially reasonable terms that could have been negotiated with an independent third party. During fiscal year 2013, we entered into new lending relationships with our customers that generated approximately $2.8 million in revenue related to our interest rate swaps, of which approximately $0.8 million was paid to us by NAB London Branch under the terms of our revenue sharing relationship with NAB London Branch. Following the completion of this offering, we plan to continue to hold our existing interest rate swap portfolio to maturity with NAB London Branch continuing to serve as counterparty. As of June 30, 2014, the average remaining duration on our interest rate swaps with NAB London Branch was 6.3 years.
The Transitional Services Agreement will provide that from the completion of this offering until the Less Than Majority Holder Date, NAB London Branch will continue to act as counterparty on any interest rate swaps we may desire to obtain consistent with past practice, on terms set in a manner consistent with past practice and based on then-prevailing market terms. During this period, we also expect to begin contracting with one or more third parties to act as counterparty on new interest rate swaps, although we expect to continue to transact with NAB London Branch as well. By the Less Than Majority Holder Date, we expect to develop relationships with counterparties other than NAB London Branch sufficient to permit us to continue entering into interest rate
194
Table of Contents
swaps in the future. We do not anticipate that our costs of entering into these swap transactions with third party counterparties will be materially different than our costs of entering into these swap transactions with NAB London Branch.
Fair Value Calculations. From the completion of this offering until the later of the Less Than Majority Holder Date and the maturity of our interest rate swap portfolio held with NAB London Branch, NAB will continue to provide us with fair value calculations used in the mark-to-market accounting of certain of our loans and interest rate swaps for financial and regulatory reporting purposes. No commission or other payment was made for these services during fiscal year 2013, and we will not be required to pay for these services under the terms of the Transitional Services Agreement.
Systems and Application Access. Upon the completion of this offering, we will remain a consolidated subsidiary of NAB for purposes of its financial and regulatory reporting. From the completion of this offering until the time NAB is no longer required to consolidate us in its financial results, NAB will provide us access to systems and applications used by NAB to report and consolidate its aggregate financial results and risk positions across its enterprise. During fiscal year 2013, we paid NAB approximately $100,000 in fees for these services. We expect the fees we will pay for these services under the Transitional Services Agreement will be materially consistent with the fees we paid as a wholly owned subsidiary of NAB. We will not require these services once our financial results are no longer consolidated by NAB.
Risk, Credit Rating and Tax Oversight. Following the completion of this offering, NAB will continue to provide us with certain risk, credit rating and tax oversight currently provided to us and recorded through NAB’s systems by NAB employees. During the period when these services are being provided, we expect to engage one or more additional third party vendors to begin providing similar services to ensure an orderly transition following NAB’s cessation of these services, which will result in some duplicate costs for a period of time during the transition period, which we do not expect will be material. NAB will continue to provide all of these services, other than tax oversight services, until the later of the Less Than Majority Holder Date and the one-year anniversary of the completion of this offering, and will continue providing tax oversight services until the one-year anniversary of the Less Than Majority Holder Date. During fiscal year 2013, we paid NAB approximately $150,000 in fees for these services. We expect the fees we will pay for these services under the Transitional Services Agreement will be materially consistent with the fees we paid as a wholly owned subsidiary of NAB.
Insurance. For a period of time following the completion of this offering until one year after the Less Than Majority Holder Date, NAB will continue to provide us with various insurance-related services currently provided to us by NAB. Prior to this date, we intend to transition these services to enable our personnel to handle all insurance-related matters, including by contracting with third parties as appropriate. During fiscal year 2013, we paid NAB approximately $935,000 in fees for these services. These fees were based on then-prevailing rates in the insurance market. The fees we will pay for these services under the Transitional Services Agreement will also be based on prevailing market rates.
Other Provisions. We and NAB will work together in good faith to mutually agree to migration plans for each of the services being provided under the Transitional Services Agreement and have agreed to discuss in good faith the mitigation of any risks or issues relating to the migration of any of the services as part of the migration planning process. We may terminate any of the services provided under the Transitional Services Agreement earlier, however, as mutually agreed by both us and NAB, upon our delivery of at least 60 days’ prior written notice to NAB or in certain other circumstances, provided that in such case we will be responsible for any fees or expenses incurred by NAB as a result of such termination.
Except for breaches of certain intellectual property licenses, breaches of confidentiality and data protection provisions and breaches of applicable law in connection with provision or receipt of the services being provided under the Transitional Services Agreement, neither we nor NAB will be liable for claims in connection with or arising out of the Transitional Services Agreement in an aggregate amount exceeding the aggregate payments made for services under the Transitional Services Agreement.
195
Table of Contents
Although we believe the Transitional Services Agreement contains commercially reasonable terms (including fees for the services provided) that could have been negotiated with an independent third party, the terms of the agreement may later prove to be more or less favorable than arrangements we could make to provide these services internally or to obtain them from unaffiliated service providers in the future.
Related Party Transactions with NAB
Services Subject to the Transitional Services Agreement
As discussed above, NAB has provided certain services to us historically and will continue to provide these services for a limited transitional period. For a discussion of these services and the fees we have paid NAB for the fiscal year ended September 30, 2013, see “—Relationship with NAB—Transitional Services Agreement.”
Indebtedness Held by NAB and Its Affiliates
NAB and its affiliates have provided funding to us. Described below are certain subordinated capital notes issued to NAB and a credit line provided by NAB.
2018 Subordinated Capital Note. In connection with NAB’s acquisition of us in 2008, Great Western issued to NAB New York Branch a $35.8 million subordinated capital note due on June 3, 2018. Interest on the note is payable quarterly and accrues at a rate equal to the London inter-bank offered rate, or LIBOR, for three-month U.S. dollar deposits plus 205 basis points. The interest rate on the note is recalculated every quarter and was 2.27% at June 30, 2014. We paid $0.9 million in interest on the note during the year ended September 30, 2013 and paid $0.6 million in interest during the nine-month period ended June 30, 2014. Subject to receipt of regulatory approval, we may prepay the note at any time, in whole but not in part, without penalty. We expect that, prior to the completion of this offering, Great Western Bancorp, Inc. will assume this subordinated capital note.
Revolving Line of Credit. Great Western has a $10.0 million revolving line of credit issued by NAB, which is due on demand. Amounts outstanding under the line of credit bear interest at a rate equal to LIBOR for three-month U.S. dollar deposits plus 125 basis points, with interest payable quarterly. The interest rate is recalculated every quarter and was 1.41% at June 30, 2014. There were outstanding advances of $5.5 million on this line of credit at both June 30, 2014 and September 30, 2013. We incurred $93,000 in interest on outstanding amounts under the line of credit during the year ended September 30, 2013 and incurred $68,000 in interest during the nine-month period ended June 30, 2014. We may prepay all amounts outstanding under the revolving line of credit without penalty. We expect that, prior to the completion of this offering, Great Western Bancorp, Inc. will assume the revolving line of credit through an amended and restated agreement generally consistent with the line of credit’s current terms.
2020 and 2021 Subordinated Capital Notes. In 2010, NAI issued to NAB New York Branch an $85.0 million subordinated capital note due April 30, 2020. In 2011, NAI also issued to NAB New York Branch a $100.0 million subordinated capital note due June 30, 2021. The consolidated financial information included elsewhere in this prospectus is for Great Western and its consolidated subsidiaries at and for the period presented. Since NAI is not a subsidiary of Great Western or otherwise included in Great Western’s consolidated financial information, these subordinated capital notes and the interest payable thereon are not included in such financial information. Prior to the contribution of NAI to Great Western Bancorp, Inc., NAI intends to prepay all outstanding amounts under these subordinated capital notes.
Other
NAB is a dealer of certain securities we purchase from time to time. We purchased approximately $56.1 million of securities from NAB during the year ended September 30, 2013. No commission was paid in connection with those purchases.
196
Table of Contents
Prior to the offering, NAB provided certain of our employees with restricted shares of NAB common stock in connection with the satisfaction of short- and long-term incentive goals. We record a liability in favor of NAB based on the value and vesting schedule of the issued shares. The aggregate amounts of this liability were $3.2 million and $4.3 million as of June 30, 2014 and September 30, 2013, respectively. Following the completion of this offering, we expect that these restricted shares will continue to vest in accordance with their terms, and we will provide NAB with any information NAB reasonably requests to permit vesting of these shares in accordance with their terms. NAB will also provide us with information regarding the value, vesting schedule and outstanding amount of restricted shares upon our reasonable request.
Our Chief Financial Officer and Chief Credit Officer are NAB employees, and our Head of Credit—Agribusiness is a Bank of New Zealand employee, who were temporarily seconded to work with us beginning in January 2013, November 2010 and December 2010, respectively, and continuing through December 31, 2014. In addition, our Chief Risk Officer is an employee of Bank of New Zealand, a NAB subsidiary, who was temporarily seconded to work with us beginning in December 2010 and continuing through October 2015. We are generally responsible for paying the salary and benefits of these individuals. In connection with this offering, we have entered into employment agreements with our Chief Financial Officer and Chief Risk Officer, whose employment with NAB, or Bank of New Zealand, as applicable, will terminate and transfer to us when the agreements become effective upon the completion of this offering. The secondments of our Chief Credit Officer and Head of Credit—Agribusiness will terminate in December 31, 2014 in accordance with their current arrangements. In addition, an employee of NAB New York Branch who works from our offices in Omaha, NE assists us in providing pricing terms for certain of our long-term fixed-rate loans for which we enter into interest rate swaps. We do not pay any portion of this person’s salary or benefits. We will continue to receive services provided by this person under the Transitional Services Agreement.
During fiscal year 2013, NAB apportioned to its U.S. operations, including us, certain costs associated with NAB’s compliance with rules implemented pursuant to authority granted under the Dodd-Frank Act. These costs were apportioned based on the aggregate amount of assets of each of NAB’s U.S. operations relative to the total assets of all of NAB’s U.S. operations. During fiscal year 2013, we paid NAB approximately $200,000 related to these apportioned costs.
Other than certain audit-related expenses totaling approximately $650,000, NAB has agreed to pay or reimburse all fees and expenses we incur in connection with this offering.
Other Related Party Transactions
In the ordinary course of our business, we have engaged and expect to continue engaging in ordinary banking transactions with our directors, executive officers, their immediate family members and companies in which they may have a 5% or more beneficial ownership interest, including loans to such persons. Any such loan was made on substantially the same terms, including interest rates and collateral, as those prevailing at the time such loan was made as loans made to persons who were not related to us. These loans do not involve more than the normal credit collection risk and do not present any other unfavorable features.
Mr. Karels’s son owns a 22.5% interest in Sioux Falls Financial Services, LLC, which leases to us certain property in South Dakota we use as an operations center. The lease agreement for this property commenced on April 1, 2011 and contains customary and standard terms for similar lease arrangements. The term of the lease runs through March 31, 2020, at which point we have the option to renew the lease for an additional five year term. During fiscal year 2013, payments under this lease totaled approximately $133,000.
At our request, the underwriters have reserved for sale, at the initial public offering price, up to 5% of the shares offered by this prospectus for sale to some of our directors, officers, employees, friends, family, customers and related persons through a reserved share program. See “Underwriting—Reserved Share Program” for additional information regarding the reserved share program.
197
Table of Contents
Related Party Transaction Policy
Our board of directors has adopted a written policy governing the review, approval or ratification of transactions between us or any of our subsidiaries and any related party in which the amount involved since the beginning of our last completed fiscal year will or may be expected to exceed $120,000 and in which one of our executive officers, directors, director nominees or stockholders beneficially owning more than 5% of our outstanding common stock (or their immediate family members) has a direct or indirect material interest. The policy calls for the related person transactions to be reviewed and, if deemed appropriate, approved or ratified by our audit committee. In determining whether or not to approve or ratify a related person transaction, our audit committee takes into account, among other factors it deems important, whether the related person transaction is in our best interests and whether the transaction is on terms no less favorable than terms generally available to an unaffiliated third party under the same or similar circumstances. In the event a member of our audit committee is not disinterested with respect to the related person transaction under review, that member may not participate in the review, approval or ratification of that related person transaction.
Certain decisions and transactions are not subject to the related person transaction approval policy, including: (i) decisions on compensation or benefits relating to directors or executive officers and (ii) indebtedness to us in the ordinary course of business, on substantially the same terms, including interest rate and collateral, as those prevailing at the time for comparable loans with persons not related to us and not presenting more than the normal risk of collectability or other unfavorable features.
198
Table of Contents
The following description of our capital stock is a summary of the material terms of our amended and restated certificate of incorporation and amended and restated bylaws. Reference is made to the more detailed provisions of, and the descriptions are qualified in their entirety by reference to, these documents, forms of which are filed with the SEC as exhibits to the registration statement of which this prospectus is a part, and applicable law. This description assumes the effectiveness of our amended and restated certificate of incorporation and amended and restated bylaws, which will take effect prior to the consummation of this offering.
General
Our authorized capital stock consists of shares of common stock, par value $0.01 per share, which we refer to in this prospectus as “common stock,” shares of non-voting common stock, par value $0.01 per share, which we refer to in this prospectus as “non-voting common stock,” and shares of preferred stock, par value $0.01 per share. As of , 2014, we had shares of our common stock issued and outstanding, and no shares of our non-voting common stock or preferred stock were issued and outstanding. The authorized but unissued shares of our capital stock will be available for future issuance without stockholder approval, unless otherwise required by applicable law or the rules of any applicable securities exchange and subject to NAB’s consent pursuant to the terms of the Stockholder Agreement. All of our issued and outstanding shares of capital stock are validly issued, fully paid and non-assessable.
Common Stock and Non-Voting Common Stock
Subject to the rights and preferences granted to holders of our preferred stock then outstanding, and except with respect to voting rights, conversion rights and certain distributions of our capital stock, holders of our common stock and our non-voting common stock will rank equally with respect to distributions and have identical rights, preferences, privileges and restrictions, including the right to attend meetings and receive any information distributed by us with respect to such meetings.
Dividends. Holders of our common stock and non-voting common stock are equally entitled to receive ratably such dividends as may be declared from time to time by our board of directors out of legally available funds. In no event will any stock dividends or stock splits or combinations of stock be declared or made on common stock or non-voting common stock unless the shares of common stock and non-voting common stock at the time outstanding are treated equally and identically, provided that, in the event of a dividend of common stock or non-voting common stock, shares of common stock shall only be entitled to receive shares of common stock and shares of non-voting common stock shall only be entitled to receive shares of non-voting common stock. The ability of our board of directors to declare and pay dividends on our common stock and non-voting common stock is subject to the laws of the state of Delaware, applicable federal and state banking laws and regulations, and the terms of any senior securities (including preferred stock) we may then have outstanding. Our principal source of income is dividends that are declared and paid by our bank on its capital stock. Therefore, our ability to pay dividends is dependent upon the receipt of dividends from our bank. See “Dividend Policy and Dividends.”
Voting Rights. Each holder of our common stock is entitled to one vote for each share of record held on all matters submitted to a vote of stockholders, except as otherwise required by law and subject to the rights and preferences of the holders of any outstanding shares of our preferred stock. Holders of our common stock are not entitled to cumulative voting in the election of directors. Directors are elected by a plurality of the votes cast. The holders of non-voting common stock do not have any voting power and are not entitled to vote on any matter, except as otherwise required by law and as described herein. In addition to any other vote required by law, the affirmative vote of a majority of the outstanding shares of common stock or non-voting common stock, each voting separately as a class, as the case may be, will be required to amend, alter or repeal (including by merger, consolidation or otherwise) any provision of our amended and restated certificate of incorporation that adversely
199
Table of Contents
affects the rights, preferences or privileges of the common stock or non-voting common stock, respectively, in a manner that is materially adverse from the effect of such amendment, alteration or repeal on the other class of our capital stock, as applicable.
Conversion of Non-Voting Common Stock. Any holder of non-voting common stock may convert any number of shares of non-voting common stock into an equal number of shares of common stock at the option of the holder if such conversion is in connection with a transfer (i) that is part of a widely distributed public offering of our common stock, (ii) to an underwriter for the purpose of conducting a widely distributed public offering, (iii) that is part of a transfer of non-voting common stock not requiring registration under the Securities Act in which no one transferee (or group of associated transferees) acquires the right to purchase in excess of 2% of our common stock then outstanding (including pursuant to a related series of transfers), or (iv) that is part of a transaction approved by the Federal Reserve and the FDIC. We will reserve for issuance a number of shares of common stock into which all outstanding shares of non-voting common stock may be converted.
Liquidation Rights. In the event of our liquidation, dissolution or winding up, holders of common stock and non-voting common stock are entitled to share ratably in all of our assets remaining after payment of liabilities, including but not limited to the liquidation preference of any then outstanding preferred stock. Because we are a bank holding company, our rights and the rights of our creditors and stockholders to receive the assets of any subsidiary upon liquidation or recapitalization may be subject to prior claims of our subsidiary’s creditors, except to the extent that we may be a creditor with recognized claims against our subsidiary.
Preemptive and Other Rights. Holders of our common stock and our non-voting common stock are not entitled to any preemptive, subscription or redemption rights, and no sinking fund will be applicable to our common stock or our non-voting common stock.
Preferred Stock
Our amended and restated certificate of incorporation authorizes our board of directors to establish one or more series of preferred stock. Unless required by law or any stock exchange, the authorized shares of preferred stock will be available for issuance without further action by the stockholders, subject to NAB’s consent pursuant to the terms of the Stockholder Agreement. Our board of directors is authorized to divide the preferred stock into series and, with respect to each series, to fix and determine the designation, terms, preferences, limitations and relative rights thereof, including dividend rights, dividend rates, conversion rights, voting rights, redemption rights and terms, liquidation preferences, sinking fund provisions and the number of shares constituting the series. Subject to the rights of the holders of any series of preferred stock, the number of authorized shares of any series of preferred stock may be increased (but not above the total number of shares of preferred stock authorized under our amended and restated certificate of incorporation) or decreased (but not below the number of shares thereof then outstanding) by the affirmative vote of the holders of a majority in voting power of the outstanding shares. Without stockholder approval, but subject to NAB’s consent pursuant to the terms of the Stockholder Agreement, we could issue preferred stock that could impede or discourage an acquisition attempt or other transaction that some, or a majority, of our stockholders may believe is in their best interests or in which they may receive a premium for their common stock over the market price of the common stock.
Authorized but Unissued Capital Stock
The DGCL does not generally require stockholder approval for the issuance of authorized shares. These additional shares may be used for a variety of corporate purposes, including future public offerings, to raise additional capital or to facilitate acquisitions. However, the listing requirements of the NYSE, which would apply so long as the common stock remains listed on the NYSE, require stockholder approval of certain issuances equal to or exceeding 20% of the then outstanding voting power or then outstanding number of shares of common stock. In addition, our ability to issue additional shares of capital stock is subject to NAB’s consent pursuant to the terms of the Stockholder Agreement.
200
Table of Contents
One of the effects of the existence of unissued and unreserved common stock or preferred stock may be to enable our board of directors to issue shares to persons friendly to current management, which issuance could render more difficult or discourage an attempt to obtain control of us by means of a merger, tender offer, proxy contest or otherwise, and thereby protect the continuity of our management and possibly deprive our stockholders of opportunities they may believe are in their best interests or in which they may receive a premium for their common stock over the market price of the common stock.
Anti-Takeover Effects of Provisions of Applicable Law and Our Amended and Restated Certificate of Incorporation and Amended and Restated Bylaws
Business Combination Statute. We are a Delaware corporation subject to Section 203 of the DGCL. Section 203 provides that, subject to certain exceptions specified in the law, we may not engage in any “business combination” with any “interested stockholder” for a three-year period following the time such stockholder became an interested stockholder unless:
| • | prior to such time, our board of directors approved either the business combination or the transaction that resulted in the stockholder becoming an interested stockholder; |
| • | upon consummation of the transaction that resulted in the stockholder becoming an interested stockholder, the interested stockholder owned at least 85% of our voting stock outstanding at the time the transaction commenced, excluding certain shares as specified in Section 203; or |
| • | at or subsequent to such time, the business combination is approved by our board of directors and authorized at a meeting of stockholders (and not by written consent) by the affirmative vote of at least 66 2/3% of the outstanding voting stock that is not owned by the interested stockholder. |
Generally, a “business combination” includes, among other things, a merger or asset or stock sale of us or any of our majority-owned subsidiaries or any of certain other transaction resulting in a financial benefit to the interested stockholder. Subject to certain exceptions, an “interested stockholder” is a person who, together with that person’s affiliates and associates, owns, or within the previous three years did own, 15% or more of our voting stock. Our amended and restated certificate of incorporation, however, generally exempts NAB and all of its affiliates, and all transferees of our stock or preferred stock receiving shares from NAB or any of its affiliates, or any affiliate of any such transferee, from the definition of interested stockholder for purposes of Section 203 of the DGCL.
Under certain circumstances, Section 203 makes it more difficult for a person who would be an “interested stockholder” to effect various business combinations with a corporation for a three-year period. The provisions of Section 203 may encourage companies interested in acquiring us to negotiate in advance with our board of directors because the stockholder approval requirement described above would be avoided if our board of directors approves either the business combination or the transaction that results in the stockholder becoming an interested stockholder. These provisions also may make it more difficult to accomplish transactions that stockholders may otherwise deem to be in their best interests.
Federal Banking Law. The ability of a third party to acquire our stock is also limited under applicable U.S. banking laws, including regulatory approval requirements. The BHC Act requires any “bank holding company” to obtain the approval of the Federal Reserve before acquiring, directly or indirectly, more than 5% of our outstanding common stock. Any “company,” as defined in the BHC Act, other than a bank holding company is required to obtain the approval of the Federal Reserve before acquiring “control” of us. “Control” generally means (i) the ownership or control of 25% or more of a class of voting securities, (ii) the ability to elect a majority of the directors or (iii) the ability otherwise to exercise a controlling influence over management and policies. A person, other than an individual, that controls us for purposes of the BHC Act is subject to regulation and supervision as a bank holding company under the BHC Act. In addition, under the Change in Bank Control Act of 1978, as amended, and the Federal Reserve’s regulations thereunder, any person, either individually or acting through or in concert with one or more persons, is required to provide notice to the Federal Reserve prior to acquiring, directly or indirectly, 10% or more of our outstanding common stock (or any other class of our voting securities).
201
Table of Contents
Classified Board. Our amended and restated certificate of incorporation provides that our board of directors shall be divided into three classes of directors, with the classes as nearly equal in number as possible. As a result, approximately one-third of our board of directors will be elected each year. The classification of directors has the effect of making it more difficult for stockholders to change the composition of our board of directors.
Requirements for Advance Notification of Stockholder Nominations and Proposals. Our amended and restated bylaws establish advance notice procedures with respect to stockholder proposals and nomination of candidates for election as directors. These procedures provide that notice of such stockholder approval must be timely given in writing to our corporate secretary prior to the meeting at which the action is to be taken. Generally, to be timely, notice must be received at our principal executive offices not less than 90 days nor more than 120 days prior to the first anniversary date of the annual meeting for the preceding year. The notice must contain certain information required to be provided by our amended and restated bylaws.
Limits on Written Consents. Our amended and restated certificate of incorporation provides that any action to be taken by the stockholders that the stockholders are required or permitted to take must be effected at a duly called annual or special meeting of stockholders. Our stockholders are not permitted to take action by written consent.
Annual Meetings; Limits on Special Meetings. We expect to have annual meetings of stockholders beginning in 2015. Subject to the rights of the holders of any series of preferred stock, special meetings of the stockholders may be called only by (i) our board of directors, (ii) the Chairperson of the Board, (iii) our Chief Executive Officer and (iv) prior to the Non-Control Date, NAB.
Amendments to our Governing Documents. Generally, the amendment of our amended and restated certificate of incorporation requires approval by our board of directors and a majority vote of stockholders; however, certain material amendments (including amendments with respect to provisions governing board composition and actions by written consent) require the approval of at least 75% of the votes entitled to be cast by the outstanding capital stock in the elections of our board of directors. Any amendment to our amended and restated bylaws requires the approval of either a majority of our board of directors or holders of at least 75% of the votes entitled to be cast by the outstanding capital stock in the election of our board of directors. The approval of at least 75% of our board of directors is also required to amend our amended and restated bylaws to increase the number of directors and, prior to the Non-Control Date, no such amendment shall increase the number of directors to more than thirteen or decrease the number of directors to fewer than five. In addition, to any other vote required by law, the affirmative vote of a majority of the outstanding shares of common stock or non-voting common stock, each voting separately as a class, as the case may be, will be required to amend, alter or repeal (including by merger, consolidation or otherwise) any provision of our amended and restated certificate of incorporation that adversely affects the privileges, preferences or rights of our common stock or non-voting common stock, respectively, in a manner that is materially adverse from the effect of such amendment, alteration or repeal on the other class of our capital stock, as applicable. Any amendment to our amended and restated certificate of incorporation (whether by merger, consolidation or otherwise) to increase or decrease the authorized shares of any class of common stock must be approved by a majority of the votes entitled to be cast by the holders of the shares affected by the amendment, voting as a separate class or series, as applicable.
Sole and Exclusive Forum
Our amended and restated certificate of incorporation provides that, unless we consent in writing to an alternative forum, the Court of Chancery of the State of Delaware will be the sole and exclusive forum for (i) any derivative action or proceeding brought on our behalf, (ii) any action asserting a claim of breach of a fiduciary duty owed by any of our directors, officers, employees or agents to us or our stockholders, (iii) any action asserting a claim arising pursuant to any provision of the DGCL, our amended and restated certificate of incorporation or our amended and restated bylaws or (iv) any action asserting a claim that is governed by the internal affairs doctrine, in each case subject to the Court of Chancery having personal jurisdiction over the
202
Table of Contents
indispensable parties named as defendants therein and the claim not being one which is vested in the exclusive jurisdiction of a court or forum other than the Court of Chancery or for which the Court of Chancery does not have subject matter jurisdiction. Any person purchasing or otherwise acquiring any interest in any shares of our capital stock shall be deemed to have notice of and to have consented to this provision of our amended and restated certificate of incorporation. This choice of forum provision may have the effect of discouraging lawsuits against us and our directors, officers, employees and agents. The enforceability of similar choice of forum provisions in other companies’ certificates of incorporation has been challenged in legal proceedings, and it is possible that, in connection with one or more actions or proceedings described above, a court could find the provision of our amended and restated certificate of incorporation to be inapplicable or unenforceable.
Indemnification and Limitation of Liability
Our amended and restated bylaws provide generally that we will indemnify and hold harmless, to the full extent permitted by law, our directors, officers, employees and agents, as well as other persons who have served as our directors, officers, employees or agents and other persons who serve or have served at our request at another corporation, limited liability company, public limited company, partnership, joint venture, trust, employee benefit plan, fund or other enterprise in connection with any actual or threatened action, suit or proceeding, subject to limited exceptions. Insofar as indemnification for liabilities arising under the Securities Act may be permitted to our directors, officers and controlling persons, we have been informed that, in the opinion of the SEC, such indemnification is against public policy as expressed in the Securities Act and is, therefore, unenforceable. Finally, our ability to provide indemnification to our directors and officers is limited by federal banking laws and regulations.
Our amended and restated certificate of incorporation limits, to the full extent permitted by law, the personal liability of our directors in actions brought on our behalf or on behalf of our stockholders for monetary damages as a result of a director’s breach of fiduciary duty while acting in a capacity as a director. Our amended and restated certificate of incorporation does not eliminate or limit our right or the right of our stockholders to seek injunctive or other equitable relief not involving monetary damages.
Business Opportunities
Our amended and restated certificate of incorporation provides that, to the fullest extent permitted by law, none of NAB or any of its affiliates will have any duty to refrain from (i) engaging in a corporate opportunity in the same or similar lines of business in which we or our affiliates now engage or propose to engage or (ii) otherwise competing with us or our affiliates. NAB will agree, as part of the Stockholder Agreement, to refrain and to cause its subsidiaries to refrain from engaging in certain activities competitive with our business, subject to certain exceptions. See “Our Relationship with NAB and Certain Other Related Party Transactions—Relationship with NAB—Stockholder Agreement.”
Listing
We intend to apply to list our common stock on the NYSE under the symbol “GWB.”
Transfer Agent and Registrar
The transfer agent and registrar for our common stock and our non-voting common stock is .
203
Table of Contents
SHARES ELIGIBLE FOR FUTURE SALE
Prior to this offering, there has been no market for our common stock. Future sales of substantial amounts of our common stock in the public market, or the perception that such sales may occur, could adversely affect market prices prevailing from time to time. Furthermore, because only a limited number of shares will be available for sale shortly after this offering due to existing contractual and legal restrictions on resale as described below, there may be sales of substantial amounts of our common stock in the public market after the restrictions lapse. This may adversely affect the prevailing market price and our ability to raise equity capital in the future.
Upon completion of this offering, we will have shares of common stock outstanding. Of these shares, shares of our common stock (or shares if the underwriters exercise their option to purchase additional shares of common stock from the NAB selling stockholder in full) sold in this offering will be freely transferable without restriction or further registration under the Securities Act, except for any shares purchased by our “affiliates,” as that term is defined in Rule 144 under the Securities Act. The remaining shares of our common stock (or shares if the underwriters exercise their option to purchase additional shares of common stock from the NAB selling stockholder in full) outstanding are “restricted shares” as defined in Rule 144, all of which will be beneficially owned by NAB. Restricted shares may be sold in the public market only if registered under the Securities Act or if they qualify for an exemption from registration under Rule 144. As a result of the contractual 180-day lock-up period described below and the provisions of Rule 144, these shares will be available for sale in the public market only after 180 days from the date of this prospectus (generally subject to volume and other offering limitations).
Subject to market conditions and other considerations, NAB intends to divest 100% of its ownership in us over time. See “Risk Factors—Risks Related to Our Common Stock—Future sales of our common stock in the public market, including expected sales by NAB, could lower our stock price, and any additional capital raised by us through the sale of equity or convertible securities may dilute your ownership in us.”
Rule 144
In general, a person who has beneficially owned restricted shares of our common stock for at least six months would be entitled to sell such securities, provided that (i) such person is not deemed to have been one of our affiliates at the time of, or at any time during the 90 days preceding, the sale and (ii) we are subject to the Exchange Act periodic reporting requirements for at least 90 days before the sale. Persons who have beneficially owned restricted shares of our common stock for at least six months but who are our affiliates at the time of, or any time during the 90 days preceding, the sale, would be subject to additional restrictions, by which such person would be entitled to sell within any three-month period only a number of securities that does not exceed the greater of the following:
| • | 1% of the number of shares of our common stock then outstanding, which will equal approximately shares immediately after this offering; or |
| • | the average weekly trading volume of our common stock on during the four calendar weeks preceding the filing of a notice on Form 144 with respect to the sale; |
provided, in each case, that we are subject to the Exchange Act periodic reporting requirements for at least 90 days before the sale. Such sales both by affiliates and by non-affiliates must also comply with the manner of sale and notice provisions of Rule 144 to the extent applicable.
Registration Rights
Upon completion of this offering, subject to the lock-up agreements described below, NAB will be entitled to require us to register under the Securities Act of shares of our common stock (or shares of our
204
Table of Contents
common stock if the underwriters exercise their option to purchase additional shares of our common stock from the NAB selling stockholder in full) that NAB will continue to beneficially own immediately following the completion of this offering. Registration and sale of these shares under the Securities Act would result in these shares, other than shares purchased by any of our affiliates, becoming freely tradable without restriction under the Securities Act immediately upon the effectiveness of the registration statement. See “Our Relationship with NAB and Certain Other Related Party Transactions—Relationship with NAB—Registration Rights Agreement” for more information on NAB’s registration rights following the completion of this offering.
Registration Statement on Form S-8
In connection with or as soon as practicable following the completion of this offering, we intend to file a registration statement with the SEC on Form S-8 to register an aggregate of shares of common stock reserved for issuance under our incentive plans, as described further under “Executive and Director Compensation—2014 Omnibus Incentive Compensation Plan” and “Executive and Director Compensation—2014 Non-Employee Director Plan.” That registration statement will become effective upon filing and shares of common stock covered by such registration statement will be eligible for sale in the public market immediately after the effective date of such registration statement (unless held by affiliates) subject to the lock-up agreements described below.
Lock-up Agreements
We, NAB, the NAB selling stockholder and each of our directors and executive officers have agreed, subject to certain limited exceptions, not to offer, pledge, sell, contract to sell, sell any option or contract to purchase, purchase any option or contract to sell, grant any option, right or warrant for the sale of, otherwise dispose of or transfer any shares of our common stock or any securities convertible into or exchangeable or exercisable for common stock for a period of 180 days after the date of this prospectus, without the prior written consent of Deutsche Bank Securities Inc. and Merrill Lynch, Pierce, Fenner & Smith Incorporated on behalf of the underwriters. See “Underwriting.” The underwriters do not have any present intention or arrangement to release any shares of our common stock subject to lock-up agreements prior to the expiration of the 180-day lock-up period.
205
Table of Contents
MATERIAL U.S. FEDERAL TAX CONSIDERATIONS FOR NON-U.S. HOLDERS
OF OUR COMMON STOCK
This section summarizes the material United States federal income and estate tax consequences of the ownership and disposition of shares of our common stock by a non-U.S. holder (as defined below). It applies to you only if you acquire your shares of common stock in this offering and you hold the shares of common stock as capital assets for U.S. federal income tax purposes. You are a “non-U.S. holder” if you are, for United States federal income tax purposes:
| • | a nonresident alien individual; |
| • | a foreign corporation; or |
| • | an estate or trust that in either case is not subject to United States federal income tax on a net income basis on income or gain from the common stock. |
This section does not consider the specific facts and circumstances that may be relevant to a particular non-U.S. holder and does not address the treatment of a non-U.S. holder under the laws of any state, local or foreign taxing jurisdiction. In addition, it does not represent a detailed description of the United States federal income tax consequences applicable to you if you are subject to special treatment under the United States federal income tax laws (including if you are a United States expatriate, “controlled foreign corporation,” “passive foreign investment company” or a partnership or other pass-through entity for United States federal income tax purposes). This section is based on the tax laws of the United States, including the Internal Revenue Code, as amended, or the Code, existing and proposed regulations, and administrative and judicial interpretations, all as currently in effect. These laws are subject to change, possibly on a retroactive basis.
If a partnership holds the shares of our common stock, the United States federal income tax treatment of a partner will generally depend on the status of the partner and the tax treatment of the partnership. A partner in a partnership holding shares of our common stock should consult its tax adviser with regard to the United States federal income tax treatment of an investment in our common stock.
You should consult a tax adviser regarding the United States federal tax consequences of acquiring, holding and disposing of shares of our common stock in your particular circumstances, as well as any tax consequences that may arise under the laws of any state, local or foreign taxing jurisdiction.
Dividends
Except as described below, if you are a non-U.S. holder of shares of our common stock, distributions paid to you that are characterized as dividends for United States federal income tax purposes are subject to withholding of United States federal income tax at a 30% rate or at a lower rate if you are eligible for the benefits of an income tax treaty that provides for a lower rate. In addition, even if you are eligible for a lower treaty rate, we and other payors will generally be required to withhold at a 30% rate (rather than the lower treaty rate) on dividend payments to you, unless you have furnished to us or another payor:
| • | a valid Internal Revenue Service Form W-8BEN, W-8BEN-E or an acceptable substitute form upon which you certify, under penalties of perjury, your status as a non-United States person and your entitlement to the lower treaty rate with respect to such payments; or |
| • | in the case of payments made outside the United States to an offshore account (generally, an account maintained by you at an office or branch of a bank or other financial institution at any location outside the United States), other documentary evidence establishing your entitlement to the lower treaty rate in accordance with U.S. Treasury regulations. |
206
Table of Contents
If you are eligible for a reduced rate of United States withholding tax under a tax treaty, you may obtain a refund of any amounts withheld in excess of that rate by filing a refund claim with the United States Internal Revenue Service.
If dividends paid to you are “effectively connected” with your conduct of a trade or business within the United States, and, if required by a tax treaty, the dividends are attributable to a permanent establishment that you maintain in the United States, we and other payors generally are not required to withhold tax from the dividends, provided that you have furnished to us or another payor a valid Internal Revenue Service Form W-8ECI or an acceptable substitute form upon which you represent, under penalties of perjury, that:
| • | you are a non-United States person; and |
| • | the dividends are effectively connected with your conduct of a trade or business within the United States and are includible in your gross income. |
“Effectively connected” dividends are taxed at rates applicable to United States citizens, resident aliens and domestic United States corporations.
If you are a corporate non-U.S. holder, “effectively connected” dividends that you receive may, under certain circumstances, be subject to an additional “branch profits tax” at a 30% rate or at a lower rate if you are eligible for the benefits of an income tax treaty that provides for a lower rate.
Gain on Disposition of Common Stock
If you are a non-U.S. holder, you generally will not be subject to United States federal income tax on gain that you recognize on a disposition of shares of our common stock unless:
| • | the gain is “effectively connected” with your conduct of a trade or business in the United States, and the gain is attributable to a permanent establishment that you maintain in the United States, if that is required by an applicable income tax treaty as a condition for subjecting you to United States taxation on a net income basis; |
| • | you are an individual, you hold the shares of our common stock as a capital asset, you are present in the United States for 183 or more days in the taxable year of the sale and certain other conditions exist; or |
| • | we are or have been a United States real property holding corporation for federal income tax purposes and you held, directly or indirectly, at any time during the five-year period ending on the date of disposition, more than 5% of our common stock and you are not eligible for any treaty exemption. |
If you are a non-U.S. holder and the gain from the disposition of shares of our common stock is effectively connected with your conduct of a trade or business in the United States (and the gain is attributable to a permanent establishment that you maintain in the United States, if that is required by an applicable income tax treaty as a condition for subjecting you to United States taxation on a net income basis), you will be subject to tax on the net gain derived from the sale at rates applicable to United States citizens, resident aliens and domestic United States corporations. If you are a corporate non-U.S. holder, “effectively connected” gains that you recognize may also, under certain circumstances, be subject to an additional “branch profits tax” at a 30% rate or at a lower rate if you are eligible for the benefits of an income tax treaty that provides for a lower rate. If you are an individual non-U.S. holder described in the second bullet point immediately above, you will be subject to a flat 30% tax or a lower rate if you are eligible for the benefits of an income tax treaty that provides for a lower rate, on the gain derived from the sale, which may be offset by United States source capital losses, even though you are not considered a resident of the United States.
We have not been, are not and do not anticipate becoming a United States real property holding corporation for United States federal income tax purposes.
207
Table of Contents
Federal Estate Taxes
Shares of our common stock held by a non-U.S. holder at the time of death will be included in the holder’s gross estate for United States federal estate tax purposes, unless an applicable estate tax treaty provides otherwise.
Backup Withholding and Information Reporting
In general (except as described below), backup withholding and information reporting will not apply to a distribution of dividends on shares of our common stock paid to you or to proceeds from the disposition of shares of our common stock by you, in each case, if you certify under penalties of perjury that you are a non-United States person, and neither we nor our paying agent (or other payor) have actual knowledge or reason to know to the contrary. In general, if the shares of our common stock are not held through a qualified intermediary, the amount of dividends, the name and address of the beneficial owner and the amount, if any, of tax withheld may be reported to the Internal Revenue Service.
Any amounts withheld under the backup withholding rules will generally be allowed as a credit against your United States federal income tax liability or refunded, provided the required information is timely furnished to the Internal Revenue Service.
FATCA Withholding Taxes
Under legislation enacted in 2010 and existing guidance issued thereafter, a 30% withholding tax will be imposed on dividends paid in respect of shares of our common stock, and on gross proceeds from the sale of shares of our common stock after December 31, 2016, if such shares are held by or through certain foreign financial institutions (including investment funds). This withholding tax does not apply if such institution either (i) enters into an agreement with the U.S. Treasury Department to report, on an annual basis, information with respect to certain interests in, and accounts maintained by, the institution to the extent such interests or accounts are held by certain U.S. persons or by certain non-U.S. entities that are wholly or partially owned by U.S. persons, or (ii) is based in a country that has entered into an agreement with the United States which requires such institutions to report such information.
Accordingly, the entity through which shares of our common stock is held will affect the determination of whether such withholding is required. Similarly, dividends in respect of, and gross proceeds from the sale of, shares of our common stock held by an investor that is a non-financial non-U.S. entity that does not qualify under certain exceptions will be subject to withholding at a rate of 30% beginning after the dates noted above, unless such entity either (i) certifies to us (or another applicable withholding agent) that such entity does not have any “substantial U.S. owners” or (ii) provides certain information regarding the entity’s “substantial U.S. owners,” which we (or another applicable withholding agent) will in turn provide to the U.S. Treasury Department. We will not pay any additional amounts to holders in respect of any amounts withheld. Non-U.S. holders are encouraged to consult with their tax advisers regarding the possible implications of these rules on their investment in shares of our common stock.
208
Table of Contents
Deutsche Bank Securities Inc. and Merrill Lynch, Pierce, Fenner & Smith Incorporated are acting as representatives of each of the underwriters named below. Subject to the terms and conditions set forth in an underwriting agreement among us, the NAB selling stockholder, NAB and the underwriters, the NAB selling stockholder has agreed to sell to the underwriters, and each of the underwriters has agreed, severally and not jointly, to purchase from the NAB selling stockholder, the number of shares of common stock set forth opposite its name below.
| Underwriter |
Number of Shares | |
| Deutsche Bank Securities Inc. |
||
| Merrill Lynch, Pierce, Fenner & Smith Incorporated |
||
|
| ||
| Total |
||
|
|
Subject to the terms and conditions set forth in the underwriting agreement, the underwriters have agreed, severally and not jointly, to purchase all of the shares of common stock sold under the underwriting agreement if any of these shares are purchased. If an underwriter defaults, the underwriting agreement provides that the purchase commitments of the non-defaulting underwriters may be increased or the underwriting agreement may be terminated.
We, NAB and the NAB selling stockholder have agreed to indemnify the underwriters against certain liabilities, including liabilities under the Securities Act, or to contribute to payments the underwriters may be required to make in respect of those liabilities.
The underwriters are offering the shares of our common stock, subject to prior sale, when, as and if sold to and accepted by them, subject to approval of legal matters by their counsel, including the validity of the shares, and other conditions contained in the underwriting agreement, such as the receipt by the underwriters of officer’s certificates and legal opinions. The underwriters reserve the right to withdraw, cancel or modify offers to the public and to reject orders in whole or in part.
Commissions and Discounts
The representatives have advised us and the NAB selling stockholder that the underwriters propose initially to offer the shares of our common stock to the public at the public offering price set forth on the cover page of this prospectus and to dealers at that price less a concession not in excess of $ per share. After the initial offering, the public offering price, concession or any other term of the offering may be changed.
The following table shows the public offering price, underwriting discount and proceeds before expenses to the NAB selling stockholder. We will not receive any proceeds from the sale of shares by the NAB selling stockholder. The information assumes either no exercise or full exercise by the underwriters of their option to purchase additional shares:
| Per Share | Without Option | With Option | ||||||||||
| Public offering price |
$ | $ | $ | |||||||||
| Underwriting discount |
$ | $ | $ | |||||||||
| Proceeds, before expenses, to the NAB selling stockholder |
$ | $ | $ | |||||||||
209
Table of Contents
We estimate that the total amount of expenses payable by us relating to this offering, not including the underwriting discount or expenses paid or reimbursed to us by NAB, are $ . We have agreed to reimburse the underwriters for certain expenses relating to clearance of this offering with FINRA up to a maximum of $17,500.
Option to Purchase Additional Shares
The NAB selling stockholder has granted an option to the underwriters, exercisable for 30 days after the date of this prospectus, to purchase up to additional shares of our common stock at the public offering price, less the underwriting discount. If the underwriters exercise this option, each will be obligated, subject to conditions contained in the underwriting agreement, to purchase a number of additional shares proportionate to that underwriter’s initial amount reflected in the above table.
No Sales of Similar Securities
We, the NAB selling stockholder, NAB and our executive officers and directors have agreed not to sell or transfer any common stock or securities convertible into, exchangeable for, exercisable for, or repayable with common stock, for 180 days after the date of this prospectus without first obtaining the written consent of Deutsche Bank Securities Inc. and Merrill Lynch, Pierce, Fenner & Smith Incorporated. Specifically, we and these other persons have agreed, with certain limited exceptions, not to directly or indirectly:
| • | offer, pledge, sell or contract to sell any common stock; |
| • | sell any option or contract to purchase any common stock; |
| • | purchase any option or contract to sell any common stock; |
| • | grant any option, right or warrant for the sale of any common stock; |
| • | dispose of or transfer any common stock; |
| • | file a registration statement related to the common stock; or |
| • | enter into any swap or other agreement that transfers, in whole or in part, the economic consequence of ownership of any common stock whether any such swap or transaction is to be settled by delivery of shares or other securities, in cash or otherwise. |
This lock-up provision applies to common stock and to securities convertible into or exchangeable or exercisable for or repayable with common stock. It also applies to common stock owned now or acquired later by the person executing the agreement or for which the person executing the agreement later acquires the power of disposition.
Listing
We intend to apply to list our common stock on the NYSE under the symbol “GWB.”
Before this offering, there has been no public market for our common stock. The initial public offering price will be determined through negotiations among us, the NAB selling stockholder and the representatives. In addition to prevailing market conditions, the factors to be considered in determining the initial public offering price are:
| • | the valuation multiples of publicly traded companies that the representatives believe to be comparable to us; |
| • | our financial information; |
| • | the history of, and the prospects for, us and the industry in which we compete; |
210
Table of Contents
| • | an assessment of our management, its past and present operations, and the prospects for, and timing of, our future revenues; |
| • | the present state of our development; and |
| • | the above factors in relation to market values and various valuation measures of other companies engaged in activities similar to ours. |
An active trading market for the shares may not develop. It is also possible that after the offering the shares will not trade in the public market at or above the initial public offering price.
The underwriters do not expect to sell more than 5% of the shares in the aggregate to accounts over which they exercise discretionary authority.
Price Stabilization, Short Positions and Penalty Bids
Until the distribution of the shares is completed, SEC rules may limit underwriters and selling group members from bidding for and purchasing our common stock. However, the representatives may engage in transactions that stabilize the price of the common stock, such as bids or purchases to peg, fix or maintain that price.
In connection with the offering, the underwriters may purchase and sell our common stock in the open market. These transactions may include short sales, purchases on the open market to cover positions created by short sales and stabilizing transactions. Short sales involve the sale by the underwriters of a greater number of shares than they are required to purchase in the offering. “Covered” short sales are sales made in an amount not greater than the underwriters’ option to purchase additional shares described above. The underwriters may close out any covered short position by either exercising their option to purchase additional shares or purchasing shares in the open market. In determining the source of shares to close out the covered short position, the underwriters will consider, among other things, the price of shares available for purchase in the open market as compared to the price at which they may purchase shares through the option granted to them. “Naked” short sales are sales in excess of such option. The underwriters must close out any naked short position by purchasing shares in the open market. A naked short position is more likely to be created if the underwriters are concerned that there may be downward pressure on the price of our common stock in the open market after pricing that could adversely affect investors who purchase in the offering. Stabilizing transactions consist of various bids for or purchases of shares of common stock made by the underwriters in the open market prior to the completion of the offering.
The underwriters may also impose a penalty bid. This occurs when a particular underwriter repays to the underwriters a portion of the underwriting discount received by it because the representatives have repurchased shares sold by or for the account of such underwriter in stabilizing or short covering transactions.
Similar to other purchase transactions, the underwriters’ purchases to cover the syndicate short sales may have the effect of raising or maintaining the market price of our common stock or preventing or retarding a decline in the market price of our common stock. As a result, the price of our common stock may be higher than the price that might otherwise exist in the open market. The underwriters may conduct these transactions on the NYSE, in the over-the-counter market or otherwise.
Neither we nor any of the underwriters make any representation or prediction as to the direction or magnitude of any effect that the transactions described above may have on the price of our common stock. In addition, neither we nor any of the underwriters make any representation that the representatives will engage in these transactions or that these transactions, once commenced, will not be discontinued without notice.
211
Table of Contents
Electronic Distribution
In connection with the offering, certain of the underwriters or securities dealers may distribute prospectuses by electronic means, such as e-mail.
Other Relationships
Some of the underwriters and their affiliates have engaged in, and may in the future engage in, investment banking and other commercial dealings in the ordinary course of business with us or our affiliates. They have received, or may in the future receive, customary fees and commissions for these transactions.
In addition, in the ordinary course of their business activities, the underwriters and their affiliates may make or hold a broad array of investments and actively trade debt and equity securities (or related derivative securities) and financial instruments (including bank loans) for their own account and for the accounts of their customers. Such investments and securities activities may involve securities and/or instruments of ours or our affiliates. The underwriters and their affiliates may also make investment recommendations and/or publish or express independent research views in respect of such securities or financial instruments and may hold, or recommend to clients that they acquire, long and/or short positions in such securities and instruments.
Reserved Share Program
At our request, the underwriters have reserved for sale, at the initial public offering price, up to 5% of the shares offered by this prospectus for sale to some of our directors, officers, employees, friends, family, customers and related persons. If these persons purchase reserved shares, it will reduce the number of shares available for sale to the general public. Any reserved shares that are not so purchased will be offered by the underwriters to the general public on the same terms as the other shares offered by this prospectus.
Notice to Prospective Investors in the European Economic Area
In relation to each Member State of the European Economic Area, each, a Relevant Member State, no offer of shares may be made to the public in that Relevant Member State other than:
| A. | to any legal entity which is a qualified investor as defined in the Prospectus Directive; |
| B. | to fewer than 100 or, if the Relevant Member State has implemented the relevant provision of the 2010 PD Amending Directive, 150, natural or legal persons (other than qualified investors as defined in the Prospectus Directive), as permitted under the Prospectus Directive, subject to obtaining the prior consent of the representatives; or |
| C. | in any other circumstances falling within Article 3(2) of the Prospectus Directive, |
provided that no such offer of shares shall require us or the representatives to publish a prospectus pursuant to Article 3 of the Prospectus Directive or supplement a prospectus pursuant to Article 16 of the Prospectus Directive.
Each person in a Relevant Member State who initially acquires any shares or to whom any offer is made will be deemed to have represented, acknowledged and agreed that it is a “qualified investor” within the meaning of the law in that Relevant Member State implementing Article 2(1)(e) of the Prospectus Directive. In the case of any shares being offered to a financial intermediary as that term is used in Article 3(2) of the Prospectus Directive, each such financial intermediary will be deemed to have represented, acknowledged and agreed that the shares acquired by it in the offer have not been acquired on a non-discretionary basis on behalf of, nor have they been acquired with a view to their offer or resale to, persons in circumstances which may give rise to an offer of any shares to the public other than their offer or resale in a Relevant Member State to qualified investors as so defined or in circumstances in which the prior consent of the representatives has been obtained to each such proposed offer or resale.
212
Table of Contents
We and the representatives and their affiliates will rely upon the truth and accuracy of the foregoing representations, acknowledgements and agreements.
This prospectus has been prepared on the basis that any offer of shares in any Relevant Member State will be made pursuant to an exemption under the Prospectus Directive from the requirement to publish a prospectus for offers of shares. Accordingly any person making or intending to make an offer in that Relevant Member State of shares which are the subject of the offering contemplated in this prospectus may only do so in circumstances in which no obligation arises for us or any of the underwriters to publish a prospectus pursuant to Article 3 of the Prospectus Directive in relation to such offer. Neither we nor the underwriters have authorized, nor do we or they authorize, the making of any offer of shares in circumstances in which an obligation arises for us or the underwriters to publish a prospectus for such offer.
For the purpose of the above provisions, the expression “an offer to the public” in relation to any shares in any Relevant Member State means the communication in any form and by any means of sufficient information on the terms of the offer and the shares to be offered so as to enable an investor to decide to purchase or subscribe the shares, as the same may be varied in the Relevant Member State by any measure implementing the Prospectus Directive in the Relevant Member State and the expression “Prospectus Directive” means Directive 2003/71/EC (including the 2010 PD Amending Directive, to the extent implemented in the Relevant Member States) and includes any relevant implementing measure in the Relevant Member State and the expression “2010 PD Amending Directive” means Directive 2010/73/EU.
Notice to Prospective Investors in the United Kingdom
In addition, in the United Kingdom, this document is being distributed only to, and is directed only at, and any offer subsequently made may only be directed at persons who are “qualified investors” (as defined in the Prospectus Directive) (i) who have professional experience in matters relating to investments falling within Article 19 (5) of the Financial Services and Markets Act 2000 (Financial Promotion) Order 2005, as amended, or the Order, and/or (ii) who are high net worth companies (or persons to whom it may otherwise be lawfully communicated) falling within Article 49(2)(a) to (d) of the Order, which persons together we refer to in this prospectus as “relevant persons.” This document must not be acted on or relied on in the United Kingdom by persons who are not relevant persons. In the United Kingdom, any investment or investment activity to which this document relates is only available to, and will be engaged in with, relevant persons.
Notice to Prospective Investors in Switzerland
The shares may not be publicly offered in Switzerland and will not be listed on the SIX Swiss Exchange, or SIX, or on any other stock exchange or regulated trading facility in Switzerland. This document has been prepared without regard to the disclosure standards for issuance prospectuses under art. 652a or art. 1156 of the Swiss Code of Obligations or the disclosure standards for listing prospectuses under art. 27 ff. of the SIX Listing Rules or the listing rules of any other stock exchange or regulated trading facility in Switzerland. Neither this document nor any other offering or marketing material relating to the shares or the offering may be publicly distributed or otherwise made publicly available in Switzerland.
Neither this document nor any other offering or marketing material relating to the offering, us or our common stock have been or will be filed with or approved by any Swiss regulatory authority. In particular, this document will not be filed with, and the offer of shares of our common stock will not be supervised by, the Swiss Financial Market Supervisory Authority FINMA, or FINMA, and the offer of our common stock has not been and will not be authorized under the Swiss Federal Act on Collective Investment Schemes, or CISA. The investor protection afforded to acquirers of interests in collective investment schemes under the CISA does not extend to acquirers of shares of our common stock.
213
Table of Contents
Notice to Prospective Investors in the Dubai International Financial Centre
This prospectus relates to an Exempt Offer in accordance with the Offered Securities Rules of the Dubai Financial Services Authority, or DFSA. This prospectus is intended for distribution only to persons of a type specified in the Offered Securities Rules of the DFSA. It must not be delivered to, or relied on by, any other person. The DFSA has no responsibility for reviewing or verifying any documents in connection with Exempt Offers. The DFSA has not approved this prospectus nor taken steps to verify the information set forth herein and has no responsibility for the prospectus. The shares to which this prospectus relates may be illiquid and/or subject to restrictions on their resale. Prospective purchasers of the shares offered should conduct their own due diligence on the shares. If you do not understand the contents of this prospectus you should consult an authorized financial advisor.
Notice to Prospective Investors in Australia
No placement document, prospectus, product disclosure statement or other disclosure document has been lodged with the Australian Securities and Investments Commission, or ASIC, in relation to the offering. This prospectus does not constitute a prospectus, product disclosure statement or other disclosure document under the Corporations Act 2001 (Cth), or the Corporations Act, and does not purport to include the information required for a prospectus, product disclosure statement or other disclosure document under the Corporations Act.
Any offer in Australia of the shares may only be made to persons, which we refer to in this prospectus as the Exempt Investors, who are “sophisticated investors” (within the meaning of section 708(8) of the Corporations Act), “professional investors” (within the meaning of section 708(11) of the Corporations Act) or otherwise pursuant to one or more exemptions contained in section 708 of the Corporations Act so that it is lawful to offer the shares without disclosure to investors under Chapter 6D of the Corporations Act.
The shares applied for by Exempt Investors in Australia must not be offered for sale in Australia in the period of 12 months after the date of allotment under the offering, except in circumstances where disclosure to investors under Chapter 6D of the Corporations Act would not be required pursuant to an exemption under section 708 of the Corporations Act or otherwise or where the offer is pursuant to a disclosure document which complies with Chapter 6D of the Corporations Act. Any person acquiring shares must observe such Australian on-sale restrictions.
This prospectus contains general information only and does not take account of the investment objectives, financial situation or particular needs of any particular person. It does not contain any securities recommendations or financial product advice. Before making an investment decision, investors need to consider whether the information in this prospectus is appropriate to their needs, objectives and circumstances, and, if necessary, seek expert advice on those matters.
Notice to Prospective Investors in Hong Kong
The shares have not been offered or sold and will not be offered or sold in Hong Kong, by means of any document, other than (a) to “professional investors” as defined in the Securities and Futures Ordinance (Cap. 571) of Hong Kong and any rules made under that Ordinance; or (b) in other circumstances which do not result in the document being a “prospectus” as defined in the Companies Ordinance (Cap. 32) of Hong Kong or which do not constitute an offer to the public within the meaning of that Ordinance. No advertisement, invitation or document relating to the shares has been or may be issued or has been or may be in the possession of any person for the purposes of issue, whether in Hong Kong or elsewhere, which is directed at, or the contents of which are likely to be accessed or read by, the public of Hong Kong (except if permitted to do so under the securities laws of Hong Kong) other than with respect to shares which are or are intended to be disposed of only to persons outside Hong Kong or only to “professional investors” as defined in the Securities and Futures Ordinance and any rules made under that Ordinance.
214
Table of Contents
Notice to Prospective Investors in Japan
The shares have not been and will not be registered under the Financial Instruments and Exchange Law of Japan (Law No. 25 of 1948, as amended) and, accordingly, will not be offered or sold, directly or indirectly, in Japan, or for the benefit of any Japanese Person or to others for re-offering or resale, directly or indirectly, in Japan or to any Japanese Person, except in compliance with all applicable laws, regulations and ministerial guidelines promulgated by relevant Japanese governmental or regulatory authorities in effect at the relevant time. For the purposes of this paragraph, “Japanese Person” shall mean any person resident in Japan, including any corporation or other entity organized under the laws of Japan.
Notice to Prospective Investors in Singapore
This prospectus has not been registered as a prospectus with the Monetary Authority of Singapore. Accordingly, this prospectus and any other document or material in connection with the offer or sale, or invitation for subscription or purchase, of shares may not be circulated or distributed, nor may the shares be offered or sold, or be made the subject of an invitation for subscription or purchase, whether directly or indirectly, to persons in Singapore other than (i) to an institutional investor under Section 274 of the Securities and Futures Act, Chapter 289 of Singapore, or the SFA, (ii) to a relevant person pursuant to Section 275(1), or any person pursuant to Section 275(1A), and in accordance with the conditions specified in Section 275, of the SFA, or (iii) otherwise pursuant to, and in accordance with the conditions of, any other applicable provision of the SFA.
Where the shares are subscribed or purchased under Section 275 of the SFA by a relevant person which is:
| (a) | a corporation (which is not an accredited investor (as defined in Section 4A of the SFA)) the sole business of which is to hold investments and the entire share capital of which is owned by one or more individuals, each of whom is an accredited investor; or |
| (b) | a trust (where the trustee is not an accredited investor) whose sole purpose is to hold investments and each beneficiary of the trust is an individual who is an accredited investor, |
securities (as defined in Section 239(1) of the SFA) of that corporation or the beneficiaries’ rights and interest (howsoever described) in that trust shall not be transferred within six months after that corporation or that trust has acquired the shares pursuant to an offer made under Section 275 of the SFA except:
| (a) | to an institutional investor or to a relevant person defined in Section 275(2) of the SFA, or to any person arising from an offer referred to in Section 275(1A) or Section 276(4)(i)(B) of the SFA; |
| (b) | where no consideration is or will be given for the transfer; |
| (c) | where the transfer is by operation of law; |
| (d) | as specified in Section 276(7) of the SFA; or |
| (e) | as specified in Regulation 32 of the Securities and Futures (Offers of Investments) (Shares and Debentures) Regulations 2005 of Singapore. |
215
Table of Contents
The validity of the shares of our common stock offered hereby will be passed upon for us by Sullivan & Cromwell LLP, New York, New York. Sidley Austin LLP, New York, New York, will act as counsel to the underwriters.
The consolidated financial statements of Great Western Bancorporation, Inc. at September 30, 2013 and 2012 and for each of the two years in the period ended September 30, 2013 appearing in this prospectus and registration statement have been audited by Ernst & Young LLP, independent registered public accounting firm, as set forth in their report thereon appearing elsewhere herein, and are included in reliance upon such report given on the authority of such firm as experts in accounting and auditing.
WHERE YOU CAN FIND MORE INFORMATION
This prospectus, which constitutes a part of a registration statement on Form S-1 filed with the SEC, does not contain all of the information set forth in the registration statement and the related exhibits and schedules. Some items are omitted in accordance with the rules and regulations of the SEC. Accordingly, we refer you to the complete registration statement, including its exhibits and schedules, for further information about us and the shares of common stock to be sold in this offering. Statements or summaries in this prospectus as to the contents of any contract or other document referred to in this prospectus are not necessarily complete and, where that contract or document is filed as an exhibit to the registration statement, each statement or summary is qualified in all respects by reference to the exhibit to which the reference relates. You may read and copy the registration statement, including the exhibits and schedules to the registration statement, at the SEC’s Public Reference Room at 100 F Street, N.E., Room 1580, Washington, D.C. 20549. Information about the operation of the Public Reference Room may be obtained by calling the SEC at 1-800-SEC-0330. Our filings with the SEC, including the registration statement, are also available to you for free on the SEC’s Internet website at www.sec.gov.
Upon completion of the offering, we will become subject to the informational and reporting requirements of the Exchange Act and, in accordance with those requirements, will file reports and proxy and information statements with the SEC. You will be able to inspect and copy these reports and proxy and information statements and other information at the addresses set forth above. We intend to furnish to our stockholders our annual reports containing our audited consolidated financial statements certified by an independent public accounting firm.
216
Table of Contents
INDEX TO CONSOLIDATED FINANCIAL STATEMENTS
Great Western Bancorporation, Inc.
F-1
Table of Contents
Report of Independent Registered Public Accounting Firm
The Board of Directors and Shareholder of
Great Western Bancorporation, Inc.
We have audited the accompanying consolidated balance sheets of Great Western Bancorporation, Inc. as of September 30, 2013 and 2012, and the related consolidated statements of comprehensive income, stockholder’s equity and cash flows for each of the two years in the period ended September 30, 2013. These financial statements are the responsibility of the Company’s management. Our responsibility is to express an opinion on these financial statements based on our audits.
We conducted our audits in accordance with the standards of the Public Company Accounting Oversight Board (United States). Those standards require that we plan and perform the audit to obtain reasonable assurance about whether the financial statements are free of material misstatement. We were not engaged to perform an audit of the Company’s internal control over financial reporting. Our audits included consideration of internal control over financial reporting as a basis for designing audit procedures that are appropriate in the circumstances, but not for the purpose of expressing an opinion on the effectiveness of the Company’s internal control over financial reporting. Accordingly, we express no such opinion. An audit also includes examining, on a test basis, evidence supporting the amounts and disclosures in the financial statements, assessing the accounting principles used and significant estimates made by management, and evaluating the overall financial statement presentation. We believe that our audits provide a reasonable basis for our opinion.
In our opinion, the financial statements referred to above present fairly, in all material respects, the consolidated financial position of Great Western Bancorporation, Inc. at September 30, 2013 and 2012, and the consolidated results of its operations and its cash flows for each of the two years in the period ended September 30, 2013, in conformity with U.S. generally accepted accounting principles.
/s/ Ernst & Young LLP
Minneapolis, Minnesota
July 18, 2014
F-2
Table of Contents
GREAT WESTERN BANCORPORATION, INC.
Consolidated Balance Sheets
(In Thousands, Except Share and Per Share Data)
| September 30, | ||||||||
| 2013 | 2012 | |||||||
| Assets |
||||||||
| Cash and due from banks |
$ | 282,157 | $ | 255,985 | ||||
| Securities |
1,480,449 | 1,581,875 | ||||||
| Investment in affiliates |
1,683 | 1,683 | ||||||
| Loans, net of allowance for loan losses of $55,864 and $71,878 in 2013 and 2012, respectively (includes $347,408 and $548,780 of loans covered by FDIC loss share agreements in 2013 and 2012, respectively, $841,862 and $688,799 of loans and written loan commitments at fair value under the fair value option in 2013 and 2012, respectively, and $8,271 and $29,268 of loans held for sale in 2013 and 2012, respectively) |
6,306,809 | 6,066,696 | ||||||
| Premises and equipment |
114,380 | 127,556 | ||||||
| Accrued interest receivable |
41,065 | 40,736 | ||||||
| Other repossessed property (includes $24,412 and $44,332 of property covered under FDIC loss share agreements in 2013 and 2012, respectively) |
57,422 | 68,526 | ||||||
| FDIC indemnification asset |
45,690 | 68,662 | ||||||
| Goodwill |
697,807 | 697,807 | ||||||
| Core deposits and other intangibles |
30,444 | 49,745 | ||||||
| Net deferred tax assets |
32,626 | 4,998 | ||||||
| Other assets |
43,726 | 43,983 | ||||||
|
|
|
|
|
|||||
| Total assets |
$ | 9,134,258 | $ | 9,008,252 | ||||
|
|
|
|
|
|||||
| Liabilities and stockholder’s equity |
||||||||
| Deposits: |
||||||||
| Noninterest-bearing |
$ | 1,199,427 | $ | 1,076,437 | ||||
| Interest-bearing |
5,748,781 | 5,808,078 | ||||||
|
|
|
|
|
|||||
| Total deposits |
6,948,208 | 6,884,515 | ||||||
| Securities sold under agreements to repurchase |
217,562 | 235,572 | ||||||
| FHLB advances and other borrowings |
390,607 | 305,621 | ||||||
| Related party notes payable |
41,295 | 41,295 | ||||||
| Subordinated debentures |
56,083 | 56,083 | ||||||
| Fair value of derivatives |
1,526 | 43,117 | ||||||
| Accrued interest payable |
6,790 | 11,460 | ||||||
| Income tax payable |
12,390 | 5,629 | ||||||
| Accrued expenses and other liabilities |
42,583 | 36,397 | ||||||
|
|
|
|
|
|||||
| Total liabilities |
7,717,044 | 7,619,689 | ||||||
| Stockholder’s equity |
||||||||
| Common stock, $1 par value, authorized 250,000 shares; issued and outstanding 2013 and 2012—198,731 shares |
199 | 199 | ||||||
| Additional paid-in capital |
1,260,504 | 1,260,504 | ||||||
| Retained earnings |
163,592 | 108,749 | ||||||
| Accumulated other comprehensive income (loss) |
(7,081 | ) | 19,111 | |||||
|
|
|
|
|
|||||
| Total stockholder’s equity |
1,417,214 | 1,388,563 | ||||||
|
|
|
|
|
|||||
| Total liabilities and stockholder’s equity |
$ | 9,134,258 | $ | 9,008,252 | ||||
|
|
|
|
|
|||||
See accompanying notes.
F-3
Table of Contents
GREAT WESTERN BANCORPORATION, INC.
Consolidated Statements of Comprehensive Income
(In Thousands, Except Share and Per Share Data)
| Year Ended September 30, | ||||||||
| 2013 | 2012 | |||||||
| Interest and dividend income |
||||||||
| Loans |
$ | 264,333 | $ | 310,182 | ||||
| Taxable securities |
28,552 | 32,581 | ||||||
| Nontaxable securities |
127 | 180 | ||||||
| Dividends on securities |
909 | 1,030 | ||||||
| Federal funds sold and other |
336 | 331 | ||||||
|
|
|
|
|
|||||
| Total interest and dividend income |
294,257 | 344,304 | ||||||
|
|
|
|
|
|||||
| Interest expense |
||||||||
| Deposits |
33,117 | 44,416 | ||||||
| Securities sold under agreements to repurchase |
644 | 1,014 | ||||||
| FHLB advances and other borrowings |
3,103 | 3,098 | ||||||
| Related party notes payable |
950 | 1,007 | ||||||
| Subordinated debentures and other |
1,347 | 1,436 | ||||||
|
|
|
|
|
|||||
| Total interest expense |
39,161 | 50,971 | ||||||
|
|
|
|
|
|||||
| Net interest income |
255,096 | 293,333 | ||||||
| Provision for loan losses |
11,574 | 30,145 | ||||||
|
|
|
|
|
|||||
| Net interest income after provision for loan losses |
243,522 | 263,188 | ||||||
| Noninterest income |
||||||||
| Service charges and other fees |
41,692 | 38,937 | ||||||
| Net gain on sale of loans |
13,724 | 11,794 | ||||||
| Casualty insurance commissions |
1,426 | 1,383 | ||||||
| Investment center income |
3,137 | 1,847 | ||||||
| Net gain on sale of securities |
917 | 7,305 | ||||||
| Trust department income |
3,545 | 3,241 | ||||||
| Net gain from sale of repossessed property and other assets |
2,788 | 6,822 | ||||||
| Gain on acquisition of business |
— | 3,950 | ||||||
| Other |
10,463 | 13,696 | ||||||
|
|
|
|
|
|||||
| Total noninterest income |
77,692 | 88,975 | ||||||
|
|
|
|
|
|||||
F-4
Table of Contents
GREAT WESTERN BANCORPORATION, INC.
Consolidated Statements of Comprehensive Income
(In Thousands, Except Share and Per Share Data)
| Year Ended September 30, | ||||||||
| 2013 | 2012 | |||||||
| Noninterest expense |
||||||||
| Salaries and employee benefits |
$ | 100,660 | $ | 97,689 | ||||
| Occupancy expenses, net |
18,532 | 17,366 | ||||||
| Data processing |
18,980 | 15,270 | ||||||
| Equipment expenses |
4,518 | 5,438 | ||||||
| Advertising |
6,267 | 8,169 | ||||||
| Communication expenses |
4,609 | 4,826 | ||||||
| Professional fees |
12,547 | 13,049 | ||||||
| Derivatives, net (gain) loss |
(40,305 | ) | 19,369 | |||||
| Amortization of core deposits and other intangibles |
19,290 | 19,646 | ||||||
| Other |
25,975 | 34,188 | ||||||
|
|
|
|
|
|||||
| Total noninterest expense |
171,073 | 235,010 | ||||||
|
|
|
|
|
|||||
| Income before income taxes |
150,141 | 117,153 | ||||||
| Provision for income taxes |
53,898 | 44,158 | ||||||
|
|
|
|
|
|||||
| Net income |
$ | 96,243 | $ | 72,995 | ||||
|
|
|
|
|
|||||
| Other comprehensive income (loss)—change in net unrealized gain (loss) on securities available-for-sale (net of deferred income tax (expense) benefit of $15,376 and $(1,502) in 2013 and 2012, respectively) |
(26,192 | ) | 2,569 | |||||
|
|
|
|
|
|||||
| Comprehensive income |
$ | 70,051 | $ | 75,564 | ||||
|
|
|
|
|
|||||
| Earnings per common share |
||||||||
| Weighted average shares outstanding |
198,731 | 198,731 | ||||||
| Earnings per share |
$ | 484.29 | $ | 367.31 | ||||
| Dividends per share |
||||||||
| Dividends issued |
$ | 41,400 | $ | 41,800 | ||||
| Dividends per share |
$ | 208.32 | $ | 210.34 | ||||
See accompanying notes.
F-5
Table of Contents
GREAT WESTERN BANCORPORATION, INC.
Consolidated Statements of Stockholder’s Equity
(In Thousands, Except Share and Per Share Data)
Years Ended September 30, 2013 and 2012
| Comprehensive Income |
Common Stock Par Value |
Additional Paid-in Capital |
Retained Earnings |
Accumulated Other Comprehensive Income (Loss) |
Total | |||||||||||||||||||
| Balance, September 30, 2011 |
$ | 199 | $ | 1,260,504 | $ | 77,554 | $ | 16,542 | $ | 1,354,799 | ||||||||||||||
| Net income |
$ | 72,995 | — | — | 72,995 | — | 72,995 | |||||||||||||||||
| Other comprehensive income, net of tax: |
||||||||||||||||||||||||
| Net change in net unrealized gain (loss) on securities available for sale |
2,569 | — | — | — | 2,569 | 2,569 | ||||||||||||||||||
|
|
|
|||||||||||||||||||||||
| Comprehensive income |
$ | 75,564 | ||||||||||||||||||||||
|
|
|
|||||||||||||||||||||||
| Cash dividends paid: |
||||||||||||||||||||||||
| Common stock, $100.64 per share |
— | — | (20,000 | ) | — | (20,000 | ) | |||||||||||||||||
| Common stock, $109.70 per share |
— | — | (21,800 | ) | — | (21,800 | ) | |||||||||||||||||
|
|
|
|
|
|
|
|
|
|
|
|||||||||||||||
| Balance, September 30, 2012 |
199 | 1,260,504 | 108,749 | 19,111 | 1,388,563 | |||||||||||||||||||
| Net income |
$ | 96,243 | — | — | 96,243 | — | 96,243 | |||||||||||||||||
| Other comprehensive income, net of tax: |
||||||||||||||||||||||||
| Net change in net unrealized gain (loss) on securities available for sale |
(26,192 | ) | — | — | — | (26,192 | ) | (26,192 | ) | |||||||||||||||
|
|
|
|||||||||||||||||||||||
| Comprehensive income |
$ | 70,051 | ||||||||||||||||||||||
|
|
|
|||||||||||||||||||||||
| Cash dividends paid: |
||||||||||||||||||||||||
| Common stock, $97.62 per share |
— | — | (19,400 | ) | — | (19,400 | ) | |||||||||||||||||
| Common stock, $110.71 per share |
— | — | (22,000 | ) | — | (22,000 | ) | |||||||||||||||||
|
|
|
|
|
|
|
|
|
|
|
|||||||||||||||
| Balance, September 30, 2013 |
$ | 199 | $ | 1,260,504 | $ | 163,592 | $ | (7,081 | ) | $ | 1,417,214 | |||||||||||||
|
|
|
|
|
|
|
|
|
|
|
|||||||||||||||
See accompanying notes.
F-6
Table of Contents
GREAT WESTERN BANCORPORATION, INC.
Consolidated Statements of Cash Flows
(In Thousands)
| Year Ended September 30, | ||||||||
| 2013 | 2012 | |||||||
| Operating activities |
||||||||
| Net income |
$ | 96,243 | $ | 72,995 | ||||
| Adjustments to reconcile net income to net cash provided by operating activities: |
||||||||
| Depreciation and amortization |
43,764 | 47,333 | ||||||
| Net gain on sale of securities |
(917 | ) | (7,305 | ) | ||||
| Net gain on sale of loans |
(13,724 | ) | (11,794 | ) | ||||
| Net loss on sale of premises and equipment |
632 | — | ||||||
| Net gain from sale of repossessed assets and other assets |
(2,788 | ) | (6,822 | ) | ||||
| Gain on acquisition of business |
— | (3,950 | ) | |||||
| Provision for loan losses |
11,574 | 30,145 | ||||||
| Provision for repossessed assets |
4,028 | 13,820 | ||||||
| Proceeds from FDIC indemnification claims |
5,284 | 57,090 | ||||||
| Originations of residential real estate loans held-for-sale |
(429,009 | ) | (420,491 | ) | ||||
| Proceeds from sales of residential real estate loans held-for-sale |
463,730 | 428,797 | ||||||
| Net deferred income taxes |
(6,088 | ) | (14,719 | ) | ||||
| Changes in: |
||||||||
| Accrued interest receivable |
(329 | ) | (3,326 | ) | ||||
| Other assets |
(2,931 | ) | 15,005 | |||||
| FDIC indemnification asset |
17,689 | 573 | ||||||
| FDIC clawback liability |
1,202 | (1,284 | ) | |||||
| Accrued interest payable and other liabilities |
(35,519 | ) | 21,653 | |||||
|
|
|
|
|
|||||
| Net cash provided by operating activities |
152,841 | 217,720 | ||||||
|
|
|
|
|
|||||
| Investing activities |
||||||||
| Purchase of securities available for sale |
(520,929 | ) | (874,857 | ) | ||||
| Proceeds from sales and maturities of securities available for sale |
567,931 | 858,709 | ||||||
| Proceeds from sale of mortgage servicing rights |
— | 510 | ||||||
| Net increase in loans |
(308,696 | ) | (753,714 | ) | ||||
| Purchase of premises and equipment |
(3,318 | ) | (12,451 | ) | ||||
| Proceeds from sale of premises and equipment |
5,163 | 2,567 | ||||||
| Proceeds from sale of other assets |
45,877 | 118,834 | ||||||
| Purchase of FHLB stock |
(1,967 | ) | (6,716 | ) | ||||
| Business acquisitions, net of cash acquired |
— | (23,014 | ) | |||||
|
|
|
|
|
|||||
| Net cash used in investing activities |
(215,939 | ) | (690,132 | ) | ||||
|
|
|
|
|
|||||
| Financing activities |
||||||||
| Net increase in deposits |
63,693 | 254,100 | ||||||
| Net increase (decrease) in securities sold under agreements to repurchase |
(18,009 | ) | 20,923 | |||||
| Proceeds from FHLB advances and other borrowings |
84,986 | 132,078 | ||||||
| Net change in note payable to NAB |
— | (7,000 | ) | |||||
| Dividends paid |
(41,400 | ) | (41,800 | ) | ||||
|
|
|
|
|
|||||
| Net cash provided by financing activities |
89,270 | 358,301 | ||||||
|
|
|
|
|
|||||
| Net change in cash and due from banks |
26,172 | (114,111 | ) | |||||
| Cash and due from banks, beginning of year |
255,985 | 370,096 | ||||||
|
|
|
|
|
|||||
| Cash and due from banks, end of year |
$ | 282,157 | $ | 255,985 | ||||
|
|
|
|
|
|||||
| Supplemental disclosures of cash flows information |
||||||||
| Cash payments for interest |
$ | 43,832 | $ | 51,502 | ||||
|
|
|
|
|
|||||
| Cash payments for income taxes |
$ | 58,599 | $ | 51,249 | ||||
|
|
|
|
|
|||||
| Supplemental schedules of noncash investing and financing activities |
||||||||
| Loans transferred to repossessed assets and other assets |
$ | (28,980 | ) | $ | (62,158 | ) | ||
|
|
|
|
|
|||||
See accompanying notes.
F-7
Table of Contents
GREAT WESTERN BANCORPORATION, INC.
Notes to Consolidated Financial Statements
1. Nature of Operations and Summary of Significant Accounting Policies
Nature of Operations
Great Western Bancorporation, Inc. (the “Company”) is a bank holding company organized under the laws of Iowa. The primary business of the Company is ownership of its wholly owned subsidiary, Great Western Bank (the “Bank”). The Bank is a full-service regional bank focused on relationship-based business and agri-business banking in Arizona, Colorado, Iowa, Kansas, Missouri, Nebraska, and South Dakota. The Company and the Bank are subject to the regulation of certain federal and/or state agencies and undergo periodic examinations by those regulatory authorities. Substantially all of the Company’s income is generated from banking operations. The Company is a wholly owned indirect subsidiary of National Australia Bank Limited (“NAB”).
Segment Reporting
The “Segment Reporting” topic of the Financial Accounting Standards Board (“FASB”) Accounting Standards Codification (“ASC”) requires that public companies report certain information about operating segments. It also requires that public companies report certain information about their products and services, the geographic areas in which they operate, and their major customers. The Company is a holding company for a regional bank, which offers a wide array of products and services to its customers. Pursuant to its banking strategy, emphasis is placed on building relationships with its customers, as opposed to building specific lines of business. As a result, the Company is not organized and does not allocate resources around discernible lines of business or geographies and prefers to work as an integrated unit to customize solutions for its customers, with business line and geographic emphasis and product offerings changing over time as needs and demands change. Therefore, the Company only reports one segment, which is consistent with the Company’s preparation of financial information that is evaluated regularly by management in deciding how to allocate resources and assess performance.
Principles of Consolidation
The accompanying consolidated financial statements include the accounts and results of the Company and its subsidiaries after elimination of all significant intercompany accounts and transactions.
Basis of Presentation and Use of Estimates
The accompanying consolidated financial statements are prepared in accordance with accounting principles generally accepted in the United States (“U.S. GAAP”). U.S. GAAP requires management to make estimates and assumptions that affect the amounts reported in the consolidated financial statements and accompanying notes. Actual results could differ from those estimates.
Certain items in prior periods have been reclassified to conform to the current presentation.
Subsequent Events
The Company evaluated subsequent events through the date its consolidated financial statements were issued. There were no material events that would require recognition in the 2013 or 2012 consolidated financial statements or disclosure in the notes to the consolidated financial statements.
F-8
Table of Contents
GREAT WESTERN BANCORPORATION, INC.
Notes to Consolidated Financial Statements
Business Combinations
The Company accounts for business combinations under the acquisition method of accounting in accordance with ASC 805, “Business Combinations” (“ASC 805”). The Company recognizes the fair value of the assets acquired and liabilities assumed, immediately expenses transaction costs and accounts for restructuring plans separately from the business combination. There is no separate recognition of the acquired allowance for loan losses on the acquirer’s balance sheet as credit related factors are incorporated directly into the fair value of the loans recorded at the acquisition date. The excess of the cost of the acquisition over the fair value of the net tangible and intangible assets acquired is recorded as goodwill. Alternatively, a bargain purchase gain is recorded equal to the amount by which the fair value of assets purchased exceeds the fair value of liabilities assumed and consideration paid.
Results of operations of the acquired business are included in the consolidated statements of comprehensive income from the effective date of acquisition.
Cash and Due From Banks
For purposes of the consolidated statements of cash flows, management has defined cash and cash equivalents to include cash on hand, amounts due from banks (including cash items in process of clearing), and amounts held at other financial institutions with an initial maturity of 90 days or less.
Securities
The Company classifies securities upon purchase in one of three categories: trading, held-to-maturity, or available-for-sale. Debt and equity securities held for resale are classified as trading. Debt securities for which the Company has the ability and positive intent to hold until maturity are classified as held-to-maturity. All other securities are classified as available-for-sale as they may be sold prior to maturity in response to changes in the Company’s interest rate risk profile, funding needs, demand for collateralized deposits by public entities or other reasons.
Held-to-maturity securities are stated at amortized cost, which represents actual cost adjusted for premium amortization and discount accretion. Available-for-sale securities are stated at fair value, with unrealized gains and losses, net of related taxes, included in stockholder’s equity as a component of accumulated other comprehensive income (loss).
Trading securities are stated at fair value. Realized and unrealized gains and losses from sales and fair value adjustments of trading securities are included in other noninterest income in the consolidated statements of comprehensive income.
Declines in the fair value of investment securities available for sale (with certain exceptions for debt securities noted below) that are deemed to be other-than-temporary are recognized in earnings as a realized loss, and a new cost basis for the securities is established. In evaluating other-than-temporary impairment, management considers the length of time and extent to which the fair value has been less than amortized cost, the financial condition and near-term prospects of the issuer, and the intent and ability of the Company to retain its investment in the issuer for a period of time sufficient to allow for any anticipated recovery in fair value in the near term. Declines in the fair value of debt securities below amortized cost are deemed to be other-than-temporary in circumstances where: (1) the Company has the intent to sell a security; (2) it is more likely than not that the Company will be required to sell the security before recovery of its amortized cost basis; or (3) the Company does not expect to recover the entire amortized cost basis of the security. If the Company intends to sell a security or if it is more likely than not
F-9
Table of Contents
GREAT WESTERN BANCORPORATION, INC.
Notes to Consolidated Financial Statements
that the Company will be required to sell the security before recovery, an other-than-temporary impairment loss is recognized in earnings equal to the difference between the security’s amortized cost basis and its fair value. If the Company does not intend to sell the security or it is not more likely than not that it will be required to sell the security before recovery, the other-than-temporary impairment write-down is separated into an amount representing credit loss, which is recognized in earnings, and an amount related to all other factors, which is recognized in other comprehensive income.
Interest and dividends, including amortization of premiums and accretion of discounts, are recognized as interest income when earned. Realized gains and losses on sales (using the specific identification method) and declines in value judged to be other-than-temporary are included in noninterest income in the consolidated statements of comprehensive income.
Federal Home Loan Bank Stock
Investments in the Federal Home Loan Bank (“FHLB”) stock are restricted as to redemption and are carried at cost. Investments in FHLB stock are reviewed regularly for possible other-than-temporary impairment, and the cost basis of this investment is reduced by any declines in value determined to be other-than-temporary.
Loans
The Company’s accounting method for loans differs depending on whether the loans were originated or purchased and, for purchased loans, whether the loans were acquired at a discount related to evidence of credit deterioration since date of origination.
Originated Loans
Loans that management has the intent and ability to hold for the foreseeable future, or until maturity or pay-off, generally are reported at their outstanding principal balance, adjusted for charge-offs, the allowance for loan losses, and any unamortized deferred fees or costs.
Interest income on loans is accrued daily on the outstanding balances. Accrual of interest is discontinued when management believes, after considering collection efforts and other factors, the borrower’s financial condition is such that collection of interest is doubtful. Generally, when loans are placed on nonaccrual status, interest receivable is reversed against interest income in the current period. Interest payments received thereafter are applied as a reduction to the remaining principal balance as long as concern exists as to the ultimate collection of the principal. Loans are removed from nonaccrual status when they become current as to both principal and interest and concern no longer exists as to the collectability of principal and interest.
The Company has elected to measure certain long-term loans and written loan commitments at fair value to assist in managing interest rate risk for longer-term loans. Fair value loans are fixed-rate loans having original maturities of 5 years or greater (typically between 5 and 15 years) to our business and agribusiness banking customers to assist them in facilitating their risk management strategies. The fair value option was elected upon the origination or acquisition of these loans and written loan commitments. Interest income is recognized in the same manner on loans reported at fair value as on non-fair value loans, except in regard to origination fees and costs which are recognized immediately upon closing. The changes in fair value of long-term loans and written loan commitments at fair value are reported in loan interest income.
F-10
Table of Contents
GREAT WESTERN BANCORPORATION, INC.
Notes to Consolidated Financial Statements
For loans held for sale, loan fees charged or received on origination, net of certain direct loan origination costs, are recognized in income when the related loan is sold. For loans held for investment, loan fees, net of certain direct loan origination costs, are deferred, and the net amount is amortized as an adjustment of the related loan’s yield. The Company is generally amortizing these amounts over the contractual lives of the loans. Commitment fees are recognized as income when received.
The Company grants commercial, agricultural, consumer, residential real estate, and other loans to customers primarily in Arizona, Colorado, Iowa, Kansas, Missouri, Nebraska, and South Dakota. The amount of collateral obtained, if deemed necessary, is based on management’s credit evaluation of the borrower. Collateral held varies but includes accounts receivable, inventory, property and equipment, residential real estate, and income-producing commercial and agricultural properties. Government guarantees are also obtained for some loans, which reduces the Company’s risk of loss.
Loans originated and intended for sale in the secondary market are carried at the lower of cost or fair value. Loans held for sale include fixed rate single-family residential mortgage loans under contract to be sold in the secondary market. In most cases, loans in this category are sold within 45 days. These loans are sold with the mortgage servicing rights released. Under limited circumstances, buyers may have recourse to return a purchased loan to the Company. Recourse conditions may include early payment default, breach of representation or warranties, or documentation deficiencies.
Fair value of loans held for sale is determined based on prevailing market prices for loans with similar characteristics, sale contract prices, or, for certain portfolios, discounted cash flow analyses. Declines in fair value below cost (and subsequent recoveries) are recognized in net gain on sale of loans. Deferred fees and costs related to these loans are not amortized but are recognized as part of the cost basis of the loan at the time it is sold. Gains or losses on sales are recognized upon delivery and included in net gain on sale of loans.
Purchased Loans
Loans acquired (non-impaired and impaired) in a business acquisition are recorded at their fair value at the acquisition date. Credit discounts are included in the determination of fair value; therefore, an allowance for loan losses is not recorded at the acquisition date.
In determining the acquisition date fair value of purchased loans with evidence of credit deterioration (“purchased impaired loans”), and in subsequent accounting, the Company generally aggregates impaired purchased consumer and certain smaller balance impaired commercial loans into pools of loans with common risk characteristics, while accounting for larger-balance impaired commercial loans individually. Expected cash flows at the acquisition date in excess of the fair value of loans are recorded as interest income over the life of the loans using a level-yield method.
Management estimates the cash flows expected to be collected at acquisition and at subsequent measurement dates using internal risk models, which incorporate the estimate of key assumptions, such as default rates, loss severity, and prepayment speeds. Subsequent to the acquisition date, decreases in cash flows over those expected at the acquisition date are recognized by recording an allowance for loan losses. Subsequent increases in cash flow over those expected at the acquisition date are recognized as reductions to allowance for loan losses to the extent impairment was previously recognized and thereafter as interest income prospectively.
For purchased loans not deemed impaired at the acquisition date, the difference between the fair value of the loans and the expected cash flows of the loans at acquisition date is recognized in interest income on a level-yield
F-11
Table of Contents
GREAT WESTERN BANCORPORATION, INC.
Notes to Consolidated Financial Statements
method over the life of the loans. Credit discounts representing the principal losses expected over the life of the loan are a component of the initial fair value. Subsequent to the purchase date, the methods utilized to estimate the required allowance for loan losses for these loans is similar to originated loans; however, the Company records a provision for loan losses only when the required allowance exceeds any remaining credit discounts.
Credit Risk Management
The Company’s strategy for credit risk management includes well-defined, centralized credit policies, uniform underwriting criteria and ongoing risk monitoring and review processes for all credit exposures. The strategy also emphasizes diversification on a geographic, industry, and customer level; regular credit examinations; and management reviews of loans exhibiting deterioration of credit quality. The credit risk management strategy also includes a credit risk assessment process that performs assessments of compliance with commercial and consumer credit policies, risk ratings, and other critical credit information. Loan decisions are documented with respect to the borrower’s business, purpose of the loan, evaluation of the repayment source, and the associated risks, evaluation of collateral, covenants and monitoring requirements, and risk rating rationale.
The Company categorizes its loan portfolio into six classes, which is the level at which it develops and documents a systematic methodology to determine the allowance for loan losses.
The Company’s six loan portfolio classes are residential real estate, commercial real estate, commercial non real estate, agriculture, consumer and other lending.
The residential real estate lending class includes loans made to consumer customers including residential mortgages, residential construction loans and home equity loans and lines. These loans are typically fixed rate loans secured by residential real estate. Home equity lines are revolving accounts giving the borrower the ability to draw and repay balances repeatedly, up to a maximum commitment, and are secured by residential real estate. Home equity lines typically have variable rate terms which are benchmarked to a prime rate. Historical loss history is the primary factor in determining the allowance for loan losses for the residential real estate lending class. Key risk characteristics relevant to residential real estate lending class loans primarily relate to the borrower’s capacity and willingness to repay and include unemployment rates and other economic factors, and customer payment history. These risk characteristics, among others, are reflected in the environmental factors considered in determining the allowance for loan losses.
The commercial real estate lending class includes loans made to small and middle market businesses, including multifamily properties. Loans in this class are secured by commercial real estate. Historical loss history and updated loan-to-value information on collateral-dependent loans are the primary factors in determining the allowance for loan losses for the commercial real estate lending class. Key risk characteristics relevant to the commercial real estate lending class include the industry and geography of the borrower’s business, purpose of the loan, repayment source, borrower’s debt capacity and financial performance, loan covenants, and nature of pledged collateral. We consider these risk characteristics in assigning risk ratings and estimating environmental factors considered in determining the allowance for loan losses.
The commercial non real estate lending class includes loans made to small and middle market businesses, and loans made to public sector customers. Loans in this class are secured by the operations and cash flows of the borrowers, and any guarantors. Historical loss history and updated loan-to-value information on collateral-dependent loans are the primary factors in determining the allowance for loan losses for the commercial non real estate lending class. Key risk characteristics relevant to the commercial non real estate lending class include the industry and geography of the borrower’s business, purpose of the loan, repayment source, borrower’s debt
F-12
Table of Contents
GREAT WESTERN BANCORPORATION, INC.
Notes to Consolidated Financial Statements
capacity and financial performance, loan covenants, and nature of pledged collateral. We consider these risk characteristics in assigning risk ratings and estimating environmental factors considered in determining the allowance for loan losses.
The agriculture lending class includes loans made to small and mid-size agricultural individuals and businesses. Loans in this class are secured by agricultural real estate, production, and cash flows, and any guarantors. Historical loss history and updated loan-to-value information on collateral-dependent loans are the primary factors in determining the allowance for loan losses for the agriculture lending class. Key risk characteristics relevant to the agriculture lending class include the geography of the borrower’s operations, commodity prices and weather patterns, purpose of the loan, repayment source, borrower’s debt capacity and financial performance, loan covenants, and nature of pledged collateral. We consider these risk characteristics in assigning risk ratings and estimating environmental factors considered in determining the allowance for loan losses.
The consumer lending class includes loans made to consumer customers including loans secured by automobiles and other installment loans, and the other lending class includes credit card loans and unsecured revolving credit lines. Historical loss history is the primary factor in determining the allowance for loan losses for the consumer and other lending classes. Key risk characteristics relevant to loans in the consumer and other lending classes primarily relate to the borrower’s capacity and willingness to repay and include unemployment rates and other economic factors, and customer payment history. These risk characteristics, among others, are reflected in the environmental factors considered in determining the allowance for loan losses.
The Company classifies all non-consumer loans by credit quality ratings. These ratings are Pass, Watch, Substandard, Doubtful, and Loss. Loans with a Pass and Watch rating represent those loans not classified on the Company’s rating scale for problem credits, with loans with a Watch rating being monitored and updated at least quarterly by management. Substandard loans are those where a well-defined weakness has been identified that may put full collection of contractual cash flows at risk. Doubtful loans are those where a well-defined weakness has been identified and a loss of contractual cash flows is known. Substandard and doubtful loans are monitored and updated monthly. All loan risk ratings are updated and monitored on a continuous basis. The Company generally does not risk rate consumer loans unless a default event such as bankruptcy or extended nonperformance takes place. Alternatively, standard credit scoring systems are used to assess credit risks of consumer loans.
Allowance for Loan Losses (“ALL”) and Unfunded Commitments
The Company maintains an allowance for loan losses at a level management believes is appropriate to reserve for credit losses inherent in our loan portfolio. The allowance for loan losses is determined based on an ongoing evaluation, driven primarily by monitoring changes in loan risk grades, delinquencies, and other credit risk indicators, which is inherently subjective.
The Company considers the uncertainty related to certain industry sectors and the extent of credit exposure to specific borrowers within the portfolio. In addition, consideration is given to concentration risks associated with the various loan portfolios and current economic conditions that might impact the portfolio. The Company also considers changes, if any, in underwriting activities, the loan portfolio composition (including product mix and geographic, industry, or customer-specific concentrations), trends in loan performance, the level of allowance coverage relative to similar banking institutions and macroeconomic factors, such as changes in unemployment rates, gross domestic product, and consumer bankruptcy filings.
All of these estimates are susceptible to significant change. Changes to the allowance for loan losses are made by charges to the provision for loan losses, which is reflected in the consolidated statements of comprehensive
F-13
Table of Contents
GREAT WESTERN BANCORPORATION, INC.
Notes to Consolidated Financial Statements
income. Loans deemed to be uncollectible are charged off against the allowance for loan losses. Recoveries of amounts previously charged-off are credited to the allowance for loan losses.
The allowance for loan losses consist of reserves for probable losses that have been identified related to specific borrowing relationships that are individually evaluated for impairment (“specific reserve”), as well as probable losses inherent in our loan portfolio that are not specifically identified (“collective reserve”).
The specific reserve relates to impaired loans. A loan is impaired when, based on current information and events, it is probable the Company will be unable to collect all amounts due (interest as well as principal) according to the contractual terms of the loan agreement. Specific reserves are determined on a loan-by-loan basis based on management’s best estimate of the Company’s exposure, given the current payment status of the loan, the present value of expected payments, and the value of any underlying collateral. Impaired loans also include loans modified in troubled debt restructurings where concessions have been granted to borrowers experiencing financial difficulties. These concessions could include a reduction in the interest rate on the loan, payment extensions, forgiveness of principal, forbearance, or other actions intended to maximize collection. Generally, the impairment related to troubled debt restructurings is measured based on the fair value of the collateral, less cost to sell, or the present value of expected payments relative to the unpaid principal balance. If the impaired loan is identified as collateral dependent, then the fair value of the collateral method of measuring the amount of the impairment is utilized. This method requires obtaining an independent appraisal of the collateral and applying a discount factor to the appraised value, if necessary, and including costs to sell.
Management’s estimate for collective reserves reflects losses incurred in the loan portfolio as of the consolidated balance sheet reporting date. Incurred loss estimates primarily are based on historical loss experience and portfolio mix. Incurred loss estimates may be adjusted to reflect current economic conditions and current portfolio trends including credit quality, concentrations, aging of the portfolio, and/or significant policy and underwriting changes.
While management uses the best information available to establish the allowance for loan losses, future adjustments may be necessary if economic conditions differ substantially from the assumptions used in performing the estimates.
Unfunded residential mortgage loan commitments entered into in connection with mortgage loans to be held for sale are considered derivatives and recorded at fair value on the consolidated balance sheets with changes in fair value recorded in other interest income. All other unfunded loan commitments are generally related to providing credit facilities to customers and are not considered derivatives. For purchased loans, the fair value of the unfunded credit commitments is considered in determination of the fair value of the loans recorded at the date of acquisition. Reserves for credit exposure on all other unfunded credit commitments are recorded in other liabilities on the consolidated balance sheets.
FDIC Indemnification Asset and Clawback Liability
In conjunction with a Federal Deposit Insurance Corporation (“FDIC”)-assisted transaction of TierOne Bank in 2010, the Company entered into two loss share agreements with the FDIC, one covering certain single family residential mortgage loans and one covering commercial loans and other assets, with claim periods ending June 2020 and June 2015, respectively. The agreements cover a portion of realized losses on loans, foreclosed real estate and certain other assets. The Company has recorded assets on the consolidated balance sheets (i.e., indemnification assets) representing estimated future amounts recoverable from the FDIC.
F-14
Table of Contents
GREAT WESTERN BANCORPORATION, INC.
Notes to Consolidated Financial Statements
Fair values of loans covered by the loss sharing agreements at the acquisition date were estimated based on projected cash flows available based on the expected probability of default, default timing and loss given default, the expected reimbursement rates (generally 80%) from the FDIC and other relevant terms of the loss sharing agreements. The initial fair value was established by discounting these expected cash flows with a market discount rate for instruments with like maturity and risk characteristics.
The loss share assets are measured separately from the related loans and foreclosed real estate and recorded as an FDIC indemnification asset on the consolidated balance sheets because they are not contractually embedded in the loans and are not transferrable with the loans should the Company choose to dispose of them. Subsequent to the acquisition date, reimbursements received from the FDIC for actual incurred losses reduce the carrying amount of the loss share assets. Reductions to expected losses on covered assets, to the extent such reductions to expected losses are the result of an improvement to the actual or expected cash flows from the covered assets, also reduce the carrying amount of the loss share assets. The rate of accretion of the indemnification asset discount included in interest income slows to mirror the accelerated accretion of the loan discount. Additional expected losses on covered assets, to the extent such expected losses result in the recognition of an allowance for loan losses, increase the carrying amount of the loss share assets. A related increase in the value of the indemnification asset up to the amount covered by the FDIC is calculated based on the reimbursement rates from the FDIC and is included in other noninterest income. The corresponding loan accretion or amortization is recorded as a component of interest income on the consolidated statements of comprehensive income. Although these assets are contractual receivables from the FDIC, there are no contractual interest rates.
As part of the loss sharing agreements, the Company also assumed a liability (“FDIC Clawback Liability”) to be paid within 45 days subsequent to the maturity or termination of the loss sharing agreements that is contingent upon actual losses incurred over the life of the agreements relative to expected losses considered in the consideration paid at acquisition date and the amount of losses reimbursed to the Company under the loss sharing agreements. The liability was recorded at fair value as of the acquisition date. The fair value was based on a discounted cash flow calculation that considered the formula defined in the loss sharing agreements and projected losses. The difference between the fair value at acquisition date and the projected losses is amortized through other noninterest expense. As projected losses and reimbursements are updated, as described above, the FDIC Clawback Liability is adjusted and a gain or loss is recorded in other noninterest expense.
Premises and Equipment
Premises and equipment are stated at cost less accumulated depreciation. Depreciation is computed principally by the straight-line method over the estimated useful lives of the assets. Costs incurred for maintenance and repairs are expensed as incurred. The range of estimated useful lives for buildings and building improvements are 10 to 40 years and 3 to 10 years for furniture and equipment.
Long-lived Asset Impairment
The Company evaluates the recoverability of the carrying value of long-lived assets whenever events or circumstances indicate the carrying amount may not be recoverable. If a long-lived asset is tested for recoverability and the undiscounted estimated future cash flows expected to result from the use and eventual disposition of the asset is less than the carrying amount of the asset, the asset’s carrying value is adjusted to fair value and an impairment loss is recognized as the amount by which the carrying amount of the long-lived asset exceeds its fair value.
No long-lived asset impairments were recognized during the years ended September 30, 2013 or 2012.
F-15
Table of Contents
GREAT WESTERN BANCORPORATION, INC.
Notes to Consolidated Financial Statements
Bank Owned Life Insurance (“BOLI”)
The carrying amount of bank owned life insurance consists of the initial premium paid plus increases in cash value less the carrying amount associated with any death benefits received, and is recorded in other assets. Death benefits paid in excess of the applicable carrying amount are recognized as income, which is exempt from income taxes.
Other Repossessed Property
Assets acquired through, or in lieu of, loan foreclosure are held for sale and are initially recorded at fair value less cost to sell at the date of foreclosure, establishing a new cost basis. Subsequent to foreclosure, valuations are periodically performed by management, and the assets are carried at the lower of carrying amount or fair value less cost to sell. Income and expenses from operations of repossessed property are included in other noninterest expense. Valuation adjustments made to repossessed properties for the years ended September 30, 2013 and 2012, totaled $4.03 million and $9.43 million, respectively, and are included in other noninterest expense.
Goodwill
Goodwill represents the cost in excess of the fair value of net assets acquired (including identifiable intangibles) in transactions accounted for as business acquisitions. Goodwill is evaluated annually for impairment. The Company performs its impairment evaluation in the fourth quarter of each fiscal year. If the implied fair value of goodwill is lower than its carrying amount, goodwill impairment is indicated and goodwill is written down to its implied fair value. Subsequent increases in goodwill are not recognized in the consolidated financial statements. No goodwill impairment was recognized during the years ended September 30, 2013 or 2012.
Core Deposits and Other Intangibles
Intangible assets consist of core deposits, brand intangible, customer relationships, and other intangibles. Core deposits represent the identifiable intangible value assigned to core deposit bases arising from purchase acquisitions. Brand intangible represents the value associated with the Bank charter. Customer relationships intangible represents the identifiable intangible value assigned to customer relationships arising from a purchase acquisition. Other intangibles represent contractual franchise arrangements under which the franchiser grants the franchisee the right to perform certain functions within a designated geographical area.
The methods and lives used to amortize intangible assets are as follows:
| Intangible |
Method |
Years | ||||
| Core deposit |
Straight-line or effective yield | 4.75 – 6.2 | ||||
| Brand intangible |
Straight-line | 15 | ||||
| Customer relationships |
Straight-line | 8.5 | ||||
| Other intangibles |
Straight-line | 5 | ||||
Intangible assets are evaluated for impairment if indicators of impairment are identified. No intangible asset impairments were recognized during the years ended September 30, 2013 or 2012.
Derivatives
The Company maintains an overall interest rate risk management strategy that permits the use of derivative instruments to modify exposure to interest rate risk. The Company enters into interest rate swap contracts to
F-16
Table of Contents
GREAT WESTERN BANCORPORATION, INC.
Notes to Consolidated Financial Statements
offset the interest rate risk associated with borrowers who lock in long-term fixed rates (greater than or equal to five years to maturity) through a fixed rate loan. These contracts do not qualify for hedge accounting. Generally, under these swaps, the Company agrees with NAB to exchange the difference between fixed-rate and floating-rate interest amounts based upon notional principal amounts. These interest rate derivative instruments are recognized as assets and liabilities on the consolidated balance sheets and measured at fair value, with changes in fair value reported in derivatives net gain or loss. Since each fixed rate loan is paired with an offsetting derivative contract, the impact to net income is minimized.
The Company enters into forward interest rate lock commitments on mortgage loans to be held for sale, which are commitments to originate loans whereby the interest rate on the loan is determined prior to funding. The Company also has corresponding forward sales contracts related to these interest rate lock commitments. Both the mortgage loan commitments and the related sales contracts are considered derivatives and are recorded at fair value with changes in fair value recorded in other interest income.
Income Taxes
The Company files a consolidated income tax return with National Americas Holdings, LLC (a wholly owned subsidiary of NAB). Income taxes are allocated pursuant to a tax-sharing arrangement, whereby the Company will pay federal and state income taxes as if it were filing on a stand-alone basis. Income tax expense includes two components: current and deferred. Current income tax expense reflects taxes to be paid or refunded for the current period by applying the provisions of the enacted tax law to the taxable income or excess of deductions over income. The Company determines deferred income taxes using the liability (or balance sheet) method. Under this method, the net deferred tax asset or liability is based on the tax effects of the differences between the book and tax basis of assets and liabilities, and enacted changes in tax rates and laws are recognized in the period in which they occur. Deferred income tax expense results from changes in deferred tax assets and liabilities between periods.
Deferred tax assets are reduced by a valuation allowance if, based on the weight of evidence available, it is more likely than not that some portion or all of a deferred tax asset will not be realized.
Liabilities related to uncertain tax positions are recognized if it is more likely than not, based on the technical merits, that the tax position will be realized or sustained upon examination. The term more likely than not means a likelihood of more than 50 percent; the terms examined and upon examination also include resolution of the related appeals or litigation processes, if any. A tax position that meets the more-likely-than-not recognition threshold is initially and subsequently measured as the largest amount of tax benefit that has a greater than 50 percent likelihood of being realized upon settlement with a taxing authority that has full knowledge of all relevant information.
The determination of whether or not a tax position has met the more-likely-than-not recognition threshold considers the facts, circumstances, and information available at the reporting date and is subject to management’s judgment.
The Company recognizes interest and/or penalties related to income tax matters in other interest and noninterest expense.
Transfers of Financial Assets
Transfers of financial assets are accounted for as sales when control over the assets has been surrendered. Control over transferred assets is deemed to be surrendered when (1) the assets have been isolated from the Company—put presumptively beyond reach of the Company and its creditors, even in bankruptcy or other receivership,
F-17
Table of Contents
GREAT WESTERN BANCORPORATION, INC.
Notes to Consolidated Financial Statements
(2) the transferee obtains the right (free of conditions that constrain it from taking advantage of that right) to pledge or exchange the transferred assets, and (3) the Company does not maintain effective control over the transferred assets through an agreement to repurchase them before their maturity or the ability to unilaterally cause the holder to return specific assets.
Securities sold under agreements to repurchase are accounted for as collateralized financing transactions and are recorded at amounts at which the securities were financed, plus accrued interest.
Revenue Recognition
The Company recognizes revenue as it is earned based on contractual terms, as transactions occur, or as services are provided and collectability is reasonably assured. Certain specific policies related to service charges and other fees include the following:
Deposit Service Charges
Service charges on deposit accounts are primarily fees related to customer overdraft events and not sufficient funds fees, net of any refunded fees, and are recognized as transactions occur and services are provided. Service charges on deposit accounts also relate to monthly fees based on minimum balances, and are earned as transactions occur and services are provided.
Interchange Fees
Interchange fees include interchange income from consumer debit card transactions processed through card association networks. Interchange income is a fee paid by a merchant bank to the card-issuing bank through the interchange network. Interchange fees are set by the card association networks and are based on cardholder purchase volumes.
Comprehensive Income
Comprehensive income consists of net income and other comprehensive income, net of applicable income taxes. Other comprehensive income consists entirely of unrealized appreciation (depreciation) on available-for-sale securities.
New Accounting Pronouncements
In December 2011, the FASB issued Accounting Standards Update (“ASU”) 2011-11, Disclosures about Offsetting Assets and Liabilities. Under the ASU, an entity is required to disclose both gross and net information about instruments and transactions eligible for offset in the balance sheet, as well as instruments and transactions subject to an agreement similar to a master netting agreement. In January 2013, the FASB released ASU 2013-01, Clarifying the Scope of Disclosures about Offsetting Assets and Liabilities, which amended ASU 2011-11 to specifically include only derivatives accounted for under Topic 815, repurchase and reverse repurchase agreements, and securities borrowing and lending transactions that are either offset or subject to an enforceable master netting arrangement. The disclosure requirements are effective for annual reporting periods beginning on or after January 1, 2013, and interim periods therein, with retrospective application required. The adoption of these accounting pronouncements is not expected to have a material impact on the Company’s consolidated financial statements.
F-18
Table of Contents
GREAT WESTERN BANCORPORATION, INC.
Notes to Consolidated Financial Statements
In October 2012, the FASB released ASU 2012-06, Subsequent Accounting for an Indemnification Asset Recognized at the Acquisition Date as a Result of a Government-Assisted Acquisition of a Financial Institution. The new guidance clarifies that when a reporting entity recognizes an indemnification asset as a result of a government-assisted acquisition of a financial institution and subsequently a change in the cash flows expected to be collected on the indemnification asset occurs, the reporting entity should account for the change in the measurement of the indemnification asset on the same basis as the change in the assets subject to indemnification. Any amortization of changes in value should be limited to the lesser of the contractual term of the indemnification agreement or the remaining life of the indemnified assets. This guidance is effective for annual reporting periods beginning on or after December 15, 2012, and interim periods therein. The Company has previously accounted for its indemnification asset in accordance with this guidance; accordingly, the adoption of this guidance is not expected to have a material impact on the consolidated financial position, results of operations or cash flows.
In February 2013, the FASB issued ASU 2013-02, Comprehensive Income (Topic 220): Reporting of Amounts Reclassified Out of Accumulated Other Comprehensive Income. The update amends existing literature to require an entity to provide information about the amounts reclassified out of other comprehensive income by component, and it also requires enhanced disclosure and cross reference on items reclassified out of accumulated other comprehensive income during the reporting period. The update is effective for reporting periods beginning after December 15, 2012. The adoption of the update is not expected to have a significant impact to the Company’s consolidated financial statements.
In January 2014, the FASB issued ASU 2014-04, Receivables—Troubled Debt Restructurings by Creditors (Subtopic 310-40): Reclassification of Residential Real Estate Collateralized Consumer Mortgage Loans upon Foreclosure. The update amends existing literature to eliminate diversity in practice by clarifying and defining when an in substance repossession or foreclosure occurs. The terms “in substance a repossession or foreclosure” and “physical possession” are not currently defined in the accounting literature, resulting in diversity in practice when a creditor derecognizes a loan receivable and recognizes the real estate property collateralizing the loan receivable as an asset. Additionally, the update requires interim and annual disclosures of both the amount of foreclosed residential real estate property and the recorded investment in consumer mortgage loans collateralized by residential real estate property that are in the process of foreclosure. The update is effective for annual periods and the interim periods within those annual periods beginning after December 15, 2014. The adoption of the update to existing standards is not expected to have a material impact to the Company’s consolidated financial statements.
2. Business Combinations
North Central Bancshares, Inc.
On June 22, 2012, the Company acquired North Central Bancshares, Inc. (“NCB”), an Iowa bank headquartered in Fort Dodge, Iowa, in a non-FDIC assisted transaction.
NCB operated 11 locations in Iowa. Excluding the effects of purchase accounting adjustments, the Company assumed approximately $356.60 million of deposits of NCB. In addition, the Company purchased approximately $311.64 million in loans, $63.60 million in investment securities, $18.49 million of cash and cash equivalents, $12.05 million in property and equipment, and assumed $14.75 million of FHLB advances and other borrowings.
The Company determined that the NCB transaction constituted a business acquisition. Accordingly, the assets acquired and liabilities assumed as of June 22, 2012, are presented at their fair values in the table below. In many cases, the determination of these fair values required management to make estimates about discount rates, future expected cash flows, market conditions, and other future events that are highly subjective in nature and subject to change.
F-19
Table of Contents
GREAT WESTERN BANCORPORATION, INC.
Notes to Consolidated Financial Statements
The operating results of the Company for the year ended September 30, 2012, include the operating results produced by the acquired assets and assumed liabilities for the period from June 22, 2012 to September 30, 2012.
Approximately $2.20 million of core deposit intangible assets were recorded in connection with this transaction. A bargain purchase gain of $3.95 million was recorded in noninterest income as the fair value of the net assets acquired exceeded the $41.50 million purchase price.
| (Amounts in thousands) | As Recorded NCB |
Fair Value Adjustments |
As Recorded by Great Western |
|||||||||
| Assets |
||||||||||||
| Cash and cash equivalents |
$ | 18,485 | $ | — | $ | 18,485 | ||||||
| Investment securities |
63,602 | (385 | ) | 63,217 | ||||||||
| FHLB stock |
1,290 | — | 1,290 | |||||||||
| Loans |
311,640 | (978 | ) | 310,662 | ||||||||
| Allowance |
(6,049 | ) | 6,049 | — | ||||||||
|
|
|
|
|
|
|
|||||||
| Total loans |
305,591 | 5,071 | 310,662 | |||||||||
|
|
|
|
|
|
|
|||||||
| Core deposit intangible |
— | 2,200 | 2,200 | |||||||||
| Other real estate owned |
1,835 | — | 1,835 | |||||||||
| Bank owned life insurance |
6,134 | — | 6,134 | |||||||||
| Premises and equipment |
12,049 | 843 | 12,892 | |||||||||
| Other assets |
6,214 | (904 | ) | 5,310 | ||||||||
|
|
|
|
|
|
|
|||||||
| Total assets acquired |
415,200 | 6,825 | 422,025 | |||||||||
| Liabilities |
||||||||||||
| Deposits |
356,601 | 2,065 | 358,666 | |||||||||
| FHLB advances and other borrowings |
14,750 | 409 | 15,159 | |||||||||
| Accrued interest and other liabilities |
1,972 | 779 | 2,751 | |||||||||
|
|
|
|
|
|
|
|||||||
| Total liabilities assumed |
373,323 | 3,253 | 376,576 | |||||||||
|
|
|
|
|
|
|
|||||||
| Net assets acquired |
$ | 41,877 | $ | 3,572 | 45,449 | |||||||
|
|
|
|
|
|
|
|||||||
| Paid to NCB for net assets acquired |
41,499 | |||||||||||
|
|
|
|||||||||||
| Bargain purchase gain |
$ | 3,950 | ||||||||||
|
|
|
|||||||||||
The following is a description of the methods used to determine the fair values of significant assets and liabilities presented previously.
Cash and Due From Banks
The carrying amount of these assets was a reasonable estimate of fair value based on the short-term nature of these assets.
Investment Securities
Fair values for securities were based on quoted market prices, where available. If quoted market prices were not available, fair value estimates were based on observable inputs, including quoted market prices for similar instruments, quoted market prices that were not in an active market, or other inputs that were observable in the market.
F-20
Table of Contents
GREAT WESTERN BANCORPORATION, INC.
Notes to Consolidated Financial Statements
FHLB Stock
The carrying amount of FHLB stock was a reasonable estimate of fair value as shares are repurchased at par value.
Loans
The fair value of loans was based on three valuation methodologies: (1) large balance (150 largest relationships, all watch loans, all 30+ days past due) single-family residential, home equity line of credit, 2nd lien home loans, and consumer assets were valued individually using a consumer valuation calculation taking into account a broad range of variables such as FICO scores, current market rates, market spreads, and collateral values; (2) large balance (40 largest relationships, all watch and loans, and all participations) commercial and commercial real estate loans were evaluated on a credit-by-credit basis by both the former NCB officers most familiar with the credits and the Company’s credit officers, taking into account variables such as current market rates, market spreads, collateral values, payment histories, and working knowledge of the respective customers; and (3) other smaller balance and low-risk loans were valued collectively based on past credit history, collateral geography, current market interest rates, and risk grading of the loans. Loans with evidence of credit deterioration at acquisition were not material.
Core Deposit Intangible (“CDI”)
This intangible asset represents the value of the relationships NCB had with its deposit customers. The CDI was valued using an after-tax cost savings methodology, based on the estimated favorable cost of the funding provided by the depositors over their estimated remaining life, as compared with the estimated cost of the Company’s alternative cost of funding (“ACOF”) for that period. It is the present value of this after-tax cost savings generated by the depositors, if any, which is the basis for the value of the depositor relationships.
Other Real Estate Owned (“OREO”)
OREO is presented at the estimated fair value that management expects to receive when the property is sold, net of related costs of disposal. The fair values were determined by third party appraisals.
Bank Owned Life Insurance
Bank owned life insurance is presented at the cash surrender value of the insurance policies. The cash surrender value was considered to be an appropriate proxy for the fair value of the policies on the acquisition date.
Premises and Equipment
The fair value of premises was determined by third party appraisals. Other equipment and fixtures were assessed for usability and the carrying values were adjusted if applicable.
Other Assets
Other assets include subsidiary assets, prepaid expenses, deferred tax assets, and accrued interest. Adjustments were made to reduce multiple subsidiary accruals, write off deferred tax assets not associated with the Company’s acquired property and write off assets held at a subsidiary level due to obsolescence.
F-21
Table of Contents
GREAT WESTERN BANCORPORATION, INC.
Notes to Consolidated Financial Statements
Deposits
The fair value of the assumed deposits was determined using a model that incorporated original interest rate and current interest rate information as well as duration/maturity information.
Advances from the Federal Home Loan Bank
On the acquisition date, the Company assumed approximately $14.75 million of advances from the Federal Home Loan Bank, the majority of which paid a coupon of approximately 1.9% and matured in 2015 through 2017. The Company decided to pay down the advances prior to stated maturity, which included a prepayment penalty. The prepayment penalty of $0.41 million was considered as an appropriate proxy for the fair value adjustment on the acquisition date.
TierOne Bank
On June 4, 2010, the Company entered into a purchase and assumption agreement with the FDIC to acquire certain assets and assume substantially all the deposits and certain liabilities of TierOne Bank (“TOB”), a Nebraska state-chartered bank headquartered in Lincoln, Nebraska.
The Company assumed approximately $1,892.20 million of deposits and purchased approximately $1,880.38 million in loans, $101.23 million in OREO, $40.84 million in investment securities and $19.15 million in servicing assets. In connection with the acquisition, the Company entered into two loss sharing agreements with the FDIC. The expected reimbursement under the loss sharing agreements was recorded as a loss share indemnification asset at its estimated fair value on the acquisition date.
Pursuant to the terms of the loss sharing agreements, the FDIC is obligated to reimburse the Company for losses with respect to certain loans, OREO, certain investments securities and other assets (collectively “covered assets”). The loss sharing agreement applicable to single family residential mortgage loans provides for FDIC loss sharing and Bank reimbursements to the FDIC for gains and recoveries for ten years. The loss sharing agreement applicable to commercial loans and other covered assets provides for FDIC loss sharing for five years and Bank reimbursements to the FDIC for gains and recoveries for a total of eight years. Agricultural real estate and operating lines and certain consumer loans were excluded from loss sharing and the losses from these loan types were not included in the calculation of the fair value of the indemnification asset.
Approximately $63.00 million of goodwill and $33.00 million of core deposit intangible assets were recorded in connection with this transaction. The amount of goodwill recorded reflected the difference between the purchase price and the fair value of the net assets acquired. All of the goodwill and core deposit intangible assets recognized are deductible for income tax purposes.
3. Restrictions on Cash and Due from Banks
The Company is required to maintain reserve balances in cash and on deposit with the Federal Reserve based on a percentage of deposits. The total requirement was approximately $52.66 million and $46.03 million at September 30, 2013 and 2012, respectively.
F-22
Table of Contents
GREAT WESTERN BANCORPORATION, INC.
Notes to Consolidated Financial Statements
4. Securities
The amortized cost and approximate fair value of investments in securities, all of which are classified as available for sale according to management’s intent, are summarized as follows (in thousands):
| Amortized Cost |
Gross Unrealized Gains |
Gross Unrealized Losses |
Fair Value | |||||||||||||
| As of September 30, 2013 |
||||||||||||||||
| U.S. Treasury securities |
$ | — | $ | — | $ | — | $ | — | ||||||||
| Mortgage-backed securities: |
||||||||||||||||
| Government National Mortgage Association |
1,470,822 | 9,634 | (21,013 | ) | 1,459,443 | |||||||||||
| Federal National Mortgage Association |
1 | — | — | 1 | ||||||||||||
| States and political subdivision securities |
3,513 | 19 | — | 3,532 | ||||||||||||
| Corporate debt securities |
11,889 | 133 | (9 | ) | 12,013 | |||||||||||
| Other |
5,449 | 17 | (6 | ) | 5,460 | |||||||||||
|
|
|
|
|
|
|
|
|
|||||||||
| $ | 1,491,674 | $ | 9,803 | $ | (21,028 | ) | $ | 1,480,449 | ||||||||
|
|
|
|
|
|
|
|
|
|||||||||
| Amortized Cost |
Gross Unrealized Gains |
Gross Unrealized Losses |
Fair Value | |||||||||||||
| As of September 30, 2012 |
||||||||||||||||
| U.S. Treasury securities |
$ | 5,005 | $ | 102 | $ | — | $ | 5,107 | ||||||||
| Mortgage-backed securities: |
||||||||||||||||
| Government National Mortgage Association |
1,502,442 | 28,897 | (146 | ) | 1,531,193 | |||||||||||
| Federal National Mortgage Association |
1 | — | — | 1 | ||||||||||||
| States and political subdivision securities |
5,757 | 57 | — | 5,814 | ||||||||||||
| Corporate debt securities |
32,878 | 1,478 | (45 | ) | 34,311 | |||||||||||
| Other |
5,449 | — | — | 5,449 | ||||||||||||
|
|
|
|
|
|
|
|
|
|||||||||
| $ | 1,551,532 | $ | 30,534 | $ | (191 | ) | $ | 1,581,875 | ||||||||
|
|
|
|
|
|
|
|
|
|||||||||
The amortized cost and approximate fair value of debt securities available for sale as of September 30, 2013 and 2012, by contractual maturity, are shown below. Maturities of mortgage-backed securities may differ from contractual maturities because the mortgages underlying the securities may be called or repaid without any penalties.
| September 30, 2013 | September 30, 2012 | |||||||||||||||
| (In Thousands) | Amortized Cost | Fair Value | Amortized Cost | Fair Value | ||||||||||||
| Due in one year or less |
$ | 1,497 | $ | 1,514 | $ | 5,710 | $ | 5,914 | ||||||||
| Due after one year through five years |
6,988 | 7,123 | 29,733 | 31,166 | ||||||||||||
| Due after five years through ten years |
6,917 | 6,908 | 8,197 | 8,152 | ||||||||||||
| Due after ten years |
— | — | — | — | ||||||||||||
|
|
|
|
|
|
|
|
|
|||||||||
| 15,402 | 15,545 | 43,640 | 45,232 | |||||||||||||
| Mortgage-backed securities |
1,470,823 | 1,459,444 | 1,502,443 | 1,531,194 | ||||||||||||
| Securities without contractual maturities |
5,449 | 5,460 | 5,449 | 5,449 | ||||||||||||
|
|
|
|
|
|
|
|
|
|||||||||
| $ | 1,491,674 | $ | 1,480,449 | $ | 1,551,532 | $ | 1,581,875 | |||||||||
|
|
|
|
|
|
|
|
|
|||||||||
F-23
Table of Contents
GREAT WESTERN BANCORPORATION, INC.
Notes to Consolidated Financial Statements
Proceeds from sales of securities available for sale were $72.44 million and $542.80 million for the years ended September 30, 2013 and 2012, respectively. Gross gains of $1.70 million and $7.67 million and gross losses of $0.78 million and $0.36 million were realized on the sales for the years ended September 30, 2013 and 2012, respectively, using the specific identification method.
Securities with a carrying value of approximately $1,090.37 million and $833.76 million at September 30, 2013 and 2012, respectively, were pledged as collateral on public deposits, securities sold under agreements to repurchase, and for other purposes as required or permitted by law. The counterparties do not have the right to sell or pledge the securities the Company has pledged as collateral.
As detailed in the following tables, certain investments in debt securities, which are approximately 62% and 6% of the Company’s investment portfolio at September 30, 2013 and 2012, respectively, are reported in the consolidated financial statements at an amount less than their amortized cost. Based on evaluation of available evidence, including recent changes in market interest rates, credit rating information, implicit or explicit government guarantees, and information obtained from regulatory filings, management believes the declines in fair value for these securities are temporary. As the Company does not intend to sell the securities and it is not more likely than not that the Company will be required to sell the securities before the recovery of their amortized cost basis, which may be maturity, the Company does not consider the securities to be other than temporarily impaired at September 30, 2013 or 2012. For the years ended September 30, 2013 and 2012, the Company did not recognize any other-than-temporary impairment.
The following table presents the Company’s gross unrealized losses and approximate fair value in investments, aggregated by investment category and length of time that individual securities have been in a continuous unrealized loss position (in thousands):
| Less than 12 months | September 30, 2013 12 months or more |
Total | ||||||||||||||||||||||
| Fair Value |
Unrealized Losses |
Fair Value |
Unrealized Losses |
Fair Value |
Unrealized Losses |
|||||||||||||||||||
| Mortgage-backed securities |
$ | 852,344 | $ | (19,469 | ) | $ | 56,781 | $ | (1,544 | ) | $ | 909,125 | $ | (21,013 | ) | |||||||||
| Corporate debt securities |
4,436 | (9 | ) | — | — | 4,436 | (9 | ) | ||||||||||||||||
| Other |
— | — | 4,986 | (6 | ) | 4,986 | (6 | ) | ||||||||||||||||
|
|
|
|
|
|
|
|
|
|
|
|
|
|||||||||||||
| $ | 856,780 | $ | (19,478 | ) | $ | 61,767 | $ | (1,550 | ) | $ | 918,547 | $ | (21,028 | ) | ||||||||||
|
|
|
|
|
|
|
|
|
|
|
|
|
|||||||||||||
| Less than 12 months | September 30, 2012 12 months or more |
Total | ||||||||||||||||||||||
| Fair Value |
Unrealized Losses |
Fair Value |
Unrealized Losses |
Fair Value |
Unrealized Losses |
|||||||||||||||||||
| Mortgage-backed securities |
$ | 93,313 | $ | (146 | ) | $ | — | $ | — | $ | 93,313 | $ | (146 | ) | ||||||||||
| Corporate debt securities |
4,949 | (45 | ) | — | — | 4,949 | (45 | ) | ||||||||||||||||
| Other |
— | — | — | — | — | — | ||||||||||||||||||
|
|
|
|
|
|
|
|
|
|
|
|
|
|||||||||||||
| $ | 98,262 | $ | (191 | ) | $ | — | $ | — | $ | 98,262 | $ | (191 | ) | |||||||||||
|
|
|
|
|
|
|
|
|
|
|
|
|
|||||||||||||
The Company’s investments in nonmarketable equity securities are all stock of the Federal Home Loan Bank. The carrying value of Federal Home Loan Bank stock was $28.77 million and $26.80 million as of September 30, 2013 and 2012, respectively, and is reported in other assets on the consolidated balance sheets. No indicators of impairment related to FHLB stock were identified during fiscal year 2013 or 2012.
F-24
Table of Contents
GREAT WESTERN BANCORPORATION, INC.
Notes to Consolidated Financial Statements
The components of other comprehensive income from net unrealized gains (losses) on securities available for sale for the years ended September 30, 2013 and 2012 are as follows (in thousands):
| 2013 | 2012 | |||||||
| Beginning balance accumulated other comprehensive income |
$ | 19,111 | $ | 16,542 | ||||
| Net unrealized holding gain (loss) arising during the period |
(40,651 | ) | 11,376 | |||||
| Reclassification adjustment for net gain realized in net income |
(917 | ) | (7,305 | ) | ||||
|
|
|
|
|
|||||
| Net change in unrealized gain (loss) before income taxes |
(41,568 | ) | 4,071 | |||||
| Income tax benefit (expense) |
15,376 | (1,502 | ) | |||||
|
|
|
|
|
|||||
| Net change in unrealized gain (loss) on securities after taxes |
(26,192 | ) | 2,569 | |||||
|
|
|
|
|
|||||
| Ending balance accumulated other comprehensive income (loss) |
$ | (7,081 | ) | $ | 19,111 | |||
|
|
|
|
|
|||||
5. Loans
The composition of net loans as of September 30, 2013 and 2012, is as follows (in thousands):
| 2013 | 2012 | |||||||
| Residential real estate |
$ | 906,469 | $ | 940,225 | ||||
| Commercial real estate |
2,311,974 | 2,364,099 | ||||||
| Commercial non real estate |
1,481,756 | 1,353,802 | ||||||
| Agriculture |
1,587,248 | 1,396,472 | ||||||
| Consumer |
101,477 | 127,236 | ||||||
| Other |
24,711 | 15,414 | ||||||
|
|
|
|
|
|||||
| 6,413,635 | 6,197,248 | |||||||
| Less: |
||||||||
| Allowance for loan losses |
(55,864 | ) | (71,878 | ) | ||||
| Unamortized discount on acquired loans |
(34,717 | ) | (55,836 | ) | ||||
| Unearned net deferred fees and costs and loans in process |
(16,245 | ) | (2,838 | ) | ||||
|
|
|
|
|
|||||
| $ | 6,306,809 | $ | 6,066,696 | |||||
|
|
|
|
|
|||||
The loan breakouts above include loans covered by FDIC loss sharing agreements totaling $347.41 million and $548.78 million as of September 30, 2013 and 2012, respectively, residential real estate loans held for sale totaling $8.27 million and $29.27 million at September 30, 2013 and 2012, respectively, and $841.86 million and $688.80 million of loans and written loan commitments accounted for at fair value as of September 30, 2013 and 2012, respectively.
Unamortized net deferred fees and costs totaled $5.19 million and $2.84 million as of September 30, 2013 and 2012, respectively.
Loans in process represent loans that have been funded as of the balance sheet dates but not classified into a loan category and loan payments received as of the balance sheet dates that have not been applied to individual loan accounts.
Loans guaranteed by agencies of the U.S. government totaled $104.04 million and $90.21 million at September 30, 2013 and 2012, respectively.
F-25
Table of Contents
GREAT WESTERN BANCORPORATION, INC.
Notes to Consolidated Financial Statements
Principal balances of residential real estate loans sold totaled $450.01 million and $417.00 million for the years end September 30, 2013 and 2012, respectively.
Principal balances of loans pledged to the Federal Home Loan Bank to collateralize notes payable totaled $1,984.67 million and $1,939.95 million at September 30, 2013 and 2012, respectively.
The following table presents the Company’s nonaccrual loans at September 30, 2013 and 2012 (in thousands), excluding loans covered under the FDIC loss-sharing agreements. Loans greater than 90 days past due and still accruing interest as of September 30, 2013 and 2012, were not significant.
| Nonaccrual loans |
2013 | 2012 | ||||||
| Residential real estate |
$ | 8,746 | $ | 10,798 | ||||
| Commercial real estate |
57,652 | 71,455 | ||||||
| Commercial non real estate |
6,641 | 7,394 | ||||||
| Agriculture |
8,236 | 3,757 | ||||||
| Consumer |
226 | 401 | ||||||
|
|
|
|
|
|||||
| Total |
$ | 81,501 | $ | 93,805 | ||||
|
|
|
|
|
|||||
The following table (in thousands) presents the Company’s past due loans at September 30, 2013 and 2012. This table is presented net of unamortized discount on acquired loans and excludes loans measured at fair value with changes in fair value reported in earnings of $841.86 million for 2013 and $688.80 million for 2012.
| As of September 30, 2013 | 30-59 Days Past Due |
60-89 Days Past Due |
Greater Than 90 Days |
Total Past Due |
Current | Total Financing Receivables |
||||||||||||||||||
| Residential real estate |
$ | 625 | $ | 955 | $ | 4,942 | $ | 6,522 | $ | 721,333 | $ | 727,855 | ||||||||||||
| Commercial real estate |
431 | 158 | 9,639 | 10,228 | 1,797,884 | 1,808,112 | ||||||||||||||||||
| Commercial non real estate |
1,342 | 198 | 2,821 | 4,361 | 1,219,731 | 1,224,092 | ||||||||||||||||||
| Agriculture |
102 | 4,040 | 2,867 | 7,009 | 1,297,208 | 1,304,217 | ||||||||||||||||||
| Consumer |
340 | 65 | 44 | 449 | 100,214 | 100,663 | ||||||||||||||||||
| Other |
— | — | — | — | 24,711 | 24,711 | ||||||||||||||||||
|
|
|
|
|
|
|
|
|
|
|
|
|
|||||||||||||
| 2,840 | 5,416 | 20,313 | 28,569 | 5,161,081 | 5,189,650 | |||||||||||||||||||
| Loans covered by FDIC loss sharing agreements |
1,307 | 3,861 | 6,632 | 11,800 | 335,608 | 347,408 | ||||||||||||||||||
|
|
|
|
|
|
|
|
|
|
|
|
|
|||||||||||||
| Total |
$ | 4,147 | $ | 9,277 | $ | 26,945 | $ | 40,369 | $ | 5,496,689 | $ | 5,537,058 | ||||||||||||
|
|
|
|
|
|
|
|
|
|
|
|
|
|||||||||||||
| As of September 30, 2012 | 30-59 Days Past Due |
60-89 Days Past Due |
Greater Than 90 Days |
Total Past Due |
Current | Total Financing Receivables |
||||||||||||||||||
| Residential real estate |
$ | 1,895 | $ | 1,232 | $ | 3,898 | $ | 7,025 | $ | 690,195 | $ | 697,220 | ||||||||||||
| Commercial real estate |
6,729 | 1,051 | 19,623 | 27,403 | 1,817,920 | 1,845,323 | ||||||||||||||||||
| Commercial non real estate |
255 | — | 787 | 1,042 | 1,082,061 | 1,083,103 | ||||||||||||||||||
| Agriculture |
86 | — | 435 | 521 | 1,137,004 | 1,137,525 | ||||||||||||||||||
| Consumer |
282 | 91 | 97 | 470 | 124,777 | 125,247 | ||||||||||||||||||
| Other |
— | — | — | — | 15,414 | 15,414 | ||||||||||||||||||
|
|
|
|
|
|
|
|
|
|
|
|
|
|||||||||||||
| 9,247 | 2,374 | 24,840 | 36,461 | 4,867,371 | 4,903,832 | |||||||||||||||||||
| Loans covered by FDIC loss sharing agreements |
3,650 | 1,514 | 15,082 | 20,246 | 528,534 | 548,780 | ||||||||||||||||||
|
|
|
|
|
|
|
|
|
|
|
|
|
|||||||||||||
| Total |
$ | 12,897 | $ | 3,888 | $ | 39,922 | $ | 56,707 | $ | 5,395,905 | $ | 5,452,612 | ||||||||||||
|
|
|
|
|
|
|
|
|
|
|
|
|
|||||||||||||
F-26
Table of Contents
GREAT WESTERN BANCORPORATION, INC.
Notes to Consolidated Financial Statements
The composition of the loan portfolio by internal risk rating is as follows as of September 30, 2013 and 2012. This table (in thousands) is presented net of unamortized discount on acquired loans and excludes loans measured at fair value with changes in fair value reported in earnings of $841.86 million for 2013 and $688.80 million for 2012:
| As of September 30, 2013 | Residential Real Estate |
Commercial Real Estate |
Commercial Non Real Estate |
Agricultural | Consumer | Other | Total | |||||||||||||||||||||
| Credit Risk Profile by Internally Assigned Grade |
||||||||||||||||||||||||||||
| Grade: |
||||||||||||||||||||||||||||
| Pass |
$ | 707,859 | $ | 1,652,694 | $ | 1,144,131 | $ | 1,192,357 | $ | 100,087 | $ | 24,711 | $ | 4,821,839 | ||||||||||||||
| Watchlist |
5,779 | 72,924 | 52,576 | 87,596 | 164 | — | 219,039 | |||||||||||||||||||||
| Substandard |
13,039 | 78,244 | 23,538 | 23,963 | 398 | — | 139,182 | |||||||||||||||||||||
| Doubtful |
1,178 | 4,250 | 3,847 | 301 | 14 | — | 9,590 | |||||||||||||||||||||
| Loss |
— | — | — | — | — | — | — | |||||||||||||||||||||
|
|
|
|
|
|
|
|
|
|
|
|
|
|
|
|||||||||||||||
| Ending balance |
727,855 | 1,808,112 | 1,224,092 | 1,304,217 | 100,663 | 24,711 | 5,189,650 | |||||||||||||||||||||
| Loans covered by FDIC loss sharing agreements |
167,835 | 150,745 | 28,163 | 525 | 140 | — | 347,408 | |||||||||||||||||||||
|
|
|
|
|
|
|
|
|
|
|
|
|
|
|
|||||||||||||||
| Total |
$ | 895,690 | $ | 1,958,857 | $ | 1,252,255 | $ | 1,304,742 | $ | 100,803 | $ | 24,711 | $ | 5,537,058 | ||||||||||||||
|
|
|
|
|
|
|
|
|
|
|
|
|
|
|
|||||||||||||||
| As of September 30, 2012 | Residential Real Estate |
Commercial Real Estate |
Commercial Non Real Estate |
Agricultural | Consumer | Other | Total | |||||||||||||||||||||
| Credit Risk Profile by Internally Assigned Grade |
||||||||||||||||||||||||||||
| Grade: |
||||||||||||||||||||||||||||
| Pass |
$ | 675,593 | $ | 1,564,683 | $ | 1,023,721 | $ | 1,096,640 | $ | 124,476 | $ | 15,414 | $ | 4,500,527 | ||||||||||||||
| Watchlist |
5,232 | 173,904 | 20,880 | 35,404 | 76 | — | 235,496 | |||||||||||||||||||||
| Substandard |
13,789 | 87,652 | 33,095 | 2,622 | 652 | — | 137,810 | |||||||||||||||||||||
| Doubtful |
2,606 | 19,084 | 5,407 | 2,859 | 43 | — | 29,999 | |||||||||||||||||||||
| Loss |
— | — | — | — | — | — | — | |||||||||||||||||||||
|
|
|
|
|
|
|
|
|
|
|
|
|
|
|
|||||||||||||||
| Ending balance |
697,220 | 1,845,323 | 1,083,103 | 1,137,525 | 125,247 | 15,414 | 4,903,832 | |||||||||||||||||||||
| Loans covered by FDIC loss sharing agreements |
227,691 | 234,307 | 85,609 | 754 | 419 | — | 548,780 | |||||||||||||||||||||
|
|
|
|
|
|
|
|
|
|
|
|
|
|
|
|||||||||||||||
| Total |
$ | 924,911 | $ | 2,079,630 | $ | 1,168,712 | $ | 1,138,279 | $ | 125,666 | $ | 15,414 | $ | 5,452,612 | ||||||||||||||
|
|
|
|
|
|
|
|
|
|
|
|
|
|
|
|||||||||||||||
F-27
Table of Contents
GREAT WESTERN BANCORPORATION, INC.
Notes to Consolidated Financial Statements
Impaired Loans
The following table presents the Company’s impaired loans (in thousands). This table excludes loans covered by FDIC loss sharing agreements:
| Recorded Investment |
Unpaid Principal Balance |
Related Allowance |
Average Recorded Investment |
|||||||||||||
| As of September 30, 2013 |
||||||||||||||||
| Impaired loans: |
||||||||||||||||
| With an allowance recorded: |
||||||||||||||||
| Residential real estate |
$ | 15,037 | $ | 16,815 | $ | 3,217 | $ | 15,716 | ||||||||
| Commercial real estate |
106,824 | 123,523 | 5,341 | 106,780 | ||||||||||||
| Commercial non real estate |
31,132 | 32,557 | 5,607 | 34,817 | ||||||||||||
| Agriculture |
25,563 | 29,632 | 3,022 | 15,522 | ||||||||||||
| Consumer |
412 | 656 | 90 | 554 | ||||||||||||
|
|
|
|
|
|
|
|
|
|||||||||
| $ | 178,968 | $ | 203,183 | $ | 17,277 | $ | 173,389 | |||||||||
|
|
|
|
|
|
|
|
|
|||||||||
| Recorded Investment |
Unpaid Principal Balance |
Related Allowance |
Average Recorded Investment |
|||||||||||||
| As of September 30, 2012 |
||||||||||||||||
| Impaired loans: |
||||||||||||||||
| With an allowance recorded: |
||||||||||||||||
| Residential real estate |
$ | 17,132 | $ | 18,757 | $ | 3,842 | $ | 14,775 | ||||||||
| Commercial real estate |
131,204 | 147,805 | 11,369 | 133,974 | ||||||||||||
| Commercial non real estate |
41,075 | 44,715 | 9,712 | 30,548 | ||||||||||||
| Agriculture |
5,481 | 5,530 | 2,655 | 6,401 | ||||||||||||
| Consumer |
695 | 1,832 | 137 | 950 | ||||||||||||
|
|
|
|
|
|
|
|
|
|||||||||
| $ | 195,587 | $ | 218,639 | $ | 27,715 | $ | 186,648 | |||||||||
|
|
|
|
|
|
|
|
|
|||||||||
There were no impaired loans with no valuation allowance as of September 30, 2013 or 2012. Interest income recognized on impaired loans was $7.87 million and $7.73 million for the years ended September 30, 2013 and 2012, respectively.
Restructured Loans
Included in certain loan categories in the impaired loans are troubled debt restructurings (“TDRs”) that were classified as impaired. These TDRs do not include purchased impaired loans. When the Company grants concessions to borrowers such as reduced interest rates or extensions of loan periods that would not be considered other than because of borrowers’ financial difficulties, the modification is considered a TDR. Specific reserves included in the allowance for loan losses for TDRs were $6.43 million and $5.66 million at September 30, 2013 and 2012, respectively. Commitments to lend additional funds to borrowers whose loans were modified in a TDR were not significant as of September 30, 2013 or 2012.
F-28
Table of Contents
GREAT WESTERN BANCORPORATION, INC.
Notes to Consolidated Financial Statements
The following table presents the recorded value of the Company’s TDR balances as of September 30, 2013 and 2012 (in thousands):
| September 30, 2013 | September 30, 2012 | |||||||||||||||
| Accruing | Nonaccrual | Accruing | Nonaccrual | |||||||||||||
| Residential real estate |
$ | 662 | $ | 1,100 | $ | 41 | $ | 2,279 | ||||||||
| Commercial real estate |
29,373 | 49,736 | 25,323 | 41,955 | ||||||||||||
| Commercial non real estate |
4,769 | 5,007 | 14,235 | 5,719 | ||||||||||||
| Agriculture |
4,326 | 7,268 | 410 | 352 | ||||||||||||
| Consumer |
— | 29 | — | — | ||||||||||||
|
|
|
|
|
|
|
|
|
|||||||||
| Total |
$ | 39,130 | $ | 63,140 | $ | 40,009 | $ | 50,305 | ||||||||
|
|
|
|
|
|
|
|
|
|||||||||
F-29
Table of Contents
GREAT WESTERN BANCORPORATION, INC.
Notes to Consolidated Financial Statements
The following table presents a summary of all accruing loans restructured in TDRs during the years ended September 30, 2013 and 2012:
| Year Ended September 30, 2013 | Year Ended September 30, 2012 | |||||||||||||||||||||||
| ($ in thousands) | Number | Recorded Investment | Number | Recorded Investment | ||||||||||||||||||||
| Pre- Modification |
Post- Modification |
Pre- Modification |
Post- Modification |
|||||||||||||||||||||
| Residential real estate |
||||||||||||||||||||||||
| Rate modification |
— | $ | — | $ | — | — | $ | — | $ | — | ||||||||||||||
| Term extension |
7 | 663 | 663 | — | — | — | ||||||||||||||||||
| Payment modification |
— | — | — | — | — | — | ||||||||||||||||||
| Bankruptcy |
1 | 5 | 5 | — | — | — | ||||||||||||||||||
| Other |
— | — | — | — | — | — | ||||||||||||||||||
|
|
|
|
|
|
|
|
|
|
|
|
|
|||||||||||||
| Total residential real estate |
8 | 668 | 668 | — | — | — | ||||||||||||||||||
| Commercial real estate |
||||||||||||||||||||||||
| Rate modification |
2 | 990 | 990 | 2 | 12,648 | 12,648 | ||||||||||||||||||
| Term extension |
7 | 4,158 | 4,158 | — | — | — | ||||||||||||||||||
| Payment modification |
3 | 13,497 | 13,497 | 1 | 696 | 696 | ||||||||||||||||||
| Bankruptcy |
— | — | — | — | — | — | ||||||||||||||||||
| Other |
— | — | — | 1 | 793 | 793 | ||||||||||||||||||
|
|
|
|
|
|
|
|
|
|
|
|
|
|||||||||||||
| Total commercial real estate |
12 | 18,645 | 18,645 | 4 | 14,137 | 14,137 | ||||||||||||||||||
| Commercial non real estate |
||||||||||||||||||||||||
| Rate modification |
1 | 529 | 529 | 2 | 1,260 | 1,260 | ||||||||||||||||||
| Term extension |
10 | 14,851 | 14,851 | 1 | 2,663 | 2,663 | ||||||||||||||||||
| Payment modification |
9 | 2,759 | 2,759 | 6 | 9,006 | 9,006 | ||||||||||||||||||
| Bankruptcy |
— | — | — | — | — | — | ||||||||||||||||||
| Other |
— | — | — | — | — | — | ||||||||||||||||||
|
|
|
|
|
|
|
|
|
|
|
|
|
|||||||||||||
| Total commercial non real estate |
20 | 18,139 | 18,139 | 9 | 12,929 | 12,929 | ||||||||||||||||||
| Agriculture |
||||||||||||||||||||||||
| Rate modification |
— | — | — | — | — | — | ||||||||||||||||||
| Term extension |
6 | 2,008 | 2,008 | — | — | — | ||||||||||||||||||
| Payment modification |
2 | 1,949 | 1,949 | — | — | — | ||||||||||||||||||
| Bankruptcy |
— | — | — | — | — | — | ||||||||||||||||||
| Other |
— | — | — | — | — | — | ||||||||||||||||||
|
|
|
|
|
|
|
|
|
|
|
|
|
|||||||||||||
| Total agriculture |
8 | 3,957 | 3,957 | — | — | — | ||||||||||||||||||
| Consumer |
||||||||||||||||||||||||
| Rate modification |
— | — | — | — | — | — | ||||||||||||||||||
| Term extension |
1 | 3 | 3 | — | — | — | ||||||||||||||||||
| Payment modification |
— | — | — | — | — | — | ||||||||||||||||||
| Bankruptcy |
— | — | — | — | — | — | ||||||||||||||||||
| Other |
— | — | — | — | — | — | ||||||||||||||||||
|
|
|
|
|
|
|
|
|
|
|
|
|
|||||||||||||
| Total consumer |
1 | 3 | 3 | — | — | — | ||||||||||||||||||
|
|
|
|
|
|
|
|
|
|
|
|
|
|||||||||||||
| Total accruing |
49 | $ | 41,412 | $ | 41,412 | 13 | $ | 27,066 | $ | 27,066 | ||||||||||||||
|
|
|
|
|
|
|
|
|
|
|
|
|
|||||||||||||
| Change in recorded investment due to principal paydown at time of modification |
— | — | — | — | — | — | ||||||||||||||||||
| Change in recorded investment due to chargeoffs at time of modification |
— | — | — | — | — | — | ||||||||||||||||||
F-30
Table of Contents
GREAT WESTERN BANCORPORATION, INC.
Notes to Consolidated Financial Statements
The following table presents a summary of all non-accruing loans restructured in TDRs during the years ended September 30, 2013 and 2012:
| Year Ended September 30, 2013 | Year Ended September 30, 2012 | |||||||||||||||||||||||
| ($ in thousands) | Number | Recorded Investment | Number | Recorded Investment | ||||||||||||||||||||
| Pre- Modification |
Post- Modification |
Pre- Modification |
Post- Modification |
|||||||||||||||||||||
| Residential real estate |
||||||||||||||||||||||||
| Rate modification |
— | $ | — | $ | — | 2 | $ | 1,944 | $ | 1,944 | ||||||||||||||
| Term extension |
15 | 638 | 638 | — | — | — | ||||||||||||||||||
| Payment modification |
— | — | — | — | — | — | ||||||||||||||||||
| Bankruptcy |
2 | 336 | 336 | — | — | — | ||||||||||||||||||
| Other |
2 | 147 | 147 | 3 | 113 | 113 | ||||||||||||||||||
|
|
|
|
|
|
|
|
|
|
|
|
|
|||||||||||||
| Total residential real estate |
19 | 1,121 | 1,121 | 5 | 2,057 | 2,057 | ||||||||||||||||||
| Commercial real estate |
||||||||||||||||||||||||
| Rate modification |
2 | 310 | 310 | 2 | 15,788 | 15,788 | ||||||||||||||||||
| Term extension |
7 | 2,448 | 2,448 | 6 | 5,268 | 5,268 | ||||||||||||||||||
| Payment modification |
7 | 17,578 | 17,578 | 4 | 15,090 | 15,090 | ||||||||||||||||||
| Bankruptcy |
3 | 3,162 | 3,162 | — | — | — | ||||||||||||||||||
| Other |
— | — | — | — | — | — | ||||||||||||||||||
|
|
|
|
|
|
|
|
|
|
|
|
|
|||||||||||||
| Total commercial real estate |
19 | 23,498 | 23,498 | 12 | 36,146 | 36,146 | ||||||||||||||||||
| Commercial Non Real Estate |
||||||||||||||||||||||||
| Rate modification |
1 | 1,067 | 1,067 | 2 | 1,642 | 1,642 | ||||||||||||||||||
| Term extension |
8 | 1,127 | 1,127 | 3 | 98 | 98 | ||||||||||||||||||
| Payment modification |
3 | 2,051 | 1,416 | — | — | — | ||||||||||||||||||
| Bankruptcy |
— | — | — | — | — | — | ||||||||||||||||||
| Other |
— | — | — | — | — | — | ||||||||||||||||||
|
|
|
|
|
|
|
|
|
|
|
|
|
|||||||||||||
| Total commercial non real estate |
12 | 4,245 | 3,610 | 5 | 1,740 | 1,740 | ||||||||||||||||||
| Agriculture |
||||||||||||||||||||||||
| Rate modification |
— | — | — | — | — | — | ||||||||||||||||||
| Term extension |
3 | 768 | 768 | — | — | — | ||||||||||||||||||
| Payment modification |
4 | 6,196 | 6,196 | — | — | — | ||||||||||||||||||
| Bankruptcy |
— | — | — | — | — | — | ||||||||||||||||||
| Other |
— | — | — | — | — | — | ||||||||||||||||||
|
|
|
|
|
|
|
|
|
|
|
|
|
|||||||||||||
| Total agriculture |
7 | 6,964 | 6,964 | — | — | — | ||||||||||||||||||
| Consumer |
||||||||||||||||||||||||
| Rate modification |
2 | 11 | 11 | — | — | — | ||||||||||||||||||
| Term extension |
5 | 30 | 30 | — | — | — | ||||||||||||||||||
| Payment modification |
— | — | — | — | — | — | ||||||||||||||||||
| Bankruptcy |
— | — | — | — | — | — | ||||||||||||||||||
| Other |
— | — | — | — | — | — | ||||||||||||||||||
|
|
|
|
|
|
|
|
|
|
|
|
|
|||||||||||||
| Total consumer |
7 | 41 | 41 | — | — | — | ||||||||||||||||||
|
|
|
|
|
|
|
|
|
|
|
|
|
|||||||||||||
| Total non-accruing |
64 | $ | 35,869 | $ | 35,234 | 22 | $ | 39,943 | $ | 39,943 | ||||||||||||||
|
|
|
|
|
|
|
|
|
|
|
|
|
|||||||||||||
| Change in recorded investment due to principal paydown at time of modification |
— | — | — | — | — | — | ||||||||||||||||||
| Change in recorded investment due to chargeoffs at time of modification |
1 | $ | 635 | — | — | — | — | |||||||||||||||||
F-31
Table of Contents
GREAT WESTERN BANCORPORATION, INC.
Notes to Consolidated Financial Statements
For the years ended September 30, 2013 and 2012, the table below represents defaults on loans that were first modified during the respective fiscal year, that became 90 days or more delinquent or were charged-off during the respective fiscal year.
| ($ in thousands) | Year Ended September 30, 2013 | Year Ended September 30, 2012 | ||||||||||||||
| Number of Loans |
Recorded Investment |
Number of Loans |
Recorded Investment |
|||||||||||||
| Residential real estate |
5 | $ | 647 | 1 | $ | 332 | ||||||||||
| Commercial real estate |
7 | 4,401 | 5 | 15,146 | ||||||||||||
| Commercial non real estate |
1 | 1,067 | 2 | 79 | ||||||||||||
| Agriculture |
6 | 5,739 | — | — | ||||||||||||
| Consumer |
— | — | — | — | ||||||||||||
|
|
|
|
|
|
|
|
|
|||||||||
| 19 | $ | 11,854 | 8 | $ | 15,557 | |||||||||||
|
|
|
|
|
|
|
|
|
|||||||||
The majority of loans that were modified and subsequently became 90 days or more delinquent have remained on nonaccrual status since the time of modification.
F-32
Table of Contents
GREAT WESTERN BANCORPORATION, INC.
Notes to Consolidated Financial Statements
6. Allowance for Loan Losses
The following table presents the Company’s allowance for loan losses roll forward and respective loan balances for 2013 and 2012. This table (in thousands) is presented net of unamortized discount on acquired loans and excludes loans measured at fair value with changes in fair value reported in earnings of $841.86 million, loans held for sale of $8.27 million, and guaranteed loans of $104.04 million for 2013 and loans measured at fair value with changes in fair value reported in earnings of $688.80 million, loans held for sale of $29.27 million, and guaranteed loans of $90.21 million for 2012.
| As of September 30, 2013 | Residential Real Estate |
Commercial Real Estate |
Commercial Non Real Estate |
Agricultural | Consumer | Other | Total | |||||||||||||||||||||
| Allowance for loan losses |
||||||||||||||||||||||||||||
| Beginning balance October 1, 2012 |
$ | 14,761 | $ | 30,234 | $ | 18,979 | $ | 6,906 | $ | 542 | $ | 456 | $ | 71,878 | ||||||||||||||
| Charge-offs |
(1,766 | ) | (19,648 | ) | (3,636 | ) | (4,069 | ) | (244 | ) | (1,851 | ) | (31,214 | ) | ||||||||||||||
| Recoveries |
279 | 689 | 1,206 | 22 | 396 | 1,034 | 3,626 | |||||||||||||||||||||
| Provision |
1,043 | 10,925 | (5,427 | ) | 6,437 | (382 | ) | 1,054 | 13,650 | |||||||||||||||||||
| Impairment of loans acquired with deteriorated credit quality |
(2,538 | ) | 362 | 100 | — | — | — | (2,076 | ) | |||||||||||||||||||
|
|
|
|
|
|
|
|
|
|
|
|
|
|
|
|||||||||||||||
| Ending balance September 30, 2013 |
$ | 11,779 | $ | 22,562 | $ | 11,222 | $ | 9,296 | $ | 312 | $ | 693 | $ | 55,864 | ||||||||||||||
|
|
|
|
|
|
|
|
|
|
|
|
|
|
|
|||||||||||||||
| Ending balance: individually evaluated for impairment |
$ | 3,212 | $ | 5,095 | $ | 5,594 | $ | 3,016 | $ | 90 | $ | — | $ | 17,007 | ||||||||||||||
|
|
|
|
|
|
|
|
|
|
|
|
|
|
|
|||||||||||||||
| Ending balance: collectively evaluated for impairment |
$ | 3,533 | $ | 16,986 | $ | 3,897 | $ | 6,280 | $ | 222 | $ | 693 | $ | 31,611 | ||||||||||||||
|
|
|
|
|
|
|
|
|
|
|
|
|
|
|
|||||||||||||||
| Ending balance: loans acquired with deteriorated credit quality |
$ | 5,034 | $ | 481 | $ | 1,731 | $ | — | $ | — | $ | — | $ | 7,246 | ||||||||||||||
|
|
|
|
|
|
|
|
|
|
|
|
|
|
|
|||||||||||||||
| Ending balance: loans acquired without deteriorated credit quality |
$ | — | $ | — | $ | — | $ | — | $ | — | $ | — | $ | — | ||||||||||||||
|
|
|
|
|
|
|
|
|
|
|
|
|
|
|
|||||||||||||||
| Financing receivables |
||||||||||||||||||||||||||||
| Ending balance |
$ | 885,245 | $ | 1,926,828 | $ | 1,191,500 | $ | 1,295,661 | $ | 100,803 | $ | 24,711 | $ | 5,424,748 | ||||||||||||||
|
|
|
|
|
|
|
|
|
|
|
|
|
|
|
|||||||||||||||
| Ending balance: individually evaluated for impairment |
$ | 8,917 | $ | 77,620 | $ | 27,527 | $ | 23,719 | $ | 292 | $ | — | $ | 138,075 | ||||||||||||||
|
|
|
|
|
|
|
|
|
|
|
|
|
|
|
|||||||||||||||
| Ending balance: collectively evaluated for impairment |
$ | 589,104 | $ | 1,623,274 | $ | 1,136,611 | $ | 1,240,281 | $ | 91,178 | $ | 24,711 | $ | 4,705,159 | ||||||||||||||
|
|
|
|
|
|
|
|
|
|
|
|
|
|
|
|||||||||||||||
| Ending balance: loans acquired with deteriorated credit quality |
$ | 129,905 | $ | 85,022 | $ | 8,179 | $ | — | $ | 3,202 | $ | — | $ | 226,308 | ||||||||||||||
|
|
|
|
|
|
|
|
|
|
|
|
|
|
|
|||||||||||||||
| Ending balance: loans acquired without deteriorated credit quality |
$ | 157,319 | $ | 140,912 | $ | 19,183 | $ | 31,661 | $ | 6,131 | $ | — | $ | 355,206 | ||||||||||||||
|
|
|
|
|
|
|
|
|
|
|
|
|
|
|
|||||||||||||||
F-33
Table of Contents
GREAT WESTERN BANCORPORATION, INC.
Notes to Consolidated Financial Statements
| As of September 30, 2012 | Residential Real Estate |
Commercial Real Estate |
Commercial Non Real Estate |
Agricultural | Consumer | Other | Total | |||||||||||||||||||||
| Allowance for loan losses |
||||||||||||||||||||||||||||
| Beginning balance October 1, 2011 |
$ | 10,758 | $ | 40,733 | $ | 16,450 | $ | 2,509 | $ | 832 | $ | 261 | $ | 71,543 | ||||||||||||||
| Charge-offs |
(1,625 | ) | (24,854 | ) | (7,304 | ) | (49 | ) | (1,137 | ) | (1,764 | ) | (36,733 | ) | ||||||||||||||
| Recoveries |
630 | 3,268 | 1,386 | 160 | 226 | 1,253 | 6,923 | |||||||||||||||||||||
| Provision |
1,821 | 3,976 | 4,890 | 4,286 | 621 | 706 | 16,300 | |||||||||||||||||||||
| Impairment of loans acquired with deteriorated credit quality |
3,177 | 7,111 | 3,557 | — | — | — | 13,845 | |||||||||||||||||||||
|
|
|
|
|
|
|
|
|
|
|
|
|
|
|
|||||||||||||||
| Ending balance September 30, 2012 |
$ | 14,761 | $ | 30,234 | $ | 18,979 | $ | 6,906 | $ | 542 | $ | 456 | $ | 71,878 | ||||||||||||||
|
|
|
|
|
|
|
|
|
|
|
|
|
|
|
|||||||||||||||
| Ending balance: individually evaluated for impairment |
$ | 3,837 | $ | 11,132 | $ | 9,698 | $ | 2,655 | $ | 137 | $ | — | $ | 27,459 | ||||||||||||||
|
|
|
|
|
|
|
|
|
|
|
|
|
|
|
|||||||||||||||
| Ending balance: collectively evaluated for impairment |
$ | 3,364 | $ | 16,034 | $ | 5,438 | $ | 4,251 | $ | 405 | $ | 456 | $ | 29,948 | ||||||||||||||
|
|
|
|
|
|
|
|
|
|
|
|
|
|
|
|||||||||||||||
| Ending balance: loans acquired with deteriorated credit quality |
$ | 7,560 | $ | 3,068 | $ | 3,843 | $ | — | $ | — | $ | — | $ | 14,471 | ||||||||||||||
|
|
|
|
|
|
|
|
|
|
|
|
|
|
|
|||||||||||||||
| Ending balance: loans acquired without deteriorated credit quality |
$ | — | $ | — | $ | — | $ | — | $ | — | $ | — | $ | — | ||||||||||||||
|
|
|
|
|
|
|
|
|
|
|
|
|
|
|
|||||||||||||||
| Financing receivables |
||||||||||||||||||||||||||||
| Ending balance |
$ | 895,393 | $ | 2,046,836 | $ | 1,125,283 | $ | 1,126,504 | $ | 123,698 | $ | 15,414 | $ | 5,333,128 | ||||||||||||||
|
|
|
|
|
|
|
|
|
|
|
|
|
|
|
|||||||||||||||
| Ending balance: individually evaluated for impairment |
$ | 11,283 | $ | 119,791 | $ | 38,731 | $ | 4,650 | $ | 448 | $ | — | $ | 174,903 | ||||||||||||||
|
|
|
|
|
|
|
|
|
|
|
|
|
|
|
|||||||||||||||
| Ending balance: collectively evaluated for impairment |
$ | 493,200 | $ | 1,592,325 | $ | 1,030,922 | $ | 1,080,535 | $ | 104,091 | $ | 15,414 | $ | 4,316,487 | ||||||||||||||
|
|
|
|
|
|
|
|
|
|
|
|
|
|
|
|||||||||||||||
| Ending balance: loans acquired with deteriorated credit quality |
$ | 170,042 | $ | 136,817 | $ | 13,256 | $ | — | $ | 6,026 | $ | — | $ | 326,141 | ||||||||||||||
|
|
|
|
|
|
|
|
|
|
|
|
|
|
|
|||||||||||||||
| Ending balance: loans acquired without deteriorated credit quality |
$ | 220,868 | $ | 197,903 | $ | 42,374 | $ | 41,319 | $ | 13,133 | $ | — | $ | 515,597 | ||||||||||||||
|
|
|
|
|
|
|
|
|
|
|
|
|
|
|
|||||||||||||||
The reserve for unfunded loan commitments was $.40 million at both September 30, 2013 and 2012.
7. Accounting for Certain Loans Acquired with Deteriorated Credit Quality
As a result of the Company’s acquisition of TierOne Bank, the Company acquired certain loans that had deteriorated credit quality. Loan accounting specific to these purchased impaired loans addresses differences
F-34
Table of Contents
GREAT WESTERN BANCORPORATION, INC.
Notes to Consolidated Financial Statements
between contractual cash flows expected to be collected from the initial investment in loans if those differences are attributable, at least in part, to credit quality. Several factors were considered when evaluating whether a loan was considered a purchased impaired loan, including the delinquency status of the loan, updated borrower credit status, geographic information, and updated loan-to-values (“LTV”). U.S. GAAP allows purchasers to aggregate purchased impaired loans acquired in the same fiscal quarter in one or more pools, provided that the loans have common risk characteristics. A pool is then accounted for as a single asset with a single composite interest rate and an aggregate expectation of cash flows.
Loan pools are periodically reassessed to determine expected cash flows. In determining the expected cash flows, the timing of cash flows and prepayment assumptions for smaller, homogenous loans are based on statistical models that take into account factors such as the loan interest rate, credit profile of the borrowers, the years in which the loans were originated, and whether the loans are fixed or variable rate loans. Prepayments may be assumed on large individual loans that consider similar prepayment factors listed above for smaller homogenous loans. The re-assessment of purchased impaired loans resulted in the following changes in the accretable yield during 2013 and 2012 (in thousands):
| Balance at September 30, 2011 |
$ | 124,926 | ||
| Accretion |
(35,786 | ) | ||
| Reclassification from nonaccretable difference |
11,829 | |||
| Disposals |
(7,110 | ) | ||
|
|
|
|||
| Balance at September 30, 2012 |
93,859 | |||
| Accretion |
(29,674 | ) | ||
| Reclassification from nonaccretable difference |
6,815 | |||
| Disposals |
(3,340 | ) | ||
|
|
|
|||
| Balance at September 30, 2013 |
$ | 67,660 | ||
|
|
|
The reclassifications from nonaccretable difference noted in the table above represent instances where specific pools of loans are expected to perform better over the remaining lives of the loans than expected at the prior re-assessment date.
The following table provides purchased impaired loans at September 30, 2013 and September 30, 2012 (in thousands):
| September 30, 2013 | September 30, 2012 | |||||||||||||||||||||||
| Outstanding Balance1 |
Recorded Investment2 |
Carrying Value3 |
Outstanding Balance1 |
Recorded Investment2 |
Carrying Value3 |
|||||||||||||||||||
| Residential real estate |
$ | 143,998 | $ | 129,905 | $ | 124,871 | $ | 185,076 | $ | 170,042 | $ | 162,482 | ||||||||||||
| Commercial real estate |
172,706 | 85,022 | 84,541 | 229,463 | 136,817 | 133,749 | ||||||||||||||||||
| Commercial non real estate |
19,539 | 8,179 | 6,448 | 27,127 | 13,256 | 9,413 | ||||||||||||||||||
| Consumer |
3,721 | 3,202 | 3,202 | 7,624 | 6,026 | 6,026 | ||||||||||||||||||
|
|
|
|
|
|
|
|
|
|
|
|
|
|||||||||||||
| Total lending |
$ | 339,964 | $ | 226,308 | $ | 219,062 | $ | 449,290 | $ | 326,141 | $ | 311,670 | ||||||||||||
|
|
|
|
|
|
|
|
|
|
|
|
|
|||||||||||||
| 1 | Represents the legal balance of loans acquired with deteriorated credit quality. |
| 2 | Represents the book balance of loans acquired with deteriorated credit quality net of the unamortized discount on acquired loans of $33.09 million in 2013 and $51.21 million in 2012. |
| 3 | Represents the book balance of loans acquired with deteriorated credit quality net of the fair value mark and related allowance for loan losses. |
F-35
Table of Contents
GREAT WESTERN BANCORPORATION, INC.
Notes to Consolidated Financial Statements
Due to improved cash flows of the purchased impaired loans, the reductions to allowance recognized on previous impairments were $4,585 and $6,387 for the years ended September 30, 2013 and 2012, respectively.
8. FDIC Indemnification Asset
Under the terms of the purchase and assumption agreement with the FDIC with regard to the TierOne Bank acquisition, the Company is reimbursed for a portion of the losses incurred on covered assets. As covered assets are resolved, whether it be through repayment, short sale of the underlying collateral, the foreclosure on or sale of collateral, or the sale or charge-off of loans or OREO, any differences between the carrying value of the covered assets versus the payments received during the resolution process, that are reimbursable by the FDIC, are recognized as reductions in the FDIC indemnification asset. Any gains or losses realized from the resolution of covered assets reduce or increase, respectively, the amount recoverable from the FDIC. The following table represents a summary of the activity related to the FDIC indemnification asset for the years ended September 2013 and 2012 (in thousands):
| 2013 | 2012 | |||||||
| Balance at beginning of year |
$ | 68,662 | $ | 126,325 | ||||
| Amortization |
(12,129 | ) | (11,327 | ) | ||||
| FDIC portion of charge-offs exceeding fair value marks |
(2,106 | ) | 4,385 | |||||
| Reduction for claims filed |
(8,737 | ) | (50,721 | ) | ||||
|
|
|
|
|
|||||
| Balance at end of year |
$ | 45,690 | $ | 68,662 | ||||
|
|
|
|
|
|||||
The loss claims filed are subject to review, approval, and annual audits by the FDIC or its assigned agents for compliance with the terms in the loss sharing agreements.
9. Premises and Equipment
The major classes of premises and equipment and the total amount of accumulated depreciation as of September 30, 2013 and 2012, are as follows (in thousands):
| 2013 | 2012 | |||||||
| Land |
$ | 23,238 | $ | 24,533 | ||||
| Buildings and building improvements |
88,171 | 92,714 | ||||||
| Furniture and equipment |
42,721 | 40,573 | ||||||
| Construction in progress |
55 | 330 | ||||||
|
|
|
|
|
|||||
| 154,185 | 158,150 | |||||||
| Accumulated depreciation |
(39,805 | ) | (30,594 | ) | ||||
|
|
|
|
|
|||||
| $ | 114,380 | $ | 127,556 | |||||
|
|
|
|
|
|||||
Depreciation expense was $10.70 million and $9.58 million for the years ended September 30, 2013 and 2012, respectively.
F-36
Table of Contents
GREAT WESTERN BANCORPORATION, INC.
Notes to Consolidated Financial Statements
10. Derivative Financial Instruments
In the normal course of business, the Company uses interest rate swaps to manage its interest rate risk and market risk in accommodating the needs of its customers. Also, the Company enters into interest rate lock commitments on mortgage loans to be held for sale, with corresponding forward sales contracts related to these interest rate lock commitments.
Derivative instruments are recognized as either assets or liabilities in the accompanying consolidated financial statements and are measured at fair value.
The following table summarizes the notional amounts and estimated fair values of the Company’s derivative instruments at September 30, 2013 and 2012 (in thousands).
| 2013 | ||||||||||||||||
| Notional Amount |
Balance Sheet Location |
Positive Fair Value |
Negative Fair Value |
|||||||||||||
| Derivatives not designated as hedging instruments: |
||||||||||||||||
| Interest rate swaps |
$ | 864,040 | Liabilities | $ | 12,404 | $ | (13,555 | ) | ||||||||
| Mortgage loan commitments |
16,040 | Assets | 375 | — | ||||||||||||
| Mortgage loan forward sale contracts |
21,881 | Liabilities | — | (375 | ) | |||||||||||
| 2012 | ||||||||||||||||
| Notional Amount |
Balance Sheet Location |
Positive Fair Value |
Negative Fair Value |
|||||||||||||
| Derivatives not designated as hedging instruments: |
||||||||||||||||
| Interest rate swaps |
$ | 655,208 | Liabilities | $ | — | $ | (41,456 | ) | ||||||||
| Mortgage loan commitments |
87,952 | Liabilities | 11 | (1,672 | ) | |||||||||||
| Mortgage loan forward sale contracts |
104,716 | Assets | 1,672 | (11 | ) | |||||||||||
As with any financial instrument, derivative financial instruments have inherent risk including adverse changes in interest rates. The Company’s exposure to derivative credit risk is defined as the possibility of sustaining a loss due to the failure of the counterparty to perform in accordance with the terms of the contract. Credit risk associated with interest rate swaps is similar to those relating to traditional on-balance sheet financial instruments. The Company manages interest rate swap credit risk with the same standards and procedures applied to its commercial lending activities. Amounts due from NAB to reclaim cash collateral under the interest rate swap master netting arrangements have not been offset against the derivative balances. These receivables are classified on the consolidated balance sheets as cash and were $0 and $37.37 million as of September 30, 2013 and 2012, respectively.
The effect of derivatives on the consolidated statements of comprehensive income for the years ended September 30, 2013 and 2012 (in thousands) was as follows:
| 2013 | ||||||
| Location of Gain (Loss) Recognized in Income |
Amount of Gain (Loss) Recognized in Income |
|||||
| Derivatives not designated as hedging instruments: |
||||||
| Interest rate swaps |
Noninterest expense | $ | 40,305 | |||
| Mortgage loan commitments |
Interest income (expense) | 375 | ||||
| Mortgage loan forward sale contracts |
Interest income (expense) | (375 | ) | |||
F-37
Table of Contents
GREAT WESTERN BANCORPORATION, INC.
Notes to Consolidated Financial Statements
| 2012 | ||||||
| Location of Gain (Loss) Recognized in Income |
Amount of Gain (Loss) Recognized in Income |
|||||
| Derivatives not designated as hedging instruments: |
||||||
| Interest rate swaps |
Noninterest expense | $ | (19,369 | ) | ||
| Mortgage loan commitments |
Interest income (expense) | (1,661 | ) | |||
| Mortgage loan forward sale contracts |
Interest income (expense) | 1,661 | ||||
11. The Fair Value Option
The Company has elected to measure certain long-term loans and written loan commitments at fair value to assist in managing the interest rate risk for longer-term loans. This fair value option was elected upon the origination of these loans. Interest income is recognized in the same manner as interest on non-fair value loans.
See Note 23 for additional disclosures regarding the fair value of the fair value option loans and written loan commitments.
Long-term loans and written loan commitments for which the fair value option has been elected had a net unfavorable difference between the aggregate fair value and the aggregate unpaid loan principal balance and written loan commitment amount of approximately $4.83 million and a net favorable amount of approximately $36.33 million at September 30, 2013 and 2012, respectively. The total unpaid principal balance of these long-term loans was approximately $846.69 million and $652.47 million at September 30, 2013 and 2012, respectively. The fair value of these loans and written loan commitments is included in total loans in the consolidated balance sheets and are grouped with commercial non real estate, commercial real estate, and agricultural loans in Note 5. The fair value of these written loan commitments was not material at September 30, 2013 and 2012, respectively. None of the noted loans were greater than 90 days past due or in nonaccrual status as of September 30, 2013 or 2012.
Changes in fair value for items for which the fair value option has been elected and the line items in which these changes are reported are as follows for the years ended September 30, 2013 and 2012 (in thousands):
| 2013 | ||||||||
| Interest Income |
Total Changes in Fair Value |
|||||||
| Long-term loans and written loan commitments |
$ | (41,160 | ) | $ | (41,160 | ) | ||
| 2012 | ||||||||
| Interest Income |
Total Changes in Fair Value |
|||||||
| Long-term loans and written loan commitments |
$ | 15,093 | $ | 15,093 | ||||
For long-term loans and written loan commitments at September 30, 2013 and 2012, approximately $(0.85) million and $(4.27) million, respectively, of the total change in fair value is attributable to changes in specific credit risk. The gains or losses attributable to changes in instrument-specific credit risk were determined based on an assessment of existing market conditions and credit quality of the underlying loan for the specific portfolio of loans.
F-38
Table of Contents
GREAT WESTERN BANCORPORATION, INC.
Notes to Consolidated Financial Statements
12. Goodwill
Changes in the carrying amount of goodwill for the years ended September 30, 2013 and 2012, are as follows (in thousands):
| 2013 | 2012 | |||||||
| Balance, beginning of year |
$ | 697,807 | $ | 697,807 | ||||
| Arising from prior period purchases |
— | — | ||||||
| Arising from business acquisitions |
— | — | ||||||
|
|
|
|
|
|||||
| Balance, end of year |
$ | 697,807 | $ | 697,807 | ||||
|
|
|
|
|
|||||
Annually, the Company performs an impairment analysis to determine whether an adjustment to the carrying value of goodwill is required. The analysis is performed by comparing the fair value of the Bank to the carrying amount of its net assets. Fair value is based on the best information available, such as present value or multiple of earnings techniques. For the years ended September 30, 2013 and 2012, the Company did not recognize any impairment related to goodwill.
13. Core Deposits and Other Intangibles
A summary of intangible assets subject to amortization is as follows (in thousands):
| Core Deposit Intangible |
Brand Intangible |
Customer Relationships Intangible |
Other | Total | ||||||||||||||||
| As of September 30, 2013 |
||||||||||||||||||||
| Gross carrying amount |
$ | 92,679 | $ | 8,464 | $ | 16,089 | $ | — | $ | 117,232 | ||||||||||
| Accumulated amortization |
(73,668 | ) | (3,008 | ) | (10,112 | ) | — | (86,788 | ) | |||||||||||
|
|
|
|
|
|
|
|
|
|
|
|||||||||||
| $ | 19,011 | $ | 5,456 | $ | 5,977 | $ | — | $ | 30,444 | |||||||||||
|
|
|
|
|
|
|
|
|
|
|
|||||||||||
| As of September 30, 2012 |
||||||||||||||||||||
| Gross carrying amount |
$ | 92,679 | $ | 8,464 | $ | 16,089 | $ | 60 | $ | 117,292 | ||||||||||
| Accumulated amortization |
(56,843 | ) | (2,444 | ) | (8,216 | ) | (44 | ) | (67,547 | ) | ||||||||||
|
|
|
|
|
|
|
|
|
|
|
|||||||||||
| $ | 35,836 | $ | 6,020 | $ | 7,873 | $ | 16 | $ | 49,745 | |||||||||||
|
|
|
|
|
|
|
|
|
|
|
|||||||||||
Amortization expense of intangible assets was $19.29 million and $19.65 million for the years ended September 30, 2013 and 2012, respectively. The other intangible assets of $0.01 million were written off during 2013 to other expenses.
The estimated amortization expense of intangible assets assumes no activities, such as acquisitions, which would result in additional amortizable intangible assets. Estimated amortization expense of intangible assets in subsequent fiscal years is as follows (in thousands):
| 2014 |
$ | 16,215 | ||
| 2015 |
7,110 | |||
| 2016 |
2,822 | |||
| 2017 |
1,097 | |||
| 2018 |
564 | |||
| 2019 and thereafter |
2,636 | |||
|
|
|
|||
| $ | 30,444 | |||
|
|
|
F-39
Table of Contents
GREAT WESTERN BANCORPORATION, INC.
Notes to Consolidated Financial Statements
14. Deposits
The composition of deposits as of September 30, 2013 and 2012, is as follows (in thousands):
| 2013 | 2012 | |||||||
| Noninterest-bearing demand |
$ | 1,199,427 | $ | 1,076,437 | ||||
| NOW accounts, money market and savings |
3,601,796 | 3,037,382 | ||||||
| Time certificates, $100,000 or more |
850,817 | 1,178,095 | ||||||
| Other time certificates |
1,296,168 | 1,592,601 | ||||||
|
|
|
|
|
|||||
| $ | 6,948,208 | $ | 6,884,515 | |||||
|
|
|
|
|
|||||
At June 22, 2012, in conjunction with the purchase of assets and assumption of liabilities of NCB, the estimated fair value adjustment of the certificates of deposit (CD) was approximately $2.06 million. Monthly amortization is applied according to the estimated lives of the balances affected and is included in deposit interest expense. The unamortized amount was $0.78 million and $1.83 million as of September 30, 2013 and 2012, respectively.
Total amortization of CD fair value adjustments related to the NCB and other acquisitions was $1.54 million and $1.01 million for the years ended September 30, 2013 and 2012, respectively.
At September 30, 2013, the scheduled maturities of time certificates in subsequent fiscal years are as follows (in thousands):
| 2014 |
$ | 1,369,276 | ||
| 2015 |
448,934 | |||
| 2016 |
139,508 | |||
| 2017 |
151,687 | |||
| 2018 |
16,362 | |||
| 2019 and thereafter |
21,218 | |||
|
|
|
|||
| $ | 2,146,985 | |||
|
|
|
15. Securities Sold Under Agreements to Repurchase
Securities sold under agreements to repurchase generally mature within one to four days from the transaction date. Securities underlying the agreements had an amortized cost of approximately $226.16 million and $262.67 million and fair value of approximately $224.16 million and $268.23 million at September 30, 2013 and 2012, respectively. The Company holds the securities under third-party safekeeping agreements.
F-40
Table of Contents
GREAT WESTERN BANCORPORATION, INC.
Notes to Consolidated Financial Statements
16. FHLB Advances, Related Party Notes Payable and Other Borrowings
FHLB advances, related party notes payable, and other borrowings consist of the following at September 30, 2013 and 2012 (in thousands):
| 2013 | 2012 | |||||||
| Subordinated capital note to NAB New York (a branch of NAB), due June 2018 (callable June 2014), interest paid quarterly based on LIBOR plus 205 basis points, unsecured |
$ | 35,795 | $ | 35,795 | ||||
| $10,000 revolving line of credit to NAB due on demand, interest paid monthly based on LIBOR plus 125 basis points, unsecured |
5,500 | 5,500 | ||||||
| Notes payable to Federal Home Loan Bank (FHLB), interest rates from 0.31% to 5.81% and maturity dates from October 2013 to July 2023, collateralized by real estate loans and FHLB stock, with various call dates at the option of the FHLB |
390,500 | 305,500 | ||||||
| Other |
107 | 121 | ||||||
|
|
|
|
|
|||||
| $ | 431,902 | $ | 346,916 | |||||
|
|
|
|
|
|||||
As of September 30, 2013, based on its Federal Home Loan Bank stock holdings, the combined aggregate additional borrowing capacity of the Company with the Federal Home Loan Bank was $770.31 million.
As of September 30, 2013, FHLB advances, related party notes payable and other borrowings are due or callable (whichever is earlier) in subsequent fiscal years as follows (in thousands):
| 2014 | $ | 166,107 | ||
| 2015 |
65,000 | |||
| 2016 |
90,000 | |||
| 2017 |
25,000 | |||
| 2018 |
60,795 | |||
| 2019 and thereafter |
25,000 | |||
|
|
|
|||
| $ | 431,902 | |||
|
|
|
17. Subordinated Debentures
The Company has caused three trusts to be created that have issued Company Obligated Mandatorily Redeemable Preferred Securities (Preferred Securities). These trusts are described herein.
The sole assets of the trusts are junior subordinated deferrable interest debentures (the Debentures) issued by the Company (or assumed as part of the Sunstate Bank acquisition) with interest, maturity, and distribution provisions similar in term to the respective Preferred Securities. Additionally, to the extent interest payments are deferred on the Debentures, payment on the Preferred Securities will be deferred for the same period.
The trusts’ ability to pay amounts due on the Preferred Securities is solely dependent upon the Company making payment on the related Debentures. The Company’s obligation under the Debentures and relevant trust agreements constitute a full, irrevocable, and unconditional guarantee on a subordinated basis by it of the obligations of the trusts under the Preferred Securities.
For regulatory purposes the Debentures qualify as elements of capital. As of September 30, 2013, $56.08 million of Debentures were eligible for treatment as Tier 1 capital.
F-41
Table of Contents
GREAT WESTERN BANCORPORATION, INC.
Notes to Consolidated Financial Statements
The Company caused to be issued 22,400 shares, $1,000 par value, of Company Obligated Mandatorily Redeemable Preferred Securities (Preferred Securities) of Great Western Statutory Trust IV on December 17, 2003, through a private placement. The distribution rate is set quarterly at three-month LIBOR plus 285 basis points. Interest Payment Dates are March 17, June 17, September 17 and December 17 of each year, beginning March 17, 2004 and are payable in arrears. The Company may, at one or more times, defer interest payments on the related Debentures for up to 20 consecutive quarters following suspension of dividends on all capital stock. At the end of any deferral period, all accumulated and unpaid distributions must be paid. The Debentures will be redeemed 30 years from the issuance date; however, subject to the Company receiving prior approval of the Federal Reserve, if required, the Company has the right to redeem the Debentures in whole, but not in part, at the Special Redemption Date, at a premium as defined by the Indenture if a “Special Event” occurs prior to December 17, 2008. A “Special Event” means any Capital Treatment Event, an Investment Company Event, or a Tax Event. On or after December 17, 2008, subject to the Company receiving prior approval of the Federal Reserve, if required, the Company has the right to redeem the Debentures at the Redemption Price, in whole or in part, on an Interest Payment Date. The Redemption Price is $1,000 per Preferred Security plus any accrued and unpaid distributions to the date of redemption. Holders of the Preferred Securities have no voting rights. The Preferred Securities are unsecured and rank junior in priority of payment to all of the Company’s senior indebtedness and senior to the Company’s common and preferred stock. Proceeds from the issue were used for general corporate purposes.
The Company caused to be issued 30,000 shares, $1,000 par value, of Company Obligated Mandatorily Redeemable Preferred Securities (Preferred Securities) of GWB Capital Trust VI on March 10, 2006, through a private placement. The distribution rate is set quarterly at three-month LIBOR plus 148 basis points. Interest Payment dates are December 15, March 15, June 15, and September 15 of each year, beginning June 15, 2006, and are payable in arrears. T may, at one or more times, defer interest payments on the related Debentures for up to 20 consecutive quarters following suspension of dividends on all capital stock. At the end of any deferral period, all accumulated and unpaid interest must be paid. The Debentures will be redeemed March 15, 2036; however, subject to the Company receiving prior approval of the Federal Reserve, if required, the Company has the right to redeem the Debentures in whole, but not in part, at any Interest Payment Date, at a premium as defined by the Indenture if a “Special Event” occurs prior to March 15, 2007. A “Special Event” means any Capital Treatment Event, an Investment Company Event, or a Tax Event. On or after March 15, 2011, subject to the Company receiving approval of the Federal Reserve, if required, the Company has the right to redeem the Debentures at the Redemption Price, whole or in part, on an Interest Payment Date.
The Redemption Price is $1,000 per Preferred Security plus any accrued and unpaid interest to the date of redemption. Holders of the Preferred Securities have no voting rights. The Preferred Securities are unsecured and rank junior in priority of payment to all of the Company’s senior indebtedness and senior to the Company’s common and preferred stock. Proceeds from the issue were used for general corporate purposes including redemption of the 9.75% Preferred Securities of GWB Capital Trust II.
The Company acquired the Sunstate Bancshares Trust II in the acquisition of Sunstate Bank. Sunstate Bancshares caused to be issued 2,000 shares, $1,000 par value, of Company Obligated Mandatorily Redeemable Preferred Securities (Preferred Securities) of Sunstate Bancshares Trust II on June 1, 2005, through a private placement. The distribution rate is set quarterly at three-month LIBOR plus 185 basis points. Interest Payment dates are March 15, June 15, September 15, and December 15 of each year, beginning September 15, 2005, and are payable in arrears. The Company may, at one or more times, defer interest payments on the related Debentures for up to 20 consecutive quarters following suspension of dividends on all capital stock. At the end of any deferral period, all accumulated and unpaid interest must be paid. The Debentures will be redeemed June 15, 2035; however, subject to the Company receiving prior approval of the Federal Reserve, if required, the Company has the right to redeem the Debentures in whole or in part, at any time, within 90 days following the
F-42
Table of Contents
GREAT WESTERN BANCORPORATION, INC.
Notes to Consolidated Financial Statements
occurrence of a Special Event, at a premium as defined by the Indenture if a “Special Event” occurs prior to June 15, 2010. A “Special Event” means any Capital Treatment Event, an Investment Company Event, or a Tax Event. On or after June 15, 2010, subject to the Company receiving prior approval of the Federal Reserve, if required, the Company has the right to redeem the Debentures at the Redemption Price, in whole or in part, on an Interest Payment Date. The Redemption Price is $1,000 per Preferred Security plus any accrued and unpaid interest to the date of redemption. Holders of the Preferred Securities have no voting rights. The Preferred Securities are unsecured and rank junior in priority of payment to all of the Company’s senior indebtedness and senior to the Company’s common and preferred stock. Relating to the trusts, the Company held as assets $1.68 million in common shares at September 30, 2013 and 2012.
18. Income Taxes
The provision for income taxes charged to operations consists of the following for the years ended September 30, 2013 and 2012 (in thousands):
| 2013 | 2012 | |||||||
| Currently paid or payable |
||||||||
| Federal |
$ | 51,828 | $ | 51,677 | ||||
| State |
8,158 | 7,200 | ||||||
|
|
|
|
|
|||||
| 59,986 | 58,877 | |||||||
| Deferred tax (benefit) expense |
(6,088 | ) | (14,719 | ) | ||||
|
|
|
|
|
|||||
| Income tax expense |
$ | 53,898 | $ | 44,158 | ||||
|
|
|
|
|
|||||
The income tax provision differs from the amount of income tax determined by applying the U.S. federal income tax rate to pretax income due to the following for the years ended September 30, 2013 and 2012 (in thousands):
| 2013 | 2012 | |||||||
| Computed “expected” tax expense (35%) |
$ | 52,550 | $ | 41,004 | ||||
| Increase (decrease) in income taxes resulting from: |
||||||||
| Tax exempt interest income |
(3,856 | ) | (2,348 | ) | ||||
| State income taxes, net of federal benefit |
5,303 | 4,680 | ||||||
| Other |
(99 | ) | 822 | |||||
|
|
|
|
|
|||||
| Actual tax expense |
$ | 53,898 | $ | 44,158 | ||||
|
|
|
|
|
|||||
F-43
Table of Contents
GREAT WESTERN BANCORPORATION, INC.
Notes to Consolidated Financial Statements
Net deferred tax assets (liabilities) consist of the following components at September 30, 2013 and 2012 (in thousands):
| 2013 | 2012 | |||||||
| Deferred tax assets: |
||||||||
| Allowance for loan losses |
$ | 19,932 | $ | 22,187 | ||||
| Compensation |
320 | 420 | ||||||
| Net operating loss carryforward |
170 | 216 | ||||||
| Securities available for sale |
4,144 | — | ||||||
| Other real estate owned |
7,072 | 18,889 | ||||||
| Core deposit intangible and other fair value adjustments |
6,617 | 1,455 | ||||||
| Other |
4,834 | 2,768 | ||||||
|
|
|
|
|
|||||
| 43,089 | 45,935 | |||||||
|
|
|
|
|
|||||
| Deferred tax liabilities: |
||||||||
| Goodwill and other intangibles |
(2,619 | ) | (20,214 | ) | ||||
| Securities available for sale |
— | (11,232 | ) | |||||
| Premises and equipment |
(6,132 | ) | (8,235 | ) | ||||
| Other |
(1,712 | ) | (1,256 | ) | ||||
|
|
|
|
|
|||||
| (10,463 | ) | (40,937 | ) | |||||
|
|
|
|
|
|||||
| Net deferred tax assets (liabilities) |
$ | 32,626 | $ | 4,998 | ||||
|
|
|
|
|
|||||
At September 30, 2013 and 2012, the Company had an income tax payable to National Americas Investment, Inc. (a wholly owned subsidiary of National Americas Holdings, LLC) for $12.39 million and $5.63 million (included in income tax payable).
Management has determined a valuation reserve is not required for the deferred tax assets because it is more likely than not these assets could be realized through carry back to taxable income in prior years, future reversals of existing taxable temporary differences, and future taxable income.
Uncertain tax positions were not significant at September 30, 2013 or 2012.
The Company is no longer subject to U.S. federal, state, and local or non-U.S. income tax examinations by tax authorities for years before 2008.
19. Profit-Sharing Plan
The Company participates in a multiple employer 401(k) profit sharing plan (the Plan). All employees are eligible to participate, beginning with the first day of the month coincident with or immediately following the completion of one year of service and having reached the age of 21. In addition to employee contributions, the Company may contribute discretionary amounts for eligible participants. Contribution rates for participating employers must be equal. The Company contributed $4.48 million and $4.13 million to the Plan for the years ended September 30, 2013 and 2012, respectively.
As part of the NCB business combination, the Company acquired a multiple employer noncontributory tax-qualified defined benefit plan (the Retirement Plan). Effective July 1, 2008, the Retirement Plan was frozen, eliminating all future benefit accruals.
F-44
Table of Contents
GREAT WESTERN BANCORPORATION, INC.
Notes to Consolidated Financial Statements
20. Regulatory Matters
The Company and the Bank are subject to certain restrictions on the amount of dividends that may be declared without prior regulatory approval and are subject to various regulatory capital requirements administered by the federal banking agencies. Failure to meet minimum capital requirements can initiate certain mandatory, and possibly additional discretionary, actions by regulators that, if undertaken, could have a direct material effect on the Company’s consolidated financial statements. Under capital adequacy guidelines and the regulatory framework for prompt corrective action, the Company must meet specific capital guidelines that involve quantitative measures of assets, liabilities, and certain off-balance-sheet items as calculated under regulatory accounting practices. Capital amounts and classification are also subject to qualitative judgments by the regulators about components, risk weightings, and other factors.
Quantitative measures established by regulation to ensure capital adequacy require the Company and the Bank to maintain minimum amounts and ratios (set forth in the table following) of total and Tier 1 capital to risk-weighted assets, and of Tier 1 capital to average assets (all defined in the regulations). The Company met all capital adequacy and net worth requirements to which they are subject as of September 30, 2013 and 2012.
The most recent notifications from the regulatory agencies categorize the Bank as well capitalized under the regulatory framework for prompt corrective action. To be categorized as well-capitalized, the Bank must maintain minimum total risk-based, Tier 1 risk-based, and Tier 1 leverage ratios as set forth in the following table. There are no conditions or events since those notifications that management believes have changed the categories.
As an approved mortgage seller, the Bank is required to maintain a minimum level of capital specified by the United States Department of Housing and Urban Development. At September 30, 2013 and 2012, the Bank met these requirements.
F-45
Table of Contents
GREAT WESTERN BANCORPORATION, INC.
Notes to Consolidated Financial Statements
Capital amounts and ratios are presented in the following table (in thousands):
| Actual | For Capital Adequacy Purposes |
To Be Well Capitalized Under Prompt Corrective Action Provisions |
||||||||||||||||||||||
| Amount | Ratio | Amount | Ratio | Amount | Ratio | |||||||||||||||||||
| As of September 30, 2013 |
||||||||||||||||||||||||
| Total risk based capital (to risk-weighted assets): |
||||||||||||||||||||||||
| Consolidated |
$ | 846,689 | 13.80 | % | $ | 490,865 | 8.00 | % | N/A | N/A | ||||||||||||||
| Bank |
848,534 | 13.83 | % | 490,793 | 8.00 | % | $ | 613,492 | 10.00 | % | ||||||||||||||
| Tier 1 risk based capital (to risk-weighted assets): |
||||||||||||||||||||||||
| Consolidated |
762,189 | 12.42 | % | 245,433 | 4.00 | % | N/A | N/A | ||||||||||||||||
| Bank |
792,670 | 12.92 | % | 245,397 | 4.00 | % | 368,095 | 6.00 | % | |||||||||||||||
| Tier 1 leverage capital (to average assets): |
||||||||||||||||||||||||
| Consolidated |
762,189 | 9.20 | % | 331,374 | 4.00 | % | N/A | N/A | ||||||||||||||||
| Bank |
792,670 | 9.45 | % | 335,348 | 4.00 | % | 419,185 | 5.00 | % | |||||||||||||||
| As of September 30, 2012 |
||||||||||||||||||||||||
| Total risk based capital (to risk-weighted assets): |
||||||||||||||||||||||||
| Consolidated |
$ | 794,517 | 13.70 | % | $ | 463,879 | 8.00 | % | N/A | N/A | ||||||||||||||
| Bank |
794,074 | 13.69 | % | 464,000 | 8.00 | % | $ | 579,999 | 10.00 | % | ||||||||||||||
| Tier 1 risk based capital (to risk-weighted assets): |
||||||||||||||||||||||||
| Consolidated |
686,844 | 11.85 | % | 231,939 | 4.00 | % | N/A | N/A | ||||||||||||||||
| Bank |
722,196 | 12.45 | % | 232,000 | 4.00 | % | 348,000 | 6.00 | % | |||||||||||||||
| Tier 1 leverage capital (to average assets): |
||||||||||||||||||||||||
| Consolidated |
686,844 | 8.32 | % | 330,137 | 4.00 | % | N/A | N/A | ||||||||||||||||
| Bank |
722,196 | 8.75 | % | 330,137 | 4.00 | % | 412,671 | 5.00 | % | |||||||||||||||
21. Commitments and Contingencies
Financial Instruments with Off-Balance-Sheet Risk
The Company is party to financial instruments with off-balance-sheet risk in the normal course of business to meet the financing needs of its customers. These financial instruments include commitments to extend credit and letters of credit. They involve, to varying degrees, elements of credit risk in excess of the amount recognized in the consolidated balance sheets. The Company’s exposure to credit loss in the event of nonperformance by the other party to the financial instrument for commitments to extend credit and letters of credit is represented by the contractual amount of those instruments. A summary of the Company’s commitments as of September 30, 2013 and 2012, is as follows (in thousands):
| 2013 | 2012 | |||||||
| Commitments to extend credit |
$ | 1,713,869 | $ | 1,451,680 | ||||
| Letters of credit |
51,893 | 61,111 | ||||||
F-46
Table of Contents
GREAT WESTERN BANCORPORATION, INC.
Notes to Consolidated Financial Statements
Commitments to extend credit are agreements to lend to a customer provided there is no violation of any condition established in the contract. Since many of the commitments are expected to expire without being drawn upon, the total commitment amounts do not necessarily represent future cash requirements. Letters of credit are conditional commitments issued by the Company to guarantee the performance of a customer to a third party. Those guarantees are primarily issued to support public and private borrowing arrangements. The credit risk involved in issuing letters of credit is essentially the same as that involved in extending loans to customers. The Company evaluates each customer’s credit worthiness on a case-by-case basis. The credit and collateral policy for commitments and letters of credit is comparable to that for granting loans.
Asset Sales
The Bank has provided guarantees in connection with the sale of loans and has assumed a similar obligation in its acquisitions of TierOne Bank in June 2010 and NCB in June 2012. The guarantees are generally in the form of asset buy back or make whole provisions that are triggered upon a credit event and remain in effect until the loans are collected. The maximum potential future payment related to these guarantees is not readily determinable because the Company’s obligation under these agreements depends on the occurrence of future events. There were $0.16 million loans repurchased for the year ended September 30, 2013, which have subsequently been charged off. Incurred losses related to these repurchased loans and guaranteed loans as of September 30, 2013 and 2012, are not significant.
Financial Instruments with Concentration of Credit Risk by Geographic Location
A substantial portion of the Company’s customers’ ability to honor their contracts is dependent on the economy in eastern and northern Nebraska, northern Missouri, northeastern Kansas, Iowa, southeastern Arizona, central Colorado, and South Dakota. Although the Company’s loan portfolio is diversified, there is a relationship in these regions between the agricultural economy and the economic performance of loans made to nonagricultural customers. The concentration of credit in the regional agricultural economy is taken into consideration by management in determining the allowance for loan losses.
Lease Commitments
The Company leases several branch locations under terms of operating lease agreements expiring through December 31, 2021. The Company has the option to renew these leases for periods that range from 1 to 5 years. Total rent expense for these leases for the years ended September 30, 2013 and 2012, was $5.62 million and $5.32 million, respectively.
Approximate future minimum rental payments for operating leases in excess of one year in subsequent fiscal years are as follows (in thousands):
| 2014 |
$ | 4,324 | ||
| 2015 |
3,644 | |||
| 2016 |
3,080 | |||
| 2017 |
2,464 | |||
| 2018 |
1,721 | |||
| 2019 and thereafter |
2,327 | |||
|
|
|
|||
| $ | 17,560 | |||
|
|
|
F-47
Table of Contents
GREAT WESTERN BANCORPORATION, INC.
Notes to Consolidated Financial Statements
Contingencies
In the normal course of business, the Company is involved in various legal proceedings. In the opinion of management, any liability resulting from such proceedings would not have a material adverse effect on the Company’s consolidated financial statements.
The Company was a defendant in a case that challenged the Company’s ordering of transactions posted to customer checking accounts. The Company entered into and satisfied the settlement during 2012. The settlement was not material to the Company’s consolidated financial statements.
22. Transactions With Related Parties
The Company has had, and may be expected to have in the future, banking transactions in the ordinary course of business with directors, executive officers, their immediate families, and affiliated companies in which they have 10% or more beneficial ownership (commonly referred to as related parties). Total loans committed to related parties were not significant at September 30, 2013 and 2012.
In conjunction with the purchase of the Company on June 3, 2008, the subordinated capital notes with Capital Investors, LLC were redeemed and a new subordinated capital note was issued to NAB New York (a branch of NAB) in the amount of $35.80 million. The subordinated capital note bears interest at a floating rate of LIBOR plus 205 basis points and is due June 3, 2018, with interest payable quarterly. The interest rate at September 30, 2013, was 2.51685%, and resets quarterly on each September 3, December 3, March 3, and June 3. The Company has the right, subject to regulatory approval, to prepay the subordinated capital note without penalty. The Company’s obligations under its Preferred Securities guarantee and the junior subordinated debentures are unsecured and rank junior to the Company’s obligations under its subordinated capital note.
In addition, the Company obtained a $10.00 million revolving line of credit with NAB, which is due on demand. The line of credit has an interest rate of LIBOR plus 125 basis points, with interest payable quarterly. The interest rate was 1.43206% at September 30, 2013, and will reset on December 5. There were outstanding advances of $5.50 million on this line of credit at September 30, 2013 and 2012.
NAB acts as the counterparty for all of the Company’s interest rate swaps. These swaps are discussed in Note 10.
NAB acts as a dealer on certain security purchases. Securities purchased from NAB totaled $56.12 million for the year ended September 30, 2013. No commissions were paid to NAB in connection with these purchases.
Interest paid to related parties for notes payable as discussed above and in Note 16 was $0.91 million and $1.00 million for the years ended September 30, 2013 and 2012, respectively.
NAB provides the Company’s employees with restricted shares of NAB stock subsequent to meeting short- and long-term incentive goals. A payable is recorded between the Company and NAB based on the value and vesting schedule of issued shares. The liability included in accrued expenses on the consolidated balance sheets was $2.36 million and $1.92 million at September 30, 2013 and 2012, respectively. The expense related to the restricted shares was $1.94 million and $2.14 million for the years ended September 30, 2013 and 2012, respectively, and is included within salaries and employee benefits on the consolidated statements of comprehensive income.
F-48
Table of Contents
GREAT WESTERN BANCORPORATION, INC.
Notes to Consolidated Financial Statements
23. Fair Value of Financial Instruments and Interest Rate Risk
The Company measures, monitors and discloses certain of its assets and liabilities on a fair value basis. Fair value is defined as the price that would be received to sell an asset or paid to transfer a liability in an orderly transaction between market participants at the measurement date. The fair value guidance also establishes a fair value hierarchy that requires an entity to maximize the use of observable inputs and minimize the use of unobservable inputs when measuring fair value. The guidance describes three levels of inputs that may be used to measure fair value are as follows:
| Level 1 |
Quoted prices in active markets for identical assets or liabilities | |
| Level 2 |
Observable inputs other than Level 1 prices, such as quoted prices for similar assets or liabilities; quoted prices in markets that are not active; or other inputs that are observable or can be corroborated by observable market data for substantially the full term of the assets or liabilities | |
| Level 3 |
Unobservable inputs that are supported by little or no market activity and that are significant to the fair value of the assets or liabilities | |
Level 1 inputs are considered to be the most transparent and reliable and Level 3 inputs are considered to be the least transparent and reliable. The Company assumes the use of the principal market to conduct a transaction of each particular asset or liability being measured and then considers the assumptions that market participants would use when pricing the asset or liability. Whenever possible, the Company first looks for quoted prices for identical assets or liabilities in active markets (Level 1 inputs) to value each asset or liability. However, when inputs from identical assets or liabilities on active markets are not available, the Company utilizes market observable data for similar assets and liabilities. The Company maximizes the use of observable inputs and limits the use of unobservable inputs to occasions when observable inputs are not available. The need to use unobservable inputs generally results from the lack of market liquidity of the actual financial instrument or of the underlying collateral. Although in some instances, third party price indications may be available, limited trading activity can challenge the observability of these quotations.
Assets and Liabilities Measured at Fair Value on a Recurring Basis
Following is a description of the valuation methodologies and inputs used for assets and liabilities measured at fair value on a recurring basis and recognized in the accompanying consolidated balance sheets, as well as the general classification of such assets and liabilities pursuant to the valuation hierarchy.
Securities Available for Sale
Where quoted market prices are available in an active market, securities are classified within Level 1 of the valuation hierarchy. These securities are based on valuations using quoted prices. If quoted market prices are not available, then fair values are estimated by using pricing models, quoted prices of securities with similar characteristics, or discounted cash flows. Level 2 securities include U.S. Treasury, U.S. government agency, agency mortgage-backed, states and political subdivisions, corporate debt, and other securities. Where Level 1 or Level 2 inputs are not available, securities are classified within Level 3 of the hierarchy.
Interest Rate Swaps and Loans
Interest rate swaps are valued using the system used to value all of NAB’s traded securities and derivatives using LIBOR rates. The fair value of loans accounted for under the fair value option represents the net carrying value of the loan, plus the equal and opposite amount of the value of the swap needed to hedge the interest rate risk and
F-49
Table of Contents
GREAT WESTERN BANCORPORATION, INC.
Notes to Consolidated Financial Statements
an adjustment for credit risk based on our assessment of existing market conditions for the specific portfolio of loans. This is used due to the strict prepayment penalties put in the loan terms to cover the cost of exiting the hedge of the loans in the case of early prepayment or termination. The adjustment for credit risk on loans accounted for under the fair value option is not significant to the overall fair value of the loans. The fair values estimated by NAB use interest rates that are observable or that can be corroborated by observable market data and, therefore, are classified within Level 2 of the valuation hierarchy. The Company is required to post cash collateral to NAB for interest rate derivative contracts that are in a liability position, thus a credit risk adjustment on interest rate swaps is not warranted.
The following table presents the fair value measurements of assets and liabilities recognized in the accompanying consolidated balance sheets measured at fair value on a recurring basis and the level within the fair value hierarchy in which the fair value measurements fall at September 30 (in thousands):
| Fair Value | Level 1 | Level 2 | Level 3 | |||||||||||||
| As of September 30, 2013 |
||||||||||||||||
| U.S. Treasury securities |
$ | — | $ | — | $ | — | $ | — | ||||||||
| Mortgage-backed securities |
1,459,444 | — | 1,459,444 | — | ||||||||||||
| States and political subdivision securities |
3,532 | — | 3,532 | — | ||||||||||||
| Corporate debt securities |
12,013 | — | 12,013 | — | ||||||||||||
| Other |
5,460 | — | 5,460 | — | ||||||||||||
|
|
|
|
|
|
|
|
|
|||||||||
| Securities available for sale |
$ | 1,480,449 | $ | — | $ | 1,480,449 | $ | — | ||||||||
|
|
|
|
|
|
|
|
|
|||||||||
| Derivatives—assets |
$ | 375 | $ | — | $ | 375 | $ | — | ||||||||
| Derivatives—liabilities |
1,526 | — | 1,526 | — | ||||||||||||
| Fair value loans and written loan commitments |
841,862 | — | 841,862 | — | ||||||||||||
| Fair Value | Level 1 | Level 2 | Level 3 | |||||||||||||
| As of September 30, 2012 |
||||||||||||||||
| U.S. Treasury securities |
$ | 5,107 | $ | — | $ | 5,107 | $ | — | ||||||||
| Mortgage-backed securities |
1,531,194 | — | 1,531,194 | — | ||||||||||||
| States and political subdivision securities |
5,814 | — | 5,814 | — | ||||||||||||
| Corporate debt securities |
34,311 | — | 34,311 | — | ||||||||||||
| Other |
5,449 | — | 5,449 | — | ||||||||||||
|
|
|
|
|
|
|
|
|
|||||||||
| Securities available for sale |
$ | 1,581,875 | $ | — | $ | 1,581,875 | $ | — | ||||||||
|
|
|
|
|
|
|
|
|
|||||||||
| Derivatives—assets |
$ | 1,661 | $ | — | $ | 1,661 | $ | — | ||||||||
| Derivatives—liabilities |
43,117 | — | 43,117 | — | ||||||||||||
| Fair value loans and written loan commitments |
688,799 | — | 688,799 | — | ||||||||||||
Assets and Liabilities Measured at Fair Value on a Nonrecurring Basis
Following is a description of the valuation methodologies used for assets and liabilities measured at fair value on a nonrecurring basis and recognized in the accompanying consolidated balance sheets, as well as the general classification of such assets and liabilities pursuant to the valuation hierarchy.
Impaired Loans (Collateral Dependent)
Loans for which it is probable that the Company will not collect all principal and interest due according to contractual terms are measured for impairment. Allowable methods for estimating fair value include using the fair value of the collateral for collateral dependent loans or, where a loan is determined not to be collateral dependent, using the discounted cash flow method.
F-50
Table of Contents
GREAT WESTERN BANCORPORATION, INC.
Notes to Consolidated Financial Statements
If the impaired loan is identified as collateral dependent, then the fair value method of measuring the amount of the impairment is utilized. This method requires obtaining a current independent appraisal of the collateral and applying a discount factor, if necessary, to the appraised value and including costs to sell. Because many of these inputs are not observable, the measurements are classified as Level 3.
Other Real Estate Owned (OREO)
Other real estate owned consists of loan collateral that has been repossessed through foreclosure. This collateral is comprised of commercial and residential real estate. OREO is recorded initially at fair value of the collateral less estimated selling costs. Subsequent to foreclosure, valuations are updated periodically, and the assets may be marked down further to fair value less selling costs, reflecting a valuation allowance. Fair value measurements may be based upon appraisals, third-party price opinions, or internally developed pricing methods. These measurements are classified as Level 3.
Mortgage Loans Held for Sale
Fair value of mortgage loans held for sale is based on either quoted prices for the same or similar loans, or values obtained from third parties, or are estimated for portfolios of loans with similar financial characteristics and are therefore considered a Level 2 valuation.
The following tables present the fair value measurement of assets and liabilities measured at fair value on a nonrecurring basis and the level within the fair value hierarchy in which the fair value measurements fall at September 30, 2013 and 2012 (in thousands):
| Fair Value | Level 1 | Level 2 | Level 3 | |||||||||||||
| As of September 30, 2013 |
||||||||||||||||
| Other real estate owned |
$ | 40,723 | $ | — | $ | — | $ | 40,723 | ||||||||
| Impaired loans |
154,512 | — | — | 154,512 | ||||||||||||
| Loans held for sale, at lower of cost or fair value |
8,271 | — | 8,271 | — | ||||||||||||
| As of September 30, 2012 |
||||||||||||||||
| Other real estate owned |
$ | 24,145 | $ | — | $ | — | $ | 24,145 | ||||||||
| Impaired loans |
148,497 | — | — | 148,497 | ||||||||||||
| Loans held for sale, at lower of cost or fair value |
29,268 | — | 29,268 | — | ||||||||||||
The valuation techniques and significant unobservable inputs used to measure Level 3 fair value measurements at September 30, 2013 were as follows:
| Financial Instrument |
Fair Value of Assets / (Liabilities) at September 30, 2013 |
Valuation |
Unobservable |
Range |
Weighted Average | |||||||
| Other real estate owned |
$ | 40,723 | Appraisal value | Property specific adjustment | N/A | N/A | ||||||
| Impaired loans |
$ | 154,512 | Appraisal value | Property specific adjustment |
N/A | N/A | ||||||
F-51
Table of Contents
GREAT WESTERN BANCORPORATION, INC.
Notes to Consolidated Financial Statements
Fair Value of Financial Instruments
For financial instruments that have quoted market prices, those quotes are used to determine fair value. Financial instruments that have no defined maturity, have a remaining maturity of 180 days or less, or reprice frequently to a market rate are assumed to have a fair value that approximates carrying value, after taking into consideration any applicable credit risk. If no market quotes are available, financial instruments are valued by discounting the expected cash flows using an estimated current market interest rate for the financial instrument.
The short maturity of the Company’s assets and liabilities results in having a significant number of financial instruments whose fair value equals or closely approximates carrying value. Such financial instruments are reported in the following consolidated balance sheet categories: cash and due from banks, securities sold under agreements to repurchase, and accrued interest.
Fair value estimates are based on existing on and off-balance sheet financial instruments without attempting to estimate the value of anticipated future business and the value of assets and liabilities that are not considered financial instruments. Significant assets and liabilities that are not considered financial instruments include premises and equipment, deferred income taxes, goodwill, and core deposit and other intangibles. In addition, the tax ramifications related to the realization of unrealized gains and losses can have a significant effect on fair value estimates and have not been considered in the estimates.
Off-balance sheet instruments (commitments to extend credit and standby letters of credit) are generally short-term and at variable rates. Therefore, both the carrying amount and the estimated fair value associated with these instruments are immaterial. Fair values for balance sheet instruments as of September 30, 2013 and 2012, are as follows (in thousands):
| 2013 | 2012 | |||||||||||||||||||
| Level in Fair Value Hierarchy |
Carrying Amount |
Fair Value | Carrying Amount |
Fair Value | ||||||||||||||||
| Assets |
||||||||||||||||||||
| Cash and due from banks |
Level 1 | $ | 282,157 | $ | 282,157 | $ | 255,985 | $ | 255,985 | |||||||||||
| Loans, net excluding fair valued loans and loans held for sale |
Level 3 | 5,456,676 | 5,420,963 | 5,348,629 | 5,344,167 | |||||||||||||||
| Accrued interest receivable |
Level 2 | 41,065 | 41,065 | 40,736 | 40,736 | |||||||||||||||
| Federal Home Loan Bank stock |
Level 2 | 28,765 | 28,765 | 26,798 | 26,798 | |||||||||||||||
| Liabilities |
||||||||||||||||||||
| Deposits |
Level 3 | $ | (6,948,208 | ) | $ | (6,959,936 | ) | $ | (6,884,515 | ) | $ | (6,904,210 | ) | |||||||
| FHLB advances, related party notes payable, and other borrowings |
Level 2 | (431,902 | ) | (421,593 | ) | (346,916 | ) | (345,901 | ) | |||||||||||
| Securities sold under repurchase agreements |
Level 2 | (217,562 | ) | (217,562 | ) | (235,572 | ) | (235,572 | ) | |||||||||||
| Accrued interest payable |
Level 2 | (6,790 | ) | (6,790 | (11,460 | ) | (11,460 | ) | ||||||||||||
| Subordinated debentures |
Level 2 | (56,083 | ) | (56,084 | ) | (56,083 | ) | (56,086 | ) | |||||||||||
The following methods and assumptions were used in estimating the fair value of financial instruments that were not previously disclosed:
Cash and cash due from banks: Due to the short term nature of cash and cash equivalents, the estimated fair value is equal to the carrying value and they are categorized as a Level 1 fair value measurement.
F-52
Table of Contents
GREAT WESTERN BANCORPORATION, INC.
Notes to Consolidated Financial Statements
Loans, net excluding fair valued loans and loans held for sale: The fair value of the loan portfolio is estimated using observable inputs including estimated cash flows, and discount rates based on interest rates currently being offered for loans with similar terms, to borrowers of similar credit quality. Loans held for investment are categorized as a Level 3 fair value measurement.
Accrued interest receivable: Due to the nature of accrued interest receivable, the estimated fair value is equal to the carrying value and they are categorized as a Level 2 fair value measurement.
Federal Home Loan Bank stock: The carrying amount of FHLB stock approximates its fair value as it can only be redeemed with the FHLB at par value. Federal Home Loan Bank stock has been categorized as a Level 2 fair value measurement.
Deposits: The estimated fair value of deposits with no stated maturity, such as non-interest bearing demand deposits, savings, NOW, and money market accounts, is equal to the amount payable on demand. The fair value of interest-bearing time deposits is based on the discounted value of contractual cash flows of such deposits, taking into account the option for early withdrawal. The discount rate is estimated using the rates offered by the Company, at the respective measurement dates, for deposits of similar maturities. Deposits have been categorized as a Level 3 fair value measurement.
FHLB advances, related party notes payable, and other borrowings: The fair value of FHLB advances, related party notes payable, and other borrowings is estimated using discounted cash flow analysis, based on current incremental borrowing rates for similar types of borrowing arrangements. In the absence of a reasonably precise methodology to determine the fair value of the credit agreement, carrying value has been used to represent fair value. FHLB advances, related party notes payable, and other borrowings have been categorized as a Level 2 fair value measurement.
Securities sold under repurchase agreements: The Company’s repurchase agreements are overnight transactions that mature the day after the transaction, and as a result of this short-term nature, the estimated fair value equals the carrying value. Securities sold under repurchase agreements have been categorized as a Level 2 fair value measurement.
Accrued interest payable: Due to the nature of accrued interest payable, the estimated fair value is equal to the carrying value and they are categorized as a Level 2 fair value measurement.
Subordinated Debentures: The fair value of subordinated debentures is estimated using discounted cash flow analysis, based on current incremental debt rates. In the absence of a reasonably precise methodology to determine the fair value of the credit agreement, carrying value has been used to represent fair value. Subordinated debentures have been categorized as a Level 2 fair value measurement.
24. Earnings per Share
Basic earnings per share computations for the years ended September 30, 2013 and 2012 were determined by dividing net income by the weighted-average number of common shares outstanding during the years then ended. The Company had no potentially dilutive securities outstanding during the periods presented.
F-53
Table of Contents
GREAT WESTERN BANCORPORATION, INC.
Notes to Consolidated Financial Statements
The following information was used in the computation of basic earnings per share (EPS) for the years ended September 30, 2013 and 2012 (in thousands except share data).
| 2013 | 2012 | |||||||
| Basic earnings per share computation: |
||||||||
| Net income |
$ | 96,243 | $ | 72,995 | ||||
| Weighted average common shares outstanding |
198,731 | 198,731 | ||||||
|
|
|
|
|
|||||
| Basic EPS |
$ | 484.29 | $ | 367.31 | ||||
|
|
|
|
|
|||||
25. Parent Company Only Financial Statements
Parent company only financial information for Great Western Bancorporation, Inc. is summarized as follows:
Condensed Balance Sheets
(In thousands)
| September 30 | ||||||||
| 2013 | 2012 | |||||||
| Assets |
||||||||
| Cash and due from banks |
$ | 6,710 | $ | 2,512 | ||||
| Investment in subsidiaries |
1,503,778 | 1,480,008 | ||||||
| Investment in affiliates |
1,683 | 1,683 | ||||||
| Accrued interest receivable |
2 | 2 | ||||||
| Net deferred tax assets |
413 | 566 | ||||||
| Other assets |
14,521 | 7,482 | ||||||
|
|
|
|
|
|||||
| Total assets |
$ | 1,527,107 | $ | 1,492,253 | ||||
|
|
|
|
|
|||||
| Liabilities and stockholder’s equity |
||||||||
| Related party notes payable |
$ | 41,295 | $ | 41,295 | ||||
| Subordinated debentures |
56,083 | 56,083 | ||||||
| Accrued interest payable |
113 | 121 | ||||||
| Income taxes payable |
12,390 | 5,629 | ||||||
| Accrued expenses and other liabilities |
12 | 562 | ||||||
|
|
|
|
|
|||||
| Total liabilities |
109,893 | 103,690 | ||||||
| Stockholder’s equity |
||||||||
| Common stock |
199 | 199 | ||||||
| Additional paid-in capital |
1,260,504 | 1,260,504 | ||||||
| Retained earnings |
163,592 | 108,749 | ||||||
| Accumulated other comprehensive income (loss) |
(7,081 | ) | 19,111 | |||||
|
|
|
|
|
|||||
| Total stockholder’s equity |
1,417,214 | 1,388,563 | ||||||
|
|
|
|
|
|||||
| Total liabilities and stockholder’s equity |
$ | 1,527,107 | $ | 1,492,253 | ||||
|
|
|
|
|
|||||
F-54
Table of Contents
GREAT WESTERN BANCORPORATION, INC.
Notes to Consolidated Financial Statements
Condensed Statements of Comprehensive Income
(In thousands)
| Year Ended September 30 | ||||||||
| 2013 | 2012 | |||||||
| Interest and dividend income |
||||||||
| Dividends on securities |
$ | 112 | $ | 264 | ||||
| Federal funds sold and other |
40 | 43 | ||||||
|
|
|
|
|
|||||
| Total interest and dividend income |
152 | 307 | ||||||
|
|
|
|
|
|||||
| Interest expense |
||||||||
| Related party notes payable |
950 | 1,007 | ||||||
| Subordinated debentures |
1,347 | 1,436 | ||||||
|
|
|
|
|
|||||
| Total interest expense |
2,297 | 2,443 | ||||||
|
|
|
|
|
|||||
| Net interest income (loss) |
(2,145 | ) | (2,136 | ) | ||||
| Noninterest income |
||||||||
| Net gain (loss) on sale of investments |
(73 | ) | (363 | ) | ||||
| Other |
— | 23 | ||||||
|
|
|
|
|
|||||
| Total noninterest income |
(73 | ) | (340 | ) | ||||
|
|
|
|
|
|||||
| Noninterest expense |
||||||||
| Salaries and employee benefits |
906 | 1,655 | ||||||
| Data processing |
203 | 1 | ||||||
| Equipment expenses |
— | 1 | ||||||
| Advertising |
— | 1 | ||||||
| Communication expenses |
— | 1 | ||||||
| Professional fees |
135 | 120 | ||||||
| Other |
2,112 | 1,405 | ||||||
|
|
|
|
|
|||||
| Total noninterest expense |
3,356 | 3,184 | ||||||
|
|
|
|
|
|||||
| Income (loss) before equity in net income of subsidiaries and income taxes |
(5,574 | ) | (5,660 | ) | ||||
| Equity in net income of subsidiaries |
99,862 | 76,598 | ||||||
| Provision for income taxes |
(1,955 | ) | (2,057 | ) | ||||
|
|
|
|
|
|||||
| Net income |
$ | 96,243 | $ | 72,995 | ||||
|
|
|
|
|
|||||
F-55
Table of Contents
GREAT WESTERN BANCORPORATION, INC.
Notes to Consolidated Financial Statements
Condensed Statements of Cash Flows
(In thousands)
| Year Ended September 30 | ||||||||
| 2013 | 2012 | |||||||
| Operating Activities | ||||||||
| Net income |
$ | 96,243 | $ | 72,995 | ||||
| Adjustments to reconcile net income to net cash provided by operating activities: |
||||||||
| Depreciation and amortization |
— | 1 | ||||||
| Deferred income taxes |
750 | (1,817 | ) | |||||
| Changes in: |
||||||||
| Prepaid expenses and other assets |
(875 | ) | 9,213 | |||||
| Accrued interest and other liabilities |
(558 | ) | 369 | |||||
| Equity in undistributed net income of subsidiaries |
(49,962 | ) | (30,796 | ) | ||||
|
|
|
|
|
|||||
| Net cash provided by operating activities |
45,598 | 49,965 | ||||||
| Financing Activities |
||||||||
| Net change in note payable to NAB |
— | (7,000 | ) | |||||
| Dividends paid |
(41,400 | ) | (41,800 | ) | ||||
|
|
|
|
|
|||||
| Net cash used in financing activities |
(41,400 | ) | (48,800 | ) | ||||
|
|
|
|
|
|||||
| Change in cash and due from banks |
4,198 | 1,165 | ||||||
| Cash and due from banks, beginning of year |
2,512 | 1,347 | ||||||
|
|
|
|
|
|||||
| Cash and due from banks, end of year |
$ | 6,710 | $ | 2,512 | ||||
|
|
|
|
|
|||||
F-56
Table of Contents
GREAT WESTERN BANCORPORATION, INC.
(In Thousands, Except Share Data)
| June 30, 2014 (Unaudited) |
September 30, 2013 | |||||||
| Assets |
||||||||
| Cash and due from banks |
$ | 235,077 | $ | 282,157 | ||||
| Securities |
1,395,768 | 1,480,449 | ||||||
| Investment in affiliates |
1,683 | 1,683 | ||||||
| Loans, net of allowance for loan losses of $47,038 and $55,864 at June 30, 2014 and September 30, 2013, respectively (includes $259,677 and $347,408 of loans covered by FDIC loss share agreements at June 30, 2014 and September 30, 2013, respectively, $931,541 and $841,862 of loans and written loan commitments at fair value under the fair value option at June 30, 2014 and September 30, 2013, respectively, and $10,994 and $8,271 of loans held for sale at June 30, 2014 and September 30, 2013, respectively) |
6,631,463 | 6,306,809 | ||||||
| Premises and equipment |
107,129 | 114,380 | ||||||
| Accrued interest receivable |
37,055 | 41,065 | ||||||
| Other repossessed property (includes $13,967 and $24,412 of property covered under FDIC loss share agreements at June 30, 2014 and September 30, 2013, respectively) |
54,190 | 57,422 | ||||||
| FDIC indemnification asset |
32,232 | 45,690 | ||||||
| Goodwill |
697,807 | 697,807 | ||||||
| Core deposits and other intangibles |
16,996 | 30,444 | ||||||
| Net deferred tax assets |
38,685 | 32,626 | ||||||
| Other assets |
44,198 | 43,726 | ||||||
|
|
|
|
|
|||||
| Total assets |
$ | 9,292,283 | $ | 9,134,258 | ||||
|
|
|
|
|
|||||
| Liabilities and stockholder’s equity |
||||||||
| Deposits: |
||||||||
| Noninterest-bearing |
$ | 1,294,131 | $ | 1,199,427 | ||||
| Interest-bearing |
5,772,981 | 5,748,781 | ||||||
|
|
|
|
|
|||||
| Total deposits |
7,067,112 | 6,948,208 | ||||||
| Securities sold under agreements to repurchase |
185,620 | 217,562 | ||||||
| FHLB advances and other borrowings |
435,097 | 390,607 | ||||||
| Related party notes payable |
41,295 | 41,295 | ||||||
| Subordinated debentures |
56,083 | 56,083 | ||||||
| Fair value of derivatives |
13,310 | 1,526 | ||||||
| Accrued interest payable |
5,643 | 6,790 | ||||||
| Income tax payable |
16,798 | 12,390 | ||||||
| Accrued expenses and other liabilities |
40,361 | 42,583 | ||||||
|
|
|
|
|
|||||
| Total liabilities |
7,861,319 | 7,717,044 | ||||||
| Stockholder’s equity |
||||||||
| Common stock, $1 par value, authorized 250,000 shares; issued and outstanding at June 30, 2014 and September 30, 2013 - 198,731 shares |
199 | 199 | ||||||
| Additional paid-in capital |
1,260,504 | 1,260,504 | ||||||
| Retained earnings |
172,669 | 163,592 | ||||||
| Accumulated other comprehensive loss |
(2,408 | ) | (7,081 | ) | ||||
|
|
|
|
|
|||||
| Total stockholder’s equity |
1,430,964 | 1,417,214 | ||||||
|
|
|
|
|
|||||
| Total liabilities and stockholder’s equity |
$ | 9,292,283 | $ | 9,134,258 | ||||
|
|
|
|
|
|||||
See accompanying notes.
F-57
Table of Contents
GREAT WESTERN BANCORPORATION, INC.
Consolidated Statements of Comprehensive Income (Unaudited)
(In Thousands, Except Share and Per Share Data)
| Nine Months Ended | ||||||||
| June 30, 2014 | June 30, 2013 | |||||||
| Interest and dividend income |
||||||||
| Loans |
$ | 240,362 | $ | 188,666 | ||||
| Taxable securities |
20,190 | 20,817 | ||||||
| Nontaxable securities |
61 | 113 | ||||||
| Dividends on securities |
751 | 701 | ||||||
| Federal funds sold and other |
400 | 262 | ||||||
|
|
|
|
|
|||||
| Total interest and dividend income |
261,764 | 210,559 | ||||||
|
|
|
|
|
|||||
| Interest expense |
||||||||
| Deposits |
19,629 | 25,975 | ||||||
| Securities sold under agreements to repurchase |
442 | 489 | ||||||
| FHLB advances and other borrowings |
2,591 | 2,158 | ||||||
| Related party notes payable |
690 | 714 | ||||||
| Subordinated debentures and other |
985 | 1,013 | ||||||
|
|
|
|
|
|||||
| Total interest expense |
24,337 | 30,349 | ||||||
|
|
|
|
|
|||||
| Net interest income |
237,427 | 180,210 | ||||||
| Provision (recovery) for loan losses |
(2,065 | ) | 14,034 | |||||
|
|
|
|
|
|||||
| Net interest income after provision (recovery) for loan losses |
239,492 | 166,176 | ||||||
| Noninterest income |
||||||||
| Service charges and other fees |
29,728 | 30,927 | ||||||
| Net gain on sale of loans |
3,885 | 11,108 | ||||||
| Casualty insurance commissions |
877 | 955 | ||||||
| Investment center income |
1,757 | 2,050 | ||||||
| Net gain on sale of securities |
6 | 1,741 | ||||||
| Trust department income |
2,847 | 2,601 | ||||||
| Net gain from sale of repossessed property and other assets |
2,413 | 2,235 | ||||||
| Other |
4,070 | 7,997 | ||||||
|
|
|
|
|
|||||
| Total noninterest income |
45,583 | 59,614 | ||||||
|
|
|
|
|
|||||
| Noninterest expense |
||||||||
| Salaries and employee benefits |
$ | 71,176 | $ | 76,123 | ||||
| Occupancy expenses, net |
13,613 | 13,919 | ||||||
| Data processing |
14,105 | 13,749 | ||||||
| Equipment expenses |
3,099 | 3,361 | ||||||
| Advertising |
3,385 | 4,684 | ||||||
| Communication expenses |
3,402 | 3,585 | ||||||
| Professional fees |
9,623 | 8,855 | ||||||
| Derivatives, net (gain) loss |
12,119 | (41,635 | ) | |||||
| Amortization of core deposits and other intangibles |
13,448 | 14,600 | ||||||
| Other |
22,466 | 18,947 | ||||||
|
|
|
|
|
|||||
| Total noninterest expense |
166,436 | 116,188 | ||||||
|
|
|
|
|
|||||
| Income before income taxes |
118,639 | 109,602 | ||||||
| Provision for income taxes |
41,562 | 39,682 | ||||||
|
|
|
|
|
|||||
| Net income |
$ | 77,077 | $ | 69,920 | ||||
|
|
|
|
|
|||||
| Other comprehensive income (loss) - change in net unrealized gain (loss) on securities available-for-sale (net of deferred income tax (expense) benefit of $(2,684) and $10,887 for the nine months ended June 30, 2014 and 2013, respectively) |
4,673 | (18,549 | ) | |||||
|
|
|
|
|
|||||
| Comprehensive income |
$ | 81,750 | $ | 51,371 | ||||
|
|
|
|
|
|||||
| Basic earnings per share |
||||||||
| Weighted average number of shares outstanding |
198,731 | 198,731 | ||||||
| Earnings per share |
$ | 387.85 | $ | 351.83 | ||||
| Dividends per share |
||||||||
| Dividends issued |
$ | 68,000 | $ | 41,400 | ||||
| Dividends per share |
$ | 342.17 | $ | 208.32 | ||||
See accompanying notes.
F-58
Table of Contents
GREAT WESTERN BANCORPORATION, INC.
Consolidated Statements of Stockholder’s Equity (Unaudited)
(In Thousands, Except Share and Per Share Data)
| Comprehensive Income |
Common Stock Par Value |
Additional Paid-in Capital |
Retained Earnings |
Accumulated Other Comprehensive Income (Loss) |
Total | |||||||||||||||||||
| Balance, September 30, 2012 |
$ | 199 | $ | 1,260,504 | $ | 108,749 | $ | 19,111 | $ | 1,388,563 | ||||||||||||||
| Net income |
$ | 69,920 | — | — | 69,920 | — | 69,920 | |||||||||||||||||
| Other comprehensive income (loss), net of tax: |
||||||||||||||||||||||||
| Net change in net unrealized gain (loss) on securities available for sale |
(18,549 | ) | — | — | — | (18,549 | ) | (18,549 | ) | |||||||||||||||
|
|
|
|||||||||||||||||||||||
| Comprehensive income |
$ | 51,371 | ||||||||||||||||||||||
|
|
|
|||||||||||||||||||||||
| Cash dividends paid: |
||||||||||||||||||||||||
| Common stock, $97.62 per share |
— | — | (19,400 | ) | — | (19,400 | ) | |||||||||||||||||
| Common stock, $110.70 per share |
— | — | (22,000 | ) | — | (22,000 | ) | |||||||||||||||||
|
|
|
|
|
|
|
|
|
|
|
|||||||||||||||
| Balance, June 30, 2013 |
$ | 199 | $ | 1,260,504 | $ | 137,269 | $ | 562 | $ | 1,398,534 | ||||||||||||||
|
|
|
|
|
|
|
|
|
|
|
|||||||||||||||
| Balance, September 30, 2013 |
$ | 199 | $ | 1,260,504 | $ | 163,592 | $ | (7,081 | ) | $ | 1,417,214 | |||||||||||||
| Net income |
$ | 77,077 | — | — | 77,077 | — | 77,077 | |||||||||||||||||
| Other comprehensive income (loss), net of tax: |
||||||||||||||||||||||||
| Net change in net unrealized gain (loss) on securities available for sale |
4,673 | — | — | — | 4,673 | 4,673 | ||||||||||||||||||
|
|
|
|||||||||||||||||||||||
| Comprehensive income |
$ | 81,750 | ||||||||||||||||||||||
|
|
|
|||||||||||||||||||||||
| Cash dividends paid: |
||||||||||||||||||||||||
| Common stock, $171.09 per share |
— | — | (34,000 | ) | — | (34,000 | ) | |||||||||||||||||
| Common stock, $171.09 per share |
— | — | (34,000 | ) | — | (34,000 | ) | |||||||||||||||||
|
|
|
|
|
|
|
|
|
|
|
|||||||||||||||
| Balance, June 30, 2014 |
$ | 199 | $ | 1,260,504 | $ | 172,669 | $ | (2,408 | ) | $ | 1,430,964 | |||||||||||||
|
|
|
|
|
|
|
|
|
|
|
|||||||||||||||
See accompanying notes.
F-59
Table of Contents
GREAT WESTERN BANCORPORATION, INC.
Consolidated Statements of Cash Flows (Unaudited)
(In Thousands)
| Nine Months Ended | ||||||||
| June 30, 2014 | June 30, 2013 | |||||||
| Operating activities |
||||||||
| Net income |
$ | 77,077 | $ | 69,920 | ||||
| Adjustments to reconcile net income to net cash provided by operating activities: |
||||||||
| Depreciation and amortization |
27,790 | 33,758 | ||||||
| Net gain on sale of securities |
(6 | ) | (1,741 | ) | ||||
| Net gain on sale of loans |
(3,885 | ) | (11,108 | ) | ||||
| Net loss on sale of premises and equipment |
1,417 | 551 | ||||||
| Net gain from sale of repossessed assets and other assets |
(2,413 | ) | (2,235 | ) | ||||
| Provision (recovery) for loan losses |
(2,065 | ) | 14,034 | |||||
| Provision for repossessed assets |
8,997 | 241 | ||||||
| Proceeds from FDIC indemnification claims |
5,330 | 6,422 | ||||||
| Originations of residential real estate loans held-for-sale |
(149,001 | ) | (347,062 | ) | ||||
| Proceeds from sales of residential real estate loans held-for-sale |
150,163 | 366,460 | ||||||
| Net deferred income taxes |
(8,743 | ) | (11,509 | ) | ||||
| Changes in: |
||||||||
| Accrued interest receivable |
4,010 | 2,857 | ||||||
| Other assets |
1,175 | 3,069 | ||||||
| FDIC indemnification asset |
8,128 | 10,016 | ||||||
| FDIC clawback liability |
682 | 250 | ||||||
| Accrued interest payable and other liabilities |
12,145 | (34,759 | ) | |||||
|
|
|
|
|
|||||
| Net cash provided by operating activities |
130,801 | 99,164 | ||||||
|
|
|
|
|
|||||
| Investing activities |
||||||||
| Purchase of securities available for sale |
(148,670 | ) | (486,701 | ) | ||||
| Proceeds from sales and maturities of securities available for sale |
233,725 | 426,342 | ||||||
| Net increase in loans |
(351,360 | ) | (187,324 | ) | ||||
| Purchase of premises and equipment |
(2,263 | ) | (2,420 | ) | ||||
| Proceeds from sale of premises and equipment |
743 | 2,036 | ||||||
| Proceeds from sale of other assets |
28,141 | 32,758 | ||||||
| Purchase of FHLB stock |
(1,649 | ) | (5,690 | ) | ||||
|
|
|
|
|
|||||
| Net cash used in investing activities |
(241,333 | ) | (220,999 | ) | ||||
|
|
|
|
|
|||||
| Financing activities |
||||||||
| Net increase in deposits |
$ | 118,904 | $ | 24,323 | ||||
| Net decrease in securities sold under agreements to repurchase |
(31,942 | ) | (7,457 | ) | ||||
| Proceeds from FHLB advances and other borrowings |
44,490 | 119,990 | ||||||
| Dividends paid |
(68,000 | ) | (41,400 | ) | ||||
|
|
|
|
|
|||||
| Net cash provided by financing activities |
63,452 | 95,456 | ||||||
|
|
|
|
|
|||||
| Net change in cash and due from banks |
(47,080 | ) | (26,379 | ) | ||||
| Cash and due from banks, beginning of period |
282,157 | 255,985 | ||||||
|
|
|
|
|
|||||
| Cash and due from banks, end of period |
$ | 235,077 | $ | 229,606 | ||||
|
|
|
|
|
|||||
| Supplemental disclosures of cash flows information |
||||||||
| Cash payments for interest |
$ | 25,484 | $ | 30,154 | ||||
|
|
|
|
|
|||||
| Cash payments for income taxes |
$ | 45,520 | $ | 42,112 | ||||
|
|
|
|
|
|||||
| Supplemental schedules of noncash investing and financing activities |
||||||||
| Loans transferred to repossessed assets and other assets |
$ | (31,493 | ) | $ | (20,460 | ) | ||
|
|
|
|
|
|||||
See accompanying notes.
F-60
Table of Contents
GREAT WESTERN BANCORPORATION, INC.
Notes to Consolidated Financial Statements (Unaudited)
1. Basis of Presentation
Great Western Bancorporation, Inc. (the “Company”) is a bank holding company organized under the laws of Iowa. The primary business of the Company is ownership of its wholly owned subsidiary, Great Western Bank (the “Bank”). The Bank is a full-service regional bank focused on relationship-based business and agri-business banking in Arizona, Colorado, Iowa, Kansas, Missouri, Nebraska, and South Dakota. The Company and the Bank are subject to the regulation of certain federal and/or state agencies and undergo periodic examinations by those regulatory authorities. Substantially all of the Company’s income is generated from banking operations. The Company is a wholly owned indirect subsidiary of National Australia Bank Limited (“NAB”).
The accompanying unaudited consolidated interim financial statements have been prepared in accordance with accounting principles generally accepted in the United States (“U.S. GAAP”) and reflect all adjustments that are, in the opinion of management, necessary for the fair presentation of the financial position and results of operations for the periods presented. All such adjustments are of a normal recurring nature. The unaudited consolidated financial statements should be read in conjunction with the Company’s audited consolidated financial statements for the year ending September 30, 2013. The results of operations for interim periods are not necessarily indicative of the results that may be expected for the year or any other period.
The accompanying unaudited consolidated financial statements include the accounts and results of operations of the Company and its subsidiaries after elimination of all significant intercompany accounts and transactions. The preparation of unaudited consolidated financial statements in conformity with U.S. GAAP requires management to make certain estimates and assumptions that affect the amounts reported in the consolidated financial statements and accompanying notes. Actual results could differ from these estimates.
The Company has evaluated all events or transactions that occurred through the date the Company issued these financial statements. During this period, the Company did not have any material recognizable or non-recognizable subsequent events other than outlined below.
In July 2014, NAB formed Great Western Bancorp, Inc. (“Bancorp”), a Delaware corporation. Bancorp will succeed to the business of the Company whose consolidated financial statements and related notes are included in this document. Bancorp holds no assets other than the nominal amount of cash contributed as equity to it in connection with its formation. Bancorp has also not engaged in any business or other activities other than in connection with its formation and as the registrant for this offering.
2. New Accounting Pronouncements
In May 2014, the Financial Accounting Standards Board (“FASB”) issued Accounting Standards Update (“ASU”) No. 2014-09 “Revenue from Contracts with Customers (Topic 606)”, which does not apply to financial instruments. The core principle of the guidance is that an entity should recognize revenue to depict the transfer of promised goods or services to customers in an amount that reflects the consideration to which the entity expects to be entitled in exchange for those goods and services. ASU 2014-09 is effective for annual reporting periods beginning after December 15, 2016, including interim periods within that reporting period. The amendments can be applied retrospectively to each prior reporting period or retrospectively with the cumulative effect of initially applying this ASU recognized at the date of initial application. Early application is not permitted. The Company is assessing the impact of ASU 2014-09 on its accounting and disclosures.
In January 2014, the FASB issued ASU 2014-04, Receivables—Troubled Debt Restructurings by Creditors (Subtopic 310-40): Reclassification of Residential Real Estate Collateralized Consumer Mortgage Loans upon Foreclosure. The update amends existing literature to eliminate diversity in practice by clarifying and defining
F-61
Table of Contents
GREAT WESTERN BANCORPORATION, INC.
Notes to Consolidated Financial Statements (Unaudited)
when an in substance repossession or foreclosure occurs. The terms “in substance repossession or foreclosure” and “physical possession” are not currently defined in the accounting literature, resulting in diversity in practice when a creditor derecognizes a loan receivable and recognizes the real estate property collateralizing the loan receivable as an asset. Additionally, the update requires interim and annual disclosures of both the amount of foreclosed residential real estate property and the recorded investment in consumer mortgage loans collateralized by residential real estate property that are in the process of foreclosure. The update is effective for annual periods and the interim periods within those annual periods beginning after December 15, 2014. The adoption of the update to existing standards is not expected to have a material impact to the Company’s consolidated financial statements.
3. Restrictions on Cash and Due from Banks
The Company is required to maintain reserve balances in cash and on deposit with the Federal Reserve based on a percentage of deposits. The total requirement was approximately $43.27 million and $52.66 million at June 30, 2014 and September 30, 2013, respectively.
4. Securities
The amortized cost and approximate fair value of investments in securities, all of which are classified as available for sale according to management’s intent, are summarized as follows (in thousands):
| Amortized Cost |
Gross Unrealized Gains |
Gross Unrealized Losses |
Fair Value | |||||||||||||
| As of June 30, 2014 |
||||||||||||||||
| U.S. Treasury securities |
$ | 148,733 | $ | 605 | $ | — | $ | 149,338 | ||||||||
| Mortgage-backed securities: |
||||||||||||||||
| Government National Mortgage Association |
1,235,906 | 8,105 | (12,806 | ) | 1,231,205 | |||||||||||
| Federal National Mortgage Association |
1 | — | — | 1 | ||||||||||||
| States and political subdivision securities |
2,218 | 2 | — | 2,220 | ||||||||||||
| Corporate debt securities |
11,771 | 196 | — | 11,967 | ||||||||||||
| Other |
1,007 | 30 | — | 1,037 | ||||||||||||
|
|
|
|
|
|
|
|
|
|||||||||
| $ | 1,399,636 | $ | 8,938 | $ | (12,806 | ) | $ | 1,395,768 | ||||||||
|
|
|
|
|
|
|
|
|
|||||||||
| Amortized Cost |
Gross Unrealized Gains |
Gross Unrealized Losses |
Fair Value | |||||||||||||
| As of September 30, 2013 |
||||||||||||||||
| U.S. Treasury securities |
$ | — | $ | — | $ | — | $ | — | ||||||||
| Mortgage-backed securities: |
||||||||||||||||
| Government National Mortgage Association |
1,470,822 | 9,634 | (21,013 | ) | 1,459,443 | |||||||||||
| Federal National Mortgage Association |
1 | — | — | 1 | ||||||||||||
| States and political subdivision securities |
3,513 | 19 | — | 3,532 | ||||||||||||
| Corporate debt securities |
11,889 | 133 | (9 | ) | 12,013 | |||||||||||
| Other |
5,449 | 17 | (6 | ) | 5,460 | |||||||||||
|
|
|
|
|
|
|
|
|
|||||||||
| $ | 1,491,674 | $ | 9,803 | $ | (21,028 | ) | $ | 1,480,449 | ||||||||
|
|
|
|
|
|
|
|
|
|||||||||
F-62
Table of Contents
GREAT WESTERN BANCORPORATION, INC.
Notes to Consolidated Financial Statements (Unaudited)
The amortized cost and approximate fair value of debt securities available for sale as of June 30, 2014 and September 30, 2013, by contractual maturity, are shown below. Maturities of mortgage-backed securities may differ from contractual maturities because the mortgages underlying the securities may be called or repaid without any penalties.
| June 30, 2014 | September 30, 2013 | |||||||||||||||
| (In thousands) | Amortized Cost |
Fair Value | Amortized Cost |
Fair Value | ||||||||||||
| Due in one year or less |
$ | 7,246 | $ | 7,296 | $ | 1,497 | $ | 1,514 | ||||||||
| Due after one year through five years |
149,177 | 149,784 | 6,988 | 7,123 | ||||||||||||
| Due after five years through ten years |
6,299 | 6,445 | 6,917 | 6,908 | ||||||||||||
| Due after ten years |
— | — | — | — | ||||||||||||
|
|
|
|
|
|
|
|
|
|||||||||
| 162,722 | 163,525 | 15,402 | 15,545 | |||||||||||||
| Mortgage-backed securities |
1,235,907 | 1,231,206 | 1,470,823 | 1,459,444 | ||||||||||||
| Securities without contractual maturities |
1,007 | 1,037 | 5,449 | 5,460 | ||||||||||||
|
|
|
|
|
|
|
|
|
|||||||||
| $ | 1,399,636 | $ | 1,395,768 | $ | 1,491,674 | $ | 1,480,449 | |||||||||
|
|
|
|
|
|
|
|
|
|||||||||
Proceeds from sales of securities available for sale were $4.45 million and $49.44 million for the nine months ended June 30, 2014 and 2013, respectively. Gross gains of $0.01 million and $1.74 million for the nine months ended June 30, 2014 and 2013, respectively and gross losses of $0 for both the nine months ended June 30, 2014 and 2013 were realized on the sales, using the specific identification method.
Securities with a carrying value of approximately $1,174.02 million and $1,090.37 million at June 30, 2014 and September 30, 2013, respectively, were pledged as collateral on public deposits, securities sold under agreements to repurchase, and for other purposes as required or permitted by law. The counterparties do not have the right to sell or pledge the securities the Company has pledged as collateral.
As detailed in the following tables, certain investments in debt securities, which are approximately 53% and 62% of the Company’s investment portfolio at June 30, 2014 and September 30, 2013, respectively, are reported in the consolidated financial statements at an amount less than their amortized cost. Based on evaluation of available evidence, including recent changes in market interest rates, credit rating information, implicit or explicit government guarantees, and information obtained from regulatory filings, management believes the declines in fair value for these securities are temporary. As the Company does not intend to sell the securities and it is not more likely than not that the Company will be required to sell the securities before the recovery of their amortized cost basis, which may be maturity, the Company does not consider the securities to be other than temporarily impaired at June 30, 2014 or September 30, 2013. For the nine months ended June 30, 2014 and 2013, the Company did not recognize any other-than-temporary impairment.
F-63
Table of Contents
GREAT WESTERN BANCORPORATION, INC.
Notes to Consolidated Financial Statements (Unaudited)
The following table presents the Company’s gross unrealized losses and approximate fair value in investments, aggregated by investment category and length of time that individual securities have been in a continuous unrealized loss position (in thousands):
| Less Than 12 Months | June 30, 2014 12 Months or More |
Total | ||||||||||||||||||||||
| Fair Value | Unrealized Losses |
Fair Value |
Unrealized Losses |
Fair Value |
Unrealized Losses |
|||||||||||||||||||
| U.S. Treasury securities |
$ | — | $ | — | $ | — | $ | — | $ | — | $ | — | ||||||||||||
| Mortgage-backed securities |
136,531 | (867 | ) | 602,818 | (11,939 | ) | 739,349 | (12,806 | ) | |||||||||||||||
| Corporate debt securities |
— | — | — | — | — | — | ||||||||||||||||||
| Other |
— | — | — | — | — | — | ||||||||||||||||||
|
|
|
|
|
|
|
|
|
|
|
|
|
|||||||||||||
| $ | 136,531 | $ | (867 | ) | $ | 602,818 | $ | (11,939 | ) | $ | 739,349 | $ | (12,806 | ) | ||||||||||
|
|
|
|
|
|
|
|
|
|
|
|
|
|||||||||||||
| Less Than 12 Months | September 30, 2013 12 Months or More |
Total | ||||||||||||||||||||||
| Fair Value | Unrealized Losses |
Fair Value |
Unrealized Losses |
Fair Value |
Unrealized Losses |
|||||||||||||||||||
| Mortgage-backed securities |
$ | 852,344 | $ | (19,469 | ) | $ | 56,781 | $ | (1,544 | ) | $ | 909,125 | $ | (21,013 | ) | |||||||||
| Corporate debt securities |
4,436 | (9 | ) | — | — | 4,436 | (9 | ) | ||||||||||||||||
| Other |
— | — | 4,986 | (6 | ) | 4,986 | (6 | ) | ||||||||||||||||
|
|
|
|
|
|
|
|
|
|
|
|
|
|||||||||||||
| $ | 856,780 | $ | (19,478 | ) | $ | 61,767 | $ | (1,550 | ) | $ | 918,547 | $ | (21,028 | ) | ||||||||||
|
|
|
|
|
|
|
|
|
|
|
|
|
|||||||||||||
The Company’s investments in nonmarketable equity securities are all stock of the Federal Home Loan Bank. The carrying value of Federal Home Loan Bank stock was $30.41 million and $28.77 million as of June 30, 2014 and September 30, 2013, respectively, and is reported in other assets in the consolidated balance sheets.
The components of other comprehensive income from net unrealized gains (losses) on securities available for sale for the nine months ended June 30, 2014 and 2013, are as follows (in thousands):
| June 30, 2014 | June 30, 2013 | |||||||
| Beginning balance accumulated other comprehensive income (loss) |
$ | (7,081 | ) | $ | 19,111 | |||
| Net unrealized holding gain (loss) arising during the period |
7,363 | (27,695 | ) | |||||
| Reclassification adjustment for net gain realized in net income |
(6 | ) | (1,741 | ) | ||||
|
|
|
|
|
|||||
| Net change in unrealized gain (loss) before income taxes |
7,357 | (29,436 | ) | |||||
| Income tax (expense) benefit |
(2,684 | ) | 10,887 | |||||
|
|
|
|
|
|||||
| Net change in unrealized gain (loss) on securities |
4,673 | (18,549 | ) | |||||
|
|
|
|
|
|||||
| Ending balance accumulated other comprehensive income (loss) |
$ | (2,408 | ) | $ | 562 | |||
|
|
|
|
|
|||||
F-64
Table of Contents
GREAT WESTERN BANCORPORATION, INC.
Notes to Consolidated Financial Statements (Unaudited)
5. Loans
The composition of net loans as of June 30, 2014 and September 30, 2013, is as follows (in thousands):
| June 30, 2014 |
September 30, 2013 |
|||||||
| Residential real estate |
$ | 911,313 | $ | 906,469 | ||||
| Commercial real estate |
2,406,925 | 2,311,974 | ||||||
| Commercial non real estate |
1,621,949 | 1,481,756 | ||||||
| Agriculture |
1,648,856 | 1,587,248 | ||||||
| Consumer |
90,919 | 101,477 | ||||||
| Other |
30,363 | 24,711 | ||||||
|
|
|
|
|
|||||
| 6,710,325 | 6,413,635 | |||||||
| Less: |
||||||||
| Allowance for loan losses |
(47,038 | ) | (55,864 | ) | ||||
| Unamortized discount on acquired loans |
(27,732 | ) | (34,717 | ) | ||||
| Unearned net deferred fees and costs and loans in process |
(4,092 | ) | (16,245 | ) | ||||
|
|
|
|
|
|||||
| $ | 6,631,463 | $ | 6,306,809 | |||||
|
|
|
|
|
|||||
The loan breakouts above include loans covered by FDIC loss sharing agreements totaling $259.68 million and $347.41 million as of June 30, 2014 and September 30, 2013, respectively, real estate loans held for sale totaling $10.99 million and $8.27 million as of June 30, 2014 and September 30, 2013, respectively, and $931.54 million and $841.86 million of loans and written loan commitments accounted for at fair value as of June 30, 2014 and September 30, 2013, respectively.
Unamortized net deferred fees and costs totaled $5.84 million and $5.19 million as of June 30, 2014 and September 30, 2013, respectively.
Loans in process totaled $(1.75) million and $11.06 million as of June 30, 2014 and September 30, 2013, respectively. Loans in process represent loans that have been funded as of the balance sheet dates but not classified into a loan category and loan payments received as of the balance sheet dates that have not been applied to individual loan accounts.
Loans guaranteed by agencies of the U.S. government totaled $100.67 million and $104.04 million at June 30, 2014 and September 30, 2013, respectively.
Principal balances of residential real estate loans sold totaled $146.28 million and $355.35 million for the nine months ended June 30, 2014 and 2013, respectively.
Principal balances of loans pledged to the Federal Home Loan Bank to collateralize notes payable totaled $2,099.48 million and $1,984.67 million at June 30, 2014 and September 30, 2013, respectively.
F-65
Table of Contents
GREAT WESTERN BANCORPORATION, INC.
Notes to Consolidated Financial Statements (Unaudited)
The following table presents the Company’s nonaccrual loans at June 30, 2014 and September 30, 2013 (in thousands), excluding loans covered under the FDIC loss-sharing agreements. Loans greater than 90 days past due and still accruing interest as of June 30, 2014 and September 30, 2013 were not significant.
| Nonaccrual loans |
June 30, 2014 |
September 30, 2013 |
||||||
| Residential real estate |
$ | 6,615 | $ | 8,746 | ||||
| Commercial real estate |
19,978 | 57,652 | ||||||
| Commercial non real estate |
4,380 | 6,641 | ||||||
| Agriculture |
11,381 | 8,236 | ||||||
| Consumer |
139 | 226 | ||||||
|
|
|
|
|
|||||
| Total |
$ | 42,493 | $ | 81,501 | ||||
|
|
|
|
|
|||||
The following table (in thousands) presents the Company’s past due loans at June 30, 2014 and September 30, 2013. This table is presented net of unamortized discount on acquired loans and excludes loans measured at fair value with changes in fair value reported in earnings of $931.54 million as of June 30, 2014 and $841.86 million as of September 30, 2013:
| As of June 30, 2014 | 30-59 Days Past Due |
60-89 Days Past Due |
Greater Than 90 Days |
Total Past Due |
Current | Total Financing Receivables |
||||||||||||||||||
| Residential real estate |
$ | 1,304 | $ | 1,149 | $ | 2,491 | $ | 4,944 | $ | 761,859 | $ | 766,803 | ||||||||||||
| Commercial real estate |
1,551 | 1,031 | 4,727 | 7,309 | 1,903,683 | 1,910,992 | ||||||||||||||||||
| Commercial non real estate |
13,046 | 1,251 | 1,069 | 15,366 | 1,338,922 | 1,354,288 | ||||||||||||||||||
| Agriculture |
489 | 1,525 | 6,955 | 8,969 | 1,329,406 | 1,338,375 | ||||||||||||||||||
| Consumer |
269 | 217 | 40 | 526 | 90,040 | 90,566 | ||||||||||||||||||
| Other |
— | — | — | — | 30,363 | 30,363 | ||||||||||||||||||
|
|
|
|
|
|
|
|
|
|
|
|
|
|||||||||||||
| 16,659 | 5,173 | 15,282 | 37,114 | 5,454,273 | 5,491,387 | |||||||||||||||||||
| Loans covered by FDIC loss sharing agreements |
1,627 | 1,667 | 5,671 | 8,965 | 250,712 | 259,677 | ||||||||||||||||||
|
|
|
|
|
|
|
|
|
|
|
|
|
|||||||||||||
| Total |
$ | 18,286 | $ | 6,840 | $ | 20,953 | $ | 46,079 | $ | 5,704,985 | $ | 5,751,064 | ||||||||||||
|
|
|
|
|
|
|
|
|
|
|
|
|
|||||||||||||
| As of September 30, 2013 | 30-59 Days Past Due |
60-89 Days Past Due |
Greater Than 90 Days |
Total Past Due |
Current | Total Financing Receivables |
||||||||||||||||||
| Residential real estate |
$ | 625 | $ | 955 | $ | 4,942 | $ | 6,522 | $ | 721,333 | $ | 727,855 | ||||||||||||
| Commercial real estate |
431 | 158 | 9,639 | 10,228 | 1,797,884 | 1,808,112 | ||||||||||||||||||
| Commercial non real estate |
1,342 | 198 | 2,821 | 4,361 | 1,219,731 | 1,224,092 | ||||||||||||||||||
| Agriculture |
102 | 4,040 | 2,867 | 7,009 | 1,297,208 | 1,304,217 | ||||||||||||||||||
| Consumer |
340 | 65 | 44 | 449 | 100,214 | 100,663 | ||||||||||||||||||
| Other |
— | — | — | — | 24,711 | 24,711 | ||||||||||||||||||
|
|
|
|
|
|
|
|
|
|
|
|
|
|||||||||||||
| 2,840 | 5,416 | 20,313 | 28,569 | 5,161,081 | 5,189,650 | |||||||||||||||||||
| Loans covered by FDIC loss sharing agreements |
1,307 | 3,861 | 6,632 | 11,800 | 335,608 | 347,408 | ||||||||||||||||||
|
|
|
|
|
|
|
|
|
|
|
|
|
|||||||||||||
| Total |
$ | 4,147 | $ | 9,277 | $ | 26,945 | $ | 40,369 | $ | 5,496,689 | $ | 5,537,058 | ||||||||||||
|
|
|
|
|
|
|
|
|
|
|
|
|
|||||||||||||
F-66
Table of Contents
GREAT WESTERN BANCORPORATION, INC.
Notes to Consolidated Financial Statements (Unaudited)
The composition of the loan portfolio by internal risk rating is as follows as of June 30, 2014 and September 30, 2013. This table (in thousands) is presented net of unamortized discount on acquired loans and excludes loans measured at fair value with changes in fair value reported in earnings of $931.54 million as of June 30, 2014 and $841.86 million as of September 30, 2013:
| As of June 30, 2014 | Residential Real Estate |
Commercial Real Estate |
Commercial Non Real Estate |
Agricultural | Consumer | Other | Total | |||||||||||||||||||||
| Credit Risk Profile by Internally Assigned Grade |
||||||||||||||||||||||||||||
| Grade: |
||||||||||||||||||||||||||||
| Pass |
$ | 748,654 | $ | 1,778,189 | $ | 1,274,953 | $ | 1,159,928 | $ | 89,883 | $ | 30,363 | $ | 5,081,970 | ||||||||||||||
| Watchlist |
4,869 | 77,224 | 46,156 | 138,032 | 135 | — | 266,416 | |||||||||||||||||||||
| Substandard |
12,657 | 52,329 | 31,909 | 40,371 | 521 | — | 137,787 | |||||||||||||||||||||
| Doubtful |
623 | 3,250 | 1,270 | 44 | 27 | — | 5,214 | |||||||||||||||||||||
| Loss |
— | — | — | — | — | — | — | |||||||||||||||||||||
|
|
|
|
|
|
|
|
|
|
|
|
|
|
|
|||||||||||||||
| Ending balance |
766,803 | 1,910,992 | 1,354,288 | 1,338,375 | 90,566 | 30,363 | 5,491,387 | |||||||||||||||||||||
| Loans covered by FDIC loss sharing agreements |
134,620 | 110,664 | 12,292 | 2,035 | 66 | — | 259,677 | |||||||||||||||||||||
|
|
|
|
|
|
|
|
|
|
|
|
|
|
|
|||||||||||||||
| Total |
$ | 901,423 | $ | 2,021,656 | $ | 1,366,580 | $ | 1,340,410 | $ | 90,632 | $ | 30,363 | $ | 5,751,064 | ||||||||||||||
|
|
|
|
|
|
|
|
|
|
|
|
|
|
|
|||||||||||||||
| As of September 30, 2013 | Residential Real Estate |
Commercial Real Estate |
Commercial Non Real Estate |
Agricultural | Consumer | Other | Total | |||||||||||||||||||||
| Credit Risk Profile by Internally Assigned Grade |
||||||||||||||||||||||||||||
| Grade: |
||||||||||||||||||||||||||||
| Pass |
$ | 707,859 | $ | 1,652,694 | $ | 1,144,131 | $ | 1,192,357 | $ | 100,087 | $ | 24,711 | $ | 4,821,839 | ||||||||||||||
| Watchlist |
5,779 | 72,924 | 52,576 | 87,596 | 164 | — | 219,039 | |||||||||||||||||||||
| Substandard |
13,039 | 78,244 | 23,538 | 23,963 | 398 | — | 139,182 | |||||||||||||||||||||
| Doubtful |
1,178 | 4,250 | 3,847 | 301 | 14 | — | 9,590 | |||||||||||||||||||||
| Loss |
— | — | — | — | — | — | — | |||||||||||||||||||||
|
|
|
|
|
|
|
|
|
|
|
|
|
|
|
|||||||||||||||
| Ending balance |
727,855 | 1,808,112 | 1,224,092 | 1,304,217 | 100,663 | 24,711 | 5,189,650 | |||||||||||||||||||||
| Loans covered by FDIC loss sharing agreements |
167,835 | 150,745 | 28,163 | 525 | 140 | — | 347,408 | |||||||||||||||||||||
|
|
|
|
|
|
|
|
|
|
|
|
|
|
|
|||||||||||||||
| Total |
$ | 895,690 | $ | 1,958,857 | $ | 1,252,255 | $ | 1,304,742 | $ | 100,803 | $ | 24,711 | $ | 5,537,058 | ||||||||||||||
|
|
|
|
|
|
|
|
|
|
|
|
|
|
|
|||||||||||||||
F-67
Table of Contents
GREAT WESTERN BANCORPORATION, INC.
Notes to Consolidated Financial Statements (Unaudited)
Impaired Loans
The following table presents the Company’s impaired loans (in thousands). This table excludes loans covered by FDIC loss sharing agreements:
| Recorded Investment |
Unpaid Principal Balance |
Related Allowance |
Average Recorded Investment |
|||||||||||||
| As of June 30, 2014 |
||||||||||||||||
| Impaired loans: |
||||||||||||||||
| With an allowance recorded: |
||||||||||||||||
| Residential real estate |
$ | 13,555 | $ | 13,892 | $ | 3,184 | $ | 14,296 | ||||||||
| Commercial real estate |
73,000 | 76,041 | 4,949 | 89,912 | ||||||||||||
| Commercial non real estate |
34,148 | 37,102 | 5,081 | 32,640 | ||||||||||||
| Agriculture |
40,808 | 43,525 | 627 | 33,186 | ||||||||||||
| Consumer |
574 | 770 | 116 | 493 | ||||||||||||
|
|
|
|
|
|
|
|
|
|||||||||
| $ | 162,085 | $ | 171,330 | $ | 13,957 | $ | 170,527 | |||||||||
|
|
|
|
|
|
|
|
|
|||||||||
| Recorded Investment |
Unpaid Principal Balance |
Related Allowance |
Average Recorded Investment |
|||||||||||||
| As of September 30, 2013 |
||||||||||||||||
| Impaired loans: |
||||||||||||||||
| With an allowance recorded: |
||||||||||||||||
| Residential real estate |
$ | 15,037 | $ | 16,815 | $ | 3,217 | $ | 15,716 | ||||||||
| Commercial real estate |
106,824 | 123,523 | 5,341 | 106,780 | ||||||||||||
| Commercial non real estate |
31,132 | 32,557 | 5,607 | 34,817 | ||||||||||||
| Agriculture |
25,563 | 29,632 | 3,022 | 15,522 | ||||||||||||
| Consumer |
412 | 656 | 90 | 554 | ||||||||||||
|
|
|
|
|
|
|
|
|
|||||||||
| $ | 178,968 | $ | 203,183 | $ | 17,277 | $ | 173,389 | |||||||||
|
|
|
|
|
|
|
|
|
|||||||||
There were no impaired loans with no valuation allowance as of June 30, 2014 or September 30, 2013. Interest income recognized on impaired loans was $4.55 million and $5.71 million for the nine months ended June 30, 2014 and 2013, respectively.
Restructured Loans
Included in certain loan categories in the impaired loans are troubled debt restructurings (“TDRs”) that were classified as impaired. The TDRs do not include purchased impaired loans. When the Company grants concessions to borrowers such as reduced interest rates or extensions of loan periods that would not be considered other than because of borrowers’ financial difficulties, the modification is considered a TDR. Specific reserves included in the allowance for loan losses for TDRs were $2.96 million and $6.43 million at June 30, 2014 and September 30, 2013, respectively. Commitments to lend additional funds to borrowers whose loans were modified in a TDR were not significant as of June 30, 2014 or September 30, 2013.
F-68
Table of Contents
GREAT WESTERN BANCORPORATION, INC.
Notes to Consolidated Financial Statements (Unaudited)
The following table presents the recorded value of the Company’s TDR balances as of June 30, 2014 and September 30, 2013 (in thousands):
| June 30, 2014 | September 30, 2013 | |||||||||||||||
| Accruing | Nonaccrual | Accruing | Nonaccrual | |||||||||||||
| Residential real estate |
$ | 884 | $ | 773 | $ | 662 | $ | 1,100 | ||||||||
| Commercial real estate |
29,165 | 18,728 | 29,373 | 49,736 | ||||||||||||
| Commercial non real estate |
6,312 | 1,606 | 4,769 | 5,007 | ||||||||||||
| Agriculture |
1,032 | 8,723 | 4,326 | 7,268 | ||||||||||||
| Consumer |
41 | 14 | — | 29 | ||||||||||||
|
|
|
|
|
|
|
|
|
|||||||||
| Total |
$ | 37,434 | $ | 29,844 | $ | 39,130 | 63,140 | |||||||||
|
|
|
|
|
|
|
|
|
|||||||||
F-69
Table of Contents
GREAT WESTERN BANCORPORATION, INC.
Notes to Consolidated Financial Statements (Unaudited)
The following table presents a summary of all accruing loans restructured in TDRs during the periods ended June 30, 2014 and June 30, 2013 ($ in thousands):
| Nine months ended June 30, 2014 | Nine months ended June 30, 2013 | |||||||||||||||||||||||
| Recorded Investment | Recorded Investment | |||||||||||||||||||||||
| Number | Pre- Modification |
Post- Modification |
Number | Pre- Modification |
Post- Modification |
|||||||||||||||||||
| Residential real estate |
||||||||||||||||||||||||
| Rate modification |
— | $ | — | $ | — | — | $ | — | $ | — | ||||||||||||||
| Term extension |
2 | 74 | 74 | 2 | 77 | 77 | ||||||||||||||||||
| Payment modification |
2 | 50 | 50 | — | — | — | ||||||||||||||||||
| Bankruptcy |
1 | 130 | 130 | 1 | 5 | 5 | ||||||||||||||||||
| Other |
— | — | — | — | — | — | ||||||||||||||||||
|
|
|
|
|
|
|
|
|
|
|
|
|
|||||||||||||
| Total Residential real estate |
5 | 254 | 254 | 3 | 82 | 82 | ||||||||||||||||||
| Commercial real estate |
||||||||||||||||||||||||
| Rate modification |
— | — | — | — | — | — | ||||||||||||||||||
| Term extension |
— | — | — | 6 | 3,995 | 3,995 | ||||||||||||||||||
| Payment Modification |
2 | 2,911 | 2,911 | 2 | 13,343 | 13,343 | ||||||||||||||||||
| Bankruptcy |
— | — | — | — | — | — | ||||||||||||||||||
| Other |
— | — | — | — | — | — | ||||||||||||||||||
|
|
|
|
|
|
|
|
|
|
|
|
|
|||||||||||||
| Total Commercial real estate |
2 | 2,911 | 2,911 | 8 | 17,338 | 17,338 | ||||||||||||||||||
| Commercial non real estate |
||||||||||||||||||||||||
| Rate modification |
— | — | — | — | — | — | ||||||||||||||||||
| Term extension |
5 | 1,813 | 1,813 | 5 | 14,407 | 14,407 | ||||||||||||||||||
| Payment Modification |
5 | 2,917 | 2,917 | 4 | 2,454 | 2,454 | ||||||||||||||||||
| Bankruptcy |
— | — | — | — | — | — | ||||||||||||||||||
| Other |
2 | 329 | 329 | — | — | — | ||||||||||||||||||
|
|
|
|
|
|
|
|
|
|
|
|
|
|||||||||||||
| Total Commercial non real estate |
12 | 5,059 | 5,059 | 9 | 16,861 | 16,861 | ||||||||||||||||||
| Agriculture |
||||||||||||||||||||||||
| Rate modification |
— | — | — | — | — | — | ||||||||||||||||||
| Term extension |
— | — | — | 2 | 932 | 932 | ||||||||||||||||||
| Payment Modification |
— | — | — | — | — | — | ||||||||||||||||||
| Bankruptcy |
— | — | — | — | — | — | ||||||||||||||||||
| Other |
— | — | — | — | — | — | ||||||||||||||||||
|
|
|
|
|
|
|
|
|
|
|
|
|
|||||||||||||
| Total Agriculture |
— | — | — | 2 | 932 | 932 | ||||||||||||||||||
| Consumer |
||||||||||||||||||||||||
| Rate modification |
— | — | — | — | — | — | ||||||||||||||||||
| Term extension |
— | — | — | 1 | 3 | 3 | ||||||||||||||||||
| Payment Modification |
3 | 15 | 15 | — | — | — | ||||||||||||||||||
| Bankruptcy |
— | — | — | — | — | — | ||||||||||||||||||
| Other |
2 | 28 | 28 | — | — | — | ||||||||||||||||||
|
|
|
|
|
|
|
|
|
|
|
|
|
|||||||||||||
| Total Consumer |
5 | 43 | 43 | 1 | 3 | 3 | ||||||||||||||||||
|
|
|
|
|
|
|
|
|
|
|
|
|
|||||||||||||
| Total Accruing |
24 | $ | 8,267 | $ | 8,267 | 23 | $ | 35,216 | $ | 35,216 | ||||||||||||||
|
|
|
|
|
|
|
|
|
|
|
|
|
|||||||||||||
| Change in recorded investment due to principal paydown at time of modification |
— | — | — | — | — | — | ||||||||||||||||||
| Change in recorded investment due to chargeoffs at time of modification |
— | — | — | — | — | — | ||||||||||||||||||
F-70
Table of Contents
GREAT WESTERN BANCORPORATION, INC.
Notes to Consolidated Financial Statements (Unaudited)
The following table presents a summary of all non-accruing loans restructured in TDRs during the periods ended June 30, 2014 and June 30, 2013 ($ in thousands):
| Nine months ended June 30, 2014 | Nine months ended June 30, 2013 | |||||||||||||||||||||||
| Recorded Investment | Recorded Investment | |||||||||||||||||||||||
| Number | Pre- Modification |
Post- Modification |
Number | Pre- Modification |
Post- Modification |
|||||||||||||||||||
| Residential real estate |
||||||||||||||||||||||||
| Rate modification |
4 | $ | 98 | $ | 98 | — | $ | — | $ | — | ||||||||||||||
| Term extension |
3 | 26 | 26 | 9 | 475 | 475 | ||||||||||||||||||
| Payment Modification |
1 | 11 | 11 | — | — | — | ||||||||||||||||||
| Bankruptcy |
1 | 4 | 4 | — | — | — | ||||||||||||||||||
| Other |
1 | 38 | 38 | 2 | 147 | 147 | ||||||||||||||||||
|
|
|
|
|
|
|
|
|
|
|
|
|
|||||||||||||
| Total Residential real estate |
10 | 177 | 177 | 11 | 622 | 622 | ||||||||||||||||||
| Commercial real estate |
||||||||||||||||||||||||
| Rate modification |
2 | 500 | 500 | 1 | 232 | 232 | ||||||||||||||||||
| Term extension |
2 | 4,031 | 4,031 | 45 | 1,878 | 1,878 | ||||||||||||||||||
| Payment Modification |
— | — | — | 6 | 11,413 | 11,413 | ||||||||||||||||||
| Bankruptcy |
— | — | — | 3 | 3,162 | 3,162 | ||||||||||||||||||
| Other |
1 | 87 | 87 | |||||||||||||||||||||
|
|
|
|
|
|
|
|
|
|
|
|
|
|||||||||||||
| Total Commercial real estate |
5 | 4,618 | 4,618 | 15 | 16,685 | 16,685 | ||||||||||||||||||
| Commercial non real estate |
||||||||||||||||||||||||
| Rate modification |
— | — | — | 1 | 1,067 | 1,067 | ||||||||||||||||||
| Term extension |
8 | 125 | 125 | 5 | 994 | 994 | ||||||||||||||||||
| Payment Modification |
1 | 36 | 36 | 2 | 1,352 | 1,352 | ||||||||||||||||||
| Bankruptcy |
1 | 10 | 10 | — | — | — | ||||||||||||||||||
| Other |
— | — | — | — | — | — | ||||||||||||||||||
|
|
|
|
|
|
|
|
|
|
|
|
|
|||||||||||||
| Total Commercial non real estate |
10 | 171 | 171 | 8 | 3,413 | 3,413 | ||||||||||||||||||
| Agriculture |
||||||||||||||||||||||||
| Rate modification |
— | — | — | — | — | — | ||||||||||||||||||
| Term extension |
2 | 260 | 260 | — | — | — | ||||||||||||||||||
| Payment Modification |
— | — | — | — | — | — | ||||||||||||||||||
| Bankruptcy |
— | — | — | — | — | — | ||||||||||||||||||
| Other |
— | — | — | — | — | — | ||||||||||||||||||
|
|
|
|
|
|
|
|
|
|
|
|
|
|||||||||||||
| Total Agriculture |
2 | 260 | 260 | — | — | — | ||||||||||||||||||
| Consumer |
||||||||||||||||||||||||
| Rate modification |
— | — | — | — | — | — | ||||||||||||||||||
| Term extension |
1 | 11 | 11 | 3 | 14 | 14 | ||||||||||||||||||
| Payment Modification |
— | — | — | — | — | — | ||||||||||||||||||
| Bankruptcy |
— | — | — | — | — | — | ||||||||||||||||||
| Other |
1 | 1 | 1 | |||||||||||||||||||||
|
|
|
|
|
|
|
|
|
|
|
|
|
|||||||||||||
| Total Consumer |
2 | 12 | 12 | 3 | 14 | 14 | ||||||||||||||||||
|
|
|
|
|
|
|
|
|
|
|
|
|
|||||||||||||
| Total Non-accruing |
29 | $ | 5,238 | $ | 5,238 | 37 | $ | 20,734 | $ | 20,734 | ||||||||||||||
|
|
|
|
|
|
|
|
|
|
|
|
|
|||||||||||||
| Change in recorded investment due to principal paydown at time of modification |
— | — | — | — | — | — | ||||||||||||||||||
| Change in recorded investment due to chargeoffs at time of modification |
— | — | — | — | — | — | ||||||||||||||||||
F-71
Table of Contents
GREAT WESTERN BANCORPORATION, INC.
Notes to Consolidated Financial Statements (Unaudited)
For the nine months ended June 30, 2014 and 2013, the table below represents defaults on loans that were first modified during the previous 12 months, that became 90 days or more delinquent or were charged-off during the nine months ended June 30, 2014 and 2013, respectively.
| June 30, 2014 | June 30, 2013 | |||||||||||||||
| (in thousands) | Number of Loans |
Recorded Investment |
Number of Loans |
Recorded Investment |
||||||||||||
| Residential Real Estate |
2 | $ | 337 | — | $ | — | ||||||||||
| Commercial Real Estate |
2 | 7,053 | 1 | 3,716 | ||||||||||||
| Commercial Non Real Estate |
4 | 537 | 1 | 1,067 | ||||||||||||
| Agriculture |
7 | 7,361 | — | — | ||||||||||||
| Consumer |
— | — | — | — | ||||||||||||
|
|
|
|
|
|
|
|
|
|||||||||
| Total TDRs |
15 | $ | 15,288 | 2 | $ | 4,783 | ||||||||||
|
|
|
|
|
|
|
|
|
|||||||||
The majority of loans that were modified and subsequently became 90 days or more delinquent have remained on nonaccrual status since the time of modification.
F-72
Table of Contents
GREAT WESTERN BANCORPORATION, INC.
Notes to Consolidated Financial Statements (Unaudited)
6. Allowance for Loan Losses
The following table presents the Company’s allowance for loan losses roll forward and respective loan balances for the nine months ended June 30, 2014 and 2013. This table (in thousands) is presented net of unamortized discount on acquired loans and excludes loans measured at fair value with changes in fair value reported in earnings of $931.54 million, loans held for sale of $10.99 million, and guaranteed loans of $100.67 million for June 30, 2014 and loans measured at fair value with changes in fair value reported in earnings of $768.88 million, loans held for sale of $20.98 million, and guaranteed loans of $103.43 million for June 30, 2013.
| As of June 30, 2014 | Residential Real Estate |
Commercial Real Estate |
Commercial Non Real Estate |
Agricultural | Consumer | Other | Total | |||||||||||||||||||||
| Allowance for loan losses |
||||||||||||||||||||||||||||
| Beginning balance October 1, 2013 |
$ | 11,779 | $ | 22,562 | $ | 11,222 | $ | 9,296 | $ | 312 | $ | 693 | $ | 55,864 | ||||||||||||||
| Charge-offs |
(581 | ) | (3,733 | ) | (2,883 | ) | (2,652 | ) | (191 | ) | (1,154 | ) | (11,194 | ) | ||||||||||||||
| Recoveries |
190 | 1,521 | 1,228 | 29 | 136 | 1,329 | 4,433 | |||||||||||||||||||||
| Provision |
201 | (2,903 | ) | 1,461 | 1,067 | 67 | (18 | ) | (125 | ) | ||||||||||||||||||
| Impairment of loans acquired with deteriorated credit quality |
(1,175 | ) | 608 | (1,441 | ) | — | 68 | — | (1,940 | ) | ||||||||||||||||||
|
|
|
|
|
|
|
|
|
|
|
|
|
|
|
|||||||||||||||
| Ending balance June 30, 2014 |
$ | 10,414 | $ | 18,055 | $ | 9,587 | $ | 7,740 | $ | 392 | $ | 850 | $ | 47,038 | ||||||||||||||
|
|
|
|
|
|
|
|
|
|
|
|
|
|
|
|||||||||||||||
| Ending balance: individually evaluated for impairment |
$ | 3,183 | $ | 4,843 | $ | 5,078 | $ | 625 | $ | 116 | $ | — | $ | 13,845 | ||||||||||||||
|
|
|
|
|
|
|
|
|
|
|
|
|
|
|
|||||||||||||||
| Ending balance: collectively evaluated for impairment |
$ | 3,371 | $ | 12,881 | $ | 4,239 | $ | 7,115 | $ | 208 | $ | 850 | $ | 28,664 | ||||||||||||||
|
|
|
|
|
|
|
|
|
|
|
|
|
|
|
|||||||||||||||
| Ending balance: loans acquired with deteriorated credit quality |
$ | 3,860 | $ | 331 | $ | 270 | $ | — | $ | 68 | $ | — | $ | 4,529 | ||||||||||||||
|
|
|
|
|
|
|
|
|
|
|
|
|
|
|
|||||||||||||||
| Ending balance: loans acquired without deteriorated credit quality |
$ | — | $ | — | $ | — | $ | — | $ | — | $ | — | $ | — | ||||||||||||||
|
|
|
|
|
|
|
|
|
|
|
|
|
|
|
|||||||||||||||
| Financing receivables |
||||||||||||||||||||||||||||
| Ending balance |
$ | 888,457 | $ | 1,986,214 | $ | 1,309,224 | $ | 1,334,512 | $ | 90,632 | $ | 30,363 | $ | 5,639,402 | ||||||||||||||
|
|
|
|
|
|
|
|
|
|
|
|
|
|
|
|||||||||||||||
| Ending balance: individually evaluated for impairment |
$ | 10,613 | $ | 52,845 | $ | 32,325 | $ | 30,907 | $ | 433 | $ | — | $ | 127,123 | ||||||||||||||
|
|
|
|
|
|
|
|
|
|
|
|
|
|
|
|||||||||||||||
| Ending balance: collectively evaluated for impairment |
$ | 643,220 | $ | 1,770,075 | $ | 1,260,827 | $ | 1,277,405 | $ | 84,551 | $ | 30,363 | $ | 5,066,441 | ||||||||||||||
|
|
|
|
|
|
|
|
|
|
|
|
|
|
|
|||||||||||||||
| Ending balance: loans acquired with deteriorated credit quality |
$ | 107,931 | $ | 57,986 | $ | 6,807 | $ | 1,773 | $ | 2,112 | $ | — | $ | 176,609 | ||||||||||||||
|
|
|
|
|
|
|
|
|
|
|
|
|
|
|
|||||||||||||||
| Ending balance: loans acquired without deteriorated credit quality |
$ | 126,693 | $ | 105,308 | $ | 9,265 | $ | 24,427 | $ | 3,536 | $ | — | $ | 269,229 | ||||||||||||||
|
|
|
|
|
|
|
|
|
|
|
|
|
|
|
|||||||||||||||
F-73
Table of Contents
GREAT WESTERN BANCORPORATION, INC.
Notes to Consolidated Financial Statements (Unaudited)
| As of June 30, 2013 | Residential Real Estate |
Commercial Real Estate |
Commercial Non Real Estate |
Agricultural | Consumer | Other | Total | |||||||||||||||||||||
| Allowance for loan losses |
||||||||||||||||||||||||||||
| Beginning balance October 1, 2012 |
$ | 14,761 | $ | 30,234 | $ | 18,979 | $ | 6,906 | $ | 542 | $ | 456 | $ | 71,878 | ||||||||||||||
| Charge-offs |
(1,429 | ) | (18,313 | ) | (2,927 | ) | (3,644 | ) | (149 | ) | (1,388 | ) | (27,850 | ) | ||||||||||||||
| Recoveries |
209 | 196 | 826 | 19 | 314 | 680 | 2,244 | |||||||||||||||||||||
| Provision |
1,461 | 12,349 | (6,541 | ) | 5,662 | (334 | ) | 803 | 13,400 | |||||||||||||||||||
| Impairment of loans acquired with deteriorated credit quality |
(1,205 | ) | 1,188 | 651 | — | — | — | 634 | ||||||||||||||||||||
|
|
|
|
|
|
|
|
|
|
|
|
|
|
|
|||||||||||||||
| Ending balance June 30, 2013 |
$ | 13,797 | $ | 25,654 | $ | 10,988 | $ | 8,943 | $ | 373 | $ | 551 | $ | 60,306 | ||||||||||||||
|
|
|
|
|
|
|
|
|
|
|
|
|
|
|
|||||||||||||||
| Ending balance: individually evaluated for impairment |
$ | 4,352 | $ | 6,279 | $ | 4,878 | $ | 2,907 | $ | 117 | $ | — | $ | 18,533 | ||||||||||||||
|
|
|
|
|
|
|
|
|
|
|
|
|
|
|
|||||||||||||||
| Ending balance: collectively evaluated for impairment |
$ | 3,090 | $ | 17,038 | $ | 3,450 | $ | 6,036 | $ | 256 | $ | 551 | $ | 30,421 | ||||||||||||||
|
|
|
|
|
|
|
|
|
|
|
|
|
|
|
|||||||||||||||
| Ending balance: loans acquired with deteriorated credit quality |
$ | 6,355 | $ | 2,337 | $ | 2,660 | $ | — | $ | — | $ | — | $ | 11,352 | ||||||||||||||
|
|
|
|
|
|
|
|
|
|
|
|
|
|
|
|||||||||||||||
| Ending balance: loans acquired without deteriorated credit quality |
$ | — | $ | — | $ | — | $ | — | $ | — | $ | — | $ | — | ||||||||||||||
|
|
|
|
|
|
|
|
|
|
|
|
|
|
|
|||||||||||||||
| Financing receivables |
||||||||||||||||||||||||||||
| Ending balance |
$ | 855,510 | $ | 1,967,874 | $ | 1,257,530 | $ | 1,327,148 | $ | 94,812 | $ | 23,476 | $ | 5,526,350 | ||||||||||||||
|
|
|
|
|
|
|
|
|
|
|
|
|
|
|
|||||||||||||||
| Ending balance: individually evaluated for impairment |
$ | 11,632 | $ | 78,652 | $ | 25,486 | $ | 16,139 | $ | 390 | $ | — | $ | 132,299 | ||||||||||||||
|
|
|
|
|
|
|
|
|
|
|
|
|
|
|
|||||||||||||||
| Ending balance: collectively evaluated for impairment |
$ | 533,223 | $ | 1,641,237 | $ | 1,199,440 | $ | 1,278,412 | $ | 83,208 | $ | 23,476 | $ | 4,758,996 | ||||||||||||||
|
|
|
|
|
|
|
|
|
|
|
|
|
|
|
|||||||||||||||
| Ending balance: loans acquired with deteriorated credit quality |
$ | 138,762 | $ | 102,889 | $ | 8,297 | $ | — | $ | 3,727 | $ | — | $ | 253,675 | ||||||||||||||
|
|
|
|
|
|
|
|
|
|
|
|
|
|
|
|||||||||||||||
| Ending balance: loans acquired without deteriorated credit quality |
$ | 171,893 | $ | 145,096 | $ | 24,307 | $ | 32,597 | $ | 7,487 | $ | — | $ | 381,380 | ||||||||||||||
|
|
|
|
|
|
|
|
|
|
|
|
|
|
|
|||||||||||||||
A credit risk adjustment of $4.60 million at June 30, 2014 and $5.27 million at June 30, 2013 is included in the carrying value of fair valued loans to recognize potential impairment present in the portfolio.
The reserve for unfunded loan commitments was $0.40 million at both June 30, 2014 and September 30, 2013.
F-74
Table of Contents
GREAT WESTERN BANCORPORATION, INC.
Notes to Consolidated Financial Statements (Unaudited)
7. Accounting for Certain Loans Acquired with Deteriorated Credit Quality
As a result of the Company’s acquisition of TierOne Bank, the Company acquired certain loans that had deteriorated credit quality. Loan accounting specific to these purchased impaired loans addresses differences between contractual cash flows expected to be collected from the initial investment in loans if those differences are attributable, at least in part, to credit quality. Several factors were considered when evaluating whether a loan was considered a purchased impaired loan, including the delinquency status of the loan, updated borrower credit status, geographic information, and updated loan-to-values (“LTV”). U.S. GAAP allows purchasers to aggregate purchased impaired loans acquired in the same fiscal quarter in one or more pools, provided that the loans have common risk characteristics. A pool is then accounted for as a single asset with a single composite interest rate and an aggregate expectation of cash flows.
Loan pools are periodically reassessed to determine expected cash flows. In determining the expected cash flows, the timing of cash flows and prepayment assumptions for smaller, homogenous loans are based on statistical models that take into account factors such as the loan interest rate, credit profile of the borrowers, the years in which the loans were originated, and whether the loans are fixed or variable rate loans. Prepayments may be assumed on large individual loans that consider similar prepayment factors listed above for smaller homogenous loans. The re-assessment of purchased impaired loans resulted in the following changes in the accretable yield during the nine months ended June 30, 2014 and 2013 (in thousands):
| Balance at September 30, 2013 |
$ | 67,660 | ||
| Accretion |
(14,016 | ) | ||
| Reclassification from nonaccretable difference |
3,175 | |||
| Disposals |
(5,004 | ) | ||
|
|
|
|||
| Balance at June 30, 2014 |
$ | 51,815 | ||
|
|
|
|||
| Balance at September 30, 2012 |
$ | 93,859 | ||
| Accretion |
(22,615 | ) | ||
| Reclassification from nonaccretable difference |
3,156 | |||
| Disposals |
(3,199 | ) | ||
|
|
|
|||
| Balance at June 30, 2013 |
$ | 71,201 | ||
|
|
|
The reclassifications from nonaccretable difference noted in the table above represent instances where specific pools of loans are expected to perform better over the remaining lives of the loans than expected at the prior re-assessment date.
The following table presents purchased impaired loans at June 30, 2014 and September 30, 2013 (in thousands):
| June 30, 2014 | September 30, 2013 | |||||||||||||||||||||||
| Outstanding Balance1 |
Recorded Investment2 |
Carrying Value3 | Outstanding Balance1 |
Recorded Investment2 |
Carrying Value3 | |||||||||||||||||||
| Residential real estate |
$ | 121,049 | $ | 107,931 | $ | 104,071 | $ | 143,998 | $ | 129,905 | $ | 124,871 | ||||||||||||
| Commercial real estate |
140,837 | 57,986 | 57,655 | 172,706 | 85,022 | 84,541 | ||||||||||||||||||
| Commercial non real estate |
17,360 | 6,807 | 6,537 | 19,539 | 8,179 | 6,448 | ||||||||||||||||||
| Agriculture |
1,773 | 1,773 | 1,773 | — | — | — | ||||||||||||||||||
| Consumer |
2,369 | 2,112 | 2,044 | 3,721 | 3,202 | 3,202 | ||||||||||||||||||
|
|
|
|
|
|
|
|
|
|
|
|
|
|||||||||||||
| Total lending |
$ | 283,388 | $ | 176,609 | $ | 172,080 | $ | 339,964 | $ | 226,308 | $ | 219,062 | ||||||||||||
|
|
|
|
|
|
|
|
|
|
|
|
|
|||||||||||||
F-75
Table of Contents
GREAT WESTERN BANCORPORATION, INC.
Notes to Consolidated Financial Statements (Unaudited)
| 1 | Represents the legal balance of loans acquired with deteriorated credit quality. |
| 2 | Represents the book balance of loans acquired with deteriorated credit quality net of the unamortized discount on acquired loans of $27.73 million at June 30, 2014 and $33.09 million at September 30, 2013. |
| 3 | Represents the book balance of loans acquired with deteriorated credit quality net of the unamortized discount on acquired loans and related allowance for loan losses. |
Due to improved cash flows of the purchased impaired loans, the reduction to allowance recognized on previous impairments were $3.08 million and $2.39 million for the nine months ended June 30, 2014 and 2013, respectively.
8. FDIC Indemnification Asset
Under the terms of the purchase and assumption agreement with the FDIC with regard to the TierOne Bank acquisition, the Company is reimbursed for a portion of the losses incurred on covered assets. As covered assets are resolved, whether it be through repayment, short sale of the underlying collateral, the foreclosure on or sale of collateral, or the sale or charge-off of loans or OREO, any differences between the carrying value of the covered assets versus the payments received during the resolution process, that are reimbursable by the FDIC, are recognized as reductions in the FDIC indemnification asset. Any gains or losses realized from the resolution of covered assets reduce or increase, respectively, the amount recoverable from the FDIC. The following table represents a summary of the activity related to the FDIC indemnification asset for the nine months ended June 30, 2014 and 2013 (in thousands):
| June 30, 2014 | June 30, 2013 | |||||||
| Balance at beginning of period |
$ | 45,690 | $ | 68,662 | ||||
| Amortization |
(11,203 | ) | (10,092 | ) | ||||
| FDIC portion of charge-offs exceeding fair value marks and expenses |
3,834 | 2,777 | ||||||
| Payments (reductions) for claims filed |
(6,089 | ) | (9,122 | ) | ||||
|
|
|
|
|
|||||
| Balance at end of period |
$ | 32,232 | $ | 52,225 | ||||
|
|
|
|
|
|||||
The loss claims filed are subject to review, approval, and annual audits by the FDIC or its assigned agents for compliance with the terms in the loss sharing agreement.
9. Derivative Financial Instruments
In the normal course of business, the Company uses interest rate swaps to manage its interest rate risk and market risk in accommodating the needs of its customers. Also, the Company enters into interest rate lock commitments on mortgage loans to be held for sale, with corresponding forward sales contracts related to these interest rate lock commitments.
Derivative instruments are recognized as either assets or liabilities in the accompanying consolidated financial statements and are measured at fair value.
F-76
Table of Contents
GREAT WESTERN BANCORPORATION, INC.
Notes to Consolidated Financial Statements (Unaudited)
The following table summarizes the notional amounts and estimated fair values of the Company’s derivative instruments at June 30, 2014 and September 30, 2013 (in thousands).
| June 30, 2014 | ||||||||||||||
| Notional Amount |
Balance Sheet Location |
Positive Fair Value |
Negative Fair Value |
|||||||||||
| Derivatives not designated as hedging instruments: |
||||||||||||||
| Interest rate swaps |
$ | 946,818 | Liabilities | $ | 6,330 | $ | (19,600 | ) | ||||||
| Mortgage loan commitments |
28,182 | Assets | 40 | — | ||||||||||
| Mortgage loan forward sale contracts |
28,852 | Liabilities | — | (40 | ) | |||||||||
| September 30, 2013 | ||||||||||||||
| Notional Amount |
Balance Sheet Location |
Positive Fair Value |
Negative Fair Value |
|||||||||||
| Derivatives not designated as hedging instruments: |
||||||||||||||
| Interest rate swaps |
$ | 864,040 | Liabilities | $ | 12,404 | $ | (13,555 | ) | ||||||
| Mortgage loan commitments |
16,040 | Assets | 375 | — | ||||||||||
| Mortgage loan forward sale contracts |
21,881 | Liabilities | — | (375 | ) | |||||||||
As with any financial instrument, derivative financial instruments have inherent risk including adverse changes in interest rates. The Company’s exposure to derivative credit risk is defined as the possibility of sustaining a loss due to the failure of the counterparty to perform in accordance with the terms of the contract. Credit risk associated with interest rate swaps is similar to those relating to traditional on-balance sheet financial instruments. The Company manages interest rate swap credit risk with the same standards and procedures applied to its commercial lending activities. Amounts due from NAB to reclaim cash collateral under the interest rate swap master netting arrangements have not been offset against the derivative balances. These cash deposits classified on the consolidated balance sheets as cash were $0 as of June 30, 2014 and September 30, 2013.
The effect of derivatives on the consolidated statements of comprehensive income for the nine months ended June 30, 2014 and 2013 (in thousands) was as follows:
| 2014 | ||||||
| Location of Gain (Loss) Recognized in Income |
Amount of Gain (Loss) Recognized in Income |
|||||
| Derivatives not designated as hedging instruments: |
||||||
| Interest rate swaps |
Noninterest expense | $ | (12,119 | ) | ||
| Mortgage loan commitments |
Interest income (expense) | 40 | ||||
| Mortgage loan forward sale contracts |
Interest income (expense) | (40 | ) | |||
| 2013 | ||||||
| Location of Gain (Loss) Recognized in Income |
Amount of Gain (Loss) Recognized in Income |
|||||
| Derivatives not designated as hedging instruments: |
||||||
| Interest rate swaps |
Noninterest expense | $ | 41,635 | |||
| Mortgage loan commitments |
Interest income (expense) | 39 | ||||
| Mortgage loan forward sale contracts |
Interest income (expense) | (39 | ) | |||
F-77
Table of Contents
GREAT WESTERN BANCORPORATION, INC.
Notes to Consolidated Financial Statements (Unaudited)
Netting of Derivatives
The Company has various financial assets and financial liabilities that are subject to enforceable master netting agreements or similar agreements. The Company has entered into an International Swaps and Derivatives Association, Inc. (“ISDA”) master netting arrangement with NAB. Under the terms of the master netting arrangements, all transactions between the Company and the counterparty constitute a single business relationship such that in the event of default, the non-defaulting party is entitled to set off claims and apply property held by that party in respect of any transaction against obligations owed. Any payments, deliveries, or other transfers may be applied against each other and netted.
The table below shows total gross derivative assets and liabilities which are adjusted on an aggregate basis, where applicable to take into consideration the effects of legally enforceable master netting agreements for the net reported amount in the consolidated balance sheets. These amounts are offset on the consolidated balance sheets.
The following tables (in thousands) present the Company’s gross derivative financial assets and liabilities at June 30, 2014 and September 30, 2013, and the related impact of enforceable master netting arrangements and cash collateral, where applicable:
| Gross Amount |
Amount Offset |
Net Amount Presented in Consolidated Balance Sheets |
Held/ Pledged Financial Instruments |
Net Amount |
||||||||||||||||
| June 30, 2014 |
||||||||||||||||||||
| Derivative financial assets: |
||||||||||||||||||||
| Derivatives subject to master netting arrangement or similar arrangement |
$ | 6,330 | $ | (6,330 | ) | $ | — | $ | — | $ | — | |||||||||
| Derivative financial liabilities: |
||||||||||||||||||||
| Derivatives subject to master netting arrangement or similar arrangement |
$ | (19,600 | ) | 6,330 | (13,270 | ) | 20,545 | 7,275 | ||||||||||||
|
|
|
|
|
|
|
|
|
|
|
|||||||||||
| Total derivative financial liabilities |
$ | (13,270 | ) | $ | — | $ | (13,270 | ) | $ | 20,545 | $ | 7,275 | ||||||||
|
|
|
|
|
|
|
|
|
|
|
|||||||||||
| Gross Amount |
Amount Offset |
Net Amount Presented in Consolidated Balance Sheets |
Held / Pledged Financial Instruments |
Net Amount |
||||||||||||||||
| September 30, 2013 |
||||||||||||||||||||
| Derivative financial assets: |
||||||||||||||||||||
| Derivatives subject to master netting arrangement or similar arrangement |
$ | 12,404 | $ | (12,404 | ) | $ | — | $ | — | $ | — | |||||||||
| Derivative financial liabilities: |
||||||||||||||||||||
| Derivatives subject to master netting arrangement or similar arrangement |
(13,555 | ) | 12,404 | (1,151 | ) | — | (1,151 | ) | ||||||||||||
|
|
|
|
|
|
|
|
|
|
|
|||||||||||
| Total derivative financial liabilities |
$ | (1,151 | ) | $ | — | $ | (1,151 | ) | $ | — | $ | (1,151 | ) | |||||||
|
|
|
|
|
|
|
|
|
|
|
|||||||||||
10. The Fair Value Option
The Company has elected to measure certain long-term loans and written loan commitments at fair value to assist in managing the interest rate risk for longer-term loans. This fair value option was elected upon the origination of these loans. Interest income is recognized in the same manner as interest on non-fair value loans.
F-78
Table of Contents
GREAT WESTERN BANCORPORATION, INC.
Notes to Consolidated Financial Statements (Unaudited)
See Note 16 for additional disclosures regarding the fair value of the fair value option loans and written loan commitments.
Long-term loans and written loan commitments for which the fair value option has been elected had a net favorable difference between the aggregate fair value and the aggregate unpaid loan principal balance and written loan commitment amount of approximately $8.67 million at June 30, 2014 and net unfavorable difference between the aggregate fair value and the aggregate unpaid loan principal balance and written loan commitment amount of approximately $4.83 million at September 30, 2013. The total unpaid principal balance of these long-term loans was approximately $922.87 million and $846.69 million at June 30, 2014 and September 30, 2013, respectively. The fair value of these loans and written loan commitments is included in total loans in the consolidated balance sheets and are grouped with commercial non real estate, commercial real estate, and agricultural loans in Note 5. The fair value of these written loan commitments was not material at June 30, 2014 and September 30, 2013, respectively. None of the noted loans were greater than 90 days past due or in nonaccrual status as of June 30, 2014 and September 30, 2013.
Changes in fair value for items for which the fair value option has been elected and the line items in which these changes are reported are as follows for the nine months ended June 30, 2014 and 2013 (in thousands):
| June 30, 2014 | ||||||||
| Interest Income |
Total Changes in Fair Value |
|||||||
| Long-term loans and written loan commitments |
$ | 13,506 | $ | 13,506 | ||||
| June 30, 2013 | ||||||||
| Interest Income |
Total Changes in Fair Value |
|||||||
| Long-term loans and written loan commitments |
$ | (41,776 | ) | $ | (41,776 | ) | ||
For long-term loans and written loan commitments at June 30, 2014 and 2013, approximately $1.39 million and $(0.14) million, respectively, of the total change in fair value is attributable to changes in specific credit risk. The gains or losses attributable to changes in instrument-specific credit risk were determined based on an assessment of existing market conditions and credit quality of the underlying loan for the specific portfolio of loans.
11. Core Deposits and Other Intangibles
A summary of intangible assets subject to amortization is as follows (in thousands):
| Core Deposit Intangible |
Brand Intangible |
Customer Relationships Intangible |
Total | |||||||||||||
| As of June 30, 2014 |
||||||||||||||||
| Gross carrying amount |
$ | 92,679 | $ | 8,464 | $ | 16,089 | $ | 117,232 | ||||||||
| Accumulated amortization |
(85,271 | ) | (3,431 | ) | (11,534 | ) | (100,236 | ) | ||||||||
|
|
|
|
|
|
|
|
|
|||||||||
| $ | 7,408 | $ | 5,033 | $ | 4,555 | $ | 16,996 | |||||||||
|
|
|
|
|
|
|
|
|
|||||||||
| As of September 30, 2013 |
||||||||||||||||
| Gross carrying amount |
$ | 92,679 | $ | 8,464 | $ | 16,089 | $ | 117,232 | ||||||||
| Accumulated amortization |
(73,668 | ) | (3,008 | ) | (10,112 | ) | (86,788 | ) | ||||||||
|
|
|
|
|
|
|
|
|
|||||||||
| $ | 19,011 | $ | 5,456 | $ | 5,977 | $ | 30,444 | |||||||||
|
|
|
|
|
|
|
|
|
|||||||||
F-79
Table of Contents
GREAT WESTERN BANCORPORATION, INC.
Notes to Consolidated Financial Statements (Unaudited)
Amortization expense of intangible assets was $13.45 million and $14.60 million for the nine months ended June 30, 2014 and 2013, respectively.
The estimated amortization expense of intangible assets assumes no activities, such as acquisitions, which would result in additional amortizable intangible assets. Estimated amortization expense of intangible assets in subsequent fiscal years is as follows (in thousands):
| Remaining in 2014 |
$ | 2,767 | ||
| 2015 |
7,110 | |||
| 2016 |
2,822 | |||
| 2017 |
1,097 | |||
| 2018 |
564 | |||
| 2019 and thereafter |
2,636 | |||
|
|
|
|||
| $ | 16,996 | |||
|
|
|
12. Securities Sold Under Agreements to Repurchase
Securities sold under agreements to repurchase generally mature the following business day from the transaction date. Securities underlying the agreements had an amortized cost of approximately $208.51 million and $226.16 million and fair value of approximately $208.24 million and $224.16 million at June 30, 2014 and September 30, 2013, respectively. The Company holds the securities under third-party safekeeping agreements.
13. FHLB Advances, Related Party Notes Payable and Other Borrowings
FHLB advances, related party notes payable, and other borrowings consist of the following at June 30, 2014 and September 30, 2013 (in thousands):
| June 30, 2014 |
September 30, 2013 |
|||||||
| Subordinated capital note to NAB New York (a branch of NAB), due June 2018 (callable June 2015), interest paid quarterly based on LIBOR plus 205 basis points, unsecured |
$ | 35,795 | $ | 35,795 | ||||
| $10,000 revolving line of credit to NAB due on demand, interest paid monthly based on LIBOR plus 125 basis points, unsecured |
5,500 | 5,500 | ||||||
| Notes payable to Federal Home Loan Bank (FHLB), interest rates from 0.24% to 3.66% and maturity dates from July 2014 to July 2023 as of June 30, 2014, collateralized by real estate loans and FHLB stock, with various call dates at the option of the FHLB |
435,000 | 390,500 | ||||||
| Other |
97 | 107 | ||||||
|
|
|
|
|
|||||
| $ | 476,392 | $ | 431,902 | |||||
|
|
|
|
|
|||||
As of June 30, 2014, based on its Federal Home Loan Bank stock holdings, the combined aggregate additional borrowing capacity of the Company with the Federal Home Loan Bank was $806.16 million.
F-80
Table of Contents
GREAT WESTERN BANCORPORATION, INC.
Notes to Consolidated Financial Statements (Unaudited)
As of June 30, 2014, FHLB advances, related party notes payable and other borrowings are due or callable (whichever is earlier) in subsequent fiscal years as follows (in thousands):
| Remaining in 2014 |
$ | 60,597 | ||
| 2015 |
65,000 | |||
| 2016 |
90,000 | |||
| 2017 |
25,000 | |||
| 2018 |
60,795 | |||
| 2019 and thereafter |
175,000 | |||
|
|
|
|||
| $ | 476,392 | |||
|
|
|
14. Income Taxes
The provision for income taxes charged to operations consists of the following for the nine months ended June 30, 2014 and 2013 (in thousands):
| June 30, 2014 | June 30, 2013 | |||||||
| Currently paid or payable |
||||||||
| Federal |
$ | 43,760 | $ | 45,602 | ||||
| State |
6,545 | 5,589 | ||||||
|
|
|
|
|
|||||
| 50,305 | 51,191 | |||||||
| Deferred tax benefit |
(8,743 | ) | (11,509 | ) | ||||
|
|
|
|
|
|||||
| Income tax expense |
$ | 41,562 | $ | 39,682 | ||||
|
|
|
|
|
|||||
The income tax provision differs from the amount of income tax determined by applying the U.S. federal income tax rate to pretax income due to the following for the nine months ended June 30, 2014 and 2013 (in thousands):
| June 30, 2014 | June 30, 2013 | |||||||
| Computed “expected” tax expense (35%) |
$ | 41,523 | $ | 38,360 | ||||
| Increase (decrease) in income taxes resulting from: |
||||||||
| Tax exempt interest income |
(3,539 | ) | (2,679 | ) | ||||
| State income taxes, net of federal benefit |
4,254 | 3,633 | ||||||
| Other |
(676 | ) | 368 | |||||
|
|
|
|
|
|||||
| Actual tax expense |
$ | 41,562 | $ | 39,682 | ||||
|
|
|
|
|
|||||
F-81
Table of Contents
GREAT WESTERN BANCORPORATION, INC.
Notes to Consolidated Financial Statements (Unaudited)
Net deferred tax assets (liabilities) consist of the following components at June 30, 2014 and September 30, 2013 (in thousands):
| June 30, 2014 | September 30, 2013 | |||||||
| Deferred tax assets: |
||||||||
| Allowance for loan losses |
$ | 17,205 | $ | 19,932 | ||||
| Compensation |
327 | 320 | ||||||
| Net operating loss carryforward |
132 | 170 | ||||||
| Securities available for sale |
1,460 | 4,144 | ||||||
| Other real estate owned |
13,937 | 7,072 | ||||||
| Core deposit intangible and other fair value adjustments |
10,072 | 6,617 | ||||||
| Other |
3,605 | 4,834 | ||||||
|
|
|
|
|
|||||
| 46,738 | 43,089 | |||||||
|
|
|
|
|
|||||
| Deferred tax liabilities: |
||||||||
| Goodwill and other intangibles |
(1,870 | ) | (2,619 | ) | ||||
| Premises and equipment |
(4,723 | ) | (6,132 | ) | ||||
| Other |
(1,460 | ) | (1,712 | ) | ||||
|
|
|
|
|
|||||
| (8,053 | ) | (10,463 | ) | |||||
|
|
|
|
|
|||||
| Net deferred tax assets |
$ | 38,685 | $ | 32,626 | ||||
|
|
|
|
|
|||||
At June 30, 2014 and September 30, 2013, the Company had an income tax payable to National Americas Investment, Inc. for $16.80 million and $12.39 million (included in income tax payable).
Management has determined a valuation reserve is not required for the deferred tax assets because it is more likely than not these assets could be realized through carry back to taxable income in prior years, future reversals of existing taxable temporary differences, and future taxable income.
Uncertain tax positions were not significant at June 30, 2014 or September 30, 2013.
The Company is no longer subject to U.S. federal, state and local or non-U.S. income tax examinations by tax authorities for years before 2009. In July 2014, the IRS issued the final report on their examination of federal income tax returns for the periods ended September 30, 2010 and 2011.
15. Profit-Sharing Plan
The Company participates in a multiple employer 401(k) profit sharing plan (the Plan). All employees are eligible to participate, beginning with the first day of the month coincident with or immediately following the completion of one year of service and having reached the age of 21. In addition to employee contributions, the Company may contribute discretionary amounts for eligible participants. Contribution rates for participating employers must be equal. The Company contributed $2.53 million and $3.46 million to the Plan for the nine months ended June 30, 2014 and June 30, 2013, respectively.
16. Fair Value of Financial Instruments and Interest Rate Risk
The Company measures, monitors and discloses certain of its assets and liabilities on a fair value basis. Fair value is defined as the price that would be received to sell an asset or paid to transfer a liability in an orderly
F-82
Table of Contents
GREAT WESTERN BANCORPORATION, INC.
Notes to Consolidated Financial Statements (Unaudited)
transaction between market participants at the measurement date. The fair value guidance also establishes a fair value hierarchy that requires an entity to maximize the use of observable inputs and minimize the use of unobservable inputs when measuring fair value. The guidance describes three levels of inputs that may be used to measure fair value are as follows:
| Level 1 | Quoted prices in active markets for identical assets or liabilities |
| Level 2 | Observable inputs other than Level 1 prices, such as quoted prices for similar assets or liabilities; quoted prices in markets that are not active; or other inputs that are observable or can be corroborated by observable market data for substantially the full term of the assets or liabilities |
| Level 3 | Unobservable inputs that are supported by little or no market activity and that are significant to the fair value of the assets or liabilities |
Level 1 inputs are considered to be the most transparent and reliable and Level 3 inputs are considered to be the least transparent and reliable. The Company assumes the use of the principal market to conduct a transaction of each particular asset or liability being measured and then considers the assumptions that market participants would use when pricing the asset or liability. Whenever possible, the Company first looks for quoted prices for identical assets or liabilities in active markets (Level 1 inputs) to value each asset or liability. However, when inputs from identical assets or liabilities on active markets are not available, the Company utilizes market observable data for similar assets and liabilities. The Company maximizes the use of observable inputs and limits the use of unobservable inputs to occasions when observable inputs are not available. The need to use unobservable inputs generally results from the lack of market liquidity of the actual financial instrument or of the underlying collateral. Although in some instances, third party price indications may be available, limited trading activity can challenge the observability of these quotations.
Assets and Liabilities Measured at Fair Value on a Recurring Basis
Following is a description of the valuation methodologies and inputs used for assets and liabilities measured at fair value on a recurring basis and recognized in the accompanying consolidated balance sheets, as well as the general classification of such assets and liabilities pursuant to the valuation hierarchy.
Securities Available for Sale
Where quoted market prices are available in an active market, securities are classified within Level 1 of the valuation hierarchy. These securities are based on valuations using quoted prices. Level 1 securities include U.S. Treasury. If quoted market prices are not available, then fair values are estimated by using pricing models, quoted prices of securities with similar characteristics, or discounted cash flows. Level 2 securities include U.S. government agency, agency mortgage-backed, states and political subdivisions, corporate debt, and other securities. Where Level 1 or Level 2 inputs are not available, securities are classified within Level 3 of the hierarchy.
Interest Rate Swaps and Loans
Interest rate swaps are valued using the system used to value all of NAB’s traded securities and derivatives using LIBOR rates. The fair value of loans accounted for under the fair value option represents the net carrying value of the loan, plus the equal and opposite amount of the value of the swap needed to hedge the interest rate risk and an adjustment for credit risk based on our assessment of existing market conditions for the specific portfolio of loans. This is used due to the strict prepayment penalties put in the loan terms to cover the cost of exiting the hedge of the loans in the case of early prepayment or termination. The adjustment for credit risk on loans
F-83
Table of Contents
GREAT WESTERN BANCORPORATION, INC.
Notes to Consolidated Financial Statements (Unaudited)
accounted for under the fair value option is not significant to the overall fair value of the loans. The fair values estimated by NAB use interest rates that are observable or that can be corroborated by observable market data and, therefore, are classified within Level 2 of the valuation hierarchy. The Company is required to post cash collateral to NAB for interest rate derivative contracts that are in a liability position, thus a credit risk adjustment on interest rate swaps is not warranted.
The following table presents the fair value measurements of assets and liabilities recognized in the accompanying consolidated balance sheets measured at fair value on a recurring basis and the level within the fair value hierarchy in which the fair value measurements fall at June 30, 2014 and September 30, 2013 (in thousands):
| Fair Value | Level 1 | Level 2 | Level 3 | |||||||||||||
| As of June 30, 2014 |
||||||||||||||||
| U.S. Treasury securities |
$ | 149,338 | $ | — | $ | 149,338 | $ | — | ||||||||
| Mortgage-backed securities |
1,231,206 | — | 1,231,206 | — | ||||||||||||
| States and political subdivision securities |
2,220 | — | 2,220 | — | ||||||||||||
| Corporate debt securities |
11,967 | — | 11,967 | — | ||||||||||||
| Other |
1,037 | — | 1,037 | |||||||||||||
|
|
|
|
|
|
|
|
|
|||||||||
| Securities available for sale |
$ | 1,395,768 | $ | — | $ | 1,395,768 | $ | — | ||||||||
|
|
|
|
|
|
|
|
|
|||||||||
| Derivatives - assets |
$ | 40 | $ | — | $ | 40 | $ | — | ||||||||
| Derivatives - liabilities |
13,310 | — | 13,310 | — | ||||||||||||
| Fair value loans and written loan commitments |
931,541 | — | 931,541 | — | ||||||||||||
| Fair Value | Level 1 | Level 2 | Level 3 | |||||||||||||
| As of September, 30, 2013 |
||||||||||||||||
| Mortgage-backed securities |
$ | 1,459,444 | $ | — | $ | 1,459,444 | $ | — | ||||||||
| States and political subdivision securities |
3,532 | — | 3,532 | — | ||||||||||||
| Corporate debt securities |
12,013 | — | 12,013 | — | ||||||||||||
| Other |
5,460 | — | 5,460 | — | ||||||||||||
|
|
|
|
|
|
|
|
|
|||||||||
| Securities available for sale |
$ | 1,480,449 | $ | — | $ | 1,480,449 | $ | — | ||||||||
|
|
|
|
|
|
|
|
|
|||||||||
| Derivatives - assets |
$ | 375 | $ | — | $ | 375 | $ | — | ||||||||
| Derivatives - liabilities |
1,526 | — | 1,526 | — | ||||||||||||
| Fair value loans and written loan commitments |
841,862 | — | 841,862 | — | ||||||||||||
Assets and Liabilities Measured at Fair Value on a Nonrecurring Basis
Following is a description of the valuation methodologies used for assets and liabilities measured at fair value on a nonrecurring basis and recognized in the accompanying consolidated balance sheets, as well as the general classification of such assets and liabilities pursuant to the valuation hierarchy.
Impaired Loans (Collateral Dependent)
Loans for which it is probable that the Company will not collect all principal and interest due according to contractual terms are measured for impairment. Allowable methods for estimating fair value include using the fair value of the collateral for collateral dependent loans or, where a loan is determined not to be collateral dependent, using the discounted cash flow method.
F-84
Table of Contents
GREAT WESTERN BANCORPORATION, INC.
Notes to Consolidated Financial Statements (Unaudited)
If the impaired loan is identified as collateral dependent, then the fair value method of measuring the amount of the impairment is utilized. This method requires obtaining a current independent appraisal of the collateral and applying a discount factor, if necessary, to the appraised value and including costs to sell. Because many of these inputs are not observable, the measurements are classified as Level 3.
Other Real Estate Owned (OREO)
Other real estate owned consists of loan collateral that has been repossessed through foreclosure. This collateral is comprised of commercial and residential real estate. OREO is recorded initially at fair value of the collateral less estimated selling costs. Subsequent to foreclosure, valuations are updated periodically, and the assets may be marked down further to fair value less selling costs, reflecting a valuation allowance. Fair value measurements may be based upon appraisals, third-party price opinions, or internally developed pricing methods. These measurements are classified as Level 3.
Mortgage Loans Held for Sale
Fair value of mortgage loans held for sale is based on either quoted prices for the same or similar loans, or values obtained from third parties, or are estimated for portfolios of loans with similar financial characteristics and are therefore considered a Level 2 valuation.
The following tables present the fair value measurement of assets and liabilities measured at fair value on a nonrecurring basis and the level within the fair value hierarchy in which the fair value measurements fall at June 30, 2014 and September 30, 2013 (in thousands):
| Fair Value | Level 1 | Level 2 | Level 3 | |||||||||||||
| As of June 30, 2014 |
||||||||||||||||
| Other real estate owned |
$ | 33,677 | $ | — | $ | — | $ | 33,677 | ||||||||
| Impaired loans |
138,723 | — | — | 138,723 | ||||||||||||
| Loans held for sale, at lower of cost or market |
10,994 | — | 10,994 | — | ||||||||||||
| As of September 30, 2013 |
||||||||||||||||
| Other real estate owned |
$ | 40,723 | $ | — | $ | — | $ | 40,723 | ||||||||
| Impaired loans |
154,512 | — | — | 154,512 | ||||||||||||
| Loans held for sale, at lower of cost or market |
8,271 | — | 8,271 | — | ||||||||||||
The valuation techniques and significant unobservable inputs used to measure Level 3 fair value measurements at June 30, 2014 were as follows:
| Financial Instrument |
Fair Value of Assets / (Liabilities) at June 30, 2014 |
Valuation Technique(s) |
Unobservable Input | Range | Weighted Average | |||||||||
| Other real estate owned |
$ | 33,677 | Appraisal value | Property specific adjustment | N/A | N/A | ||||||||
| Impaired loans |
$ | 138,723 | Appraisal value | Property specific adjustment | N/A | N/A | ||||||||
Fair Value of Financial Instruments
For financial instruments that have quoted market prices, those quotes are used to determine fair value. Financial instruments that have no defined maturity, have a remaining maturity of 180 days or less, or reprice frequently to
F-85
Table of Contents
GREAT WESTERN BANCORPORATION, INC.
Notes to Consolidated Financial Statements (Unaudited)
a market rate are assumed to have a fair value that approximates carrying value, after taking into consideration any applicable credit risk. If no market quotes are available, financial instruments are valued by discounting the expected cash flows using an estimated current market interest rate for the financial instrument.
The short maturity of the Company’s assets and liabilities results in having a significant number of financial instruments whose fair value equals or closely approximates carrying value. Such financial instruments are reported in the following consolidated balance sheet categories: cash and due from banks, securities sold under agreements to repurchase, and accrued interest.
Fair value estimates are based on existing on and off-balance sheet financial instruments without attempting to estimate the value of anticipated future business and the value of assets and liabilities that are not considered financial instruments. Significant assets and liabilities that are not considered financial instruments include premises and equipment, deferred income taxes, goodwill, and core deposit and other intangibles. In addition, the tax ramifications related to the realization of unrealized gains and losses can have a significant effect on fair value estimates and have not been considered in the estimates.
Off-balance sheet instruments (commitments to extend credit and standby letters of credit) are generally short-term and at variable rates. Therefore, both the carrying amount and the estimated fair value associated with these financial instruments are immaterial. Fair values for balance sheet instruments as of June 30, 2014 and September 30, 2013, are as follows (in thousands):
| Level in Fair |
June 30, 2014 | September 30, 2013 | ||||||||||||||||||
| Carrying Amount |
Fair Value | Carrying Amount |
Fair Value | |||||||||||||||||
| Assets |
||||||||||||||||||||
| Cash and due from banks |
Level 1 | $ | 235,077 | $ | 235,077 | $ | 282,157 | $ | 282,157 | |||||||||||
| Loans, net excluding fair valued loans and loans held for sale |
Level 3 | 5,688,928 | 5,680,154 | 5,456,676 | 5,420,963 | |||||||||||||||
| Accrued interest receivable |
Level 2 | 37,055 | 37,055 | 41,065 | 41,065 | |||||||||||||||
| Federal Home Loan Bank stock |
Level 2 | 30,414 | 30,414 | 28,765 | 28,765 | |||||||||||||||
| Liabilities |
|
|||||||||||||||||||
| Deposits |
Level 3 | $ | (7,067,112 | ) | $ | (7,072,929 | ) | $ | (6,948,208 | ) | $ | (6,959,936 | ) | |||||||
| FHLB advances, related party notes payable, and other borrowings |
Level 2 | (476,392 | ) | (461,674 | ) | (431,902 | ) | (421,593 | ) | |||||||||||
| Securities sold under repurchase agreements |
Level 2 | (185,620 | ) | (185,620 | ) | (217,562 | ) | (217,562 | ) | |||||||||||
| Accrued interest payable |
Level 2 | (5,643 | ) | (5,643 | ) | (6,790 | ) | (6,790 | ) | |||||||||||
| Subordinated debentures |
Level 2 | (56,083 | ) | (56,083 | ) | (56,083 | ) | (56,084 | ) | |||||||||||
The following methods and assumptions were used in estimating the fair value of financial instruments that were not previously disclosed:
Cash and cash due from banks: Due to the short term nature of cash and cash equivalents, the estimated fair value is equal to the carrying value and they are categorized as a Level 1 fair value measurement.
Loans, net excluding fair value loans and loans held for sale: The fair value of the loan portfolio is estimated using observable inputs including estimated cash flows, and discount rates based on interest rates currently being offered for loans with similar terms, to borrowers of similar credit quality. Loans held for investment are categorized as a Level 3 fair value measurement.
F-86
Table of Contents
GREAT WESTERN BANCORPORATION, INC.
Notes to Consolidated Financial Statements (Unaudited)
Accrued interest receivable: Due to the nature of accrued interest receivable, the estimated fair value is equal to the carrying value and they are categorized as a Level 2 fair value measurement.
Federal Home Loan Bank stock: The carrying amount of FHLB stock approximates its fair value as it can only be redeemed with the FHLB at par value. Federal Home Loan Bank stock has been categorized as a Level 2 fair value measurement.
Deposits: The estimated fair value of deposits with no stated maturity, such as non-interest bearing demand deposits, savings, NOW, and money market accounts, is equal to the amount payable on demand. The fair value of interest-bearing time deposits is based on the discounted value of contractual cash flows of such deposits, taking into account the option for early withdrawal. The discount rate is estimated using the rates offered by the Company, at the respective measurement dates, for deposits of similar maturities. Deposits have been categorized as a Level 3 fair value measurement.
FHLB advances, related party notes payable, and other borrowings: The fair value of FHLB advances, related party notes payable, and other borrowings are estimated using discounted cash flow analysis, based on current incremental borrowing rates for similar types of borrowing arrangements. In the absence of a reasonably precise methodology to determine the fair value of the credit agreement, carrying value has been used to represent fair value. FHLB advances, related party notes payable, and other borrowings have been categorized as a Level 2 fair value measurement.
Securities sold under repurchase agreements: The Company’s repurchase agreements are overnight transactions that mature the day after the transaction, and as a result of this short-term nature, the estimated fair value equals the carrying value. Securities sold under repurchase agreements have been categorized as a Level 2 fair value measurement.
Accrued interest payable: Due to the nature of accrued interest payable, the estimated fair value is equal to the carrying value and they are categorized as a Level 2 fair value measurement.
Subordinated Debentures: The fair value of subordinated debentures is estimated using discounted cash flow analysis, based on current incremental debt rates. In the absence of a reasonably precise methodology to determine the fair value of the credit agreement, carrying value has been used to represent fair value. Subordinated debentures have been categorized as a Level 2 fair value measurement.
17. Earnings per Share
Basic earnings per share computations for the nine months ended June 30, 2014 and 2013 were determined by dividing net income by the weighted-average number of common shares outstanding during the periods then ended. The Company had no potentially dilutive securities outstanding during the periods presented.
The following information was used in the computation of basic earnings per share (EPS) for the nine months ended June 30, 2014 and 2013 (in thousands except share data).
| June 30, 2014 | June 30, 2013 | |||||||
| Basic earnings per share computation: |
||||||||
| Net income |
$ | 77,077 | $ | 69,920 | ||||
| Weighted average common shares outstanding |
198,731 | 198,731 | ||||||
|
|
|
|
|
|||||
| Basic EPS |
$ | 387.85 | $ | 351.83 | ||||
|
|
|
|
|
|||||
F-87
Table of Contents
Through and including , 2014 (the 25th day after the date of this prospectus), all dealers effecting transactions in our common stock, whether or not participating in this offering, may be required to deliver a prospectus. This delivery requirement is in addition to a dealer’s obligation to deliver a prospectus when acting as an underwriter and with respect to an unsold allotment or subscription.
Shares
Great Western Bancorp, Inc.
Common Stock
PROSPECTUS
Joint Book-Running Managers
| Deutsche Bank Securities | BofA Merrill Lynch | |
, 2014
Table of Contents
PART II
INFORMATION NOT REQUIRED IN PROSPECTUS
Item 13. Other Expenses of Issuance and Distribution.
Estimated expenses, other than underwriting discounts and commissions, in connection with the sale of the registrant’s common stock, par value $0.01, are as follows:
| Amount to be Paid |
||||
| SEC registration fee |
* | |||
| Financial Industry Regulatory Authority, Inc. filing fee |
* | |||
| New York Stock Exchange listing fee |
* | |||
| Blue sky fees and expenses |
* | |||
| Printing fees and expenses |
* | |||
| Legal fees and expenses |
* | |||
| Accounting fees and expenses |
* | |||
| Transfer agent’s fees |
* | |||
| Miscellaneous |
* | |||
|
|
|
|||
| Total |
* | |||
|
|
|
|||
| * | To be included by amendment. |
Item 14. Indemnification of Directors and Officers.
Section 145 of the Delaware General Corporation Law, or DGCL, grants each corporation organized thereunder the power to indemnify any person who is or was a director, officer, employee or agent of a corporation or enterprise against expenses (including attorneys’ fees), judgments, fines and amounts paid in settlement actually and reasonably incurred by such person in connection with any threatened, pending or completed action, suit or proceeding, whether civil, criminal, administrative or investigative, by reason of being or having been in any such capacity, if such person acted in good faith and in a manner such person reasonably believed to be in or not opposed to the best interests of the corporation, and, with respect to any criminal action or proceeding had no reasonable cause to believe such person’s conduct was unlawful, except that with respect to an action or suit brought by or in the right of the corporation such indemnification is limited to expenses (including attorneys’ fees) in connection with the defense or settlement of such action or suit. The DGCL provides that Section 145 is not exclusive of other rights to which those seeking indemnification may be entitled under any bylaw, agreement, vote of stockholders or disinterested directors or otherwise. The registrant’s amended and restated bylaws will provide for indemnification by the registrant of its directors, officers, employees and agents to the fullest extent permitted by the DGCL, subject to limited exceptions. In addition, the registrant entered into the employment agreements filed as Exhibits 10.7 through 10.9 hereto with certain officers of the registrant that provide for indemnification by the registrant of those officers to the fullest extent permitted by the DGCL, subject to the registrant’s amended and restated certificate of incorporation and amended and restated bylaws. Furthermore, the registrant intends to enter into the stockholder agreement to be filed as Exhibit 10.1, under which it will be required to provide for the indemnification of NAB-employed or NAB-designated directors, officers and employees to the fullest extent permitted by the DGCL.
Section 102(b)(7) of the DGCL permits a corporation to provide in its certificate of incorporation that a director of the corporation shall not be personally liable to the corporation or its stockholders for monetary damages for breach of fiduciary duty as a director, except for liability (i) for any breach of the director’s duty of loyalty to the corporation or its stockholders, (ii) for acts or omissions not in good faith or which involve intentional misconduct or a knowing violation of law, (iii) for unlawful payments of dividends or unlawful stock repurchases, redemptions or other distributions or (iv) for any transaction from which the director derived an improper personal benefit. The registrant’s amended and restated certificate of incorporation will provide for such limitation of liability.
II-1
Table of Contents
The registrant maintains insurance policies under which coverage is provided (a) to its directors and officers, in their respective capacities as such, against loss arising from a claim made for any actual or alleged wrongful act, and (b) to itself with respect to payments which the registrant may make to such officers and directors pursuant to the above indemnification provision or otherwise as a matter of law. We will also be obligated under the Stockholder Agreement to provide certain insurance coverage to our directors, officers and employees and to NAB-affiliated individuals and entities, including insurance against certain liabilities under the Securities Act of 1933, as amended, or the Securities Act.
Reference is made to the form of underwriting agreement to be filed as Exhibit 1.1 hereto for provisions providing that the underwriters are obligated, under certain circumstances, to indemnify the registrant’s directors, officers and controlling persons against certain liabilities under the Securities Act.
Item 15. Recent Sales of Unregistered Securities.
In the three years preceding the filing of this Registration Statement, the registrant has not issued any securities that were not registered under the Securities Act, except for the issuance of 100 shares of the registrant’s common stock to National Americas Holdings LLC for aggregate consideration of $100 upon the registrant’s formation in a transaction exempt from registration pursuant to Section 4(a)(2) of the Securities Act. Prior to the completion of this offering, the registrant will effect a -to-1 stock split of its common stock.
Item 16. Exhibits and Financial Statement Schedules.
(a) Exhibits: The following exhibits are filed as part of this Registration Statement:
| Number |
Description | |
| 1.1 | Form of Underwriting Agreement* | |
| 2.1 | Purchase and Assumption Agreement (Whole Bank, All Deposits), dated as of June 4, 2010, among Federal Deposit Insurance Corporation, as Receiver of TierOne Bank, Lincoln, Nebraska, Federal Deposit Insurance Corporation and Great Western Bank** | |
| 2.2 | Form of Agreement and Plan of Merger of Great Western Bancorp, Inc. and Great Western Bancorporation, Inc. | |
| 3.1 | Form of Amended and Restated Certificate of Incorporation** | |
| 3.2 | Form of Amended and Restated Bylaws** | |
| 4.1 | Form of Common Stock Certificate** | |
| 4.2 | Indenture, dated as of December 17, 2003, between Great Western Bancorporation, Inc. and U.S. Bank National Association** | |
| 4.3 | Form of First Supplemental Indenture, between Great Western Bancorporation, Inc., Great Western Bancorp, Inc. and U.S. Bank National Association | |
| 4.4 | Amended and Restated Declaration of Trust of Great Western Statutory Trust IV, dated December 17, 2003** | |
| 4.5 | Indenture, dated as of March 10, 2006, between Great Western Bancorporation, Inc. and LaSalle Bank National Association** | |
| 4.6 | Form of First Supplemental Indenture, between Great Western Bancorporation, Inc., Great Western Bancorp, Inc. and U.S. Bank National Association | |
| 4.7 | Amended and Restated Declaration of Trust of GWB Capital Trust VI, dated as of March 10, 2006** | |
| 4.8 | Indenture, dated as of June 1, 2005, between Sunstate Bancshares, Inc. and JPMorgan Chase Bank, National Association** | |
II-2
Table of Contents
| Number |
Description | |
| 4.9 | First Supplemental Indenture, dated as of May 10, 2007, between Great Western Bancorporation, Inc. and The Bank of New York Trust Company, National Association** | |
| 4.10 | Form of Second Supplemental Indenture, between Great Western Bancorporation, Inc., Great Western Bancorp, Inc. and The Bank of New York Mellon Trust Company, National Association | |
| 4.11 | Amended and Restated Declaration of Trust of Sunstate Bancshares Trust II, dated as of June 1, 2005** | |
| 4.12 | Form of Amended and Restated Credit Agreement, between Great Western Bancorporation, Inc. and National Australia Bank Limited | |
| 4.13 | Subordinated Note of Great Western Bancorporation, Inc., dated as of June 3, 2008** | |
| 4.14 | Form of Assumption of Subordinated Note Due June 3, 2018, between Great Western Bancorp, Inc. and Great Western Bancorporation, Inc. | |
| 4.15 | Guarantee Agreement, dated as of December 17, 2003, between Great Western Bancorporation, Inc. and U.S. Bank National Association | |
| 4.16 | Guarantee Agreement, dated as of March 10, 2006, between Great Western Bancorporation, Inc. and LaSalle Bank National Association | |
| 4.17 | Guarantee Agreement, dated as of June 1, 2005, between Sunstate Bancshares, Inc. and JPMorgan Chase Bank, National Association | |
| 5.1 | Opinion of Sullivan & Cromwell LLP* | |
| 10.1 | Form of Stockholder Agreement, between National Australia Bank Limited and Great Western Bancorp, Inc. | |
| 10.2 | Form of Transitional Services Agreement, between National Australia Bank Limited and Great Western Bancorp, Inc. | |
| 10.3 | Form of Registration Rights Agreement, among National Australia Bank Limited, National Americas Holdings LLC and Great Western Bancorp, Inc. | |
| 10.4 | Employment Agreement, dated January 16, 2014, between Great Western Bank and Kenneth Karels** | |
| 10.5 | Secondment Letter, dated November 8, 2012, between National Australia Bank Limited and Peter Chapman** | |
| 10.6 | Secondment Letter, dated August 5, 2010, between National Australia Bank Limited and Stephen Ulenberg, as amended by the letter dated December 23, 2013** | |
| 10.7 | Employment Agreement, dated September 15, 2014, between Great Western Bancorp, Inc. and Kenneth Karels | |
| 10.8 | Employment Agreement, dated September 12, 2014, between Great Western Bancorp, Inc. and Peter Chapman | |
| 10.9 | Employment Agreement, dated September 12, 2014, between Great Western Bancorp, Inc. and Stephen Ulenberg | |
| 10.10 | Form of Great Western Bancorp, Inc. 2014 Omnibus Incentive Compensation Plan** | |
| 10.11 | Form of Great Western Bancorp, Inc. 2014 Non-Employee Director Plan** | |
| 10.12 | Form of Great Western Bancorp, Inc. Executive Incentive Compensation Plan** | |
| 10.13 | Form of Great Western Bancorp, Inc. 2014 Omnibus Incentive Compensation Plan Performance Share Unit Award Agreement* | |
| 10.14 | Form of Great Western Bancorp, Inc. 2014 Omnibus Incentive Compensation Plan Restricted Share Unit Award Agreement* | |
| 10.15 | Form of Great Western Bancorp, Inc. 2014 Non-Employee Director Plan Restricted Share Unit Award Agreement* | |
II-3
Table of Contents
| Number |
Description | |
| 21.1 | Subsidiaries of Great Western Bancorp, Inc.** | |
| 23.1 | Consent of Ernst & Young LLP | |
| 23.2 | Consent of Sullivan & Cromwell LLP (contained in Exhibit 5.1)* | |
| 24.1 | Powers of Attorney** | |
| * | To be filed by amendment. |
| ** | Previously filed. |
(b) Consolidated Financial Statement Schedules: All schedules are omitted because the required information is inapplicable or the information is presented in the consolidated financial statements and the related notes.
Item 17. Undertakings
The undersigned registrant hereby undertakes:
(a) to provide to the underwriter at the closing specified in the underwriting agreements, certificates in such denominations and registered in such names as required by the underwriter to permit prompt delivery to each purchaser;
(b) that insofar as indemnification for liabilities arising under the Securities Act of 1933 may be permitted to directors, officers and controlling persons of the registrant pursuant to the foregoing provisions, or otherwise, the registrant has been advised that in the opinion of the Securities and Exchange Commission such indemnification is against public policy as expressed in the Act and is, therefore, unenforceable. In the event that a claim for indemnification against such liabilities (other than the payment by the registrant of expenses incurred or paid by a director, officer or controlling person of the registrant in the successful defense of any action, suit or proceeding) is asserted by such director, officer or controlling person in connection with the securities being registered, the registrant will, unless in the opinion of its counsel the matter has been settled by controlling precedent, submit to a court of appropriate jurisdiction the question whether such indemnification by it is against public policy as expressed in the Act and will be governed by the final adjudication of such issue;
(c) that for purposes of determining any liability under the Securities Act of 1933, the information omitted from the form of prospectus filed as part of this registration statement in reliance upon Rule 430A and contained in a form of prospectus filed by the registrant pursuant to Rule 424(b)(1) or (4) or 497(h) under the Securities Act shall be deemed to be part of this registration statement as of the time it was declared effective; and
(d) that for the purpose of determining any liability under the Securities Act of 1933, each post-effective amendment that contains a form of prospectus shall be deemed to be a new registration statement relating to the securities offered therein, and the offering of such securities at that time shall be deemed to be the initial bona fide offering thereof.
II-4
Table of Contents
SIGNATURES
Pursuant to the requirements of the Securities Act of 1933, the Registrant has duly caused this Registration Statement on Form S-1 to be signed on its behalf by the undersigned, thereunto duly authorized, in Sioux Falls, South Dakota, on September 24, 2014.
| Great Western Bancorp, Inc. | ||
| By: | /s/ Ken Karels | |
| Name: | Ken Karels | |
| Title: | President and Chief Executive Officer |
Pursuant to the requirements of the Securities Act of 1933, this Registration Statement has been signed by the following persons in the capacities and on the dates indicated:
| Signature |
Title |
Date | ||
| /s/ Ken Karels Ken Karels |
President, Chief Executive Officer and Director (Principal Executive Officer) |
September 24, 2014 | ||
| * Nathan Butler |
Director |
September 24, 2014 | ||
| * Swati Dave |
Director |
September 24, 2014 | ||
| * Frances Grieb |
Director |
September 24, 2014 | ||
| * Andrew Hove |
Director |
September 24, 2014 | ||
| * Rolfe Lakin |
Director |
September 24, 2014 | ||
| * Richard Rauchenberger |
Director |
September 24, 2014 | ||
| * Daniel Rykhus |
Director |
September 24, 2014 | ||
| * Richard Sawers |
Director |
September 24, 2014 | ||
II-5
Table of Contents
| Signature |
Title |
Date | ||
| /s/ Peter Chapman |
||||
| Peter Chapman | Chief Financial Officer and Executive Vice President (Principal Financial Officer and Principal Accounting Officer) |
September 24, 2014 | ||
| * |
/s/ Ken Karels Ken Karels Attorney-in-fact |
|||||
II-6
Table of Contents
INDEX TO EXHIBITS
| Number |
Description | |
| 1.1 | Form of Underwriting Agreement* | |
| 2.1 | Purchase and Assumption Agreement (Whole Bank, All Deposits), dated as of June 4, 2010, among Federal Deposit Insurance Corporation, as Receiver of TierOne Bank, Lincoln, Nebraska, Federal Deposit Insurance Corporation and Great Western Bank** | |
| 2.2 | Form of Agreement and Plan of Merger of Great Western Bancorp, Inc. and Great Western Bancorporation, Inc. | |
| 3.1 | Form of Amended and Restated Certificate of Incorporation** | |
| 3.2 | Form of Amended and Restated Bylaws** | |
| 4.1 | Form of Common Stock Certificate** | |
| 4.2 | Indenture, dated as of December 17, 2003, between Great Western Bancorporation, Inc. and U.S. Bank National Association** | |
| 4.3 | Form of First Supplemental Indenture, between Great Western Bancorporation, Inc., Great Western Bancorp, Inc. and U.S. Bank National Association | |
| 4.4 | Amended and Restated Declaration of Trust of Great Western Statutory Trust IV, dated December 17, 2003** | |
| 4.5 | Indenture, dated as of March 10, 2006, between Great Western Bancorporation, Inc. and LaSalle Bank National Association** | |
| 4.6 | Form of First Supplemental Indenture, between Great Western Bancorporation, Inc., Great Western Bancorp, Inc. and U.S. Bank National Association | |
| 4.7 | Amended and Restated Declaration of Trust of GWB Capital Trust VI, dated as of March 10, 2006** | |
| 4.8 | Indenture, dated as of June 1, 2005, between Sunstate Bancshares, Inc. and JPMorgan Chase Bank, National Association** | |
| 4.9 | First Supplemental Indenture, dated as of May 10, 2007, between Great Western Bancorporation, Inc. and The Bank of New York Trust Company, National Association** | |
| 4.10 | Form of Second Supplemental Indenture, between Great Western Bancorporation, Inc., Great Western Bancorp, Inc. and The Bank of New York Mellon Trust Company, National Association | |
| 4.11 | Amended and Restated Declaration of Trust of Sunstate Bancshares Trust II, dated as of June 1, 2005** | |
| 4.12 | Form of Amended and Restated Credit Agreement, between Great Western Bancorporation, Inc. and National Australia Bank Limited | |
| 4.13 | Subordinated Note of Great Western Bancorporation, Inc., dated as of June 3, 2008** | |
| 4.14 | Form of Assumption of Subordinated Note Due June 3, 2018, between Great Western Bancorp, Inc. and Great Western Bancorporation, Inc. | |
| 4.15 | Guarantee Agreement, dated as of December 17, 2003, between Great Western Bancorporation, Inc. and U.S. Bank National Association | |
| 4.16 | Guarantee Agreement, dated as of March 10, 2006, between Great Western Bancorporation, Inc. and LaSalle Bank National Association | |
| 4.17 | Guarantee Agreement, dated as of June 1, 2005, between Sunstate Bancshares, Inc. and JPMorgan Chase Bank, National Association | |
Table of Contents
| Number |
Description | |
| 5.1 | Opinion of Sullivan & Cromwell LLP* | |
| 10.1 | Form of Stockholder Agreement, between National Australia Bank Limited and Great Western Bancorp, Inc. | |
| 10.2 | Form of Transitional Services Agreement, between National Australia Bank Limited and Great Western Bancorp, Inc. | |
| 10.3 | Form of Registration Rights Agreement, among National Australia Bank Limited, National Americas Holdings LLC and Great Western Bancorp, Inc. | |
| 10.4 | Employment Agreement, dated January 16, 2014, between Great Western Bank and Kenneth Karels** | |
| 10.5 | Secondment Letter, dated November 8, 2012, between National Australia Bank Limited and Peter Chapman** | |
| 10.6 | Secondment Letter, dated August 5, 2010, between National Australia Bank Limited and Stephen Ulenberg, as amended by the letter dated December 23, 2013** | |
| 10.7 | Employment Agreement, dated September 15, 2014, between Great Western Bancorp, Inc. and Kenneth Karels | |
| 10.8 | Employment Agreement, dated September 12, 2014, between Great Western Bancorp, Inc. and Peter Chapman | |
| 10.9 | Employment Agreement, dated September 12, 2014, between Great Western Bancorp, Inc. and Stephen Ulenberg | |
| 10.10 | Form of Great Western Bancorp, Inc. 2014 Omnibus Incentive Compensation Plan** | |
| 10.11 | Form of Great Western Bancorp, Inc. 2014 Non-Employee Director Plan** | |
| 10.12 | Form of Great Western Bancorp, Inc. Executive Incentive Compensation Plan** | |
| 10.13 | Form of Great Western Bancorp, Inc. 2014 Omnibus Incentive Compensation Plan Performance Share Unit Award Agreement* | |
| 10.14 | Form of Great Western Bancorp, Inc. 2014 Omnibus Incentive Compensation Plan Restricted Share Unit Award Agreement* | |
| 10.15 | Form of Great Western Bancorp, Inc. 2014 Non-Employee Director Plan Restricted Share Unit Award Agreement* | |
| 21.1 | Subsidiaries of Great Western Bancorp, Inc.** | |
| 23.1 | Consent of Ernst & Young LLP | |
| 23.2 | Consent of Sullivan & Cromwell LLP (contained in Exhibit 5.1)* | |
| 24.1 | Powers of Attorney ** | |
| * | To be filed by amendment. |
| ** | Previously filed. |