Attached files
| file | filename |
|---|---|
| EXCEL - IDEA: XBRL DOCUMENT - Digital Brand Media & Marketing Group, Inc. | Financial_Report.xls |
| EX-31 - DBMM EXHIBIT 31.1 - Digital Brand Media & Marketing Group, Inc. | exhibit31.htm |
| EX-32 - DBMM EXHIBIT 32.1 - Digital Brand Media & Marketing Group, Inc. | exhibit32.htm |
UNITED STATES
SECURITIES AND EXCHANGE COMMISSION
Washington, D.C. 20549
FORM 10-Q/A
Amendment No 2
þ QUARTERLY REPORT PURSUANT TO SECTION 13 OR 15(D) OF THE SECURITIES EXCHANGE ACT OF 1934
For the quarterly period ended: May 31, 2014
¨ TRANSITION REPORT UNDER SECTION 13 OR 15(D) OF THE EXCHANGE ACT
For the transition period from ________ to ________
Commission file number: 333-85072
DBMM GROUP
DIGITAL BRAND MEDIA & MARKETING GROUP, INC.
WWW.DBMMGROUP.COM
(Exact name of small business issuer as specified in its charter)
747 Third Avenue, New York, NY 10017
(Address of principal executive offices)
Florida
State of incorporation
59-3666743
IRS Employer Identification №
(646) 722-2706
(Issuer's telephone number, including area code)
Indicate by check mark whether the registrant (1) has filed all reports required to be filed by Section 13 or 15(d) of the Securities Exchange Act of 1934 during the preceding 12 months (or for such shorter period that the registrant was required to file such reports), and (2) has been subject to such filing requirements for the past 90 days. þ Yes ¨ No
Indicate by check mark whether the registrant has submitted electronically and posted on its corporate Web site, if any, every Interactive Data File required to be submitted and posted pursuant to Rule 405 of Regulation S-T (§232.405 of this chapter) during the preceding 12 months (or for such shorter period that the registrant was required to submit and post such files). þ Yes ¨ No
Indicate by check mark whether the registrant is a large accelerated filer, an accelerated filer, a non-accelerated filer, or a smaller reporting company. See the definitions of “large accelerated filer,” “accelerated filer” and “smaller reporting company” in Rule 12b-2 of the Exchange Act.
| Large Accelerated Filer ¨ | Accelerated Filer ¨ |
| Non-Accelerated Filer ¨ | Smaller Reporting Company þ |
Indicate by check mark whether the registrant is a shell company (as defined in Rule 12b-2 of the Exchange Act) ¨ Yes þ No
Indicate the number of shares outstanding of each of the Issuer’s classes of common stock, as of the latest practicable date: As of September 1, 2014 - 3,613,790,986 shares outstanding.
EXPLANATORY NOTE:
This Quarterly report for the period ending May 31, 2014, amendment № 2, and amends the prior 2013-2014 Q3, filed on July 23, 2014, which contained unreviewed financial statements. It also amends the filing to furnish an updated Exhibit 101 to the Form 10Q (Interactive Data or XBRL files).
|
| |
|
|
INDEX
|
|
|
|
|
|
|
|
|
|
| Page No |
| PART I. FINANCIAL INFORMATION |
|
|
|
|
| Item 1. Financial Statements |
|
| Consolidated Financial Statements (Unaudited) |
|
| Balance Sheets | 3 |
| Statements of Operations | 4 |
| Statements of Cash Flows | 5 |
| Notes to Unaudited Consolidated Financial Statements | 6-13 |
| Item 2. Management's Discussion and Analysis of Financial Condition and Results of Operations | 14 |
| Item 3. Quantitative and Qualitative Disclosures About Market Risk | 25 |
| Item 4. Controls and Procedures | 25 |
| PART II. OTHER INFORMATION |
|
|
|
|
| Item 1. Legal Proceedings | 26 |
| Item 1A. Risk Factors | 26 |
| Item 2. Unregistered Sale of Equity Securities and Use of Proceeds | 26 |
| Item 3. Defaults Upon Senior Securities | 26 |
| Item 4. Submission of Matters to a Vote of Security Holders | 26 |
| Item 5. Other Information | 26 |
| Item 6. Exhibits | 26 |
| SIGNATURES | 27 |
|
|
|
|
| |
|
|
|
|
|
|
|
|
|
|
|
|
Page 2 of 27
Item 1. Financial Statements
| DIGITAL BRAND MEDIA & MARKETING GROUP, INC. AND SUBSIDIARIES | ||||
| CONSOLIDATED BALANCE SHEETS | ||||
|
|
|
|
|
|
|
|
| May 31, |
| August 31, |
|
|
| 2014 |
| 2013 |
|
|
| (Unaudited) |
|
|
| ASSETS | ||||
| CURRENT ASSETS |
|
|
|
|
| Cash |
| $ 56,935 |
| $ 18,015 |
| Accounts receivable, net |
| 40,691 |
| 35,520 |
| Prepaid expenses and other current assets |
| 1,493 |
| 6,357 |
| Total current assets |
| 99,119 |
| 59,892 |
|
|
|
|
|
|
| Property and equipment - net |
| 1,011 |
| 1,915 |
|
|
|
|
|
|
| TOTAL ASSETS |
| $ 100,130 |
| $ 61,807 |
|
|
|
|
|
|
| LIABILITIES AND STOCKHOLDERS' DEFICIT | ||||
| CURRENT LIABILITIES |
|
|
|
|
| Accounts payable and accrued expenses |
| $ 414,233 |
| $ 372,737 |
| Bank overdraft |
| - |
| 23,150 |
| Accrued salaries |
| 879,244 |
| 737,849 |
| Loans payable |
| 234,300 |
| 492,000 |
| Derivative liability |
| 275,929 |
| 151,329 |
| Convertible debentures, net |
| 488,423 |
| 341,588 |
|
|
|
|
|
|
| TOTAL CURRENT LIABILITIES |
| 2,292,129 |
| 2,118,653 |
|
|
|
|
|
|
| CONTINGENCIES (Note 9) | - | - | ||
|
| ||||
| STOCKHOLDERS' DEFICIT |
|
|
|
|
| Preferred stock, Series 1, par value .001; authorized 2,000,000 shares; 870,185 and 993,407 shares issued and outstanding |
| 870 |
| 993 |
| Preferred stock, Series 2, par value .001; authorized 2,000,000 shares; 0 and 2,000,000 shares issued and outstanding |
| - |
| - |
| Common stock, par value .001; authorized 5,000,000,000 shares; 1,789,764,483 and 38,069,489 shares issued and outstanding |
| 1,789,763 |
| 38,069 |
| Additional paid in capital |
| 7,880,879 |
| 8,739,662 |
| Accumulated other comprehensive loss |
| (6,627) |
| (4,452) |
| Accumulated deficit |
| (11,856,884) |
| (10,831,118) |
|
|
|
|
|
|
| TOTAL STOCKHOLDERS' DEFICIT |
| (2,191,999) |
| (2,056,846) |
|
|
|
|
|
|
| TOTAL LIABILITIES AND STOCKHOLDERS' DEFICIT |
| $ 100,130 |
| $ 61,807 |
|
|
|
|
|
|
| See Notes to Unaudited Consolidated Financial Statements | ||||
Page 3 of 27
| DIGITAL BRAND MEDIA & MARKETING GROUP, INC. AND SUBSIDIARIES | |||||||
| CONSOLIDATED STATEMENTS OF OPERATIONS | |||||||
| (UNAUDITED) | |||||||
|
|
|
|
|
|
|
|
|
|
| For the Three Months Ended May 31, |
| For the Nine Months Ended May 31, | ||||
|
| 2014 |
| 2013 |
| 2014 |
| 2013 |
|
|
|
|
|
|
|
|
|
| SALES | $ 79,902 |
| $ 105,893 |
| $ 292,341 |
| $ 329,772 |
|
|
|
|
|
|
|
|
|
| COST OF SALES | 47,561 |
| 53,062 |
| 152,103 |
| 180,076 |
|
|
|
|
|
|
|
|
|
| GROSS PROFIT | 32,341 |
| 52,831 |
| 140,238 |
| 149,696 |
|
|
|
|
|
|
|
|
|
| COSTS AND EXPENSES |
|
|
|
|
|
|
|
| General and administrative | 64,792 |
| 35,593 |
| 165,507 |
| 153,076 |
| Compensation expense | 89,999 |
| 51,000 |
| 379,627 |
| 180,600 |
| Legal and professional fees | 76,886 |
| (156,054) |
| 200,572 |
| (195) |
|
|
|
|
|
|
|
|
|
| TOTAL OPERATING EXPENSES | 231,677 |
| (69,461) |
| 745,706 |
| 333,481 |
|
|
|
|
|
|
|
|
|
| OPERATING LOSS | (199,336) |
| 122,292 |
| (605,468) |
| (183,785) |
|
|
|
|
|
|
|
|
|
| OTHER INCOME (EXPENSE) |
|
|
|
|
|
|
|
| Interest expense | (147,129) |
| (163,406) |
| (542,698) |
| (301,460) |
| Gain on derivative liability | 591,106 |
| 174,189 |
| 122,400 |
| 31,615 |
| Gain on settlement of debt | - |
| - |
| - |
| 33,151 |
| TOTAL OTHER INCOME (EXPENSE) | 443,977 |
| 10,783 |
| (420,298) |
| (236,694) |
|
|
|
|
|
|
|
|
|
| NET INCOME (LOSS) | $ 244,641 |
| $ 133,075 |
| $ (1,025,766) |
| $ (420,479) |
|
|
|
|
|
|
|
|
|
| OTHER COMPREHENSIVE INCOME (LOSS) |
|
|
|
|
|
| |
| Foreign exchange translation | (1,271) |
| (662) |
| (2,175) |
| (1,885) |
| COMPREHENSIVE INCOME (LOSS) | $ 243,370 |
| $ 132,413 |
| $ (1,027,941) |
| $ (422,364) |
|
|
|
|
|
|
|
|
|
| NET INCOME (LOSS) PER SHARE |
|
|
|
|
|
|
|
| Basic | $ 0.00 |
| $ 0.02 |
| $ (0.00) |
| $ (0.05) |
| Diluted | $ (0.00) | $ (0.01) | $ 0.00 | $ (0.05) | |||
|
|
|
|
|
|
|
|
|
| WEIGHTED AVERAGE NUMBER OF SHARES |
|
|
|
|
|
|
|
| Basic and diluted | 1,294,235,636 |
| 7,855,800 |
| 625,407,388 |
| 7,855,800 |
|
|
|
|
|
|
|
|
|
| See Notes to Unaudited Consolidated Financial Statements | |||||||
Page 4 of 27
| DIGITAL BRAND MEDIA & MARKETING GROUP, INC. AND SUBSIDIARIES | ||||
| CONSOLIDATED STATEMENTS OF CASH FLOWS | ||||
| (UNAUDITED) | ||||
|
|
|
|
|
|
|
|
| Nine Months Ended May 31, | ||
|
|
| 2014 |
| 2013 |
| CASH FLOWS FROM OPERATING ACTIVITIES |
|
|
|
|
| Net loss |
| $ (1,025,766) |
| $ (420,479) |
|
|
|
|
|
|
| Adjustments to reconcile net loss to net cash used in |
|
|
|
|
| operating activities: |
|
|
|
|
| Fair value of preferred shares issued for compensation |
| - |
| 27,600 |
| Fair value of preferred shares issued for bonus |
| 144,985 |
| - |
| Fair value of shares of common stock-interest |
| 72,480 |
| - |
| Depreciation |
| 1,398 |
| 2,098 |
| Amortization of debt discount |
| 417,592 |
| 170,967 |
| Change in fair value of derivative liability |
| (122,400) |
| (31,615) |
| Gain on settlement of debt |
| - |
| (33,151) |
| Additional compensation for debt restructuring |
| - |
| 70,430 |
| Reversal of preferred shares cancelled |
| - |
| (219,798) |
| Changes in operating assets and liabilities: |
|
|
|
|
| Accounts receivable |
| (5,171) |
| (3,796) |
| Prepaid expenses and other current assets |
| 4,860 |
| - |
| Accrued salaries |
| 141,395 |
| 86,994 |
| Accounts payable and accrued expenses |
| 73,765 |
| 90,690 |
|
|
|
|
|
|
| NET CASH USED IN OPERATING ACTIVITIES |
| (296,862) |
| (260,060) |
|
|
|
|
|
|
| CASH FLOWS FROM INVESTING ACTIVITIES |
|
|
|
|
| Purchase of fixed assets |
| (493) |
| (417) |
|
|
|
|
|
|
| NET CASH USED IN INVESTING ACTIVITIES |
| (493) |
| (417) |
|
|
|
|
|
|
| CASH FLOWS FROM FINANCING ACTIVITIES |
|
|
|
|
| Bank overdraft |
| (23,150) |
| - |
| Proceeds from convertible notes payable |
| 149,000 |
| 125,000 |
| Principal repayments of loan payable |
| (40,000) |
| (15,000) |
| Proceeds from loans payable |
| 252,600 |
| 104,500 |
|
|
|
|
|
|
| NET CASH PROVIDED BY FINANCING ACTIVITIES |
| 338,450 |
| 214,500 |
|
|
|
|
|
|
| NET INCREASE (DECREASE) IN CASH |
| 41,095 |
| (45,977) |
|
|
|
|
|
|
| EFFECT OF VARIATION OF EXCHANGE RATE OF CASH |
|
|
|
|
| HELD IN FOREIGN CURRENCY |
| (2,175) |
| (1,964) |
|
|
|
|
|
|
| CASH - BEGINNING OF PERIOD |
| 18,015 |
| 78,131 |
|
|
|
|
|
|
| CASH - END OF PERIOD |
| $ 56,935 |
| $ 30,190 |
|
|
|
|
|
|
| Supplemental disclosures of cash flow information: |
|
|
|
|
| Cash paid for interest |
| $ - |
| $ 2,000 |
| Cash paid for income taxes |
| $ - |
| $ - |
|
|
|
|
|
|
| Non-cash investing and financing activities: |
|
|
|
|
|
|
|
|
|
|
| Conversion of convertible notes payable into common stock |
| $ 399,228 |
| $ 69,396 |
| Assignment/Modification of notes payable to convertible notes payable |
| $ 450,300 |
| $ 110,000 |
| Debt discount associated with derivative liability |
| $ 247,000 |
| $ - |
| Beneficial conversion feature |
| $ 274,650 |
| $ 80,000 |
| Conversion of preferred stock to common stock |
| $ 26,956 |
| - |
| Conversion of accrual to preferred stock |
| $ - |
| $ 2,673 |
|
|
| |||
| See Notes to Unaudited Consolidated Financial Statements | ||||
Page 5 of 27
DIGITAL BRAND MEDIA & MARKETING GROUP, INC.
NOTES TO UNAUDITED CONSOLIDATED FINANCIAL STATEMENTS
NOTE 1 – ORGANIZATION, BASIS OF PRESENTATION AND GOING CONCERN
Nature of Business and History of the Company
Digital Brand Media & Marketing Group, Inc. (f/k/a RTG Ventures, Inc.) is an OTC:Pink listed company. The Company was organized under the laws of the State of Florida on September 29, 1998.
Subsequent to the close of the fiscal year 2011 following substantial investment, the Company conducted a structural review of its total product and services offering. The review was carried out by the Board of Directors. The result was to bring technology development being outsourced directly into the Company to steward on a daily basis and any activities which were not revenue generating in the near term were eliminated.
Certain business lines were eliminated from the Business Plan immediately. In October, 2011 the joint venture with iPayu was mutually withdrawn and in December, 2011 the acquisition of Bitemark Ltd. was rescinded. The companies reverted to the same position each held prior to the contracts. The rescission of the Bitemark Ltd. share purchase agreement was included as an exhibit to the filing for the 2011 fiscal year even though it constituted a subsequent event at the time.
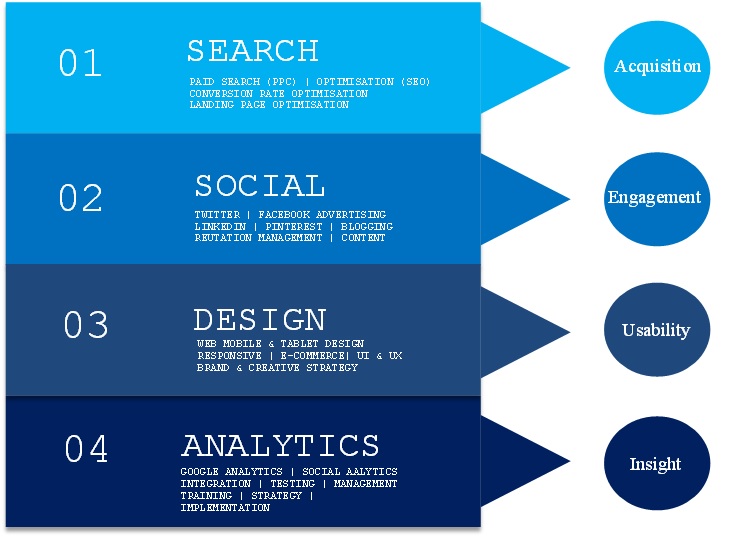
As a further result of the review, the Company has also agreed to strategically focus on developing the business of its wholly owned and revenue generating online marketing services company, Digital Clarity. With deep DNA in its operating market, blending the services of an experienced professional workforce leveraging a technology offering would position the company in a strong, forward looking structure. Digital Clarity operates in the growing area of digital marketing that helps companies make the most the digital economy focusing on areas such as Search Engine Marketing (Google, Yahoo! & Bing), Social Media (Twitter, Facebook & LinkedIn) and Internet Strategy Planning including Design, Analytics and Mobile Marketing.
During the last quarter of fiscal 2012, the Company entered into an agreement with BrandEntertain. BrandEntertain is a partnership and there were certain issues with partnership financials which suggested the business combination be construed as a collaboration/cooperative venture, rather than an acquisition. Upon analysis, on June 11, 2013, the agreement was rescinded.
On March 5, 2013, Digital Brand Media & Marketing Group, Inc. filed a Certificate of Amendment to its Articles of Incorporation to change its name from “RTG Ventures, Inc.” to “Digital Brand Media & Marketing Group, Inc.” In connection with the name change, the Company’s trading symbol changed from “RTGV” to “DBMM” (the “Symbol Change”). The Amendment was effective as of March 20, 2013. The Name Change and Symbol Change have been reflected in the Company’s ticker symbol as of April 8, 2013.
Page 6 of 27
Also on March 5, 2013, a 100 to 1 reverse stock split went effective. All reference to Common Stock shares and per share amounts have been retroactively restated to effect the reverse stock split as if the transaction had taken place as of the beginning of the earliest period presented.
A summary of the business is: DBMM Group crafts, designs and executes digital marketing strategies across multiple ad platforms and social media networks for a broad array of clients to help each of them establish a uniform brand identity across the digital universe. The product offering is a unique value proposition of intelligent analytics provided by an experienced digital marketing and technology team. Therefore DBMM Group is a blend of data, strategy and creative execution.
Going Concern
The accompanying unaudited consolidated financial statements have been prepared on a going concern basis. The Company has an accumulated deficit of approximately $11.9 million and a working capital deficiency at May 31, 2014 of approximately $2.2 million. The Company has incurred a net loss of approximately $1.2 million for the nine months ended May 31, 2014, 2013. The Company's ability to continue as a going concern is dependent upon its ability to obtain the necessary financing to meet its obligations and repay its liabilities arising from normal business operations when they come due, and to generate profitable operations in the future. Management plans to continue to provide for its capital requirements by seeking long term financing which may be in the form of additional equity securities and debt. The outcome of these matters cannot be predicted at this time and there are no assurances that if achieved, the Company will have sufficient funds to execute its business plan or generate positive operating results.
These matters, among others, raise substantial doubt about the ability of the Company to continue as a going concern. These unaudited financial statements do not include any adjustments to the amounts and classification of assets and liabilities that may be necessary should the Company be unable to continue as a going concern.
Basis of Presentation and Principles of Consolidation
The interim consolidated financial statements of Digital Brand Media & Marketing Group, Inc. (“we,” “us,” “our,” “DBMM” or the “Company”) are unaudited and contain all adjustments (consisting primarily of normal recurring accruals) necessary for a fair statement of the results for the interim periods presented. Results for interim periods are not necessarily indicative of results to be expected for a full year or for previously reported periods due in part, but not limited to, availability of capital resources, the timing of acquisitions, and the sensitivity of our business to economic conditions.
The accompanying unaudited consolidated financial statements have been prepared, in accordance with accounting principles generally accepted in the United States (“U.S. GAAP”) and pursuant to the rules and regulations of the Securities and Exchange Commission (the “SEC”). The accompanying unaudited consolidated financial statements include the accounts of the Company and its wholly owned subsidiaries. All intercompany transactions have been eliminated in consolidation. You should read these interim financial statements in conjunction with the consolidated financial statements and notes thereto included in the Company’s Annual Report on Form 10-K/A for the year ended August 31, 2013.
NOTE 2 - SIGNIFICANT ACCOUNTING POLICIES
Basis of Consolidation
The consolidated financial statements include the accounts of the Company and its wholly owned subsidiary RTG Ventures (Europe), Ltd. which is the sole shareholder of Stylar Ltd. All significant inter-company transactions are eliminated.
Cash and Cash Equivalents
Cash and cash equivalents consist primarily of cash in banks. The Company considers cash equivalents to include all highly liquid investments with original maturities of three months or less to be cash equivalents.
Page 7 of 27
Accounts Receivable and Allowance for Doubtful Accounts
Accounts receivable are recorded at the invoiced amount and do not bear interest. Accounts receivable are presented net of allowance for doubtful accounts.
The Company has a policy of reserving for uncollectible accounts based on its best estimate of the amount of probable credit losses in its existing accounts receivable. The Company periodically reviews its accounts receivable to determine whether an allowance is necessary based on an analysis of past due accounts and other factors that may indicate that the realization of an account may be in doubt. Account balances deemed to be uncollectible are charged to the bad debt expense after all means of collection have been exhausted and the potential for recovery is considered remote. At May 31, 2014 and August 31, 2013, the Company recognized $0 and $7,207 as allowance for doubtful accounts, respectively.
Property and Equipment
Property and equipment is stated at cost, less accumulated depreciation. Depreciation is provided using the straight-line method over the estimated useful lives of the related assets (primarily three to five years).
Revenue Recognition
The Company follows the guidance of ASC Topic 605, formerly, SAB 104 for revenue recognition. In general, the Company records revenue when persuasive evidence of an arrangement exists, services have been rendered, the sales price to the customer is fixed or determinable, and collectability is reasonably assured.
Revenues from services are recognized when the services are performed, evidence of an arrangement exists, the fee is fixed and determinable and collectability is probable.
Use of Estimates
The preparation of financial statements in conformity with accounting principles generally accepted in the United States of America requires management to make estimates and assumptions that affect the reported amounts of assets and liabilities, and disclosure of contingent assets and liabilities, at the date of the financial statements and the reported amounts of revenues and expenses during the reporting period. Actual results could differ from those estimates.
Reclassifications
Certain amounts in the prior period financial statements have been reclassified to conform with the current period presentation, such as amortization of debt discount, which was grouped with interest expense.
Income Taxes
The Company accounts for income taxes utilizing the liability method of accounting. Under the liability method, deferred taxes are determined based on differences between financial statement and tax bases of assets and liabilities at enacted tax rates in effect in years in which differences are expected to reverse. Valuation allowances are established, when necessary, to reduce deferred tax assets to amounts that are expected to be realized.
Earnings (loss) per common share
The Company utilizes the guidance per FASB Codification “ASC 260 "Earnings Per Share". Basic earnings per share is calculated on the weighted effect of all common shares issued and outstanding, and is calculated by dividing net income available to common stockholders by the weighted average shares outstanding during the period. Diluted earnings per share, which is calculated by dividing net income available to common stockholders by the weighted average number of common shares used in the basic earnings per share calculation, plus the number of common shares that would be issued assuming conversion of all potentially dilutive securities outstanding, is not presented separately as it is anti-dilutive. Such securities have been excluded from the per share computations as of May 31, 2014 and 2013.
Anti-dilutive securities, which consist of shares underlying the convertible promissory notes amounted to 2,769,755,822 and 24,175,488 at May 31, 2014 and 2013, respectively.
The numerator for the diluted net loss per share for the three-month periods ended May 31, 2014 and 2013 has been adjusted for the gain on derivative liability of $591,106 and $174,189 respectively.
Page 8 of 27
Derivative Liabilities
The Company assessed the classification of its derivative financial instruments as of May 31, 2014, which consist of convertible instruments and rights to shares of the Company’s common stock, and determined that such derivatives meet the criteria for liability classification under ASC 815.
ASC 815 generally provides three criteria that, if met, require companies to bifurcate conversion options from their host instruments and account for them as free standing derivative financial instruments. These three criteria include circumstances in which (a) the economic characteristics and risks of the embedded derivative instrument are not clearly and closely related to the economic characteristics and risks of the host contract, (b) the hybrid instrument that embodies both the embedded derivative instrument and the host contract is not re-measured at fair value under otherwise applicable generally accepted accounting principles with changes in fair value reported in earnings as they occur and (c) a separate instrument with the same terms as the embedded derivative instrument would be considered a derivative instrument subject to the requirements of ASC 815. ASC 815 also provides an exception to this rule when the host instrument is deemed to be conventional, as described.
During the nine-month period ended May 31, 2014 and 2013, the Company had notes payable outstanding in which the conversion rate was variable and undeterminable. Accordingly, the Company has recognized a derivative liability in connection with such instruments. The Company uses judgment in determining the fair value of derivative liabilities at the date of issuance at every balance sheet thereafter and in determining which valuation is most appropriate for the instrument (e.g., Binomial method), the expected volatility, the implied risk free interest rate, as well as the expected dividend rate.
Fair Value of Financial Instruments
Effective January 1, 2008, the Company adopted FASB ASC 820-Fair Value Measurements and Disclosures, or ASC 820, for assets and liabilities measured at fair value on a recurring basis. ASC 820 establishes a common definition for fair value to be applied to existing generally accepted accounting principles that require the use of fair value measurements establishes a framework for measuring fair value and expands disclosure about such fair value measurements. The adoption of ASC 820 did not have an impact on the Company’s financial position or operating results, but did expand certain disclosures.
ASC 820 defines fair value as the price that would be received to sell an asset or paid to transfer a liability in an orderly transaction between market participants at the measurement date. Additionally, ASC 820 requires the use of valuation techniques that maximize the use of observable inputs and minimize the use of unobservable inputs. These inputs are prioritized below:
Level 1 | Observable inputs such as quoted market prices in active markets for identical assets or liabilities |
| Level 2 | Observable market-based inputs or unobservable inputs that are corroborated by market data |
Level 3 | Unobservable inputs for which there is little or no market data, which require the use of the reporting entity’s own assumptions. |
|
|
|
The Company did not have any Level 2 or Level 3 assets or liabilities as of May 31, 2014, with the exception of its derivative liability which are valued based on Level 3 inputs.
Cash is considered to be highly liquid and easily tradable as of May 31, 2014 and therefore classified as Level 1 within our fair value hierarchy.
In addition, FASB ASC 825-10-25 Fair Value Option, or ASC 825-10-25, was effective for January 1, 2008. ASC 825-10-25 expands opportunities to use fair value measurements in financial reporting and permits entities to choose to measure many financial instruments and certain other items at fair value. The Company did not elect the fair value options for any of its qualifying financial instruments.
Page 9 of 27
Convertible Instruments
The Company evaluates and accounts for conversion options embedded in its convertible instruments in accordance with professional standards for “Accounting for Derivative Instruments and Hedging Activities”.
Professional standards generally provides three criteria that, if met, require companies to bifurcate conversion options from their host instruments and account for them as free standing derivative financial instruments. These three criteria include circumstances in which (a) the economic characteristics and risks of the embedded derivative instrument are not clearly and closely related to the economic characteristics and risks of the host contract, (b) the hybrid instrument that embodies both the embedded derivative instrument and the host contract is not re-measured at fair value under otherwise applicable generally accepted accounting principles with changes in fair value reported in earnings as they occur and (c) a separate instrument with the same terms as the embedded derivative instrument would be considered a derivative instrument. Professional standards also provide an exception to this rule when the host instrument is deemed to be conventional as defined under professional standards as “The Meaning of “Conventional Convertible Debt Instrument”.
The Company accounts for convertible instruments (when it has determined that the embedded conversion options should not be bifurcated from their host instruments) in accordance with professional standards when “Accounting for Convertible Securities with Beneficial Conversion Features,” as those professional standards pertain to “Certain Convertible Instruments.” Accordingly, the Company records, when necessary, discounts to convertible notes for the intrinsic value of conversion options embedded in debt instruments based upon the differences between the fair value of the underlying common stock at the commitment date of the note transaction and the effective conversion price embedded in the note. Debt discounts under these arrangements are amortized over the term of the related debt to their earliest date of redemption. The Company also records when necessary deemed dividends for the intrinsic value of conversion options embedded in preferred shares based upon the differences between the fair value of the underlying common stock at the commitment date of the note transaction and the effective conversion price embedded in the note.
ASC 815-40 provides that, among other things, generally, if an event is not within the entity’s control could or require net cash settlement, then the contract shall be classified as an asset or a liability.
Stock Based Compensation
We account for the grant of stock options and restricted stock awards to employees in accordance with ASC 718, “Compensation-Stock Compensation.” ASC 718 requires companies to recognize in the statement of operations the grant-date fair value of stock options and other equity based compensation.
Foreign Currency Translation
Assets and liabilities of subsidiaries operating in foreign countries are translated into U.S. dollars using both the exchange rate in effect at the balance sheet date or historical rate, as applicable. Results of operations are translated using the average exchange rates prevailing throughout the year. The effects of exchange rate fluctuations on translating foreign currency assets and liabilities into U.S. dollars are included in a separate component of stockholders’ equity (accumulated other comprehensive loss), while gains and losses resulting from foreign currency transactions are included in operations.
Business Combinations
In accordance with Accounting Standards Codification 805, "Business Combinations" ("ASC 805") the Company records acquisitions under the purchase method of accounting, under which the acquisition purchase price is allocated to the assets acquired and liabilities assumed based upon their respective fair values. The Company utilizes management estimates and, in some instances, may require an independent third-party valuation firm to assist in determining the fair values of assets acquired, liabilities assumed and contingent consideration granted. Such estimates and valuations require us to make significant assumptions, including projections of future events and operating performance.
Page 10 of 27
Recently Issued Accounting Pronouncements
A variety of accounting standards have been issued or proposed by FASB that do not require adoption until a future date. We regularly review all new pronouncements that have been issued since the filing of our Form 10-K for the nine-month period ended May 31, 2014 to determine their impact, if any, on our financial statements. The Company does not expect the adoption of any of these standards to have a material impact once adopted.
NOTE 3 - PROPERTY AND EQUIPMENT
Property and equipment consisted of the following:
|
|
|
| May 31, |
| August 31, | |
|
| Estimated life |
| 2014 |
| 2013 | |
|
|
|
|
| (Unaudited) |
|
|
| Computer and office equipment | 3 to 5 years |
| $ | 9,483 |
| $ 8,990 |
| Less: Accumulated depreciation |
|
|
| (8,472 | ) | (7,075) |
|
|
|
| $ | 1,011 |
| $ 1,915 |
Depreciation expense amounted to $1,398 and $2,098 for the nine-month periods ended May 31, 2014 and 2013, respectively.
NOTE 4 - LOANS PAYABLE
|
|
| May 31, |
| August 31, | ||
|
|
| 2014 |
| 2013 | ||
|
|
|
| (Unaudited) |
|
| |
| Loans payable |
| $ | 234,300 |
| $ | 492,000 |
The loans payable are due on demand, are unsecured, and are non-interest bearing.
During the nine-month period ended May 31, 2014 and 2013, the Company modified terms with existing or new lenders for loans payable aggregating $450,300 and $110,000, respectively. Substantially all modifications consist in adding conversion terms to such notes.
During the nine-month period ended May 31, 2014 and 2013, the Company made principal repayments aggregating $40,000 and $15,000.
During the nine-month period ended May 31, 2014 and 2013, the Company generated proceeds of $252,600 and $104,500 from loans payable, respectively.
NOTE 5 – CONVERTIBLE NOTES PAYABLE
At May 31, 2014 and August 31, 2013 convertible debentures consisted of the following:
|
|
|
| ||||
|
|
| May 31, 2014 |
| August 31, 2013 | ||
|
|
|
| (Unaudited) |
|
|
|
| Convertible notes payable |
| $ | 610,902 |
| $ | 432,831 |
| Unamortized debt discount |
|
| (122,479) |
|
| (91,243) |
| Total |
| $ | 488,423 |
| $ | 341,588 |
Page 11 of 27
The convertible notes payable mature through May 2015, some of which are payable on demand and they bear interest at ranges between 6% and 15%. The convertible promissory notes are convertible at ratios varying between 50 and 55% of the closing price at the date of conversion through, at its most favorable terms for the holders, the average of the three lowest closing bids for a period of 45 days prior to conversion. As of May 31, 2014, an aggregate of $365,931 of convertible promissory notes have matured. In addition the Company has convertible loans totaling $75,000 which are in default due to the delay in filing audited August 31, 2013 financial statements. The default is cured when the 10-KA is filed.
During the nine-month period ended May 31, 2014 and 2013, the Company modified terms with existing or new lenders for loans payable aggregating $450,300 and $110,000, respectively. Substantially all modifications consist in adding conversion terms to such notes.
During the nine-month period ended May 31, 2014 and 2013, the Company issued 1,541,715,705 and 2,027,975 shares of its common stock, respectively, to satisfy its obligations under principal repayments aggregating $399,228 and $69,396, respectively. Additionally, the Company issued 183,023,194 shares of its common stock pursuant to subsequent pricing reset provisions and to satisfy interest pursuant to certain convertible promissory notes during the nine-month period ended May 31, 2014. The fair value of the shares of common stock amounted to $72,480 during such period and has been recorded as interest expense.
During the nine-month period ended May 31, 2014 and 2013, the Company generated proceeds of $149,000 and $125,000, respectively, from the issuance of convertible promissory notes payable.
NOTE 6 - DERIVATIVE LIABILITIES
The Company accounts for the embedded conversion features included in its convertible instruments as derivative liabilities. At each measurement date, the fair value of the embedded conversion features was based on the lattice binomial method using the following assumptions:
Nine-Months Periods Ended
|
| May 31, 2014 |
| May 31, 2013 |
| Effective Exercise price | $.0003-.0008 |
| $0.0004-0.0172 |
| Effective Market price | $.0003-.0008 |
| $.0006-.0153 |
| Volatility | 171-179% |
| 157-411% |
| Risk-free interest | .13% |
| 0.04-.13% |
| Terms | 90 days |
| 1-365 days |
| Expected dividend rate | 0% |
| 0% |
Changes in the derivative liabilities during the nine-month periods ended May 31, 2014 and 2013 are as follows:
| Balance at September 1, 2012 | $ 112,828 |
| embedded conversion features at issuance | 45,000 |
| changes in fair value of derivative liabilities | (31,615) |
| Balance at May 31, 2013 | $ 126,213 |
|
|
|
| Balance at September 1, 2013 | $ 151,329 |
| embedded conversion features at issuance | 247,000 |
| changes in fair value of derivative liabilities | (122,400) |
| Balance at May 31, 2014 | $ 275,929 |
NOTE 7 - COMMON STOCK AND PREFERRED STOCK
During May 2014, the Company increased its number of authorized shares of common stock to 5,000,000,000.
On March 5, 2013, Digital Brand Media & Marketing Group, Inc. received approval from the Financial Industry Regulatory Authority (FINRA) for its 100 to 1 reverse stock split. All shares have been retroactively adjusted to reflect the 100 to 1 reverse stock split.
During the nine-month period ended May 31, 2014, the Company issued 622,531,098 shares of its common stock to satisfy its obligations under principal repayments aggregating $279,395. Additionally, the Company issued 111,150,106 shares of its common stock pursuant to subsequent pricing reset provisions and to satisfy interest pursuant to certain convertible promissory notes. The fair value of the shares of common stock amounted to $47,026 and has been recorded as interest expense.
In November 2012, 41,995 shares of Preferred Stock-Series 1 Designation were issued for an accrual to satisfy a debt. These shares are valued at $2,673.
Page 12 of 27
In November 2012, 433,637 shares of Preferred Stock-Series 1 Designation were issued to four officers of the Company. These shares are valued at $27,600.
In October 2013, 385,000 shares of Preferred Stock-Series 1 Designation were issued to three officers of the Company. These shares are valued at $144,985.
In September 2013, 508,222 shares of Preferred Stock-Series 1 Designation were converted into 26,956,095 shares of restricted common stock by officers of the Company. The fair value of such shares was based on the traded price per share of the Company's underlying shares of common stock.
NOTE 8 - FOREIGN OPERATIONS
As of May 31, 2014, all of our revenues and a majority of our assets are associated with subsidiaries located in the United Kingdom. Assets at May 31, 2014 and revenues for the nine-month period ended May 31, 2014 were as follows:
|
|
|
|
|
|
|
|
|
|
|
|
|
|
|
|
|
|
| United States |
|
| Great Britain |
|
|
|
| Total |
| |||
| Revenues |
| $ | - |
|
| $ | 292,341 |
|
|
|
| $ | 292,341 |
|
| Total revenues |
| $ | - |
|
| $ | 292,341 |
|
|
|
| $ | 292,341 |
|
| Identifiable assets at May 31, 2014 |
| $ | 1,011 |
|
| $ | 1,011 |
|
|
|
| $ | 100,130 |
|
As of August 31, 2013, all of our revenues and a majority of our assets are associated with subsidiaries located in the United Kingdom. Assets at August 31, 2013 and revenues for fiscal 2013 were as follows:
|
|
|
|
|
|
|
|
|
|
|
|
|
|
|
| |||||||||||
|
|
| United States |
|
| Great Britain |
|
|
|
| Total |
| ||||||||||||||
| Revenues |
| $ | - |
|
| $ | 408,505 |
|
|
|
| $ | 408,505 |
| |||||||||||
| Total revenues |
| $ | - |
|
| $ | 408,505 |
|
|
|
| $ | 408,505 |
| |||||||||||
| Identifiable assets at August 31, 2013 |
| $ | - |
|
| $ | 61,807 |
|
|
|
| $ | 61,807 |
| |||||||||||
|
|
|
|
|
|
|
|
|
|
|
|
|
|
|
| |||||||||||
NOTE 9 - LEGAL MATTERS
In February 2014, one of the Company's lenders filed a lawsuit in the State of New York alleging damages of $337,500 based on breach of contract arising from the Company's untimely public filings in November 2013. On September 18, 2014, the Court declined to grant the plaintiff's application for default judgment. The cross-motion by the Company was granted, and the lender was directed to file a certified answer in the form submitted within 20 days. The Company plans on vigorously defending the litigation and is unable to assert the likelihood of the outcomes of the allegation. However, it is possible that the Company will incur a loss of $37,500.
NOTE 10 - SUBSEQUENT EVENTS
Since June 1, 2014, the Company issued an aggregate of 1,824,026,503 shares of its common stock to satisfy obligations under certain convertible promissory notes.
Page 13 of 27
Item 2. Management's Discussion and Analysis or Plan of Operations
Readers are cautioned that certain statements contained herein are forward-looking statements and should be read in conjunction with our disclosures under the heading "Forward-Looking Statements" above. These statements are based on current expectations and assumptions that are subject to risks and uncertainties. This discussion also should be read in conjunction with the notes to our consolidated financial statements contained in Item 8. "Financial Statements and Supplementary Data" of this Report.
Background
DBMM is an OTC:Pink listed company. Subsequent to the close of the fiscal year 2011 following substantial investment, the Company conducted a structural review of its total product and services offering. The review was carried out by the Board of Directors. The result was to bring technology development being outsourced directly into the Company to steward on a daily basis and any activities which were not revenue generating in the near term were eliminated. It was unanimously agreed that the company would adopt a lean approach that focused on the relationships and partnerships. To that end, the Company has added significant partnerships through Letters of Intent, Joint Ventures and various collaborative structures involving revenue sharing arrangements.
Operations Overview/Outlook
Operationally, 2013 has been important in continuing the direction of the Company and steering it toward a scaled, sustainable growth plan. The model developed in fiscal 2012 has been reinforced and is differentiating to clients, therefore, the model will continue into fiscal 2014.
Entertainment/Fashion/Sports/Automotive/Ecommerce Solutions
DBMM is taking its strengths including its relationships to build its business focus on a wide array of industries. The Company, under very competitive global market conditions and growing development needs, continues to identify partnership opportunities. Utilizing successful models with existing clients, the outlook remains strong for the future.
The heart of the business is the marketing consultancy. Understanding each client and developing the model to individualize the outlook has been essential. This kind of close relationship with the client resulted in Digital Clarity being considered a close professional advisor.
In fiscal year 2014, the Company will continue to focus on the positive results of the last year and use that model to expand geographic reach with existing and new partners.
Page 14 of 27
Digital Marketing Services
2013 continues to see exponential growth in the adoption of Social Media as communication, marketing and engagement avenues. An acceptance of change is driving revenue. The future growth in mobile search is one of the fastest growing ancillary businesses. It was clear that the direction, talent and growth of the Company is in its human capital and outside relationships which must be proactive in order to differentiate itself from competition
The clear opportunity is at the foundation of the Company, namely the need to expedite and encourage development in the digital marketing services sector. The marketing services product is labor intensive and thus the Company must jumpstart the growth by significant capital infusion in fiscal year 2014 to grow simultaneously in multiple geographies.
As a foundation, the financial review showed that Digital Clarity continued to be revenue generating and remained cash flow positive.
Key Milestones
During 2013, Digital Clarity continued to make inroads into established and emerging markets. In 2012, as part of this emphasis, that was greatly enhanced and supported by the Head of US Operations, Steven Baughman, the company won a major deal with a US based entertainment group. The group was seeking a seasoned agency that could fulfill its complex specifications and grow with its aggressive expansion plans throughout the US and beyond. Digital Clarity was awarded the contract, removing the competitors to win the design and development of the new website centered on an intelligent design as well as a strong understanding and execution of social media integration. This model became the template for contracts going forward.
DBMM signed a Letter of Intent with Video Media Holdings, Inc. (VMS) to become its reseller in Europe with other revenue streams being explored as well. The value proposition for VMS strengthens DBMM’s offering to its clients. VMS Holdings, Inc. develops a mobile application for sharing videos. Its mobile application allows companies and users to send and receive video content to and from a mobile phone; subscribe for a favorite celebrity, actor, TV-channel, or team and get video updates; and create your own channel and become a broadcaster, as well as serves as a tool for mobile marketing and sales. The company's mobile application is available for Android, BlackBerry, iPhone, and Symbian devices. It distributes its mobile application through distributors, and mobile device and application stores in Africa, Europe, Asia, North America, and South Africa. It serves mobile operators and media companies, government organizations and law enforcement agencies, premium content providers and retailers, sports clubs, and celebrities worldwide.
DBMM finalized an agreement with New York based digital marketing automation platform, BRANDmini LLC, to strategically broaden BRANDmini's delivery of its SaaS (Software as a Service) application; primarily looking after those larger clients seeking to leverage a more bespoke digital marketing service abroad. BRANDmini is a transactional marketing automation platform for creating, serving, and measuring marketing campaigns across multiple online channels and mobile devices. Our platform is integrated with leading ad networks, publishers, mobile platforms and social sites. BRANDmini's innovative In-Page technology empowers brands to engage and transact with consumers while they are browsing. Now anyone can build branded transactional ads, gadgets, social landing pages and run campaigns anywhere your customers are.
These two partnerships illustrate the execution of DBMM’s strategic direction which strengthens the Company through its revenue sharing relationships resulting in additional revenue streams.
Many clients in the UK such as Mercedes Benz, UK, Wharfside and Duvet & Pillow Warehouse have experienced increases in revenue and increases in conversion as a result of Digital Clarity’s strategic direction. These case studies are excellent resources for new clients.
Page 15 of 27
Digital Clarity Named in Top Ten Best Social Media Marketing Firms in the UK for 2013
"Topseos.co.uk , an independent research firm, revealed the listing of the top 10 best social media marketing agencies in the UK based on their strength and competitive advantage. Social media marketing companies are put through a methodical analysis to ensure the rankings contain the absolute best companies the search marketing industry has to offer."
Digital Clarity was awarded a spot in the top 10. The process for researching and declaring social media marketing agencies in the UK is based on the use of a set of analysis criteria and learning more about their solutions and their communications with their customers through references. The teso.co.uk independent analysis team communicates directly with the clients in order to inquire about the solutions and achievement from the client's perspective.
Key Differentiators
2013 was been about establishing strong foundations by restructuring financially, continuing to streamline operations and assessing activities on a cost benefit basis while developing new partnerships and relationships. This focus has allowed the Company to enhance brand value for its clients. 2014 will continue to be about growth and outreach.
STRENGTHS: BRAND ENHANCEMENT
As the internet and mobile arena continues to mature, the need to make sense of and manage companies through this often complex market is clearly an area of massive growth. The company is confident that the talent and experience within the digital marketing team is poised for a major springboard in 2014, but must be expanded significantly in order to support the global reach intended.
Artist Collaboration, driven by Co-Chief Operating Officer and Head, US Operations, Steve Baughman, is an area that will see exponential growth in the coming 12 months and beyond. Artists and brands that look to leverage their celebrity status will look to companies such as Digital Clarity to help drive and develop their brand in the growing and complex arena of social media.
Market Reach
The Company has reach and experience across a large number of vertical markets including, but not limited to: Entertainment/Fashion/Sports/Automotive/Ecommerce.
Relationships and Industry Contacts
The team at Digital Clarity have professional and personal contacts, including some long-term relationships, at companies such as Google, Microsoft and Facebook, often being invited to attend strategic market briefings and insights.
Partnerships and agency management have allowed Digital Clarity to work on some of the biggest brands, sitting behind the agencies as a support and resource to deliver very high quality service and results to their clients.
Page 16 of 27
Team Expertise
COMPANY KEY ASSETS
Examples:
Ø
PPC campaign experience especially Google AdWords existed
Ø
SEO evolution from aggressive link building and onsite SEO through to strategic marketing integration of inbound marketing
Ø
Website design and development based on results driven design and planning
Ø
Brand consultancy
Ø
Social media management and advertising. Several clients have been “won” directly via Digital Clarity’s internal social media strategy
Ø
Sales and account management experience from multi-disciplined backgrounds
Evolution and Flexibility
The market is continually changing. Digital Clarity has always remained ahead of the curve and given their clients peace of mind by remaining a true strategic partner.
Page 17 of 27
Creative, Individualized Solutions and Customer Service
Case Studies and testimonials reflect the client-centric approach of Digital Clarity. Being selected over larger more established firms, support that we provide the client with skills that are differentiating. The Digital Clarity Brand is being established positively.
Growth Opportunities in the Market
As the use of web mobile sites and applications grow, so do the complexities and challenges of using these sites and platforms commercially. Digital Clarity directs business through the maze of an often confusing and sophisticated set of barriers, to create a clear path for the customer to our clients product or service. As this market matures, the need for companies to rely on the services from Digital Clarity can only grow. Here we look at some of the growth areas in Digital Clarity’s arsenal.
Growth Opportunities in Design
Ø
644,275,754– number of active web pages 1st QTR 2012 - NetCraft
Ø
6 million domains added quarterly - Verisign
Ø
By 2015, Mobile Internet Usage Will Increase by Factor of 26 - CISCO
Ø
665 million media tablets in use worldwide By end of 2016 - Gartner Group
Growth & Opportunities in Search
Ø
The North American Search industry will grow from $19.3 bn in 2011 to $26.8bn in 2013 - SEMPO
Ø
Revenue from Localized Mobile Ads to Reach $5.8 Billion in U.S. by 2016 - BIA/Kelsey
Ø
U.S. search spend grew by 11 percent Year over Year, while ROI improved by 26 percent - Adobe
Ø
72% of Consumers Want Mobile-Friendly Sites - Google Research
Ø
2 million search queries are made on Google, every minute - Google
Ø
Growth in Corporate Search - 50% of Fortune 100 Companies have a Google+ Account
Growth & Opportunities in Social Media
Fortune Global 100 companies have more accounts on each platform than ever before with an average:
Ø
10.1 Twitter accounts
Ø
10.4 Facebook pages
Ø
8.1 YouTube channels
Ø
2.6 Google Plus pages
Ø
2.0 Pinterest accounts
Ø
Seventy-four percent of companies studied have a Facebook page.
Ø
Ninety-three percent of corporate Facebook pages are updated weekly.
Ø
Forty-eight percent of companies are now on Google Plus.
Ø
Twenty-five percent of companies have Pinterest accounts.
Ø
Each corporate Facebook page has an average of 6,101 people talking about it.
Page 18 of 27
The need for DBMM to reach Global Markets
It is clear that the economy continues its slow recovery from the global effect of market forces which impact on all areas of commerce and trade. As the markets remain volatile, the opportunity for a company like DBMM to approach new business with its proven track record, increases. The core markets remain US and English speaking European markets. Emerging markets are a target for 2014. BRIC countries (Brazil, Russia, India and China) will be the next targets from the emerging markets.
Internet usage is poised for explosive growth across Asia, driving massive consumer demand for digital content and services. The biggest challenge for businesses hoping to meet this demand is how to make money while creating low-cost content. According to McKinsey & Co, India and China are driving the next digital revolution via new mobile devices.
The Company intends to further extend its services in the Middle Eastern market initially then review the successes using a lean methodology and continuous improvement along the way, and then roll out to the BRIC markets.
US
The US remains the center of the entertainment, technology and digital industries and as such the emphasis looking forward to 2014 and building on the recent success in the last quarter of the 2013 calendar year means that DBMM and its agency Digital Clarity are perfectly positioned to spring board into this market using the successful models established over the last two years.
The digital market continues to be focused on New York and Los Angeles therefore DBMM’s triangle of London/New York/LA is strategically sound. We are establishing a strong digital marketing presence in the Los Angeles area to cover the entertainment and music market and then plan to have the same model in New York. Our corporate offices are located in New York, however Los Angeles remains a key regional base from which to build and expand relationships, while a New York presence is equally important to serve and build relationships in the largest advertising market in the US.
The Asian American Market - An Unusually Attractive Opportunity
Ø
Fast Growing: -Current Population - 13+ Million - 49% population growth 1990-2000; 29% growth 2000-2008.
Ø
Educated & Affluent: -44% holding BA degree - vs. 28% of Non-Hispanic Whites -Median HH income almost $10K greater than Non-Hispanic Whites
Ø
Geographically Concentrated: -More than 50% reside in 3 states alone: CA, NY, TX.
Ø
Money to Spend:
Ø
$509 billion in annual purchasing power.
Ø
Entrepreneurial and Driven -Own and operate 1.1 million business nationally, generating $343 billion in annual revenue.
Ø
Cost Efficient Reach -Almost 1,000 targeted media outlets reaching Asians nationally, with lowest CPMs of all consumer segments.
Page 19 of 27
Europe
As the current base of the digital marketing agency is in London England, it is perfectly placed to reach out to the broader European market to replicate the Company’s model in the stronger economies in this region. As with the relationships mentioned in the US, opportunities were advanced with US partners to leverage Digital Clarity’s reach in this region and help take established US agencies into the European region.
In 2013, the execution of this aspect of the business plan is illustrated by the agreements with VMS and Brandmini to represent them outside the United States, initially in Europe.
Middle East
The Middle East is a fertile market for heritage based US and European brands looking for entry into this lucrative market. The fastest area for growth in this sector is to leverage on the luxury arena. Digital Clarity is already in discussions with a number of different luxury groups each with different brands within the group.
Given the complexity of the region as well as the enormous potential, it is important that Digital Clarity aligns itself with established players in local markets. With this in mind, Digital Clarity will look to collaborate with some digital agency partners where there is already a relationship and create a strategy that allows the company to look at the breakdown of current digital competence of these brands focusing on various touch points such as tablets, sites, mobile & social reach in the Middle East.
Our value proposition is very much about creating digital penetration of the Middle Eastern market for a particular group and how those brands would be positioned to create brand value – a byproduct of which would be sales.
Support for growth in the Middle East
Ø
Worldwide luxury goods continues double-digit annual growth; global market now tops €200 billion
Ø
Dubai commands around 30 per cent of Middle East luxury market and around 60 per cent of the UAE’s luxury market
Ø
The Dubai Mall accounts for around 50 per cent of Dubai’s luxury purchases
Ø
Each year, more “HENRYs” (High Earnings, Not Rich Yet) become potential customers, with ten times as many HENRYs as ultra-affluent individuals
Ø
The rise of the middle class in emerging countries is polarizing the competitive arena, becoming a “new baby-boom sized generation” for luxury brands to target.
Page 20 of 27
Financial Overview/Outlook
DBMM began the 2013 fiscal year with significant challenges while continuing to streamline the Company which resulted in a reduction of 39% in operating expenses coupled with a decrease in other expenses of 56%. While the Company is still operating at a loss, the loss was 46% less than 2012. The focus remains on the growth of digital marketing services and technology driven through Digital Clarity. The cost of sales has decreased by 19% while gross profit increased by 3%, which continued into the first quarter of fiscal 2014. DBMM is a marketing services company which is labor intensive in order to provide a differentiating product to its clients. As such, it is imperative to raise a significant amount of capital to hire professionals who can deliver profit to the Company within a quarter. The proven model carried in our financials is each new hire/client averages a margin of 35%-55%, straight line and simple. On that basis, our target is to recruit 10-20 new staff to represent a critical mass and scale up our revenues proportionately.
The Company restructured through a reverse stock split in early 2013 coincident with a name change and trading symbol change effective in April, 2013.
Unfortunately all of the corporate realignment took a significant portion of the fiscal year, thus a significant capital raise was deferred until 2014 in order to follow the fiscal year 2013 audit. In the interim, the Company relied on short-term financing, a practice which we do not expect to continue in 2014 when it will be replaced by long term financing.
However, the weakened share price remains a challenge to the Company. On that basis, in the last two years having revenues of approximately $500,000 would suggest a conservative market multiple of x10-x16, the latter being the manufacturing average, the market cap of DBMM should be a minimum of $5,000,000. The multiples for media tend to be at the higher end of the spectrum, therefore, compared to other companies in this sector, DBMM is significantly undervalued. The issue will be addressed as a priority early in the 2014 fiscal year. Professional advisors suggested that in order to position the Company successfully with the long-term financial community, a restructuring was required. The Company concluded its reverse split and name change and post - fiscal year 2013 filing of the 10-K, will be in a good position to continue discussions with a number of target groups. In addition an investment bank in New York is collaborating with DBMM in the identification of a significant acquisition in our industry sector. Initial due diligence is now taking place.
Page 21 of 27
In summary, DBMM’s financing efforts have always been in short term, small amounts of working capital. That is going to change in 2014. Going forward, DBMM intends to embark on a significant capital raise to allow the Company to scale up geographically and maximize our global reach through partnered relationships. This strategy is the most efficient and effective path to grow DBMM quickly into multiple revenue streams. We have proven the model in the last year. Our marketing services’ offering is a labor intensive endeavor, wherein human capital is a key differentiator of knowledge and/or relationships. What we have discussed here is organic growth which will be conducted in conjunction with concluding an acquisition in the digital technology/marketing services sector.
After a very difficult year, fraught with challenges and hurdles, we see 2014 as poised for growth on multiple fronts. With capital infusion, which will allow us to bring in new clients, grow existing successful clients and service them accordingly, coupled with an offer of a deferred tax asset to attract partners with significant revenue and expansion patterns, we will have a model in place which will be sustainable.
Off-Balance Sheet Arrangements
We are not currently a party to, or otherwise involved with, any off-balance sheet arrangements that have or are reasonably likely to have a current or future material effect on our financial condition, changes in financial condition, revenues or expenses, results of operations, liquidity, capital expenditures or capital resources.
Recently Issued Accounting Pronouncements
Management does not believe that any recently issued, but not yet effective, accounting standards, if currently adopted, could have a material effect on the accompanying financial statements.
Reclassifications
Certain amounts in the prior period financial statements have been reclassified to conform with the current period presentation.
Significant and Critical Accounting Policies
Our discussion of the financial condition and results of operations is based upon our consolidated financial statements, which have been prepared in conformity with accounting principles generally accepted in the United States. The preparation of our consolidated financial statements requires management to make estimates and assumptions that affect the reported amounts of assets and liabilities, revenues and expenses, and related disclosure of any contingent assets and liabilities at the date of the financial statements. Management regularly reviews its estimates and assumptions, which are based on historical factors and other factors that are believed to be relevant under the circumstances. Actual results may differ from these estimates under different assumptions, estimates or conditions.
Critical accounting policies are defined as those that are reflective of significant judgments and uncertainties, and potentially result in materially different results under different assumptions and conditions. See “Notes to Consolidated Financial Statements” for additional disclosure of the application of these and other accounting policies.
Page 22 of 27
LIQUIDITY AND CAPITAL RESOURCES
During the 2012-2013 and 2013-2014 fiscal years, we migrated the technology in-house and concentrated on activities to grow Digital Clarity organically and by acquisition. We spent fiscal year 2012-2013 establishing a client model for existing and new customers which can be exported geographically, continued the successful model into 2013 and will expand the base in 2014.
NINE-MONTH PERIOD ENDED MAY 31, 2014
We had approximately $57,000 in cash and our working capital deficiency amounted to approximately $2.2 million at May 31, 2014.
During the nine-month period ended May 31, 2014, we used cash in our operating activities amounting to approximately $297,000. Our cash used in operating activities was comprised of our net loss from continuing operations of approximately $1.0 million adjusted for the following:
|
|
|
|
|
| · | Fair value of preferred shares issued of $144,985; |
|
| · | Change in fair value of derivative liability of $122,400; |
|
| · | Amortization of debt discount of $417,592; |
|
| · | Fair value of shares issued as payment for interest and related financing fees of $72,480. |
Additionally, the following variations in operating assets and liabilities during the nine-month period ended May 31, 2014 impacted our cash used in operating activity:
|
|
|
|
|
| · | An increase in our accounts payable and accrued expenses, including accrued compensation, of approximately $215,000, resulting from slower payment processing due to our financial condition. |
During the nine-month period ended May 31, 2014, we generated cash from financing activities of $338,450, which primarily consists of the proceeds from the issuance of loans and convertible debt aggregating $401,600 offset by principal repayments of loans payable of $40,000 and payment of the bank overdraft of approximately $23,000.
NINE-MONTH PERIOD ENDED MAY 31, 2013
During the nine-month period ended May 31, 2013, we used cash in our operating activities amounting to approximately $260,060. Our cash used in operating activities was comprised of our net loss from continuing operations of approximately $420,000 adjusted for the following:
|
| · | Amortization of debt discount of $170,967; |
Additionally, the following variations in operating assets and liabilities impacted our cash used in operating activity:
|
| · | An increase in our accounts payable and accrued expenses, including accrued compensation of approximately $178,000, resulting from slower payment processing due to our financial condition.
|
During the nine-month period ended May 31, 2013, we generated cash from financing activities of $214,500, which consist of the proceeds from the issuance of loans and convertible debt totaling $229,500 and offset by prinicipal payments of loans payable totaling $15,000.
Page 23 of 27
RESULTS OF OPERATIONS
Comparison of the Results for the Three and Nine-month periods Ended May 31, 2014 and 2013
| Unaudited Consolidated Operating Results | |||||||||||||||
| Increase/ | Increase/ | Increase/ | Increase/ | ||||||||||||
|
| For the Three Months Ended May 31, |
| (Decrease) |
| (Decrease) |
| For the Nine Months Ended May 31, |
| (Decrease) |
| (Decrease) | ||||
|
| 2014 |
| 2013 |
| $ 2014 vs 2013 |
| % 2014 vs 2013 |
| 2014 |
| 2013 |
| $ 2014 vs 2013 |
| % 2014 vs 2013 |
| SALES | $ 79,902 | $ 105,893 | $ (25,991) | -25% | $ 292,341 | $ 329,772 | $ (37,431) | -11% | |||||||
| COST OF SALES | 47,561 | 53,062 | (5,501) | -10% | 152,103 | 180,076 | (27,973) | -16% | |||||||
| GROSS PROFIT | 32,341 | 52,831 | (20,490) | -39% | 140,238 | 149,696 | (9,458) | -6% | |||||||
| COSTS AND EXPENSES | |||||||||||||||
| General and administrative | 64,792 | 35,593 | 29,199 | 82% | 165,507 | 153,076 | 12,431 | 8% | |||||||
| Compensation expense | 89,999 | 51,000 | 38,999 | 76% | 379,627 | 180,600 | 199,027 | 110% | |||||||
| Legal and professional fees | 76,886 | (156,054) | 232,940 | NM | 200,572 | (195) | 200,767 | NM | |||||||
| TOTAL OPERATING EXPENSES | 231,677 | (69,461) | 301,138 | NM | 745,706 | 333,481 | 412,225 | 124% | |||||||
| OPERATING LOSS | (199,336) | 122,292 | 321,628 | NM | (605,468) | (183,785) | 421,683 | NM | |||||||
| OTHER INCOME (EXPENSE) | |||||||||||||||
| Interest expense | (147,129) | (163,406) | (16,277) | NM | (542,698) | (301,460) | 241,238 | NM | |||||||
| Gain on derivative liability | 591,106 | 174,189 | (416,917) | 239% | 122,400 | 31,615 | (90,785) | 287% | |||||||
| Gain on settlement of debt | - | - | - | - | 33,151 | (33,151) | NM | ||||||||
| TOTAL OTHER INCOME (EXPENSE) | 443,977 | 10,783 | (433,194) | NM | (420,298) | (236,694) | 183,604 | NM | |||||||
| NET LOSS | $ 244,641 | $ 133,075 | $ (111,566) | NM | $ (1,025,766) | $ (420,479) | $ 605,287 | NM | |||||||
| NM: Not meaningful | |||||||||||||||
We currently generate revenue through our Pay-Per-Click Advertising, Search Engine Marketing, Search Engine Optimization Services, Web Design, Social Media, Digital analytics and Advisory Services.
For the three and nine-month periods ended May 31, 2014 our primary sources of revenue are the Per-Click Advertising, Web Design and Search Engine Optimization Services. These primary sources amounted to 96% and 93% of our revenues during the three and nine-month period ended May 31, 2014. Our secondary sources of revenue are our Social Media and Email Media. These secondary sources amounted to approximately 4% and 7% of our revenues during the three and nine-month period ended May 31, 2014. For the three and nine-month periods ended May 31, 2013 our primary sources of revenue are the Per-Click Advertising, Web Design and Search Engine Optimization Services. These primary sources amounted to 85% of our revenues. Our secondary sources of revenue are our Social Media and Email Media. These secondary sources amounted to approximately 15% of our revenues.
We recognize revenue upon the completion of our performance obligation, provided that: (1) evidence of an arrangement exists; (2) the arrangement fee is fixed and determinable; and (3) collection is reasonably assured.
During the three-month and nine-month periods ended May 31, 2014, the decrease in our revenues, when compared to the prior year periods, is primarily attributable to a decrease in volume of transactions from Search Engine Optimization and Web Design Services during the three-month period ended May 31, 2014.
For the three and nine-month periods ended May 31, 2014, cost of sales included advertising, salaries and media spend. Our cost of sales decreased during the three-month and nine-month period endeds May 31, 2014, when compared to the prior year periods, primarily as a result of a corresponding decrease in revenues
The increase in general and administrative costs during the three and nine-month periods ended May 31, 2014, when compared to the prior year period, results from additional travel expenses incurred during the three-month periods ended May 31, 2014 in connection with business development activities.
The increase in compensation expense during the three and nine-month periods ended May 31, 2014 is primarily attributable to a non-recurring grant of preferred shares as bonus to certain of its officers which occurred during the first quarter of fiscal 2014 and which amounted to $145,000 for the three month period ended May 31, 2014. Additional compensation realted to the new Co-Chief Operating Officer which occured after May 31, 2013, but was in effect for the three-month period ended May 31, 2014.
Page 24 of 27
The increase in legal and professional fees during the three-month period and nine-month period ended May 31, 2014 when compared to the comparable prior year periods is primarily due to the cancellation of the arrangement with BrandEntertain recognized during the three-month period ended May 31, 2013, which resulted in the cancellation of 2,000,000 series2 Preferred shares recorded at a carrying value of approximately $220,000 and the timing of performance of services by certain of our professionals which did not occur during the three-month period ended May 31, 2014, but which, rather, will be incurred in later quarters.
Interest expense, which include interest accrued on certain notes, as well as amortization of debt discount and the fair value of shares issued pursuant to reset provisions of certain convertible promissory notes, increased during the three and nine-month period ended May 31, 2014 is primarily attributable to the amortization of debt discount which was higher during the three-and nine-month period ended May 31, 2014, when compared to the comparable prior year periods. The increase in amortization debt discount is primarily due to the issuance of a larger amount of convertible debt with beneficial conversion features and embedded conversion features during the nine-month period ended May 31, 2014 than the prior year comparable periods.
Gain on settlement of debt totaled 33,151 for the nine-month period ended May 31, 2013. There were no settlements during the three-month and nine-month period ended May 31, 2014.
The gain on derivative liabilities is primarily attributable to a change in fair value of derivative liabilities between measurement dates.
Item 3. QUANTITATIVE AND QUALITATIVE DISCLOSURE ABOUT MARKET RISK
As a “smaller reporting company”, as defined by Rule 10(f)(1) of Regulation S-K, the Company is not required to provide this information.
Item 4. CONTROLS AND PROCEDURES
As of the end of the period covered by this quarterly report, our management evaluated the effectiveness of our disclosure controls and procedures pursuant to Rule 13a-15(b) promulgated under the Exchange Act. Based upon that evaluation, our management concluded that, as of May 31, 2014, our disclosure controls and procedures were effective in ensuring that material information required to be disclosed in the reports that we file or submit under the Exchange Act is recorded, processed, summarized and reported within the time periods specified in the Securities and Exchange Commission’s rules and forms, including ensuring that such material information is accumulated and communicated to our management, as appropriate to allow timely decisions regarding required disclosure.
Evaluation of Disclosure Controls
We maintain controls and procedures designed to ensure that we are able to collect the information that is required to be disclosed in the reports we file with the Securities and Exchange Commission (the "SEC") and to process, summarize and disclose this information within the time period specified in the rules of the SEC. Our management is responsible for establishing, maintaining and enhancing these procedures. Management is also responsible, as required by the rules established by the SEC, for the evaluation of the effectiveness of these procedures.
Internal Controls
We maintain a system of internal controls designed to provide reasonable assurance that transactions are executed in accordance with management's general or specific authorization; transactions are recorded as necessary to permit preparation of financial statements in conformity with Generally Accepted Accounting Principles ("GAAP") and maintain accountability for assets. Access to assets is permitted only in accordance with management's general or specific authorization.
In conclusion, the disclosure and procedure controls provide for reasonable assurance regarding the reliability of financial reporting and preparation of financial statements for external purposes.
Page 25 of 27
PART II - OTHER INFORMATION
Item 1. Legal Proceedings
The Company is involved in a litigation, Asher Enterprises, Inc. v. Digital Brand Media & Marketing Group, Inc. and Linda Perry, Index No. 600717/2014, in the Supreme Court of the State of New York, sitting in the County of Nassau. The Plaintiff alleges $337,500 in damages based on breach of contract allegations arising from the Company’s untimely periodic filings in November 2013. On September 18, 2014, the Court declined to grant the plaintiff's application for default judgment. The cross-motion by the Company was granted and the lender was directed to file a verified answer in the form submitted within 20 days. The Company plans on vigorously defending the litigation. However, it is possible that the Company will incur a loss of $37,500 based on penalty clauses in its debt agreement with the plaintiff.
Item 1A. Risk Factors
As a “smaller reporting company” as defined by Item 10 of Regulation S-K, the Company is not required to provide information required by this item.
Item 2. Unregistered Sale of Equity Securities and Use of Proceeds
| Period | Class | Shares | Consideration | Use of Proceeds | Exemption from Registration |
|
|
|
|
|
|
|
| 2013-2014 Q3 | Investors | 991,057,695 | $145,284 | Reduction of Outstanding Debt | §4 (a) (2) |
|
|
|
|
|
|
|
Item 3. Defaults Upon Senior Securities
None.
Item 4. Submission of Matters to a Vote of Security Holders
None.
Item 5. Other Information
None.
Item 6. Exhibits
| Exhibits | |
|
|
|
|
|
|
| 31.1 | Executive Director - Rule 13a-14(a) Certification |
| 32.1 | Executive Director - Sarbanes-Oxley Act Section 906 Certification |
|
|
|
Page 26 of 27
SIGNATURES
Pursuant to the requirements of the Securities and Exchange Act of 1934, the Registrant has duly caused this report to be signed on its behalf by the undersigned, thereunto duly authorized.
|
|
|
|
|
|
|
|
|
|
|
|
|
|
|
|
|
| DIGITAL BRAND MEDIA & MARKETING GROUP, INC. |
|
|
|
| ||
| Date: September 23, 2014 |
| By: /s/ Linda Perry |
|
|
|
| Linda Perry Executive Director |
|
Page 27 of 27