Attached files
| file | filename |
|---|---|
| 8-K - 8-K - LRR Energy, L.P. | a14-21227_18k.htm |
EXHIBIT 99.1
|
|
LRR Energy, L.P. September 23, 2014 IPAA OGIS San Francisco |
|
|
1 . This presentation contains "forward-looking statements" — that is, statements related to future events. Forward-looking statements are based on the current expectations of LRR Energy and include any statement that does not directly relate to a current or historical fact. In this context, forward-looking statements often address expected future business and financial performance, and often contain words such as "may," "predict," "pursue," "expect," "estimate," "project," "plan," "believe," "intend," "achievable," "anticipate," "target," "continue," "potential," "should," "could" and other similar words. Forward-looking statements in this presentation relate to, among other things, LRR Energy's expectations regarding future results, production volumes, lease operating expenses and capital expenditures. Forward-looking statements involve certain risks and uncertainties, and ultimately may not prove to be accurate. These risks and uncertainties include, among other things, a decline in oil, natural gas or NGL prices, the risk and uncertainties involved in producing oil and natural gas, competition in the oil and natural gas industry, governmental regulations and other factors. Actual results could differ materially from those anticipated or implied in the forward-looking statements due to the factors described under the captions "Risk Factors" in LRR Energy's Annual Report on Form 10-K for the year ended December 31, 2013 and LRR Energy's subsequent filings with the Securities and Exchange Commission. All forward-looking statements speak only as of the date of this presentation. Other than required under the securities laws, LRR Energy does not intend to update or revise any forward-looking statements, whether as a result of new information, future events or circumstances, changes in expectations or otherwise. All forward-looking statements are qualified in their entirety by this cautionary statement. Forward Looking Statements LRR Energy, L.P. |
|
|
. 2 Equity Market Capitalization $506 MM Net Debt $242 MM Enterprise Value $748 MM Current Yield 10.8% Proved Reserves 32.6 MMBoe % Proved Developed 89% Q2 2014 Production 6,688 Boe/d Total Proved Reserve Life (R/P) 13.3 LRR Energy Overview LRR Energy, L.P. . Upstream MLP formed in November 2011 (NYSE: LRE) . Seek to provide investors with stable distributions and exposure to growth through the development, acquisition and exploitation of mature oil and gas properties . Stable and consistent source of quarterly distributions . 8 consecutive distribution increases Market Valuation1 1 Market data based on 9/17/14 unit price of $18.41. Net debt assumes 6/30/14 balance sheet 2 Reserves based on third party estimates using 12/31/13 SEC pricing for base assets and Ryder Scott estimates using 8/12/14 strip pricing for Stroud Prue Sand Unit assets Key Statistics2 Make Accretive Acquisitions of Oil and Gas Properties Create Value Through Development & Cost Reduction Reduce Commodity Price Risk Through Hedging Maintain a Balanced Capital Structure Permian Basin Mid-Continent Gulf Coast |
|
|
3 . . On September 2, 2014, LRE acquired operated oil and natural gas properties in Lincoln and Creek Counties, Oklahoma for $38.0 million . Effective date of sale is September 1, 2014 . Transaction is expected to close on October 1, 2014 . Field was discovered in 1943 and initial waterflood began in 1960 . Proved developed reserves of 2.5 MMBoe . 89% oil, 6% NGLs and 5% natural gas . Q2 2014 net production of 270 Boe/d (90% liquids) . 100% operated, 100% WI and 87% NRI . 110 active producing wells and 57 active injection wells . 3-year average annual PDP decline rate of 4% . Hedged 85% of expected PDP oil production through 2018 . Additional reserve potential will be evaluated at year-end LRR Energy, L.P. Stroud Prue Sand Unit Dyer Prue Sand Unit Proposed S. Stroud Prue Sand Unit Note: Reserves are based on Ryder Scott report using strip prices as of 8/12/2014 through 2017, escalated at 3% per year thereafter Recent Acquisition – Stroud Prue Sand Unit Land Legend Sales Properties Area with leases Area 100% leased |
|
|
. 4 . Operatorship allows for operational and engineering excellence (85% operated asset base) . LRE has operated core assets for numerous years . Maintain portfolio of actionable development opportunities . Maintain a conservative balance sheet and sufficient liquidity to fund growth . Use a prudent mix of debt and equity to fund acquisitions . Focused on increasing distribution coverage while providing growth . Target long-lived, low-risk properties . Proven management team with acquisition track record . Leverage industry relationships to source third party deals . Potential acquisitions from LRR and Lime Rock Partners . Aggressive use of hedges to lock in economics and to minimize cash flow volatility . General commodity hedge target of 65%-85% of estimated PDP production for a rolling 3-5 year period Strategy: Stable Cash Flows with Exposure to Growth Make Accretive Acquisitions of Oil and Gas Properties Create Value Through Development & Cost Reduction Reduce Commodity Price Risk Through Hedging Maintain a Balanced Capital Structure LRR Energy, L.P. |
|
|
. 5 . All major fields in primary production . Q2 2014 field level cash costs of $16.20/Boe1 . Q2 2014 field level cash margin of 70%2 Quality Assets Low Risk, Mature Assets Focused Portfolio Control Development Low-Cost Operator Developmental Inventory . Shallow production decline . 89% proved developed reserves . 13.3 reserve life . Focused operations . Three operating areas with scale . Well, commodity and geographic diversification . Operate 85% of proved reserves . Control project selection, timing and costs . Nearly all acreage is held by production . Low-risk, balanced proved inventory – 548 total projects . 377 gross development projects . 171 gross drilling locations LRR Energy, L.P. 1 Q2 2014 field level cash cost per Boe based on expenses of $9.9 million divided by production of 609 MBoe. Expenses include Lease Operating Expenses of $7.4 million, and Production and Ad Valorem Taxes of $2.4 million 2 Q2 2014 field level cash margin based on (Commodity Sales less Lease Operating Expenses and Production and Ad Valorem Taxes) divided by Commodity Sales |
|
|
. 6 Q2 2014 Production (Boe/d) 6,688 Proved Reserves (MMBoe) (1) 32.6 % Proved Developed 89% % Liquids 52% Total Proved Reserve Life (R/P) 13.3 Producing Wells (gross) 1,303 Total Development Opportunities (gross) 548 % Operated By Total Proved Reserves 85% Property Summary (Includes Stroud Acquisition) LRR Energy, L.P. 1 Reserves based on third party estimates using 12/31/13 SEC pricing for base assets and Ryder Scott estimates using 8/12/14 strip pricing for Stroud Prue Sand Unit assets BY PRODUCT 2013 Proved Reserve Characteristics BY CATEGORY BY AREA LRE Total Permian Basin Mid-Continent Gulf Coast Stroud Prue Sand Unit Acquisition |
|
|
. 7 Production Summary LRR Energy, L.P. Q2 2014 BY AREA AT IPO BY PRODUCT LRE has become more liquids weighted as a result of drilling at Red Lake and acquisitions Q2 2014 OP VS. NON-OP Q2 2014 BY PRODUCT Note: Q2 data is pro forma for Stroud Prue Sand Unit acquisition |
|
|
8 . Permian Basin Region LRR Energy, L.P. 1 Reserves based on Third Party estimates using 12/31/13 SEC Pricing Proved Reserves1 . Key fields: Red Lake, Pecos Slope, Corral Canyon . Proved reserves1 : 16.5 MMBoe (51% of total) . Q2 2014 Production: 3,562 Boe/d (53% of total) . 662 gross (533 net) producing wells . LRE operates 94% of proved reserves . 152,000 gross (124,000 net) acres . 244 gross development projects and 144 gross drilling locations . 2014 Capex of $29.4 MM (71% of total budget) Chaves Eddy Lea Martin Ward Reagan |
|
|
9 . Red Lake Field . Largest LRE field, predominantly liquids . Located in Eddy County, New Mexico . 32% of total proved reserves1 and 37% of total Q2 2014 production . 223 gross (186 net) producing wells . 99% LRE Operated . Sweet / sour crude with casing head gas . Low permeability carbonate reservoirs . Nearly all production via primary recovery . Multi year development program LRR Energy, L.P. 1 Reserves based on Third Party estimates using 12/31/13 SEC Pricing Proved Reserves1 Chaves Eddy Lea |
|
|
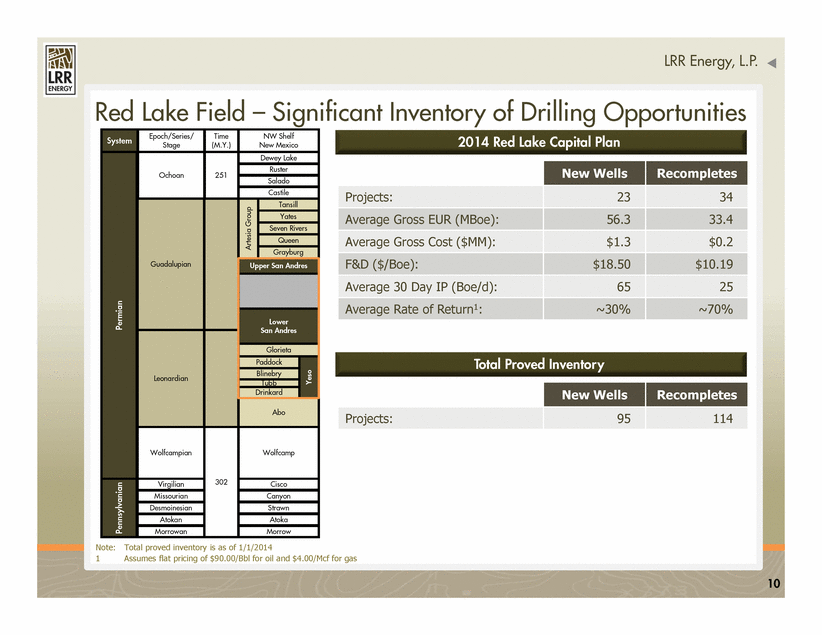
10 . Red Lake Field – Significant Inventory of Drilling Opportunities LRR Energy, L.P. System Permian Pennsylvanian Epoch/Series/ Stage Ochoan Guadalupian Leonardian Wolfcampian Virgilian Missourian Desmoinesian Atokan Morrowan Time (M.Y.) 251 302 NW Shelf New Mexico Dewey Lake Ruster Salado Castile Upper San Andres Artesia Group Tansill Yates Seven Rivers Queen Grayburg Lower San Andres Glorieta Paddock Blinebry Tubb Drinkard Yeso Abo Wolfcamp Cisco Canyon Strawn Atoka Morrow 2014 Red Lake Capital Plan New Wells Recompletes Projects: 23 34 Average Gross EUR (MBoe): 56.3 33.4 Average Gross Cost ($MM): $1.3 $0.2 F&D ($/Boe): $18.50 $10.19 Average 30 Day IP (Boe/d): 65 25 Average Rate of Return1: ~30% ~70% New Wells Recompletes Projects: 95 114 Total Proved Inventory Note: Total proved inventory is as of 1/1/2014 1 Assumes flat pricing of $90.00/Bbl for oil and $4.00/Mcf for gas |
|
|
11 . Mid-Continent and Gulf Coast Regions LRR Energy, L.P. Mid-Continent Overview1 . Key fields: Potato Hills, East Velma, Putnam, Stroud Prue Sand Unit . Proved reserves2: 13.0 MMBoe (40%) . Q2 2014 Production: 2,415 Boe/d (36%) . 151,800 gross (83,800 net) acres . LRE operates 73% of proved reserves . 87 gross development projects and 60 gross drilling locations Gulf Coast Overview . Key fields: New Years Ridge, George West-Stratton . Proved reserves2: 3.0 MMBoe (9%) . Q2 2014 Production: 711 Boe/d (11%) . 15,500 gross (12,000 net) acres . LRE operates 90% of proved reserves . 11 gross development projects and 2 gross drilling location PROVED RESERVES2 (by Commodity) PROVED RESERVES2 (by Commodity) 1 Pro forma for Stroud Prue Sand Unit acquisition 2 Reserves based on third party estimates using 12/31/13 SEC pricing for base assets and Ryder Scott estimates using 8/12/14 strip pricing for Stroud Prue Sand Unit assets |
|
|
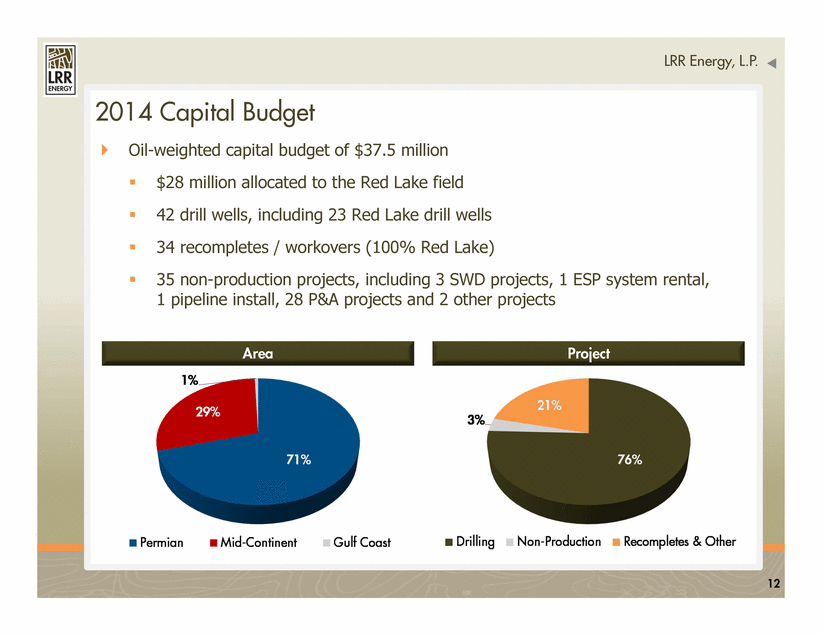
12 . 2014 Capital Budget LRR Energy, L.P. . Oil-weighted capital budget of $37.5 million . $28 million allocated to the Red Lake field . 42 drill wells, including 23 Red Lake drill wells . 34 recompletes / workovers (100% Red Lake) . 35 non-production projects, including 3 SWD projects, 1 ESP system rental, 1 pipeline install, 28 P&A projects and 2 other projects Area Project |
|
|
13 . LRR Energy, L.P. Significant Growth Potential – Multiple Acquisition Sources . 3 drop-down deals since IPO ~$125 MM . 60.9 MMBoe of proved reserves1 . ~$1.0 BN of current acquisition capacity . Strategy includes future LRR funds . ~$4.0 BN of private capital commitments . Potential asset acquisitions from portfolio companies . Announced first third party deal . Attractive market conditions . Producers continue to fund shale growth with conventional asset sales Drop-downs from Lime Rock Resources Joint Bids with Lime Rock Resources Acquisitions from Lime Rock Partners Acquisitions From Third Parties . Expands LRE acquisition universe . Supports ultimate drop-down strategy . 20 major LRR acquisitions since 2006 for ~$2.0 BN 1 Estimated proved reserves as of 12/31/13. Pro forma for announced acquisitions and divestitures. Lime Rock Resources includes Fund II and Fund III |
|
|
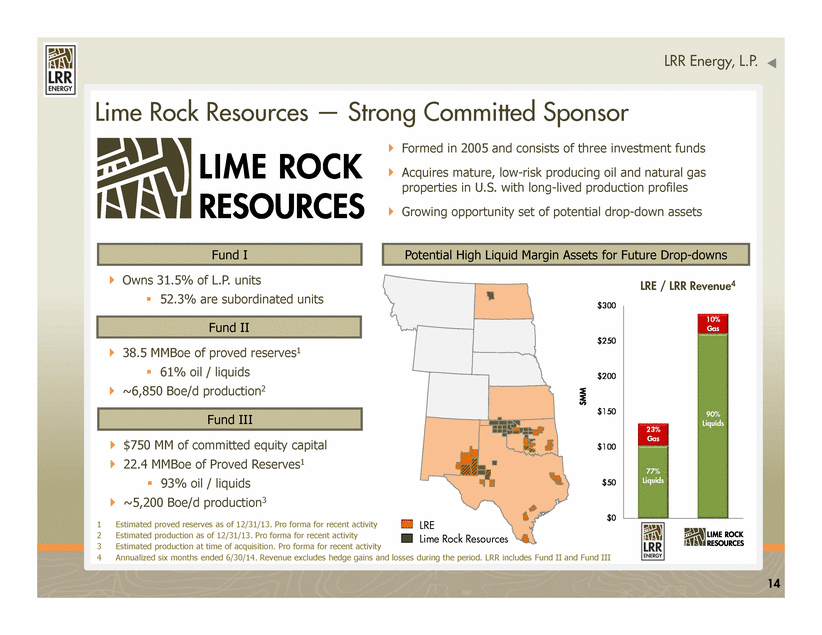
14 . LRE Lime Rock Resources 1 Estimated proved reserves as of 12/31/13. Pro forma for recent activity 2 Estimated production as of 12/31/13. Pro forma for recent activity 3 Estimated production at time of acquisition. Pro forma for recent activity 4 Annualized six months ended 6/30/14. Revenue excludes hedge gains and losses during the period. LRR includes Fund II and Fund III LRR Energy, L.P. Lime Rock Resources — Strong Committed Sponsor . Formed in 2005 and consists of three investment funds . Acquires mature, low-risk producing oil and natural gas properties in U.S. with long-lived production profiles . Growing opportunity set of potential drop-down assets Fund I . Owns 31.5% of L.P. units . 52.3% are subordinated units LRE / LRR Revenue4 Fund II . 38.5 MMBoe of proved reserves1 . 61% oil / liquids . ~6,850 Boe/d production2 Fund III . $750 MM of committed equity capital . 22.4 MMBoe of Proved Reserves1 . 93% oil / liquids . ~5,200 Boe/d production3 Potential High Liquid Margin Assets for Future Drop-downs |
|
|
. 15 As of June 30, 2014 ($ in thousands) Cash & Equivalents $2,871 Senior Credit Facility $195,000 2nd Lien Term Loan $50,000 Total Debt $245,000 Equity Market Capitalization (1) $505,685 Enterprise Value (2) $747,814 Senior Credit Facility Borrowing Base $235,000 Senior Credit Facility Availability $40,000 Liquidity $42,871 LTM Adjusted EBITDA $81,875 Total Debt / LTM Adjusted EBITDA 3.0x Total Debt / Enterprise Value 33% Conservative Financial Strategy . Strong balance sheet commitment . Target debt/Adjusted EBITDA of < 3.0x . Maintain adequate liquidity . Fund acquisitions with prudent leverage . Long-term financing plan . 40%-50% debt . 50%-60% equity LRR Energy, L.P. 1 Market data based on 9/17/14 unit price of $18.41 2 Enterprise Value equals Equity Market Capitalization plus Total Debt less Cash |
|
|
. 16 Stable and Consistent Source of Distributions . Track record of increasing distributions . Focused on increasing coverage while providing distribution growth over time . Distribution growth driven by organic development and acquisitions LRR Energy, L.P. |
|
|
17 . Robust Hedge Portfolio at Attractive Prices . 10% increase or decrease in commodity prices would affect 2014-2015 EBITDA by less than 1%1 Note: Hedge prices based on weighted-average of swap prices; pro forma for Stroud Prue Sand Unit acquisition 1 Portfolio as of 9/17/2014 2 Hedge percentages based on assumed flat production through 2017 at 6,500 Boe/d and production mix of gas 46%, oil 39% and NGL 15% LRR Energy, L.P. Hedge Summary2 Weighted Average Price Oil Gas NGLs $96.05 $5.56 $34.72 Oil Gas NGLs $93.16 $5.72 $34.46 Oil Gas NGLs $87.27 $4.29 NA Oil Gas NGLs $86.06 $4.61 NA Oil Gas NGLs $86.45 $4.28 NA |
|
|
. 18 Significant Total Return Potential . Annual distribution of $1.98 per unit . Current yield of 10.9% . Substantial tax shield . 100% shield on 2013 income . Opportunity for price appreciation . 13% potential appreciation, assuming LRE trades in line with peer average . Implied unit price of $20.83 LRR Energy, L.P. Current Yield Comparison1 1 Comparable yields based on 9/17/2014 data |
|
|
. 19 . Stable, low-risk and predictable properties . Operated, primary production and low cost asset portfolio . Track record of distribution increases – 8 consecutive quarters . Subordinated units support common unit distribution coverage . Protects cash flow, distributions, revolver and capital program . Includes commodity, regional oil and gas basis and interest rates . Strong and growing sponsor . Additional Lime Rock Resources funds should lead to increased drop-down opportunities . Multiple sources of acquisitions . Large internal project inventory . Attractive, tax shielded yield . Significant unit price appreciation potential Investment Highlights LRR Energy, L.P. Quality Assets Consistent Source of Distributions Significant Growth Potential Comprehensive Hedging Program Compelling Valuation Committed Sponsor |
|
|
20 . Appendix |
|
|
21 . Lime Rock Management "Lime Rock" Lime Rock Overview Appendix . Formed in 2005 . Consists of three funds . ~$2.0 BN invested in 20 major acquisitions . ~$1.0 BN of additional acquisition capacity . 60.9 MMBoe of proved reserves1 . Owns 32% of LRE's LP interests . Mature producing oil and natural gas properties . 32.6 MMBoe of proved reserves2 . Three operating regions . ~$4.0 BN of private capital commitments . Consists of six funds . Founded in 1998 . ~$5.5 BN of private capital commitments LRR Energy, L.P. "LRE" Lime Rock Resources "LRR" Lime Rock Partners "LRP" 1 Estimated proved reserves as of 12/31/13. Pro forma for recent activity 2 Reserves based on third party estimates using 12/31/13 SEC pricing for base assets and Ryder Scott estimates using 8/12/14 strip pricing for Stroud Prue Sand Unit assets |
|
|
22 . Lime Rock Management LP LRR Energy, L.P. (NYSE: LRE) LRE GP, LLC Incentive Distribution Rights Public Common Units Organization and Ownership Summary Lime Rock Resources ("LRR") Fund I Common Units Subordinated Units LRE Operating, LLC 100% Class A Member Interest 0.1% GP Interest 100% Interest 68.4% LP Interest 31.5% LP Interest Appendix Note: Ownership percentage as of 6/30/14 |
|
|
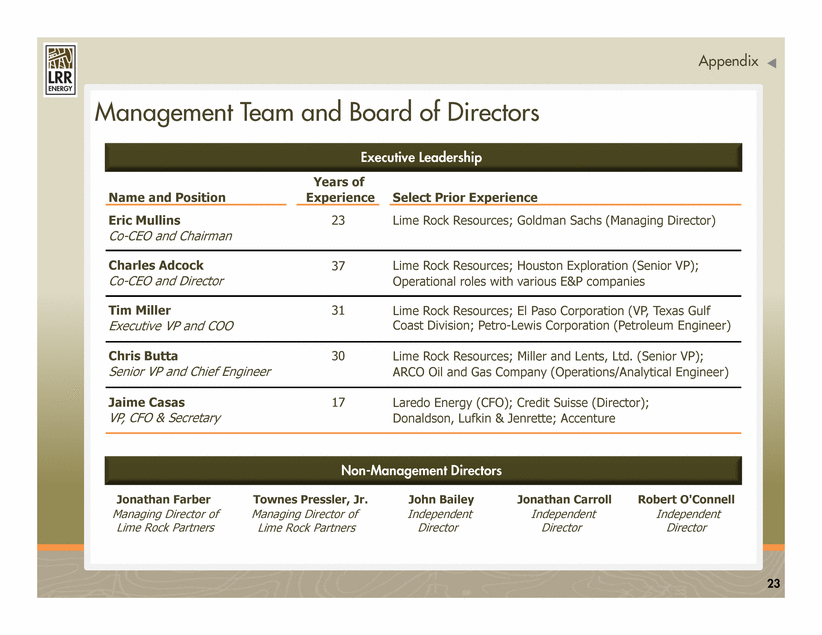
. 23 Management Team and Board of Directors Executive Leadership Non-Management Directors Appendix Jonathan Farber Townes Pressler, Jr. John Bailey Jonathan Carroll Robert O'Connell Managing Director of Lime Rock Partners Managing Director of Lime Rock Partners Independent Director Independent Director Independent Director Years of Name and Position Experience Select Prior Experience Eric Mullins Co-CEO and Chairman 23 Lime Rock Resources; Goldman Sachs (Managing Director) Charles Adcock Co-CEO and Director 37 Lime Rock Resources; Houston Exploration (Senior VP); Operational roles with various E&P companies Chris Butta Senior VP and Chief Engineer 30 Lime Rock Resources; Miller and Lents, Ltd. (Senior VP); ARCO Oil and Gas Company (Operations/Analytical Engineer) Tim Miller Executive VP and COO 31 Lime Rock Resources; El Paso Corporation (VP, Texas Gulf Coast Division; Petro-Lewis Corporation (Petroleum Engineer) Jaime Casas VP, CFO & Secretary 17 Laredo Energy (CFO); Credit Suisse (Director); Donaldson, Lufkin & Jenrette; Accenture |
|
|
24 . Commodity Hedges Appendix Note: Portfolio as of 9/17/14 1 Hedge prices based on weighted-average of swap prices Current Hedge Position Q3-Q4 2014 2015 2016 2017 2018 NYMEX HH GAS SWAPS Gas (MMBtu) 2,961,198 5,500,236 5,433,888 5,045,760 2,374,800 Wt Avg Price $5.56 $5.72 $4.29 $4.61 $4.28 NYMEX WTI OIL SWAPS Oil (Bbl) 391,425 757,321 610,131 266,574 65,280 Wt Avg Price $96.05 $93.16 $87.27 $86.06 $86.45 NGL SWAPS NGLs (Bbl) 137,760 236,149 Wt Avg Price $34.72 $34.46 |


