Attached files
| file | filename |
|---|---|
| EX-5.1 - EX-5.1 - Wayfair Inc. | a2221390zex-5_1.htm |
| EX-3.5 - EX-3.5 - Wayfair Inc. | a2221390zex-3_5.htm |
| EX-1.1 - EX-1.1 - Wayfair Inc. | a2221390zex-1_1.htm |
| EX-3.4 - EX-3.4 - Wayfair Inc. | a2221390zex-3_4.htm |
| EX-4.1 - EX-4.1 - Wayfair Inc. | a2221390zex-4_1.htm |
| EX-3.2 - EX-3.2 - Wayfair Inc. | a2221390zex-3_2.htm |
| EX-3.6 - EX-3.6 - Wayfair Inc. | a2221390zex-3_6.htm |
| EX-10.6 - EX-10.6 - Wayfair Inc. | a2221390zex-10_6.htm |
| EX-10.4 - EX-10.4 - Wayfair Inc. | a2221390zex-10_4.htm |
| EX-23.1 - EX-23.1 - Wayfair Inc. | a2221390zex-23_1.htm |
| EX-10.3 - EX-10.3 - Wayfair Inc. | a2221390zex-10_3.htm |
| EX-10.5 - EX-10.5 - Wayfair Inc. | a2221390zex-10_5.htm |
Use these links to rapidly review the document
TABLE OF CONTENTS
TABLE OF CONTENTS 2
As filed with the Securities and Exchange Commission on September 19, 2014.
Registration No. 333-198171
UNITED STATES
SECURITIES AND EXCHANGE COMMISSION
Washington, D.C. 20549
Amendment No. 1
to
FORM S-1
REGISTRATION STATEMENT
UNDER
THE SECURITIES ACT OF 1933
WAYFAIR INC.
(Exact name of registrant as specified in its charter)
| Delaware (State or other jurisdiction of incorporation or organization) |
5961 (Primary Standard Industrial Classification Code Number) |
36-4791999 (I.R.S. Employer Identification No.) |
4 Copley Place, 7th Floor
Boston, MA 02116
(617) 532-6100
(Address, including zip code, and telephone number, including area code, of registrant's principal executive offices)
Niraj Shah
Chief Executive Officer
Wayfair Inc.
4 Copley Place, 7th Floor
Boston, MA 02116
(617) 532-6100
(Name, address, including zip code, and telephone number, including area code, of agent for service)
| Copies to: | ||||
John H. Chory, Esq. Susan L. Mazur, Esq. Latham & Watkins LLP 1000 Winter Street, Suite 3700 Waltham, MA 02451 Telephone: (781) 434-6700 Facsimile: (781) 434-6601 |
Michael Fleisher Chief Financial Officer Wayfair Inc. 4 Copley Place, 7th Floor Boston, MA 02116 Telephone: (617) 532-6100 Facsimile: (617) 532-6148 |
Julie H. Jones, Esq. Thomas Holden, Esq. Ropes & Gray LLP Prudential Tower 800 Boylston Street Boston, MA 02199 Telephone: (617) 951-7000 Facsimile: (617) 951-7050 |
||
Approximate date of commencement of proposed sale to the public:
As soon as practicable after this Registration Statement is declared effective.
If any of the securities being registered on this form are to be offered on a delayed or continuous basis pursuant to Rule 415 under the Securities Act of 1933, check the following box. o
If this form is filed to register additional securities for an offering pursuant to Rule 462(b) under the Securities Act, check the following box and list the Securities Act registration statement number of the earlier effective registration statement for the same offering. o
If this form is a post-effective amendment filed pursuant to Rule 462(c) under the Securities Act, check the following box and list the Securities Act registration statement number of the earlier effective registration statement for the same offering. o
If this form is a post-effective amendment filed pursuant to Rule 462(d) under the Securities Act, check the following box and list the Securities Act registration statement number of the earlier effective registration statement for the same offering. o
Indicate by check mark whether the registrant is a large accelerated filer, an accelerated filer, a non-accelerated filer, or a smaller reporting company. See the definitions of "large accelerated filer," "accelerated filer" and "smaller reporting company" in Rule 12b-2 of the Exchange Act.
| Large accelerated filer o | Accelerated filer o | Non-accelerated filer þ (Do not check if a smaller reporting company) |
Smaller reporting company o |
CALCULATION OF REGISTRATION FEE
|
||||||||
| Class A Title of Each Class of Securities To Be Registered |
Amount To Be Registered(1) |
Proposed Maximum Offering Price Per Share(2) |
Proposed Maximum Aggregate Offering Price(2) |
Amount of Registration Fee(3) |
||||
|---|---|---|---|---|---|---|---|---|
Class A Common Stock, $0.001 par value per share |
12,650,000 | $28.00 | $354,200,000 | $45,621 | ||||
|
||||||||
- (1)
- Includes
additional shares that the underwriters have the option to purchase.
- (2)
- Estimated
solely for the purpose of calculating the registration fee pursuant to Rule 457(a) under the Securities Act of 1933, as amended.
- (3)
- Registration fee of $45,080 was previously paid in connection with the initial filing of this Registration Statement. The amount due in connection with this filing for the aggregate registration fee of $45,621 is partially offset by the $45,080 previously paid.
The Registrant hereby amends this Registration Statement on such date or dates as may be necessary to delay its effective date until the Registrant shall file a further amendment which specifically states that this Registration Statement shall thereafter become effective in accordance with Section 8(a) of the Securities Act of 1933 or until the Registration Statement shall become effective on such date as the Commission, acting pursuant to said Section 8(a), may determine.
The information in this preliminary prospectus is not complete and may be changed. These securities may not be sold until the registration statement filed with the Securities and Exchange Commission is effective. This preliminary prospectus is not an offer to sell nor does it seek an offer to buy these securities in any jurisdiction where the offer or sale is not permitted.
Subject to Completion. Dated September 19, 2014.
Preliminary Prospectus
11,000,000 Shares

Class A Common Stock
This is an initial public offering of shares of Class A common stock of Wayfair Inc.
Wayfair is offering 10,500,000 shares of Class A common stock to be sold in the offering. The selling stockholders identified in this prospectus are offering an additional 500,000 shares of Class A common stock. Wayfair will not receive any of the proceeds from the sale of the shares being sold by the selling stockholders.
Wayfair has two classes of authorized common stock, Class A common stock and Class B common stock. The rights of the holders of Class A common stock and Class B common stock are identical, except with respect to voting and conversion rights. Each share of Class A common stock is entitled to one vote per share. Each share of Class B common stock is entitled to ten votes per share and is convertible into one share of Class A common stock. Outstanding shares of Class B common stock will represent approximately 98.5% of the voting power of our outstanding capital stock immediately following the completion of this offering.
Prior to this offering, there has been no public market for the Class A common stock. It is currently estimated that the initial public offering price will be between $25.00 and $28.00 per share. We have applied to list our Class A common stock on the New York Stock Exchange under the symbol "W."
We are an "emerging growth company" as that term is used in the Jumpstart Our Business Startups Act of 2012, and, as such, have elected to comply with certain reduced public company reporting requirements. Investing in our common stock involves risks.
See "Risk Factors" beginning on page 14 to read about factors you should consider before buying shares of the Class A common stock.
|
Per Share
|
Total
|
|||||
Initial public offering price |
$ | $ | |||||
Underwriting discount |
$ | $ | |||||
Proceeds, before expenses, to Wayfair |
$ | $ | |||||
Proceeds, before expenses, to the selling stockholders |
$ | $ |
To the extent that the underwriters sell more than 11,000,000 shares of Class A common stock, the underwriters have the option to purchase up to an additional 1,650,000 shares from the selling stockholders at the initial public offering price less the underwriting discount.
Neither the Securities and Exchange Commission nor any state securities commission has approved or disapproved of these securities or passed on the adequacy or accuracy of this prospectus. Any representation to the contrary is a criminal offense.
The underwriters expect to deliver the shares against payment in New York, New York on , 2014.
| Goldman, Sachs & Co. | BofA Merrill Lynch | Citigroup | ||
Allen & Company LLC |
||||
Pacific Crest Securities |
Piper Jaffray |
Wells Fargo Securities |
||
| Canaccord Genuity | Cowen and Company | Raymond James |
Prospectus dated , 2014.


Through and including , 2014 (the 25th day after the date of this prospectus), all dealers effecting transactions in these securities, whether or not participating in this offering, may be required to deliver a prospectus. This is in addition to a dealer's obligation to deliver a prospectus when acting as an underwriter and with respect to an unsold allotment or subscription.
We, the selling stockholders and the underwriters, have not authorized anyone to provide any information or to make any representations other than those contained in this prospectus or in any free writing prospectuses we have prepared. We take no responsibility for, and can provide no assurance as to the reliability of, any other information that others may give you. This prospectus is an offer to sell only the shares offered hereby, but only under circumstances and in jurisdictions where it is lawful to do so. The information contained in this prospectus is current only as of its date.
Trademarks, Trade Names and Design Marks
We use various trademarks, trade names and design marks in our business, including without limitation Wayfair®, Joss & Main®, AllModern®, DwellStudio® and Birch Lane™. This prospectus also contains trademarks and trade names of other businesses that are the property of their respective holders.
Market, Industry and Other Data
We obtained the industry, market and competitive position data in this prospectus from our own internal estimates and research as well as from industry publications and research, surveys
i
and studies conducted by third parties and other publicly available information. Industry publications, studies and surveys generally state that they have been obtained from sources believed to be reliable, although they do not guarantee the accuracy or completeness of such information. While we believe our internal company research is reliable and the market definitions are appropriate, neither such research nor these definitions have been verified by any independent source.
Research by Euromonitor International should not be considered as the opinion of Euromonitor International as to the value of any security or the advisability of investing in Wayfair and accordingly, such information should not be relied upon for making any investment decision in respect of Wayfair.
ii
This summary highlights information contained elsewhere in this prospectus and does not contain all of the information you should consider in making your investment decision. Before deciding to invest in shares of our Class A common stock, you should read this summary together with the more detailed information elsewhere in this prospectus, including our consolidated financial statements and the related notes. You should carefully consider, among other things, the matters discussed in "Risk Factors," "Special Note Regarding Forward-Looking Statements," our consolidated financial statements and related notes, and "Management's Discussion and Analysis of Financial Condition and Results of Operations," in each case included elsewhere in this prospectus.
Unless the context otherwise requires, references in this prospectus to "Wayfair," "the company," "we," "us," and "our" refer, prior to the Corporate Reorganization discussed below, to Wayfair LLC, and, after the Corporate Reorganization discussed below, to Wayfair Inc., in each case together with its consolidated subsidiaries as a combined entity.
Overview
Wayfair is transforming the way people shop for their homes. Our homes are the center of our lives, where we raise families, create our fondest memories and spend most of our time. Our homes are very personal expressions of self and identity, which is why many of us seek uniqueness, crave originality and enjoy the feeling created by home design, furniture and décor. We built Wayfair to meet this emotional need for mass market consumers.
We have created one of the world's largest online destinations for the home. Through our e-commerce business model, we offer visually inspiring browsing, compelling merchandising, easy product discovery and attractive prices for over seven million products from over 7,000 suppliers across five distinct brands:

1
Our typical Wayfair customer is a 35 to 65 year old woman with an annual household income of $60,000 to $175,000, who we consider to be a mass market consumer and who we believe is underserved by traditional brick and mortar and other online retailers of home goods. Because each of our customers has a different taste, style, purchasing goal and budget when shopping for her home, we have built one of the largest online selections of furniture, home furnishings, décor and goods. We are able to offer this vast selection of products while holding minimal inventory because we typically ship products directly from our suppliers to our customers. This supplier direct fulfillment network is a key component of our custom-built and seamlessly integrated technology and operational platform, which also includes extensive supplier integrations, a proprietary transportation delivery network and superior customer service.
We founded our company in May 2002 and have since delivered nearly 13 million orders. From 2002 through 2011, the company was bootstrapped by our co-founders and operated as hundreds of niche websites, such as bedroomfurniture.com and allbarstools.com. In 2006, we launched AllModern. From 2003 to 2011, we grew our net revenue organically from $7.7 million to $517.3 million, representing a 69.2% compound annual growth rate, or CAGR. In late 2011, we made the strategic decision to close and permanently redirect over 240 of our niche websites into Wayfair.com to create a one-stop shop for furniture, home furnishings, décor and goods and to build brand awareness, drive customer loyalty and increase repeat purchasing. We also changed our name from CSN Stores LLC to Wayfair LLC.
Our co-founders are lifetime tech innovators who have worked together in the consumer internet sector since 1995 and have created a company culture deeply rooted in technology. Our technology and data focus facilitates critical e-commerce capabilities such as tailored shopping experiences across our five brands, consumer targeting and personalization, and "anytime, anywhere" shopping across our websites, mobile-optimized websites and mobile applications, which we collectively refer to as our sites.
Our strong customer loyalty and deep supplier relationships have helped us grow our Direct Retail sales, which we define as sales generated primarily through the sites of our five brands. In 2013 and the six months ended June 30, 2014, we generated Direct Retail net revenue of $673.4 million and $469.5 million, respectively, an increase of 73.0% and 75.0%, respectively, over our Direct Retail net revenue of $389.3 million and $268.4 million in 2012 and the six months ended June 30, 2013, respectively. In 2013, we delivered 3.3 million orders for 2.1 million Direct Retail active customers, representing increases of 85.2% and 61.0%, respectively, over 2012. In the six months ended June 30, 2014, we delivered 2.2 million orders, representing an increase of 76.6%, over the six months ended June 30, 2013. In the six months ended June 30, 2014, we had 2.6 million Direct Retail active customers, representing an increase of 75.0% over the six months ended June 30, 2013. In 2013 and the six months ended June 30, 2014, LTM net revenue per active customer was $322 and $332, respectively, an increase of 7.3% and 6.1% over 2012 and the six months ended June 30, 2013, respectively. In 2013 and the six months ended June 30, 2014, 47.2% and 51.2%, respectively, of orders delivered were from repeat customers, up from 37.4% and 47.7% in 2012 and the six months ended June 30, 2013, respectively. In addition, our mobile platform drives growth by engaging customers where and when they want to shop; in the first six months of 2014, 27.9% of all Direct Retail orders delivered were placed from a mobile device, up from 21.3% in the first six months of 2013. See the section titled "Management's Discussion and Analysis of Financial Condition and Results of Operations — Key Financial and Operating Metrics" on page 55 for further detail.
In 2013 and the six months ended June 30, 2014, we generated net revenue of $915.8 million and $574.1 million, respectively, up 52.4% and 49.8% over 2012 and the six months ended June 30, 2013, respectively. Our 2013 and six months ended June 30, 2014 net revenue included $673.4 million and $469.5 million, respectively, from Direct Retail and $242.4 million and $104.6 million, respectively,
2
from Other, which we define as net revenue generated primarily online through third parties, which we refer to as our retail partners. In 2013, we generated a net loss of $15.5 million and Adjusted EBITDA of $(2.9) million, improvements of $5.5 million and $9.1 million, respectively, over 2012. In the six months ended June 30, 2014, we generated a net loss of $51.4 million and Adjusted EBITDA of $(37.0) million, increases of $43.1 million and $34.9 million, respectively, over the six months ended June 30, 2013. Our net loss and Adjusted EBITDA results were driven primarily by our increased investment in advertising in 2012, 2013 and the six months ended June 30, 2014. Because we hold minimal inventory and a majority of our customers pay us before we pay our suppliers, we have an attractive net working capital dynamic which typically allows us to generate more cash than our Adjusted EBITDA on an annual basis. See the section titled "Management's Discussion and Analysis of Financial Condition and Results of Operations — Non-GAAP Financial Measures" on page 55 for more information and for a reconciliation of Adjusted EBITDA.
Our Industry
The home goods market is large and characterized by specific consumer trends, structural challenges and market dynamics that are shaping the future of our industry.
Addressable Market Size and Growth
Large and Growing Home Goods Market with Significant Online Potential: The home goods market is large, global and growing. Our addressable home goods market, which we define as the U.S. furniture and home décor markets, was $233 billion in 2013, according to Euromonitor International, Ltd., a market research firm. It also expects the U.S. home goods market to grow at a 2.5% CAGR in real terms from 2013 to 2023, reaching $297 billion in 2023. We believe the online penetration of the U.S. home goods market in 2013 was approximately 7%, significantly lower than other retail markets.
Mass Market for Home Goods is Large and Underserved: We believe the mass market for home goods represents the largest addressable opportunity within the home goods sector and that the mass market consumer is underserved due to structural limitations of brick and mortar and other online retailers.
Women Control an Outsized Share of Spending within the Household: In 2013, women represented 70% of our customers. According to a report released by the U.S. Census Bureau in 2013, there are 158 million women in the United States, of which 63 million are between the ages of 35 and 65. We believe these women control an outsized share of spending, particularly spending related to furniture, home furnishings, décor and goods.
Beneficial Effects of the Millennial Generation Aging and Maturing into the Home Category: We believe there are approximately 73 million millennials (which we define as individuals currently between the ages of 18 to 31) in the United States, many of whom are accustomed to purchasing goods online. As millennials age, start new families and move into new homes, we expect online sales of home goods to increase. In addition, we believe the online home goods market will further grow as older generations of consumers become increasingly comfortable purchasing online.
Mobile Commerce is Growing Rapidly and Only Just Beginning in Home Goods: The proliferation of smartphones and tablets has made mobile commerce one of the fastest growing online channels. Since consumers have access to their mobile devices virtually anytime and anywhere, they have the opportunity to browse, discover and shop throughout the day. From 2013 to 2018, mobile e-commerce as a percentage of overall e-commerce is projected to increase from 15% to 30%, according to eMarketer Inc., a market research firm.
3
Why Home is Different
Home is Shopped Differently than Other Retail Verticals: Homes are very personal expressions of self and identity, which is why many consumers seek uniqueness, crave originality and enjoy the feeling created by home design, furniture and décor. Consumers shopping for home goods often cannot articulate what they are looking for other than to describe a feeling or visual image that they want to capture in their home. In addition, while consumers typically know the names of big box and specialty retailers that offer various home products, we believe they rarely know the names of the product brands or suppliers. We believe traditional search-based sites that rely on directed product search (e.g., "running sneakers") or brand name search (e.g., "Samsung 32-inch LCD television") have difficulty serving customers shopping for home products in this more emotional, visual and inspirational manner.
Home Shoppers Desire Uniqueness, which Requires Vast Selection: In the mass market for home goods, consumers with different tastes, styles, purchasing goals and budgets require a broad selection of products and choices. This need for selection applies across many home categories, including furniture, décor, lighting, kitchen, bed & bath, outdoor, home improvement and baby & kids, each of which has dozens of sub-categories with hundreds to tens of thousands of products. Brick and mortar home goods retailers must balance a consumer's desire for uniqueness, which requires massive selection, with the challenges of high inventory carrying costs and limited showroom and storage space.
Time Consuming and Inconvenient for Consumers to Shop across Brick and Mortar Home Retailers: To browse a vast selection of products across highly-fragmented brick and mortar retailers, consumers must shop multiple stores. For example, if a nearby furniture retailer has 20 bedroom sets on its showroom floor, a consumer may feel she must visit multiple stores to see a wide enough selection to make an informed purchase decision that satisfies her style and budget needs. We believe the lack of an easy-to-browse, one-stop shopping experience with massive selection has led to dissatisfaction with brick and mortar home goods shopping. In contrast, Wayfair.com offers over 900 bedroom sets across many styles and prices, which mitigates the need for a consumer to visit multiple stores to find the perfect item at a price she can afford.
Difficult to Browse, Value Shop and Price Compare: Mass market home goods shoppers frequently seek a wide variety of information from disparate online and offline sources to research home goods products. Because this information is not easily comparable, it is difficult for consumers to make informed home décor and design-related decisions. In addition, consumers may struggle to mix and match different home goods items they are considering buying from multiple traditional brick and mortar retailers.
Challenging Logistics for Consumers and Retailers: Logistics, fulfillment and customer service for home goods products are challenging given the various categories, shapes, sizes, weights and price points in the home market. Given the personal nature and high touch physical characteristics of home goods products, many consumers seek first-rate customer service so they are not burdened with managing delivery, shipping and return logistics on their own. However, we believe big box retailers that serve the mass market for home goods are often unable or unwilling to provide this level of service. In addition, many regional retailers do not ship nationally, which we believe is because they lack the required scalable technology, operations and distribution infrastructure.
4
Our Solution
Key Benefits for Our Customers
We offer our consumers vast selection, easy access and value, inspirational content, personalized and mobile shopping experiences and superior customer service to help them find the perfect item at a price they can afford.
Broad Selection and Choice: We offer one of the largest online selections of furniture, home furnishings, décor and goods with over seven million products from over 7,000 suppliers.
Easy Access and Value: We offer consumers a one-stop shop with home goods pricing designed to be on par with big box retailers and a merchandising experience designed to be on par with specialty retailers.
Inspirational Photography and Editorial Content: To inspire customers, we produce beautiful imagery and highly-tailored editorial content both in house and through third parties.
Personalized and Mobile Shopping Experiences: We use personalization, based on past browsing, shopping patterns and personal preferences, to create a more engaging consumer experience. Our investment in mobile allows us to deliver value, convenience and inspiration to consumers anytime and anywhere.
Superior Customer Service: Our customer service organization has over 440 representatives who help consumers navigate our sites, answer questions and help complete orders. This team helps us build trust with consumers, build our brand awareness, enhance our reputation and drive sales.
Key Benefits for Our Suppliers
Through our technology platform, we offer our suppliers a cost-effective channel, the ability to leverage our technological expertise, a real-time view of our demand and proven logistics capabilities to help sell their products.
Cost-Effective Access to Our Large Customer Base: We sell products from over 7,000 suppliers, many of which are small, family-run operations without well-known product brands and without easy retail access to a large customer base. We provide our suppliers with access to our customer base of 2.6 million active customers, enabling them to increase their sales and access the growing e-commerce market.
Ability to Leverage Our Technological Expertise to Drive Sales: Our technology platform is designed to allow suppliers to easily provide us with their full product selection. Through our technology platform, we believe many of our suppliers have increased their sales, which has strengthened their loyalty to us.
Real-Time View of Demand and Inventory Needs via Data and Analytics: We offer our suppliers a real-time view of our demand and inventory needs via powerful data and analytics.
Proven Logistics Capabilities: Our logistics infrastructure allows us to ship directly from our suppliers to our customers. This supplier direct fulfillment network is a key component of our custom-built and seamlessly integrated technology and operational platform.
5
Our Strengths
We believe we have achieved our market leading position through the following key strengths:
- •
- our large scale drives powerful network effects;
- •
- superior logistics infrastructure and supplier direct fulfillment network require minimal inventory and capital
expenditures;
- •
- trusted brand with rapidly growing awareness;
- •
- personalized shopping experiences and differentiated use of data, analytics and technology drive high customer repeat
rates;
- •
- powerful and custom-built technology platform;
- •
- well-positioned to benefit from platform shift to mobile; and
- •
- proven and operationally disciplined management team.
Our Growth Strategy
Our goal is to further improve our leadership in the home goods market by pursuing the following key strategies:
- •
- continue building leading retail home brands;
- •
- acquire more customers;
- •
- continue to invest in the consumer experience;
- •
- increase repeat purchasing through merchandising, data, analytics and technology;
- •
- add new suppliers and deepen relationships with our existing suppliers;
- •
- continue to invest in our technology and operational platform, including our mobile platform;
- •
- expand internationally; and
- •
- opportunistically pursue strategic acquisitions.
Risk Factors
Our business is subject to numerous risks and uncertainties. Please carefully read "Risk Factors" beginning on page 14 and "Special Note Regarding Forward-Looking Statements" on page 42 for a more detailed explanation of the risks and uncertainties before investing in our Class A common stock. For example, any of the following risks may negatively affect our competitiveness or growth strategy, which could cause the price of our Class A common stock to decline and result in a loss of a part or all of your investment:
- •
- Our recent growth rates may not be sustainable or indicative of our future growth.
- •
- If we fail to manage our growth effectively, our business, financial condition and operating results could be harmed.
- •
- If we fail to acquire new customers, or fail to do so in a cost-effective manner, we may not be able to increase net
revenue per active customer or achieve profitability.
- •
- Our success depends in part on our ability to increase our net revenue per active customer. If our efforts to increase customer loyalty and repeat purchasing as well as maintain high levels of customer engagement and average order values of our customers are not successful, our growth prospects and revenue will be materially adversely affected.
6
- •
- Our business depends on our ability to build and maintain strong brands. We may not be able to maintain and enhance our
existing brands if we receive unfavorable customer complaints, negative publicity or otherwise fail to live up to consumers' expectations, which could materially adversely affect our business, results
of operations and growth prospects.
- •
- Our efforts to launch new brands and expand our existing brand portfolio internationally may not be successful.
- •
- Expansion of our international operations will require management attention and resources, involves additional risks, and
may be unsuccessful, which could harm our future business development and existing domestic operations.
- •
- We have a history of losses, and we have accumulated $277.1 million in common members' deficit as of
June 30, 2014. We expect to have increasing operating losses and negative cash flow as we continue to expand our business.
- •
- System interruptions that impair customer access to our sites or other performance failures in our technology
infrastructure could damage our business, reputation and brand and substantially harm our business and results of operations.
- •
- Our business is highly competitive. Competition presents an ongoing threat to the success of our
business.
- •
- The dual class structure of our common stock and the existing ownership of capital stock by our executive officers, directors and their affiliates have the effect of concentrating voting control with our executive officers, directors and their affiliates for the foreseeable future, which will limit your ability to influence corporate matters. Following this offering, our co-founders will own shares representing approximately 49.8% of the economic interest and 56.6% of the voting power of our outstanding capital stock, and, together with our other executive officers, directors and their affiliates, will own shares representing approximately 76.3% of the economic interest and 86.7% of the voting power of our outstanding capital stock.
Company Information and Reorganization
We began operating as Smart Tech Toys, Inc., a Massachusetts corporation, in May 2002 and changed our name to CSN Stores, Inc. in February 2003. In March 2008, we formed, and contributed all of the assets and liabilities of CSN Stores, Inc. to, a subsidiary, CSN Stores LLC, and we continued operating our business through this Delaware limited liability company. In late 2011, we changed the name of CSN Stores, Inc. to SK Retail, Inc. and changed our name from CSN Stores LLC to Wayfair LLC. Prior to the completion of this offering, we intend to complete an internal restructuring, which we refer to in this prospectus as the Corporate Reorganization. The proposed structure of the Corporate Reorganization is described in the section titled "Organizational Structure." Following the Corporate Reorganization, (i) Wayfair Inc. would be a holding company with no material assets other than 100% of the equity interests in Wayfair LLC and (ii) the holders of equity interests in Wayfair LLC would become stockholders of Wayfair Inc. Prior to the Corporate Reorganization, Wayfair Inc. will not have conducted any activities other than in connection with its formation and in preparation for this offering. Accordingly, our consolidated financial statements and other financial information included in this prospectus as of dates and for periods prior to the date of the Corporate Reorganization reflect the results of operations and financial position of Wayfair LLC. Our consolidated financial information, if any, as of dates and for periods from and after the date of the Corporate Reorganization reflect the results of operations and financial condition of Wayfair Inc. and its wholly-owned subsidiary, Wayfair LLC, unless otherwise expressly stated.
7
While our outstanding equity as a limited liability company prior to the Corporate Reorganization is called "common units," "incentive units" and "preferred units," we refer to such common units and incentive units as common stock and to the preferred units as preferred stock for the periods prior to the Corporate Reorganization for ease of comparison, except in the sections titled "Prospectus Summary — Summary Consolidated Financial Data," "Organizational Structure," "Selected Consolidated Financial Data," "Management's Discussion and Analysis of Financial Condition and Results of Operations," the audited financial statements included elsewhere in this prospectus and where otherwise indicated in this prospectus. For the same reason, we also refer to our "restricted unit bonus awards" and "restricted unit purchase right awards" under our Wayfair LLC second amended and restated 2010 incentive plan, or 2010 Plan, as restricted common stock and to our "deferred units" under our 2010 Plan as our restricted stock units.
Our executive offices are located at 4 Copley Place, 7th Floor, Boston, MA 02116, and our telephone number is (617) 532-6100. Our corporate website address is Wayfair.com. The information contained in, or accessible through, our website does not constitute part of this prospectus, and investors should not rely on any such information in deciding whether to purchase our Class A common stock.
We are an "emerging growth company," as defined in the Jumpstart Our Business Startups Act of 2012. We will remain an emerging growth company until the earlier of (1) the last day of the fiscal year (a) following the fifth anniversary of the completion of this offering, (b) in which we have total annual gross revenue of at least $1.0 billion, or (c) in which we become a large accelerated filer, which means that we have been public for at least 12 months, have filed at least one annual report and the market value of our common stock that is held by non-affiliates exceeds $700 million as of the last day of our then most recently completed second fiscal quarter, and (2) the date on which we have issued more than $1.0 billion in non-convertible debt during the prior three-year period. We refer to the Jumpstart Our Business Startups Act of 2012 herein as the "JOBS Act," and references herein to "emerging growth company" shall have the meaning associated with such term in the JOBS Act.
8
Issuer |
Wayfair Inc. | |
Class A common stock we are offering |
10,500,000 shares |
|
Class A common stock the selling stockholders are offering |
500,000 shares |
|
Class A common stock to be outstanding after the offering |
11,000,000 shares |
|
Class B common stock to be outstanding after the offering |
71,756,943 shares |
|
Total Class A common stock and Class B common stock to be outstanding after the offering |
82,756,943 shares |
|
Option to purchase additional shares of Class A common stock |
1,650,000 shares being offered by the selling stockholders |
|
Voting Rights |
We have two classes of authorized common stock: Class A common stock and Class B common stock. The rights of the holders of Class A common stock and Class B common stock are identical, except with respect to voting and conversion rights. Each share of Class A common stock is entitled to one vote per share, and each share of Class B common stock is entitled to ten votes per share. The Class B common stock also has approval rights over certain corporate actions. Following the completion of this offering, each share of Class B common stock may be converted into one share of Class A common stock at the option of its holder and will be automatically converted into one share of Class A common stock upon transfer thereof, subject to certain exceptions. In addition, upon the date on which the outstanding shares of Class B common stock represent less than 10% of the aggregate number of shares of the then outstanding Class A common stock and Class B common stock, or in the event of the affirmative vote or written consent of holders of at least 662/3% of the outstanding shares of Class B common stock, all outstanding shares of Class B common stock shall convert automatically into Class A common stock. Please read the section titled "Description of Capital Stock" for additional information. |
9
Use of Proceeds |
We expect to distribute a portion of the net proceeds to our existing Series A preferred stockholders upon conversion to common stock in connection with the completion of this offering to satisfy the remaining portion of an accrued cash dividend, which amount was approximately $20.9 million as of June 30, 2014, or approximately 8.1% of the net proceeds, based on the midpoint of the range set forth on the cover page of this prospectus. Our co-founders and certain of our directors, executive officers and holders of more than 5% of our voting securities hold 85% of our outstanding shares of Series A preferred stock and, as a result of their ownership, will receive 85% of the dividend payment, or approximately $17.8 million as of June 30, 2014. We also expect to distribute a portion of the net proceeds to satisfy minimum statutory tax withholding and remittance obligations related to the settlement of outstanding restricted stock units upon the completion of this offering, which amount was approximately $14.0 million as of June 30, 2014. We intend to use the remaining net proceeds to us from this offering for working capital and other general corporate purposes. We may also use a portion of the net proceeds for the acquisition of, or investment in, technologies, solutions or businesses that complement our business. We will not receive any proceeds from the sale of shares by the selling stockholders. Please read the section titled "Use of Proceeds" for additional information. |
|
Risk Factors |
Please read the section titled "Risk Factors" beginning on page 14 and other information included in this prospectus for a discussion of factors you should consider before deciding to invest in our Class A common stock. |
|
Proposed New York Stock Exchange symbol |
"W" |
Unless otherwise indicated, this prospectus reflects and assumes the following:
- •
- the consummation of the Corporate Reorganization described in the section titled "Organizational Structure" prior to the
completion of this offering;
- •
- the reclassification of our common stock and the conversion of all outstanding shares of our preferred stock held by the selling stockholders into shares of our Class B common stock, which will occur prior to the completion of this offering;
10
- •
- the automatic conversion of all other outstanding shares of our preferred stock into shares of our Class B common
stock, which will occur immediately upon the completion of this offering;
- •
- the net issuance of 925,949 shares of Class B common stock upon the vesting of outstanding restricted stock units
in connection with this offering;
- •
- the filing and effectiveness of our restated certificate of incorporation and the adoption of our amended and restated
bylaws, each of which will occur immediately prior to the completion of this offering; and
- •
- no exercise by the underwriters of their option to purchase additional shares of Class A common stock.
The number of shares of our Class A common stock and Class B common stock to be outstanding after this offering is based on no shares of Class A common stock and shares of Class B common stock outstanding as of June 30, 2014 and excludes:
- •
- 646,413 shares of Class B common stock issuable upon exercise of options to purchase common stock
outstanding as of June 30, 2014 under our 2010 Plan at a weighted-average exercise price of $2.98 per share;
- •
- 4,630,834 shares of Class B common stock issuable from restricted stock units outstanding as of
June 30, 2014 under our 2010 Plan; and
- •
- 8,603,066 shares of Class A common stock, subject to increase on an annual basis, reserved for future issuance under our 2014 Incentive Award Plan, or our 2014 Plan, which will become effective prior to the completion of this offering.
11
Summary Consolidated Financial Data
The following tables set forth a summary of our historical financial data as of, and for the period ended on, the dates indicated. The statement of operations data for the years ended December 31, 2012 and 2013 are derived from the audited financial statements of Wayfair LLC included elsewhere in this prospectus. The statement of operations data for the six months ended June 30, 2013 and 2014 are derived from the unaudited financial statements of Wayfair LLC included elsewhere in this prospectus. The statement of operations data for the year ended December 31, 2011 are derived from the unaudited financial statements of Wayfair LLC not included elsewhere in this prospectus. You should read this data together with the audited financial statements and related notes appearing elsewhere in this prospectus and the information in the sections titled "Selected Financial Data" and "Management's Discussion and Analysis of Financial Condition and Results of Operations." The historical results are not necessarily indicative of our future results.
| |
Years ended December 31, | Six months ended June 30, |
||||||||||||||
|---|---|---|---|---|---|---|---|---|---|---|---|---|---|---|---|---|
| |
2011
|
2012
|
2013
|
2013
|
2014
|
|||||||||||
| |
(in thousands, except share and per share data) |
|||||||||||||||
Consolidated Statements of Operations: |
||||||||||||||||
Net revenue |
$ | 517,336 | $ | 601,028 | $ | 915,843 | $ | 383,208 | $ | 574,144 | ||||||
Cost of goods sold |
385,824 | 455,879 | 691,602 | 288,337 | 440,483 | |||||||||||
| | | | | | | | | | | | | | | | | |
Gross profit |
131,512 | 145,149 | 224,241 | 94,871 | 133,661 | |||||||||||
Operating expenses: |
||||||||||||||||
Sales and marketing |
106,794 | 113,370 | 177,475 | 72,714 | 138,228 | |||||||||||
General and administrative |
36,772 | 52,961 | 62,246 | 30,014 | 46,355 | |||||||||||
Amortization of acquired intangible assets |
— | 212 | 539 | 106 | 499 | |||||||||||
| | | | | | | | | | | | | | | | | |
Total operating expenses |
143,566 | 166,543 | 240,260 | 102,834 | 185,082 | |||||||||||
| | | | | | | | | | | | | | | | | |
Loss from operations |
(12,054 | ) | (21,394 | ) | (16,019 | ) | (7,963 | ) | (51,421 | ) | ||||||
Interest income, net |
157 | 234 | 245 | 124 | 133 | |||||||||||
Gain on joint venture acquisition |
1,425 | — | — | — | — | |||||||||||
Other (expense) income, net |
(675 | ) | 155 | 294 | (504 | ) | (96 | ) | ||||||||
| | | | | | | | | | | | | | | | | |
Loss before income taxes |
(11,147 | ) | (21,005 | ) | (15,480 | ) | (8,343 | ) | (51,384 | ) | ||||||
Provision for income taxes |
(22 | ) | (50 | ) | (46 | ) | 5 | (17 | ) | |||||||
| | | | | | | | | | | | | | | | | |
Net loss |
$ | (11,169 | ) | $ | (21,055 | ) | $ | (15,526 | ) | $ | (8,338 | ) | $ | (51,401 | ) | |
Accretion of convertible redeemable preferred units |
(9,337 | ) | (12,154 | ) | (25,388 | ) | (15,948 | ) | (11,755 | ) | ||||||
| | | | | | | | | | | | | | | | | |
Net loss attributable to common unit holders |
(20,506 | ) | (33,209 | ) | (40,914 | ) | (24,286 | ) | (63,156 | ) | ||||||
Net loss attributable to common unit holders per unit — basic and diluted(1) |
$ |
(0.50 |
) |
$ |
(0.80 |
) |
$ |
(0.99 |
) |
$ |
(0.59 |
) |
$ |
(1.55 |
) |
|
| | | | | | | | | | | | | | | | | |
| | | | | | | | | | | | | | | | | |
Weighted average number of common units outstanding used in computing per unit amounts — basic and diluted(1) |
41,271,992 | 41,271,992 | 41,331,546 | 41,271,992 | 40,828,976 | |||||||||||
| | | | | | | | | | | | | | | | | |
| | | | | | | | | | | | | | | | | |
Pro forma net loss per share — basic and diluted (unaudited)(1) |
$ | (0.87 | ) | $ | (0.89 | ) | ||||||||||
| | | | | | | | | | | | | | | | | |
| | | | | | | | | | | | | | | | | |
Pro forma weighted average number of common shares outstanding (unaudited)(1) |
66,399,733 | 70,416,261 | ||||||||||||||
| | | | | | | | | | | | | | | | | |
| | | | | | | | | | | | | | | | | |
- (1)
- See Note 15 to our consolidated financial statements for an explanation of the calculations of our basic and diluted net loss per share of common stock, and pro forma net loss per share of common stock.
12
| |
June 30, 2014 | |||||||||
|---|---|---|---|---|---|---|---|---|---|---|
| |
Actual
|
Pro Forma(1)
|
Pro Forma as Adjusted(2)
|
|||||||
| |
(in thousands) |
|||||||||
Consolidated Balance Sheet Data: |
||||||||||
Cash and cash equivalents and short-term investments |
$ | 152,798 | $ | 117,902 | $ | 376,207 | ||||
Working capital |
68,706 | 33,810 | 292,115 | |||||||
Total assets |
277,018 | 242,122 | 500,427 | |||||||
Deferred revenue |
18,033 | 18,033 | 18,033 | |||||||
Convertible redeemable preferred units |
392,715 | — | — | |||||||
Total member's (deficit)/stockholders' equity |
$ | (277,455 | ) | $ | 80,058 | $ | 338,363 | |||
- (1)
- The
pro forma column reflects (i) the consummation of the proposed Corporate Reorganization described in the section titled "Organizational
Structure," including a net adjustment of $0.3 million to accumulated (deficit)/retained earnings in connection with deferred income tax liabilities assumed to be recognized in connection with
the Corporate Reorganization, all presented as if these events had occurred as of June 30, 2014, (ii) the reclassification of all outstanding shares of common stock and the conversion of
all outstanding shares of preferred stock held by selling stockholders into shares of Class B common stock prior to the completion of this offering, (iii) the automatic conversion of all
other outstanding shares of our preferred stock into shares of our Class B common stock, which will occur immediately upon the completion of this offering, (iv) an adjustment of
$13.3 million to reduce the carrying value of the convertible redeemable preferred units to reflect conversion value assuming the security was converted on the balance sheet date,
(v) the distribution of accrued dividend amounts payable to certain holders of our Series A convertible redeemable preferred units upon conversion to shares of Class B common
stock equal to the members' distribution payable balance on our consolidated financial statements as of the completion of this offering, which amount was $20.9 million as of June 30,
2014, (vi) the equity compensation expense of $40.3 million associated with the common option units, deferred units and restricted common units that have satisfied the service condition
as of June 30, 2014, (vii) the reclassification of $1.5 million from due to related party to accrued expenses to reflect the effect of consolidation of SK Retail and
(viii) the net issuance of 925,949 shares of Class B common stock issuable upon the vesting of outstanding deferred units in connection with this offering, net of minimum tax withholding
obligations and the associated payment of cash, which amount was approximately $14.0 million as of June 30, 2014.
- (2)
- The pro forma as adjusted column gives effect to the pro forma adjustments set forth above and the receipt of $258.3 million in proceeds from the sale and issuance by us of 10,500,000 shares of Class A common stock in this offering, based on the initial public offering price of $26.50 per share, the midpoint of the range listed on the cover page of this prospectus, after deducting the estimated underwriting discount and estimated offering expenses payable by us.
13
Investing in our Class A common stock involves a high degree of risk. Before you invest, you should carefully consider the following risks, as well as general economic and business risks and all of the other information contained in this prospectus. Any of the following risks could have a material adverse effect on our business, operating results and financial condition and cause the trading price of our Class A common stock to decline, which could cause you to lose all or part of your investment. When determining whether to invest, you should also refer to the other information contained in this prospectus, including the section titled "Special Note Regarding Forward-Looking Statements" and our financial statements and the related notes thereto.
Risks Related to Our Business and Industry
Our recent growth rates may not be sustainable or indicative of our future growth.
In late 2011, we closed and permanently redirected over 240 of our niche websites into Wayfair.com. Additionally, we launched Joss & Main. In 2013, we acquired DwellStudio, and in 2014, we launched Birch Lane. Because we launched most of our brands recently, we have a limited amount of information regarding the purchasing patterns of our customers on these websites. We depend heavily on this information to plan and forecast our business, including anticipated customer acquisition costs, net revenue per active customer and other key performance metrics. If our assumptions prove to be wrong, we may spend more than we anticipate to acquire and retain customers or may generate less net revenue per active customer than anticipated, any of which could have a negative impact on our business and results of operations. In addition, our historical growth rates may not be sustainable or indicative of future growth.
We believe that our continued revenue growth will depend upon, among other factors, our ability to:
- •
- build our brands and launch new brands;
- •
- acquire more customers;
- •
- develop new features to enhance the consumer experience on our websites, mobile-optimized websites and mobile
applications, which we collectively refer to as our sites;
- •
- increase the frequency with which new and repeat customers purchase products on our sites through merchandising, data,
analytics and technology;
- •
- add new suppliers and deepen our relationships with our existing suppliers;
- •
- enhance the systems our consumers use to interact with our sites and invest in our infrastructure platform;
- •
- expand internationally; and
- •
- pursue strategic acquisitions.
We cannot assure you we will be able to achieve any of the foregoing. Our customer base may not continue to grow or may decline as a result of increased competition and the maturation of our business. Failure to continue our revenue growth rates could have a material adverse effect on our financial condition and results of operations. You should not rely on our historical rate of revenue growth as an indication of our future performance.
14
If we fail to manage our growth effectively, our business, financial condition and operating results could be harmed.
To manage our growth effectively, we must continue to implement our operational plans and strategies, improve and expand our infrastructure of people and information systems and expand, train and manage our employee base. We have rapidly increased employee headcount since our inception to support the growth in our business, and we intend for this growth to continue for the foreseeable future. The number of our employees increased from 1,169 full-time equivalents as of December 31, 2012 to 1,558 full-time equivalents as of December 31, 2013, and we expect to add a significant number of employees in 2014. To support continued growth, we must effectively integrate, develop and motivate a large number of new employees. We face significant competition for personnel, particularly in the Boston, Massachusetts area where our headquarters are located. Failure to manage our hiring needs effectively or successfully integrate our new hires may have a material adverse effect on our business, financial condition and operating results.
Additionally, the growth of our business places significant demands on our management and other employees. For example in 2013, we launched hundreds of promotional events across thousands of products each month on Wayfair.com, in addition to hundreds of promotional events — or "Daily Events" — on Joss & Main in which we promote thousands of products via emails, "push" notifications and personalized displays. These events require us to produce updates of our sites and emails to our customers on a daily basis with different products, photos and text. The growth of our business may require significant additional resources to meet these daily requirements, which may not scale in a cost-effective manner or may negatively affect the quality of our sites and customer experience. We are also required to manage relationships with a growing number of suppliers, customers and other third parties. For example, in 2013, we added over 800 new suppliers. Our information technology systems and our internal controls and procedures may not be adequate to support future growth of our supplier base. If we are unable to manage the growth of our organization effectively, our business, financial condition and operating results may be materially adversely affected.
If we fail to acquire new customers, or fail to do so in a cost-effective manner, we may not be able to increase net revenue per active customer or achieve profitability.
Our success depends on our ability to acquire customers in a cost-effective manner. In order to expand our customer base, we must appeal to and acquire customers who have historically used other means of commerce to purchase home goods and may prefer alternatives to our offerings, such as traditional brick and mortar retailers, the websites of our competitors or a supplier's own website. We have made significant investments related to customer acquisition and expect to continue to spend significant amounts to acquire additional customers. For example, we have recently expanded our national U.S. television branding and advertising campaigns. Such campaigns are expensive and may not result in the cost-effective acquisition of customers. We cannot assure you that the net profit from new customers we acquire will ultimately exceed the cost of acquiring those customers. If we fail to deliver a quality shopping experience, or if consumers do not perceive the products we offer to be of high value and quality, we may not be able to acquire new customers. If we are unable to acquire new customers who purchase products in numbers sufficient to grow our business, we may not be able to generate the scale necessary to drive beneficial network effects with our suppliers, our net revenue may decrease, and our business, financial condition and operating results may be materially adversely affected.
We believe that many of our new customers originate from word-of-mouth and other non-paid referrals from existing customers. Therefore we must ensure that our existing customers remain loyal to us in order to continue receiving those referrals. If our efforts to satisfy our existing customers are not successful, we may not be able to acquire new customers in sufficient numbers
15
to continue to grow our business, or we may be required to incur significantly higher marketing expenses in order to acquire new customers.
We also utilize paid and non-paid advertising. Our paid advertising includes search engine marketing, display advertising, paid social media and television advertisements. Our non-paid advertising efforts include search engine optimization, non-paid social media, mobile "push" notifications and email. We obtain a significant amount of traffic via search engines and, therefore, rely on search engines such as Google, Bing and Yahoo!. Search engines frequently update and change the logic that determines the placement and display of results of a user's search, such that the purchased or algorithmic placement of links to our sites can be negatively affected. Moreover, a search engine could, for competitive or other purposes, alter its search algorithms or results, causing our sites to place lower in search query results. A major search engine could change its algorithms in a manner that negatively affects our paid or non-paid search ranking, and competitive dynamics could impact the effectiveness of search engine marketing or search engine optimization. We also obtain a significant amount of traffic via social networking websites or other channels used by our current and prospective customers. As e-commerce and social networking continue to rapidly evolve, we must continue to establish relationships with these channels and may be unable to develop or maintain these relationships on acceptable terms. If we are unable to cost-effectively drive traffic to our sites, our ability to acquire new customers and our financial condition would suffer.
Our success depends in part on our ability to increase our net revenue per active customer. If our efforts to increase customer loyalty and repeat purchasing as well as maintain high levels of customer engagement and average order values of our customers are not successful, our growth prospects and revenue will be materially adversely affected.
Our ability to grow our business depends on our ability to retain our existing customer base and generate increased revenue and repeat purchases from this customer base, and maintain high levels of customer engagement. To do this, we must continue to provide our customers and potential customers with a unified, convenient, efficient and differentiated shopping experience by:
- •
- providing imagery, tools and technology that attract customers who historically would have bought elsewhere;
- •
- maintaining a high-quality and diverse portfolio of products;
- •
- managing over 7,000 suppliers to deliver products on time and without damage; and
- •
- continuing to invest in our mobile platforms.
If we fail to increase net revenue per active customer, generate repeat purchases or maintain high levels of customer engagement and average order value, our growth prospects, operating results and financial condition could be materially adversely affected.
Our business depends on our ability to build and maintain strong brands. We may not be able to maintain and enhance our existing brands if we receive unfavorable customer complaints, negative publicity or otherwise fail to live up to consumers' expectations, which could materially adversely affect our business, results of operations and growth prospects.
We currently offer five distinct brands to our customers, but we have a limited operating history with most of these brands. Maintaining and enhancing these brands are critical to expanding our base of customers and suppliers. However, a significant portion of our customers' brand experience depends on third parties outside of our control, including suppliers and logistics providers such as FedEx, UPS and the U.S. Postal Service. If these third parties do not meet our or our customers' expectations, our brand may suffer irreparable damage. In addition, maintaining and
16
enhancing these brands may require us to make substantial investments, and these investments may not be successful. If we fail to promote and maintain our brands, or if we incur excessive expenses in this effort, our business, operating results and financial condition may be materially adversely affected. We anticipate that, as our market becomes increasingly competitive, maintaining and enhancing our brands may become increasingly difficult and expensive. Maintaining and enhancing our brands will depend largely on our ability to provide high quality products to our customers and a reliable, trustworthy and profitable sales channel to our suppliers, which we may not do successfully.
Customer complaints or negative publicity about our sites, products, product delivery times, customer data handling and security practices or customer support, especially on blogs, social media websites and our sites, could rapidly and severely diminish consumer use of our sites and consumer and supplier confidence in us and result in harm to our brands.
Our efforts to launch new brands and expand our existing brand portfolio internationally may not be successful.
Our business success depends to some extent on our ability to expand our customer offerings by launching new brands and expanding our existing brand portfolio into new geographies. For example, we recently launched Birch Lane in the United States and Canada and we recently launched our Joss & Main brand in the United Kingdom, France and Germany. Launching new brands or expanding our existing brand portfolio internationally requires significant upfront investments, including investments in marketing, information technology and additional personnel. Expanding our brands internationally is particularly challenging because it requires us to gain country-specific knowledge about consumers and regional competitors, construct home goods catalogs specific to the country, build local logistics capabilities and customize portions of our technology for local markets. We may not be able to generate satisfactory revenue from these efforts to offset these upfront costs. Any lack of market acceptance of our efforts to launch new brands or expand our existing brand portfolio could have a material adverse effect on our business, prospects, financial condition and results of operations.
Expansion of our international operations will require management attention and resources, involves additional risks, and may be unsuccessful, which could harm our future business development and existing domestic operations.
We believe international expansion represents a significant growth opportunity for us. Today, we deliver products to customers in a number of countries, including the United States, the United Kingdom, Canada, Australia, Germany, France, Austria, Ireland and New Zealand. We plan to expand into other international markets in order to grow our business, which will require significant management attention and resources. For example, we have made and will continue to make significant investments in information technology, logistics, supplier relationships, merchandising and marketing in the foreign jurisdictions in which we operate or plan to operate. We have limited experience in selling our products to conform to different local cultures, standards and regulations, and the products we offer may not appeal to customers in the same manner, if at all, in other geographies. We may have to compete with local companies which understand the local market better than we do and/or may have greater brand recognition than we do. In addition, to deliver satisfactory performance for customers in international locations, it may be necessary to locate physical facilities, such as consolidation centers, in foreign markets, and we may have to invest in these facilities before we can determine whether or not our foreign operations are successful. We have limited experience establishing such facilities internationally. We may not be successful in expanding into additional international markets or in generating net revenue from foreign operations. Furthermore, different privacy, censorship, liability, intellectual property and other laws
17
and regulations in foreign countries may cause our business, financial condition and operating results to be materially adversely affected.
Our future results could be materially adversely affected by a number of factors inherent in international operations, including:
- •
- localization of our product offerings, including translation into foreign languages and adaptation for local practices;
- •
- the need to vary our practices in ways with which we have limited or no experience or which are less profitable or carry
more risk to us;
- •
- unexpected changes in regulatory requirements, taxes, trade laws, tariffs, export quotas, custom duties or other trade
restrictions;
- •
- differing labor regulations where labor laws may be more advantageous to employees as compared to the United States;
- •
- more stringent regulations relating to data privacy and security, including the use of commercial and personal
information, particularly in the European Union;
- •
- changes in a specific country's or region's political or economic conditions;
- •
- the rising cost of labor in the foreign countries in which our suppliers operate, resulting in increases in our costs of
doing business internationally;
- •
- challenges inherent in efficiently managing an increased number of employees over large geographic distances, including
the need to implement appropriate systems, policies, benefits and compliance programs and maintain our corporate culture across geographies;
- •
- risks resulting from changes in currency exchange rates;
- •
- limitations on our ability to reinvest earnings from operations in one country to fund the capital needs of our operations
in other countries;
- •
- different or lesser intellectual property protection;
- •
- exposure to liabilities under anti-corruption and anti-money laundering laws, including the U.S. Foreign Corrupt Practices
Act and similar laws and regulations in other jurisdictions;
- •
- import/export controls; and
- •
- logistics and sourcing.
Operating internationally requires significant management attention and financial resources. We cannot be certain that the investment and additional resources required to establish and expand our international operations will produce desired levels of net revenue or profitability. If we invest substantial time and resources to establish and expand our international operations and are unable to do so successfully and in a timely manner, our business, financial condition and operating results may be materially adversely affected.
We have a history of losses and expect to have increasing operating losses and negative cash flow as we continue to expand our business.
We have a history of losses, and we have accumulated $277.1 million in common members' deficit as of June 30, 2014. We expect our operating losses and negative cash flow to increase significantly in the near-term as we increase investment in our business. Because the market for purchasing home goods online is rapidly evolving and has not yet reached widespread adoption, it is difficult for us to predict our future operating results. As a result, our losses may be larger than
18
anticipated, and we may never achieve profitability. We expect our operating expenses to increase over the next several years as we increase our advertising budget, hire additional personnel and continue to develop features on our sites. In particular, we intend to continue to invest substantial resources in marketing to acquire new customers. In addition, as we grow as a newly public company, we have and will continue to incur additional significant legal, accounting and other expenses that we did not incur as a private company. Furthermore, if our future growth and operating performance fail to meet investor or analyst expectations, or if we have future negative cash flow or losses resulting from our investment in acquiring new customers, our financial condition and stock price could be materially adversely affected.
System interruptions that impair customer access to our sites or other performance failures in our technology infrastructure could damage our business, reputation and brand and substantially harm our business and results of operations.
The satisfactory performance, reliability and availability of our sites, transaction processing systems and technology infrastructure are critical to our reputation and our ability to acquire and retain customers, as well as maintain adequate customer service levels.
We currently utilize two third-party data center hosting facilities. If the main facility where substantially all of our computer and communications hardware is located fails, or if we suffer an interruption or degradation of services at our main facility, we could lose customer data and miss order fulfillment deadlines, which could harm our business. Our systems and operations are vulnerable to damage or interruption from fire, flood, power loss, telecommunications failure, terrorist attacks, cyber-attacks, data loss, acts of war, break-ins, earthquake and similar events. In the event of a failure of our main facility, the failover to our back-up facility could take substantial time, during which time our sites could be completely shut down. Our back-up facility is designed to support transaction volume at a level slightly above our average daily sales, but is not adequate to support spikes in demand. The back-up facility may not process effectively during time of higher traffic to our sites and may process transactions more slowly and may not support all of our sites' functionality.
We use complex proprietary software in our technology infrastructure, which we seek to continually update and improve. We may not always be successful in executing these upgrades and improvements, and the operation of our systems may be subject to failure. In particular, we have in the past and may in the future experience slowdowns or interruptions in some or all of our sites when we are updating them, and new technologies or infrastructures may not be fully integrated with existing systems on a timely basis, or at all. Additionally, if we expand our use of third-party services, including cloud-based services, our technology infrastructure may be subject to increased risk of slowdown or interruption as a result of integration with such services and/or failures by such third-parties, which are out of our control. Our net revenue depends on the number of visitors who shop on our sites and the volume of orders we can handle. Unavailability of our sites or reduced order fulfillment performance would reduce the volume of goods sold and could also materially adversely affect consumer perception of our brand. We may experience periodic system interruptions from time to time. In addition, continued growth in our transaction volume, as well as surges in online traffic and orders associated with promotional activities or seasonal trends in our business, place additional demands on our technology platform and could cause or exacerbate slowdowns or interruptions. If there is a substantial increase in the volume of traffic on our sites or the number of orders placed by customers, we will be required to further expand and upgrade our technology, transaction processing systems and network infrastructure. There can be no assurance that we will be able to accurately project the rate or timing of increases, if any, in the use of our sites or expand and upgrade our systems and infrastructure to accommodate such increases on a timely basis. In order to remain competitive, we must continue to enhance and
19
improve the responsiveness, functionality and features of our sites, which is particularly challenging given the rapid rate at which new technologies, customer preferences and expectations and industry standards and practices are evolving in the e-commerce industry. Accordingly, we redesign and enhance various functions on our sites on a regular basis, and we may experience instability and performance issues as a result of these changes.
Any slowdown or failure of our sites and the underlying technology infrastructure could harm our business, reputation and our ability to acquire, retain and serve our customers, which could materially adversely affect our results of operations. Our disaster recovery plan may be inadequate, and our business interruption insurance may not be sufficient to compensate us for the losses that could occur.
Our business is highly competitive. Competition presents an ongoing threat to the success of our business.
Our business is rapidly evolving and intensely competitive, and we have many competitors in different industries. Our competition includes: furniture stores, big box retailers, department stores, specialty retailers, and online home goods retailers and marketplaces, including:
- •
- Furniture Stores: Ashley Furniture, Bob's Discount
Furniture, Havertys, Raymour & Flanagan and Rooms To Go;
- •
- Big Box Retailers: Bed, Bath & Beyond, Home Depot,
IKEA, Lowe's, Target and Walmart;
- •
- Department Stores: JCPenney and Macy's;
- •
- Specialty Retailers: Crate and Barrel, Ethan Allen,
HomeGoods, Pottery Barn and Restoration Hardware; and
- •
- Online Home Goods Retailers and Online Marketplaces: Amazon, eBay and One Kings Lane.
We expect competition in e-commerce generally to continue to increase. We believe that our ability to compete successfully depends upon many factors both within and beyond our control, including:
- •
- the size and composition of our customer base;
- •
- the number of suppliers and products we feature on our sites;
- •
- our selling and marketing efforts;
- •
- the quality, price and reliability of products offered either by us;
- •
- the convenience of the shopping experience that we provide;
- •
- our ability to distribute our products and manage our operations; and
- •
- our reputation and brand strength.
Many of our current competitors have, and potential competitors may have, longer operating histories, greater brand recognition, larger fulfillment infrastructures, greater technical capabilities, faster and less costly shipping, significantly greater financial, marketing and other resources and larger customer bases than we do. These factors may allow our competitors to derive greater net revenue and profits from their existing customer base, acquire customers at lower costs or respond more quickly than we can to new or emerging technologies and changes in consumer habits. These competitors may engage in more extensive research and development efforts, undertake more far-reaching marketing campaigns and adopt more aggressive pricing policies, which may
20
allow them to build larger customer bases or generate net revenue from their customer bases more effectively than we do.
Purchasers of home goods may not choose to shop online, which would prevent us from growing our business.
The online market for home goods in the United States is less developed than the online market for apparel, consumer electronics and other consumer products in the United States and, we believe, only accounts for approximately 7% of the market as a whole. If the online market for home goods does not gain acceptance, our business may suffer. Our success will depend, in part, on our ability to attract consumers who have historically purchased home goods through traditional retailers. Furthermore, we may have to incur significantly higher and more sustained advertising and promotional expenditures in order to attract additional online consumers to our sites and convert them into purchasing customers. Specific factors that could impact consumers' willingness to purchase home goods from us include:
- •
- concerns about buying products, and in particular larger products, without a physical storefront, face-to-face interaction
with sales personnel and the ability to physically examine products;
- •
- delivery time associated with online orders;
- •
- actual or perceived lack of security of online transactions and concerns regarding the privacy of personal information;
- •
- delayed shipments or shipments of incorrect or damaged products;
- •
- inconvenience associated with returning or exchanging items purchased online; and
- •
- usability, functionality and features of our sites.
If the shopping experience we provide does not appeal to consumers or meet the expectations of existing customers, we may not acquire new customers at rates consistent with historical periods, and existing customers' buying patterns and levels may be less than historical rates.
We may be subject to product liability claims if people or property are harmed by the products we sell.
Some of the products we sell or have manufactured for us may expose us to product liability claims and litigation or regulatory action relating to personal injury, death or environmental or property damage. Some of our agreements with our suppliers and international manufacturers may not indemnify us from product liability for a particular supplier's or international manufacturer's products, or our suppliers or international manufacturers may not have sufficient resources or insurance to satisfy their indemnity and defense obligations. Although we maintain liability insurance, we cannot be certain that our coverage will be adequate for liabilities actually incurred or that insurance will continue to be available to us on economically reasonable terms, or at all.
Risks associated with the suppliers from whom our products are sourced could materially adversely affect our financial performance as well as our reputation and brand.
We depend on our ability to provide our customers with a wide range of products from qualified suppliers in a timely and efficient manner. Political and economic instability, the financial stability of suppliers, suppliers' ability to meet our standards, labor problems experienced by suppliers, the availability of raw materials, merchandise quality issues, currency exchange rates,
21
transport availability and cost, transport security, inflation, and other factors relating to the suppliers are beyond our control.
Our agreements with most of our suppliers do not provide for the long-term availability of merchandise or the continuation of particular pricing practices, nor do they restrict such suppliers from selling products to other buyers. There can be no assurance that our current suppliers will continue to seek to sell us products on current terms or that we will be able to establish new or otherwise extend current supply relationships to ensure product acquisitions in a timely and efficient manner and on acceptable commercial terms. Our ability to develop and maintain relationships with reputable suppliers and offer high quality merchandise to our customers is critical to our success. If we are unable to develop and maintain relationships with suppliers that would allow us to offer a sufficient amount and variety of quality merchandise on acceptable commercial terms, our ability to satisfy our customers' needs, and therefore our long-term growth prospects, would be materially adversely affected.
We also are unable to predict whether any of the countries in which our suppliers' products are currently manufactured or may be manufactured in the future will be subject to trade restrictions imposed by the U.S. or foreign governments or the likelihood, type or effect of any such restrictions. Any event causing a disruption or delay of imports from suppliers with international manufacturing operations, including the imposition of additional import restrictions, restrictions on the transfer of funds or increased tariffs or quotas, could increase the cost or reduce the supply of merchandise available to our customers and materially adversely affect our financial performance as well as our reputation and brand. Furthermore, some or all of our suppliers' foreign operations may be adversely affected by political and financial instability, resulting in the disruption of trade from exporting countries, restrictions on the transfer of funds or other trade disruptions.
In addition, our business with foreign suppliers, particularly with respect to our international sites, may be affected by changes in the value of the U.S. dollar relative to other foreign currencies. For example, any movement by any other foreign currency against the U.S. dollar may result in higher costs to us for those goods. Declines in foreign currencies and currency exchange rates might negatively affect the profitability and business prospects of one or more of our foreign suppliers. This, in turn, might cause such foreign suppliers to demand higher prices for merchandise in their effort to offset any lost profits associated with any currency devaluation, delay merchandise shipments, or discontinue selling to us altogether, any of which could ultimately reduce our sales or increase our costs.
We may be unable to source additional or strengthen our relationships with suppliers.
As of December 31, 2013, we had relationships with over 7,000 suppliers. Our agreements with suppliers are generally terminable at will by either party upon short notice. If we do not maintain our existing relationships or build new relationships with suppliers on acceptable commercial terms, we may not be able to maintain a broad selection of merchandise, and our business and prospects would suffer severely.
In order to attract quality suppliers to our platform, we must:
- •
- demonstrate our ability to help our suppliers increase their sales;
- •
- offer suppliers a high quality, cost-effective fulfillment process; and
- •
- continue to provide suppliers a dynamic and real-time view of our demand and inventory needs via powerful data and analytics capabilities.
22
If we are unable to provide our suppliers with a compelling return on investment and an ability to increase their sales, we may be unable to maintain and/or expand our supplier network, which would negatively impact our business.
We depend on our suppliers to perform certain services regarding the products that we offer.
As part of offering our suppliers' products for sale on our sites, these suppliers generally agree to conduct a number of traditional retail operations with respect to their respective products, including maintaining inventory and preparing merchandise for shipment to our customers. We may be unable to ensure that these suppliers will continue to perform these services to our or our customers' satisfaction in a manner that provides our customer with a unified brand experience or on commercially reasonable terms. If our customers become dissatisfied with the services provided by our suppliers, our business, reputation and brands could suffer.
We depend on our relationships with other third parties, including our retail partners, and changes in our relationships with these parties could adversely impact our revenue and profits.
In 2013 and the six months ended June 30, 2014, approximately 26% and 18%, respectively, of our net revenue was generated from other operations, consisting primarily of revenue generated online by third parties, which we refer to as our retail partners. Our relationships with our retail partners allow consumers to purchase products offered by us though their websites and mobile applications. Because our agreements with our retail partners are generally terminable at will, we may be unable to maintain these relationships, and our results of operations could fluctuate significantly from period to period depending on the performance of our retail partners and their willingness to continue to offer and/or promote our products. Our agreements with our retail partners may also restrict our ability to market certain products, and not all of our suppliers may permit us to market through all of our retail partners' sites. Because some of our retail partners are competitors or potential competitors in the home goods market, some or all of our retail partners may in the future determine they no longer wish to do business with us or may decide to take other actions that could harm our business. We may also determine that we no longer want to do business with them. Because we do business with a small number of retail partners, if any one of our contracts with our retailer partners were to terminate, our revenue from our retail partners may decline and our relationships with our suppliers may be adversely affected.
Because we rely on FedEx, UPS and the U.S. Postal Service to deliver most of the small parcel products we offer on our sites, we are subject to shipping delays or disruptions caused by inclement weather, natural disasters, labor activism, health epidemics or bioterrorism. In addition, because we rely on national and regional major transportation companies for the delivery of some of our other products, we are also subject to risks of breakage or other damage during delivery by any of these third parties. We also use and rely on other services from third parties, such as our telecommunications services, and those services may be subject to outages and interruptions that are not within our control. For example, failures by our telecommunications providers have in the past and may in the future interrupt our ability to provide phone support to our customers. If these products are not delivered in a timely fashion or are damaged during the delivery process, or if we are not able to provide adequate customer support, our customers could become dissatisfied and cease buying products through our sites, which would adversely affect our operating results.
23
If our internal control over financial reporting or our disclosure controls and procedures are not effective, we may not be able to accurately report our financial results, prevent fraud or file our periodic reports in a timely manner, which may cause investors to lose confidence in our reported financial information and may lead to a decline in our stock price.
We have been a private company for 12 years and, as such, we have not had the internal control and financial reporting requirements that are required of a publicly-traded company. We are required to comply with the requirements of The Sarbanes-Oxley Act of 2002, or the Sarbanes-Oxley Act, following the later of the date we are deemed to be an "accelerated filer" or a "large accelerated filer," each as defined in the Securities Exchange Act of 1934, as amended, or the Exchange Act, or the date we are no longer an "emerging growth company," as defined in the JOBS Act, which could be as early as our first fiscal year beginning after the effective date of this offering. The Sarbanes-Oxley Act requires that we maintain effective internal control over financial reporting and disclosure controls and procedures. In particular, we must perform system and process evaluation, document our controls and perform testing of our key control over financial reporting to allow management and our independent public accounting firm to report on the effectiveness of our internal control over financial reporting, as required by Section 404 of the Sarbanes-Oxley Act. Our testing, or the subsequent testing by our independent public accounting firm, may reveal deficiencies in our internal control over financial reporting that are deemed to be material weaknesses. If we are not able to comply with the requirements of Section 404 in a timely manner, or if we or our accounting firm identify deficiencies in our internal control over financial reporting that are deemed to be material weaknesses, the market price of our stock would likely decline and we could be subject to lawsuits, sanctions or investigations by regulatory authorities, which would require additional financial and management resources.
We continue to invest in more robust technology and in more resources in order to manage those reporting requirements. Implementing any appropriate changes to our internal controls may distract our officers and employees, result in substantial costs if we implement new processes or modify our existing processes and require significant time to complete. For example, we plan to transition from our current accounting system to a new reporting system that is expected to integrate better with our other existing systems. Any difficulties or delays in implementing the system could impact our ability to timely report our financial results. In addition, we currently rely on a manual process in some areas which increases our exposure to human error or intervention in reporting our financial results. For these reasons, we may encounter difficulties in the timely and accurate reporting of our financial results, which would impact our ability to provide our investors with information in a timely manner. As a result, our investors could lose confidence in our reported financial information, and our stock price could decline.
In addition, any such changes do not guarantee that we will be effective in maintaining the adequacy of our internal controls, and any failure to maintain that adequacy could prevent us from accurately reporting our financial results.
We may be unable to accurately forecast net revenue and appropriately plan our expenses in the future.
Net revenue and operating results are difficult to forecast because they generally depend on the volume, timing and type of the orders we receive, all of which are uncertain. We base our expense levels and investment plans on our estimates of total net revenue and gross margins and have not historically relied on a formalized forecasting and budgeting process. In addition, we have been operating as five distinct brands for a short period of time, and we cannot be sure the same growth rates, trends and other key performance metrics are meaningful predictors of future growth. Our business is affected by general economic and business conditions in the United States, and we anticipate that it will be increasingly affected by conditions in international markets. In addition, we
24
experience seasonal trends in our business, and our mix of product offerings is highly variable from day-to-day and quarter-to-quarter. This variability makes it difficult to predict sales and could result in significant fluctuations in our net revenue from period-to-period. A significant portion of our expenses is fixed, and as a result, we may be unable to adjust our spending in a timely manner to compensate for any unexpected shortfall in net revenue. Any failure to accurately predict net revenue or gross margins could cause our operating results to be lower than expected, which could materially adversely affect our financial condition and stock price.
Our ability to raise capital in the future may be limited, and our failure to raise capital when needed could prevent us from growing.
In the future, we could be required to raise capital through public or private financing or other arrangements. Such financing may not be available on acceptable terms, or at all, and our failure to raise capital when needed could harm our business. We may sell Class A common stock, convertible securities and other equity securities in one or more transactions at prices and in a manner as we may determine from time to time. If we sell any such securities in subsequent transactions, investors may be materially diluted. New investors in such subsequent transactions could gain rights, preferences and privileges senior to those of holders of our Class A common stock. Debt financing, if available, may involve restrictive covenants and could reduce our operational flexibility or profitability. If we cannot raise funds on acceptable terms, we may not be able to grow our business or respond to competitive pressures.
Our business may be adversely affected if we are unable to provide our customers a cost-effective shopping platform that is able to respond and adapt to rapid changes in technology.
The number of people who access the Internet through devices other than personal computers, including mobile phones, smartphones, handheld computers such as notebooks and tablets, video game consoles, and television set-top devices, has increased dramatically in the past few years. The smaller screen size, functionality, and memory associated with some alternative devices may make the use of our sites and purchasing our products more difficult. The versions of our sites developed for these devices may not be compelling to consumers. In addition, it is time consuming and costly to keep pace with rapidly changing and continuously evolving technology. We launched our mobile applications for Joss & Main in 2012, and in 2014 we launched the Wayfair.com mobile application. In addition, all of our sites in North America and a majority of our international sites are mobile-optimized. In the first six months of 2014, 43.5% of Joss & Main orders delivered were placed from a mobile device, and 27.9% of our overall orders delivered were placed from a mobile device. However, we have only recently launched a mobile application for Wayfair.com and a majority of our mobile-optimized sites, and we cannot be certain that they will be successful.
As new mobile devices and platforms are released, it is difficult to predict the problems we may encounter in developing applications for alternative devices and platforms, and we may need to devote significant resources to the creation, support and maintenance of such applications. If we are unable to attract consumers to our websites through these devices or are slow to develop a version of our websites that is more compatible with alternative devices or a mobile application, we may fail to capture a significant share of consumers in the home goods market, which could adversely affect our business.
Further, we continually upgrade existing technologies and business applications, and we may be required to implement new technologies or business applications in the future. The implementation of upgrades and changes requires significant investments. Our results of operations may be affected by the timing, effectiveness and costs associated with the successful
25
implementation of any upgrades or changes to our systems and infrastructure. In the event that it is more difficult for our customers to buy products from us on their mobile devices, or if our customers choose not to buy products from us on their mobile devices or to use mobile products that do not offer access to our websites, our customer growth could be harmed and our business, financial condition and operating results may be materially adversely affected.
Significant merchandise returns could harm our business.
We allow our customers to return products, subject to our return policy. If merchandise returns are significant, our business, prospects, financial condition and results of operations could be harmed. Further, we modify our policies relating to returns from time to time, which may result in customer dissatisfaction or an increase in the number of product returns. Many of our products are large and require special handling and delivery. From time to time our products are damaged in transit, which can increase return rates and harm our brand.
Uncertainties in global economic conditions and their impact on consumer spending patterns, particularly in the home goods segment, could adversely impact our operating results.
Consumers may view a substantial portion of the products we offer as discretionary items rather than necessities. As a result, our results of operations are sensitive to changes in macro-economic conditions that impact consumer spending, including discretionary spending. Some of the factors adversely affecting consumer spending include levels of unemployment, consumer debt levels, changes in net worth based on market changes and uncertainty, home foreclosures and changes in home values, fluctuating interest rates, credit availability, government actions, fluctuating fuel and other energy costs, fluctuating commodity prices and general uncertainty regarding the overall future economic environment. Consumer purchases of discretionary items, including our merchandise, generally decline during periods when disposable income is adversely affected or there is economic uncertainty. Adverse economic changes in any of the regions in which we sell our products could reduce consumer confidence and could negatively affect net revenue and have a material adverse effect on our operating results.
Our business relies heavily on email and other messaging services, and any restrictions on the sending of emails or messages or an inability to timely deliver such communications could materially adversely affect our net revenue and business.
Our business is highly dependent upon email and other messaging services for promoting our sites and products. Daily promotions offered through emails and other messages sent by us, or on our behalf by our vendors, generate a significant portion of our revenue. We provide daily emails and "push" communications to customers and other visitors informing them of what is available for purchase on our sites that day, and we believe these messages are an important part of our customer experience and help generate a substantial portion of our net revenue. If we are unable to successfully deliver emails or other messages to our subscribers, or if subscribers decline to open our emails or other messages, our net revenue and profitability would be materially adversely affected. Changes in how webmail applications organize and prioritize email may reduce the number of subscribers opening our emails. For example, Google Inc.'s Gmail service recently introduced a feature that organizes incoming emails into categories (for example, primary, social and promotions). Such categorization or similar inbox organizational features may result in our emails being delivered in a less prominent location in a subscriber's inbox or viewed as "spam" by our subscribers and may reduce the likelihood of that subscriber opening our emails. Actions by third parties to block, impose restrictions on or charge for the delivery of emails or other messages could also adversely impact our business. From time to time, Internet service providers or other
26
third parties may block bulk email transmissions or otherwise experience technical difficulties that result in our inability to successfully deliver emails or other messages to third parties. Changes in the laws or regulations that limit our ability to send such communications or impose additional requirements upon us in connection with sending such communications would also materially adversely impact our business. Our use of email and other messaging services to send communications about our sites or other matters may also result in legal claims against us, which may cause us increased expenses, and if successful might result in fines and orders with costly reporting and compliance obligations or might limit or prohibit our ability to send emails or other messages. We also rely on social networking messaging services to send communications and to encourage customers to send communications. Changes to the terms of these social networking services to limit promotional communications, any restrictions that would limit our ability or our customers' ability to send communications through their services, disruptions or downtime experienced by these social networking services or decline in the use of or engagement with social networking services by customers and potential customers could materially adversely affect our business, financial condition and operating results.
We are subject to risks related to online payment methods.
We accept payments using a variety of methods, including credit card, debit card, PayPal and gift cards. As we offer new payment options to consumers, we may be subject to additional regulations, compliance requirements and fraud. For certain payment methods, including credit and debit cards, we pay interchange and other fees, which may increase over time and raise our operating costs and lower profitability. We are also subject to payment card association operating rules and certification requirements, including the Payment Card Industry Data Security Standard and rules governing electronic funds transfers, which could change or be reinterpreted to make it difficult or impossible for us to comply. As our business changes, we may also be subject to different rules under existing standards, which may require new assessments that involve costs above what we currently pay for compliance. If we fail to comply with the rules or requirements of any provider of a payment method we accept, if the volume of fraud in our transactions limits or terminates our rights to use payment methods we currently accept, or if a data breach occurs relating to our payment systems, we may, among other things, be subject to fines or higher transaction fees and may lose, or face restrictions placed upon, our ability to accept credit card and debit card payments from consumers or facilitate other types of online payments. If any of these events were to occur, our business, financial condition and operating results could be materially adversely affected.
We occasionally receive orders placed with fraudulent credit card data. We may suffer losses as a result of orders placed with fraudulent credit card data even if the associated financial institution approved payment of the orders. Under current credit card practices, we may be liable for fraudulent credit card transactions. If we are unable to detect or control credit card fraud, our liability for these transactions could harm our business, financial condition and results of operations.
Government regulation of the Internet and e-commerce is evolving, and unfavorable changes or failure by us to comply with these regulations could substantially harm our business and results of operations.
We are subject to general business regulations and laws as well as regulations and laws specifically governing the Internet and e-commerce. Existing and future regulations and laws could impede the growth of the Internet, e-commerce or mobile commerce. These regulations and laws may involve taxes, tariffs, privacy and data security, anti-spam, content protection, electronic contracts and communications, consumer protection, Internet neutrality and gift cards. It is not clear how existing laws governing issues such as property ownership, sales and other taxes and
27
consumer privacy apply to the Internet as the vast majority of these laws were adopted prior to the advent of the Internet and do not contemplate or address the unique issues raised by the Internet or e-commerce. It is possible that general business regulations and laws, or those specifically governing the Internet or e-commerce, may be interpreted and applied in a manner that is inconsistent from one jurisdiction to another and may conflict with other rules or our practices. We cannot be sure that our practices have complied, comply or will comply fully with all such laws and regulations. Any failure, or perceived failure, by us to comply with any of these laws or regulations could result in damage to our reputation, a loss in business and proceedings or actions against us by governmental entities or others. Any such proceeding or action could hurt our reputation, force us to spend significant amounts in defense of these proceedings, distract our management, increase our costs of doing business, decrease the use of our sites by consumers and suppliers and may result in the imposition of monetary liability. We may also be contractually liable to indemnify and hold harmless third parties from the costs or consequences of non-compliance with any such laws or regulations. In addition, it is possible that governments of one or more countries may seek to censor content available on our sites or may even attempt to completely block access to our sites. Adverse legal or regulatory developments could substantially harm our business. In particular, in the event that we are restricted, in whole or in part, from operating in one or more countries, our ability to retain or increase our customer base may be adversely affected, and we may not be able to maintain or grow our net revenue and expand our business as anticipated.
Failure to comply with federal, state and international laws and regulations relating to privacy, data protection and consumer protection, or the expansion of current or the enactment of new laws or regulations relating to privacy, data protection and consumer protection, could adversely affect our business and our financial condition.
A variety of federal, state and international laws and regulations govern the collection, use, retention, sharing and security of consumer data. Laws and regulations relating to privacy, data protection and consumer protection are evolving and subject to potentially differing interpretations. These requirements may be interpreted and applied in a manner that is inconsistent from one jurisdiction to another or may conflict with other rules or our practices. As a result, our practices may not have complied or may not comply in the future with all such laws, regulations, requirements and obligations. Any failure, or perceived failure, by us to comply with our posted privacy policies or with any federal, state or international privacy or consumer protection-related laws, regulations, industry self-regulatory principles, industry standards or codes of conduct, regulatory guidance, orders to which we may be subject or other legal obligations relating to privacy or consumer protection could adversely affect our reputation, brand and business, and may result in claims, proceedings or actions against us by governmental entities or others or other liabilities or require us to change our operations and/or cease using certain data sets. Any such claim, proceeding or action could hurt our reputation, brand and business, force us to incur significant expenses in defense of such proceedings, distract our management, increase our costs of doing business, result in a loss of customers and suppliers and may result in the imposition of monetary penalties. We may also be contractually required to indemnify and hold harmless third parties from the costs or consequences of non-compliance with any laws, regulations or other legal obligations relating to privacy or consumer protection or any inadvertent or unauthorized use or disclosure of data that we store or handle as part of operating our business.
Federal, state and international governmental authorities continue to evaluate the privacy implications inherent in the use of third-party "cookies" and other methods of online tracking for behavioral advertising and other purposes. U.S. and foreign governments have enacted, have considered or are considering legislation or regulations that could significantly restrict the ability of companies and individuals to engage in these activities, such as by regulating the level of consumer notice and consent required before a company can employ cookies or other electronic
28
tracking tools or the use of data gathered with such tools. Additionally, some providers of consumer devices and web browsers have implemented, or announced plans to implement, means to make it easier for Internet users to prevent the placement of cookies or to block other tracking technologies, which could if widely adopted result in the use of third-party cookies and other methods of online tracking becoming significantly less effective. The regulation of the use of these cookies and other current online tracking and advertising practices or a loss in our ability to make effective use of services that employ such technologies could increase our costs of operations and limit our ability to acquire new customers on cost-effective terms and consequently, materially adversely affect our business, financial condition and operating results.
Foreign data protection, privacy and other laws and regulations are often more restrictive than those in the United States. The European Union, for example, traditionally has imposed stricter obligations under its laws and regulations relating to privacy, data protection and consumer protection than the United States. Individual EU member countries have discretion with respect to their interpretation and implementation of these laws and the penalties for breach and have their own regulators with differing attitudes towards enforcement, which results in varying privacy standards and enforcement risk from country to country. Legislation and regulation in the European Union and some EU member states require companies to give specific types of notice and in some cases seek consent from consumers before using their data for certain purposes, including some marketing activities. In the majority of EU member countries, consent must be obtained prior to setting cookies or other tracking technologies. Outside of the European Union, there are many countries with data protections laws, and new countries are adopting data protection legislation with increasing frequency. Many of these laws may require consent from consumers for the use of data for various purposes, including marketing, which may reduce our ability to market our products. There is no harmonized approach to these laws and regulations globally. Consequently, we increase our risk of non-compliance with applicable foreign data protection laws and regulations as we continue our international expansion. We may need to change and limit the way we use consumer information in operating our business and may have difficulty maintaining a single operating model that is compliant. Compliance with such laws and regulations will result in additional costs and may necessitate changes to our business practices and divergent operating models, which may adversely affect our business and financial condition.
In addition, various federal, state and foreign legislative and regulatory bodies, or self-regulatory organizations, may expand current laws or regulations, enact new laws or regulations or issue revised rules or guidance regarding privacy, data protection and consumer protection. For example, the European Union is considering revisions to its current privacy laws. Any such changes may force us to incur substantial costs or require us to change our business practices. This could compromise our ability to pursue our growth strategy effectively and may adversely affect our ability to acquire customers or otherwise harm our business, financial condition and operating results.
Our failure or the failure of third-party service providers to protect our sites, networks and systems against security breaches, or otherwise to protect our confidential information, could damage our reputation and brand and substantially harm our business and operating results.
We collect, maintain, transmit and store data about our customers, suppliers and others, including credit card information and personally identifiable information, as well as other confidential and proprietary information. We also employ third-party service providers that store, process and transmit proprietary, personal and confidential information on our behalf. We rely on encryption and authentication technology licensed from third parties in an effort to securely transmit confidential and sensitive information, including credit card numbers. Advances in computer capabilities, new technological discoveries or other developments may result in the whole or partial failure of this technology to protect transaction data or other confidential and sensitive information from being
29
breached or compromised. Our security measures, and those of our third-party service providers, may not detect or prevent all attempts to hack our systems, denial-of-service attacks, viruses, malicious software, break-ins, phishing attacks, social engineering, security breaches or other attacks and similar disruptions that may jeopardize the security of information stored in or transmitted by our sites, networks and systems or that we or our third-party service providers otherwise maintain, including payment card systems which may subject us to fines or higher transaction fees or limit or terminate our access to certain payment methods. We and our service providers may not anticipate or prevent all types of attacks until after they have already been launched, and techniques used to obtain unauthorized access to or sabotage systems change frequently and may not be known until launched against us or our third-party service providers. In addition, security breaches can also occur as a result of non-technical issues, including intentional or inadvertent breaches by our employees or by persons with whom we have commercial relationships.
Breaches of our security measures or those of our third-party service providers or cyber security incidents could result in unauthorized access to our sites, networks and systems; unauthorized access to and misappropriation of consumer information, including consumers' personally identifiable information, or other confidential or proprietary information of ourselves or third parties; viruses, worms, spyware or other malware being served from our sites, networks or systems; deletion or modification of content or the display of unauthorized content on our sites; interruption, disruption or malfunction of operations; costs relating to breach remediation, deployment of additional personnel and protection technologies, response to governmental investigations and media inquiries and coverage; engagement of third party experts and consultants; litigation, regulatory action and other potential liabilities. If any of these breaches of security occur, our reputation and brand could be damaged, our business may suffer, we could be required to expend significant capital and other resources to alleviate problems caused by such breaches and we could be exposed to a risk of loss, litigation or regulatory action and possible liability. Actual or anticipated attacks may cause us to incur increasing costs, including costs to deploy additional personnel and protection technologies, train employees and engage third-party experts and consultants. In addition, any party who is able to illicitly obtain a subscriber's password could access the subscriber's transaction data or personal information. Any compromise or breach of our security measures, or those of our third-party service providers, could violate applicable privacy, data security and other laws, and cause significant legal and financial exposure, adverse publicity and a loss of confidence in our security measures, which could have an material adverse effect on our business, financial condition and operating results. Although we maintain privacy, data breach and network security liability insurance, we cannot be certain that our coverage will be adequate for liabilities actually incurred or that insurance will continue to be available to us on economically reasonable terms, or at all. We may need to devote significant resources to protect against security breaches or to address problems caused by breaches, diverting resources from the growth and expansion of our business.
Changes in tax treatment of companies engaged in e-commerce may adversely affect the commercial use of our sites and our financial results.
Due to the global nature of the Internet, it is possible that various states or foreign countries might attempt to impose additional or new regulation on our business or levy additional or new sales, income or other taxes relating to our activities. Tax authorities at the international, federal, state and local levels are currently reviewing the appropriate treatment of companies engaged in e-commerce. New or revised international, federal, state or local tax regulations may subject us or our customers to additional sales, income and other taxes. For example, the U.S. Senate has recently proposed legislation, the "Marketplace Fairness Act," that would require companies engaged in e-commerce to collect sales tax taxes on Internet revenue. The U.S. House of
30
Representatives is currently considering such legislation. We cannot predict the effect of current attempts to impose sales, income or other taxes on e-commerce. New or revised taxes and, in particular, sales taxes, VAT and similar taxes would likely increase the cost of doing business online and decrease the attractiveness of selling products over the Internet. New taxes could also create significant increases in internal costs necessary to capture data and collect and remit taxes. Any of these events could have a material adverse effect on our business, financial condition and operating results.
Taxing authorities may successfully assert that we should have collected or in the future should collect sales and use, commercial activity, VAT or similar taxes, and we could be subject to liability with respect to past or future sales, which could adversely affect our operating results.
We do not collect sales and use, commercial activity, VAT or similar taxes in all jurisdictions in which we have sales, based on our belief that such taxes are not applicable. Sales and use, VAT and similar tax laws and rates vary greatly by jurisdiction. Several states have presented us with tax assessments, alleging that we are required to collect and remit sales or other similar taxes. The aggregate amount of claims from these states, including interest and penalties, is approximately $11.7 million. While we do not believe that we are obligated to collect and remit such taxes and intend to vigorously defend our position, we cannot be sure of the outcome of our discussions and/or appeals with these states. In the event of an adverse outcome, we could face assessments for additional time periods, plus any interest and penalties. We also expect additional jurisdictions may make similar assessments in the future. As a result, we may be required to collect such taxes in additional jurisdictions in the future. Such tax assessments, penalties and interest or future requirements may materially adversely affect our business, financial condition and operating results.
We may experience fluctuations in our tax obligations and effective tax rate, which could materially adversely affect our operating results.
We are subject to taxes in the United States and numerous international jurisdictions. We record tax expense based on current tax payments and our estimates of future tax payments, which may include reserves for estimates of probable settlements of international and domestic tax audits. At any one time, multiple tax years may be subject to audit by various taxing jurisdictions. The results of these audits and negotiations with taxing authorities may affect the ultimate settlement of these issues. As a result, we expect that throughout the year there could be ongoing variability in our quarterly tax rates as taxable events occur and exposures are re-evaluated. Further, our effective tax rate in a given financial statement period may be materially impacted by changes in tax laws, changes in the mix and level of earnings by taxing jurisdiction, changes to existing accounting rules or regulations or by changes to our ownership or capital structures. Fluctuations in our tax obligations and effective tax rate could materially adversely affect our results of business, financial condition and operating results.
We may expend substantial funds in connection with the tax liabilities that arise upon the settlement of restricted stock units in connection with this offering.
We may expend substantial funds to satisfy minimum statutory tax withholding and remittance obligations when we settle a portion of our restricted stock units, or RSUs, that were granted prior to the date of this prospectus. Our RSUs vest upon the satisfaction of both a service condition and an event condition. The service condition for our RSUs is typically satisfied over a period of five years. The event condition will be satisfied on the closing of this offering. On the settlement dates for our RSUs, we plan to withhold shares and remit income taxes on behalf of the holders of our RSUs at the applicable minimum statutory rates based on the then current value of the underlying
31
shares of our common stock as determined by us, which we refer to as a net settlement. We expect the applicable minimum statutory rates to be approximately 36% on average. Based on the number of our RSUs outstanding as of June 30, 2014 for which the service condition has been satisfied on that date, and assuming (i) the event condition has been satisfied on that date and (ii) that the price of our common stock at the time of settlement is equal to $26.50, which is the midpoint of the estimated offering price range set forth on the cover page of this prospectus, we estimate that this tax obligation on the initial settlement date will be approximately $14.0 million in the aggregate. The amount of this obligation could be higher or lower, depending on the price of shares of our common stock and the actual number of our RSUs outstanding for which the service condition has been satisfied on the initial settlement date for the RSUs. To net settle these RSUs on the initial settlement date, assuming a 36% tax withholding rate, we expect to deliver an aggregate of approximately 925,949 shares of our Class B common stock to RSU holders. In connection with these net settlements, we will withhold and remit the tax liabilities on behalf of the RSU holders to the relevant tax authorities in cash.
In order to fund the tax withholding and remittance obligations on behalf of our RSU holders, we expect to use a portion of our cash and cash equivalent balances. Alternatively, we may choose to borrow funds or use a combination of cash and borrowed funds to satisfy these obligations.
We expect to pursue acquisitions, which could have a material adverse effect on our business, as could the integration of the businesses following acquisition.
As part of our business strategy, we may acquire other companies or businesses. Since our inception, we have made two acquisitions, the remainder of the stake of our Australian joint venture in 2011 and DwellStudio in 2013. Acquisitions involve numerous risks, any of which could harm our business, including: difficulties in integrating the technologies, operations, existing contracts and personnel of an acquired company; difficulties in supporting and transitioning suppliers, if any, of an acquired company; diversion of financial and management resources from existing operations or alternative acquisition opportunities; failure to realize the anticipated benefits or synergies of a transaction; failure to identify all of the problems, liabilities or other shortcomings or challenges of an acquired company or technology, including issues related to intellectual property, regulatory compliance practices, revenue recognition or other accounting practices or employee or customer issues; risks of entering new markets in which we have limited or no experience; potential loss of key employees, customers and suppliers from either our current business or an acquired company's business; inability to generate sufficient net revenue to offset acquisition costs; additional costs or equity dilution associated with funding the acquisition; and possible write-offs or impairment charges relating to acquired businesses.
We may also pursue acquisitions in businesses that are complementary to our business but otherwise new to our organization. Pursuing complementary business opportunities would require significant time and resources that may divert management's attention from other business activities. In addition, any complementary businesses we acquire may expose us to additional laws, regulations and risks, including the risk that we may incur ongoing operating expenses in such businesses in excess of revenue, which could harm our results of operations and financial condition. The financial profile of any such new businesses may be different than our current financial profile, which could also materially adversely affect our financial condition.
32
We rely on the performance of members of management and highly skilled personnel, and if we are unable to attract, develop, motivate and retain well-qualified employees, our business could be harmed.
We believe our success has depended, and continues to depend, on the efforts and talents of Niraj Shah, one of our co-founders, co-chairman of the board of directors and our Chief Executive Officer, Steven Conine, one our co-founders, co-chairman of the board of directors and Chief Technology Officer, and other members of our management team. Our future success depends on our continuing ability to attract, develop, motivate and retain highly qualified and skilled employees, particularly mid-level managers, engineers and merchandising and technology personnel. The market for such positions in the Boston area and other cities in which we operate is competitive. Qualified individuals are in high demand, and we may incur significant costs to attract them. In addition, the loss of any of our senior management or key employees or our inability to recruit and develop mid-level managers could materially adversely affect our ability to execute our business plan, and we may not be able to find adequate replacements. All of our officers and other U.S. employees are at-will employees, meaning that they may terminate their employment relationship with us at any time, and their knowledge of our business and industry would be extremely difficult to replace. If we do not succeed in attracting well-qualified employees or retaining and motivating existing employees, our business, financial condition and operating results may be materially adversely affected.
We may not be able to adequately protect our intellectual property rights.
We regard our subscriber list, trademarks, domain names, copyrights, patent, trade dress, trade secrets, proprietary technology and similar intellectual property as critical to our success, and we rely on trademark, copyright and patent law, trade secret protection, agreements and other methods with our employees and others to protect our proprietary rights. We might not be able to obtain broad protection in the United States or internationally for all of our intellectual property, and we might not be able to obtain effective intellectual property protection in every country in which we sell products. The protection of our intellectual property rights may require the expenditure of significant financial, managerial and operational resources. Moreover, the steps we take to protect our intellectual property may not adequately protect our rights or prevent third parties from infringing or misappropriating our proprietary rights, and we may not be able to broadly enforce all of our trademarks. Any of our patents, marks or other intellectual property rights may be challenged by others or invalidated through administrative process or litigation. Our patent and trademark applications may never be granted. Additionally, the process of obtaining patent protection is expensive and time-consuming, and we may not be able to prosecute all necessary or desirable patent applications at a reasonable cost or in a timely manner. Even if issued, there can be no assurance that these patents will adequately protect our intellectual property, as the legal standards relating to the validity, enforceability and scope of protection of patent and other intellectual property rights are uncertain. We also cannot be certain that others will not independently develop or otherwise acquire equivalent or superior technology or intellectual property rights.
We might be required to spend significant resources to monitor and protect our intellectual property rights. We may not be able to discover or determine the extent of any infringement, misappropriation or other violation of our intellectual property rights and other proprietary rights. We may initiate claims or litigation against others for infringement, misappropriation or violation of our intellectual property rights or proprietary rights or to establish the validity of such rights. Despite our efforts, we may be unable to prevent third parties from infringing upon, misappropriating or otherwise violating our intellectual property rights and other proprietary rights. Any litigation, whether or not it is resolved in our favor, could result in significant expense to us and divert the efforts of our technical and management personnel, which may materially adversely affect our business, financial condition and operating results.
33
We have been, and may again be, accused of infringing intellectual property rights of third parties.
The e-commerce industry is characterized by vigorous protection and pursuit of intellectual property rights, which has resulted in protracted and expensive litigation for many companies. We are subject to claims and litigation by third parties that we infringe their intellectual property rights, and we expect additional claims and litigation with respect to infringement to occur in the future. The costs of supporting such litigation and disputes are considerable, and there can be no assurances that favorable outcomes will be obtained. As our business expands and the number of competitors in our market increases and overlaps occur, we expect that infringement claims may increase in number and significance. Any claims or proceedings against us, whether meritorious or not, could be time-consuming, result in considerable litigation costs, require significant amounts of management time or result in the diversion of significant operational resources, any of which could materially adversely affect our business, financial condition and operating results.
Legal claims regarding intellectual property rights are subject to inherent uncertainties due to the oftentimes complex issues involved, and we cannot be certain that we will be successful in defending ourselves against such claims. In addition, some of our larger competitors have extensive portfolios of issued patents. Many potential litigants, including patent holding companies, have the ability to dedicate substantially greater resources to enforce their intellectual property rights and to defend claims that may be brought against them. Furthermore, a successful claimant could secure a judgment that requires us to pay substantial damages or prevents us from conducting our business as we have historically done or may desire to do in the future. We might also be required to seek a license and pay royalties for the use of such intellectual property, which may not be available on commercially acceptable terms, or at all. Alternatively, we may be required to develop non-infringing technology or intellectual property, which could require significant effort and expense and may ultimately not be successful.
We have received in the past, and we may receive in the future, communications alleging that certain items posted on or sold through our sites violate third-party copyrights, designs, marks and trade names or other intellectual property rights or other proprietary rights. Brand and content owners and other proprietary rights owners have actively asserted their purported rights against online companies, including Wayfair. In addition to litigation from rights owners, we may be subject to regulatory, civil or criminal proceedings and penalties if governmental authorities believe we have aided and abetted in the sale of counterfeit or infringing products.
Such claims, whether or not meritorious, may result in the expenditure of significant financial, managerial and operational resources, injunctions against us or the payment of damages by us. We may need to obtain licenses from third parties who allege that we have violated their rights, but such licenses may not be available on terms acceptable to us, or at all. These risks have been amplified by the increase in third parties whose sole or primary business is to assert such claims.
The inability to acquire, use or maintain our marks and domain names for our sites could substantially harm our business and operating results.
We currently are the registrant of marks for our brands in numerous jurisdictions and are the registrant of the Internet domain name for the websites of Wayfair.com and our other sites, as well as various related domain names. However, we have not registered our marks or domain names in all major international jurisdictions. Domain names generally are regulated by Internet regulatory bodies. If we do not have or cannot obtain on reasonable terms the ability to use our marks in a particular country, or to use or register our domain name, we could be forced either to incur significant additional expenses to market our products within that country, including the development of a new brand and the creation of new promotional materials and packaging, or to
34
elect not to sell products in that country. Either result could materially adversely affect our business, financial condition and operating results.
Furthermore, the regulations governing domain names and laws protecting marks and similar proprietary rights could change in ways that block or interfere with our ability to use relevant domains or our current brand. Also, we might not be able to prevent third parties from registering, using or retaining domain names that interfere with our consumer communications or infringe or otherwise decrease the value of our marks, domain names and other proprietary rights. Regulatory bodies also may establish additional generic or country-code top-level domains or may allow modifications of the requirements for registering, holding or using domain names. As a result, we might not be able to register, use or maintain the domain names that utilize the name Wayfair or our other brands in all of the countries in which we currently or intend to conduct business.
Our use of open source software may pose particular risks to our proprietary software and systems.
We use open source software in our software and systems and will use open source software in the future. The licenses applicable to open source software may require that the source code subject to the license be made available to the public and that any modifications or derivative works to certain open source software continue to be licensed under open source licenses. From time to time, we may face claims from third parties claiming infringement of their intellectual property rights, or demanding the release or license of the open source software or derivative works that we developed using such software (which could include our proprietary source code) or otherwise seeking to enforce the terms of the applicable open source license. These claims could result in litigation and could require us to purchase a costly license, publicly release the affected portions of our source code, be limited in or cease using the implicated software unless and until we can re-engineer such software to avoid infringement or change the use of the implicated open source software. In addition to risks related to license requirements, use of certain open source software can lead to greater risks than use of third-party commercial software, as open source licensors generally do not provide warranties, indemnities or other contractual protections with respect to the software (for example, non-infringement or functionality). Our use of open source software may also present additional security risks because the source code for open source software is publicly available, which may make it easier for hackers and other third parties to determine how to breach our sites and systems that rely on open source software. Any of these risks could be difficult to eliminate or manage, and, if not addressed, could have a material adverse effect on our business, financial condition and operating results.
Risks Related to this Offering and Ownership of our Class A Common Stock
There has been no prior market for our Class A common stock. An active market may not develop or be sustainable, and investors may not be able to resell their shares at or above the initial public offering price.
There has been no public market for our Class A common stock prior to this offering. The initial public offering price for our Class A common stock will be determined through negotiations between a representative of the underwriters and us and may vary from the market price of our Class A common stock following the completion of this offering. An active or liquid market in our Class A common stock may not develop upon completion of this offering or, if it does develop, it may not be sustainable. In the absence of an active trading market for our Class A common stock, you may not be able to resell those shares at or above the initial public offering price or at all. We cannot predict the prices at which our Class A common stock will trade.
35
Although we do not intend to rely on "controlled company" exemptions from certain corporate governance requirements under the New York Stock Exchange, or NYSE, rules, if we use these exemptions in the future, you will not have the same protections afforded to stockholders of companies that are subject to such requirements.
After this offering, our co-founders will continue to control a majority of the voting power of our outstanding common stock. As a result, we will qualify as a "controlled company" within the meaning of the corporate governance standards of the NYSE. Under these rules, a listed company of which more than 50% of the voting power is held by an individual, group or another company is a "controlled company" and may elect not to comply with certain corporate governance requirements, including:
- •
- the requirement that a majority of the board of directors consist of independent directors as defined under the listing
rules of the NYSE;
- •
- the requirement that we have a nominating and corporate governance committee that is composed entirely of independent
directors with a written charter addressing the committee's purpose and responsibilities;
- •
- the requirement that we have a compensation committee that is composed entirely of independent directors with a written
charter addressing the committee's purpose and responsibilities; and
- •
- the requirement for an annual performance evaluation of the nominating and corporate governance and compensation committees.
To the extent we still qualify, we may choose to take advantage of any of these exemptions in the future. As a result, in the future, we may not have a majority of independent directors and we may not have independent director oversight of decisions regarding executive compensation and director nominations.
The dual class structure of our common stock and the existing ownership of capital stock by our executive officers, directors and their affiliates have the effect of concentrating voting control with our co-founders, executive officers, directors and their affiliates for the foreseeable future, which will limit your ability to influence corporate matters.
Our Class B common stock has ten votes per share, and our Class A common stock, which is the stock we are offering in this initial public offering, has one vote per share. Given the greater number of votes per share attributed to our Class B common stock, our existing stockholders, all of which hold shares of Class B common stock, will collectively beneficially own shares representing approximately 98.5% of the voting power of our outstanding capital stock following the completion of this offering. Consequently, the holders of Class B common stock collectively will continue to be able to control a majority of the voting power even if their stock holdings represent as few as approximately 10% of the outstanding number of shares of our common stock. Further, our co-founders will own shares representing approximately 49.8% of the economic interest and 56.6% of the voting power of our outstanding capital stock following this offering and, together with our other executive officers, directors and their affiliates, will own shares representing approximately 76.3% of the economic interest and 86.7% of the voting power of our outstanding capital stock following this offering. This concentrated control will limit your ability to influence corporate matters for the foreseeable future. For example, these stockholders will be able to control elections of directors, amendments of our restated certificate of incorporation or bylaws, increases to the number of shares available for issuance under our equity incentive plans or adoption of new equity incentive plans and approval of any merger or sale of assets for the foreseeable future. This control may materially adversely affect the market price of our Class A common stock. Additionally, the
36
holders of our Class B common stock may cause us to make strategic decisions or pursue acquisitions that could involve risks to you or may not be aligned with your interests. The holders of our Class B common stock will also be entitled to a separate vote in the event we seek to amend our restated certificate of incorporation to increase or decrease the par value of a class of our common stock or in a manner that alters or changes the powers, preferences or special rights of the Class B common stock in a manner that affects its holders adversely.
Future transfers by holders of Class B common stock will generally result in those shares converting on a 1:1 basis to Class A common stock, which will have the effect, over time, of increasing the relative voting power of those holders of Class B common stock who retain their shares in the long-term, which may include our executive officers and directors and their affiliates.
Our stock price may be volatile or may decline regardless of our operating performance, resulting in substantial losses for investors purchasing shares in this offering.
The market price of our Class A common stock may fluctuate significantly in response to numerous factors, many of which are beyond our control, including:
- •
- actual or anticipated fluctuations in our results of operations;
- •
- the financial projections we may provide to the public, any changes in these projections or our failure to meet these
projections;
- •
- failure of securities analysts to initiate or maintain coverage of our company, changes in financial estimates or ratings
by any securities analysts who follow our company or our failure to meet these estimates or the expectations of investors;
- •
- announcements by us or our competitors of significant technical innovations, acquisitions, strategic partnerships, joint
ventures, operating results or capital commitments;
- •
- changes in operating performance and stock market valuations of other technology or retail companies generally, or those
in our industry in particular;
- •
- price and volume fluctuations in the overall stock market, including as a result of trends in the economy as a whole;
- •
- changes in our board of directors or management;
- •
- sales of large blocks of our Class A common stock, including sales by our executive officers, directors and
significant stockholders;
- •
- lawsuits threatened or filed against us;
- •
- changes in laws or regulations applicable to our business;
- •
- the expiration of contractual lock-up agreements;
- •
- changes in our capital structure, such as future issuances of debt or equity securities;
- •
- short sales, hedging and other derivative transactions involving our capital stock;
- •
- general economic conditions in the United States and abroad;
- •
- other events or factors, including those resulting from war, incidents of terrorism or responses to these events; and
- •
- the other factors described in the sections of the prospectus titled "Risk Factors" and "Special Note Regarding Forward-Looking Statements."
37
In addition, stock markets have experienced extreme price and volume fluctuations that have affected and continue to affect the market prices of equity securities of many technology companies, including e-commerce companies. Stock prices of many technology companies, including e-commerce companies, have fluctuated in a manner unrelated or disproportionate to the operating performance of those companies. In the past, stockholders have instituted securities class action litigation following periods of market volatility. If we were to become involved in securities litigation, it could subject us to substantial costs, divert resources and the attention of management from our business and materially adversely affect our business, financial condition and operating results.
Substantial future sales of shares of our Class A common stock could cause the market price of our Class A common stock to decline.
Sales of a substantial number of shares of our Class A common stock in the public market following the completion of this offering, or the perception that these sales might occur, could depress the market price of our Class A common stock and could impair our ability to raise capital through the sale of additional equity securities. We are unable to predict the effect that such sales may have on the prevailing market price of our Class A common stock.
All of our executive officers, directors, holders of substantially all of our outstanding capital stock and substantially all of our stock options and restricted stock units are subject to lock-up agreements that restrict their ability to transfer shares of our capital stock for 180 days from the date of this prospectus. Subject to certain exceptions, the lock-up agreements limit the number of shares of capital stock that may be sold immediately following this initial public offering. Subject to certain limitations, as of June 30, 2014, approximately 71,756,943 shares of Class B common stock (assuming the sale of 500,000 shares by the selling stockholders) will become eligible for sale upon expiration of the 180-day lock-up period. Goldman, Sachs & Co. may, in its sole discretion, permit our stockholders who are subject to these lock-up agreements to sell shares prior to the expiration of the lock-up agreements.
In addition, as of June 30, 2014, there were 646,413 shares of Class B common stock subject to outstanding options. We intend to register all of the shares of Class A common stock issuable upon conversion of the shares of Class B common stock issuable upon exercise of outstanding options, and upon exercise of settlement of any options or other equity incentives we may grant in the future, for public resale under the Securities Act of 1933, as amended, or the Securities Act. Accordingly, these shares will be able to be freely sold in the public market upon issuance as permitted by any applicable vesting requirements, subject to the lock-up agreements described above. The shares of Class A common stock issuable upon conversion of these shares will become eligible for sale in the public market to the extent such options are exercised, subject to the lock-up agreements described above and compliance with applicable securities laws.
If securities or industry analysts do not publish research or reports about our business, or publish negative reports about our business, our share price and trading volume could decline.
The trading market for our Class A common stock will depend in part on the research and reports that securities or industry analysts publish about us or our business, our market and our competitors. We do not have any control over these analysts. If one or more of the analysts who cover us downgrade our shares or change their opinion of our shares, our share price would likely decline. If one or more of these analysts cease coverage of our company or fail to regularly publish reports on us, we could lose visibility in the financial markets, which could cause our share price or trading volume to decline.
38
We may invest or spend the proceeds of this offering in ways with which you may not agree or in ways that may not yield a return.
We currently intend to use the net proceeds to us from this offering primarily for general corporate purposes. We also expect to distribute a portion of the net proceeds to our existing Series A preferred stockholders, including our co-founders and certain of our directors, executive officers and holders of more than 5% of our voting securities, upon conversion to common stock to satisfy the remaining portion of an accrued cash dividend, which amount was approximately $20.9 million as of June 30, 2014, and a portion of the net proceeds to satisfy minimum statutory tax withholding and remittance obligations related to the settlement of outstanding RSUs upon the completion of this offering, or approximately $14.0 million as of June 30, 2014. We may also use a portion of the net proceeds from this offering for the acquisition of, or investment in, technologies, solutions or businesses that complement our business, although we have no present commitments or agreements to enter into any such acquisition or investment. Our management will have considerable discretion in the application of the net proceeds, and you will not have the opportunity, as part of your investment decision, to assess whether the proceeds are being used appropriately. The net proceeds may be used for purposes that do not increase the value of our business or increase the risks to you, which could cause the price of our stock to decline. Until net proceeds are used, they may be placed in investments that do not produce significant income or that may lose value.
We are an "emerging growth company," and we cannot be certain if the reduced disclosure requirements applicable to "emerging growth companies" will make our Class A common stock less attractive to investors.
We are an "emerging growth company," as defined in the JOBS Act, and we may take advantage of certain exemptions from various reporting requirements that are applicable to other public companies that are not "emerging growth companies" including, but not limited to, not being required to comply with the auditor attestation requirements of Section 404 of the Sarbanes-Oxley Act, reduced disclosure obligations regarding executive compensation in our periodic reports and proxy statements and exemptions from the requirements of holding a nonbinding advisory vote on executive compensation and stockholder approval of any golden parachute payments not previously approved. We will remain an "emerging growth company" for up to five years, although we will cease to be an "emerging growth company" upon the earliest of (1) the last day of the fiscal year following the fifth anniversary of this offering, (2) the last day of the first fiscal year in which our annual gross revenues are $1.0 billion or more, (3) the date on which we have, during the previous rolling three-year period, issued more than $1.0 billion in non-convertible debt securities and (4) the date on which we are deemed to be a "large accelerated filer" as defined in the Securities Exchange Act of 1934, or the Exchange Act. We cannot predict if investors will find our Class A common stock less attractive or our company less comparable to certain other public companies because we will rely on these exemptions.
The requirements of being a public company may strain our resources, divert management's attention and affect our ability to attract and retain additional executive management and qualified board members.
As a public company, we will be subject to the reporting requirements of the Exchange Act, the Sarbanes-Oxley Act, the Dodd-Frank Wall Street Reform and Consumer Protection Act, the listing requirements of the NYSE and other applicable securities rules and regulations. Compliance with these rules and regulations will increase our legal and financial compliance costs, make some activities more difficult, time-consuming or costly and increase demand on our systems and resources, particularly after we are no longer an "emerging growth company." The Exchange Act
39
requires, among other things, that we file annual, quarterly and current reports with respect to our business and results of operations. The Sarbanes-Oxley Act requires, among other things, that we maintain effective disclosure controls and procedures and internal control over financial reporting. In order to maintain and, if required, improve our disclosure controls and procedures and internal control over financial reporting to meet this standard, significant resources and management oversight may be required. As a result, management's attention may be diverted from other business concerns, which could materially adversely affect our business and results of operations. We will need to hire additional employees or engage outside consultants to comply with these requirements, which will increase our costs and expenses.
In addition, changing laws, regulations and standards relating to corporate governance and public disclosure are creating uncertainty for public companies, increasing legal and financial compliance costs and making some activities more time-consuming. These laws, regulations and standards are subject to varying interpretations, in many cases due to their lack of specificity, and, as a result, their application in practice may evolve over time as new guidance is provided by regulatory and governing bodies. This could result in continuing uncertainty regarding compliance matters and higher costs necessitated by ongoing revisions to disclosure and governance practices. We intend to invest resources to comply with evolving laws, regulations and standards, and this investment may result in increased general and administrative expenses and a diversion of management's time and attention from revenue-generating activities to compliance activities. If our efforts to comply with new laws, regulations and standards differ from the activities intended by regulatory or governing bodies due to ambiguities related to their application and practice, regulatory authorities may initiate legal proceedings against us, and our business may be materially adversely affected.
We also expect that being a public company will make it more expensive for us to obtain director and officer liability insurance, and we may be required to accept reduced coverage or incur substantially higher costs to obtain coverage. These factors could also make it more difficult for us to attract and retain qualified members of our board of directors, particularly to serve on our audit committee and compensation committee, and qualified executive officers.
As a result of disclosure of information in this prospectus and in filings required of a public company, our business and financial condition will become more visible, which we believe may result in threatened or actual litigation, including by competitors and other third parties. If such claims are successful, our business and results of operations could be materially adversely affected, and even if the claims do not result in litigation or are resolved in our favor, these claims, and the time and resources necessary to resolve them, could divert the resources of our management and materially adversely affect our business, financial condition and operating results.
Anti-takeover provisions in our charter documents and under Delaware law could make an acquisition of our company more difficult, limit attempts by our stockholders to replace or remove our current management and limit the market price of our Class A common stock.
Provisions in our certificate of incorporation and bylaws, as will be amended and restated upon completion of this offering, may have the effect of delaying or preventing a change of control or changes in our management. Our restated certificate of incorporation and amended and restated bylaws include provisions that:
- •
- permit the board of directors to establish the number of directors and fill any vacancies and newly created directorships;
- •
- when the outstanding shares of our Class B common stock represent less than 10% of the then outstanding shares of Class A common stock and Class B common stock, provide that
40
- •
- require super-majority voting to amend some provisions in our restated certificate of incorporation and amended and
restated bylaws;
- •
- authorize the issuance of "blank check" preferred stock that our board of directors could use to implement a stockholder
rights plan;
- •
- eliminate the ability of our stockholders to call special meetings of stockholders;
- •
- when the outstanding shares of our Class B common stock represent less than 10% of the then outstanding shares of
Class A common stock and Class B common stock, prohibit stockholder action by written consent, which requires all stockholder actions to be taken at a meeting of our stockholders;
- •
- provide that the board of directors is expressly authorized to make, alter or repeal our bylaws;
- •
- restrict the forum for certain litigation against us to Delaware;
- •
- reflect the dual class structure of our common stock, as discussed above; and
- •
- establish advance notice requirements for nominations for election to our board of directors or for proposing matters that can be acted upon by stockholders at annual stockholder meetings.
our board of directors will be classified into three classes with staggered, three year terms and that directors may only be removed for cause;
These provisions may frustrate or prevent any attempts by our stockholders to replace or remove our current management by making it more difficult for stockholders to replace members of our board of directors, which is responsible for appointing the members of our management. In addition, because we are incorporated in Delaware, we are governed by the provisions of Section 203 of the Delaware General Corporation Law, which generally prohibits a Delaware corporation from engaging in any of a broad range of business combinations with any holder of at least 15% of our capital stock for a period of three years following the date on which the stockholder became a 15% stockholder.
Our restated certificate of incorporation will also provide that the Court of Chancery of the State of Delaware will be the exclusive forum for substantially all disputes between us and our stockholders, which could limit our stockholders' ability to obtain a favorable judicial forum for disputes with us or our directors, officers or employees.
Our restated certificate of incorporation provides that the Court of Chancery of the State of Delaware is the exclusive forum for any derivative action or proceeding brought on our behalf; any action asserting a breach of fiduciary duty; any action asserting a claim against us arising pursuant to the Delaware General Corporation Law, our restated certificate of incorporation or our bylaws; or any action asserting a claim against us that is governed by the internal affairs doctrine. The choice of forum provision may limit a stockholder's ability to bring a claim in a judicial forum that it finds favorable for disputes with us or our directors, officers or other employees, which may discourage such lawsuits against us and our directors, officers and other employees. Alternatively, if a court were to find the choice of forum provision contained in our restated certificate of incorporation to be inapplicable or unenforceable in an action, we may incur additional costs associated with resolving such action in other jurisdictions, which could materially adversely affect our business and financial condition.
41
SPECIAL NOTE REGARDING FORWARD-LOOKING STATEMENTS
This prospectus contains forward-looking statements. All statements other than statements of historical fact contained in this prospectus, including statements regarding our future results of operations and financial position, business strategy and plans and objectives of management for future operations, are forward-looking statements.
In some cases, you can identify forward-looking statements by terms such as "may," "will," "should," "expects," "plans," "anticipates," "could," "intends," "target," "projects," "contemplates," "believes," "estimates," "predicts," "potential" or "continue" or the negative of these terms or other similar expressions. The forward-looking statements in this prospectus are only predictions. We have based these forward-looking statements largely on our current expectations and projections about future events and financial trends that we believe may affect our business, financial condition and results of operations. These forward-looking statements speak only as of the date of this prospectus and are subject to a number of risks, uncertainties and assumptions described in the "Risk Factors" section and elsewhere in this prospectus. Because forward-looking statements are inherently subject to risks and uncertainties, some of which cannot be predicted or quantified, you should not rely on these forward-looking statements as predictions of future events. The events and circumstances reflected in our forward-looking statements may not be achieved or occur and actual results could differ materially from those projected in the forward-looking statements. Except as required by applicable law, we undertake no obligation to publicly update or revise any forward-looking statements contained herein, whether as a result of any new information, future events or otherwise.
42
Reorganization Transactions
Prior to the completion of this offering, we intend to complete an internal restructuring, which we refer to in this prospectus as the Corporate Reorganization. Pursuant to the Corporate Reorganization, Wayfair LLC will become a wholly-owned subsidiary of Wayfair Inc., and the holders of equity interests in Wayfair LLC will become stockholders of Wayfair Inc.
Wayfair Inc. was incorporated as a Delaware corporation on August 8, 2014. Wayfair Inc. has not engaged in any business or other activities except in connection with its formation and in preparation for this offering. The certificate of incorporation of Wayfair Inc. in effect immediately prior to the completion of the Corporate Reorganization authorizes common stock and three series of preferred stock—Series A-1 convertible preferred stock, Series A-2 convertible preferred stock and Series B convertible preferred stock.
Prior to the Corporate Reorganization, Wayfair LLC is owned by (i) our co-founders, through SK Retail, Inc., which owns common units and preferred units, (ii) outside investors who currently own preferred units via single purpose entities taxable as corporations, which we refer to herein as corporate blockers, (iii) outside investors who directly own preferred units, and (iv) our employees and former employees, advisors and former advisors, managers and certain other individuals and entities who own common units or equity incentives to purchase or otherwise receive common units. We refer to the individuals and entities described in clauses (iii) and (iv) as our direct members. Our outside investors and direct members consist primarily of holders of more than 5% of our voting securities and entities affiliated with our directors.
The sole purposes of SK Retail, Inc. prior to the Corporate Reorganization were to own equity interests in Wayfair LLC and to provide reimbursable management services to Wayfair LLC. Wayfair LLC reimbursed SK Retail for services provided, and these costs have been included in the consolidated financial statements of Wayfair LLC. The sole purpose of the corporate blockers prior to the Corporate Reorganization was to own equity interests in Wayfair LLC.
In connection with the Corporate Reorganization and pursuant to a contribution and exchange agreement we executed on August 15, 2014 with all of the holders of equity interests in Wayfair LLC, the following contributions of interests and entities will be made to Wayfair Inc. by the current owners of Wayfair LLC:
- •
- Our co-founders will contribute all of the outstanding stock of SK Retail, Inc. to Wayfair Inc. in exchange
for an aggregate of 40,375,939 shares of common stock and 856,566 shares of Series A-2 convertible preferred stock of Wayfair Inc.;
- •
- Certain outside investors who own interests in Wayfair LLC through corporate blockers will contribute all of the
outstanding stock of those corporate blockers to Wayfair Inc. in exchange for an aggregate of 10,152,786 shares of Series A-1, 1,740,478 shares of Series A-2 and
4,627,422 shares of Series B convertible preferred stock of Wayfair Inc.;
- •
- Our direct members who own preferred units of Wayfair LLC and certain corporate blockers will contribute all of
their outstanding preferred units to Wayfair Inc. in exchange for an aggregate of 7,513,878 shares of Series A-1, 1,288,093 shares of Series A-2 and 1,367,711 shares of
Series B convertible preferred stock of Wayfair Inc.; and
- •
- Our direct members who own common units will contribute all of their outstanding common units to Wayfair Inc. in exchange for an aggregate of 3,408,120 shares of common stock of Wayfair Inc.
43
In addition, all outstanding incentive units of Wayfair LLC outstanding immediately prior to the Reorganization will automatically be converted into (i) options to purchase our Class B common stock, (ii) shares of our Class B common stock subject to vesting and repurchase provisions or (iii) restricted stock units for our Class B common stock.
Following the contributions described above, and prior to the completion of this offering, all outstanding shares of common stock of Wayfair Inc. will be reclassified into shares of Class B common stock. Upon the completion of this offering, all outstanding shares of convertible preferred stock of Wayfair Inc. will convert into shares of Class B common stock. The terms of the Class B common stock are described in the section titled "Description of Capital Stock."
As a result of the Corporate Reorganization and this offering, including the filing of our restated certificate of incorporation, (i) Wayfair Inc., the issuer of Class A common stock in this offering, will be a holding company with no material assets other than 100% of the equity interests in Wayfair LLC held directly and through one or more wholly-owned corporate subsidiaries, and (ii) the capital stock of Wayfair Inc. will consist of three classes of stock: (i) Class A common stock, entitled to one vote per share on all matters submitted to a vote of stockholders; (ii) Class B common stock, entitled to ten votes per share on all matters submitted to a vote of stockholders and (iii) undesignated and unissued Preferred Stock. See the section titled "Description of Capital Stock" for additional information. All shares sold in this offering will be shares of Class A common stock.
Effect of the Corporate Reorganization and this Offering
As a result of the transactions described above, immediately following this offering, and after giving effect to the sale of shares in this offering, including by the selling stockholders:
- •
- our co-founders will collectively own 41,232,505 shares of Class B common stock, representing 56.6% of the voting
power and 49.8% of the economic interest in Wayfair Inc.;
- •
- our current outside investors, who are primarily holders of more than 5% of our voting securities and entities affiliated
with our directors, will collectively own 26,190,368 shares of Class B common stock, representing 35.9% of the voting power and 31.6% of the economic interest in Wayfair Inc.;
- •
- our public stockholders will collectively own 11,000,000 shares of Class A common stock, representing 1.5% of the
voting power and 13.3% of the economic interest in Wayfair Inc.; and
- •
- SK Retail, Inc. and certain corporate blockers will be wholly-owned corporate subsidiaries of Wayfair Inc.
44
The diagram below depicts our organizational structure immediately following the offering:
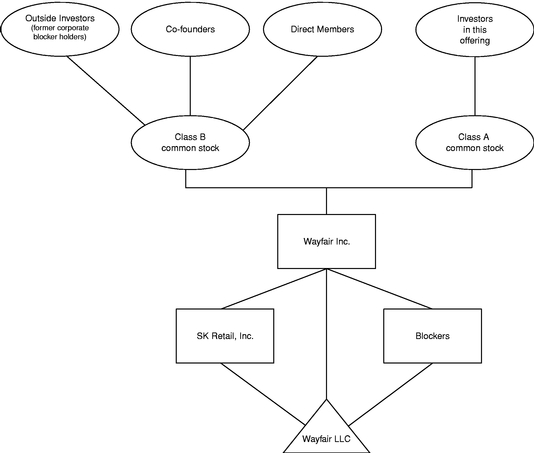
We expect to account for the Corporate Reorganization transactions in accordance with guidance provided for entities under common ownership because the holders of our current equity interests in Wayfair LLC are expected to hold the same ownership interests in Wayfair Inc. as they do in Wayfair LLC immediately prior to the Corporate Reorganization.
Holding Company Structure
Following the Corporate Reorganization and this offering, Wayfair Inc. will hold, directly and indirectly, 100% of the membership interests in Wayfair LLC and will operate and control all of the business and affairs of Wayfair LLC. Wayfair Inc. will consolidate the financial results of Wayfair LLC.
Wayfair Inc. and its corporate subsidiaries will incur U.S. federal, state and local income taxes on any net taxable income of Wayfair LLC. Net profits and net losses of Wayfair LLC will be allocated to Wayfair Inc. and its corporate subsidiaries. In addition, Wayfair LLC may make distributions to Wayfair Inc. and its corporate subsidiaries in order to remit taxes and certain other fees and expenses.
45
We estimate that the net proceeds to us from the sale of the Class A common stock that we are offering will be approximately $258.3 million, assuming an initial public offering price of $26.50 per share, which is the midpoint of the range listed on the cover page of this prospectus, and after deducting the estimated underwriting discount and estimated offering expenses payable by us.
A $1.00 increase (decrease) in the assumed initial public offering price of $26.50 per share, which is the midpoint of the range listed on the cover page of this prospectus, would increase (decrease) the net proceeds to us from this offering by approximately $9.9 million, assuming the number of shares offered by us, as set forth on the cover page of this prospectus, remains the same and after deducting the estimated underwriting discount and estimated offering expenses payable by us. If the underwriters exercise their option to purchase additional shares of Class A common stock from the selling stockholders in full, we will not receive any of the net proceeds.
We will not receive any of the net proceeds from the sale of shares of our Class A common stock in this offering by the selling stockholders.
We expect to distribute a portion of the net proceeds to our existing Series A preferred stockholders upon conversion to common stock in connection with the completion of this offering to satisfy the remaining portion of an accrued cash dividend, which amount was approximately $20.9 million as of June 30, 2014, or approximately 8.1% of the net proceeds, based on the midpoint of the range listed on the cover of this prospectus. Our co-founders and certain of our directors, executive officers and holders of more than 5% of our voting securities hold 85% of our outstanding shares of Series A preferred stock and, as a result of their ownership, will receive 85% of the dividend payment, or approximately $17.8 million as of June 30, 2014. We also expect to distribute a portion of the net proceeds to satisfy minimum statutory tax withholding and remittance obligations related to the settlement of outstanding restricted stock units upon the completion of this offering, which amount was approximately $14.0 million as of June 30, 2014. We intend to use the remaining net proceeds to us from this offering for working capital and other general corporate purposes. We may also use a portion of the net proceeds from this offering for the acquisition of, or investment in, technologies, solutions or businesses that complement our business.
Pending use of the proceeds as described above, we intend to invest the proceeds in short-term, interest-bearing, investment-grade securities.
46
We do not expect to pay any dividends on our Class A common stock or Class B common stock in the foreseeable future. Any future determination to pay dividends will be at the sole discretion of our board of directors, subject to applicable laws. Our board of directors may take into account general and economic conditions, our financial condition and operating results, our available cash and current and anticipated cash needs, our capital requirements, contractual, legal, tax and regulatory restrictions, and implications on the payment of dividends by us to our stockholders or by our subsidiaries to us and such other factors as our board of directors may deem relevant.
In the past we have made tax distributions to our existing stockholders to the extent we have had taxable net income attributable to our existing stockholders. Accordingly, we paid distributions to our stockholders in 2011 in the aggregate amount of approximately $6.2 million. In March 2014, we distributed a portion of an accrued cash dividend to our Series A preferred stockholders in the aggregate amount of $15.0 million as further described in the section titled "Certain Relationships and Related Party Transactions — Series A Distributions" on page 113. In addition, following the Corporate Reorganization and upon the completion of this offering, we intend to distribute the remaining portion of the cash dividend accrued as of the date of this offering to our existing Series A preferred stockholders, including our co-founders and certain of our directors, executive officers and holders of more than 5% of our voting securities. Please read the section titled "Management's Discussion and Analysis of Financial Condition and Results of Operations — Liquidity and Capital Resources" on page 68 and the section titled "Certain Relationships and Related Party Transactions — Series A Distributions" on page 113 for additional information about our remaining dividend obligations.
47
The following table sets forth our cash, cash equivalents and short-term investments and capitalization as of June 30, 2014, as follows:
- •
- on an actual basis;
- •
- on a pro forma basis, giving effect to (i) the consummation of the proposed Corporate Reorganization described in
the section titled "Organizational Structure," including a net adjustment of $0.3 million to accumulated (deficit)/retained earnings in connection with deferred income tax liabilities assumed
to be recognized in connection with the Corporate Reorganization, all presented as if these events had occurred as of June 30, 2014, (ii) the reclassification of all outstanding shares
of common stock, the conversion of all outstanding shares of preferred stock held by the selling stockholders into shares of Class B common stock prior to the completion of this offering and
the automatic conversion of all other outstanding shares of our preferred stock into shares of Class B common stock immediately upon the completion of this offering, (iii) an adjustment of
$13.3 million to reduce the carrying value of the convertible redeemable preferred units to reflect conversion value assuming the security was converted on the balance sheet date,
(iv) the distribution of accrued dividend amounts payable to certain holders of our Series A convertible redeemable preferred units upon conversion into shares of Class B common stock
equal to the members' distribution payable balance on our consolidated financial statements as of the completion of this offering, which amount was approximately $20.9 million as of
June 30, 2014, (v) equity compensation expense of approximately $40.3 million associated with the common option units, restricted stock units and restricted common units that have
satisfied the service condition as of June 30, 2014 and (vi) the net issuance of 925,949 shares of Class B common stock issuable upon the vesting of outstanding restricted
stock units in connection with this offering, net of minimum tax withholding obligations and the associated payment of cash, which amount was approximately $14.0 million as of June 30,
2014.
- •
- on a pro forma as adjusted basis, giving effect to the pro forma adjustments set forth above and the receipt of $258.3 million in proceeds from the sale and issuance by us of 10,500,000 shares of Class A common stock in this offering, based on the initial public offering price of $26.50 per share, the midpoint of the range listed on the cover page of this
48
prospectus, after deducting the estimated underwriting discount and estimated offering expenses payable by us.
| |
As of June 30, 2014 | |||||||||
|---|---|---|---|---|---|---|---|---|---|---|
| |
Actual
|
Pro Forma
|
Pro Forma as Adjusted |
|||||||
| |
(in thousands, except unit/share and per unit/share data) |
|||||||||
Cash and cash equivalents and short-term investments |
$ | 152,798 | $ | 117,902 | $ | 376,207 | ||||
| | | | | | | | | | | |
| | | | | | | | | | | |
Series A convertible redeemable preferred units, no par value per unit: 21,551,801 units authorized, 21,551,801 units outstanding, actual; no units authorized, issued and outstanding, pro forma and pro forma as adjusted |
$ | 235,486 | $ | — | $ | — | ||||
Series B convertible redeemable preferred units, no par value per unit: 5,995,133 units authorized, 5,995,133 units outstanding, actual; no units authorized, issued and outstanding, pro forma and pro forma as adjusted |
157,229 | — | — | |||||||
Members' (deficit)/Stockholders' equity: |
||||||||||
Common units, no par value per unit: 81,365,954 units authorized, 43,784,060 units issued and outstanding, actual; no units authorized, issued or outstanding, pro forma and pro forma as adjusted |
— | — | — | |||||||
Preferred stock, $0.001 par value; no shares authorized, issued or outstanding, actual and pro forma; 10,000,000 shares authorized, no shares issued or outstanding, pro forma as adjusted |
— | — | ||||||||
Class A common stock, $0.001 par value; no shares authorized, issued or outstanding, actual; 500,000,000 authorized, no shares issued or outstanding, pro forma; 500,000,000 shares authorized, 11,000,000 shares issued and outstanding, pro forma as adjusted |
— | 11 | ||||||||
Class B common stock, $0.001 par value; no shares authorized, issued or outstanding actual; 164,000,000 shares authorized, 72,256,943 shares issued and outstanding, pro forma; 71,756,943 shares issued and outstanding, pro forma as adjusted |
72 | 72 | ||||||||
Additional paid-in capital |
— | 107,623 | 365,917 | |||||||
Accumulated (deficit)/Retained earnings |
(277,134 | ) | (27,316 | ) | (27,316 | ) | ||||
Accumulated other comprehensive (loss) income |
(321 | ) | (321 | ) | (321 | ) | ||||
| | | | | | | | | | | |
Total member's (deficit)/stockholders' equity |
(277,455 | ) | 80,058 | 338,363 | ||||||
| | | | | | | | | | | |
Total capitalization |
$ | 115,260 | $ | 80,058 | $ | 338,363 | ||||
| | | | | | | | | | | |
| | | | | | | | | | | |
The foregoing table excludes:
- •
- 646,413 shares of Class B common stock issuable upon exercise of options to purchase common stock
outstanding as of June 30, 2014 under our 2010 Plan, at a weighted-average exercise price of $2.98 per share;
- •
- 4,630,834 shares of Class B common stock issuable from restricted stock units outstanding as of June 30, 2014 under our 2010 Plan; and
49
- •
- 8,603,066 shares of Class A common stock, subject to increase on an annual basis, reserved for future issuance under our 2014 Plan, which will become effective prior to the completion of this offering.
You should read this information in conjunction with our consolidated financial statements and the related notes appearing at the end of this prospectus and the "Management's Discussion and Analysis of Financial Condition and Results of Operations" section and other financial information contained in this prospectus.
Pursuant to the fourth amended and restated limited liability company agreement, dated March 5, 2014, as amended, of Wayfair LLC, or the LLC Agreement, we are required to make tax distributions to our stockholders to the extent we have taxable net income attributable to our stockholders. Accordingly we paid distributions to our stockholders in 2011 in an aggregate amount of approximately $6.2 million. In March 2014, we also distributed a portion of an accrued cash dividend to our Series A preferred stockholders in the aggregate amount of $15.0 million as further described in the section titled "Certain Relationships and Related Party Transactions — Series A Distributions." In addition, following our Corporate Reorganization and upon the completion of this offering, we intend to distribute the remaining portion of the cash dividend accrued as of the date of this offering to our existing Series A preferred stockholders, including our co-founders certain of our directors, executive officers and holders of more than 5% of our voting securities. Please read the section titled "Management's Discussion and Analysis of Financial Condition and Results of Operations—Liquidity and Capital Resources" for additional information about our remaining dividend obligations.
50
If you invest in our Class A common stock in this offering, your ownership interest will be immediately diluted to the extent of the difference between the initial public offering price per share and the pro forma as adjusted net tangible book value per share of our Class A common stock after this offering. Our pro forma net tangible book value as of June 30, 2014 was $71.5 million, or $0.99 per share of our Class A common stock. Pro forma net tangible book value per share represents our total tangible assets reduced by the amount of our total liabilities, divided by the total number of shares of our Class A common stock outstanding after giving effect to (1) the Corporate Reorganization, (2) the reclassification of all outstanding shares of common stock into Class B common stock, (3) the conversion of all outstanding shares of our preferred stock held by the selling stockholders into shares of Class B common stock, which will occur prior to the completion of this offering, (4) the automatic conversion of all other outstanding shares of our preferred stock into shares of our Class B common stock, which will occur immediately upon the completion of this offering, (5) the distribution of accrued dividend amounts payable to certain holders of our Series A convertible redeemable preferred units upon conversion into shares of Class B common stock equal to the members' distribution payable balance on our consolidated financial statements as of the completion of this offering, which amount was approximately $20.9 million as of June 30, 2014 and (6) the net issuance of 925,949 shares of Class B common stock issuable upon the vesting of outstanding restricted stock units in connection with this offering, net of minimum tax withholding obligations and the associated payment of cash, which amount was approximately $14.0 million as of June 30, 2014.
After giving effect to the sale of 10,500,000 shares of Class A common stock that we are offering at an assumed initial public offering price of $26.50 per share, which is the midpoint of the range listed on the cover page of this prospectus, and after deducting the estimated underwriting discount and estimated offering expenses payable by us, our pro forma as adjusted net tangible book value as of June 30, 2014 would have been approximately $329.8 million, or approximately $3.98 per share. This amount represents an immediate increase in pro forma net tangible book value of $2.99 per share to our existing stockholders and an immediate dilution in pro forma net tangible book value of approximately $22.52 per share to new investors purchasing shares of Class A common stock in this offering. We determine dilution by subtracting the pro forma as adjusted net tangible book value per share after this offering from the amount of cash that a new investor paid for a share of Class A common stock. The following table illustrates this dilution:
Assumed initial public offering price per share |
$ | 26.50 | |||||
Pro forma net tangible book value per share as of June 30, 2014 |
$ | 0.99 | |||||
Increase in net tangible book value per share attributable to this offering |
2.99 | ||||||
| | | | | | | | |
Pro forma as adjusted net tangible book value per share after this offering |
$ | 3.98 | |||||
| | | | | | | | |
Dilution in net tangible book value per share to new investors |
$ | 22.52 | |||||
| | | | | | | | |
| | | | | | | | |
A $1.00 increase (decrease) in the assumed initial public offering price of $26.50 per share, which is the midpoint of the range listed on the cover page of this prospectus, would increase (decrease) the pro forma as adjusted net tangible book value per share after this offering by approximately $0.13, and dilution in pro forma net tangible book value per share to new investors by approximately $0.88, assuming that the number of shares offered by us, as set forth on the cover page of this prospectus, remains the same and after deducting estimated underwriting discount and estimated offering expenses payable by us.
The following table summarizes, on a pro forma basis as of June 30, 2014, the differences between the number of shares purchased from us, the total consideration paid to us in cash and
51
the average price per share that existing owners and new investors paid. The calculation below is based on an assumed initial public offering price of $26.50 per share, which is the midpoint of the range listed on the cover page of this prospectus, before deducting the estimated underwriting discount and estimated offering expenses payable by us.
| |
Shares Purchased | Total Consideration | |
|||||||||||||
|---|---|---|---|---|---|---|---|---|---|---|---|---|---|---|---|---|
| |
Average Price Per Share |
|||||||||||||||
| |
Number
|
Percent
|
Amount
|
Percent
|
||||||||||||
Existing shareholders |
72,256,943 | 87.3 | % | $ | 358,514,677 | 56.3 | % | $ | 4.96 | |||||||
New investors |
10,500,000 | 12.7 | % | 278,250,000 | 43.7 | % | $ | 26.50 | ||||||||
| | | | | | | | | | | | | | | | | |
|
82,756,943 | 100.0 | % | $ | 636,764,677 | 100.0 | % | |||||||||
The foregoing tables and calculations are based on the number of shares of our Class A common stock outstanding as of June 30, 2014 after giving effect to (1) the Corporate Reorganization described in the section titled "Organizational Structure," (2) the reclassification of all outstanding shares of common stock into shares of Class B common stock, (3) the conversion of all outstanding shares of our preferred stock held by the selling stockholders into shares of Class B common stock upon the closing of this offering, (4) the net issuance of 925,949 shares of Class B common stock issuable upon the vesting of outstanding restricted stock units in connection with this offering, net of minimum tax withholding obligations as of June 30, 2014 and (5) the automatic conversion of all other outstanding shares of our preferred stock into shares of our Class B common stock, which will occur immediately upon the completion of this offering, and excludes:
- •
- 646,413 shares of Class B common stock issuable upon exercise of options to purchase common stock
outstanding as of June 30, 2014 under our 2010 Plan, at a weighted-average exercise price of $2.98 per share;
- •
- 4,630,834 shares of Class B common stock issuable from restricted stock units outstanding as of
June 30, 2014 under our 2010 Plan; and
- •
- 8,603,066 shares of Class A common stock, subject to increase on an annual basis, reserved for future issuance under our 2014 Plan, which will become effective prior to the completion of this offering.
To the extent any of these outstanding options are exercised or restricted stock units are converted into shares of Class B common stock, there will be further dilution to new investors. To the extent all of such outstanding options had been exercised and restricted stock units converted into shares of Class B common stock as of June 30, 2014, the pro forma as adjusted net tangible book value per share after this offering would be $3.77, and total dilution per share to new investors would be $22.73. We have not included 8,603,066 shares of our Class A common stock reserved for future issuance under our 2014 Plan in these calculations.
The foregoing table and calculations do not reflect any sales by existing stockholders in this offering. Sales by the selling stockholders in this offering will reduce the number of shares held by existing stockholders to 71,756,943 shares, or 86.7% of the total number of shares of our capital stock outstanding after this offering and will increase the number of shares of Class A common stock held by new investors to 11,000,000 shares, or 13.3% of the total number of shares of our capital stock outstanding after this offering, assuming the number of shares offered by the selling stockholders, as set forth on the cover of this prospectus, remains the same. In addition, if the underwriters exercise their option to purchase additional shares from the selling stockholders in full, the number of shares of Class B common stock held by the existing stockholders after this offering would be reduced to 70,106,943, or 84.7% of the total number of shares of our capital stock outstanding after this offering, and the number of shares of Class A common stock held by new investors would increase to 12,650,000, or 15.3%, of the total number of shares of our capital stock outstanding after this offering.
52
SELECTED CONSOLIDATED FINANCIAL DATA
You should read the following selected consolidated financial data below in conjunction with "Management's Discussion and Analysis of Financial Condition and Results of Operations" and the consolidated financial statements, related notes and other financial information included in this prospectus. The following consolidated statements of operations data for the six months ended June 30, 2013 and 2014 and the consolidated balance sheet data as of June 30, 2014 are derived from our unaudited consolidated financial statements included elsewhere in this prospectus. The following consolidated statements of operations data for the years ended December 31, 2012 and 2013 and the consolidated balance sheet data as of December 31, 2012 and 2013 are derived from our audited consolidated financial statements included elsewhere in this prospectus. The following consolidated statements of operations data for the year ended December 31, 2011 and the consolidated balance sheet data as of December 31, 2011 are derived from our unaudited consolidated financial statements which are not included elsewhere in this prospectus. Historical results are not necessarily indicative of the results to be expected in the future.
| |
Years ended December 31, | Six months ended June 30, |
||||||||||||||
|---|---|---|---|---|---|---|---|---|---|---|---|---|---|---|---|---|
| |
2011
|
2012
|
2013
|
2013
|
2014
|
|||||||||||
| |
(in thousands, except share and per share data) |
|||||||||||||||
Consolidated Statements of Operations: |
||||||||||||||||
Net revenue |
$ | 517,336 | $ | 601,028 | $ | 915,843 | $ | 383,208 | $ | 574,144 | ||||||
Cost of goods sold |
385,824 | 455,879 | 691,602 | 288,337 | 440,483 | |||||||||||
| | | | | | | | | | | | | | | | | |
Gross profit |
131,512 | 145,149 | 224,241 | 94,871 | 133,661 | |||||||||||
Operating expenses: |
||||||||||||||||
Sales and marketing |
106,794 | 113,370 | 177,475 | 72,714 | 138,228 | |||||||||||
General and administrative |
36,772 | 52,961 | 62,246 | 30,014 | 46,355 | |||||||||||
Amortization of acquired intangible assets |
— | 212 | 539 | 106 | 499 | |||||||||||
| | | | | | | | | | | | | | | | | |
Total operating expenses |
143,566 | 166,543 | 240,260 | 102,834 | 185,082 | |||||||||||
| | | | | | | | | | | | | | | | | |
Loss from operations |
(12,054 | ) | (21,394 | ) | (16,019 | ) | (7,963 | ) | (51,421 | ) | ||||||
Interest income, net |
157 | 234 | 245 | 124 | 133 | |||||||||||
Gain on joint venture acquisition |
1,425 | — | — | — | — | |||||||||||
Other (expense) income, net |
(675 | ) | 155 | 294 | (504 | ) | (96 | ) | ||||||||
| | | | | | | | | | | | | | | | | |
Loss before income taxes |
(11,147 | ) | (21,005 | ) | (15,480 | ) | (8,343 | ) | (51,384 | ) | ||||||
Provision for income taxes |
(22 | ) | (50 | ) | (46 | ) | 5 | (17 | ) | |||||||
| | | | | | | | | | | | | | | | | |
Net loss |
$ | (11,169 | ) | $ | (21,055 | ) | $ | (15,526 | ) | $ | (8,338 | ) | $ | (51,401 | ) | |
Accretion of convertible redeemable preferred units |
(9,337 | ) | (12,154 | ) | (25,388 | ) | (15,948 | ) | (11,755 | ) | ||||||
| | | | | | | | | | | | | | | | | |
Net loss attributable to common unit holders |
(20,506 | ) | (33,209 | ) | (40,914 | ) | (24,286 | ) | (63,156 | ) | ||||||
Net loss attributable to common unit holders per unit — basic and diluted |
$ |
(0.50 |
) |
$ |
(0.80 |
) |
$ |
(0.99 |
) |
$ |
(0.59 |
) |
$ |
(1.55 |
) |
|
| | | | | | | | | | | | | | | | | |
| | | | | | | | | | | | | | | | | |
Weighted average number of common units outstanding used in computing per unit amounts — basic and diluted |
41,271,992 | 41,271,992 | 41,331,546 | 41,271,992 | 40,828,976 | |||||||||||
| | | | | | | | | | | | | | | | | |
| | | | | | | | | | | | | | | | | |
Pro forma net loss per share — basic and diluted (unaudited) |
$ | (0.87 | ) | $ | (0.89 | ) | ||||||||||
| | | | | | | | | | | | | | | | | |
| | | | | | | | | | | | | | | | | |
Pro forma weighted average number of common shares outstanding (unaudited)(1) |
66,399,733 | 70,416,261 | ||||||||||||||
| | | | | | | | | | | | | | | | | |
| | | | | | | | | | | | | | | | | |
53
| |
December 31, | |
|||||||||||
|---|---|---|---|---|---|---|---|---|---|---|---|---|---|
| |
June 30, 2014 |
||||||||||||
| |
2011
|
2012
|
2013
|
||||||||||
| |
(in thousands) |
||||||||||||
Consolidated Balance Sheet Data: |
|||||||||||||
Cash and cash equivalents and short-term investments |
$ | 67,045 | $ | 100,878 | $ | 115,308 | $ | 152,798 | |||||
Working capital |
32,795 | 42,031 | 18,118 | 68,706 | |||||||||
Total assets |
118,866 | 163,577 | 196,300 | 277,018 | |||||||||
Deferred revenue |
9,006 | 12,282 | 13,397 | 18,033 | |||||||||
Convertible redeemable preferred units |
167,480 | 215,798 | 241,186 | 392,715 | |||||||||
Total members' deficit |
$ | (117,736 | ) | $ | (150,791 | ) | $ | (190,839 | ) | $ | (277,455 | ) | |
- (1)
- The pro forma weighted average number of shares of common stock outstanding gives effect to the automatic conversion of all of our outstanding preferred stock into common stock upon the closing of this offering.
54
MANAGEMENT'S DISCUSSION AND ANALYSIS OF
FINANCIAL CONDITION AND RESULTS OF OPERATIONS
You should read the following discussion and analysis of our financial condition and results of operations together with the "Selected Consolidated Financial Data" section of this prospectus and our consolidated financial statements and related notes appearing elsewhere in this prospectus. Our consolidated financial statements have been prepared in accordance with generally accepted accounting principles in the United States, or GAAP. This discussion contains forward-looking statements that involve risks and uncertainties. As a result of many factors, such as those set forth under the "Risk Factors" and "Special Note Regarding Forward-Looking Statements" sections and elsewhere in this prospectus, our actual results may differ materially from those anticipated in these forward-looking statements.
Overview
We are transforming the way people shop for their homes. Through our e-commerce business model, we offer visually inspiring browsing, compelling merchandising, easy product discovery and attractive prices for over seven million products from over 7,000 suppliers across five distinct brands — Wayfair.com, Joss & Main, AllModern, DwellStudio and Birch Lane. Our typical Wayfair customer is a 35 to 65 year old woman with an annual household income of $60,000 to $175,000, who we consider to be a mass market consumer and who we believe is underserved by traditional brick and mortar and other online retailers of home goods. Because each of our customers has a different taste, style, purchasing goal and budget when shopping for her home, we have built one of the largest online selections of furniture, home furnishings, décor and goods. We are able to offer this vast selection of products while holding minimal inventory because we typically ship products directly from our suppliers to our customers. This supplier direct fulfillment network is a key component of our custom-built and seamlessly integrated technology and operational platform, which also includes extensive supplier integrations, a proprietary transportation delivery network and superior customer service.
We founded our company in May 2002 and have since delivered nearly 13 million orders. From 2002 through 2011, the company was bootstrapped by our co-founders and operated as hundreds of niche websites, such as bedroomfurniture.com and allbarstools.com. In 2006, we launched AllModern. From 2003 to 2011, we grew our net revenue organically from $7.7 million to $517.3 million, representing a 69.2% CAGR. In late 2011, we made the strategic decision to close and permanently redirect over 240 of our niche websites into Wayfair.com to create a one-stop shop for furniture, home furnishings, décor and goods and to build brand awareness, drive customer loyalty and increase repeat purchasing. We also changed our name from CSN Stores LLC to Wayfair LLC. Additionally, we expanded our multi-brand strategy beyond our then existing brands — Wayfair.com and AllModern — by launching Joss & Main. In 2013, we acquired DwellStudio, and in 2014, we launched Birch Lane. We plan to continue expanding our existing brand portfolio and may opportunistically launch new brands. When launching new brands, we expect to leverage our experiences, insights, customer data, merchandising expertise, technology platform, operational platform and supplier base to create desired brands for our customers with minimal upfront capital. We may also continue to expand our business through opportunistic acquisitions that allow us to enhance our customer offering, build our multi-brand portfolio, enter new geographies or enhance our operational infrastructure.
Our strong customer loyalty and deep supplier relationships have helped us grow our Direct Retail sales, which we define as sales generated primarily through the sites of our five brands. In 2013 and the six months ended June 30, 2014, we generated Direct Retail net revenue of $673.4 million and $469.5 million, respectively, an increase of 73.0% and 75.0%, respectively, over our Direct Retail net revenue of $389.3 million and $268.4 million in 2012 and the six months ended
55
June 30, 2013, respectively. In 2013, we delivered 3.3 million orders for 2.1 million Direct Retail active customers, representing increases of 85.2% and 61.0%, respectively, over 2012. In the six months ended June 30, 2014, we delivered 2.2 million orders representing an increase of 76.6% over the six months ended June 30, 2013. In the six months ended June 30, 2014, we had 2.6 million Direct Retail active customers representing an increase of 75.0% over the six months ended June 30, 2013.
We have built extensive supplier integrations, management tools and processes that allow us to efficiently onboard and manage suppliers of any size, type and sophistication level. We continue to seek new suppliers with compelling products to add to our selection of home goods. We offer fast and reliable delivery to our customers via our proprietary transportation delivery network for certain large parcels or FedEx, UPS, the U.S. Postal Service and other carriers for smaller parcels and we leverage our scale to reduce shipping costs. In the first six months of 2014, we shipped orders within North America in an average of 2.4 days, despite different handling requirements and complexities for large and small parcel items.
We plan to grow our customer base by attracting more unique visitors to our sites through two main strategies — increasing brand awareness and expanding direct online marketing — and then converting those visitors to active customers. Our online efforts are focused on building brand awareness to drive visitor traffic via direct navigation, search engine optimization and email marketing campaigns. In addition, we have made significant investments to improve the consumer experience on our sites, such as creating highly engaging visual imagery and merchandising, as well as easy-to-use navigation tools and personalization features that enable better product discovery. We plan to continue investing in our infrastructure, including enhancing our merchandising, data, analytics, and technology platform, as well as developing additional logistics and transportation solutions, self-service tools for our suppliers, fulfillment offerings and enhancing our development, testing and deployment systems.
Mobile is an increasingly important part of our business, especially for Joss & Main. We have invested in mobile technology to optimize the shopping experience across our sites for use on the majority of mobile devices. We launched mobile applications for Joss & Main in 2012 and Wayfair.com in 2014. In the first six months of 2014, 43.5% of Joss & Main orders delivered and 27.9% of all Direct Retail orders delivered were placed from a mobile device, up from 35.8% and 21.3%, respectively, in the first six months of 2013.
Until late 2012, we were primarily focused on growing our U.S. business. In 2012, we began laying the groundwork for our international business by building our international infrastructure, developing deeper country-specific knowledge, building international supplier networks and establishing our brand presence in select international regions. We currently deliver products to customers in a number of countries, including the United States, the United Kingdom, Canada, Australia, Germany, France, Austria, Ireland and New Zealand. We intend to expand in these countries, especially Joss & Main, which we launched in the United Kingdom, France and Germany in 2014. In 2013 and the six months ended June 30, 2014, we generated net revenue outside of North America of $41.5 million and $25.2 million, or 4.5% and 4.4% of our total net revenue, respectively.
In 2013 and the six months ended June 30, 2014, we generated net revenue of $915.8 million and $574.1 million, respectively, up 52.4% and 49.8% over 2012 and the six months ended June 30, 2013, respectively. Our net revenue in 2013 and the six months ended June 30, 2014 included $673.4 million and $469.5 million, respectively, from Direct Retail and $242.4 million and $104.6, respectively, from Other, which we define as net revenue generated primarily online through third parties, which we refer to as our retail partners and net revenue from third-party advertisers. In 2013, we generated a net loss of $15.5 million and Adjusted EBITDA of $(2.9) million,
56
improvements of $5.5 million and $9.1 million, respectively, over 2012. In the six months ended June 30, 2014, we generated a net loss of $51.4 million and Adjusted EBITDA of $(37.0) million, increases of $43.1 million and $34.9 million, respectively, over the six months ended June 30, 2013. Our net loss and Adjusted EBITDA results were driven primarily by our increased investment in advertising in 2012, 2013, and the six months ended June 30, 2014. See "Key Financial and Operating Metrics" below for further discussion of Adjusted EBITDA, our use of this measure, the limitations of this measure as an analytical tool and the reconciliation of Adjusted EBITDA to net loss, the most directly comparable GAAP financial measure.
Key Financial and Operating Metrics
We measure our business using both financial and operating metrics. Our net revenue, Adjusted EBITDA and free cash flow metrics are measured on a consolidated basis. All other key financial and operating metrics are derived and reported from our Direct Retail sales, which includes sales generated primarily through the sites of our five distinct brands. These metrics do not include net revenue derived from the sites operated by our retail partners. We do not have access to certain customer level information on net revenue derived through our retail partners and therefore cannot measure or disclose it.
We use the following metrics to assess the near-term and longer-term performance of our overall business.
| |
Years ended December 31, |
Six months ended June 30, |
% Change December 31, |
% Change June 30, |
|||||||||||||||
|---|---|---|---|---|---|---|---|---|---|---|---|---|---|---|---|---|---|---|---|
| |
2012
|
2013
|
2013
|
2014
|
2012 to 2013
|
2013 to 2014
|
|||||||||||||
| |
(in thousands, except Average Order Value and LTM Net Revenue Per Active Customer) |
|
|
||||||||||||||||
Consolidated Financial Metrics |
|||||||||||||||||||
Net Revenue |
$ | 601,028 | $ | 915,843 | $ | 383,208 | $ | 574,144 | 52.4 | % | 49.8 | % | |||||||
Adjusted EBITDA |
$ | (12,059 | ) | $ | (2,928 | ) | $ | (2,100 | ) | $ | (37,002 | ) | |||||||
Free Cash Flow |
$ | (11,035 | ) | $ | 18,643 | $ | (13,275 | ) | $ | (70,250 | ) | ||||||||
Direct Retail Financial and Operating Metrics |
|||||||||||||||||||
Direct Retail Net Revenue |
$ | 389,290 | $ | 673,446 | $ | 268,366 | $ | 469,534 | 73.0 | % | 75.0 | % | |||||||
Active Customers |
1,299 | 2,092 | 1,506 | 2,635 | 61.0 | % | 75.0 | % | |||||||||||
LTM Net Revenue Per Active Customer |
$ | 300 | $ | 322 | $ | 313 | $ | 332 | 7.3 | % | 6.1 | % | |||||||
Orders Delivered |
1,789 | 3,314 | 1,258 | 2,222 | 85.2 | % | 76.6 | % | |||||||||||
Average Order Value |
$ | 218 | $ | 204 | $ | 213 | $ | 211 | (6.4 | )% | (0.9 | )% | |||||||
Non-GAAP Financial Measures
Adjusted EBITDA
To provide investors with additional information regarding our financial results, we have disclosed here and elsewhere in this prospectus Adjusted EBITDA, a non-GAAP financial measure that we calculate as earnings (loss) before depreciation and amortization, equity-based compensation, interest and other income and expense and taxes. We have provided a reconciliation below of Adjusted EBITDA to net loss, the most directly comparable GAAP financial measure.
We have included Adjusted EBITDA in this prospectus because it is a key measure used by our management and board of managers to evaluate our operating performance, generate future operating plans and make strategic decisions regarding the allocation of capital. In particular, the exclusion of certain expenses in calculating Adjusted EBITDA facilitates operating performance comparisons on a period-to-period basis. Accordingly, we believe that Adjusted EBITDA provides useful information to investors and others in understanding and evaluating our operating results in the same manner as our management and board of managers.
57
Adjusted EBITDA has limitations as an analytical tool, and you should not consider it in isolation or as a substitute for analysis of our results as reported under GAAP. Some of these limitations are:
- •
- although depreciation and amortization are non-cash charges, the assets being depreciated and amortized may have to be
replaced in the future, and Adjusted EBITDA does not reflect cash capital expenditure requirements for such replacements or for new capital expenditure requirements;
- •
- Adjusted EBITDA does not reflect the compensation charge associated with a tender offer we completed in April 2014 as
described in the section titled "Management's Discussion and Analysis of Financial Condition and Results of Operations — Liquidity and Capital Resources," or our 2014 Tender Offer;
- •
- Adjusted EBITDA does not reflect changes in our working capital;
- •
- Adjusted EBITDA does not reflect tax payments that may represent a reduction in cash available to us;
and
- •
- Other companies, including companies in our industry, may calculate Adjusted EBITDA differently, which reduces its usefulness as a comparative measure.
Because of these limitations, you should consider Adjusted EBITDA alongside other financial performance measures, including various cash flow metrics, net (loss) income and our other GAAP results.
The following table reflects the reconciliation of net loss to Adjusted EBITDA for each of the periods indicated:
| |
Years ended December 31, |
Six months ended June 30, |
|||||||||||
|---|---|---|---|---|---|---|---|---|---|---|---|---|---|
| |
2012
|
2013
|
2013
|
2014
|
|||||||||
| |
(in thousands) |
||||||||||||
Reconciliation of Adjusted EBITDA |
|||||||||||||
Net loss |
$ | (21,055 | ) | $ | (15,526 | ) | $ | (8,338 | ) | $ | (51,401 | ) | |
Depreciation and amortization |
9,335 | 13,091 | 5,863 | 8,891 | |||||||||
Equity-based compensation |
— | — | — | 5,528 | |||||||||
Interest income, net |
(234 | ) | (245 | ) | (124 | ) | (133 | ) | |||||
Other (expense) income, net |
(155 | ) | (294 | ) | 504 | 96 | |||||||
Taxes |
50 | 46 | (5 | ) | 17 | ||||||||
| | | | | | | | | | | | | | |
Adjusted EBITDA |
$ | (12,059 | ) | $ | (2,928 | ) | $ | (2,100 | ) | $ | (37,002 | ) | |
| | | | | | | | | | | | | | |
| | | | | | | | | | | | | | |
Free Cash Flow
To provide investors with additional information regarding our financial results, we have also disclosed here and elsewhere in this prospectus free cash flow, a non-GAAP financial measure that we calculate as net cash (used in) provided by operating activities less net cash used to purchase property and equipment including leasehold improvements and site and software development costs. We have provided a reconciliation below of free cash flow to net cash (used in) provided by operating activities, the most directly comparable GAAP financial measure.
We have included free cash flow in this prospectus because it is an important indicator of our business performance as it measures the amount of cash we generate. Accordingly, we believe that free cash flow provides useful information to investors and others in understanding and evaluating our operating results in the same manner as our management.
58
Free cash flow has limitations as an analytical tool, and you should not consider it in isolation or as a substitute for analysis of our results as reported under GAAP. There are limitations to using non-GAAP financial measures, including that other companies, including companies in our industry, may calculate free cash flow differently. Because of these limitations, you should consider free cash flow alongside other financial performance measures, including net cash (used in) provided by operating activities, capital expenditures and our other GAAP results.
The following table presents a reconciliation of free cash flow to net cash provided by operating activities for each of the periods indicated:
| |
Years ended December 31, |
Six months ended June 30, |
|||||||||||
|---|---|---|---|---|---|---|---|---|---|---|---|---|---|
| |
2012
|
2013
|
2013
|
2014
|
|||||||||
| |
(in thousands) |
||||||||||||
Net cash provided by operating activities, net of acquisition |
$ | 3,945 | $ | 34,413 | $ | (5,907 | ) | $ | (39,771 | ) | |||
Purchase of property, equipment, and leasehold improvements |
(8,031 | ) | (6,739 | ) | (3,301 | ) | (24,331 | ) | |||||
Site and software development costs |
(6,949 | ) | (9,040 | ) | (4,067 | ) | (6,148 | ) | |||||
| | | | | | | | | | | | | | |
Free cash flow |
$ | (11,035 | ) | $ | 18,634 | $ | (13,275 | ) | $ | (70,250 | ) | ||
| | | | | | | | | | | | | | |
| | | | | | | | | | | | | | |
Key Operating Metrics (Direct Retail)
Active Customers
As of the last date of each reported period, we determine our number of active customers by counting the total number of individual customers who have purchased at least once directly from our sites during the preceding twelve-month period. The change in active customers in a reported period captures both the inflow of new customers as well as the outflow of existing customers who have not made a purchase in the last twelve months. We view the number of active customers as a key indicator of our growth.
LTM Net Revenue Per Active Customer
We define LTM net revenue per active customer as our total net revenue derived from Direct Retail sales in the last twelve months divided by our total number of active customers for the same preceding twelve-month period. We view LTM net revenue per active customer as a key indicator of our customers' purchasing patterns, including their initial and repeat purchase behavior.
Orders Delivered
We define orders delivered as the total Direct Retail orders delivered in any period, inclusive of orders that may eventually be returned. As we ship a large volume of packages through multiple carriers, actual delivery dates may not always be available, and as such we estimate delivery dates based on historical data. We recognize net revenue when an order is delivered and therefore orders delivered, together with average order value, is an indicator of the net revenue we expect to recognize in a given period. We view orders delivered as a key indicator of our growth.
Average Order Value
We define average order value as total Direct Retail net revenue in a given period divided by the orders delivered in that period. We view average order value as a key indicator of the mix of products on our sites, the mix of offers and promotions and the purchasing behavior of our customers.
59
Factors Affecting our Performance
We believe that our performance and future success depend on a number of factors that present significant opportunities for us but also pose risks and challenges, including those discussed below and in the section titled "Risk Factors" on page 14.
Growth in Brand Awareness and Visitors to our Sites
We intend to continue investing in our brand awareness strategy and direct online marketing efforts. In late 2011, we made a strategic decision to close and permanently redirect over 240 of our niche websites into Wayfair.com. Since late 2011, we have marketed our brands, in particular Wayfair.com, through TV advertising, display advertising, paid search advertising, social media advertising and direct mail, catalog and print advertising. Since the launch of Wayfair.com and our rebranding effort in late 2011, our aided brand awareness has increased to 52% in August 2014, according to Hanover Research, a market research firm. Failure to cost-effectively attract new visitors to our sites and convert them into customers would adversely affect our net revenue growth and operating results.
Growth in Customer Acquisition and Customer Retention
Our goal is to convert visitors into active customers and then encourage repeat purchases. Orders from repeat customers increased from 37.4% of orders delivered in 2012 to 47.2% of orders delivered in 2013, increasing our operating leverage since it costs more to acquire a customer than to retain one. Our continued investments in infrastructure, including enhancing our merchandising, data, analytics, and technology platform, allow us to deliver increasingly tailored and personalized shopping experiences for customers across our sites. We believe our focus on a personalized shopping experience drives sales from new customers as well as repeat customers.
To illustrate how the costs of acquiring customers and their contribution to our operating results have trended over time, we analyzed metrics across two separate periods. We analyzed the amount we spent on advertising to attract new consumers to our sites in North America in the third quarters of 2011 and 2013. Once the consumers provide their email addresses in any given quarter, we track the date each consumer becomes a customer by making a first purchase on one of our sites, as well as each customer's repeat purchasing behavior and the break-even date on our advertising spend.
We chose the third quarter of 2011 and the third quarter of 2013 to illustrate the evolution of our advertising and customer acquisition strategies following our strategic decision in 2011 to close and permanently redirect over 240 of our niche websites into Wayfair.com. Prior to that strategic shift, we targeted a shorter payback period because we were focused on acquiring customers with immediate purchasing needs. Following our strategic shift and the introduction of our flash sales site Joss & Main, we began to focus on acquiring customers with a higher lifetime value, greater
60
brand loyalty and potential for long-term repeat purchasing, but with a longer payback period. Beginning with the third quarter of 2013, our results reflect the ongoing transition to this strategy.
| |
Third Quarter of 2011(1) |
Third Quarter of 2013(1) |
|||
|---|---|---|---|---|---|
Advertising spend (in thousands) |
$8,797 | $20,966 | |||
Customers activated(2) |
246,960 | 469,850 | |||
Acquisition cost per customer |
$36 | $45 | |||
Net revenue per customer |
$273 | $327 | |||
Repeat rate(3) |
15.9% | 24.2% | |||
Break-even date(4) |
September 15, 2011 | October 31, 2013 |
- (1)
- This
analysis is based on orders shipped.
- (2)
- Customers
activated are consumers who provided their email address during the quarter and made their first purchase on one of our sites during the quarter
or the subsequent 270 days.
- (3)
- For
this analysis, repeat rate reflects the number of customers in this analysis who have purchased from the same site at least twice during the quarter and
the subsequent 270 days.
- (4)
- The break-even date is the date that the contribution generated by our customers equals the amount we spent on advertising within the respective quarter. For the purpose of this analysis, we use an approximation for contribution margin of 20% of net revenue, which is consistent with our historical performance. Contribution margin is a non-GAAP financial measure that we define as gross profit less customer service costs and merchant processing fees.
Revenue Growth Through Mobile Platform
Mobile is an increasingly important part of our business, especially for Joss & Main. We launched our mobile applications for Joss & Main in 2012 and Wayfair.com in 2014. In the first six months of 2014, 43.5% of Joss & Main orders delivered and 27.9% of all Direct Retail orders delivered were placed from a mobile device, up from 35.8% and 21.3%, respectively, in the first six months of 2013. Due to the relative newness of smartphones, tablets, and mobile shopping in general, we do not know if this increase in mobile use will continue.
Investment In Growth
We have aggressively invested in the growth of our business and this investment will continue. We anticipate that our operating expenses will increase substantially as we continue to increase our advertising spending, hire additional personnel primarily in merchandising, technology, operations, customer service and general and administrative functions and continue to develop features on our sites. In 2013, we signed a lease to increase our office space, and in 2014 we further increased the office space to accommodate the anticipated growth of our headcount in our corporate headquarters. These investments are expected to increase our losses near term and yield returns in the long term, but there is no guarantee that we will be able to realize the return on our investments.
61
Components of Our Results of Operations
Net Revenue
Net revenue consists primarily of sales of product from our sites and through the sites of our online retail partners and includes related shipping fees. We deduct cash discounts, allowances, rewards and estimated returns from gross revenue to determine net revenue. We recognize product revenue upon delivery to our customers. Net revenue is primarily driven by growth of new and active customers and the frequency with which customers purchase. The products offered on our sites are primarily fulfilled with product we ship to our customers directly from our suppliers and, to a lesser extent, from our fulfillment centers.
We also generate net revenue through third-party advertisers that pay us based on the number of advertisement related clicks, actions, or impressions for advertisements placed on our sites. Net revenue earned under these arrangements is included in net revenue and is recognized in the period in which the click, action or impression occurs. This revenue has not been material to date.
We maintain a membership rewards program that allows enrolled customers to earn points which can be redeemed on future purchases. We defer the portion of our revenue associated with rewards which are expected to be redeemed prior to its expiration.
Cost of Goods Sold
Cost of goods sold consists of the cost of product sold to customers, shipping and handling costs and shipping supplies and fulfillment costs. Fulfillment costs include costs incurred in operating and staffing the fulfillment centers, such as costs attributed to receiving, inspecting, picking, packaging and preparing customer orders for shipment. Cost of goods sold also includes direct and indirect labor costs for fulfillment center oversight, including payroll and related benefit costs. The increase in cost of goods sold is primarily driven by growth in orders delivered, the mix of the product available for sale on our sites and transportation costs related to delivering orders to our customers.
We earn rebates on our incentive programs with our suppliers. These rebates are earned upon shipment of goods. Amounts due from suppliers as a result of these rebate programs are included as a receivable and are reflected as a reduction of cost of goods sold on the consolidated statements of operations. We expect cost of goods sold expenses to remain relatively stable as a percentage of net revenue.
Sales and Marketing
Sales and marketing expenses consist primarily of direct response performance marketing costs, such as television advertising, display advertising, paid search advertising, social media advertising, search engine optimization, comparison shopping engine advertising, direct mail, catalog and print advertising. Sales and marketing expenses also include labor-related costs for our employees involved in sales and marketing and customer service activities, merchant processing fees and partner advertising fees. Sales and marketing expenses are primarily driven by investments to grow and retain our customer base. We expect marketing expenses to continue to increase but decrease as a percentage of net revenue over time.
General and Administrative
General and administrative expenses consist primarily of labor-related costs for administrative, engineering, merchandising, human resources, finance and accounting personnel, professional service fees including audit and legal fees, insurance and other corporate expenses, including
62
depreciation and rent. We anticipate that we will incur additional personnel expenses, professional service fees, including audit and legal, investor relations, costs of compliance with securities laws and regulations, and higher director and officer insurance costs related to operating as a public company. In addition, as we continue to grow as a company, we expect that our general and administrative expenses will continue to increase but decrease as a percentage of net revenue over time.
Amortization of Acquired Intangible Assets
We have recorded identifiable intangible assets in conjunction with our acquisitions and are amortizing those assets over their estimated useful lives. We perform impairment testing of goodwill and intangibles with definite lives annually and whenever events or circumstances indicate that impairment may have occurred.
Interest (Expense) Income, Net
Interest (expense) income, net consists primarily of interest earned on cash, cash equivalents and short-term investments held by us.
Other (Expense) Income, Net
Other (expense) income, net consist primarily foreign currency gains (losses).
Results of Consolidated Operations
The following tables set forth our results of operations for the periods presented and express the relationship of certain line items as a percentage of net revenue for those periods. The period-to-period comparison of financial results is not necessarily indicative of future results.
| |
Years ended December 31, |
Six months ended June 30, |
|||||||||||
|---|---|---|---|---|---|---|---|---|---|---|---|---|---|
| |
2012 | 2013 | 2013 | 2014 | |||||||||
| |
(in thousands) |
||||||||||||
Consolidated Statements of Operations: |
|||||||||||||
Net revenue |
$ | 601,028 | $ | 915,843 | $ | $383,208 | $ | $574,144 | |||||
Cost of goods sold |
455,879 | 691,602 | 288,337 | 440,483 | |||||||||
| | | | | | | | | | | | | | |
Gross profit |
145,149 | 224,241 | 94,871 | 133,661 | |||||||||
Operating expenses: |
|||||||||||||
Sales and marketing |
113,370 | 177,475 | 72,714 | 138,228 | |||||||||
General and administrative |
52,961 | 62,246 | 30,014 | 46,355 | |||||||||
Amortization of acquired intangible assets |
212 | 539 | 106 | 499 | |||||||||
| | | | | | | | | | | | | | |
Total operating expenses |
166,543 | 240,260 | 102,834 | 185,082 | |||||||||
| | | | | | | | | | | | | | |
Loss from operations |
(21,394 | ) | (16,019 | ) | (7,963 | ) | (51,421 | ) | |||||
Interest income, net |
234 | 245 | 124 | 133 | |||||||||
Other (expense) income, net |
155 | 294 | (504 | ) | (96 | ) | |||||||
| | | | | | | | | | | | | | |
Loss before income taxes |
(21,005 | ) | (15,480 | ) | (8,343 | ) | (51,384 | ) | |||||
Provision for income taxes |
(50 | ) | (46 | ) | 5 | (17 | ) | ||||||
| | | | | | | | | | | | | | |
Net loss |
$ | (21,055 | ) | $ | (15,526 | ) | $ | (8,338 | ) | $ | (51,401 | ) | |
| | | | | | | | | | | | | | |
| | | | | | | | | | | | | | |
63
| |
Years ended December 31, |
Six months ended June 30, |
|||||||||||
|---|---|---|---|---|---|---|---|---|---|---|---|---|---|
| |
2012
|
2013
|
2013
|
2014
|
|||||||||
Consolidated Statements of Operations: |
|||||||||||||
Net revenue |
100.0 | % | 100.0 | % | 100.0 | % | 100.0 | % | |||||
Cost of goods sold |
75.8 | 75.5 | 75.2 | % | 76.7 | % | |||||||
| | | | | | | | | | | | | | |
Gross profit |
24.2 | 24.5 | 24.8 | % | 23.3 | % | |||||||
Operating expenses: |
|||||||||||||
Sales and marketing |
18.9 | 19.4 | 19.0 | % | 24.1 | % | |||||||
General and administrative |
8.8 | 6.8 | 7.8 | % | 8.0 | % | |||||||
Amortization of acquired intangible assets |
0.0 | 0.0 | 0.0 | % | 0.1 | % | |||||||
| | | | | | | | | | | | | | |
Total operating expenses |
27.7 | 26.2 | 26.8 | % | 32.2 | % | |||||||
| | | | | | | | | | | | | | |
Loss from operations |
(3.6 | ) | (1.7 | ) | (2.1 | )% | (8.9 | )% | |||||
Interest income, net |
0.0 | 0.0 | 0.0 | % | 0.0 | % | |||||||
Other (expense) income, net |
0.0 | 0.0 | (0.1 | )% | 0.0 | % | |||||||
| | | | | | | | | | | | | | |
Loss before income taxes |
(3.5 | ) | (1.7 | ) | (2.2 | )% | (8.9 | )% | |||||
Provision for income taxes |
0.0 | 0.0 | 0.0 | % | 0.0 | % | |||||||
| | | | | | | | | | | | | | |
Net loss |
(3.5 | )% | (1.7 | )% | (2.2 | )% | (8.9 | )% | |||||
| | | | | | | | | | | | | | |
| | | | | | | | | | | | | | |
Comparison of six months ended June 30, 2014 and 2013
Net revenue
| |
Six months ended June 30, |
% Change | ||||||||
|---|---|---|---|---|---|---|---|---|---|---|
| |
2013 to 2014
|
|||||||||
| |
2013
|
2014
|
||||||||
| |
(in thousands) |
|
||||||||
Direct Retail |
$ | 268,366 | $ | 469,534 | 75.0 | % | ||||
Other |
114,842 | 104,610 | (8.9 | )% | ||||||
| | | | | | | | | | | |
Net revenue |
$ | 383,208 | $ | 574,144 | 49.8 | % | ||||
| | | | | | | | | | | |
| | | | | | | | | | | |
In the six months ended June 30, 2014, net revenue increased by $190.9 million, or 49.8% compared to the six months ended June 30, 2013, primarily as a result of an increase in Direct Retail net revenue. In the six months ended June 30, 2014, Direct Retail net revenue increased by $201.2 million, or 75.0% compared to the six months ended June 30, 2013. The increase in Direct Retail net revenue was primarily due to sales to a larger customer base, as the number of active customers increased 75% in the six months ended June 30, 2014 compared to the six months ended June 30, 2013. Additionally, LTM net revenue per active customer increased 6.1% in the six months ended June 30, 2014 compared with the six months ended June 30, 2013. The decrease in Other revenue was primarily due to decreased sales through our retail partners.
64
Cost of Goods Sold
| |
|
|
% Change | |||||||
|---|---|---|---|---|---|---|---|---|---|---|
| |
Six months ended June 30, |
|||||||||
| |
2013 to 2014 | |||||||||
| |
2013
|
2014
|
||||||||
| |
(in thousands) |
|
||||||||
Cost of goods sold |
$ | 288,337 | $ | 440,483 | 52.8 | % | ||||
As a percentage of net revenue |
75.2 | % | 76.7 | % | ||||||
In the six months ended June 30, 2014, costs of goods sold increased by $152.1 million, or 52.8%, compared to the six months ended June 30, 2013. Of the increase in cost of goods sold, $121.0 million was due to the increase in products sold to our larger customer base. In addition, shipping and fulfillment costs increased $31.1 million as a result of the increase in products sold during the period. Costs of goods sold as a percentage of net revenue increased in the six months ended June 30, 2014 compared to the six months ended June 30, 2013 as a result of changes in our pricing and the mix of the products sold.
Operating Expenses
| |
Six months ended June 30, |
% Change | ||||||||
|---|---|---|---|---|---|---|---|---|---|---|
| |
2013 to 2014
|
|||||||||
| |
2013
|
2014
|
||||||||
| |
(in thousands) |
|
||||||||
Sales and marketing |
$ | 72,714 | $ | 138,228 | 90.1 | % | ||||
General and administrative |
30,014 | 46,355 | 54.4 | % | ||||||
Amortization of acquired intangible assets |
106 | 499 | 370.8 | % | ||||||
| | | | | | | | | | | |
|
$ | 102,834 | $ | 185,082 | 80.0 | % | ||||
| | | | | | | | | | | |
| | | | | | | | | | | |
As a percentage of net revenue |
||||||||||
Sales and marketing |
19.0 | % | 24.1 | % | ||||||
General and administrative |
7.8 | % | 8.0 | % | ||||||
Amortization of acquired intangible assets |
0.0 | % | 0.1 | % | ||||||
| | | | | | | | | | | |
|
26.8 | % | 32.2 | % | ||||||
In the six months ended June 30, 2014, sales and marketing expenses increased by $65.5 million, or 90.1%, compared to the six months ended June 30, 2013. The increase in marketing expenses was primarily to grow and retain our customer base. We increased our advertising expenses by $43.5 million from $43.2 million in the six months ended June 30, 2013 to $86.7 million in the six months ended June 30, 2014, primarily driven by an increase in television and display advertising. Our customer service costs and merchant processing fees increased by $7.8 million from $15.0 million in the six months ended June 30, 2013 to $22.8 million in the six months ended June 30, 2014. We also incurred equity based compensation expense of $4.3 million recorded in sales and marketing in the six months ended June 30, 2014 associated with our 2014 Tender Offer. The remainder of the increase was primarily in sales and marketing labor costs for product development, operations, and marketing personnel.
In the six months ended June 30, 2014, general and administrative expense increased by $16.3 million, or 54.4%, compared to the six months ended June 30, 2013. This increase was primarily attributable to personnel costs, rent, amortization and depreciation expenses.
In the six months ended June 30, 2014, amortization of purchased intangible assets increased by $0.4 million, or 370.8%, compared to the six months ended June 30, 2013. The increase in
65
amortization expense for the six months ended June 30, 2014 was primarily the result of our acquisition of DwellStudio.
Interest Income, net
In the six months ended June 30, 2014 and the six months ended June 30, 2013, interest income, net, was $0.1 million.
Other (Expense), Income, net
In the six months ended June 30, 2014, other (expense), net, decreased by $0.4 million compared to the six months ended June 30, 2013 primarily attributed to changes in foreign currency.
Comparison of years ended December 31, 2013 and 2012
Net revenue
| |
Years ended December 31, |
% Change | ||||||||
|---|---|---|---|---|---|---|---|---|---|---|
| |
2012 to 2013
|
|||||||||
| |
2012
|
2013
|
||||||||
| |
(in thousands) |
|
||||||||
Direct Retail |
$ | 389,290 | $ | 673,446 | 73.0 | % | ||||
Other |
211,738 | 242,397 | 14.5 | |||||||
| | | | | | | | | | | |
Net revenue |
$ | 601,028 | $ | 915,843 | 52.4 | % | ||||
| | | | | | | | | | | |
| | | | | | | | | | | |
In 2013, net revenue increased by $314.8 million, or 52.4% compared to 2012 primarily as a result of increase in Direct Retail net revenue. In 2013, Direct Retail net revenue increased by $284.2 million, or 73.0% compared to 2012. The increase in Direct Retail net revenue was primarily due to sales to a larger customer base, as the number of active customers increased 61.0% in 2013 compared to the number of active customers in 2012. Additionally, LTM net revenue per active customer increased 7.3% in 2013 compared with 2012. The increase in Other revenue was primarily due to increased sales through our existing and new retail partners.
Cost of Goods Sold
| |
Years ended December 31, |
% Change | ||||||||
|---|---|---|---|---|---|---|---|---|---|---|
| |
2012 to 2013
|
|||||||||
| |
2012
|
2013
|
||||||||
| |
(in thousands) |
|
||||||||
Cost of goods sold |
$ | 455,879 | $ | 691,602 | 51.7 | % | ||||
As a percentage of net revenue |
75.8 | % | 75.5 | % | ||||||
In 2013, costs of goods sold increased by $235.7 million, or 51.7%, compared to 2012. Of the increase in cost of goods sold, $190.3 million was due to the increase in products sold to our larger customer base. In addition, shipping and fulfillment costs increased $45.4 million as a result of the increase in products sold during the period.
66
Operating Expenses
| |
Years ended December 31, |
% Change | ||||||||
|---|---|---|---|---|---|---|---|---|---|---|
| |
2012 to 2013
|
|||||||||
| |
2012
|
2013
|
||||||||
| |
(in thousands) |
|
||||||||
Sales and marketing |
$ | 113,370 | $ | 177,475 | 56.5 | % | ||||
General and administrative |
52,961 | 62,246 | 17.5 | |||||||
Amortization of acquired intangible assets |
212 | 539 | 154.2 | |||||||
| | | | | | | | | | | |
|
$ | 166,543 | $ | 240,260 | 44.3 | % | ||||
| | | | | | | | | | | |
| | | | | | | | | | | |
As a percentage of net revenue |
||||||||||
Sales and marketing |
18.9 | % | 19.4 | % | ||||||
General and administrative |
8.8 | 6.8 | ||||||||
Amortization of acquired intangible assets |
0.0 | 0.1 | ||||||||
| | | | | | | | | | | |
|
27.7 | % | 26.2 | % | ||||||
In 2013, sales and marketing expenses increased by $64.1 million, or 56.5%, compared to 2012. The increase in marketing expenses was primarily to grow and retain our customer base. We increased our advertising expenses by $43.0 million from $65.5 million in 2012 to $108.5 million in 2013, primarily driven by an increase in television and display advertising. Our customer service costs and merchant processing fees increased by $9.8 million from $25.7 million in 2012 to $35.5 million in 2013. The remainder of the increase was primarily in sales and marketing labor costs for product development, operations, and marketing personnel.
In 2013, general and administrative expense increased by $9.3 million, or 17.5%, compared to 2012. This increase was primarily attributable to personnel costs, rent, information technology and amortization and depreciation expenses.
In 2013, amortization of purchased intangible assets increased by $0.3 million, or 154.2%, compared to 2012. The increase in amortization expense for 2013 was primarily the result of our acquisition of DwellStudio.
Interest Income, net
In 2013 and 2012, interest income, net, was $0.2 million.
Other (Expense), Income, net
In 2013, other (expense), income, net, increased by $0.1 million compared to 2012 primarily attributed to changes in foreign currency.
Quarterly Results of Operations and Other Financial and Operations Data
The following tables set forth selected unaudited quarterly results of operations and other financial and operations data for the six quarters ended June 30, 2014, as well as the percentage that each line item represents of net revenue. The information for each of these quarters has been prepared on the same basis as the audited consolidated financial statements included elsewhere in this prospectus and in the opinion of management, reflects all adjustments, consisting of only normal recurring adjustments, necessary for the fair statement of our consolidated results of operations for these periods. This data should be read in conjunction with our consolidated
67
financial statements and related notes included elsewhere in this prospectus. Historical results are not necessarily indicative of the results to be expected in the future.
| |
Three months ended | ||||||||||||||||||
|---|---|---|---|---|---|---|---|---|---|---|---|---|---|---|---|---|---|---|---|
| |
March 31, 2013 |
June 30, 2013 |
September 30, 2013 |
December 31, 2013 |
March 31, 2014 |
June 30, 2014 |
|||||||||||||
| |
(in thousands) |
||||||||||||||||||
Consolidated Statements of Operations: |
|||||||||||||||||||
Net revenue |
$ |
179,831 |
$ |
203,377 |
$ |
237,302 |
$ |
295,333 |
$ |
278,707 |
$ |
295,437 |
|||||||
Cost of goods sold |
135,798 | 152,539 | 178,656 | 224,609 | 213,500 | 226,983 | |||||||||||||
| | | | | | | | | | | | | | | | | | | | |
Gross profit |
44,033 | 50,838 | 58,646 | 70,724 | 65,207 | 68,454 | |||||||||||||
Operating expenses: |
|||||||||||||||||||
Sales and marketing |
34,079 | 38,635 | 46,602 | 58,159 | 70,344 | 67,884 | |||||||||||||
General and administrative |
15,327 | 14,687 | 15,530 | 16,702 | 22,769 | 23,586 | |||||||||||||
Amortization of acquired intangible assets |
53 | 53 | 184 | 249 | 249 | 250 | |||||||||||||
| | | | | | | | | | | | | | | | | | | | |
Total operating expenses |
49,459 | 53,375 | 62,316 | 75,110 | 93,362 | 91,720 | |||||||||||||
| | | | | | | | | | | | | | | | | | | | |
Loss from operations |
(5,426 | ) | (2,537 | ) | (3,670 | ) | (4,386 | ) | (28,155 | ) | (23,266 | ) | |||||||
Interest income, net |
67 | 57 | 61 | 60 | 56 | 77 | |||||||||||||
Other (expense) income, net |
(384 | ) | (120 | ) | 579 | 219 | 88 | (184 | ) | ||||||||||
| | | | | | | | | | | | | | | | | | | | |
Loss before income taxes |
(5,743 | ) | (2,600 | ) | (3,030 | ) | (4,107 | ) | (28,011 | ) | (23,373 | ) | |||||||
Provision for income taxes |
— | 5 | (1 | ) | (50 | ) | (15 | ) | (2 | ) | |||||||||
| | | | | | | | | | | | | | | | | | | | |
Net loss |
$ | (5,743 | ) | $ | (2,595 | ) | $ | (3,031 | ) | $ | (4,157 | ) | $ | (28,026 | ) | $ | (23,375 | ) | |
| | | | | | | | | | | | | | | | | | | | |
| | | | | | | | | | | | | | | | | | | | |
| |
Three months ended | ||||||||||||||||||
|---|---|---|---|---|---|---|---|---|---|---|---|---|---|---|---|---|---|---|---|
| |
March 31, 2013
|
June 30, 2013
|
September 30, 2013
|
December 31, 2013
|
March 31, 2014
|
June 30, 2014
|
|||||||||||||
Consolidated Statements of Operations: |
|||||||||||||||||||
Net revenue |
100.0 |
% |
100.0 |
% |
100.0 |
% |
100.0 |
% |
100.0 |
% |
100.0 |
% |
|||||||
Cost of goods sold |
75.5 | 75.0 | 75.3 | 76.1 | 76.6 | 76.8 | |||||||||||||
| | | | | | | | | | | | | | | | | | | | |
Gross profit |
24.5 | 25.0 | 24.7 | 23.9 | 23.4 | 23.2 | |||||||||||||
Operating expenses: |
|||||||||||||||||||
Sales and marketing |
19.0 | 19.0 | 19.6 | 19.7 | 25.2 | 23.0 | |||||||||||||
General and administrative |
8.5 | 7.2 | 6.5 | 5.6 | 8.2 | 7.9 | |||||||||||||
Amortization of acquired intangible assets |
0.0 | 0.0 | 0.1 | 0.1 | 0.1 | 0.1 | |||||||||||||
| | | | | | | | | | | | | | | | | | | | |
Total operating expenses |
27.5 | 26.2 | 26.2 | 25.4 | 33.5 | 31.0 | |||||||||||||
| | | | | | | | | | | | | | | | | | | | |
Loss from operations |
(3.0 | ) | (1.2 | ) | (1.5 | ) | (1.5 | ) | (10.1 | ) | (7.8 | ) | |||||||
Interest income, net |
0.0 | 0.0 | 0.0 | 0.0 | 0.0 | 0.0 | |||||||||||||
Other (expense) income, net |
(0.2 | ) | (0.1 | ) | 0.2 | 0.1 | 0.0 | (0.1 | ) | ||||||||||
| | | | | | | | | | | | | | | | | | | | |
Loss before income taxes |
(3.2 | ) | (1.3 | ) | (1.3 | ) | (1.4 | ) | (10.1 | ) | (7.9 | ) | |||||||
Provision for income taxes |
0.0 | 0.0 | 0.0 | 0.0 | 0.0 | (0.0 | ) | ||||||||||||
| | | | | | | | | | | | | | | | | | | | |
Net loss |
(3.2 | )% | (1.3 | )% | (1.3 | )% | (1.4 | )% | (10.1 | )% | (7.9 | )% | |||||||
| | | | | | | | | | | | | | | | | | | | |
| | | | | | | | | | | | | | | | | | | | |
68
| |
Three months ended | ||||||||||||||||||
|---|---|---|---|---|---|---|---|---|---|---|---|---|---|---|---|---|---|---|---|
| |
March 31, 2013 |
June 30, 2013 |
September 30, 2013 |
December 31, 2013 |
March 31, 2014 |
June 30, 2014 |
|||||||||||||
| |
(in thousands, except Average Order Value and LTM Net Revenue Per Active Customer) |
||||||||||||||||||
Consolidated Financial Metrics |
|||||||||||||||||||
Net Revenue |
$ | 179,831 | $ | 203,377 | $ | 237,302 | $ | 295,333 | $ | 278,707 | $ | 295,437 | |||||||
Adjusted EBITDA(1) |
$ | (2,542 | ) | $ | 442 | $ | (181 | ) | $ | (647 | ) | $ | (19,403 | ) | $ | (17,599 | ) | ||
Free Cash Flow(2) |
$ | (24,683 | ) | $ | 11,409 | $ | (3,982 | ) | $ | 35,890 | $ | (38,506 | ) | $ | (31,744 | ) | |||
Direct Retail Financial and Operating Metrics |
|||||||||||||||||||
Direct Retail Net Revenue |
$ | 120,617 | $ | 147,748 | $ | 181,693 | $ | 223,388 | $ | 226,000 | $ | 243,534 | |||||||
Active Customers |
1,366 | 1,506 | 1,775 | 2,092 | 2,409 | 2,635 | |||||||||||||
LTM Net Revenue Per Active Customer |
$ | 305 | $ | 313 | $ | 315 | $ | 322 | $ | 323 | $ | 332 | |||||||
Orders Delivered |
555 | 703 | 884 | 1,172 | 1,138 | 1,084 | |||||||||||||
Average Order Value |
$ | 217 | $ | 210 | $ | 206 | $ | 191 | $ | 199 | $ | 225 | |||||||
- (1)
- Adjusted EBITDA is a non-GAAP financial measure that we calculate as earnings (loss) before depreciation and amortization, equity-based compensation, interest and other income and expense and taxes. Refer to the section of this prospectus captioned "Management's Discussion and Analysis of Financial Condition and Results of Operations — Non-GAAP Financial Measures — Adjusted EBITDA" for more information.
The following table reflects the reconciliation of net loss to Adjusted EBITDA for each of the periods indicated:
| |
Three months ended | ||||||||||||||||||
|---|---|---|---|---|---|---|---|---|---|---|---|---|---|---|---|---|---|---|---|
| |
March 31, 2013 |
June 30, 2013 |
September 30, 2013 |
December 31, 2013 |
March 31, 2014 |
June 30, 2014 |
|||||||||||||
| |
(in thousands) |
||||||||||||||||||
Reconciliation of Adjusted EBITDA |
|||||||||||||||||||
Net loss |
$ | (5,743 | ) | $ | (2,595 | ) | $ | (3,031 | ) | $ | (4,157 | ) | $ | (28,026 | ) | $ | (23,375 | ) | |
Depreciation and amortization |
2,884 | 2,979 | 3,489 | 3,739 | 4,198 | 4,693 | |||||||||||||
Equity-based compensation |
— | — | — | — | 4,554 | 974 | |||||||||||||
Interest income, net |
(67 | ) | (57 | ) | (61 | ) | (60 | ) | (56 | ) | (77 | ) | |||||||
Other (expense) |
384 | 120 | (579 | ) | (219 | ) | (88 | ) | 184 | ||||||||||
Taxes |
— | (5 | ) | 1 | 50 | 15 | 2 | ||||||||||||
| | | | | | | | | | | | | | | | | | | | |
Adjusted EBITDA |
$ | (2,542 | ) | $ | 442 | $ | (181 | ) | $ | (647 | ) | $ | (19,403 | ) | $ | (17,599 | ) | ||
| | | | | | | | | | | | | | | | | | | | |
| | | | | | | | | | | | | | | | | | | | |
- (2)
- Free cash flow is a non-GAAP financial measure that we calculate as net cash (used in) provided by operating activities less net cash used to purchase property and equipment including leasehold improvements and site and software development costs. Refer to the section of this prospectus captioned "Management's Discussion and Analysis of Financial Condition and Results of Operations — Non-GAAP Financial Measures — Free Cash Flow" for more information.
The following table presents a reconciliation of free cash flow to net cash provided by operating activities for each of the periods indicated:
| |
Three months ended | ||||||||||||||||||
|---|---|---|---|---|---|---|---|---|---|---|---|---|---|---|---|---|---|---|---|
| |
March 31, 2013 |
June 30, 2013 |
September 30, 2013 |
December 31, 2013 |
March 31, 2014 |
June 30, 2014 |
|||||||||||||
| |
(in thousands) |
||||||||||||||||||
Net cash provided by operating activities, net of acquisition |
$ | (20,451 | ) | $ | 14,545 | $ | (517 | ) | $ | 40,836 | $ | (24,432 | ) | $ | (15,339 | ) | |||
Purchase of property, equipment, and leasehold improvements |
(2,236 | ) | (1,065 | ) | (1,120 | ) | $ | (2,318 | ) | (11,357 | ) | (12,974 | ) | ||||||
Site and software development costs |
(1,996 | ) | (2,071 | ) | (2,345 | ) | $ | (2,628 | ) | (2,717 | ) | (3,431 | ) | ||||||
| | | | | | | | | | | | | | | | | | | | |
Free cash flow |
$ | (24,683 | ) | $ | 11,409 | $ | (3,982 | ) | $ | 35,890 | $ | (38,506 | ) | $ | (31,744 | ) | |||
| | | | | | | | | | | | | | | | | | | | |
| | | | | | | | | | | | | | | | | | | | |
Seasonality and Quarterly Trends
Net revenue
Quarterly net revenue increased sequentially quarter-to-quarter for all periods presented, except for the first quarter of 2014. Over the quarters presented our customer base increased as the number of active customers increased each quarter. Additionally, our LTM net revenue per active customer increased in each quarter presented, except for the first quarter of 2014.
69
The first quarter of each year is usually our lowest net revenue quarter during the year and net revenue typically declines from the prior fourth quarter. We believe that the holiday shopping season has resulted in increased sales during a portion of the third quarter and the fourth quarter each fiscal year and comparisons of our year-over-year quarterly revenue are more meaningful than comparisons of our sequential quarterly revenue due to the seasonality in net revenue.
Cost of Goods Sold
Quarterly cost of goods sold increased sequentially quarter-to-quarter for all periods presented, except for the first quarter 2014, due to the increase in products sold to our larger customer base. In addition, shipping and fulfillment costs increased as a result of the increase in products sold.
Operating Expenses
Sales and marketing expenses increased sequentially quarter-to-quarter for all periods presented. The increase in marketing expenses was primarily to grow and retain our customer base. Our advertising expenses increased in each quarter primarily driven by an increase in television and display advertising. Quarterly merchant processing fees increased sequentially quarter-to-quarter for all periods presented, except for the first quarter 2014, due to the increase in products sold to our larger customer base. The remainder of the increase was primarily in customer service and sales and marketing labor costs for product development, operations, and marketing personnel.
General and administrative expense increased sequentially quarter-to-quarter for all periods presented, except for the second quarter 2013, primarily attributed to personnel costs, rent, information technology and amortization and depreciation expenses.
Amortization of purchased intangible assets increased in the third and fourth quarters 2013 primarily as a result of our acquisition of DwellStudio.
Liquidity and Capital Resources
Sources of Liquidity
| |
December 31, | |
||||||||
|---|---|---|---|---|---|---|---|---|---|---|
| |
June 30, 2014 |
|||||||||
| |
2012
|
2013
|
||||||||
| |
(in thousands) |
|||||||||
Cash and cash equivalents |
$ | 77,861 | $ | 65,289 | $ | 87,781 | ||||
Short-term investments |
23,017 | 50,019 | 65,017 | |||||||
Accounts receivable, net |
15,766 | 7,689 | 6,647 | |||||||
Working capital |
42,031 | 18,118 | 68,706 | |||||||
Historical Cash Flows
| |
Years ended December 31, |
Six months ended June 30, |
|||||||||||
|---|---|---|---|---|---|---|---|---|---|---|---|---|---|
| |
2012
|
2013
|
2013
|
2014
|
|||||||||
| |
(in thousands) |
||||||||||||
Net loss |
$ | (21,055 | ) | $ | (15,526 | ) | $ | (8,338 | ) | $ | (51,401 | ) | |
Net cash provided by (used in) operating activities |
3,945 | 34,413 | (5,907 | ) | (39,771 | ) | |||||||
Net cash used in investing activities |
(23,080 | ) | (46,991 | ) | (24,371 | ) | (48,489 | ) | |||||
Net cash provided by financing activities |
44,944 | — | — | 110,746 | |||||||||
70
Since our inception, we have financed our operations, capital expenditures and acquisitions primarily through cash flows generated by operations and, since 2011, also through private sales of convertible redeemable preferred units and common units. Since inception through June 30, 2014, we have raised a total of approximately $363.1 million from the sale of preferred stock, net of costs and expenses associated with such financings, or approximately $195.4 million, net of repurchases of our securities. We believe that our existing cash and cash equivalents, together with cash generated from operations, will be sufficient to meet our anticipated cash needs for at least the next 12 months. However, our liquidity assumptions may prove to be incorrect, and we could exhaust our available financial resources sooner than we currently expect. In addition, we may elect to raise additional funds at any time through equity, equity-linked or debt financing arrangements. Our future capital requirements and the adequacy of available funds will depend on many factors, including those described in the section titled "Risk Factors" on page 14. We may not be able to secure additional financing to meet our operating requirements on acceptable terms, or at all.
As of June 30, 2014, 21.6 million Series A and 6.0 million Series B convertible redeemable preferred units were outstanding with accrued dividend amounts of $20.9 million payable upon conversion into shares of Class B common stock which is included in carrying value of Series A convertible redeemable preferred units. The accrued dividend amounts are payable upon conversion of the units into common stock, which will occur following the Corporate Reorganization and upon the closing of this offering. Following the conversion of the units into common stock, no further dividends will accrue with respect to this equity. We expect to use a portion of our cash and cash equivalent balances, or, alternatively, we may choose to borrow funds or use a combination of cash and borrowed funds to satisfy these dividend obligations.
In March 2014, we issued approximately 6.0 million Series B convertible redeemable preferred units, resulting in gross proceeds of approximately $157.2 million. Upon the closing of this transaction, we distributed $15.0 million, which is a portion of the aforementioned accrued dividends, to Series A preferred unit holders. We also repurchased 896,052 common units from SK Retail, Inc. at a price of $26.23 per unit, for an aggregate purchase price of approximately $23.5 million. In addition, in April 2014, we closed a tender offer to repurchase provisionally vested (defined as service time completed) common unit options and restricted common units from certain employees at a price of $26.23. A total of 9,028 common unit options and 202,757 restricted common units were tendered for approximately $5.5 million in net cash. Our net proceeds from the sale of Series B convertible redeemable preferred units, net of costs and expenses associated with the financing, the distribution to our Series A preferred unit holders and the repurchase of our securities, was approximately $110.8 million.
As part of our employee equity compensation plan, our employees receive deferred units. These deferred units vest upon the satisfaction of both a service condition and a performance condition. The service condition for the majority of the deferred units is satisfied over a period of five years. The performance condition in connection with these grants will be satisfied on the date of a change in control or an initial public offering. On the settlement dates for the deferred units, we may choose to undertake a net settlement and withhold shares and remit income taxes on behalf of the holders of such units at the applicable minimum statutory rates. As of June 30, 2014, 1,454,251 deferred units had provisionally vested for which the service condition had been satisfied on that date. Assuming (i) the performance condition had been satisfied on that date and (ii) that the price of our common stock at the time of settlement was equal to $26.50, based on the initial public offering price of $26.50 per share, the midpoint of the range listed on the cover page of this prospectus, we estimate that this tax obligation on the initial settlement date would be approximately $14.0 million in the aggregate.
If we choose to undertake a net settlement of our deferred unit holders, then to fund the minimum tax withholding and remittance obligations on behalf of such unit holders and employer
71
taxes, we would expect to use a portion of our cash and cash equivalent balances, or, alternatively, we may choose to borrow funds or a combination of cash and borrowed funds to satisfy these obligations.
Operating Activities
Cash provided by operating activities consisted of net loss adjusted for certain non-cash items including depreciation and amortization, and certain other non-cash expenses, as well as the effect of changes in working capital and other activities.
Cash used in operating activities in the six months ended June 30, 2014 was $39.8 million, an increase in cash outflow of $33.9 million compared to the six months ended June 30, 2013. Cash used in operating activities was driven primarily by net loss of $51.4 million, adjusted for certain non-cash items including depreciation and amortization expense of $8.9 million, equity based compensation of $5.5 million and other non-cash items of $0.1 million and cash used in operating assets and liabilities of $2.9 million. Operating cash flows can be volatile and are sensitive to many factors, including changes in working capital and our net (loss) income.
Cash provided by operating activities in 2013 was $34.4 million and was driven by a net loss of $15.5 million, adjusted for certain non-cash items including depreciation and amortization expense of $13.1 million and other non-cash items of $0.1 million offset by cash provided by operating assets and liabilities of $36.7 million.
Cash provided by operating activities in 2012 was $3.9 million and was driven by a net loss of $21.1 million, adjusted for certain non-cash items including depreciation and amortization expense of $9.3 million and other non-cash items of $0.1 million offset by cash provided by operating assets and liabilities of $15.6 million.
Investing Activities
Our primary investing activities consisted of purchases of property and equipment, particularly purchases of servers and networking equipment, investment in our sites and software development, purchases and disposal of marketable securities, leasehold improvements for our facilities and acquisitions of businesses.
Cash used in investing activities in the six months ended June 30, 2014 was $48.5 million, an increase in cash outflow of $24.1 million compared to the six months ended June 30, 2013. The increase in cash outflow was primarily driven by purchases of property and equipment of $24.3 million, site and software development costs of $6.1 million and net increase in restricted cash of $3.0 million. The purchases of property and equipment includes $5.8 million, primarily related to leasehold improvements, for which cash has not been paid as of June 30, 2014.
Cash used in investing activities in 2013 was $47.0 million and was driven by net purchases of short-term investments of $27.0 million, purchases of property and equipment of $6.7 million, cash paid for the acquisition of DwellStudio of $3.7 million, site and software development costs of $9.0 million and other net investing activities of $0.5 million.
Cash used in investing activities in 2012 was $23.1 million and was driven by net purchases of short-term investments of $8.0 million, purchases of property and equipment of $8.0 million, site and software development costs of $6.9 million and other net investing activities of $0.1 million.
Financing Activities
Our primary financing activities consisted of private sales of convertible redeemable preferred units in 2014 and 2012. Cash provided by financing activities in the six months ended June 30,
72
2014 was $110.7 million and was primarily due to net proceeds from issuance of Series B convertible redeemable preferred units partially offset by the dividend distribution to our Series A preferred unit holders, the repurchase of our securities and the 2014 Tender Offer. There were no financing activities in the six months ended June 30, 2013 and the year ended December 31, 2013. Cash provided by financing activities in the year ended December 31, 2012 was $44.9 million and was primarily due to net proceeds from issuance of Series A convertible redeemable preferred units.
Credit Agreement
We have a credit agreement with a lender which provides us with a line of credit for up to $25.0 million, with the committed amounts of $10.0 million to be used for a revolving line of credit and $15.0 million to be used to support our corporate credit card program. We are required to maintain certain covenants, including debt service coverage, tangible net worth, and unencumbered liquid assets. As of December 31, 2013 and June 30, 2014, we did not have any borrowings outstanding and were in full compliance with the credit agreement. The credit agreement is renewable on an annual basis, and the next renewal date is October 28, 2014.
Off-Balance Sheet Arrangements
We do not engage in any off-balance sheet activities. We do not have any off-balance sheet interest in variable interest entities, which include special purpose entities and other structured finance entities.
Contractual Obligations
The following table summarizes our contractual obligations as of December 31, 2013:
| |
|
Payment Due by Period | ||||||||||||||
|---|---|---|---|---|---|---|---|---|---|---|---|---|---|---|---|---|
| |
Total
|
Less than 1 year |
1 - 3 Years |
3 - 5 Years |
More than 5 Years |
|||||||||||
| |
(in thousands) |
|||||||||||||||
Operating Lease Obligations |
$ | 62,906 | 6,988 | 15,231 | 14,151 | $ | 26,536 | |||||||||
We lease office space under non-cancelable operating leases. These leases expire at various dates through 2024 and include discounted rental periods and fixed escalation clauses, which are amortized straight-line over the terms of the lease. We recognize rent expense on a straight-line basis over the lease periods. We do not have any debt or material capital lease obligations and all of our property, equipment and software have been purchased with cash. Future operating lease payments have not been reduced by minimum sublease rentals of $1.6 million due to us in the future under noncancelable subleases.
In March 2014, we expanded our lease of office space in Boston, MA, to a total of approximately 275,000 square feet in order to accommodate the growth of our new corporate headquarters which we have occupied since June 2014 with the expansion occurring in June 2015. This additional lease space will result in additional operating lease obligations of $52.1 million payable through 2024.
Critical Accounting Policies
Our financial statements are prepared in accordance with accounting principles generally accepted in the United States. The preparation of our financial statements and related disclosures requires us to make estimates, assumptions and judgments that affect the reported amount of
73
assets, liabilities, net revenue, costs and expenses and related disclosures. We believe that the estimates, assumptions and judgments involved in the accounting policies described below have the greatest potential impact on our financial statements and, therefore, we consider these to be our critical accounting policies. Accordingly, we evaluate our estimates and assumptions on an ongoing basis. Our actual results may differ from these estimates under different assumptions and conditions. See Note 2 to our consolidated financial statements included elsewhere in this prospectus for information about these critical accounting policies, as well as a description of our other significant accounting policies.
Revenue Recognition
We recognize revenue only when the following four criteria are met: (1) persuasive evidence of an arrangement exists; (2) delivery has occurred; (3) the selling price is fixed or determinable; and (4) collectability is reasonably assured.
We recognize net revenue from sales of our products upon delivery to the customer. As we ship a large volume of packages through multiple carriers, actual delivery dates may not always be available and as such we estimate delivery dates based on historical data. We record our product revenue at the gross amount as we are the primary obligor with the customer and provide the primary customer service for all products sold on our sites, have latitude in establishing price and selecting products sold on our sites, have discretion in selecting suppliers of products sold on our sites, maintain inventory risk from shipment through delivery date and upon accepting returns, and have credit risk. Net revenue includes shipping costs charged to the customer and are recorded net of taxes collected from customers, which are remitted to governmental authorities. Cash discounts, estimated returns and rebates are deducted from gross revenue in determining net revenue. We record an allowance for returns based on current period revenue and historical returns experience. We defer revenue when cash is collected from our customer prior to the satisfaction of the revenue recognition criteria.
We maintain a rewards program that allows enrolled customers to earn points which can be redeemed for future purchases. We defer the portion of our revenue associated with rewards that are ultimately expected to be redeemed prior to expiration.
We also earn revenue through third-party advertisers that pay us based on the number of advertisement related clicks, actions, or impressions for ads placed on our sites. Revenue earned under these arrangements is included in net revenue and is recognized in the period in which the click, action, or impression occurs.
Site and Software Development Costs
We capitalize certain external costs and internal labor-related costs associated with the development of our sites and internal-use software products after the preliminary project stage is complete and until the software is ready for its intended use. Initial costs are charged to operating expenses prior to the selection of a vendor and determination of performance requirements. Costs incurred after the software is ready for use are charged to operating expenses as incurred. Abandoned projects previously capitalized are charged to operating expenses in the period of abandonment. The company expenses site development costs that manage, monitor, and operate the company's sites, except for costs that provide additional functionality, which are capitalized. Capitalized software costs are included in property and equipment within our consolidated balance sheets and are amortized over a two-year period.
74
Stock-Based Compensation
We issue equity awards to employees and non-employees, generally in the form of common unit options, common units and deferred units. We account for our equity awards in accordance with Financial Accounting Standards Board, or FASB, Accounting Standard Codification Topic 718, Compensation — Stock Compensation, or ASC 718, which requires all equity-based payments to employees, including grants of employee unit options and deferred units and modifications to existing unit options, to be recognized in the consolidated statements of operations and comprehensive loss based on their fair values. We account for equity awards to non-employees in accordance with FASB ASC Topic 505-50, Equity-Based Payments to Non-Employees, which requires the fair value of an award to non-employees be remeasured at fair value as the award vests. Our equity awards are subject to two vesting triggers: a service period (typically five years) and a performance condition (a liquidity event in the form of either a change of control or an initial public offering, each as defined in the Amended Plan). Employees are able to retain provisionally vested units upon departure. We determined that a liquidity event was not probable at June 30, 2014, and as such, no expense has been recognized. Since April 2011, we have only granted deferred units and have not granted any common unit options or common units. Following the consummation of this offering, deferred unit values will be determined based on the quoted market price of our common stock.
As there has been no public market for our common units to date, the estimated fair value of our common units has been determined by our board of managers. We have periodically determined for financial reporting purposes the estimated fair value of our common units at various dates using contemporaneous valuations performed in accordance with the guidance outlined in the American Institute of Certified Public Accountants Practice Aid, Valuation of Privately-Held Company Equity Securities Issued as Compensation, also known as the Practice Aid. We generally use the income and market approaches prescribed in the Practice Aid, in particular the income approach's discounted cash flow method, which was based on our projections and estimated discount rate and the guideline public company, guideline transactions and precedent transaction methodologies, based on inputs from comparable public companies' equity valuations, comparable acquisition transactions and transactions in our own equity securities, to estimate the enterprise value of our company. We performed these contemporaneous valuations as of December 31, 2011, June 30, 2012, December 31, 2012, June 30, 2013, September 30, 2013, December 31, 2013, March 31, 2014, and June 30, 2014. The assumptions underlying these valuations represent management's best estimates, which involve inherent uncertainties and the application of management judgment. As a result, if factors or expected outcomes change and we use significantly different assumptions or estimates, our equity-based compensation could be materially different.
In connection with the preparation of the financial statements for the year ended December 31, 2013 we undertook a retrospective reassessment of the fair market value of our common stock for certain of our 2013 grants for financial reporting purposes. As part of that reassessment, we determined that the grant date fair values of our May, August and November 2013 grants to be $6.46, $10.88 and $20.87 respectively. Our fair value previously determined at various valuation dates increased substantially in 2013 and there was no particular transaction or event that caused this increase. The grants made in May, August and November 2013 were between the dates when we performed our valuation. Accordingly, we calculated grant date fair value for these grants on a linear basis between each valuation date and believe it to be a reasonable method.
In connection with the Corporate Reorganization, all of our outstanding common units will be exchanged for, and all of our incentive units will convert into, shares of Class B common stock. In addition, all of outstanding preferred units will convert into shares of Series A and Series B
75
convertible preferred stock. Immediately prior to the completion of this offering, all of our outstanding shares of Series A and Series B convertible preferred stock will convert into shares of Class B common stock.
Goodwill
We test goodwill for impairment on the last day of each fiscal year and whenever events or changes in circumstances indicate that the carrying amount of this asset may exceed its fair value. The assessment is performed at the reporting unit level using the two-step goodwill impairment test to identify potential goodwill impairment. The first step is to compare the fair value of the reporting unit to the book value, including goodwill. If the fair value of the reporting unit exceeds the book value, goodwill is not impaired. If the book value exceeds the fair value, the second step of the process is performed to measure the amount of impairment.
The fair value of the reporting unit is determined by using the income and the market approaches. The income approach uses a discounted cash flow analysis, which involves applying appropriate discount rates to estimated cash flows, including the terminal value based on forecasts of revenue, costs and capital requirements. We estimate future revenue growth based on a number of key assumptions, including customer and order growth by acquisition channel, average order value, advertising spend, e-commerce growth rates and our experience in growth of our more mature markets and categories. Our cost structure assumptions are based on historic trends in product cost and freight, advertising costs, growth in headcount, and merchant processing fees. We deem the discount rate used in our analysis to be commensurate with the underlying uncertainties associated with achieving the estimated cash flows we projected. The terminal value is calculated using the two-stage growth model. The market approach includes the guideline public company method and guideline transaction method. The guideline public company method uses the fair value of comparable publicly-traded companies in the industry group. The companies used for comparison under the guideline public company method are selected based on a number of factors, including, but not limited to, the similarity of their industry, growth rate and stage of development, business model, and financial risk. The guideline transaction method involves determining a fair value using recent mergers and acquisitions transactions in the industry group in the recent years.
Based on our 2013 analysis, we determined that the fair value of the reporting unit carrying the goodwill balance significantly exceeded its carrying value including goodwill and management has concluded that the reporting units are not at risk of failing step one of the goodwill impairment analysis. We evaluated our goodwill for impairment at June 30, 2014 and noted no changes in events or circumstances that indicated it is more likely than not that the fair value of our reporting units had fallen below the carrying value since December 31, 2013.
Inventory
Inventories consisting of finished goods are stated at the lower of cost or market, determined by the first-in, first-out (FIFO) method, and consist of merchandise for resale. This valuation requires us to make judgments based on currently-available information about the likely method of disposition, such as through sales to individual customers, returns to product suppliers, or liquidations, and expected recoverable values of each disposition category.
Recent Accounting Pronouncements
In May 2013, the FASB issued new accounting guidance regarding revenue recognition under GAAP. This new guidance will supersede nearly all existing revenue recognition guidance, and is effective for public entities for annual and interim periods beginning after December 31, 2016. Early
76
adoption is not permitted. We are currently evaluating the impact of this new guidance on our consolidated financial statements.
Pro Forma Income Tax Accounting Related to the Corporate Reorganization
Prior to the transition to a corporate structure, we were generally not subject to U.S. federal income taxes. Since U.S. federal taxes related to income earned by the members of Wayfair LLC were the responsibility of the individual members, our members reported and paid U.S. federal taxes on their share of Wayfair LLC's income on their individual tax returns. In other countries, however, we operated in the form of a corporation or were otherwise subject to entity-level taxes on income and withholding taxes. As a result, prior to transitioning to a corporate structure, we paid some entity-level taxes with the amount varying from year to year depending on the mix of earning among the countries. Where applicable, we accounted for these taxes under the asset and liability method. Therefore, historical financial statements with respect to periods ended on or prior to December 31, 2013 do not reflect the income tax liability that we would have paid as a corporation. Following the transition to a corporate structure, we will be subject to corporate tax on income.
We prepared and provided our unaudited pro forma consolidated balance sheet as if our reorganization from a limited liability company to a corporation in connection with this offering occurred on December 31, 2013. Pro forma deferred income taxes reflect the net tax effects of temporary differences between the pro forma carrying amounts of our tax assets and liabilities calculated for financial reporting purposes and the amounts that would have been calculated for our income tax returns in accordance with tax regulations and the net pro forma tax effects of operating loss and tax credit carryforwards if we had been a taxable entity.
The ultimate realization of deferred tax assets depends on the generation of sufficient taxable income of the appropriate character and in the appropriate taxing jurisdictions during the future periods in which the related temporary differences become deductible. We determined the valuation allowance on pro forma deferred tax assets is in accordance with the accounting standard for income taxes, which require weight of both positive and negative evidence in order to ascertain whether it is more likely than not that the pro forma deferred tax assets would be realized. We evaluated all significant available positive and negative evidence, including the existence of cumulative net income, benefits that could be realized from available tax strategies and forecasts of future taxable income, in determining the need for a valuation allowance on pro forma deferred tax assets. After applying the evaluation guidance of the accounting standard for income taxes we determined that it was more likely than not that $23.3 million of the pro forma deferred tax assets will not be realized, and as such, a valuation allowance of $23.3 million was required.
As of December 31, 2013, pro forma tax-effected deferred tax assets, net of valuation allowance, and deferred tax liabilities were $6.6 million and $6.8 million respectively. Accordingly the pro forma net deferred tax liability as of December 31, 2013 was determined to be $0.2 million.
Quantitative and Qualitative Disclosures about Market Risk
We have operations both within the United States and internationally, and we are exposed to market risks in the ordinary course of our business, including the effects of foreign currency fluctuations, interest rate changes and inflation. Information relating to quantitative and qualitative disclosures about these market risks is set forth below.
Interest Rate Sensitivity
Cash and cash equivalents and short-term investments were held primarily in cash deposits, certificates of deposit and money market funds. The fair value of our cash, cash equivalents and short-term investments would not be significantly affected by either an increase or decrease in
77
interest rates due mainly to the short-term nature of these instruments. Interest on the revolving line of credit incurred pursuant to the credit agreement described above would accrue at a floating rate based on a formula tied to certain market rates at the time of incurrence; however, we do not expect that any change in prevailing interest rates will have a material impact on our results of operations.
Foreign Currency Risk
Most of our sales are denominated in U.S. dollars, and therefore, our revenue is not currently subject to significant foreign currency risk. Our operating expenses are denominated in the currencies of the countries in which our operations are located, and may be subject to fluctuations due to changes in foreign currency exchange rates, particularly changes in the British Pound, Australian Dollar and Euro. Fluctuations in foreign currency exchange rates may cause us to recognize transaction gains and losses in our statement of operations. To date, foreign currency transaction gains and losses have not been material to our financial statements, and we have not engaged in any foreign currency hedging transactions.
Inflation
We do not believe that inflation has had a material effect on our business, financial condition or results of operations. We continue to monitor the impact of inflation in order to minimize its effects through pricing strategies, productivity improvements and cost reductions. If our costs were to become subject to significant inflationary pressures, we may not be able to fully offset such higher costs through price increases. Our inability or failure to do so could harm our business, financial condition and results of operations.
Emerging Growth Company Status
Section 107 of the JOBS Act provides that an "emerging growth company" can take advantage of the extended transition period provided in Section 7(a)(2)(B) of the Securities Act for complying with new or revised accounting standards. In other words, an "emerging growth company" can delay the adoption of certain accounting standards until those standards would otherwise apply to private companies. However, we are choosing to "opt out" of such extended transition period, and as a result, we will comply with new or revised accounting standards on the relevant dates on which adoption of such standards is required for non-emerging growth companies. Section 107 of the JOBS Act provides that our decision to opt out of the extended transition period for complying with new or revised accounting standards is irrevocable.
78
Overview
Wayfair is transforming the way people shop for their homes.
Our homes are the center of our lives, where we raise families, create our fondest memories and spend most of our time. Our homes are very personal expressions of self and identity, which is why many of us seek uniqueness, crave originality and enjoy the feeling created by home design, furniture and décor. We built Wayfair to meet this emotional need for mass market consumers by creating one of the world's largest online destinations for the home.
Through our e-commerce business model, we offer visually inspiring browsing, compelling merchandising, easy product discovery and attractive prices for over seven million products from over 7,000 suppliers across our five distinct brands — Wayfair.com, Joss & Main, AllModern, DwellStudio and Birch Lane. Our typical Wayfair customer is a 35 to 65 year old woman with an annual household income of $60,000 to $175,000, who we consider to be a mass market consumer and who we believe is underserved by traditional brick and mortar and other online retailers of home goods. Because each of our customers has a different taste, style, purchasing goal and budget when shopping for her home, we have built one of the largest online selections of furniture, home furnishings, décor and goods. We are able to offer this vast selection of products while holding minimal inventory because we typically ship products directly from our suppliers to our customers. This supplier direct fulfillment network is a key component of our custom-built and seamlessly integrated technology and operational platform, which also includes extensive supplier integrations, a proprietary transportation delivery network and superior customer service.
Our co-founders are lifetime tech innovators who have worked together in the consumer internet sector since 1995 and have created a company culture deeply rooted in technology. We employ over 300 engineers and data scientists who continue to improve and enhance our technology platform. Our success reflects a deep culture of data-driven decision making, operational discipline and an unwavering focus on customer service. Our technology and data focus also facilitates critical e-commerce capabilities such as tailored shopping experiences across our five brands, consumer targeting and personalization, as well as "anytime, anywhere" shopping across our websites, mobile-optimized websites and mobile applications, which we collectively refer to as our sites.
We founded our company in May 2002 and have since delivered over 13 million orders. From 2002 through 2011, the company was bootstrapped by our co-founders and operated as hundreds of niche websites, such as bedroomfurniture.com and allbarstools.com. In 2006, we launched AllModern. From 2003 to 2011, we grew our net revenue organically from $7.7 million to $517.3 million, representing a 69.2% compound annual growth rate, or CAGR. In late 2011, we made the strategic decision to close and permanently redirect over 240 of our niche websites into Wayfair.com to create a one-stop shop for furniture, home furnishings, décor and goods and to build brand awareness, drive customer loyalty and increase repeat purchasing. We also changed our name from CSN Stores LLC to Wayfair LLC. Additionally, we expanded our multi-brand strategy beyond our then existing brands — Wayfair.com and AllModern — by launching Joss & Main. In 2013, we acquired DwellStudio, and in 2014, we launched Birch Lane.
79
Since our strategic shift was fully implemented in 2012, we have experienced significant and accelerating growth. To drive further growth we intend to:
- •
- build our existing brands:
- •
- acquire more customers;
- •
- continue to invest in the consumer experience;
- •
- increase repeat purchasing through merchandising, data, analytics and technology;
- •
- add new suppliers and deepen relationships with our existing suppliers;
- •
- continue to invest in our technology and operational platform, including our mobile platform;
- •
- opportunistically launch new retail home brands;
- •
- expand internationally; and
- •
- opportunistically pursue strategic acquisitions.
Our strong customer loyalty and deep supplier relationships have helped us grow our Direct Retail sales, which we define as generated primarily through the sites of our five brands. In 2013 and the six months ended June 30, 2014, we generated Direct Retail net revenue of $673.4 million and $469.5 million, respectively, an increase of 73.0% and 75.0% over 2012 and the six months ended June 30, 2013, respectively. In 2013, we delivered 3.3 million orders for 2.1 million Direct Retail active customers, representing increases of 85.2% and 61.0%, respectively, over 2012. In the six months ended June 30, 2014, we delivered 2.2 million orders, representing an increase of 76.6%, over the six months ended June 30, 2013. In the six months ended June 30, 2014, we had 2.6 million Direct Retail active customers, representing an increase of 75.0% over the six months ended June 30, 2013. In 2013 and the six months ended June 30, 2014, net revenue per active customer was $322 and $332, respectively, an increase of 7.3% and 6.1% over 2012 and the six months ended June 30, 2013, respectively. In 2013 and the six months ended June 30, 2014, 47.2% and 51.2% of orders delivered, respectively, were from repeat customers, up from 37.4% and 47.7% in 2012 and the six months ended June 30, 2013, respectively. Additionally, our mobile platform drives growth by engaging and reengaging customers where and when they want to shop; in the first six months of 2014, 27.9% of all Direct Retail orders delivered were placed from a mobile device, up from 21.3% in the first six months of 2013. See the section titled "Management's Discussion and Analysis of Financial Condition and Results of Operations — Key Financial and Operating Metrics" on page 55 for further detail.
80
In 2013 and the six months ended June 30, 2014, we generated net revenue of $915.8 million and $574.1 million, respectively, up 52.4% and 49.8% over 2012 and the six months ended June 30, 2013, respectively. Net revenue in 2013 and the six months ended June 30, 2014 included $673.4 million and $469.5 million, respectively, from Direct Retail and $242.4 million and $104.6 million, respectively, from Other, net revenue generated primarily online through third parties, which we refer to as our retail partners. In 2013, we generated a net loss of $15.5 million and Adjusted EBITDA of $(2.9) million, improvements of $5.5 million and $9.1 million, respectively, over 2012. In the six months ended June 30, 2014, we generated a net loss of $51.4 million and Adjusted EBITDA of $(37.0) million, increases of $43.1 million and $34.9 million, respectively, over the six months ended June 30, 2013. Our net loss and Adjusted EBITDA results were driven primarily by our increased investment in advertising in 2012, 2013, and the six months ended June 30, 2014. Because we hold minimal inventory and a majority of our customers pay us before we pay our suppliers, we have an attractive net working capital dynamic which typically allows us to generate more cash than our Adjusted EBITDA on an annual basis. See "Management's Discussion and Analysis of Financial Condition and Results of Operations — Non-GAAP Financial Measures" on page 55 for more information and for a reconciliation of Adjusted EBITDA.
Our Industry
The home goods market is large and characterized by specific consumer trends, structural challenges and market dynamics that are shaping the future of our industry.
Addressable Market Size and Growth
Large and Growing Home Goods Market with Significant Online Potential: The home goods market is large, global and growing.
According to Euromonitor International, Ltd., a market research firm:
- •
- Our addressable home goods market, which we define as the U.S. furniture and home décor markets, was
$233 billion in 2013.
- •
- The U.S. home goods market can be expected to grow at a 2.5% CAGR in real terms from 2013 to 2023, reaching
$297 billion in 2023.
- •
- The total market size for home goods in Western Europe was $292 billion in 2013.
Based on the above and online market size industry data obtained from comScore, Inc., an internet analytics company, we believe:
- •
- The online penetration of the U.S. home goods market in 2013 was approximately
7%.
- •
- The online penetration of the U.S. apparel and consumer electronics markets in 2013 were approximately 15% and 54%, respectively, which are significantly higher than the online penetration of the U.S. home goods market.
Based on these online penetration rates and the adoption rates of other retail categories, we believe the online penetration of the U.S. home goods market will accelerate significantly from 2013 to 2023, driving outsized growth in the online home goods market. Assuming a $297 billion U.S. market for home goods in 2023 and online penetration of 15%, we believe the online market for home goods would be approximately $45 billion in 2023.
Mass Market for Home Goods is Large and Underserved: The home goods market can be split into three segments: the lower-end, mass and higher-end markets. We believe the mass market for home goods represents the largest addressable opportunity within the home goods sector and that the mass market consumer is underserved due to structural limitations of brick and
81
mortar and other online retailers. These limitations include limited product selection due to high inventory carrying costs and restricted showroom and warehouse space. While there are home goods retailers that serve the mass consumer in various capacities, there are many challenges to providing a one-stop shop for the consumer to easily browse, discover and purchase a large selection of mass market home goods at affordable prices. For example, the lighting market and the paper towel market in the United States are each $7 billion annually according to The Freedonia Group, Inc., Euromonitor and Fisher International, Inc.; however, we believe that while the paper towel market has a limited number of unique products (less than a hundred), we believe the lighting market has a vast number of products (hundreds of thousands).
Women Control an Outsized Share of Spending within the Household: In 2013, women represented 70% of our customers. According to a report released by the U.S. Census Bureau in 2013, there are 158 million women in the United States, of which 63 million are between the ages of 35 and 65. We believe these women control an outsized share of spending, particularly spending related to furniture, home furnishings, décor and goods.
Beneficial Effects of the Millennial Generation Aging and Maturing into the Home Category: We believe there are approximately 73 million millennials (which we define as individuals currently between the ages of 18 to 31) in the United States, many of whom are accustomed to purchasing goods online. According to a survey by Jeffries Group and AlixPartners, as cited by eMarketer, Inc., a market research firm, 29% of millennials buy essential goods online as compared to 12% of baby boomers (which we define as individuals currently between the ages of 48 to 66). As millennials age, start new families and move into new homes, we expect online sales of home goods to increase. In addition, we believe the online home goods market will further grow as older generations of consumers become increasingly comfortable purchasing online.
Mobile Commerce is Growing Rapidly and Only Just Beginning in Home Goods: The proliferation of smartphones and tablets has made mobile commerce one of the fastest growing online channels. Since consumers have access to their mobile devices virtually anytime and anywhere, they have the opportunity to browse, discover and shop throughout the day. According to eMarketer U.S. retail mobile e-commerce from smartphones is projected to grow from $15 billion in 2013 to $35 billion in 2018, and mobile e-commerce from tablets is expected to grow from $26 billion in 2013 to $96 billion in 2018, representing 18.5% and 29.9% CAGRs, respectively. Additionally, from 2013 to 2018, mobile e-commerce as a percentage of overall e-commerce is projected to increase from 15% to 30%.
Why Home is Different
Home is Shopped Differently than Other Retail Verticals: Homes are very personal expressions of self and identity, which is why many consumers seek uniqueness, crave originality and enjoy the feeling created by home design, furniture and décor. As a result, many consumers desire inspiration and attractive visual merchandising when searching for the perfect item. Consumers shopping for home goods often cannot articulate what they are looking for other than to describe a feeling or visual image that they want to capture in their home. For example:
- •
- Emotion: "I'd love my home to look and feel like this..."
- •
- Inspiration: "I'm always browsing for my home, and asking my
friend for ideas..."
- •
- Discovery: "It's hard to describe what I'm looking for... I'll know it when I see it."
In addition, while consumers typically know the names of big box and specialty retailers that offer various home products, they rarely know the names of the product brands or suppliers. We believe traditional search-based sites that rely on directed product search (e.g. "running sneakers")
82
or brand name search (e.g. "Samsung 32-inch LCD television") have difficulty serving customers shopping for home products in this more emotional, visual and inspiration manner.
Home Shoppers Desire Uniqueness, which Requires Vast Selection: In the mass market for home goods, consumers with different tastes, styles, purchasing goals and budgets require a broad selection of products and choices. This need for selection applies across many home categories, including furniture, décor, lighting, kitchen, bed & bath, outdoor, home improvement and baby & kids, each of which has dozens of sub-categories with hundreds to tens of thousands of products. Brick and mortar home goods retailers must balance a consumer's desire for uniqueness, which requires massive selection, with the challenges of high inventory carrying costs and limited showroom and storage space. These challenges often result in low inventory turns. Furniture Today, an industry trade publication, estimated that in 2013 U.S. furniture retailers turned their inventory a median of only 4.4 times per year. We believe traditional online retailers of home goods face similar challenges meeting a home shopper's desire for uniqueness due to high inventory carrying costs and limited storage space.
Time Consuming and Inconvenient for Consumers to Shop across Brick and Mortar Home Retailers: To browse a vast selection of products across highly-fragmented brick and mortar retailers, consumers must shop multiple stores. For example, if a furniture retailer has 20 bedroom sets on its showroom floor, a consumer may feel she must visit multiple stores to see a wide enough selection to make an informed purchase decision that satisfies her style and budget needs. Often this effort requires a consumer to spend an entire day or weekend shopping for a specific item. Product selection at brick and mortar retailers is limited, may not be relevant to a given consumer who lives nearby and may be out of stock. We believe the lack of an easy-to-browse, one-stop shopping experience with massive selection has led to dissatisfaction with brick and mortar home goods shopping. In contrast, Wayfair.com offers over 900 bedroom sets across many styles and prices, which mitigates the need for a consumer to visit multiple stores to find the perfect item at a price she can afford.
Difficult to Browse, Value Shop and Price Compare: Mass market home goods shoppers frequently seek a wide variety of information from disparate online and offline sources to research home goods products. Because this information is not easily comparable, it is more difficult for consumers to make informed home décor and design-related decisions. In addition, consumers may struggle to mix and match different home goods items they are considering buying from multiple traditional brick and mortar retailers. For example, retailers carrying dining room tables and chairs may not also carry lighting.
Challenging Logistics for Consumers and Retailers: Logistics, fulfillment and customer service for home goods products are challenging given the various categories, shapes, sizes, weights and price points in the home market. Large bulky items, such as living room sofas, dining room tables and bed frames, are particularly challenging and costly to warehouse, ship and deliver. Many consumers seek first-rate customer service so they are not burdened with managing delivery, shipping and return logistics on their own. However, we believe big box retailers that serve the mass market for home goods are often unable or unwilling to provide this level of customer service. In addition, many regional retailers do not ship nationally, which we believe is because they lack the required scalable technology, operations and distribution infrastructure.
83
Our Solution
Key Benefits for Our Customers
We offer our consumers vast selection, easy access and value, inspirational content, personalized and mobile shopping experiences and superior customer service to help them find the perfect item at a price they can afford.
Broad Selection and Choice: We offer one of the largest online selections of furniture, home furnishings, décor and goods with over seven million products from over 7,000 suppliers. Our customers shop across different use cases, ranging from practical everyday purchases to inspired and spontaneous shopping. To address the different tastes, styles, purchasing goals and budgets of our target consumers, we offer five distinct brands tailored to meet their specific needs: Wayfair.com, Joss & Main, AllModern, DwellStudio and Birch Lane.
Easy Access and Value: We offer consumers a one-stop shop with home goods pricing designed to be on par with big box retailers and a merchandising experience designed to be on par with specialty retailers. With easy online access to millions of affordable home products across over a thousand sub-categories, we believe consumers no longer need to shop across multiple online and offline retailers to find what they want at affordable price points.
Inspirational Photography and Editorial Content: To inspire customers, we produce beautiful imagery and highly-tailored editorial content both in house and through third parties. We often present and merchandise our home products around an idea, creative content or contextual imagery to drive customer inspiration and sales. We also have relationships with media outlets such as HGTV that allow us to create integrated media campaigns for our brands.
Personalized and Mobile Shopping Experiences: Our purpose-built technology platform, which is fully integrated across all of our sites, including our mobile applications, is designed to provide consumers with a compelling user experience as they browse, discover and purchase our products. We use personalization, based on past browsing and shopping patterns and personal preferences, as well as inspirational imagery, to create a more engaging consumer experience. Our investment in mobile allows us to deliver value, convenience and inspiration to our customers who are browsing and shopping anytime and anywhere, often during spare minutes throughout the day. Our custom-built platform is designed to provide us with detailed and real-time insight into our suppliers' inventory in order to ensure our customers are browsing current information and rarely experience stock-outs.
Superior Customer Service: Our customer service organization has over 440 representatives based in Ogden, UT, Boston, MA, Galway, Ireland and Sydney, Australia. Our representatives are available 7 days a week by phone, email and live chat. By helping consumers navigate our sites, answering their questions and helping to complete their orders, this team helps us build trust with consumers, build our brand awareness, enhance our reputation and drive sales. We are regularly highly ranked by StellaService, a third-party provider of customer service ratings for online retailers.
We grew our active customers from 1.3 million in 2012 to 2.1 million in 2013, representing an increase of 61.0%. We grew our active customers from 1.5 million to 2.6 million in the six months ended June 30, 2013 and 2014, respectively, representing an increase of 75.0%. We delivered 1.8 million orders in 2012 and 3.3 million orders in 2013, representing an increase of 85.2%. We delivered 1.3 million orders and 2.2 million orders in the six months ended June 30, 2013 and 2014, respectively, representing an increase of 76.6%. Of our orders delivered, orders from repeat customers grew from 37.4% to 47.2% from 2012 to 2013 and from 47.7% to 51.2% from the six months ended June 30, 2013 to the six months ended June 30, 2014. Through a mix of increased purchase frequency and average order value, we grew our net revenue per active customer from
84
$300 in 2012 to $322 in 2013 and from $313 to $332 in the six months ended June 30, 2013 and 2014, respectively, representing an increase of 7.3% and 6.1%, respectively. See "Management's Discussion and Analysis of Financial Condition and Results of Operation — Key Financial and Operating Metrics" on page 55 for further detail.
Key Benefits for Our Suppliers
Through our technology platform, we offer our suppliers a cost-effective channel, the ability to leverage our technological expertise, a real-time view of our demand and proven logistics capabilities to help sell their products.
Cost-Effective Access to Our Large Customer Base: We sell products from over 7,000 suppliers, many of which are small, family-run operations without well-known product brands and without easy retail access to a large customer base. We buy products from our suppliers to sell to our large customer base of 2.6 million active customers. This enables suppliers to increase their sales and access the growing e-commerce market.
Ability to Leverage Our Technological Expertise to Drive Sales: Over the past decade, we have purpose-built our technology platform for selling home goods to consumers. Our technology platform is designed to allow suppliers to easily provide us with their full product selection. We offer this vast selection to acquire more customers and drive greater sales. Through our technology platform, we believe many of our suppliers have increased their sales, which has strengthened their loyalty to us. Of the suppliers whose products we sold in 2008, we are still doing business with 72% of them today, and the sales we have generated from their products have increased by 88% from 2008 to 2013.
Real-Time View of Our Demand and Inventory Needs via Data and Analytics: We offer our suppliers a real-time view of our demand and inventory needs via powerful data and analytics. This proprietary information is designed to allow our suppliers to optimize their manufacturing and merchandising strategies to better match supply and demand on our sites, enabling them to turn their inventory faster. We believe our suppliers are better able to anticipate demand than those suppliers whose products are only placed on retailers' showroom floors or warehouses until they are sold.
Proven Logistics Capabilities: Our logistics infrastructure allows us to ship directly from our suppliers to our customers. This supplier direct fulfillment network is a key component of our custom-built and seamlessly integrated technology and operational platform, which also includes extensive supplier integrations, a proprietary transportation delivery network and superior customer service. Once a product is purchased on one of our sites, we notify our supplier and the supplier packages the item for us to ship directly from their facilities to our customer. We offer fast and reliable delivery to our customers via our proprietary transportation delivery network for certain large parcels or FedEx, UPS, the U.S. Postal Service and other carriers for smaller parcels, and we leverage our scale to reduce shipping costs. We also offer a full suite of supplier management tools designed to make it easier for our suppliers to do business with us, including a convenient way to provide us with information about the millions of products that we sell — such as description, classification and attribution tools, dynamic wholesale pricing tools and end-to-end customer order monitoring and exception management tools — via our supplier extranet.
Our technology allows us to work with suppliers of all sizes, types and levels of sophistication. We grew our supplier base from 5,190 in 2011 to 7,052 in 2013.
85
Our Strengths
We offer one of the largest online selections of furniture, home furnishings, décor and goods among with over seven million products from over 7,000 suppliers. Through our e-commerce business model, we are transforming the way people shop for their homes by offering visually inspiring browsing, compelling merchandising, easy product discovery and attractive prices. We believe we have achieved this due to our following key strengths:
Our Large Scale Drives Powerful Network Effects: Our large scale and breadth and depth of product selection has attracted a large and growing customer base. The larger our customer base, the greater and more compelling the opportunity for our suppliers; and, the larger our supplier base and product catalog, the more selection there is for our customers, creating powerful network effects. These network effects are further enhanced by our data and analytics capabilities. With each transaction, we learn more about our customers through data analysis which helps us to acquire customers more economically and personalize their shopping experiences, driving repeat purchases. For our suppliers, our data and analytics capabilities are designed to improve inventory management and logistics. These network effects are fundamental to our business and allow us to grow and to continue investing in advertising, merchandising, product selection, technology and our operations.
Superior Logistics Infrastructure and Supplier Direct Fulfillment Network Require Minimal Inventory and Capital Expenditures: Because we typically ship products directly from our suppliers to our customers, we offer our customers millions of home goods while holding minimal inventory. Through our supplier direct fulfillment network, Direct Retail orders delivered in 2013 were 3.3 million, which generated $673.4 million of net revenue with only $11.4 million in inventory on average in 2013. Direct Retail orders delivered in the six months ended June 30, 2014 were 2.2 million, which generated $469.5 million of net revenue with only $17.4 million in inventory on average in the six months ended June 30, 2014. Our extensive supplier integrations, management tools and processes are designed to allow us to onboard and manage suppliers of any size, type and sophistication level. As a result, we can work with thousands of suppliers to provide a vast selection of home goods for our customers, while buying and holding only select inventory. Additionally, we have required relatively modest capital expenditures to support our operations. In 2013, our property and equipment expenditures were $6.7 million, and our site and software development costs were $9.0 million, an aggregate of only 1.7% of net revenue. In the six months ended June 30, 2014, our property and equipment expenditures were $24.3 million, and our site and software development costs were $6.1 million, an aggregate of only 4.7% of net revenue. Our capital efficiency has allowed us the flexibility to further invest in growing our business.
Trusted Brand with Rapidly Growing Awareness: We offer five distinct brands tailored for customers with different tastes, styles, purchasing goals and budgets. Since the launch of Wayfair.com and our rebranding efforts in 2011, our aided brand awareness has increased to 52% in August 2014, according to Hanover Research. As part of our rebranding efforts, we also focused on driving inspirational buying, including via recently-launched features such as "Ideas & Advice" buying guides, "Shop the Look" rooms by designers and "Editor's Picks," designed to allow consumers to explore different home décor ideas and discover their unique styles. As we grow, our brands are increasingly becoming a significant point of differentiation with both our customers and suppliers.
Personalized Shopping Experiences and Differentiated Use of Data, Analytics and Technology Drive High Customer Repeat Rates: We built our large information database to analyze our sources of visitor traffic and consumers' browsing and shopping patterns across our sites. We apply rigorous analytics to this data in order to generate personalized and relevant shopping experiences for each of our customers in order to improve their shopping experience. We
86
believe this personalization allows us to offer a vast selection of home products without overwhelming individual customers with endless options or less relevant product offerings. Our powerful search is designed to ensure ease-of-use and convenience for our customers, and our sophisticated pricing algorithms are designed to deliver pricing that is competitive with real-time prices in the market. Orders delivered from repeat customers increased from 37.4% in 2012 to 47.2% in 2013 and from 47.7% to 51.2% from the six months ended June 30, 2013 to the six months ended June 30, 2014.
Powerful and Custom-Built Technology Platform: Our co-founders are lifetime tech innovators and have created a company culture deeply rooted in technology. We employ over 300 engineers and data scientists who continue to optimize our technology platform. Our success has been built on a culture of data-driven decision making, operational discipline and an unwavering focus on customer service. Our technology and data focus also facilitates critical e-commerce capabilities such as tailored shopping experiences via multiple brands, customer targeting and personalization, as well as "anytime, anywhere" mobile shopping across our sites. We also provide suppliers with data, analytics and technology to help them grow their sales to us. Our extensive supplier integrations, management tools and processes, which we built specifically for the unique complexities in the home goods market, allow us to onboard and manage suppliers of any size, type and sophistication level, which, we believe, provides a significant competitive advantage.
Well-Positioned to Benefit from Platform Shift to Mobile: Mobile is an increasingly important part of our business, especially for Joss & Main. Our Joss & Main consumers are able to browse our daily flash sales events whenever they have a few minutes of spare time throughout the day, regardless of their location. We launched our mobile applications for Joss & Main in 2012 and Wayfair.com in 2014. In the first six months of 2014, 43.5% of Joss & Main orders delivered and 27.9% of all Direct Retail orders delivered were placed from a mobile device, up from 35.8% and 21.3%, respectively, in the first six months of 2013.
We expect the number of orders delivered that are placed from a mobile device to grow with the launch of our Wayfair.com mobile application and a majority of our mobile-optimized sites in 2014. We have invested in mobile technology to optimize the shopping experience across our sites for use on the majority of mobile devices. We believe that our ability to anticipate and react to significant platform shifts by our consumer audience will continue to drive growth in our business.
Proven and Operationally Disciplined Management Team: Our company was founded in 2002 and bootstrapped by our co-founders from 2002 until June 2011, when we raised our first outside capital for use in our business. Between 2003 and 2011, we grew our net revenue from $7.7 million to $517.3 million, representing a 69.2% CAGR. Over more than a decade, our founder-led management team has developed deep and broad experience in the home goods market and across all facets of e-commerce, including marketing, merchandising, technology and operations. Our success has been built on a culture of data-driven decision making, operational discipline and an unwavering focus on customer service.
Our Growth Strategy
Our goal is to further improve our leadership in the home goods market by pursuing the following key strategies:
Continue Building Leading Retail Home Brands: We currently offer five distinct brands — Wayfair.com, Joss & Main, AllModern, DwellStudio and Birch Lane. We plan to continue expanding our existing brand portfolio and may opportunistically launch new brands. When launching new brands, we expect to leverage our experiences, insights, customer data, merchandising expertise,
87
technology and operational platform and supplier base to create desired brands for our customers with minimal upfront capital.
Acquire More Customers: We believe there is significant opportunity to further grow our customer base. As of June 30, 2014, we had 2.6 million active customers. We plan to grow our customer base by attracting more unique visitors to our sites through two main strategies and then converting those visitors to active customers:
- •
- Increase Brand Awareness. We intend to continue investing in
our brand awareness strategy. In connection with our rebranding efforts that began in 2011, we launched a brand marketing campaign focused on TV and online advertising for Wayfair.com. We launched
national TV campaigns for Wayfair.com in September 2012 and for Joss & Main in October 2013. We have achieved 52% aided brand awareness in August 2014, according to Hanover Research. Our online
efforts are focused on building brand awareness to drive visitor traffic via direct navigation, search engine optimization and email marketing campaigns.
- •
- Expand Direct Online Marketing. We plan to continue to expand our direct online marketing efforts through paid campaigns including display advertising, search engine marketing, comparison shopping engines, affiliate networks and social advertising.
Continue to Invest in the Consumer Experience: We have made significant investments to improve the consumer experience on our sites, such as creating highly engaging visual imagery and merchandising, as well as easy-to-use navigation tools and personalization features that enable better product discovery. For example, we recently launched features such as "Ideas & Advice" buying guides, "Shop the Look" rooms by designers and "Editor's Picks." We plan to continue to develop features to enhance the consumer experience on our sites.
Increase Repeat Purchasing through Merchandising, Data, Analytics and Technology: Our continued investments in merchandising, data, analytics and technology allow us to deliver increasingly tailored and personalized shopping experiences for consumers across our sites. For example, by analyzing the past browsing and purchasing history of consumers that visit our sites, we are able to show them a tailored selection of products when they visit Wayfair.com or JossandMain.com. We believe our focus on a personalized shopping experience drives sales from new customers as well as repeat customers. In 2013, our Direct Retail sales consisted of over 3.3 million orders delivered for 2.1 million customers, representing 85.2% and 61.0% year-over-year growth, respectively. In 2013, 47.2% of orders delivered were placed by repeat customers, up from 37.4% in 2012, and net revenue per active customer was $322, up 7.3% over 2012.
Add New Suppliers and Deepen Relationships with our Existing Suppliers: We continue to seek new suppliers with compelling products to add to our selection of home goods. We leverage our significant scale and the structural advantages in our business model to build, maintain and deepen long-term relationships with our suppliers. Our platform creates a large scale marketing, technology and distribution advantage to help our suppliers efficiently and cost-effectively drive sales. Our supplier management tools — including wholesale price management, self-service product addition and fulfillment performance monitoring — are designed to allow our suppliers to sell more of, and have greater visibility into our sales of, their products on our sites.
Continue to Invest in Our Technology and Operational Platform, Including Our Mobile Platform: We intend to continue to enhance the systems our consumers use to interact with our sites in order to facilitate better product discovery and to provide customer inspiration and idea generation tools through personalized interactions and high-speed, reliable site performance. We also plan to continue investing in our infrastructure, including enhancing our merchandising, data, analytics and technology platform, as well as developing additional logistics and transportation
88
solutions, self-service tools for our suppliers, fulfillment offerings and enhancing our development, testing and deployment systems. Finally, we plan to continue to launch additional mobile capabilities. Following the successful launch of our Joss & Main mobile application in 2012, in 2014 we launched the Wayfair.com mobile application and mobile-optimized sites across a majority of our domestic and international sites.
Expand Internationally: Until late 2012, we were primarily focused on growing our U.S. business. We currently deliver products to customers in a number of countries, including the United States, the United Kingdom, Canada, Australia, Germany, France, Austria, Ireland and New Zealand. We are investing in our international business by building our international infrastructure, developing deeper country-specific knowledge, building international supplier networks and establishing our brand presence in select international regions. We intend to expand in these countries, especially Joss & Main, which we launched in the United Kingdom, France and Germany in 2014. In 2013, we generated net revenue outside of North America of $41.5 million, or 4.5% of our total net revenue.
Opportunistically Pursue Strategic Acquisitions: Since our inception, we have made two acquisitions, the remainder of the stake of our Australian joint venture in 2011 and DwellStudio in 2013. We may continue to expand our business through opportunistic acquisitions that allow us to enhance our customer offering, build our multi-brand portfolio, enter new geographies or enhance our operational infrastructure.
Our Customers
Our typical customer is a 35 to 65 year old woman with an annual household income of $60,000 to $175,000, who we consider to be a mass market consumer and who we believe is underserved by traditional brick and mortar and other online retailers of home goods. Historically, she has had three primary ways to shop for home goods: (1) affordable mass market alternatives such as big box retailers, (2) higher-end, more curated alternatives such as specialty retailers and (3) regional home décor and furniture retailers. Mass market retailers may be cost-effective but typically do not have aspirational and inspirational merchandising. They also tend to have limited product selection in home goods. Higher-end specialty retailers tend to be more inspirational with beautifully curated merchandise, but the home products they offer often exceed the mass consumer's budget. Regional home décor and furniture retailers often have a regionally inspired selection that is limited and typically not beautifully merchandised. Consumers often must visit multiple stores to make an informed purchase decision, requiring a larger time commitment. We believe none of these alternatives fully serves the mass consumer's home goods needs, which is why we built Wayfair. We have created an e-commerce model that offers vast selection, visually inspiring browsing, compelling merchandising, easy product discovery and attractive prices.
We have a significant opportunity to serve additional mass market consumers shopping for their homes. According to a report released by the U.S. Census Bureau in 2013, there are 63 million women in the United States between the ages of 35 and 65. In 2013, 2.1 million active customers made Direct Retail purchases from us.
We also believe the aging of the millennial generation provides a growing population of target customers. According to a survey by Jeffries Group and AlixPartners as cited by eMarketer, a market research firm, 29% of millennials buy essential goods online as compared to 12% of baby boomers. As millennials age, start new families, and move into homes, we expect this generation to represent an increasing percentage of our customer base.
89
Our Brands and Websites
Each of our customers has a different taste, style, purchasing goal and budget when shopping for her home. To help her find the right products for her home, we offer five distinct brands: Wayfair.com, Joss & Main, AllModern, DwellStudio and Birch Lane. Each brand has a unique identity that offers a tailored shopping experience and rich product selection to a different target audience.
Wayfair.com: Wayfair.com is our flagship mass market brand that focuses on offering the largest selection of home furnishings and décor, from low- to high-end and across all styles. Customers browse our vast selection and can discover and purchase products in one convenient and affordable place online. Paired with curated daily sales events and inspirational content, we believe Wayfair.com meets a broad range of consumers' home shopping needs.
Joss & Main: Joss & Main is our online flash sales site that combines inspiring home design with significant savings. Joss & Main is designed to bring a compelling editorialized shopping experience to our loyal customer base every day. We believe Joss & Main provides a stylish lifestyle within reach for our customers.
Unlike our other brands, Joss & Main operates exclusively as a flash sales site, which means we launch various online sale events daily featuring images of styled rooms created to provide the consumer with design inspiration. We typically notify our customers of these daily sale events via "push" notifications to their desktop and mobile devices. These events are available for a limited time, and often have limited inventory, which we believe creates a sense of urgency and excitement for customers.
AllModern: AllModern is an online destination for original design for modern home enthusiasts. From beloved icons to emerging brands, AllModern offers a comprehensive online collection of modern design at a range of price points. The AllModern shopping experience combines product discovery and modern design principles. AllModern also offers daily sale events for certain products.
DwellStudio: DwellStudio is an online design studio for modern, fashion-forward home furnishings. The collection — including furniture, bedding, home accessories and a line of baby and children's furniture — features sophisticated style and high quality. Founded by Christiane Lemieux in 2000, the studio's philosophy is to design pieces with classic elements for a modern setting.
Birch Lane: Birch Lane is a new destination for classic style and timeless home designs. We believe Birch Lane's traditionally-styled furniture and décor collections, shoppable online or through a print catalog, inspire customers to bring home the looks they love at affordable prices.
In addition to our five brands, we also generate net revenue through two other sources:
Retail Partners: A portion of our net revenue is generated online by retail partners. These relationships allow consumers to purchase Wayfair products through the retail partners' sites. Our retail partners enable us to reach a broader consumer base, help us build our brand and drive incremental net revenue.
Wayfair Media Solutions: Wayfair helps selected manufacturers, retailers and other advertisers market to our large consumer audience. For example, regional and national furniture stores often advertise with us to geo-target local consumers. National stores and consumer brands across industries can display advertisements on our sites, as well as engage our consumer audience with integrated marketing campaigns, sponsored stories or buying guides.
90
Our Operations
Category Management: Our category management team is responsible for deepening our relationships with existing suppliers as well as sourcing new suppliers so that we continue broadening our product selection for consumers. Our largest product categories include furniture, décor, lighting, kitchen, bed & bath, outdoor, home improvement and baby & kids. Within each of these product categories, there are also numerous product sub-categories. Our category managers work with suppliers to negotiate discounts and promotions on an ongoing basis. Category managers and buyers also seek to identify and fill any gaps in our product selection. In 2013, we added over 800 new suppliers.
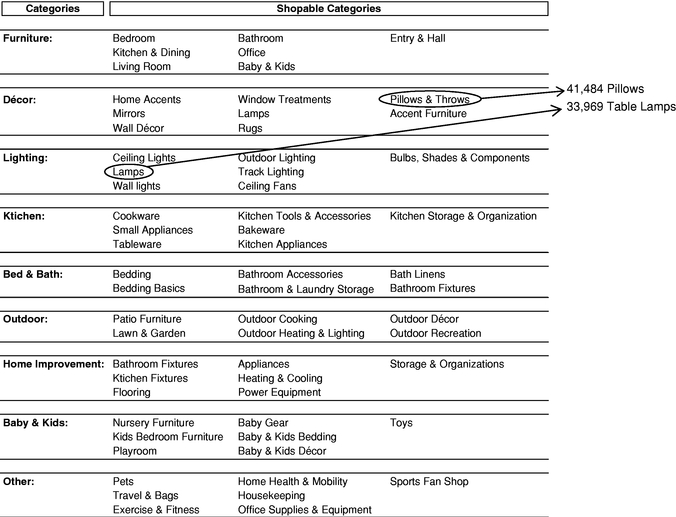
Supplier Management: Our supplier management team seeks to optimize the performance of the suppliers in our network. We have built extensive supplier integrations, management tools and processes that allow us to efficiently onboard and manage suppliers of any size, type and sophistication level. Our supplier management tools include wholesale price management, self-service product addition and fulfillment performance monitoring.
Site Merchandising: Our site merchandising team manages the presentation of products across all our sites, as well as the customer shopping experience. Our enhanced product imagery, presentation standards specific to and appropriate for individual product categories and detailed and intuitive site navigation are designed to provide a relevant, seamless shopping experience across our catalog. The merchandising team seeks to continually enhance the customer experience
91
by providing regularly updated, detailed information for each of the products we sell to offer the customer a data rich shopping experience.
Inspiration, Editorial Content and Photography: We seek to provide our consumers with a visually appealing and inspiring online shopping experience. While we increasingly style and photograph more of our product displays at our in-house studios, we also utilize third party studios. As part of our rebranding efforts in 2011, we launched editorial features such as "Ideas & Advice" buying guides, "Shop the Look" rooms by designers and "Editor's Picks," which are designed to allow consumers to explore different home décor ideas and discover their unique styles. We also manage blogger contributed content and work with media partners such as Coastal Living, Country Living, This Old House, Sunset and HGTV to bring their content to our site. We believe our editorial content and visual imagery provide an engaging and inspiring experience for consumers.
Pricing Strategy: Our pricing team approaches pricing scientifically and algorithmically, by applying data and analytics to optimize our pricing on a real-time basis. Our goal is to maintain competitive pricing that delivers good value to our customers. Therefore, we dynamically price and re-price our products across all of our sites on a regular basis. We believe our technological skills and capabilities enable us to understand our competitors' pricing and dynamically adjust to offer competitive prices on any given day. Because we focus only on the home, we also focus on attributes that are uncommon to most categories but relevant for the home market. For instance, in the home market, customers frequently pick products based upon pricing relative to the immediately available alternative options. In addition, we believe the fact that we are an online home goods retailer that takes minimal inventory gives us greater pricing flexibility relative to brick and mortar home goods retailers who purchase and hold inventory.
Fulfillment and Logistics: Our logistics infrastructure allows us to ship directly from our suppliers to our customers. This supplier direct fulfillment network is a key component of our custom-built and seamlessly integrated technology and operational platform, which also includes extensive supplier integrations, a proprietary transportation delivery network and superior customer service. Once a product is purchased on one of our sites, we notify the appropriate supplier, and that supplier packages the item for us to ship directly from its facility to our customer. We offer fast and reliable delivery to our customers via our proprietary transportation delivery network for certain large parcels or FedEx, UPS, the U.S. Postal Service and other carriers for smaller parcels and we leverage our scale to reduce shipping costs. In the first six months of 2014, we shipped orders within North America out on an average of 2.4 days, different handling requirements and complexities for large and small parcel items. We have scaled our business from 1.8 million orders delivered in 2012 to 3.3 million orders delivered in 2013.
92
Order Fulfillment and Logistics Flow
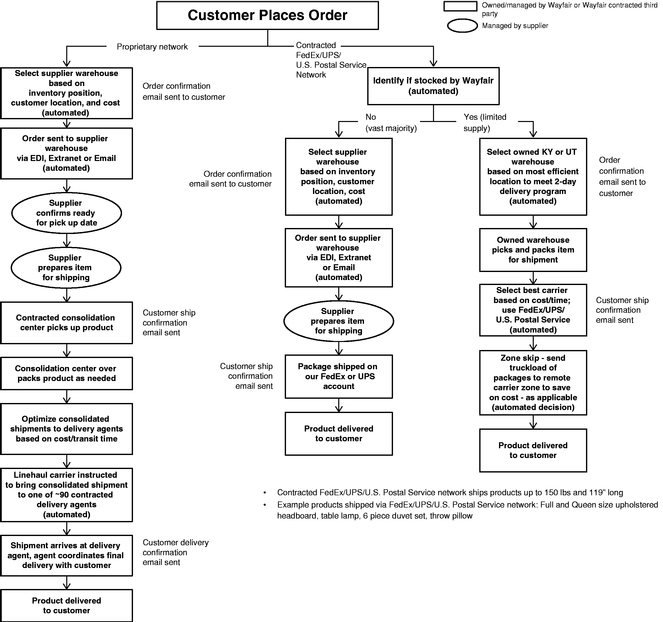
Customer Service. Our customer service organization has over 440 customer service representatives based in Ogden, UT, Boston, MA, Galway, Ireland and Sydney, Australia. Our representatives are available seven days a week by phone, email and live chat. By helping consumers navigate our sites, answering their questions and completing their orders, this team helps us build trust with consumers, build our brand awareness, enhance our reputation and drive sales. We are regularly highly ranked by StellaService, a third-party provider of customer service ratings for online retailers.
Our Technology
We are a technology company first and foremost. Technology is infused in everything we do, not just the consumer facing sites. Over the past 12 years, we have custom-built our proprietary technology and operational platform to deliver the best experience for both our customers and suppliers. Our success has been built on a culture of data-driven decision-making, operational
93
discipline and an unwavering focus on the customer. We employ over 300 engineers and data scientists and believe we are able to attract and retain some of the best technological minds. Our engineering department is organized into four operating groups (storefront, operations, infrastructure and corporate IT) that have built a full set of technology solutions specific for the home goods market.
Storefront: We offer a large set of tools and systems with which our customers directly interact, which we refer to as our storefront system. Our storefront team develops an experience specifically tuned for shopping the home goods category. The major areas this group works on are:
- •
- Product Discovery and Site Search
- •
- Merchandising Systems
- •
- Content Publishing Systems
- •
- Multi-Device Delivery (e.g. mobile)
- •
- User Generated Content (e.g. reviews)
- •
- Online Flash Sales Systems
- •
- Checkout Systems
- •
- Customer Account Self-Service Tools
Operations: A majority of the software we have written is designed to deliver the reliable and consistent experience consumers desire, but is not consumer facing. Our engineering operations group is responsible for these areas, including:
- •
- Email Marketing Platform
- •
- Data Science and Clickstream Analysis
- •
- Product Catalog Management Systems
- •
- Product Pricing Systems
- •
- Partner Automation
- •
- Product Feed Tools that enable marketing on third party sites
- •
- Marketing Program Support and Automation
- •
- Fulfillment Center Management Systems
- •
- Transportation Selection Algorithms
- •
- Domestic and International Logistics Automation
- •
- Fulfillment Services
- •
- Supplier Self-Service Systems (our supplier extranet platform)
- •
- Order Processing Algorithms
- •
- Payment Processing Systems
- •
- Supplier Management Systems
- •
- Financial Systems
- •
- Global Inventory Visibility
94
Infrastructure: We have developed a variety of tools and systems that enable us to move quickly and efficiently as we scale our organization. Our infrastructure group supports a variety of proprietary, purchased as well as open source systems. Many of our systems run in multiple data centers. Our infrastructure group is primarily focused on the tools, processes, systems and platforms that provide the technical infrastructure that drives our business, including:
- •
- Deployment Infrastructure
- •
- Server, Storage, Communication and Datacenter Infrastructure
- •
- Monitoring and Alerting
- •
- Issue Identification, Tracking and Resolution
- •
- Human Resource Systems
- •
- Project Management Systems
- •
- Project Tracker System (our internal collaboration tool)
- •
- SQL Databases
- •
- No-SQL Data Storage and Retrieval Systems
- •
- Big Data Analytics and Reporting Platforms
- •
- Performance Improvement
- •
- Security
- •
- Testing and Quality Assurance
- •
- Source Code Control and Revision Management
Corporate IT: In addition to developing a large amount of software that is specific to our business, we run systems common across multiple industries. Our Corporate IT group is primarily focused on these parts of our business, including:
- •
- Internal Messaging Infrastructure
- •
- File Sharing and Collaboration Systems
- •
- Internal Knowledge Bases
- •
- Electronic Data Interchange and External Data Exchange Systems
- •
- Employee Support and Help Desk Services
- •
- Call Center Systems and Corporate Phone Systems
- •
- Customer Communication Systems
Our Competition
The market for online home goods and furniture is highly competitive, fragmented and rapidly changing. While we are primarily focused on the mass market, we compete across all segments of the home goods market. Our competition includes furniture stores, big box retailers, department stores, specialty retailers and online home goods retailers and marketplaces:
- •
- Furniture
Stores: Ashley Furniture, Bob's Discount Furniture, Havertys, Raymour & Flanigan and Rooms To Go;
- •
- Big Box Retailers: Bed Bath & Beyond, Home Depot, IKEA, Lowe's, Target and Walmart;
95
- •
- Department
Stores: JCPenney and Macy's;
- •
- Specialty
Retailers: Crate and Barrel, Ethan Allen, HomeGoods, Pottery Barn and Restoration Hardware; and
- •
- Online Home Goods Retailers and Marketplaces: Amazon, eBay and One Kings Lane.
We believe that the primary competitive factors in the mass market are vast selection, visually inspiring browsing, compelling merchandising, ease of product discovery, price, convenience, reliability, speed of fulfillment and customer service. We believe our technological and operational expertise allows us to provide our customers with a vast selection of goods, attractive price points, reliable and timely fulfillment, plus superior customer service, and that the combination of these capabilities is what provides us with a sustainable competitive advantage.
Sales and Marketing
Our sales and marketing efforts bring new and repeat customers to our sites and help us acquire their email addresses through various paid and non-paid advertising methods. Our paid advertising efforts include search engine marketing, display advertising, paid social media, catalog and television advertisements. Our non-paid advertising efforts include search engine optimization, non-paid social media, mobile "push" notifications and email. Upon acquiring a customer or a potential customer's email address, we seek to increase their engagement with our sites and drive repeat purchases. This effort to increase engagement and repeat purchasing is primarily accomplished via unpaid mobile "push" notifications and email marketing efforts.
We rigorously manage our paid marketing efforts, to ensure that each new spending initiative is cost-effective with a measurable return on investment within a short period of time. This disciplined approach of required investment payback periods ensures that we only pursue sales and marketing strategies with the best return profiles.
Our Culture
We believe a critical component of our success has been our corporate culture that influences the way we incorporate technology solutions, the way we serve our customers, our daily focus on execution and a constant desire to innovate further. We have nurtured this culture to ensure we are providing our customers with a "zillion" options while providing a transparent transaction process for all parties involved. We believe our culture and focus has fostered accountability by nurturing the type of "go to" employees that are never done improving Wayfair for our customers and suppliers. To help new employees orient to our culture we call out five specific values:
1. We Love a "Zillion" Options. Delivering options across styles and price points for our customers is what we do. With more styles and more choice, there is more chance of finding the perfect item for your home.
2. We Use Our Brains. We trust and empower our employees to build solutions and systems for complex problems. We reward brains with more responsibility and experience.
3. We Like Transparency. We gather and share information openly and transparently because it enables us to figure things out, build relationships and make shopping easier.
4. We're Never Done. We're passionate about continually making things better and faster through open minds and teamwork, measuring results, then adjusting. Some call it a learning mindset, some call it flexibility. We call it another day at the office.
5. We Are "Go-To" People. We are a company full of "go-to" people who help each other, our customers and our communities by being active, accountable and accessible.
96
Facilities
Our corporate headquarters are in Boston, MA, where we currently occupy approximately 133,000 square feet of office space pursuant to a lease that expires in June 2024. In 2015, we will expand our headquarters to occupy approximately 142,000 additional square feet of office space. Prior to the expansion of our headquarters in 2015, we will also occupy additional office space in two locations near our headquarters. We also lease approximately 795,000 square feet of fulfillment center space in Hebron, KY and Ogden, UT. This fulfillment center space is expected to expand by an additional 180,000 square feet in 2015. We lease additional office space in Ogden, UT, Orem, UT and New York, NY, a photography studio in Framingham, MA and retail space in New York, NY for DwellStudio.
Our European headquarters are located in Galway, Ireland, where we currently lease approximately 6,200 square feet of office space. We also lease additional office space in Sydney, Australia, London, England and Berlin, Germany for our international operations.
We believe that our facilities are sufficient to meet our current needs. We intend to add new facilities or to expand our existing facilities as we add employees and expand our operations. We believe that additional space that is suitable for our needs will be available as needed to accommodate any such expansion of our operations.
Employees
As of August 31, 2014, we had 2,104 full-time equivalent employees. Additionally, we rely on independent contractors and temporary personnel to supplement our workforce, primarily in our fulfillment centers. None of our employees is represented by a labor union or covered by a collective bargaining agreement. We consider our relationship with our employees to be good.
Legal Matters
From time to time we may be involved in claims that arise during the ordinary course of business. Although the results of litigation and claims cannot be predicted with certainty, we do not currently have any pending litigation to which we are a party or to which our property is subject that we believe to be material. Regardless of the outcome, litigation can be costly and time consuming, as it can divert management's attention from important business matters and initiatives, negatively impacting our overall operations. In addition, we may also find ourselves at greater risk to outside party claims as we increase our operations in jurisdictions where the laws with respect to the potential liability of online retailers are uncertain, unfavorable, or unclear.
Intellectual Property
Our intellectual property, including any trademarks, copyrights, domain names, patents, trade dress, trade secrets and proprietary technologies, is an important part of our business. To protect our intellectual property, we rely on a combination of laws and regulations, as well as contractual restrictions.
We pursue the registration of our trademarks, including "Wayfair" and certain variations thereon, copyrights and domain names in the United States and certain foreign locations. As of August 31, 2014, we had 72 trademark registrations and 26 trademark applications pending. In addition, we had 85 copyright registrations, primarily covering the content we create for our sites, including our proprietary designs. We also rely on the protection of laws regarding unregistered copyrights for our proprietary software and certain other content we create. We will continue to evaluate the merits applying for copyright registrations in the future. We have registered numerous domain names, including "Wayfair.com," "AllModern.com" and "JossandMain.com."
97
We have an issued patent regarding our proprietary technology and we are evaluating additional patent applications. We expect to consider filing patent applications for future technology inventions. We also rely on trade secret laws to protect our proprietary technology and other intellectual property.
To further protect our intellectual property, we enter into confidentiality and assignment of invention assignment agreements with employees and certain contractors and confidentiality agreements with other third parties, such as suppliers.
Government Regulation
Our business is subject to foreign and domestic laws and regulations applicable to companies conducting business on the Internet. Jurisdictions vary as to how, or whether, existing laws governing areas such as personal privacy and data security, consumer protection or sales and other taxes, among other areas, apply to the Internet and e-commerce, and these laws are continually evolving. For example, certain applicable privacy laws and regulations require us to provide customers with our policies on sharing information with third parties, and advance notice of any changes to these policies. Related laws may govern the manner in which we store or transfer sensitive information, or impose obligations on us in the event of a security breach or inadvertent disclosure of such information. International jurisdictions impose different, and sometimes more stringent, consumer and privacy protections. Additionally, tax regulations in jurisdictions where we do not currently collect state or local taxes may subject us to the obligation to collect and remit such taxes, or to additional taxes, or to requirements intended to assist jurisdictions with their tax collection efforts. New legislation or regulation, the application of laws from jurisdictions whose laws do not currently apply to our business, or the application of existing laws and regulations to the Internet and e-commerce generally could result in significant additional taxes on our business. Further, we could be subject to fines or other payments for any past failures to comply with these requirements. The continued growth and demand for e-commerce is likely to result in more laws and regulations that impose additional compliance burdens on e-commerce companies.
98
Executive Officers and Directors
The following table sets forth the name, age and position of each of our executive officers and directors as of August 31, 2014.
Name
|
Age
|
Position(s)
|
||
|---|---|---|---|---|
Niraj Shah |
40 | Co-Founder, Chief Executive Officer, Director (Co-Chairman) | ||
Steven Conine |
42 | Co-Founder, Chief Technology Officer, Director (Co-Chairman) | ||
Michael Fleisher |
49 | Chief Financial Officer | ||
Edmond Macri |
42 | Senior Vice President, Marketing and Analytics | ||
Nicholas Malone |
49 | Chief Administrative Officer | ||
John Mulliken |
42 | Senior Vice President, Strategic Initiatives | ||
Steve Oblak |
41 | Senior Vice President, General Manager, Wayfair.com | ||
James Savarese |
48 | Chief Operating Officer | ||
Neeraj Agrawal(1) |
41 | Director | ||
Julie Bradley(1)(3) |
45 | Director | ||
Alex Finkelstein(2) |
38 | Director | ||
Michael Kumin(2)(3) |
42 | Director | ||
Ian Lane(1) |
37 | Director | ||
Romero Rodrigues(2) |
36 | Director |
- (1)
- Member
of our audit committee.
- (2)
- Member
of our compensation committee.
- (3)
- Member of our nominating and corporate governance committee.
Niraj Shah is our co-founder and has served as our Chief Executive Officer and a director since 2002. Prior to founding Wayfair, Mr. Shah served as Chief Executive Officer for Simplify Mobile Corporation, an enterprise software company he co-founded in 2001, and Entrepreneur-in-Residence at Greylock Partners, a venture capital firm, in 2001. Mr. Shah served in various roles at iXL Enterprises, Inc., including as Chief Operating Officer and a director, from 1998 to 2000, and as Chief Executive Officer of Spinners Incorporated, an IT consulting company he co-founded, from 1995 to 1998. Mr. Shah received a B.S. from Cornell University. We believe Mr. Shah is qualified to serve on our board of directors due to the leadership and operational experience he brings as our Chief Executive Officer, as well as the vision and continuity he brings as our co-founder.
Steven Conine is our co-founder and has served as our Chief Technology Officer and a director since 2002. Prior to founding Wayfair, Mr. Conine served as Chief Technology officer for Simplify Mobile Corporation, an enterprise software company he co-founded in 2001, Chief Operating Officer for the London office of iXL Enterprises, Inc. from 1999 to 2000, and Chief Technology Officer of Spinners Incorporated, an IT consulting company he co-founded, from 1995 to 1998. Mr. Conine received a B.S. from Cornell University. We believe Mr. Conine is qualified to serve on our board of directors due to the technological and operational experience he brings as our Chief Technology Officer, as well as the vision and continuity he brings as our co-founder.
Michael Fleisher has served as our Chief Financial Officer since October 2013. Prior to joining Wayfair, Mr. Fleisher served at Warner Music Group as the Vice Chairman, Strategy and Operations from 2008 to 2011 and also served as Executive Vice President and Chief Financial Officer from
99
2005 to 2008. Mr. Fleisher's responsibilities for Warner Music Group included overseeing its global corporate strategy and operations. He was previously the Chief Executive Officer of Gartner, Inc. from 1999 to 2005 and its Chairman from 2001 to 2005. Mr. Fleisher serves on the board of directors of Vistage International. Mr. Fleisher received a B.S. from the University of Pennsylvania's Wharton School of Business.
Edmond Macri has served as our Senior Vice President, Marketing and Analytics since March 2013 and previously served as our Vice President, Marketing and Business Intelligence from March 2009 to March 2013 and our Director, Business Intelligence from March 2007 to March 2009. Prior to joining Wayfair, Mr. Macri served as Product Marketing Manager at Emptoris, Inc. from 2005 to 2007, Marketing Manager at DigitasLBi from 2001 to 2005 and as a Software Product Manager and Programmer and Analyst at Bain & Company from 1994 to 1999. Mr. Macri received a B.A. from Dartmouth College and an M.B.A from the Massachusetts Institute of Technology's Sloan School of Management.
Nicholas Malone has served as our Chief Administrative Officer since October 2013 and previously served as our Chief Financial Officer from August 2005 to October 2013. Prior to joining Wayfair, Mr. Malone served as Director of Finance for Siemens Information Systems Ltd. from 2003 to 2005, Vice President of Finance for Mercator Software, Inc. from 2001 to 2003 and Vice President of Finance and Assistant Treasurer for Enhance Financial Services Group (now known as Radian Group Inc.) from 1993 to 1998. He received a B.S.B.A. from American University's Kogod School of Business and an M.B.A from Fordham University.
John Mulliken has served as our Senior Vice President, Strategic Initiatives since July 2013 and previously as our Vice President, Strategic Initiatives from February 2010 to June 2013. Mr. Mulliken launched Joss & Main, our online flash sales site, and Birch Lane, our newest brand. Prior to joining Wayfair, he served at Boston Consulting Group as a Principal, Project Leader and Consultant from 2004 to 2010. Mr. Mulliken's responsibilities for Boston Consulting Group included leading the multi-channel retail group and serving on the leadership team of the Global Center for Consumer Insight. Mr. Mulliken received a B.A. from Reed College and an M.B.A. from the London Business School.
Stephen Oblak has served as our Senior Vice President, General Manager of Wayfair.com since March 2014 and previously as our Vice President, Category Management from July 2011 to March 2014 and as our Director, Category Management from October 2009 to July 2011. Prior to joining Wayfair, Mr. Oblak served as Vice President of River West Brands, a brand acquisition and enterprise development company focused on acquiring and re-commercializing dormant consumer brands, from 2007 to 2009. Mr. Oblak's responsibilities for River West Brands included conducting strategic due diligence on brand investment opportunities in the beverage, personal care and entertainment categories. He previously served as Senior Director of the Strategy Consulting Group of FutureBrand Worldwide from 2003 to 2007, as a consultant to Peppers & Rogers Group from 2002 to 2003 and as a Senior Manager of the International Financial Services practice of the Corporate Executive Board from 1995 to 1999. He received a B.A. from Hamilton College and an M.B.A. from Northwestern University's Kellogg School of Management.
James Savarese has served as our Chief Operating Officer since February 2014 and previously as our Senior Vice President, Operations from September 2008 to February 2014. Prior to joining Wayfair, Mr. Savarese served as a founding member and Senior Vice President, Products & Services of ArrowStream, Inc. from 2001 to 2008, as a Global Client Partner at iXL Enterprises, Inc. from 1999 to 2001 and as a Senior Manager at Deloitte Consulting from 1993 to 1999. He received a B.A. from Dartmouth College and an M.B.A. from the University of Chicago's Booth School of Business.
Neeraj Agrawal has served as a member of our board of directors since June 2011. Since 2007, Mr. Agrawal has served as a General Partner of Battery Ventures, a venture capital firm that
100
he joined in 2000. He previously served as Operations Director for Sky TV Latin America, a News Corp. subsidiary, from 1996 to 1998. Mr. Agrawal serves on the board of directors of Bazaarvoice, Inc., Marketo, Inc. and several private companies. He received a B.S. from Cornell University and an M.B.A. from Harvard Business School. We believe Mr. Agrawal is qualified to serve on our board of directors due to his experience in the e-commerce industry as a venture capitalist and his service on the board of directors of other technology companies.
Julie Bradley has served as a member of our board of directors since September 2012. Ms. Bradley has served as the Chief Financial Officer of TripAdvisor, Inc., an online travel planning site, since October 2011. She previously served as the Chief Financial Officer of Art Technology Group, Inc., an e-commerce software company, from 2005 to 2011, the Vice President of Finance for Akamai Technologies, Inc. from 2000 to 2005 and an accountant at Deloitte & Touche LLP from 1993 to 2000. Ms. Bradley served on the board of directors of ExactTarget, Inc. from September 2012 to July 2013. Ms. Bradley received a B.A. from Wheaton College. We believe Ms. Bradley is qualified to serve on our board of directors due to her financial expertise and her experience in corporate development.
Alex Finkelstein has served as a member of our board of directors since June 2011. Mr. Finkelstein has served as a General Partner at Spark Capital, a venture capital firm, since 2009, and joined the firm at its inception in 2005 as a Principal. He previously served as a Principal at Seed Capital Partners from 2003 to 2005 and as an associate at GrandBanks Capital, a venture capital firm, from 2000 to 2003. Mr. Finkelstein serves on the board of directors of a number of private companies. Mr. Finkelstein received a B.A. from Middlebury College. We believe Mr. Finkelstein is qualified to serve on our board of directors due to his experience in the e-commerce industry as a venture capitalist and his service on the board of directors of other technology companies.
Michael Kumin has served as a member of our board of directors since June 2011. Mr. Kumin has worked as an investment professional at Great Hill Partners, a private equity investment firm, since 2002 where he currently serves as a Managing Partner. Mr. Kumin also currently serves on the board of directors of Vitacost.com, Inc. and a number of private companies. He also served on the board of directors of Spark Networks, Inc. from June 2006 to December 2013. Mr. Kumin received a B.A. from Princeton University's Woodrow Wilson School of Public & International Affairs. We believe Mr. Kumin is qualified to serve on our board of directors due to his experience in the e-commerce industry as a private equity investor and his service on the board of directors of other technology companies.
Ian Lane has served as a member of our board of directors since June 2011. Mr. Lane has worked as an investment professional at HarbourVest Partners, LLC, a private equity investment firm, since 2003, where he currently serves as a Principal. He previously served as an analyst in the mergers and acquisitions group of J.P. Morgan Securities, Inc. Mr. Lane serves on the board of directors of a number of private companies. Mr. Lane received a B.S. from the University of Florida, a M.S. from the University of Florida and an M.B.A. from Harvard Business School. We believe Mr. Lane is qualified to serve on our board of directors due to his experience in the e-commerce industry as a venture capitalist and his service on the board of directors of other technology companies.
Romero Rodrigues has served as a member of our board of directors since July 2014. Mr. Rodrigues has served as Global CEO Comparison Shopping at Naspers Limited since September 2009. He previously served as Chief Executive Officer of BuscaPé Company, a comparison shopping e-commerce company which he co-founded in 1998, until it was acquired by Naspers Limited in September 2009. Mr. Rodrigues currently serves on the board of directors Endeavor Global, Brazil. Mr. Rodrigues has a B.S. from the University of São Paulo. We believe
101
Mr. Rodrigues is qualified to serve on our board of directors due to his experience in the e-commerce industry as a founder and executive.
Composition of the Board of Directors
Our board of directors currently consists of eight members. The members of our board of directors were elected in compliance with the provisions of the LLC Agreement and the second amended and restated voting agreement, dated as of March 5, 2014, entered into by Wayfair LLC and certain of our stockholders, or Voting Agreement. Upon the Corporate Reorganization, in the case of the LLC Agreement, and upon the closing of this offering in the case of the Voting Agreement, the LLC Agreement and the Voting Agreement will terminate and there will be no further contractual obligations regarding the election of our directors. Our directors hold office until their successors have been elected and qualified or until the earlier of their resignation or removal. After this offering, our co-founders will own more than 50% of our outstanding common stock, and as such, we qualify as a controlled company under the NYSE rules. We do not intend to rely on the controlled company exemptions that would otherwise allow us to elect not to comply with certain corporate governance requirements.
Our restated certificate of incorporation that will become effective upon the closing of this offering provides that the authorized number of directors may be changed only by resolution of the board of directors. Our restated certificate of incorporation and amended and restated bylaws that will become effective upon the closing of this offering also provide that our directors may be removed only for cause by the affirmative vote of the holders of at least 662/3% of the votes that all of our stockholders would be entitled to cast in an annual election of directors. Upon the expiration of the term of a director, that director will be eligible to be elected for a new one-year term at the annual meeting of stockholders in the year in which their term expires. An election of our directors by our stockholders will be determined by a plurality of the votes cast by the stockholders entitled to vote on the election.
Classified Board
We will not have a classified board of directors, and all directors will be elected for annual terms, so long as the outstanding shares of our Class B common stock represent more than 10% of the outstanding shares of Class A common stock and Class B common stock. When the outstanding shares of our Class B common stock represent less than 10% of the then outstanding shares of Class A common stock and Class B common stock, we will have a classified board of directors consisting of three classes of approximately equal size, each serving staggered three-year terms. Our directors will be assigned by the then-current board of directors to a class.
Upon expiration of the term of a class of directors, directors for that class will be elected for three-year terms at the annual meeting of stockholders in the year in which that term expires. As a result, only one class of directors will be elected at each annual meeting of our stockholders, with the other classes continuing for the remainder of their respective three-year terms. Each director's term continues until the election and qualification of his or her successor, or his or her earlier death, resignation, or removal.
So long as our board of directors is classified, directors may be removed only for cause, and only our board of directors may fill vacancies on our board. Any additional directorships resulting from an increase in the number of directors will be distributed among the three classes so that, as nearly as possible, each class will consist of one-third of the total number of directors.
The classification of our board of directors may have the effect of delaying or preventing changes in our control or management.
102
Role of Board in Risk Oversight Process
Risk assessment and oversight are an integral part of our governance and management processes. Our board of directors encourages management to promote a culture that incorporates risk management into our corporate strategy and day-to-day business operations. Management discusses strategic and operational risks at regular management meetings, and conducts specific strategic planning and review sessions during the year that include a focused discussion and analysis of the risks facing us. Throughout the year, senior management reviews these risks with the board of directors at regular board meetings as part of management presentations that focus on particular business functions, operations or strategies, and presents the steps taken by management to mitigate or eliminate such risks. Our board of directors does not have a standing risk management committee, but rather administers this oversight function directly through our board of directors as a whole, as well as through various standing committees of our board of directors that address risks inherent in their respective areas of oversight. In particular, our board of directors is responsible for monitoring and assessing strategic risk exposure. Following completion of this offering, our audit committee will be responsible for overseeing our major financial risk exposures and the steps our management has taken to monitor and control these exposures. The audit committee will also monitor compliance with legal and regulatory requirements. Following completion of this offering, our compensation committee will assess and monitor whether any of our compensation policies and programs has the potential to encourage excessive risk-taking. In addition, following completion of this offering, our nominating and governance committee will monitor the effectiveness of our corporate governance guidelines and consider and approve or disapprove any related party transactions.
Leadership Structure of the Board
Our board of directors is currently co-chaired by Niraj Shah, our Chief Executive Officer, and Steven Conine, our Chief Technology Officer. Our board has established the position of lead independent director and elected Mr. Kumin our lead independent director effective upon the completion of this offering. Our amended and restated bylaws and corporate governance guidelines, in each case effective upon the closing of this offering, will provide our board of directors with flexibility to combine or separate the positions of chairman of the board and Chief Executive Officer and/or utilize a lead director in accordance with its determination that one or the other structure would be in the best interests of our company. Our board of directors has concluded that our proposed leadership structure following the closing of this offering is appropriate at this time. However, our board of directors will continue to periodically review our leadership structure and may make such changes in the future as it deems appropriate.
Director Independence
Our board of directors has determined that all of our directors, other than Messrs. Shah and Conine, qualify as "independent" directors in accordance with the listing requirements of the NYSE. Each of Messrs. Shah and Conine is not considered independent because he is an employee of the company.
Board Committees
Our board has established three standing committees — audit, compensation, and nominating and corporate governance — each of which, upon the closing of this offering, will operate under a charter that has been approved by our board and that will satisfy the applicable standards of the Securities and Exchange Commission, or the SEC, and NYSE. Following the consummation of this offering, copies of each committee's charter will be posted on the Corporate Governance section of our website, Wayfair.com. Information included on or accessible through our website is not incorporated by reference herein.
103
Audit Committee
Our audit committee oversees our corporate accounting and financial reporting process. Among other matters, the audit committee:
- •
- appoints and determines the compensation and retention of our independent registered public accounting firm;
- •
- evaluates the independent registered public accounting firm's qualifications, independence and performance;
- •
- determines the engagement of the independent registered public accounting firm;
- •
- reviews and approves the scope of the annual audit and the audit fee;
- •
- discusses with management and the independent registered public accounting firm the results of the annual audit and the
review of our quarterly financial statements;
- •
- approves the retention of the independent registered public accounting firm to perform any proposed permissible non-audit
services;
- •
- monitors the rotation of partners of the independent registered public accounting firm on our engagement team as required
by law;
- •
- reviews our financial statements and our management's discussion and analysis of financial condition and results of
operations to be included in our annual and quarterly reports to be filed with the SEC;
- •
- reviews our critical accounting policies and estimates;
- •
- is responsible for investigating any reports received by the company's ethics helpline; and
- •
- reviews, at least annually, the audit committee charter and the committee's performance.
The members of our audit committee are Messrs. Agrawal and Lane and Ms. Bradley. Our board of directors has determined that each of Messrs. Agrawal and Lane and Ms. Bradley is an independent director under NYSE rules and under Rule 10A-3 under the Securities Exchange Act of 1934, as amended, or the Exchange Act. All members of our audit committee meet the requirements for financial literacy under the applicable rules and regulations of the SEC and the NYSE. Our board of directors has determined that Ms. Bradley is an "audit committee financial expert" as defined by applicable SEC rules and has the requisite financial sophistication as defined under the applicable NYSE rules and regulations.
Compensation Committee
The compensation committee's responsibilities include:
- •
- reviewing and recommending policies relating to compensation and benefits of our officers and employees;
- •
- reviewing and recommending corporate goals and objectives relevant to compensation of our Chief Executive Officer and
other executive officers and evaluating the performance of these officers in light of those goals and objectives;
- •
- recommending to our board of directors the compensation of our Chief Executive Officer and other executive officers based
on the compensation committee's evaluation;
- •
- recommending to our board of directors the issuance of stock options and other awards under our stock plans;
- •
- appointing, compensating and overseeing the work of any compensation consultant or other advisor retained by the committee;
104
- •
- preparing the Compensation Committee report on executive officer compensation as required by the SEC to be included in our
annual proxy statement or annual report on Form 10-K and, to the extent we are required to include a Compensation Discussion and Analysis, or CD&A, in our annual proxy statement or annual
report on Form 10-K, review and discuss CD&A with our management and consider whether to recommend to our board of directors that CD&A be included in the appropriate filing; and
- •
- reviewing and evaluating, at least annually, the performance of the compensation committee and its members, including compliance by the compensation committee with its charter.
The members of our compensation committee are Messrs. Finkelstein, Kumin and Rodrigues. Each of these individuals is independent under the applicable rules and regulations of the NYSE, is a "non-employee director" as defined in Rule 16b-3 under the Exchange Act and is an "outside director" as that term is defined in Section 162(m) of the U.S. Internal Revenue Code of 1986, as amended.
Nominating and Corporate Governance Committee
The nominating and corporate governance committee's responsibilities include:
- •
- identifying individuals qualified to become board members;
- •
- recommending to our board the persons to be nominated for election as directors and to each of our board's committees;
- •
- reviewing and making recommendations to our board with respect to management succession planning;
- •
- developing and recommending to our board a set of corporate governance guidelines and principles; and
- •
- overseeing the evaluation of our board and its various committees.
The members of our nominating and corporate governance committee are Ms. Bradley and Mr. Kumin. Each of these individuals is an independent director under the applicable rules and regulations of the NYSE relating to nominating and corporate governance committee independence.
Compensation Committee Interlocks and Insider Participation
The members of our compensation committee are Messrs. Finkelstein, Kumin and Rodrigues. Neither of these individuals is a current or former officer or employee of Wayfair LLC or had any related party transaction involving Wayfair LLC.
Code of Ethics and Code of Conduct
Our Board has adopted a written code of business conduct and ethics that applies to our directors, officers and employees, including our principal executive officer, principal financial officer, principal accounting officer or controller, or persons performing similar functions. Prior to completion of this offering, we will post a copy of the code on the Corporate Governance section of our website, Wayfair.com. In addition, we intend to post on the Corporate Governance section of our website all disclosures that are required by law or the NYSE listing standards concerning any amendments to, or waivers from, any provision of the code. Information included on or accessible through our website is not incorporated by reference herein.
105
This section "Executive Compensation," intended to comply with the reduced disclosure requirements provided under the JOBS Act, provides an overview of the 2013 executive compensation program offered to our three named executive officers identified below. For 2013, our named executive officers, or NEOs, were:
- •
- Niraj Shah, Co-Chairman and Chief Executive Officer;
- •
- Steven Conine, Co-Chairman and Chief Technology Officer; and
- •
- Michael Fleisher, Chief Financial Officer.
Summary Compensation Table
The following summarizes the total compensation awarded to, earned by or paid to our NEOs for their service to us in 2013:
Name and Principal Position |
Year
|
Salary ($)
|
Bonus ($)
|
Stock Awards ($)(3) |
All Other Compensation ($) |
Total ($) |
|||||||||||||
|---|---|---|---|---|---|---|---|---|---|---|---|---|---|---|---|---|---|---|---|
Niraj Shah |
2013 | 480,000 | — | 3,130,500 | 11,000(5 | ) | 3,621,500 | ||||||||||||
Steven Conine |
2013 |
480,000 |
— |
3,130,500 |
11,000(5 |
) |
3,621,500 |
||||||||||||
Michael Fleisher(1) |
2013 |
69,271 |
10,938(2 |
) |
11,854,160(4 |
) |
20,491(6 |
) |
11,954,860 |
||||||||||
- (1)
- Amounts
shown for Mr. Fleisher reflect amounts paid for services provided by him in 2013 beginning on October 21, 2013, his hire date.
- (2)
- Represents
the discretionary cash bonus paid to Mr. Fleisher under our annual cash incentive plan for 2013.
- (3)
- Represent
the fair value on the grant date of restricted stock units granted on November 12, 2013, without regard to forfeitures, calculated in
accordance with ASC Topic 718. The valuation assumptions used in calculating the grant date fair value of these restricted stock units are set forth in "Management's Discussion and Analysis of
Financial Condition and Results of Operations — Critical Accounting Policies — Stock-Based Compensation."
- (4)
- Represents
an award granted to Mr. Fleisher upon commencing employment as our Chief Financial Officer.
- (5)
- Represent
employer contributions under our 401(k) plan during 2013.
- (6)
- Represents certain expenses related to housing and travel to company headquarters, including tax gross-ups.
Narrative Disclosure to Summary Compensation Table
The primary elements of compensation for our NEOs are base salary, cash bonuses and long-term equity-based compensation awards. The NEOs also participate in employee benefit plans and programs that we offer to our other full-time employees.
106
Base Salary: The base salary payable to each NEO is intended to provide a fixed component of compensation reflecting the executive's skill set, experience, role and responsibilities. Base salaries for our NEOs have generally been set at levels deemed necessary to attract and retain individuals with superior talent. In 2013, base salary for each of Messrs. Shah and Conine was $480,000. For 2014, each base salary was reduced to $80,000 at the request of Messrs. Shah and Conine.
Cash Bonuses: Mr. Fleisher is eligible to participate in a discretionary annual cash incentive program, which provides him with an opportunity to earn a cash bonus award that ranges from 0-25% of his base salary. As a result of Mr. Fleisher's performance in 2013 with respect to the finance department generally and his leadership in connection with the preparation for this offering, Mr. Fleisher was awarded a bonus equal to $10,938, which amount represented 20% of his pro-rated base salary. Messrs. Shah and Conine did not participate in the bonus plan in 2013. No changes to the bonus plan are anticipated in connection with this offering.
Long-Term Equity-Based Compensation Awards: Prior to this offering, we maintained the Wayfair LLC Second Amended and Restated 2010 Incentive Plan, or the 2010 Plan, under which we made periodic grants of equity and equity-based awards to our NEOs and other key employees. In connection with this offering, we plan to adopt the 2014 Incentive Award Plan, or 2014 Plan, and no future grants will be made under the 2010 Plan. For additional information, please read the section titled "— 2014 Incentive Award Plan" below.
In 2013, our NEOs received an award of restricted stock units granted under our 2010 Plan as set forth in the table below. Mr. Fleisher received his award in connection with his commencement of employment with us in 2013.
Name
|
Total Number of Restricted Stock Units |
|||
|---|---|---|---|---|
Niraj Shah |
150,000 | |||
Steven Conine |
150,000 | |||
Michael Fleisher |
568,000 | |||
The restricted stock unit awards vest upon the satisfaction of a service condition and an event condition. The service condition will be satisfied as to 20% of the shares underlying the restricted stock units upon completion of one year of service measured from the vesting commencement date, subject to continued service through such date. Thereafter, but prior to satisfaction of the event condition, an additional 1/60th of the total number of shares underlying the restricted stock units will vest in monthly installments, subject to continued service through each such vesting date. After satisfaction of the event condition, an additional 1/60th of the total number of shares underlying the restricted stock units will vest in monthly installments, subject to continued service through each such vesting date. The event condition will be satisfied on the earlier of (i) the time immediately prior to the consummation of a change in control and (ii) the closing of this offering.
For more information on the vesting provisions of the restricted stock units upon certain terminations or a change in control, please see the section titled "— Severance and Change in Control Provisions" below.
107
Outstanding Equity Awards as of December 31, 2013
The outstanding equity awards held by our NEOs as of December 31, 2013 were as follows:
| |
Stock Awards(1) | |||||||||
|---|---|---|---|---|---|---|---|---|---|---|
Name
|
Grant Date
|
Number of Stock or Units of Stock That Have Not Vested |
Market Value of Stock or Units of Stock That Have Not Vested |
|||||||
Niraj Shah |
11/12/2013 | 150,000 | 3,130,500 | |||||||
Steven Conine |
11/12/2013 | 150,000 | 3,130,500 | |||||||
Michael Fleisher |
11/12/2013 | 568,000 | 11,854,160 | |||||||
- (1)
- The awards vest in monthly installments beginning on the one year anniversary of the grant date. However, full vesting is subject to the occurrence of a change in control or the closing of an initial public offering prior to the seventh anniversary of the grant date.
Severance and Change in Control Provisions
Employment Agreements
Messrs. Shah and Conine: We entered into amended and restated employment letter agreements with Messrs. Shah and Conine on May 6, 2014, which entitled each of Messrs. Shah and Conine to receive an annual base salary, subject to periodic increases (but not decreases) at the discretion of the board of directors. In 2013, base salary for each of Messrs. Shah and Conine was $480,000. For 2014, each base salary was reduced to $80,000 at the request of Messrs. Shah and Conine. The letter agreements also entitle them to participate in the employee benefit plans and programs that we offer to our other full-time employees. Messrs. Shah's and Conine's employment letter agreements contain restrictive covenants which prohibit them from competing with us or soliciting our employees, consultants or suppliers for twenty-four months following termination of employment. Pursuant to Messrs. Shah's and Conine's employment letter agreements, if we terminate their employment without cause (as defined in the employment letter agreements) or if they resign for good reason (as defined in the employment letter agreements) they will receive healthcare benefit continuation until the earlier of (i) the last day of the applicable COBRA period and (ii) twenty-four months following termination. In addition, pursuant to the terms of their restricted stock unit award grants, in the event Messrs. Shah or Conine is terminated for any reason other than for cause within twelve months following a change in control, 50% of their unvested restricted stock units will vest.
Mr. Fleisher: We entered into an employment letter agreement with Mr. Fleisher on October 2, 2013, which was amended on May 5, 2014 and which entitles him to an initial annual base salary of $350,000, subject to periodic review and adjustment. The employment letter agreement also provides Mr. Fleisher with an equity award under the 2010 Plan (which award is reflected in the "Stock Awards" column of the Summary Compensation Table above), an annual bonus between 0-20% of his annual salary under our annual cash incentive program and the opportunity to participate in the employee benefit plans and programs that we offer to our other full-time employees. For 2014, the annual bonus Mr. Fleisher is eligible to receive under our annual cash incentive program ranges between 0-25% of his annual salary. Mr. Fleisher's employment letter agreement also contains a provision requiring him to sign the company's non-compete,
108
non-solicitation, non-disclosure and invention agreement designed for all employees, which agreement generally provides that he will not disclose confidential information of the company nor solicit any employee, contractor, customer or supplier of the company. In 2014, we memorialized Mr. Fleisher's right to receive reimbursement for his commuting-related expenses, which includes a gross-up for applicable taxes.
Pursuant to Mr. Fleisher's employment letter agreement, if his employment is terminated for any reason other than for cause (as defined in his employment letter agreement) within twelve months of his hiring date of October 21, 2013, he is entitled to receive severance pay equal to six months of his base salary. In addition, in the event Mr. Fleisher is terminated for any reason other than for cause within twelve months following a change in control (as defined in his employment letter agreement), 100% of Mr. Fleisher's unvested units will vest.
Restricted Stock Unit Vesting
In the event any of the NEOs are terminated prior to the occurrence of a change in control or the closing of an initial public offering, all those restricted stock units whose vesting remained contingent solely on the occurrence of a change in control or the closing of an initial public offering will vest upon such change in control or initial public offering occurring prior to the fifth or seventh anniversary of the restricted stock units' grant date, as applicable. The restricted stock units are described in more detail above in the section titled "— Long-Term Equity-Based Compensation Awards."
Executive Compensation Plans
The following summarizes the material terms of the long-term incentive compensation plan in which our NEOs will be eligible to participate following the consummation of this offering and the 2010 Plan under which we have previously made periodic grants of equity and equity-based awards to our NEOs and other key employees.
2014 Incentive Award Plan
In connection with this offering, our board of directors adopted the 2014 Plan, which we anticipate will be approved by our stockholders prior to the effective date of this offering, under which we may grant cash and equity incentive awards to eligible service providers in order to attract, motivate and retain the talent for which we compete. The material terms of the 2014 Plan are summarized below.
Eligibility and Administration: Our employees, consultants and directors, and employees, consultants and directors of our subsidiaries will be eligible to receive awards under the 2014 Plan. Following our initial public offering, the 2014 Plan will be administered by our board of directors with respect to awards to non-employee directors and by our compensation committee with respect to other participants, each of which may delegate its duties and responsibilities to committees of our directors and/or officers (referred to collectively as the plan administrator below), subject to certain limitations that may be imposed under Section 16 of the Securities Exchange Act of 1934, as amended, or the Exchange Act, and/or stock exchange rules, as applicable. The plan administrator will have the authority to make all determinations and interpretations under, prescribe all forms for use with, and adopt rules for the administration of, the 2014 Plan, subject to its express terms and conditions. The plan administrator will also set the terms and conditions of all awards under the 2014 Plan, including any vesting and vesting acceleration conditions.
Limitation on Awards and Shares Available: An aggregate of 8,603,066 shares of our Class A common stock will initially be available for issuance under awards granted pursuant to the 2014 Plan. The number of shares initially available for issuance will be increased by (i) the number
109
of shares of Class B common stock represented by awards outstanding under our 2010 Plan that are forfeited, lapse unexercised or are settled in cash and which following the effective date of the 2014 Plan are not issued under the 2010 Plan and (ii) an annual increase on January 1 of each calendar year beginning in 2016 and ending in and including 2024, equal to the lesser of (A) 2,500,000 shares of Class A common stock, (B) 2% of the aggregate number of shares of Class A and Class B common stock outstanding on the final day of the immediately preceding calendar year and (C) such smaller number of shares as determined by our board of directors. No more than 8,603,066 shares of Class A common stock may be issued upon the exercise of incentive stock options. Shares issued under the 2014 Plan may be authorized but unissued shares, or shares purchased in the open market.
If an award under the 2014 Plan or 2010 Plan is forfeited, expires or is settled for cash, any shares subject to such award may, to the extent of such forfeiture, expiration or cash settlement, be used again for new grants under the 2014 Plan. Awards granted under the 2014 Plan upon the assumption of, or in substitution for, awards authorized or outstanding under a qualifying equity plan maintained by an entity with which we enter into a merger or similar corporate transaction will not reduce the shares available for grant under the 2014 Plan. The maximum aggregate grant date fair value of awards granted to any non-employee director as compensation for services as a non-employee director during any calendar year shall be $1,000,000.
Awards: The 2014 Plan provides for the grant of stock options, including incentive stock options, or ISOs, and nonqualified stock options, or NSOs, restricted stock, dividend equivalents, stock payments, restricted stock units, or RSUs, performance shares, other incentive awards, stock appreciation rights, or SARs, and cash awards. No determination has been made as to the types or amounts of awards that will be granted to specific individuals pursuant to the 2014 Plan. Certain awards under the 2014 Plan may constitute or provide for a deferral of compensation, subject to Section 409A of the Internal Revenue Code, which may impose additional requirements on the terms and conditions of such awards. All awards under the 2014 Plan will be set forth in award agreements, which will detail the terms and conditions of the awards, including any applicable vesting and payment terms and post-termination exercise limitations. Awards other than cash awards generally will be settled in shares of our common stock, but the plan administrator may provide for cash settlement of any award. A brief description of each award type follows.
- •
- Stock Options. Stock options provide for the purchase of
shares of our common stock in the future at an exercise price set on the grant date. ISOs, by contrast to NSOs, may provide tax deferral beyond exercise and favorable capital gains tax treatment to
their holders if certain holding period and other requirements of the Internal Revenue Code are satisfied. The exercise price of a stock option may not be less than 100% of the fair market value of
the underlying share on the date of grant (or 110% in the case of ISOs granted to certain significant stockholders), except with respect to certain substitute options granted in connection with a
corporate transaction. The term of a stock option may not be longer than ten years (or five years in the case of ISOs granted to certain significant stockholders). Vesting conditions determined by the
plan administrator may apply to stock options and may include continued service, performance and/or other conditions.
- •
- SARs. SARs entitle their holder, upon exercise, to receive from us an amount equal to the appreciation of the shares subject to the award between the grant date and the exercise date. The exercise price of a SAR will generally not be less than 100% of the fair market value of the underlying share on the date of grant (except with respect to certain substitute SARs granted in connection with a corporate transaction) and the term of a SAR may not be longer than ten years. Vesting conditions determined by the plan administrator may apply to SARs and may include continued service, performance and/or other conditions.
110
- •
- Restricted Stock, RSUs and Performance Shares. Restricted
stock is an award of nontransferable shares of our common stock that remain forfeitable unless and until specified conditions are met, and which may be subject to a purchase price. RSUs are
contractual promises to deliver shares of our common stock in the future, which may also remain forfeitable unless and until specified conditions are met. Delivery of the shares underlying RSUs may be
deferred under the terms of the award or at the election of the participant, if the plan administrator permits such a deferral. Performance shares are contractual rights to receive a range of shares
of our common stock in the future based on the attainment of specified performance goals, in addition to other conditions which may apply to these awards. Conditions applicable to restricted stock,
RSUs and performance shares may be based on continuing service, the attainment of performance goals and/or such other conditions as the plan administrator may determine.
- •
- Stock Payments, Other Incentive Awards and Cash
Awards. Stock payments are awards of fully vested shares of our common stock that may, but need not, be made in lieu of base salary,
bonus, fees or other cash compensation otherwise payable to any individual who is eligible to receive awards. Other incentive awards are awards other than those enumerated in this summary that are
denominated in, linked to or derived from shares of our common stock or value metrics related to our shares, and may remain forfeitable unless and until specified conditions are met. Cash awards are
cash incentive bonuses subject to performance goals.
- •
- Dividend Equivalents. Dividend equivalents represent the right to receive the equivalent value of dividends paid on shares of our common stock and may be granted alone or in tandem with awards. Dividend equivalents are credited as of dividend record dates during the period between the date an award is granted and the date such award vests, is exercised, is distributed or expires, as determined by the plan administrator.
Performance Awards: Performance awards include any of the foregoing awards that are granted subject to vesting and/or payment based on the attainment of specified performance goals or other criteria the plan administrator may determine, which may or may not be objectively determinable. Performance criteria upon which performance goals are established by the plan administrator may include but are not limited to: (i) net earnings (either before or after one or more of (A) interest, (B) taxes, (C) depreciation and (D) amortization); (ii) gross or net sales or revenue; (iii) net income (either before or after taxes); (iv) adjusted net income; (v) operating earnings or profit; (vi) cash flow (including, but not limited to, operating cash flow and free cash flow); (vii) return on assets; (viii) return on capital; (ix) return on stockholders' equity; (x) total stockholder return; (xi) return on sales; (xii) gross or net profit or operating margin; (xiii) costs; (xiv) expenses; (xv) working capital; (xvi) earnings per share; (xvii) adjusted earnings per share; (xviii) price per share; (xix) regulatory body approval for commercialization of a product; (xx) implementation, completion or attainment of objectives relating to research, development, regulatory, commercial, or strategic milestones or developments; (xxi) market share; (xxii) economic value; (xxiii) revenue and (xxiv) revenue growth.
Certain Transactions: The plan administrator has broad discretion to take action under the 2014 Plan, as well as make adjustments to the terms and conditions of existing and future awards, to prevent the dilution or enlargement of intended benefits and facilitate necessary or desirable changes in the event of certain transactions and events affecting our common stock, such as stock dividends, stock splits, mergers, acquisitions, consolidations and other corporate transactions. In addition, in the event of certain non-reciprocal transactions with our stockholders known as "equity restructurings," the plan administrator will make equitable adjustments to the 2014 Plan and outstanding awards. In the event of a change in control of our company (as defined in the 2014 Plan), to the extent that the surviving entity declines to continue, convert, assume or replace
111
outstanding awards, then all such awards may become fully vested and exercisable in connection with the transaction. Upon or in anticipation of a change in control, the plan administrator may cause any outstanding awards to terminate at a specified time in the future and give the participant the right to exercise such awards during a period of time determined by the plan administrator in its sole discretion. Individual award agreements may provide for additional accelerated vesting and payment provisions.
Foreign Participants, Claw-Back Provisions, Transferability, and Participant Payments: The plan administrator may modify award terms, establish subplans and/or adjust other terms and conditions of awards, subject to the share limits described above. All awards will be subject to the provisions of any claw-back policy implemented by our company to the extent set forth in such claw-back policy and/or in the applicable award agreement. With limited exceptions for estate planning, domestic relations orders, certain beneficiary designations and the laws of descent and distribution, awards under the 2014 Plan are generally non-transferable prior to vesting, and are exercisable only by the participant. With regard to tax withholding, exercise price and purchase price obligations arising in connection with awards under the 2014 Plan, the plan administrator may, in its discretion, accept cash or check, shares of our common stock that meet specified conditions, a "market sell order" or such other consideration as it deems suitable.
Plan Amendment and Termination: Our board of directors may amend or terminate the 2014 Plan at any time. However, except in connection with certain changes in our capital structure, stockholder approval will be required for any amendment that increases the number of shares available under the 2014 Plan. The plan administrator will have the authority, without the approval of our stockholders, to amend any outstanding stock option or SAR to reduce its price per share. No award may be granted pursuant to the 2014 Plan after the tenth anniversary of the date on which our board of directors adopts the 2014 Plan.
Second Amended and Restated 2010 Incentive Plan
We currently maintain the 2010 Plan, under which we may grant stock options and other stock-based awards to employees, consultants and managers of our company or its affiliates. We have reserved a total of 10,405,879 shares of our common stock for issuance under the 2010 Plan.
Following the effectiveness of the 2014 Plan, we will not make any further grants under the 2010 Plan. However, the 2010 Plan will continue to govern the terms and conditions of the outstanding awards granted under it. As discussed above, we anticipate that shares of our common stock subject to awards granted under the 2010 Plan that are forfeited, lapse unexercised or are settled in cash and which following the effective date of the 2014 Plan are not issued under the 2010 Plan will be available for issuance under the 2014 Plan.
Administration: Our board of directors administers the 2010 Plan and has the authority to determine recipients of awards and the terms of awards granted under the 2010 Plan, to interpret the 2010 Plan and awards outstanding thereunder and to make changes to awards outstanding under the 2010 Plan, provided that such changes may not have a materially adverse effect on a participant's rights under the plan without the participant's consent. Following the effectiveness of this offering, we anticipate that the board of directors will delegate its general administrative authority under the 2010 Plan to the compensation committee of the board of directors.
Types of Awards: The 2010 Plan provides for the grant of stock options, restricted stock and restricted stock units to employees, consultants and managers of the company or its affiliates. As of the date of this prospectus, awards of restricted stock units, options for common stock and shares of restricted stock are outstanding under the 2010 Plan.
112
Certain Transactions: If certain changes are made in, or events occur with respect to, our common stock, adjustments shall be made as the board of directors determines appropriate in order to prevent dilution or enlargement of participants' rights under the plan, including adjusting the number, kind, exercise price and/or vesting conditions, providing for substitute awards, accelerating exercisability and/or vesting, effecting the lapse of restrictions and termination of awards, providing for a period of time to exercise the awards and/or cancelling outstanding awards. In the event of a change in control of our company, the acquiring entity assuming obligations under the 2010 Plan may assume or continue the company's rights and obligations under each or any award or portion thereof outstanding immediately prior to the change in control, or substitute for each or any such outstanding award or portion thereof a substantially equivalent award with respect to the acquiror's securities. Any award or portion thereof which is neither assumed or continued by the acquiror in connection with the change in control, nor exercised or settled as of the time of consummation of the change in control, shall terminate and cease to be outstanding. The board of directors may determine that, upon the occurrence of a change in control, each or any award or portion thereof outstanding immediately prior to the change in control and not previously exercised or settled shall be cancelled in exchange for a payment with respect to each vested award, and each unvested award as determined by the board of directors, in cash, securities or other property in an amount equal to the fair market value of the consideration to be paid per share in the change in control, reduced (but not below zero) by the exercise price under such award. The exercisability, vesting and/or settlement of awards may accelerate in connection with such change in control, either by action of the board of directors or under the terms of the applicable award agreement.
Amendment and Termination: The board of directors may terminate, modify or amend the 2010 Plan from time to time, provided that any amendment or modification may not materially adversely affect a participant's rights under the 2010 Plan without the participant's consent. Any amendment the board of directors determines is of a scope that requires stockholder approval will be subject to approval by the company's stockholders. The 2010 Plan will continue in effect until its termination by the board of directors.
Director Compensation
Our officers, employees, consultants or advisors who also serve as directors do not receive additional compensation for their service as directors. In addition, our directors who are not our officers, employees, consultants or advisors, who we refer to as our non-employee directors, have not generally received cash or equity based compensation for their services as directors and no cash or equity based compensation was provided to our non-employee directors in 2013. However, Julie Bradley received 20,000 restricted stock units in November 2012 in connection with her election to our board of directors.
113
CERTAIN RELATIONSHIPS AND RELATED PARTY TRANSACTIONS
Since January 1, 2011, we have engaged in the following transactions with our directors, executive officers, holders of more than 5% of our voting securities and affiliates of our directors, executive officers and holders of more than 5% of our voting securities. We believe that all of the transactions described below were made on terms no less favorable to us than could have been obtained from unaffiliated third parties.
Corporate Reorganization
Prior to the issuance of our shares of Class A common stock in this offering, we will have completed an internal restructuring, which we refer to in this prospectus as the Corporate Reorganization. Pursuant to the Corporate Reorganization, Wayfair LLC will become a wholly-owned subsidiary of Wayfair Inc., and the holders of equity interests in Wayfair LLC will become stockholders of Wayfair Inc. Please read the section titled "Organizational Structure" for additional information.
Issuances of Preferred Stock
Series B Preferred Stock Financing
In March 2014, we issued an aggregate of 5,995,133 shares of Series B preferred stock to 23 accredited investors at a price per share of $26.2261 for aggregate gross consideration of approximately $157.2 million. In 2014, we used approximately $29.0 million of these proceeds to repurchase equity securities as described below under the section titled "— Repurchases of Stock." Julie Bradley, a member of our board of directors, purchased 76,260 shares of Series B preferred stock in this transaction for an aggregate purchase price of approximately $2.0 million.
Series A Preferred Stock Financings
In November 2012, we issued an aggregate of 3,885,137 shares of Series A preferred stock to 10 accredited investors at a price per share of $9.339624 for aggregate gross consideration of approximately $36.3 million. The following table sets forth the shares of Series A preferred stock sold to each of our executive officers, directors, holders of more than 5% of our voting securities:
Name
|
Shares of Series A Preferred Stock |
Aggregate Purchase Price |
|||||
|---|---|---|---|---|---|---|---|
Entities affiliated with Battery Ventures(1) |
642,424 | $ | 5,999,999 | ||||
Steven Conine(2) |
428,283 | $ | 4,000,002 | ||||
Entities affiliated with Great Hill Partners(3) |
1,193,073 | $ | 11,142,853 | ||||
Entities affiliated with HarbourVest Partners(4) |
734,200 | $ | 6,857,152 | ||||
Niraj Shah(2) |
428,283 | $ | 4,000,002 | ||||
- (1)
- Consists
of (a) 636,065 shares sold to Battery Ventures IX (AIV I), L.P. and (b) 6,359 shares sold to Battery Investment
Partners IX, LLC. Neeraj Agrawal, a managing member of Battery Partners IX (AIV I), LLC and Battery Partners IX, LLC and an officer of Battery Management Corp., is a member
of our board of directors.
- (2)
- Messrs. Conine
and Shah are members of our board of directors and our executive officers and also holders of more than 5% of our voting securities.
- (3)
- Consists of (a) 1,189,828 shares sold to Great Hill Equity Partners IV, L.P. (through a wholly-owned entity, CSN Great Hill, Inc.) and (b) 3,245 shares sold to Great Hill
114
Investors, LLC. Michael Kumin, a manager of GHP IV, LLC and Great Hill Investors, LLC, is a member of our board of directors.
- (4)
- Consists of (a) 550,650 shares sold to HarbourVest CSN LLC and (b) 183,550 shares sold to HarbourVest/NYSTRS Co-invest Fund L.P. Ian Lane, a Principal of HarbourVest Partners, LLC, is a member of our board of directors.
In June 2011, we issued an aggregate of 17,666,664 shares of Series A preferred stock to 8 accredited investors at a price per share of $9.339624 for aggregate gross consideration of $165.0 million. We used approximately $87.7 million of these proceeds to repurchase equity securities as described below under the section titled "— Repurchases of Stock." The following table sets forth the shares of Series A preferred stock sold to each of our executive officers, directors, holders of more than 5% of our voting securities:
Name
|
Shares of Series A Preferred Stock |
Aggregate Purchase Price |
|||||
|---|---|---|---|---|---|---|---|
Entities affiliated with Battery Ventures(1) |
3,747,474 | $ | 35,000,000 | ||||
Entities affiliated with Great Hill Partners(2) |
6,959,595 | $ | 65,000,000 | ||||
Entities affiliates with HarbourVest Partners(3) |
4,282,828 | $ | 40,000,000 | ||||
- (1)
- Consists
of (a) 3,710,374 shares sold to CSN Battery, Inc., which are currently held by Battery Ventures IX (AIV I), L.P., and
(b) 37,100 shares sold to Battery Investment Partners IX, LLC. Neeraj Agrawal, a managing member of Battery Partners IX (AIV I), LLC and Battery Partners IX, LLC and
an officer of Battery Management Corp., is a member of our board of directors.
- (2)
- Consists
of (a) 6,940,665 shares sold to Great Hill Equity Partners IV, L.P. (through a wholly-owned entity, CSN Great Hill, Inc.) and
(b) 18,930 shares sold to Great Hill Investors, LLC. Michael Kumin, a manager of GHP IV, LLC and Great Hill Investors, LLC, is a member of our board of directors.
- (3)
- Consists of (a) 3,212,121 shares sold to HarbourVest CSN LLC and (b) 1,070,707 shares sold to HarbourVest/NYSTRS Co-invest Fund L.P. Ian Lane, a Principal of HarbourVest Partners, LLC, is a member of our board of directors.
Series A Distributions
In March 2014, we distributed a portion of an accrued cash dividend to our Series A preferred stockholders in the aggregate amount of $15.0 million. The following table sets forth the cash distributions made to each of our executive officers, directors, and holders of more than 5% of our voting securities:
Name
|
Cash Distribution
|
|||
|---|---|---|---|---|
Entities affiliated with Battery Ventures(1) |
$ | 3,055,358 | ||
Steven Conine(2) |
$ | 298,084 | ||
Entities affiliated with Great Hill Partners(3) |
$ | 5,674,236 | ||
Entities affiliates with HarbourVest Partners(4) |
$ | 3,491,839 | ||
Niraj Shah(2) |
$ | 298,084 | ||
- (1)
- Consists of (a) $3,025,111 distributed to Battery Ventures IX (AIV I), L.P. and (b) $30,247 distributed to Battery Investment Partners IX, LLC. Neeraj Agrawal, a
115
managing member of Battery Partners IX (AIV I), LLC and Battery Partners IX, LLC and an officer of Battery Management Corp, is a member of our board of directors.
- (2)
- Messrs. Conine
and Shah are members of our board of directors and our executive officers and also holders of more than 5% of our voting securities.
- (3)
- Consists
of (a) $5,658,803 distributed to Great Hill Equity Partners IV, L.P. (through a wholly-owned entity, CSN Great Hill, Inc.) and
(b) $15,433 distributed to Great Hill Investors, LLC. Michael Kumin, a manager of GHP IV, LLC and Great Hill Investors, LLC, is a member of our board of directors.
- (4)
- Consists of (a) $2,618,879 distributed to HarbourVest CSN LLC and (b) $872,960 distributed to HarbourVest/NYSTRS Co-invest Fund L.P. Ian Lane, a Principal of HarbourVest Partners, LLC, is a member of our board of directors.
Upon the completion of this offering, we expect to distribute a portion of the net proceeds to our existing Series A preferred stockholders to satisfy the remaining portion of an accrued cash dividend, which was approximately $20.9 million as of June 30, 2014, or approximately 8.1% of the net proceeds based on the midpoint of the range listed on the cover of this prospectus. Our co-founders and certain of our directors, executive officers and holders of more than 5% of our voting securities hold 85% of our outstanding shares of Series A preferred stock and, as a result of their ownership, will receive 85% of the dividend payment, or approximately $17.8 million, as of June 30, 2014.
Repurchases of Stock
In our 2014 Tender Offer, we repurchased equity securities convertible or exercisable into 211,785 shares of common stock for an aggregate purchase price of approximately $5.5 million. The following table sets forth the equity we repurchased from our executive officers:
Name
|
Shares Repurchased |
Total Purchase Price |
|||||
|---|---|---|---|---|---|---|---|
Edmond Macri |
30,000 | $ | 786,783 | ||||
Nicholas Malone |
17,500 | $ | 458,957 | ||||
Steven Oblak |
6,000 | $ | 157,357 | ||||
James Savarese |
10,000 | $ | 262,261 | ||||
In April 2014, we repurchased 896,052 shares of common stock from SK Retail, Inc., a holder of more than 5% of our voting securities prior to our Corporate Reorganization, for an aggregate purchase price of approximately $23.5 million. Messrs. Conine and Shah, members of our board of directors and our executive officers, are the owners of SK Retail, Inc. and, following our Corporate Reorganization, will be holders of more than 5% of our voting securities.
In August 2011, we repurchased equity securities convertible into 746,322 shares of common stock for an aggregate purchase price of approximately $6.9 million. The following table sets forth the equity we repurchased from our executive officers:
Name
|
Shares Repurchased |
Total Purchase Price |
|||||
|---|---|---|---|---|---|---|---|
Nicholas Malone |
39,033 | $ | 364,554 | ||||
John Mulliken |
21,500 | $ | 200,802 | ||||
James Savarese |
223,046 | $ | 2,083,166 | ||||
116
In June 2011, we repurchased 9,101,009 shares of common stock from SK Retail, Inc., a holder of more than 5% of our voting securities prior to our Corporate Reorganization, for an aggregate purchase price of approximately $80.8 million. Messrs. Conine and Shah, members of our board of directors and our executive officers, are the owners of SK Retail, Inc. and, following our Corporate Reorganization, will be holders of more than 5% of our voting securities.
Reimbursements
Since our restructuring transactions in March 2008, which are described in the section titled "Prospectus Summary — Company Information and Reorganization," SK Retail, Inc. has continued to incur certain of our general and administrative expenses. For the years ending December 31, 2011, 2012 and 2013, we reimbursed SK Retail, Inc. aggregate amounts of approximately $12.2 million, $11.2 million and $12.0 million, respectively, for the payments it made on our behalf to employees for salary, benefits and certain overhead costs. Messrs. Conine and Shah, members of our board of directors and our executive officers, are the owners of SK Retail, Inc., a holder of more than 5% of our voting securities before the Corporate Reorganization, and will be holders of more than 5% of our voting securities following the Corporate Reorganization.
Agreements with Stockholders
Limited Liability Company Operating Agreement
The LLC Agreement governs the operations of Wayfair LLC and the rights and preferences of its stockholders. In connection with the Corporate Reorganization, the LLC Agreement will be terminated and will no longer govern the operations and will not govern the rights of our existing stockholders or future stockholders, other than certain provisions relating to certain pre-termination tax matters and liabilities.
Investors' Rights Agreement
We have entered into an investors' rights agreement, dated as of August 15, 2014, with holders of our preferred stock following the Corporate Reorganization, including some of our holders of more than 5% of our voting securities and their affiliates. This agreement will become effective upon the effectiveness of the Corporate Reorganization. The Investors' Rights Agreement contains a right of first offer provision that provides that we shall not make certain issuances of our securities unless we first offer such securities to holders of our preferred stock in accordance with the terms of the agreement. The right of first offer provision does not apply to and will terminate upon the closing of this offering. The Investors' Rights Agreement also provides that (i) certain holders of our preferred stock have the right to demand that we file a registration statement, subject to certain limitations, and (ii) the holders of our preferred stock will have the right to request that their shares be covered by a registration statement that we are otherwise filing. For a more detailed description of these registration rights, please read the section titled "Description of Capital Stock — Registration Rights" on page 122.
Right of First Refusal and Co-Sale Agreement
Wayfair LLC entered into a second amended and restated right of first refusal and co-sale agreement, dated as of March 5, 2014, with certain holders of our preferred stock and certain holders of our common stock, including some of our directors, executive officers and holders of more than 5% of our voting securities and their affiliates, pursuant to which such holders of preferred stock have a right of purchase and co-sale in respect of sales of securities by our founders and common stockholders party to the agreement. These purchase and co-sale rights do not apply to shares sold pursuant to this offering, and this agreement will terminate upon the closing of this offering.
117
Voting Agreement
The Voting Agreement provides, among other things, that each of the parties thereto agrees to vote all of the shares of our capital stock they hold in the manner described therein with respect to the size and composition of our board of directors and acquisitions of the company, subject to certain specified exceptions. This agreement will terminate upon the closing of this offering.
Indemnification Agreements
Our certificate of incorporation provides that we will indemnify our directors and officers to the fullest extent permitted by law. In addition, we expect to enter into indemnification agreements with all of our directors and executive officers prior to the completion of this offering.
Executive Compensation and Employment Arrangements
For a description of the compensation arrangements we have with our executive officers, please read the section titled "Executive Compensation."
Policies and Procedures for Related Party Transactions
Prior to the completion of this offering, our board of directors will adopt written policies and procedures for the review of any transaction, arrangement or relationship (or any series of similar transactions, arrangements or relationships) in which Wayfair (including any of its subsidiaries) was, is or will be, a participant, the amount involved exceeds $120,000 in any one fiscal year, and one of our executive officers, directors, director nominees or 5% stockholders (or their immediate family members), each of whom we refer to as a "related party," had, has or will have a direct or indirect material interest.
If a related party proposes to enter into such a transaction, arrangement or relationship, which we refer to as a "related party transaction," the related party will be required to report the proposed related party transaction to our general counsel. The policy will call for the proposed related party transaction to be reviewed and, if deemed appropriate, approved by our audit committee. Whenever practicable, the reporting, review and approval will occur prior to entry into the transaction. If advance approval of a related party transaction requiring the audit committee's approval is not feasible, then the transaction may be preliminarily entered into by management upon prior approval of the transaction by the chairperson of the audit committee subject to ratification of the transaction by the audit committee at the committee's next regularly scheduled meeting. If the transaction is not so ratified, the policy will require management to make all reasonable efforts to cancel or annul such transaction. Any related party transactions that are ongoing in nature will be reviewed annually.
A related party transaction reviewed under the policy will be considered approved or ratified if it is authorized by the audit committee after full disclosure of the related party's interest in the transaction. In reviewing and approving any such transactions, the audit committee will be tasked to consider all relevant facts and circumstances, including, but not limited to, whether the transaction is on terms comparable to those that could be obtained in an arm's length transaction and the extent of the related party's interest in the transaction.
All of the transactions described in this section occurred prior to the adoption of the policy.
118
PRINCIPAL AND SELLING STOCKHOLDERS
The following table sets forth information with respect to the beneficial ownership of our Class A common stock and Class B common stock, as of August 31, 2014, after giving effect to (1) the consummation of the Corporate Reorganization described in the section titled "Organizational Structure," (2) the reclassification of all outstanding shares of common stock and the conversion of all outstanding shares of our preferred stock held by the selling stockholders into shares of Class B common stock prior to the completion of this offering and (3) the automatic conversion of all other outstanding shares of our preferred stock into shares of our Class B common stock, which will occur immediately upon the completion of this offering, for:
- •
- each of our named executive officers;
- •
- each of our directors;
- •
- all of our directors and executive officers as a group;
- •
- each holder of more than 5% of our Class A common stock or Class B common stock; and
- •
- each of the selling stockholders.
The number of shares beneficially owned by each stockholder is determined under rules issued by the Securities and Exchange Commission and includes any shares as to which the individual or entity has sole or shared voting power or investment power. Each of the stockholders listed has sole voting and investment power with respect to the shares beneficially owned by the stockholder unless noted otherwise, subject to community property laws where applicable.
Our calculation of the percentage ownership prior to this offering is based on no shares of our Class A common stock and 72,377,263 shares of our Class B common stock (including preferred stock on an as-converted basis) outstanding as of August 31, 2014. We have based our calculation of the percentage of beneficial ownership after this offering on 10,500,000 shares of our Class A common stock and 72,377,263 shares of our Class B common stock outstanding immediately after the closing of this offering (assuming no exercise of the underwriters' option to purchase additional shares of Class A common stock and the sale of 500,000 shares of our Class A common stock by the selling stockholders). In computing the number of shares beneficially owned by a stockholder and the percentage ownership of that stockholder, shares of common stock subject to options that are currently exercisable or will become exercisable within 60 days after August 31, 2014 or issuable pursuant to restricted stock units which are subject to vesting conditions expected to occur within 60 days after August 31, 2014 are considered outstanding, although these shares are not considered outstanding for purposes of computing the percentage ownership of any other stockholder.
119
Unless otherwise indicated, the address of all listed stockholders is c/o Wayfair Inc., 4 Copley Place, 7th Floor, Boston, MA 02116.
| |
Shares beneficially owned prior to this offering |
|
Shares beneficially owned following this offering |
|||||||||||||||||||||||||||||||
|---|---|---|---|---|---|---|---|---|---|---|---|---|---|---|---|---|---|---|---|---|---|---|---|---|---|---|---|---|---|---|---|---|---|---|
| |
Class A | Class B | % total voting power |
Shares being sold |
Class A | Class B | % total voting power** |
|||||||||||||||||||||||||||
Name and address of beneficial owner
|
||||||||||||||||||||||||||||||||||
Shares
|
%
|
Shares
|
%
|
Shares
|
%
|
Shares
|
%
|
|||||||||||||||||||||||||||
5% stockholders: |
||||||||||||||||||||||||||||||||||
Entities affiliated with Battery Ventures(1) |
4,389,898 | 6.07 | % | 6.07 | % | 128,426 | 0 | 0.00 | % | 4,261,472 | 5.94 | % | 5.85 | % | ||||||||||||||||||||
One Marina Park Drive |
||||||||||||||||||||||||||||||||||
Entities affiliated with Great Hill Partners(2) |
8,152,668 | 11.26 | % | 11.26 | % | 231,168 | 0 | 0.00 | % | 7,921,500 | 11.04 | % | 10.87 | % | ||||||||||||||||||||
One Liberty Square |
||||||||||||||||||||||||||||||||||
Entities affiliated with HarbourVest Partners(3) |
5,017,028 | 6.93 | % | 6.93 | % | 140,406 | 0 | 0.00 | % | 4,876,622 | 6.80 | % | 6.69 | % | ||||||||||||||||||||
One Financial Center |
||||||||||||||||||||||||||||||||||
Directors and Named Executive Officers |
||||||||||||||||||||||||||||||||||
Niraj Shah(4) |
20,646,253 | 28.51 | % | 28.51 | % | — | 0 | 0.00 | % | 20,646,253 | 28.76 | % | 28.33 | % | ||||||||||||||||||||
Steven Conine(5) |
20,646,252 | 28.51 | % | 28.51 | % | — | 0 | 0.00 | % | 20,646,252 | 28.76 | % | 28.33 | % | ||||||||||||||||||||
Michael Fleisher(6) |
113,600 | * | * | 0 | 0.00 | % | 113,600 | * | * | |||||||||||||||||||||||||
Neeraj Agrawal(7) |
— | 4,389,898 | 6.07 | % | 6.07 | % | 128,426 | (13) | 0 | 0.00 | % | 4,261,472 | 5.94 | % | 5.85 | % | ||||||||||||||||||
Julie Bradley(8) |
95,426 | * | * | 0 | 0.00 | % | 95,426 | * | * | |||||||||||||||||||||||||
Alex Finkelstein(9) |
— | 3,135,641 | 4.33 | % | 4.33 | % | 0 | 0.00 | % | 3,135,641 | 4.37 | % | 4.30 | % | ||||||||||||||||||||
Michael Kumin(10) |
— | 8,152,668 | 11.26 | % | 11.26 | % | 231,168 | (14) | 0 | 0.00 | % | 7,921,500 | 11.04 | % | 10.87 | % | ||||||||||||||||||
Ian Lane(11) |
5,017,028 | 6.93 | % | 6.93 | % | 140,406 | (15) | 0 | 0.00 | % | 4,876,622 | 6.80 | % | 6.69 | % | |||||||||||||||||||
Romero Rodrigues |
— | * | * | 0 | 0.00 | % | — | * | * | |||||||||||||||||||||||||
All executive officers and directors as a group (11 persons)(12) |
— | 0.00 | % | 63,784,690 | 88.10 | % | 88.10 | % | 500,000 | — | 0.00 | % | 63,284,690 | 88.17 | % | 86.83 | % | |||||||||||||||||
- *
- Represents
beneficial ownership of less than 1% of our outstanding capital stock.
- **
- Represents
the voting power with respect to all shares of our Class A common stock and Class B common stock, voting as a single class. Each
share of Class A common stock will be entitled to one vote per share and each share of Class B common stock will be entitled to ten votes per share. For more information, please see the
section "Description of Capital Stock — Class A common stock and Class B Common Stock."
- (1)
- Consists
of (a) 3,710,374 shares of Series A-1 preferred stock and 636,065 shares of Series A-2 preferred stock held by Battery Ventures IX
(AIV I), L.P. and (b) 37,100 shares of Series A-1 preferred stock and 6,359 shares of Series A-2 preferred stock held by Battery Investment Partners IX, LLC. The sole
general partner of Battery Ventures IX (AIV I), L.P. is Battery Partners IX (AIV I), LLC. The sole managing member of Battery Investment Partners IX, LLC is Battery
Partners IX, LLC. Battery Partners IX (AIV I), LLC's and Battery Partners IX, LLC's investment advisor is Battery Management Corp., which we refer to together with
Battery Partners IX (AIV I), LLC and Battery Partners IX, LLC as the Battery Companies. The managing members and officers of the Battery Companies who share voting and dispositive power
with respect to these shares are Neeraj Agrawal, Michael Brown, Thomas J. Crotty, Jesse Feldman, Richard D. Frisbie, Kenneth P. Lawler, Roger H. Lee, R. David Tabors and Scott R. Tobin.
Each of the foregoing persons disclaims beneficial ownership of these shares except to the extent of his pecuniary interest therein.
- (2)
- Consists
of (a) 6,940,665 shares of Series A-1 preferred stock and 1,189,828 shares of Series A-2 preferred stock held by Great Hill Equity
Partners IV, L.P., and (b) 18,930 shares of Series A-1 preferred stock and 3,245 shares of Series A-2 preferred stock held by Great Hill Investors, LLC. Great Hill
Partners GP IV, L.P. is the sole general partner of Great Hill Equity Partners IV, L.P. and GHP IV, LLC is the sole general partner of Great Hill Partners GP
IV, L.P. GHP IV, LLC is controlled by Christopher S. Gaffney, John G. Hayes, Michael A. Kumin, Mark D. Taber and Matthew T. Vettel and, as such, they may be deemed to indirectly
beneficially own the shares beneficially owned by Great Hill Equity Partners IV, L.P. Great Hill Investors, LLC is controlled by Christopher S. Gaffney, John G. Hayes, Michael A.
Kumin, Mark D. Taber and Matthew T. Vettel and, as such, they may be deemed to indirectly beneficially own the shares beneficially owned by Great Hill Investors, LLC. Each of
Messrs. Gaffney, Hayes, Kumin, Taber and Vettel disclaims beneficial ownership of these shares except to the extent of his pecuniary interest therein.
- (3)
- Consists of (a) 1,070,707 shares of Series A-1 preferred stock and 183,550 shares of Series A-2 preferred stock held by HarbourVest Partners VIII-Venture Fund, L.P., (b) 1,070,707 shares of Series A-1 preferred stock and 183,550 shares of Series A-2 preferred stock held by HarbourVest/NYSTRS Co-invest Fund L.P. and (c) 2,141,414 shares of Series A-1 preferred stock and 367,100 shares of Series A-2 preferred stock held by HarbourVest Partners 2007 Director Fund L.P. The general partner of HarbourVest Partners VIII-Venture Fund, L.P. is HarbourVest VIII-Venture Associates L.P., the general partner of HarbourVest VIII-Venture Associates L.P. is HarbourVest VIII-Venture Associates LLC and the managing member of HarbourVest VIII-Venture Associates LLC is HarbourVest Partners, LLC. The general partner of HarbourVest/NYSTRS Co-invest Fund L.P. is HIPEP VI Select Associates L.P., the general partner of HIPEP VI Select Associates L.P. is HIPEP VI Select Associates LLC and the managing member of HIPEP VI Select Associates LLC is HarbourVest Partners, LLC. The general partner of HarbourVest Partners 2007 Director Fund L.P. is HarbourVest 2007 Direct Associates L.P., the general partner of HarbourVest 2007 Direct Associates L.P. is HarbourVest 2007 Direct Associates LLC and the managing member of HarbourVest 2007 Direct Associates LLC is HarbourVest Partners, LLC. The members of the investment committee of HarbourVest Partners, LLC consists of John M. Toomey, William A. Johnston, Gregory V. Stento, D. Brooks Zug and Kathleen M. Bacon and, as such, they may be deemed to indirectly
120
beneficially own the common stock beneficially owned by HarbourVest Partners VIII-Venture Fund, L.P., HarbourVest/NYSTRS Co-invest Fund L.P. and HarbourVest Partners 2007 Director Fund L.P. Each of HarbourVest Partners, LLC, Messrs. Toomey, Johnston, Stento and Zug and Ms. Bacon disclaims beneficial ownership of these shares except to the extent of its, his or her pecuniary interest therein.
- (4)
- Consists
of (a) 428,283 shares of Series A preferred stock held by Mr. Shah, (b) 15,710,763 shares of common stock held by
Mr. Shah, (c) 1,625,858 shares of common stock held by Niraj Shah 2007 Irrevocable Trust, (d) 2,851,349 shares of common stock held by Niraj Shah 2007 Non Exempt Irrevocable Trust
and (e) restricted stock units that will convert into 30,000 shares of common stock with 60 days of August 31, 2014. The trustee of the Niraj Shah 2007 Irrevocable Trust and the Niraj Shah 2007
Non Exempt Irrevocable Trust is Nikunj Shah, and he exercises voting and investment power over the shares held of record by the trusts.
- (5)
- Consists
of (a) 428,283 shares of Series A preferred stock held by Mr. Conine, (b) 15,710,762 shares of common stock held by
Mr. Conine, (c) 1,625,858 shares of common stock held by Steven K. Conine 2007 Irrevocable Trust, (d) 15,710,762 shares of common stock held by Steven K. Conine Non Exempt
Irrevocable Trust and (e) restricted stock units that will convert into 30,000 shares of common stock with 60 days of August 31, 2014. The trustee of the Steven K. Conine 2007 Irrevocable Trust
and the Steven K. Conine 2007 Non Exempt Irrevocable Trust is Sarah Conine, and she exercises voting and investment power over the shares held of record by the trusts.
- (6)
- Consists
of restricted stock units that will convert into 113,600 shares of common stock within 60 days of August 31, 2014.
- (7)
- Consists
of shares described in Note (1) above, which are held by entities affiliated with Battery Ventures. Mr. Agrawal is a managing member
and officer of the Battery Companies.
- (8)
- Consists
of (a) 76,260 shares of Series B preferred stock and (b) restricted stock units that will convert into 19,166 shares of common stock within
60 days of August 31, 2014.
- (9)
- Consists
of (a) 2,650,535 shares of Series A-1 preferred stock and 454,376 shares of Series A-2 preferred stock held by Spark Capital
III (AIV I), L.P. and (b) 26,232 shares of Series A-1 preferred stock and 4,498 shares of Series A-2 preferred stock held by Spark Capital Founders' Fund III, L.P.
Mr. Finkelstein is a general partner of Spark Capital and, as such, may be deemed to have beneficial ownership of these shares.
- (10)
- Consists
of shares described in Note (2) above, which are held by entities affiliated with Great Hill Partners. Mr. Kumin is a manager of GHP
IV, LLC and Great Hill Investors, LLC, and, as such, may be deemed to have beneficial ownership of these shares.
- (11)
- Consists
of shares described in Note (3) above, which are held by entities affiliated with HarbourVest Partners, LLC. Mr. Lane is a Principal
of HarbourVest Partners, LLC and, as such, may be deemed to have beneficial ownership of these shares.
- (12)
- Consists
of (a) 41,534,421 shares of common stock, (b) 18,523,230 shares of Series A-1 preferred stock, (c) 3,028,571 shares of Series A-2 preferred stock,
(d) 76,260 shares of Series B preferred stock and (e) restricted stock units that will convert into 622,208 shares of common stock within 60 days of August 31, 2014 shares of common stock.
- (13)
- Represents
shares that will be offered and sold by entities affiliated with Battery Ventures.
- (14)
- Represents
shares that will be offered and sold by entities affiliated with Great Hill Partners.
- (15)
- Represents shares that will be offered and sold by entities affiliated with HarbourVest Partners, LLC.
121
General
As of the closing of this offering, our authorized capital stock will consist of 674,000,000 shares of common stock, par value $0.001 per share, and 10,000,000 shares of preferred stock, par value $0.001 per share. Our common stock will be divided into two classes, Class A common stock and Class B common stock. Following this offering, our authorized Class A common stock will consist of 500,000,000 shares and our authorized Class B common stock will consist of 164,000,000 shares.
The following description of our capital stock and provisions of our restated certificate of incorporation and amended and restated bylaws are summaries and are qualified by reference to the restated certificate of incorporation and amended and restated bylaws that will become effective upon the closing of this offering. Copies of these documents will be filed with the Securities and Exchange Commission as exhibits to our registration statement, of which this prospectus forms a part. The description of our capital stock reflects changes to our capital structure that will occur upon the closing of this offering.
Class A Common Stock and Class B Common Stock
As of June 30, 2014, there were no shares of our Class A common stock outstanding and 71,330,994 shares of Class B common stock outstanding and held of record by 116 stockholders, assuming (1) the consummation of the Corporate Reorganization, described in the section titled "Organizational Structure" prior to the completion of this offering, (2) the reclassification of all outstanding shares of common stock and the conversion of all outstanding shares of our preferred stock held by the selling stockholders into shares of Class B common stock prior to the completion of this offering and (3) the automatic conversion of all other outstanding shares of our preferred stock into shares of our Class B common stock, which will occur immediately upon the completion of this offering.
Voting Rights
Holders of our Class A common stock and Class B common stock have identical rights, provided that, except as otherwise expressly provided in our restated certificate of incorporation or required by applicable law, on any matter that is submitted to a vote of our stockholders, holders of our Class A common stock are entitled to one vote per share of Class A common stock and holders of our Class B common stock are entitled to ten votes per share of Class B common stock. Holders of shares of Class A common stock and Class B common stock will vote together as a single class on all matters (including the election of directors) submitted to a vote of stockholders.
Upon the completion of this offering, under our restated certificate of incorporation, we may not increase or decrease the authorized number of shares of Class A common stock or Class B common stock without the affirmative vote of the holders of a majority of the voting power of the outstanding shares of our capital stock entitled to vote, voting together as a single class. In addition, we may not issue any shares of Class B common stock (other than upon exercise of options or other rights to acquire Class B common stock or in connection with a reclassification or dividend), unless that issuance is approved by the affirmative vote of the holders of a majority of the outstanding shares of Class B common stock.
We have not provided for cumulative voting for the election of directors in our restated certificate of incorporation.
122
Economic Rights
Except as otherwise expressly provided in our restated certificate of incorporation or required by applicable law, shares of Class A common stock and Class B common stock will have the same rights and privileges and rank equally, share ratably and be identical in all respects as to all matters, including, without limitation, those described below.
Dividends. Any dividend or distributions paid or payable to the holders of shares of Class A common stock and Class B common stock shall be paid pro rata, on an equal priority, pari passu basis, unless different treatment of the shares of each such class is approved by the affirmative vote of the holders of a majority of the outstanding shares of Class A common stock and Class B common stock, each voting separately as a class; provided, however, that if a dividend or distribution is paid in the form of Class A common stock or Class B common stock (or rights to acquire shares of Class A common stock or Class B common stock), then the holders of the Class A common stock shall receive Class A common stock (or rights to acquire shares of Class A common stock) and holders of Class B common stock shall receive Class B common stock (or rights to acquire shares of Class B common stock).
Subdivisions and Combinations. If we subdivide or combine in any manner outstanding shares of Class A common stock or Class B common stock, then the outstanding shares of all common stock will be subdivided or combined in the same proportion and manner.
Change of Control Transaction. In connection with any change of control transaction (as defined in our restated certificate of incorporation), the holders of Class A common stock and Class B common stock will be treated equally and identically with respect to shares of Class A common stock or Class B common stock owned by them, unless different treatment of the shares of each class is approved by the affirmative vote of the holders of a majority of the outstanding shares of Class A common stock and Class B common stock, each voting separately as a class.
Conversion
Each share of Class B common stock is convertible at any time at the option of the holder into one share of Class A common stock. In addition, each share of Class B common stock will convert automatically into one share of Class A common stock upon any transfer, whether or not for value and whether voluntary or involuntary or by operation of law, except for certain transfers described in our restated certificate of incorporation, including, without limitation, certain transfers for tax and estate planning purposes. In addition, upon the earlier of (i) the date on which the outstanding shares of Class B common stock represent less than 10% of the aggregate number of the then outstanding shares of Class A common stock and Class B common stock or (ii) the affirmative vote or written consent of the holders of at least 662/3% of the outstanding shares of Class B common stock, all outstanding shares of Class B common stock shall convert automatically into Class A common stock, and no additional shares of Class B common stock will be issued.
Preferred Stock
Under the terms of our restated certificate of incorporation that will become effective upon the closing of this offering, our board of directors is authorized to direct us to issue shares of preferred stock in one or more series without stockholder approval. Our board of directors has the discretion to determine the rights, preferences, privileges and restrictions, including voting rights, dividend rights, conversion rights, redemption privileges and liquidation preferences, of each series of preferred stock.
The purpose of authorizing our board of directors to issue preferred stock and determine its rights and preferences is to eliminate delays associated with a stockholder vote on specific
123
issuances. The issuance of preferred stock could adversely affect the voting power of holders of our common stock and the likelihood that such holders will receive dividend payments and payments upon liquidation. The issuance of preferred stock, while providing flexibility in connection with possible acquisitions, future financings and other corporate purposes, could have the effect of making it more difficult for a third party to acquire, or could discourage a third party from seeking to acquire, a majority of our outstanding voting stock. Upon the closing of this offering, there will be no shares of preferred stock outstanding, and we have no present plans to issue any shares of preferred stock.
Options
As of June 30, 2014, we had outstanding options to purchase an aggregate of 646,413 shares of our Series B common stock under our 2010 Plan, at a weighted-average exercise price of $2.98 per share.
Restricted Stock Units
As of June 30, 2014, we had outstanding restricted stock units for 6,085,085 shares of our Series B common stock under our 2010 Plan, at a weighted-average grant date fair value of $12.15 per share.
Registration Rights
We entered into our Investors' Rights Agreement with the holders of shares of our common stock issuable upon conversion of the shares of our preferred stock, which we refer to as registrable shares. Under the Investors' Rights Agreement, certain holders of registrable shares can demand that we file a registration statement and all holders of registrable shares can request that their registrable shares be covered by a registration statement that we are otherwise filing, as described below.
Demand Registration Rights. At any time after 180 days after the closing of this offering, the holders of registrable shares entitled to demand registration rights may request that we register all or a portion of their registrable shares for sale under the Securities Act of 1933, as amended, or Securities Act, so long as the request for such registration is for at least 20% of all registrable shares then outstanding (or a lesser percentage if the anticipated aggregate offering price would exceed $10 million). We will effect the registration as requested unless, in the good faith judgment of our board of directors, such registration should be delayed. We may be required to effect two of these registrations. In addition, when we are eligible for the use of Form S-3, or any successor form, holders of registrable shares entitled to demand registration rights may make unlimited requests that we register all or a portion of their registrable shares for sale under the Securities Act on Form S-3, or any successor form, so long as the request for registration is for at least 10% of all registrable shares then outstanding (or a lesser percentage if the anticipated aggregate offering price would exceed $1.0 million).
Incidental Registration Rights. In addition, if at any time after this offering we register any shares of our common stock, the holders of all registrable shares are entitled to notice of the registration and to include all or a portion of their registrable shares in the registration.
Other Provisions. In the event that any registration in which the holders of registrable shares participate pursuant to the second amended and restated investors' rights agreement is an underwritten public offering, the number of registrable shares to be included may, in specified circumstances, be limited due to market conditions.
124
We will pay all registration expenses related to any demand or incidental registration, other than underwriting discounts, selling commissions and the fees and expenses of the selling stockholders' own counsel, other than the reasonable fees and disbursements of one counsel for the selling stockholders. Our Investors' Rights Agreement contains customary cross-indemnification provisions, pursuant to which we are obligated to indemnify the selling stockholders in the event of material misstatements or omissions in the registration statement attributable to us, and they are obligated to indemnify us for material misstatements or omissions in the registration statement attributable to them.
Anti-Takeover Provisions
Upon the closing of this offering, we will be subject to Section 203 of the Delaware General Corporation Law. Subject to certain exceptions, Section 203 prevents a publicly held Delaware corporation from engaging in a "business combination" with any "interested stockholder" for three years following the date that the person became an interested stockholder, unless the interested stockholder attained such status with the approval of our board of directors or unless the business combination is approved in a prescribed manner. A "business combination" includes, among other things, a merger or consolidation involving us and the "interested stockholder" and the sale of more than 10% of our assets. In general, an "interested stockholder" is any entity or person beneficially owning 15% or more of our outstanding voting stock and any entity or person affiliated with or controlling or controlled by such entity or person.
Removal of Directors
Our restated certificate of incorporation and our amended and restated bylaws provide that, in the event the outstanding shares of our Class B common stock represent less than 10% of the then outstanding shares of Class A common stock and Class B common stock, a director may be removed only for cause and only by the affirmative vote of the holders of at least 662/3% of the votes that all of our stockholders would be entitled to cast in an annual election of directors. Any vacancy on our board of directors, including a vacancy resulting from an enlargement of our board of directors, may be filled only by vote of a majority of our directors then in office.
The limitations on the removal of directors and filling of vacancies could make it more difficult for a third party to acquire, or discourage a third party from seeking to acquire, control of our company.
Super-Majority Voting
The Delaware General Corporation Law provides generally that the affirmative vote of a majority of the shares entitled to vote on any matter is required to amend a corporation's certificate of incorporation or bylaws, unless a corporation's certificate of incorporation or bylaws, as the case may be, requires a greater percentage. Our amended and restated bylaws may be amended or repealed by a majority vote of our board of directors or the affirmative vote of the holders of at least 662/3% of the votes that all of our stockholders would be entitled to cast in an annual election of directors. In addition, the affirmative vote of the holders of at least 662/3% of the votes which all our stockholders would be entitled to cast in an election of directors is required to amend or repeal or to adopt any provisions inconsistent with any of the provisions of our restated certificate of incorporation described in this paragraph and the prior two paragraphs.
Stockholder Action; Special Meeting of Stockholders
Our restated certificate of incorporation provides that, in the event the outstanding shares of our Class B common stock represent less than 10% of the then outstanding shares of Class A
125
common stock and Class B common stock, any action required or permitted to be taken by our stockholders must be effected at a duly called annual or special meeting of such stockholders and may not be effected by any consent in writing by such stockholders. Our restated certificate of incorporation and our amended and restated bylaws also provide that, except as otherwise required by law, special meetings of our stockholders can only be called by our chairman of the board (or in the event of co-chairmen, either chairman), our chief executive officer, our president (in the event there is no chief executive officer) or our board of directors.
Authorized But Unissued Shares
The authorized but unissued shares of our common stock and preferred stock are available for future issuance without stockholder approval, subject to any limitations imposed by the listing standards of the NYSE. These additional shares may be used for a variety of corporate finance transactions, acquisitions and employee benefit plans. The existence of authorized but unissued and unreserved common stock and preferred stock could make more difficult or discourage an attempt to obtain control of us by means of a proxy contest, tender offer, merger or otherwise.
Transfer Agent and Registrar
The transfer agent and registrar for our common stock will be Computershare Trust Company, N.A.
New York Stock Exchange
We have applied to list our common stock on the NYSE under the symbol "W."
126
SHARES ELIGIBLE FOR FUTURE SALE
Immediately prior to this offering, there was no public market for our Class A common stock. Future sales of substantial amounts of Class A common stock in the public market, or the perception that such sales may occur, could adversely affect the market price of our common stock. Although we intend to apply to have our common stock listed on the NYSE, we cannot assure you that there will be an active public market for our common stock.
Upon the closing of this offering, and after giving effect to the Corporate Reorganization, the reclassification of all outstanding shares of common stock and the conversion of all outstanding shares of our preferred stock into shares of Class B common stock and the conversion of shares sold by the selling stockholders in this offering into shares of Class A common stock, based on the number of shares of our capital stock outstanding as of June 30, 2014, we will have outstanding an aggregate of 11,000,000 shares of Class A common stock, assuming the issuance of 10,500,000 shares of Class A common stock offered by us in this offering and the sale of shares by the selling stockholders, 500,000 shares of Class B common stock and no shares of preferred stock. Of these shares, all shares sold in this offering will be freely tradable without restriction or further registration under the Securities Act, except for any shares purchased by our "affiliates," as that term is defined in Rule 144 under the Securities Act, whose sales would be subject to the Rule 144 resale restrictions described below, other than the holding period requirement.
The remaining 71,756,943 shares of common stock will be "restricted securities," as that term is defined in Rule 144 under the Securities Act. These restricted securities are eligible for public sale only if they are registered under the Securities Act or if they qualify for an exemption from registration under the Securities Act, including pursuant to Rules 144 and 701, which are summarized below.
Subject to the lock-up agreements described below and the provisions of Rules 144 and 701 under the Securities Act, these restricted securities will be available for sale in the public market as follows:
Date
|
Number of Shares
|
|||
|---|---|---|---|---|
On the date of this prospectus |
0 | |||
90 days after the date of this prospectus |
1,424,205 | |||
180 days after the date of this prospectus |
7,303,175 | |||
In addition, of the 646,413 shares of our Class B common stock that were subject to stock options outstanding as of June 30, 2014 under our 2010 Plan, options to purchase 555,018 shares of Class B common stock were vested as of June 30, 2014 and, upon exercise, these shares will be eligible for sale subject to the lock-up agreements described below and Rules 144 and 701 under the Securities Act.
Lock-Up Agreements
We and each of our directors and executive officers, holders of substantially all of our outstanding capital stock and holders of substantially all of our stock options and restricted stock units, have agreed that, without the prior written consent of Goldman, Sachs & Co. on behalf of the underwriters, we and they will not, subject to limited exceptions, during the period ending 180 days after the date of this prospectus, subject to extension in specified circumstances, offer, sell, contract to sell or otherwise dispose of, directly or indirectly, our Class A common stock or securities convertible into or exchangeable for or exercisable for our Class A common stock. Please read the section titled "Underwriting" for additional information. Upon the expiration of the applicable lock-up periods, substantially all of the shares subject to such lock-up restrictions will become eligible for sale, subject to the limitations discussed above.
127
Rule 144
Affiliate Resales of Restricted Securities
In general, under Rule 144, beginning 90 days after the effective date of the registration statement of which this prospectus is a part, a person who is an affiliate of ours, or who was an affiliate at any time during the 90 days before a sale, who has beneficially owned shares of our common stock for at least six months would be entitled to sell in "broker's transactions" or certain "riskless principal transactions" or to market makers, a number of shares within any three-month period that does not exceed the greater of:
- •
- 1% of the number of shares of our common stock then outstanding, which will equal approximately 827,569 shares
immediately after this offering; or
- •
- the average weekly trading volume in our common stock on the NYSE during the four calendar weeks preceding the filing of a notice on Form 144 with respect to such sale.
Affiliate resales under Rule 144 are also subject to the availability of current public information about us. In addition, if the number of shares being sold under Rule 144 by an affiliate during any three-month period exceeds 5,000 shares or has an aggregate sale price in excess of $50,000, the seller must file a notice on Form 144 with the Securities and Exchange Commission, or SEC, and the NYSE concurrently with either the placing of a sale order with the broker or the execution directly with a market maker.
Non-Affiliate Resales of Restricted Securities
In general, beginning 90 days after the effective date of the registration statement of which this prospectus is a part, a person who is not an affiliate of ours at the time of sale, and has not been an affiliate at any time during the three months preceding a sale, and who has beneficially owned shares of our common stock for at least six months but less than a year, is entitled to sell such shares subject only to the availability of current public information about us. If such person has held our shares for at least one year, such person can resell under Rule 144(b)(1) without regard to any Rule 144 restrictions, including the 90-day public company requirement and the current public information requirement.
Non-affiliate resales are not subject to the manner of sale, volume limitation or notice filing provisions of Rule 144.
Rule 701
In general, under Rule 701, any of our employees, directors, officers, consultants or advisors who purchase shares from the us in connection with a compensatory stock or option plan or other written agreement before the effective date of a registration statement under the Securities Act is entitled to sell such shares 90 days after such effective date in reliance on Rule 144. An affiliate of ours can resell shares in reliance on Rule 144 without having to comply with the holding period requirement, and non-affiliates of ours can resell shares in reliance on Rule 144 without having to comply with the current public information and holding period requirements.
The SEC has indicated that Rule 701 will apply to typical stock options granted by an issuer before it becomes subject to the reporting requirements of the Exchange Act, along with the shares acquired upon exercise of such options, including exercises after an issuer becomes subject to the reporting requirements of the Exchange Act.
128
Equity Plans
We intend to file one or more registration statements on Form S-8 under the Securities Act to register all shares of common stock subject to outstanding stock options and common stock issued or issuable under our stock plans. We expect to file the registration statement covering shares offered pursuant to our stock plans shortly after the date of this prospectus, permitting the resale of such shares by nonaffiliates in the public market without restriction under the Securities Act and the sale by affiliates in the public market, subject to compliance with the resale provisions of Rule 144 and subject in each case to applicable lock-up restrictions. Please read the section titled "Underwriting" for additional information.
Registration Rights
Upon the closing of this offering, the holders of 27,046,934 shares of our Class B common stock or their transferees will be entitled to various rights with respect to the registration of these shares under the Securities Act. Registration of these shares under the Securities Act would result in these shares becoming fully tradable without restriction under the Securities Act immediately upon the effectiveness of the registration, except for shares purchased by affiliates. Please read the section titled "Description of Capital Stock — Registration Rights" for additional information. Shares covered by a registration statement will be eligible for sale in the public market upon the expiration or release from the terms of the lock-up agreement.
129
MATERIAL U.S. FEDERAL INCOME TAX CONSEQUENCES
TO NON-U.S. HOLDERS OF CLASS A COMMON STOCK
The following discussion is a summary of the material U.S. federal income tax consequences to non-U.S. holders (as defined below) of the purchase, ownership and disposition of our Class A common stock issued pursuant to this offering, but it is not a complete analysis of all potential tax consequences. The consequences of other U.S. federal tax laws, such as estate and gift tax laws, and any applicable state, local or foreign tax laws are not discussed. This discussion is based on the Internal Revenue Code of 1986, as amended, or the Code, Treasury Regulations promulgated thereunder, judicial decisions, and published rulings and administrative pronouncements of the U.S. Internal Revenue Service, or the IRS, in effect as of the date of this offering. These authorities may change or be subject to differing interpretations. Any such change may be applied retroactively in a manner that could adversely affect a non-U.S. holder of our Class A common stock. We have not sought and will not seek any rulings from the IRS regarding the matters discussed below. There can be no assurance the IRS or a court will not take a contrary position regarding the tax consequences of the purchase, ownership and disposition of our Class A common stock.
This discussion is limited to non-U.S. holders that hold our Class A common stock as a "capital asset" within the meaning of Section 1221 of the Code (generally, property held for investment). This discussion does not address all U.S. federal income tax consequences relevant to a non-U.S. holder's particular circumstances, including the impact of the unearned income Medicare contribution tax or the alternative minimum tax. In addition, it does not address consequences relevant to non-U.S. holders subject to particular rules, including, without limitation:
- •
- U.S. expatriates and certain former citizens or long-term residents of the United States;
- •
- persons holding our Class A common stock as part of a hedge, straddle or other risk reduction strategy or as part
of a conversion transaction or other integrated investment;
- •
- banks, insurance companies, and other financial institutions;
- •
- real estate investment trusts or regulated investment companies;
- •
- brokers, dealers or traders in securities or currencies;
- •
- "controlled foreign corporations," "passive foreign investment companies," and corporations that accumulate earnings to
avoid U.S. federal income tax;
- •
- S corporations, partnerships or other entities or arrangements treated as partnerships for U.S. federal income tax
purposes;
- •
- tax-exempt organizations or governmental organizations;
- •
- persons deemed to sell our Class A common stock under the constructive sale provisions of the Code;
- •
- persons who hold or receive our Class A common stock pursuant to the exercise of any employee stock option or
otherwise as compensation;
- •
- tax-qualified retirement plans;
- •
- foreign governments; and
- •
- persons whose "functional currency" is not the U.S. dollar.
If a partnership (or other entity treated as a partnership for U.S. federal income tax purposes) holds our Class A common stock, the tax treatment of a partner in the partnership will depend on the status of the partner, the activities of the partnership and certain determinations made at the partner level. Accordingly, partnerships holding our Class A common stock and the partners in such
130
partnerships should consult their tax advisors regarding the U.S. federal income tax consequences to them of the purchase, ownership and disposition of our Class A common stock.
THIS DISCUSSION IS FOR INFORMATION PURPOSES ONLY AND IS NOT, AND IS NOT INTENDED AS, LEGAL OR TAX ADVICE. INVESTORS SHOULD CONSULT THEIR TAX ADVISORS WITH RESPECT TO THE APPLICATION OF THE U.S. FEDERAL INCOME TAX LAWS TO THEIR PARTICULAR SITUATIONS AS WELL AS ANY TAX CONSEQUENCES OF THE PURCHASE, OWNERSHIP AND DISPOSITION OF OUR CLASS A COMMON STOCK ARISING UNDER THE U.S. FEDERAL ESTATE OR GIFT TAX LAWS OR UNDER THE LAWS OF ANY STATE, LOCAL OR NON-U.S. TAXING JURISDICTION OR UNDER ANY APPLICABLE INCOME TAX TREATY.
Definition of a Non-U.S. Holder
For purposes of this discussion, a "non-U.S. holder" is any beneficial owner of our Class A common stock that is not a "U.S. person," a partnership, or an entity disregarded from its owner, each for United States federal income tax purposes. A U.S. person for such purposes is any of the following:
- •
- an individual who is a citizen or resident of the United States;
- •
- a corporation (or other entity taxable as a corporation for U.S. federal income tax purposes) created or organized under
the laws of the United States, any state thereof, or the District of Columbia;
- •
- an estate, the income of which is subject to U.S. federal income tax regardless of its source; or
- •
- a trust that (1) is subject to the primary supervision of a U.S. court and the control of one or more United States persons (within the meaning of Section 7701(a)(30) of the Code), or (2) has made a valid election under applicable Treasury Regulations to continue to be treated as a United States person.
Distributions
As described in the section titled "Dividend Policy," we do not anticipate declaring or paying dividends to holders of our Class A common stock in the foreseeable future. However, if we do make distributions on our Class A common stock, such distributions of cash or property on our Class A common stock will constitute dividends for U.S. federal income tax purposes to the extent paid from our current or accumulated earnings and profits, as determined under U.S. federal income tax principles. Amounts not treated as dividends for U.S. federal income tax purposes will constitute a return of capital and first be applied against and reduce a non-U.S. holder's adjusted tax basis in its Class A common stock, but not below zero. Any excess will be treated as capital gain and will be treated as described below in the section relating to the sale or disposition of our Class A common stock.
Subject to the discussion below on backup withholding and foreign accounts, dividends paid to a non-U.S. holder of our Class A common stock that are not effectively connected with the non-U.S. holder's conduct of a trade or business within the United States (or, if required by an applicable income tax treaty, that are not attributable to a permanent establishment in the United States maintained by the non-U.S. holder) will be subject to U.S. federal withholding tax at a rate of 30% of the gross amount of the dividends (or such lower rate specified by an applicable income tax treaty).
131
Non-U.S. holders will be entitled to a reduction in or an exemption from withholding on dividends as a result of either (a) an applicable income tax treaty or (b) the non-U.S. holder holding our Class A common stock in connection with the conduct of a trade or business within the United States and dividends being paid in connection with that trade or business. To claim such a reduction in or exemption from withholding, the non-U.S. holder must provide the applicable withholding agent with a properly executed (a) IRS Form W-8BEN or W-8BEN-E (or other applicable documentation) claiming an exemption from or reduction of the withholding tax under the benefit of an income tax treaty between the United States and the country in which the non-U.S. holder resides or is established, or (b) IRS Form W-8ECI stating that the dividends are not subject to withholding tax because they are effectively connected with the conduct by the non-U.S. holder of a trade or business within the United States, as may be applicable. These certifications must be provided to the applicable withholding agent prior to the payment of dividends and must be updated periodically. Non-U.S. holders that do not timely provide the applicable withholding agent with the required certification, but that qualify for a reduced rate under an applicable income tax treaty, may obtain a refund of any excess amounts withheld by timely filing an appropriate claim for refund with the IRS.
Subject to the discussion below on backup withholding and foreign accounts, if dividends paid to a non-U.S. holder are effectively connected with the non-U.S. holder's conduct of a trade or business within the United States (and, if required by an applicable income tax treaty, the non-U.S. holder maintains a permanent establishment in the United States to which such dividends are attributable), then, although exempt from U.S. federal withholding tax (provided the non-U.S. holder provides appropriate certification, as described above), the non-U.S. holder will be subject to U.S. federal income tax on such dividends on a net income basis at the regular graduated U.S. federal income tax rates. In addition, a non-U.S. holder that is a corporation may be subject to a branch profits tax at a rate of 30% (or such lower rate specified by an applicable income tax treaty) on its effectively connected earnings and profits for the taxable year that are attributable to such dividends, as adjusted for certain items. Non-U.S. holders should consult their tax advisors regarding their entitlement to benefits under any applicable income tax treaty.
Sale or Other Taxable Disposition
Subject to the discussions below on backup withholding and foreign accounts, a non-U.S. holder will not be subject to U.S. federal income tax on any gain realized upon the sale or other disposition of our Class A common stock unless:
- •
- the gain is effectively connected with the non-U.S. holder's conduct of a trade or business within the United States (and,
if required by an applicable income tax treaty, the non-U.S. holder maintains a permanent establishment in the United States to which such gain is attributable);
- •
- the non-U.S. holder is a nonresident alien individual present in the United States for 183 days or more during the
taxable year of the disposition and certain other requirements are met; or
- •
- our Class A common stock constitutes a U.S. real property interest, or USRPI, by reason of our status as a U.S. real property holding corporation, or a USRPHC, for U.S. federal income tax purposes.
Gain described in the first bullet point above will generally be subject to U.S. federal income tax on a net income basis at the regular graduated U.S. federal income tax rates. A non-U.S. holder that is a foreign corporation also may be subject to a branch profits tax at a rate of 30% (or such lower rate specified by an applicable income tax treaty) of a portion of its effectively connected earnings and profits for the taxable year, as adjusted for certain items.
132
A non-U.S. holder described in the second bullet point above will be subject to U.S. federal income tax at a rate of 30% (or such lower rate specified by an applicable income tax treaty) on any gain derived from the disposition, which may be offset by certain U.S. source capital losses of the non-U.S. holder (even though the individual is not considered a resident of the United States) provided the non-U.S. holder has timely filed U.S. federal income tax returns with respect to such losses.
With respect to the third bullet point above, we believe we are not currently and do not anticipate becoming a USRPHC. Because the determination of whether we are a USRPHC depends on the fair market value of our USRPIs relative to the fair market value of our other business assets and our non-U.S. real property interests, however, there can be no assurance we are not a USRPHC or will not become one in the future. Even if we are or were to become a USRPHC, gain arising from the sale or other taxable disposition by a non-U.S. holder of our Class A common stock will not be subject to U.S. federal income tax if (i) such class of stock is "regularly traded," as defined by applicable Treasury Regulations, on an established securities market, and (ii) such non-U.S. holder owned, actually or constructively, 5% or less of such class of our stock throughout the shorter of the five-year period ending on the date of the sale or other disposition or the non-U.S. holder's holding period for such stock. If we are a USRPHC and the conditions described in clauses (i) and (ii) of the preceding sentence are not met, gain on the disposition of shares of our Class A common stock generally will be taxed in the same manner as gain that is effectively connected with the conduct of a U.S. trade or business, except that the branch profits tax generally will not apply.
Non-U.S. holders should consult their tax advisors regarding potentially applicable income tax treaties that may provide for different rules.
Information Reporting and Backup Withholding
Subject to the discussion below on foreign accounts, a non-U.S. holder will not be subject to backup withholding with respect to payments of dividends on our Class A common stock we make to the non-U.S. holder, provided the applicable withholding agent does not have actual knowledge or reason to know such holder is a United States person and the holder certifies its non-U.S. status, such as by providing a valid IRS Form W-8BEN, W-8BEN-E or W-8ECI, or other applicable certification. However, information returns will be filed with the IRS in connection with any dividends on our Class A common stock paid to the non-U.S. holder, regardless of whether any tax was actually withheld. Copies of these information returns may also be made available under the provisions of a specific treaty or agreement to the tax authorities of the country in which the non-U.S. holder resides or is established.
Information reporting and backup withholding may apply to the proceeds of a sale of our Class A common stock within the United States, and information reporting may (although backup withholding generally will not) apply to the proceeds of a sale of our Class A common stock outside the United States conducted through certain U.S.-related financial intermediaries, in each case, unless the beneficial owner certifies under penalty of perjury that it is a non-U.S. holder on IRS Form W-8BEN, W-8BEN-E or other applicable form (and the payor does not have actual knowledge or reason to know that the beneficial owner is a U.S. person) or such owner otherwise establishes an exemption.
Backup withholding is not an additional tax. Any amounts withheld under the backup withholding rules may be allowed as a refund or a credit against a non-U.S. holder's U.S. federal income tax liability, provided the required information is timely furnished to the IRS.
133
Additional Withholding Tax on Payments Made to Foreign Accounts
Withholding taxes may be imposed under the Foreign Account Tax Compliance Act, or FATCA, on certain types of payments made to non-U.S. financial institutions and certain other non-U.S. entities. Specifically, a 30% withholding tax may be imposed on dividends on, or gross proceeds from the sale or other disposition of, our Class A common stock paid to a "foreign financial institution" or a "non-financial foreign entity" (each as defined in the Code), unless (1) the foreign financial institution undertakes certain diligence and reporting obligations, (2) the non-financial foreign entity either certifies it does not have any "substantial United States owners" (as defined in the Code) or furnishes identifying information regarding each substantial United States owner, or (3) the foreign financial institution or non-financial foreign entity otherwise qualifies for an exemption from these rules. If the payee is a foreign financial institution and is subject to the diligence and reporting requirements in (1) above, it must enter into an agreement with the U.S. Department of the Treasury requiring, among other things, that it undertake to identify accounts held by certain "specified United States persons" or "United States-owned foreign entities" (each as defined in the Code), annually report certain information about such accounts, and withhold 30% on payments to non-compliant foreign financial institutions and certain other account holders. Foreign governments may enter into an agreement with the IRS to implement FATCA in a different manner. Under current IRS guidance, FATCA withholding generally applies to payments of dividends on our Class A common stock and will apply to payments of gross proceeds from the sale or other disposition of such stock on or after January 1, 2017. Because we may not know the extent to which a distribution is a dividend for U.S. federal income tax purposes at the time it is made, for purposes of these withholding rules we may treat the entire distribution as a dividend. Prospective investors should consult their tax advisors regarding these withholding provisions.
134
The company, the selling stockholders and the underwriters named below have entered into an underwriting agreement with respect to the shares of Class A common stock being offered. Subject to certain conditions, each underwriter has severally agreed to purchase the number of shares indicated in the following table. Goldman, Sachs & Co. is the representative of the underwriters.
Underwriters
|
Number of Shares |
|||
|---|---|---|---|---|
Goldman, Sachs & Co. |
||||
Merrill Lynch, Pierce, Fenner & Smith |
||||
Citigroup Global Markets Inc. |
||||
Allen & Company LLC |
||||
Pacific Crest Securities LLC |
||||
Piper Jaffray & Co |
||||
Wells Fargo Securities, LLC |
||||
Canaccord Genuity Inc. |
||||
Cowen and Company, LLC |
||||
Raymond James & Associates, Inc. |
||||
| | | | | |
Total |
11,000,000 | |||
| | | | | |
| | | | | |
The underwriters are committed to take and pay for all of the shares being offered, if any are taken, other than the shares covered by the option described below unless and until this option is exercised.
The underwriters have an option to buy up to an additional 1,650,000 shares of Class A common stock from the selling stockholders. They may exercise that option for 30 days. If any shares are purchased pursuant to this option, the underwriters will severally purchase shares in approximately the same proportion as set forth in the table above.
The following tables show the per share and total underwriting discount to be paid to the underwriters by the company and the selling stockholders. Such amounts are shown assuming both no exercise and full exercise of the underwriters' option to purchase 1,650,000 additional shares.
Paid by the Company
|
No Exercise
|
Full Exercise
|
|||||
|---|---|---|---|---|---|---|---|
Per Share |
$ | $ | |||||
Total |
$ | $ | |||||
Paid by the Selling Stockholders
|
No Exercise
|
Full Exercise
|
|||||
|---|---|---|---|---|---|---|---|
Per Share |
$ | $ | |||||
Total |
$ | $ | |||||
Shares of Class A common stock sold by the underwriters to the public will initially be offered at the initial public offering price set forth on the cover of this prospectus. Any shares sold by the underwriters to securities dealers may be sold at a discount of up to $ per share from the initial public offering price. After the initial offering of the shares, the representative may change the offering price and the other selling terms. The offering of the shares by the underwriters is subject to receipt and acceptance and subject to the underwriters' right to reject any order in whole or in part.
135
The company estimates that its share of the total expenses of the offering, excluding the underwriting discount, will be approximately $3.3 million. The underwriters have agreed to reimburse the Company for certain expenses incurred in connection with this offering.
The company and its officers, directors, and holders of substantially all of the company's common stock, including the selling stockholders, have agreed with the underwriters, subject to certain exceptions, not to dispose of or hedge any of their common stock or securities convertible into or exchangeable for shares of common stock during the period from the date of this prospectus continuing through the date 180 days after the date of this prospectus, except with the prior written consent of Goldman, Sachs & Co. Please read the section titled "Shares Eligible for Future Sale" for a discussion of certain transfer restrictions.
Prior to the offering, there has been no public market for the shares of Class A common stock. The initial public offering price will be negotiated among the company and the underwriters. Among the factors to be considered in determining the initial public offering price of the shares, in addition to prevailing market conditions, will be the company's historical performance, estimates of the business potential and earnings prospects of the company, an assessment of the company's management and the consideration of the above factors in relation to market valuation of companies in related businesses.
We have applied to have our Class A common stock listed on the NYSE under the symbol "W."
In connection with the offering, the underwriters may purchase and sell shares of Class A common stock in the open market. These transactions may include short sales, stabilizing transactions and purchases to cover positions created by short sales. Short sales involve the sale by the underwriters of a greater number of shares than they are required to purchase in the offering, and a short position represents the amount of such sales that have not been covered by subsequent purchases. A "covered short position" is a short position that is not greater than the amount of additional shares for which the underwriters' option described above may be exercised. The underwriters may cover any covered short position by either exercising their option to purchase additional shares or purchasing shares in the open market. In determining the source of shares to cover the covered short position, the underwriters will consider, among other things, the price of shares available for purchase in the open market as compared to the price at which they may purchase additional shares pursuant to the option described above. "Naked" short sales are any short sales that create a short position greater than the amount of additional shares for which the option described above may be exercised. The underwriters must cover any such naked short position by purchasing shares in the open market. A naked short position is more likely to be created if the underwriters are concerned that there may be downward pressure on the price of the Class A common stock in the open market after pricing that could adversely affect investors who purchase in the offering. Stabilizing transactions consist of various bids for or purchases of Class A common stock made by the underwriters in the open market prior to the completion of the offering.
The underwriters may also impose a penalty bid. This occurs when a particular underwriter repays to the underwriters a portion of the underwriting discount received by it because Goldman, Sachs & Co. has repurchased shares sold by or for the account of such underwriter in stabilizing or short covering transactions.
Purchases to cover a short position and stabilizing transactions, as well as other purchases by the underwriters for their own accounts, may have the effect of preventing or retarding a decline in the market price of the company's stock, and together with the imposition of the penalty bid, may stabilize, maintain or otherwise affect the market price of the Class A common stock. As a result, the price of the Class A common stock may be higher than the price that otherwise might exist in the open market. The underwriters are not required to engage in these activities and may end any
136
of these activities at any time. These transactions may be effected on the NYSE, in the over-the-counter market or otherwise.
Notice to Prospective Investors in the European Economic Area
In relation to each Member State of the European Economic Area (each, a "Relevant Member State"), no offer of shares may be made to the public in that Relevant Member State other than:
- A.
- to
any legal entity which is a qualified investor as defined in the Prospectus Directive;
- B.
- to
fewer than 100 or, if the Relevant Member State has implemented the relevant provision of the 2010 PD Amending Directive, 150, natural or legal persons
(other than qualified investors as defined in the Prospectus Directive), as permitted under the Prospectus Directive, subject to obtaining the prior consent of the representative; or
- C.
- in any other circumstances falling within Article 3(2) of the Prospectus Directive,
provided that no such offer of shares shall require the Company or the representative to publish a prospectus pursuant to Article 3 of the Prospectus Directive or supplement a prospectus pursuant to Article 16 of the Prospectus Directive.
Each person in a Relevant Member State who initially acquires any shares or to whom any offer is made will be deemed to have represented, acknowledged and agreed that it is a "qualified investor" within the meaning of the law in that Relevant Member State implementing Article 2(1)(e) of the Prospectus Directive. In the case of any shares being offered to a financial intermediary as that term is used in Article 3(2) of the Prospectus Directive, each such financial intermediary will be deemed to have represented, acknowledged and agreed that the shares acquired by it in the offer have not been acquired on a non-discretionary basis on behalf of, nor have they been acquired with a view to their offer or resale to, persons in circumstances which may give rise to an offer of any shares to the public other than their offer or resale in a Relevant Member State to qualified investors as so defined or in circumstances in which the prior consent of the representative has been obtained to each such proposed offer or resale.
The company, the representative and their affiliates will rely upon the truth and accuracy of the foregoing representations, acknowledgements and agreements.
This prospectus has been prepared on the basis that any offer of shares in any Relevant Member State will be made pursuant to an exemption under the Prospectus Directive from the requirement to publish a prospectus for offers of shares. Accordingly any person making or intending to make an offer in that Relevant Member State of shares which are the subject of the offering contemplated in this prospectus may only do so in circumstances in which no obligation arises for the company or any of the underwriters to publish a prospectus pursuant to Article 3 of the Prospectus Directive in relation to such offer. Neither the Company nor the underwriters have authorized, nor do they authorize, the making of any offer of shares in circumstances in which an obligation arises for the Company or the underwriters to publish a prospectus for such offer.
For the purpose of the above provisions, the expression "an offer to the public" in relation to any shares in any Relevant Member State means the communication in any form and by any means of sufficient information on the terms of the offer and the shares to be offered so as to enable an investor to decide to purchase or subscribe the shares, as the same may be varied in the Relevant Member State by any measure implementing the Prospectus Directive in the Relevant Member State and the expression "Prospectus Directive" means Directive 2003/71/EC (including the 2010 PD Amending Directive, to the extent implemented in the Relevant Member States) and includes any relevant implementing measure in the Relevant Member State and the expression "2010 PD Amending Directive" means Directive 2010/73/EU.
137
Notice to Prospective Investors in the United Kingdom
In addition, in the United Kingdom, this document is being distributed only to, and is directed only at, and any offer subsequently made may only be directed at persons who are "qualified investors" (as defined in the Prospectus Directive) (i) who have professional experience in matters relating to investments falling within Article 19 (5) of the Financial Services and Markets Act 2000 (Financial Promotion) Order 2005, as amended (the "Order") and/or (ii) who are high net worth companies (or persons to whom it may otherwise be lawfully communicated) falling within Article 49(2)(a) to (d) of the Order (all such persons together being referred to as "relevant persons"). This document must not be acted on or relied on in the United Kingdom by persons who are not relevant persons. In the United Kingdom, any investment or investment activity to which this document relates is only available to, and will be engaged in with, relevant persons.
Notice to Prospective Investors in Switzerland
The shares may not be publicly offered in Switzerland and will not be listed on the SIX Swiss Exchange (SIX) or on any other stock exchange or regulated trading facility in Switzerland. This document has been prepared without regard to the disclosure standards for issuance prospectuses under art. 652a or art. 1156 of the Swiss Code of Obligations or the disclosure standards for listing prospectuses under art. 27 ff. of the SIX Listing Rules or the listing rules of any other stock exchange or regulated trading facility in Switzerland. Neither this document nor any other offering or marketing material relating to the shares or the offering may be publicly distributed or otherwise made publicly available in Switzerland.
Neither this document nor any other offering or marketing material relating to the offering, the Company, the shares have been or will be filed with or approved by any Swiss regulatory authority. In particular, this document will not be filed with, and the offer of shares will not be supervised by, the Swiss Financial Market Supervisory Authority FINMA (FINMA), and the offer of shares has not been and will not be authorized under the Swiss Federal Act on Collective Investment Schemes (CISA). The investor protection afforded to acquirers of interests in collective investment schemes under the CISA does not extend to acquirers of shares.
Notice to Prospective Investors in the Dubai International Financial Centre
This prospectus relates to an Exempt Offer in accordance with the Offered Securities Rules of the Dubai Financial Services Authority (DFSA). This prospectus is intended for distribution only to persons of a type specified in the Offered Securities Rules of the DFSA. It must not be delivered to, or relied on by, any other person. The DFSA has no responsibility for reviewing or verifying any documents in connection with Exempt Offers. The DFSA has not approved this prospectus nor taken steps to verify the information set forth herein and has no responsibility for the prospectus. The shares to which this prospectus relates may be illiquid and/or subject to restrictions on their resale. Prospective purchasers of the shares offered should conduct their own due diligence on the shares. If you do not understand the contents of this prospectus you should consult an authorized financial advisor.
Notice to Prospective Investors in Australia
No placement document, prospectus, product disclosure statement or other disclosure document has been lodged with the Australian Securities and Investments Commission (ASIC), in relation to the offering. This prospectus does not constitute a prospectus, product disclosure statement or other disclosure document under the Corporations Act 2001 (Corporations Act), and does not purport to include the information required for a prospectus, product disclosure statement or other disclosure document under the Corporations Act.
138
Any offer in Australia of the shares may only be made to persons (the "Exempt Investors") who are "sophisticated investors" (within the meaning of section 708(8) of the Corporations Act), "professional investors" (within the meaning of section 708(11) of the Corporations Act) or otherwise pursuant to one or more exemptions contained in section 708 of the Corporations Act so that it is lawful to offer the shares without disclosure to investors under Chapter 6D of the Corporations Act.
The shares applied for by Exempt Investors in Australia must not be offered for sale in Australia in the period of 12 months after the date of allotment under the offering, except in circumstances where disclosure to investors under Chapter 6D of the Corporations Act would not be required pursuant to an exemption under section 708 of the Corporations Act or otherwise or where the offer is pursuant to a disclosure document which complies with Chapter 6D of the Corporations Act. Any person acquiring shares must observe such Australian on-sale restrictions.
This prospectus contains general information only and does not take account of the investment objectives, financial situation or particular needs of any particular person. It does not contain any securities recommendations or financial product advice. Before making an investment decision, investors need to consider whether the information in this prospectus is appropriate to their needs, objectives and circumstances, and, if necessary, seek expert advice on those matters.
Notice to Prospective Investors in Hong Kong
The shares have not been offered or sold and will not be offered or sold in Hong Kong, by means of any document, other than (a) to "professional investors" as defined in the Securities and Futures Ordinance (Cap. 571) of Hong Kong and any rules made under that Ordinance; or (b) in other circumstances which do not result in the document being a "prospectus" as defined in the Companies Ordinance (Cap. 32) of Hong Kong or which do not constitute an offer to the public within the meaning of that Ordinance. No advertisement, invitation or document relating to the shares has been or may be issued or has been or may be in the possession of any person for the purposes of issue, whether in Hong Kong or elsewhere, which is directed at, or the contents of which are likely to be accessed or read by, the public of Hong Kong (except if permitted to do so under the securities laws of Hong Kong) other than with respect to shares which are or are intended to be disposed of only to persons outside Hong Kong or only to "professional investors" as defined in the Securities and Futures Ordinance and any rules made under that Ordinance.
Notice to Prospective Investors in Japan
The shares have not been and will not be registered under the Financial Instruments and Exchange Law of Japan (Law No. 25 of 1948, as amended) and, accordingly, will not be offered or sold, directly or indirectly, in Japan, or for the benefit of any Japanese Person or to others for re-offering or resale, directly or indirectly, in Japan or to any Japanese Person, except in compliance with all applicable laws, regulations and ministerial guidelines promulgated by relevant Japanese governmental or regulatory authorities in effect at the relevant time. For the purposes of this paragraph, "Japanese Person" shall mean any person resident in Japan, including any corporation or other entity organized under the laws of Japan.
Notice to Prospective Investors in Singapore
This prospectus has not been registered as a prospectus with the Monetary Authority of Singapore. Accordingly, this prospectus and any other document or material in connection with the offer or sale, or invitation for subscription or purchase, of shares may not be circulated or distributed, nor may the shares be offered or sold, or be made the subject of an invitation for subscription or purchase, whether directly or indirectly, to persons in Singapore other than (i) to an
139
institutional investor under Section 274 of the Securities and Futures Act, Chapter 289 of Singapore (the "SFA"), (ii) to a relevant person pursuant to Section 275(1), or any person pursuant to Section 275(1A), and in accordance with the conditions specified in Section 275, of the SFA, or (iii) otherwise pursuant to, and in accordance with the conditions of, any other applicable provision of the SFA.
Where the shares are subscribed or purchased under Section 275 of the SFA by a relevant person which is:
- (a)
- a corporation (which is not an accredited investor (as defined in Section 4A of the SFA) the sole business of which is to hold investments and the entire share capital of which is owned by one or more individuals, each of whom is an accredited investor; or
a trust (where the trustee is not an accredited investor) whose sole purpose is to hold investments and each beneficiary of the trust is an individual who is an accredited investor,
securities (as defined in Section 239(1) of the SFA) of that corporation or the beneficiaries' rights and interest (howsoever described) in that trust shall not be transferred within six months after that corporation or that trust has acquired the shares pursuant to an offer made under Section 275 of the SFA except:
- (a)
- to an institutional investor or to a relevant person defined in Section 275(2) of the SFA, or to any person arising from an offer referred to in Section 275(1A) or Section 276(4)(i)(B) of the SFA;
where no consideration is or will be given for the transfer;
where the transfer is by operation of law;
as specified in Section 276(7) of the SFA; or
as specified in Regulation 32 of the Securities and Futures (Offers of Investments) (Shares and Debentures) Regulations 2005 of Singapore.
The underwriters do not expect sales to discretionary accounts to exceed five percent of the total number of shares offered.
The company and the selling stockholders estimate that their share of the total expenses of the offering, excluding underwriting discount, will be approximately $3.3 million.
The company and the selling stockholders have agreed to indemnify the several underwriters against certain liabilities, including liabilities under the Securities Act of 1933.
The underwriters and their respective affiliates are full service financial institutions engaged in various activities, which may include sales and trading, commercial and investment banking, advisory, investment management, investment research, principal investment, hedging, market making, brokerage and other financial and non-financial activities and services. Certain of the underwriters and their respective affiliates have provided, and may in the future provide, a variety of these services to us and to persons and entities with relationships with us, for which they received or will receive customary fees and expenses. We have previously paid aggregate fees of approximately $7.4 million to Allen & Company, an underwriter in this offering, for services provided to us in connection with our sale and issuance of shares of our Series B preferred stock in March 2014 and shares of our Series A preferred stock in November 2011 and July 2011. In addition, Bank of America, N.A., an affiliate of Merrill Lynch, Pierce, Fenner & Smith Incorporated, an underwriter in this offering, is a lender under our credit agreement.
In the ordinary course of their various business activities, the underwriters and their respective affiliates, officers, directors and employees may purchase, sell or hold a broad array of investments
140
and actively trade securities, derivatives, loans, commodities, currencies, credit default swaps and other financial instruments for their own account and for the accounts of their customers, and such investment and trading activities may involve or relate to assets, securities and/or instruments of the company (directly, as collateral securing other obligations or otherwise) and/or persons and entities with relationships with the company. The underwriters and their respective affiliates may also communicate independent investment recommendations, market color or trading ideas and/or publish or express independent research views in respect of such assets, securities or instruments and may at any time hold, or recommend to clients that they should acquire, long and/or short positions in such assets, securities and instruments.
141
The validity of the shares of common stock offered hereby will be passed upon for us by Latham & Watkins LLP, Waltham, Massachusetts. Ropes & Gray LLP is acting as counsel for the underwriters in connection with certain legal matters related to this offering.
The consolidated financial statements of Wayfair LLC at December 31, 2012 and 2013, and for the years then ended, appearing in this prospectus and registration statement have been audited by Ernst & Young LLP, independent registered public accounting firm, as set forth in their report thereon appearing elsewhere herein, and are included in reliance upon such report given on the authority of such firm as experts in accounting and auditing.
WHERE YOU CAN FIND MORE INFORMATION
We have filed with the SEC a registration statement on Form S-1 under the Securities Act with respect to the shares of Class A common stock offered hereby. This prospectus, which constitutes a part of the registration statement, does not contain all of the information set forth in the registration statement or the exhibits and schedules filed therewith. For further information about us and the Class A common stock offered hereby, we refer you to the registration statement and the exhibits and schedules filed thereto. Statements contained in this prospectus regarding the contents of any contract or any other document that is filed as an exhibit to the registration statement are not necessarily complete, and each such statement is qualified in all respects by reference to the full text of such contract or other document filed as an exhibit to the registration statement. Upon completion of this offering, we will be required to file periodic reports, proxy statements, and other information with the SEC pursuant to the Securities Exchange Act of 1934. You may read and copy this information without charge at the Securities and Exchange Commission, 100 F Street, N.E., Room 1580, Washington, D.C. 20549, and copies of all or any part of the registration statement may be obtained from such offices upon the payment of the fees prescribed by the SEC. You may obtain information on the hours of operation by calling the SEC at 1-800-SEC-0330. The SEC also maintains an Internet website that contains reports, proxy statements and other information about registrants, like us, that file electronically with SEC. The address of that site is www.sec.gov.
142
F-1
Report of Independent Registered Public Accounting Firm
The Board of Managers and Members of Wayfair LLC
We have audited the accompanying consolidated balance sheets of Wayfair LLC (the Company) as of December 31, 2012 and 2013, and the related consolidated statements of operations, comprehensive loss, changes in convertible redeemable preferred units and members' deficit, and cash flows for the years then ended. These financial statements are the responsibility of the Company's management. Our responsibility is to express an opinion on these financial statements based on our audits.
We conducted our audits in accordance with the standards of the Public Company Accounting Oversight Board (United States). Those standards require that we plan and perform the audit to obtain reasonable assurance about whether the financial statements are free of material misstatement. We were not engaged to perform an audit of the Company's internal control over financial reporting. Our audits included consideration of internal control over financial reporting as a basis for designing audit procedures that are appropriate in the circumstances, but not for the purpose of expressing an opinion on the effectiveness of the Company's internal control over financial reporting. Accordingly, we express no such opinion. An audit also includes examining, on a test basis, evidence supporting the amounts and disclosures in the financial statements, assessing the accounting principles used and significant estimates made by management, and evaluating the overall financial statement presentation. We believe that our audits provide a reasonable basis for our opinion.
In our opinion, the financial statements referred to above present fairly, in all material respects, the consolidated financial position of Wayfair LLC at December 31, 2012 and 2013, and the consolidated results of its operations and its cash flows for the years then ended, in conformity with U.S. generally accepted accounting principles.
/s/ Ernst & Young LLP
Boston, Massachusetts
May 7, 2014
F-2
Wayfair LLC
Consolidated Balance Sheets
| |
December 31, | June 30, | June 30, 2014 | ||||||||||
|---|---|---|---|---|---|---|---|---|---|---|---|---|---|
| |
2012 | 2013 | 2014 | Pro Forma | |||||||||
| |
(in thousands, except share and per unit/share data) |
||||||||||||
| |
|
|
(unaudited) |
||||||||||
Consolidated Balance Sheets: |
|||||||||||||
Assets |
|||||||||||||
Current assets |
|||||||||||||
Cash and cash equivalents |
$ | 77,861 | $ | 65,289 | $ | 87,781 | $ | 52,885 | |||||
Short-term investments |
23,017 | 50,019 | 65,017 | 65,017 | |||||||||
Accounts receivable, net of allowance for doubtful accounts of $754, $1,183 and $2,084 as of December 31, 2012 and 2013 and June 30, 2014, respectively |
15,766 | 7,689 | 6,647 | 6,647 | |||||||||
Inventories |
7,909 | 14,963 | 19,803 | 19,803 | |||||||||
Prepaid expenses and other current assets |
15,571 | 25,167 | 38,327 | 38,327 | |||||||||
| | | | | | | | | | | | | | |
Total current assets |
140,124 | 163,127 | 217,575 | 182,679 | |||||||||
Property and equipment, net |
18,370 | 22,088 | 44,141 | 44,141 | |||||||||
Intangible assets, net |
780 | 3,919 | 3,416 | 3,416 | |||||||||
Goodwill |
3,420 | 5,165 | 5,165 | 5,165 | |||||||||
Restricted cash |
268 | 826 | 3,844 | 3,844 | |||||||||
Other noncurrent assets |
615 | 1,175 | 2,877 | 2,877 | |||||||||
| | | | | | | | | | | | | | |
Total assets |
$ | 163,577 | $ | 196,300 | $ | 277,018 | $ | 242,122 | |||||
| | | | | | | | | | | | | | |
| | | | | | | | | | | | | | |
Liabilities, Convertible Redeemable Preferred Units and Members' (Deficit)/Stockholders' Equity |
|||||||||||||
Current liabilities |
|||||||||||||
Accounts payable |
$ | 66,603 | $ | 102,153 | $ | 81,124 | $ | 81,124 | |||||
Accrued expenses |
12,596 | 19,239 | 36,972 | 38,457 | |||||||||
Deferred revenue |
12,282 | 13,397 | 18,033 | 18,033 | |||||||||
Due to related party |
1,390 | 1,878 | 1,485 | — | |||||||||
Other current liabilities |
5,222 | 8,342 | 11,255 | 11,255 | |||||||||
| | | | | | | | | | | | | | |
Total current liabilities |
98,093 | 145,009 | 148,869 | 148,869 | |||||||||
Other liabilities |
477 | 944 | 12,889 | 13,195 | |||||||||
| | | | | | | | | | | | | | |
Total liabilities |
98,570 | 145,953 | 161,758 | 162,064 | |||||||||
Commitments and contingencies (Note 7) |
|||||||||||||
Series A convertible redeemable preferred units, no par value per unit: 21,551,801 units authorized at December 31, 2012 and 2013 and June 30, 2014; 21,551,801 units issued at December 31, 2012 and 2013 and June 30, 2014, respectively; no units authorized, issued and outstanding, pro forma (unaudited); liquidation preference of $235.5 million at June 30, 2014. |
215,798 |
241,186 |
235,486 |
— |
|||||||||
Series B convertible redeemable preferred units, no par value per unit: no units authorized and issued at December 31, 2012 and 2013, respectively; 5,995,133 units authorized and issued at June 30, 2014; no units authorized, issued and outstanding, pro forma (unaudited); liquidation preference of $157.2 million at June 30, 2014 |
— | — | 157,229 | — | |||||||||
Members' (deficit)/Stockholders' equity: |
|||||||||||||
Common units, no par value per unit: 71,194,852, 74,328,124 and 81,365,954 units authorized at December 31, 2012, and 2013 and June 30, 2014, respectively; 44,818,934, 44,904,110 and 43,784,060 units issued and outstanding at December 31, 2012 and 2013 and June 30, 2014, respectively; no units authorized, issued and outstanding, pro forma (unaudited) |
|||||||||||||
Class A common stock, $0.001 par value; no shares authorized, issued or outstanding, actual; 500,000,000 shares authorized, no shares issued and outstanding, pro forma |
— | — | — | — | |||||||||
Class B common stock, $0.001 par value; no shares authorized, issued or outstanding, actual; 164,000,000 shares authorized, 72,256,943 shares issued and outstanding, pro forma |
— | — | — | 72 | |||||||||
Additional paid-in capital |
— | — | — | 107,623 | |||||||||
Common members' (deficit)/Retained earnings |
(150,853 | ) | (190,511 | ) | (277,134 | ) | (27,316 | ) | |||||
Accumulated other comprehensive income (loss) |
62 | (328 | ) | (321 | ) | (321 | ) | ||||||
| | | | | | | | | | | | | | |
Total members' (deficit)/stockholders' equity |
(150,791 | ) | (190,839 | ) | (277,455 | ) | 80,058 | ||||||
| | | | | | | | | | | | | | |
Total liabilities, convertible redeemable preferred units and members' (deficit)/stockholders' equity |
$ | 163,577 | $ | 196,300 | $ | 277,018 | $ | 242,122 | |||||
| | | | | | | | | | | | | | |
| | | | | | | | | | | | | | |
See notes to consolidated financial statements.
F-3
Wayfair LLC
Consolidated Statements of Operations
| |
Years ended December 31, |
Six months ended June 30, |
|||||||||||
|---|---|---|---|---|---|---|---|---|---|---|---|---|---|
| |
2012
|
2013
|
2013
|
2014
|
|||||||||
| |
(in thousands, except share and per unit/share data) |
||||||||||||
| |
|
|
(unaudited) |
||||||||||
Consolidated Statements of Operations: |
|||||||||||||
Net revenue |
$ |
601,028 |
$ |
915,843 |
$ |
383,208 |
$ |
574,144 |
|||||
Cost of goods sold |
455,879 | 691,602 | 288,337 | 440,483 | |||||||||
| | | | | | | | | | | | | | |
Gross profit |
145,149 | 224,241 | 94,871 | 133,661 | |||||||||
Operating expenses: |
|||||||||||||
Sales and marketing |
113,370 | 177,475 | 72,714 | 138,228 | |||||||||
General and administrative |
52,961 | 62,246 | 30,014 | 46,355 | |||||||||
Amortization of acquired intangible assets |
212 | 539 | 106 | 499 | |||||||||
| | | | | | | | | | | | | | |
Total operating expenses |
166,543 | 240,260 | 102,834 | 185,082 | |||||||||
| | | | | | | | | | | | | | |
Loss from operations |
(21,394 | ) | (16,019 | ) | (7,963 | ) | (51,421 | ) | |||||
Interest income, net |
234 | 245 | 124 | 133 | |||||||||
Other (expense) income, net |
155 | 294 | (504 | ) | (96 | ) | |||||||
| | | | | | | | | | | | | | |
Loss before income taxes |
(21,005 | ) | (15,480 | ) | (8,343 | ) | (51,384 | ) | |||||
Provision for income taxes |
(50 | ) | (46 | ) | 5 | (17 | ) | ||||||
| | | | | | | | | | | | | | |
Net loss |
$ | (21,055 | ) | $ | (15,526 | ) | $ | (8,338 | ) | $ | (51,401 | ) | |
Accretion of convertible redeemable preferred units |
(12,154 | ) | (25,388 | ) | (15,948 | ) | (11,755 | ) | |||||
| | | | | | | | | | | | | | |
Net loss attributable to common unit holders |
(33,209 | ) | (40,914 | ) | (24,286 | ) | (63,156 | ) | |||||
| | | | | | | | | | | | | | |
| | | | | | | | | | | | | | |
Net loss attributable to common unit holders per unit — basic and diluted |
$ | (0.80 | ) | $ | (0.99 | ) | $ | (0.59 | ) | $ | (1.55 | ) | |
| | | | | | | | | | | | | | |
| | | | | | | | | | | | | | |
Weighted average number of common units outstanding used in computing per unit amounts — basic and diluted |
41,271,992 | 41,331,546 | 41,271,992 | 40,828,976 | |||||||||
| | | | | | | | | | | | | | |
| | | | | | | | | | | | | | |
Pro forma net loss per share — basic and diluted (Note 15) (unaudited) |
$ | (0.87 | ) | $ | (0.89 | ) | |||||||
| | | | | | | | | | | | | | |
| | | | | | | | | | | | | | |
Pro forma weighted average number of common shares outstanding (Note 15) (unaudited) |
66,399,733 | 70,416,261 | |||||||||||
| | | | | | | | | | | | | | |
| | | | | | | | | | | | | | |
See notes to consolidated financial statements.
F-4
Wayfair LLC
Consolidated Statements of Comprehensive Loss
| |
Years ended December 31, |
Six months ended June 30, |
|||||||||||
|---|---|---|---|---|---|---|---|---|---|---|---|---|---|
| |
2012
|
2013
|
2013
|
2014
|
|||||||||
| |
(in thousands) |
||||||||||||
| |
|
|
(unaudited) |
||||||||||
Net loss |
$ | (21,055 | ) | $ | (15,526 | ) | $ | (8,338 | ) | $ | (51,401 | ) | |
Other comprehensive loss: |
|||||||||||||
Foreign currency translation adjustments |
(392 | ) | (390 | ) | 583 | 7 | |||||||
| | | | | | | | | | | | | | |
Comprehensive loss |
$ | (21,447 | ) | $ | (15,916 | ) | $ | (7,755 | ) | $ | (51,394 | ) | |
| | | | | | | | | | | | | | |
| | | | | | | | | | | | | | |
See notes to consolidated financial statements.
F-5
Consolidated Statements of Changes in Convertible Redeemable Preferred Units and Members' Deficit
(in thousands, except unit data)
|
Series A Convertible Redeemable Preferred Units |
Series A Convertible Redeemable Members' Equity |
Series B Convertible Redeemable Preferred Units |
Series B Convertible Redeemable Members' Equity |
Common Units |
Common Members' Deficit |
Accumulated Other Comprehensive Income (Loss) |
Total Members' Deficit |
|||||||||||||||||
|---|---|---|---|---|---|---|---|---|---|---|---|---|---|---|---|---|---|---|---|---|---|---|---|---|---|
Balance at December 31, 2011 |
17,666,664 | $ | 167,480 | — | $ | — | 45,002,043 | $ | (118,190 | ) | $ | 454 | $ | (117,736 | ) | ||||||||||
Net loss |
— | — | — | — | — | (21,055 | ) | — | (21,055 | ) | |||||||||||||||
Cumulative translation adjustment |
— | — | — | — | — | — | (392 | ) | (392 | ) | |||||||||||||||
Due to common unit holders |
— | — | — | — | — | (154 | ) | — | (154 | ) | |||||||||||||||
Return of excess distribution |
— | — | — | — | — | 700 | — | 700 | |||||||||||||||||
Forfeiture of unvested units |
— | — | — | — | (183,109 | ) | — | — | — | ||||||||||||||||
Accretion of Series A convertible redeemable preferred units |
— | 12,154 | — | — | — | (12,154 | ) | — | (12,154 | ) | |||||||||||||||
Issuance of Series A convertible redeemable preferred units |
3,885,137 | 36,164 | — | — | — | — | — | — | |||||||||||||||||
| | | | | | | | | | | | | | | | | | | | | | | | | | |
Balance at December 31, 2012 |
21,551,801 | 215,798 | — | — | 44,818,934 | (150,853 | ) | 62 | (150,791 | ) | |||||||||||||||
Net loss |
— | — | — | — | — | (15,526 | ) | — | (15,526 | ) | |||||||||||||||
Cumulative translation adjustment |
— | — | — | — | — | — | (390 | ) | (390 | ) | |||||||||||||||
Accretion of Series A convertible redeemable preferred units |
— | 25,388 | — | — | — | (25,388 | ) | — | (25,388 | ) | |||||||||||||||
Forfeiture of unvested units |
— | — | — | — | (55,974 | ) | — | — | — | ||||||||||||||||
Equity issued as part of acquisition, net |
— | — | — | — | 141,150 | 1,194 | — | 1,194 | |||||||||||||||||
Equity compensation expense |
— | — | — | — | — | 62 | — | 62 | |||||||||||||||||
| | | | | | | | | | | | | | | | | | | | | | | | | | |
Balance at December 31, 2013 |
21,551,801 | 241,186 | — | — | 44,904,110 | (190,511 | ) | (328 | ) | (190,839 | ) | ||||||||||||||
Net loss (unaudited) |
— | — | — | — | — | (51,401 | ) | — | (51,401 | ) | |||||||||||||||
Cumulative translation adjustment (unaudited) |
— | — | — | — | — | — | 7 | 7 | |||||||||||||||||
Accretion of convertible redeemable preferred units (unaudited) |
— | 9,300 | — | 2,455 | — | (11,755 | ) | — | (11,755 | ) | |||||||||||||||
Forfeiture of unvested units (unaudited) |
— | — | — | — | (16,695 | ) | — | — | — | ||||||||||||||||
Repurchase of vested common units (unaudited) |
— | — | — | — | (202,757 | ) | — | — | — | ||||||||||||||||
Issuance of Series B convertible redeemable preferred units, net of issuance costs (unaudited) |
— | — | 5,995,133 | 154,774 | — | — | — | — | |||||||||||||||||
Dividends paid to Series A convertible redeemable preferred unitholders (unaudited) |
— | (15,000 | ) | — | — | — | — | — | — | ||||||||||||||||
Repurchase of common units (unaudited) |
— | — | — | — | (896,052 | ) | (23,500 | ) | — | (23,500 | ) | ||||||||||||||
Return of equity held in escrow as part of acquisition (unaudited) |
— | — | — | — | (4,546 | ) | (49 | ) | — | (49 | ) | ||||||||||||||
Equity compensation expense (unaudited) |
— | — | — | — | — | 82 | — | 82 | |||||||||||||||||
| | | | | | | | | | | | | | | | | | | | | | | | | | |
Balance at June 30, 2014 (unaudited) |
21,551,801 | $ | 235,486 | 5,995,133 | $ | 157,229 | 43,784,060 | $ | (277,134 | ) | $ | (321 | ) | $ | (277,455 | ) | |||||||||
| | | | | | | | | | | | | | | | | | | | | | | | | | |
| | | | | | | | | | | | | | | | | | | | | | | | | | |
See notes to consolidated financial statements.
F-6
Wayfair LLC
Consolidated Statements of Cash Flows
| |
Years ended December 31, |
Six months ended June 30, |
|||||||||||
|---|---|---|---|---|---|---|---|---|---|---|---|---|---|
| |
2012
|
2013
|
2013
|
2014
|
|||||||||
| |
(in thousands) |
||||||||||||
| |
|
|
(unaudited) |
||||||||||
Cash flows from operating activities |
|||||||||||||
Net loss |
$ | (21,055 | ) | $ | (15,526 | ) | $ | (8,338 | ) | $ | (51,401 | ) | |
Adjustments to reconcile net loss to net cash provided by operating activities, net of acquisition: |
|||||||||||||
Depreciation and amortization |
9,335 | 13,091 | 5,863 | 8,891 | |||||||||
Equity-based compensation |
— | — | — | 5,528 | |||||||||
Other non-cash adjustments |
110 | 121 | 11 | 119 | |||||||||
Changes in operating assets and liabilities: |
|||||||||||||
Accounts receivable and customer refunds payable |
(8,234 | ) | 8,112 | 4,476 | 1,040 | ||||||||
Inventories |
(2,497 | ) | (6,630 | ) | (4,238 | ) | (4,840 | ) | |||||
Prepaid expenses and other current assets |
(2,431 | ) | (9,159 | ) | (3,168 | ) | (13,203 | ) | |||||
Due to related party |
(6,978 | ) | 92 | 216 | (388 | ) | |||||||
Accounts payable and accrued expenses |
32,917 | 40,761 | (3,186 | ) | (3,306 | ) | |||||||
Deferred revenue and other liabilities |
3,041 | 4,195 | 2,408 | 19,487 | |||||||||
Other assets |
(263 | ) | (644 | ) | 49 | (1,698 | ) | ||||||
| | | | | | | | | | | | | | |
Net cash provided by (used in) operating activities |
3,945 | 34,413 | (5,907 | ) | (39,771 | ) | |||||||
| | | | | | | | | | | | | | |
Cash flows from investing activities |
|||||||||||||
Purchase of short-term investments |
(66,065 | ) | (93,000 | ) | (40,000 | ) | (65,000 | ) | |||||
Sale and maturities of short-term investments |
58,065 | 65,998 | 22,997 | 50,002 | |||||||||
Purchase of property and equipment |
(8,031 | ) | (6,739 | ) | (3,301 | ) | (24,331 | ) | |||||
Site and software development costs |
(6,949 | ) | (9,040 | ) | (4,067 | ) | (6,148 | ) | |||||
Cash paid for acquisition |
— | (3,741 | ) | — | — | ||||||||
Other investing activities, net |
(100 | ) | (469 | ) | — | (3,012 | ) | ||||||
| | | | | | | | | | | | | | |
Net cash used in investing activities |
(23,080 | ) | (46,991 | ) | (24,371 | ) | (48,489 | ) | |||||
| | | | | | | | | | | | | | |
Cash flows from financing activities |
|||||||||||||
Net proceeds from issuance of Series A convertible redeemable preferred units |
36,164 | — | — | — | |||||||||
Escrow proceeds from the issuance of Series A convertible redeemable preferred units in 2011 |
8,080 | — | — | — | |||||||||
Net proceeds from issuance of Series B convertible redeemable preferred units |
— | — | — | 154,774 | |||||||||
Repurchase of common units |
— | — | — | (23,500 | ) | ||||||||
Dividends paid to Series A convertible redeemable preferred |
— | — | — | (15,000 | ) | ||||||||
Purchase of employee equity |
— | — | — | (5,528 | ) | ||||||||
Additional paid-in capital |
700 | — | — | — | |||||||||
| | | | | | | | | | | | | | |
Net cash provided by financing activities |
44,944 | — | — | 110,746 | |||||||||
| | | | | | | | | | | | | | |
Effect of exchange rate changes on cash and cash equivalents |
25 | 6 | (65 | ) | 6 | ||||||||
| | | | | | | | | | | | | | |
Net increase (decrease) in cash and cash equivalents |
25,834 | (12,572 | ) | (30,343 | ) | 22,492 | |||||||
| | | | | | | | | | | | | | |
Cash and cash equivalents |
|||||||||||||
Beginning of period |
52,027 | 77,861 | 77,861 | 65,289 | |||||||||
| | | | | | | | | | | | | | |
End of period |
$ | 77,861 | $ | 65,289 | $ | 47,518 | $ | 87,781 | |||||
| | | | | | | | | | | | | | |
| | | | | | | | | | | | | | |
Supplemental disclosure of cash flow information |
|||||||||||||
Income tax payments |
$ |
17 |
$ |
3 |
$ |
2 |
$ |
6 |
|||||
Tax distribution receivable |
154 | — | — | — | |||||||||
| | | | | | | | | | | | | | |
| | | | | | | | | | | | | | |
Supplemental disclosure of non-cash investing activities |
|||||||||||||
Issuance of common units in connection with acquisition |
$ | — | $ | 1,194 | — | — | |||||||
Purchase of property and equipment included in accounts payable and accrued expenses and in other liabilities |
— | — | 677 | 5,787 | |||||||||
| | | | | | | | | | | | | | |
| | | | | | | | | | | | | | |
Supplemental disclosure of non-cash financing activities |
|||||||||||||
Accretion of preferred units |
$ | 12,154 | $ | 25,388 | $ | 15,948 | $ | 11,755 | |||||
| | | | | | | | | | | | | | |
| | | | | | | | | | | | | | |
See notes to consolidated financial statements.
F-7
Notes to Consolidated Financial Statements
1. Summary of Business Operations
Wayfair LLC (formerly CSN Stores LLC), a Delaware limited liability company, is an e-commerce business offering visually inspiring browsing, compelling merchandising, easy product discovery and attractive prices for over seven million products from over 7,000 suppliers across distinct brands — Wayfair.com, Joss & Main, AllModern, DwellStudio, and Birch Lane. In addition to generating net revenue through Direct Retail sales, which includes all sales generated primarily through Wayfair LLC's websites, mobile-optimized websites, and mobile applications (sites), net revenue is also generated through sites operated by third parties and through third-party advertising distribution providers that pay Wayfair LLC based on the number of advertisement related clicks, actions, or impressions for advertisements placed on Wayfair LLC sites.
Unaudited Interim Financial Information
The accompanying consolidated balance sheet as of June 30, 2014, the consolidated statements of operations, consolidated statements of comprehensive loss, and consolidated statements of cash flows for the six months ended June 30, 2013 and 2014, and the consolidated statement of changes in convertible redeemable preferred units and members' deficit for the six months ended June 30, 2014 are unaudited. The unaudited interim financial statements have been prepared on the same basis as the audited consolidated financial statements and in the opinion of management, reflect all adjustments, consisting of only normal recurring adjustments, necessary for the fair statement of the Company's financial position as of June 30, 2014 and results of operations and cash flows for the six months ended June 30, 2013 and 2014. The financial data and the other information disclosed in these notes to the consolidated financial statements related to these six month periods are unaudited.
Unaudited Pro Forma Financial Information
The unaudited pro forma balance sheet as of June 30, 2014 reflects the reorganization of Wayfair LLC into a Delaware corporation. Pursuant to this reorganization, Wayfair LLC will become a wholly-owned subsidiary of Wayfair Inc., and holders of the equity interests in Wayfair LLC will become stockholders of Wayfair Inc. In connection with the reorganization, all outstanding common units will convert into shares of Class B common stock of Wayfair Inc. All outstanding preferred units will first convert into shares of Series A and Series B convertible preferred stock of Wayfair Inc. and then, immediately prior to the completion of Wayfair Inc.'s proposed initial public offering, into shares of Class B common stock of Wayfair Inc. The unaudited pro forma balance sheet as of June 30, 2014 reflects the conversion of all then outstanding Series A and Series B convertible preferred units into 27,546,934 shares of Class B common stock and the net issuance of 925,949 shares of Class B common stock issuable upon the vesting of outstanding deferred units in connection with this offering because the service period and the liquidity conditions are satisfied. See Note 10 for further details.
The unaudited pro forma weighted average number of shares of common stock outstanding disclosed in the consolidated statements of operations gives effect to the automatic conversion of all of Wayfair LLC's outstanding convertible preferred stock into Class B common stock upon the closing of Wayfair LLC's proposed initial public offering. See Note 15 for further details.
F-8
Notes to Consolidated Financial Statements (Continued)
2. Summary of Significant Accounting Policies
Principles of Consolidation
The accompanying consolidated financial statements include the accounts of Wayfair LLC and its wholly owned subsidiaries (collectively the Company or Wayfair). All intercompany accounts and transactions have been eliminated. Below is a summary of the wholly-owned subsidiaries of the Company:
Subsidiary
|
Location
|
|
|---|---|---|
| Wayfair Stores Limited | Republic of Ireland | |
| Wayfair (UK) Limited | United Kingdom | |
| Wayfair GmbH | Germany | |
| Wayfair (BVI) Ltd. | British Virgin Islands | |
| Wayfair Australia Pty Limited | Australia |
Use of Estimates
The preparation of financial statements in conformity with accounting principles generally accepted in the United States of America (US GAAP) requires management to make estimates and assumptions that affect the reported amounts of assets and liabilities, and disclosure of contingent assets and liabilities, at the date of the financial statements, and the reported amounts of revenue and expenses during the reported period. On an ongoing basis, management evaluates these estimates and judgments, including those related to revenue recognition, capitalization of site and software development costs, stock-based compensation, and inventory. Actual results could differ from those estimates.
Cash and Cash Equivalents
The Company considers all highly liquid investments purchased with an original maturity (at the date of purchase) of three months or less to be the equivalent of cash for the purpose of consolidated balance sheets and statements of cash flows presentation. Cash equivalents, which consist primarily of money market accounts, are carried at cost, which approximates market value.
Restricted Cash
As of December 31, 2012 and 2013 and June 30, 2014, there was $0.3 million, $0.8 million, and $3.8 million, respectively, of cash that was restricted from withdrawal and held by banks to guarantee the Company's letters of credit issued principally to secure certain property leases.
Short-Term Investments
Short-term investments consist of certificates of deposits with original maturities in less than twelve months.
Accounts Receivable
Accounts receivable are stated at the amount management expects to collect from outstanding balances. The Company estimates the allowance for doubtful accounts based on historical losses, existing economic conditions, and other information available at the consolidated balance sheets dates. Uncollectible amounts are written off against the allowance after all collection efforts have been exhausted.
F-9
Notes to Consolidated Financial Statements (Continued)
2. Summary of Significant Accounting Policies (Continued)
Fair Value of Financial Instruments
The Company's financial assets and liabilities are measured at fair value, which is defined as the price that would be received to sell an asset or paid to transfer a liability in an orderly transaction between market participants at the measurement date (exit price). The three levels of inputs used to measure fair value are as follows:
- •
- Level 1 — Unadjusted quoted prices in active markets for identical assets or liabilities
- •
- Level 2 — Unadjusted quoted prices in active markets for similar assets or liabilities,
unadjusted quoted prices for identical or similar assets or liabilities in markets that are not active, or inputs other than quoted prices that are observable or can be corroborated by observable
market data for substantially the full-term of the asset or liability
- •
- Level 3 — Unobservable inputs that are supported by little or no market activity and that are significant to the fair value of the asset or liability
This hierarchy requires the Company to use observable market data, when available, and to minimize the use of unobservable inputs when determining fair value. The Company measures its cash equivalents and short-term investments at fair value. The Company classifies its cash equivalents and short-term investments within Level 1 because the Company values these investments using quoted market prices. The fair value of the Company's Level 1 financial assets is based on quoted market prices of the identical underlying security. The Company does not have any assets or liabilities classified as Level 2 or Level 3 financial assets. See Note 3 for further details.
Concentrations of Credit Risk
Financial instruments that subject the Company to credit risk consist of cash and cash equivalents, short-term investments, and accounts receivable. The risk with respect to cash and cash equivalents and short-term investments is minimized by the Company's policy of investing in financial instruments (i.e., cash equivalents) with short-term maturities issued by highly rated financial institutions. At times, these balances may exceed federally insured limits; however, to date, the Company has not incurred any losses on these investments. The risk with respect to accounts receivable is managed by the Company through its policy of monitoring the creditworthiness of its customers to which it grants credit terms in the normal course of business. As of December 31, 2012 and 2013 and June 30, 2014, the Company had $1.0 million, $2.6 million and $1.4 million, respectively, in banks located outside the United States.
Foreign Currency Translation
The functional currency of the Company is the United States dollar, while its subsidiaries' functional currencies are as follows:
Subsidiary
|
Currency
|
|
|---|---|---|
| Wayfair Stores Limited | Euro | |
| Wayfair (UK) Limited | Pound sterling | |
| Wayfair GmbH | Euro | |
| Wayfair (BVI) Ltd. | Euro | |
| Wayfair Australia Pty Limited | Australian dollar |
F-10
Notes to Consolidated Financial Statements (Continued)
2. Summary of Significant Accounting Policies (Continued)
The financial statements of the Company are translated to United States dollars using year-end exchange rates as to assets and liabilities and average exchange rates as to revenue and expenses. Capital accounts are translated at their historical exchange rates when the capital transaction occurred. The effects of foreign currency translation are included in other comprehensive loss in the consolidated statements of comprehensive loss. Transaction gains and losses are included in the Company's consolidated statements of operations. Translation adjustments arising from the use of differing exchange rates from period to period are included in accumulated other comprehensive loss within members' deficit.
Inventories
Inventories consisting of finished goods are stated at the lower of cost or market, determined by the first-in, first-out (FIFO) method, and consist of product for resale. Inventory costs consist of cost of product and inbound shipping and handling costs. Inventory costs also include direct and indirect labor costs, rents and depreciation expenses associated with the Company's fulfillment centers. Inventory valuation requires the Company to make judgments, based on currently-available information, about the likely method of disposition, such as through sales to individual customers, returns to product suppliers, or liquidations, and expected recoverable values of each disposition category.
Goods In-Transit
Goods in-transit directly from suppliers to customers are recorded in prepaid expenses and other current assets. Risk of loss and the transfer of title from the supplier to the Company occurs at freight on board shipping point. As of December 31, 2012 and 2013 and June 30, 2014, goods in-transit amounted to $6.7 million, $9.7 million and $13.9 million, respectively.
Property and Equipment
Property and equipment are stated at cost, net of depreciation and amortization. Depreciation and amortization on property and equipment is calculated on the straight-line method over the estimated useful lives of the assets as follows:
Class
|
Range of Life (In Years) |
|
|---|---|---|
| Furniture and computer equipment | 3 to 7 | |
| Site and software development costs | 2 | |
| Leasehold improvements | The lesser of useful life or lease term |
Site and Software Development Costs
The Company capitalizes costs associated with the development of its sites and internal-use software products after the preliminary project stage is complete and until the software is ready for its intended use. The capitalized costs are amortized over a two-year period. Costs incurred in the preliminary stages of development, after the software is ready for its intended use and for maintenance of internal-use software are expensed as incurred. Upgrade and enhancements are capitalized to the extent they will result in added functionality.
F-11
Notes to Consolidated Financial Statements (Continued)
2. Summary of Significant Accounting Policies (Continued)
Total costs capitalized, net of accumulated amortization, totaled $6.5 million, $8.6 million, and $10.3 million as of December 31, 2012 and 2013 and June 30, 2014, respectively, and are included in property and equipment, net in the accompanying consolidated balance sheets. Amortization expense for the years ended December 31, 2012 and 2013 and the six months ended June 30, 2013 and 2014 were $4.8 million, $7.0 million, $3.2 million, and $4.4 million, respectively. Capitalized software costs are included in property and equipment within our consolidated balance sheets.
Goodwill
Goodwill represents the excess of cost over the fair value of tangible and identifiable intangible assets acquired and liabilities assumed. Goodwill is not amortized, but is subject to an annual impairment test, or more frequently as impairment indicators arise.
The Company tests goodwill for impairment at least annually. The Company reviews goodwill for impairment on the last day of its fiscal year and whenever events or changes in circumstances indicate that the carrying amount of this asset may exceed its fair value. The assessment is performed at the reporting unit level. The Company performs the two-step goodwill impairment test to identify potential goodwill impairment. The first step is to compare the fair value of the reporting unit to the book value including goodwill. If the fair value of the reporting unit exceeds the book value, goodwill is not impaired. If the book value exceeds the fair value, the second step of the process is performed to measure the amount of impairment. For the years ended December 31, 2012 and 2013 and the six months ended June 30, 2014, no impairment of goodwill had been indicated.
Long-Lived Assets
The Company reviews long-lived assets for impairment whenever events or changes in circumstances, such as service discontinuance or technological obsolescence, indicate that the carrying amount of the long-lived asset may not be recoverable. When such events occur, the Company compares the carrying amount of the asset to the undiscounted expected future cash flows related to the asset. If the comparison indicates that an impairment exists, the amount of the impairment is calculated as the difference between the excess of the carrying amount over the fair value of the asset. If a readily determinable market price does not exist, fair value is estimated using discounted expected cash flows attributable to the asset. For the years ended December 31, 2012 and 2013 and the six months ended June 30, 2014, no impairment of long-lived assets or identifiable intangibles had been indicated.
Revenue Recognition
The Company generates net revenue through product sales generated primarily through the sites of the Company's four distinct brands and through sites operated by third parties.
The Company recognizes revenue only when the following four criteria are met: (1) persuasive evidence of an arrangement exists; (2) delivery has occurred; (3) the selling price is fixed or determinable; and (4) collectability is reasonably assured. The Company recognizes net revenue from sales of its products, upon delivery to the customer. The Company records product revenue at the gross amount as the Company is the primary obligor with the customer and provides the primary customer service for all products sold on its sites, has latitude in establishing price and selecting products sold on its sites, has discretion in selecting suppliers of products sold on its
F-12
Notes to Consolidated Financial Statements (Continued)
2. Summary of Significant Accounting Policies (Continued)
sites, maintains inventory risk from shipment through delivery date and upon accepting returns, and has credit risk. Net revenue includes shipping costs charged to the customer and is recorded net of taxes collected from customers, which are remitted to governmental authorities. Cash discounts, returns and rebates are deducted from gross revenue in determining net revenue. In addition, the Company defers revenue when cash is collected from its customer prior to the satisfaction of the revenue recognition criteria.
The Company maintains a membership rewards program that allows enrolled customers to earn points which can be redeemed for future purchases. The Company defers a portion of its revenue associated with rewards that are ultimately expected to be redeemed prior to expiration.
The Company also earns revenue through third-party advertisers that pay based on the number of advertisement related clicks, actions, or impressions for advertisements placed on the Company's sites. Revenue earned under these arrangements is included in net revenue and is recognized in the period in which the click, action, or impression occurs.
Vendor Rebates
The Company earns rebates under a volume incentive programs with its suppliers. These rebates are earned upon shipment of goods. Amounts earned and due from suppliers under these rebate programs are included in other current assets on the consolidated balance sheets and are reflected as a reduction of cost of goods sold on the consolidated statements of operations. Vendor allowances received by the Company reduce the carrying cost of inventory and are recognized in cost of goods sold when the related inventory is sold.
Costs of Goods Sold
Cost of goods sold consists of the cost of product sold to customers, shipping and handling costs and shipping supplies and fulfillment costs. Fulfillment costs include costs incurred in operating and staffing the fulfillment centers, such as costs attributed to receiving, inspecting, picking, packaging and preparing customer orders for shipment. Cost of goods sold also includes direct and indirect labor costs for fulfillment center oversight, including payroll and related benefit costs.
Advertising Costs
Expenditures for advertising are expensed in the period that the advertising first takes place. Advertising expense amounted to approximately $65.5 million, $108.5 million, $43.2 million, and $86.7 million in the years ended December 31, 2012 and 2013 and the six months ended June 30, 2013 and 2014, respectively. Included in prepaid expenses at December 31, 2012 and 2013 and June 30, 2014, are approximately $0.9 million, $0.5 million, and $0.8 million, respectively, of prepaid advertising costs.
Merchant Processing Fees
Merchant processing fees totaling $13.3 million, $19.4 million, $8.1 million, and $12.3 million in the years ended December 31, 2012 and 2013 and the six months ended June 30, 2013 and 2014, respectively, are included in selling and marketing expense in the accompanying consolidated statements of operations. These fees are charged by third parties that provide merchant processing services for credit cards and debit cards.
F-13
Notes to Consolidated Financial Statements (Continued)
2. Summary of Significant Accounting Policies (Continued)
Retail Partner Fees
The Company sells its products through sites owned and operated by third-party online retailers, or retail partners. The Company pays a fee for sales generated through these sites and records them as merchant processing fees and advertising costs. Retail partner fees included in merchant processing fees are $4.3 million, $4.3 million, $2.1 million, and $2.2 million for the years ended December 31, 2012 and 2013 and the six months ended June 30, 2013 and 2014, respectively. Retail partner fees included in advertising costs are $22.0 million, $25.2 million, $13.3 million, and $11.7 million for the years ended December 31, 2012 and 2013 and the six months ended June 30, 2013 and 2014, respectively.
Equity-Based Compensation
The Company accounts for its equity-based compensation awards in accordance with ASC Topic 718, Compensation — Stock Compensation (ASC 718). ASC 718 requires all equity-based payments to employees, including grants of employee unit options, to be recognized as expense in the statements of operations based on their grant date fair values. The Company has granted option units, deferred units, and restricted units (all common units).
The Company estimated the grant date fair value of each common unit option award using the Black-Scholes option-pricing model. The use of the Black-Scholes option-pricing model required management to make assumptions with respect to the expected term of the option, the expected volatility of the common unit consistent with the expected life of the option, risk-free interest rates and expected dividend yields of the common unit. The fair value of restricted common units on the date of grant was determined by taking into account the most recently available valuation of common units.
The fair value of deferred units on the date of grant is determined by taking into account the most recently available valuation of deferred units. The fair value of a unit award is determined in accordance with the guidance outlined in the American Institute of Certified Public Accountants Practice Aid, Valuation of Privately-Held Company Equity Securities Issued as Compensation, also known as the Practice Aid, which prescribes several valuation approaches for setting the value of an enterprise, such as the cost, market and income approaches, and various methodologies for allocating the value of an enterprise to its common equity. The Company generally used the income and market approaches, in particular the discounted cash flow method under the income approach which was based on its projections and the guideline public company, guideline transactions and precedent transaction methodologies, based on inputs from comparable public companies' equity valuations, comparable acquisition transactions and transactions in its own equity securities, to estimate the enterprise value of the Company.
All awards granted by the Company are subject to service-based vesting conditions and a performance-based vesting condition based on a liquidity event, defined as either a change of control or an initial public offering. The Company will record the expense for these equity-awards using the accelerated attribution method over the remaining service period when management determines that achievement of the liquidity event is probable. The Company has determined that a liquidity event was not probable at December 31, 2012 or 2013 or June 30, 2014, and as such, no expense has been recognized in the years ended December 31, 2012 and 2013 and the six months ended June 30, 2014.
F-14
Notes to Consolidated Financial Statements (Continued)
2. Summary of Significant Accounting Policies (Continued)
Income Taxes
The Company accounts for income taxes using the asset and liability method, pursuant to which deferred tax assets and liabilities are measured using enacted tax rates expected to apply to taxable income in the years in which temporary differences are expected to be recovered or settled. Valuation allowances are provided if based upon the weight of available evidence, it is more likely than not that some or all of the deferred tax assets will not be realized. The Company considers future taxable income and ongoing prudent and feasible tax planning strategies in assessing the need for the valuation allowance. The Company recognizes the tax benefit from an uncertain tax position only if it is more likely than not that the tax position will be sustained on examination by the taxing authorities, based on the technical merits of the position. The tax benefits recognized in the financial statements from these positions are measured based on the largest benefit that has a greater-than-50% likelihood of being realized upon ultimate resolution. Interest costs and penalties related to uncertain tax positions are classified as part of income tax expense.
Net Loss Attributable to Common Unit Holders Per Unit
The Company follows the two-class method when computing net loss attributable to common unit holders per unit as the Company has issued units that meet the definition of participating securities. The Company's convertible redeemable preferred units contractually entitle the holders of such units to participate in dividends, but do not contractually require the holders of such units to participate in losses of the Company. Accordingly, in periods in which the Company reports a net loss or a net loss attributable to common unit holders resulting from preferred unit dividends or accretion, net losses are not allocated to participating securities.
Basic net income (loss) attributable to common unit holders per unit is computed by dividing the net income (loss) attributable to common unit holders by the weighted average number of common units outstanding for the period. For periods in which the Company has reported net losses, diluted net loss per unit attributable to common unit holders is the same as basic net loss per unit attributable to common unit holders, since dilutive common units are not assumed to have been issued if their effect is anti-dilutive.
Recent Accounting Pronouncements
In February 2013, the FASB issued Accounting Standards Update (ASU) No. 2013-02 "Reporting of Amounts Reclassified Out of Accumulated Other Comprehensive Income." ASU No. 2013-02 requires an entity to disaggregate the total change of each component of other comprehensive income either on the face of the income statement or as a separate disclosure in the notes. The new guidance became effective for reporting periods beginning after December 15, 2012 and is applied prospectively. The Company adopted this guidance for the fiscal year ended December 31, 2013, and the adoption did not have any impact on its financial position, results of operations or cash flows as the amounts reclassified out of accumulated other comprehensive loss are not significant.
In July 2013, the FASB issued a new accounting standard update that requires the presentation of certain unrecognized tax benefits as reductions to deferred tax assets rather than as liabilities in the consolidated balance sheets when a net operating loss carryforward, a similar tax loss, or a tax credit carryforward exists. The Company adopted this new standard on a prospective basis in the first quarter of fiscal 2014, and the adoption of this accounting standard update did not have a material impact on the Company's consolidated financial statements.
F-15
Notes to Consolidated Financial Statements (Continued)
2. Summary of Significant Accounting Policies (Continued)
In May 2014, the FASB issued new accounting guidance regarding revenue recognition under GAAP. This new guidance will supersede nearly all existing revenue recognition guidance, and is effective for public entities for annual and interim periods beginning after December 31, 2016. Early adoption is not permitted. The Company is currently evaluating the impact of this new guidance on the Company's consolidated financial statements.
3. Fair Value Measurements
The following tables set forth the fair value of the Company's financial assets measured at fair value on a recurring basis as of December 31, 2012 and 2013 and June 30, 2014 based on the three-tier value hierarchy:
| |
December 31, 2012 | ||||||||||||
|---|---|---|---|---|---|---|---|---|---|---|---|---|---|
| |
Total
|
Level 1
|
Level 2
|
Level 3
|
|||||||||
| |
(in thousands) |
||||||||||||
Cash equivalents |
|||||||||||||
Money market funds |
$ | 37,050 | $ | 37,050 | — | — | |||||||
Short-term investments: |
|||||||||||||
Certificates of deposit |
23,017 | 23,017 | — | — | |||||||||
Restricted cash |
|||||||||||||
Money market funds |
268 | 268 | — | — | |||||||||
| | | | | | | | | | | | | | |
Total |
$ | 60,335 | $ | 60,335 | $ | — | $ | — | |||||
| | | | | | | | | | | | | | |
| | | | | | | | | | | | | | |
| |
December 31, 2013 | ||||||||||||
|---|---|---|---|---|---|---|---|---|---|---|---|---|---|
| |
Total
|
Level 1
|
Level 2
|
Level 3
|
|||||||||
| |
(in thousands) |
||||||||||||
Cash equivalents |
|||||||||||||
Money market funds |
$ | 32,560 | $ | 32,560 | — | — | |||||||
Short-term investments: |
|||||||||||||
Certificates of deposit |
50,019 | 50,019 | — | — | |||||||||
Restricted cash |
|||||||||||||
Money market funds |
346 | 346 | — | — | |||||||||
| | | | | | | | | | | | | | |
Total |
$ | 82,925 | $ | 82,925 | $ | — | $ | — | |||||
| | | | | | | | | | | | | | |
| | | | | | | | | | | | | | |
F-16
Notes to Consolidated Financial Statements (Continued)
3. Fair Value Measurements (Continued)
| |
June 30, 2014 | ||||||||||||
|---|---|---|---|---|---|---|---|---|---|---|---|---|---|
| |
Total
|
Level 1
|
Level 2
|
Level 3
|
|||||||||
| |
(in thousands) |
||||||||||||
| |
(unaudited) |
||||||||||||
Cash equivalents |
|||||||||||||
Money market funds |
$ | 22,518 | $ | 22,518 | — | — | |||||||
Certificates of deposit |
35,056 | 35,056 | — | — | |||||||||
Short-term investments: |
|||||||||||||
Certificates of deposit |
65,017 | 65,017 | — | — | |||||||||
Restricted cash |
|||||||||||||
Money market funds |
3,844 | 3,844 | — | — | |||||||||
| | | | | | | | | | | | | | |
Total |
$ | 126,435 | $ | 126,435 | $ | — | $ | — | |||||
| | | | | | | | | | | | | | |
| | | | | | | | | | | | | | |
4. Acquisition, Intangible assets and Goodwill
On July 31, 2013, Wayfair LLC acquired substantially all of the assets of DwellStudio Holdings LLC, a private company that operated DwellStudio, a home lifestyle brand, for $6.4 million in cash, common units, and additional consideration for assumed liabilities. The acquisition was made to further strengthen the Company's leadership position in home retail by adding a popular lifestyle brand with core competencies in original design and product development. The assets acquired and liabilities assumed were recorded at their fair values and operating results were included in the financial statements from the date of acquisition. All accounting has been completed for the acquisition, which resulted in goodwill of $1.7 million and intangible assets, including trademarks, customer relationships and other, of $3.7 million recorded on the date of acquisition, which will be amortized over 3 to 5 years. The acquisition was not material to the Company's consolidated financial statements.
Approximately $0.8 million of the goodwill resulting from this acquisition is deductible for tax purposes.
Intangible assets consisted of the following as of December 31, 2012 and 2013 and June 30, 2014 (in thousands):
| |
|
December 31, 2012 | December 31, 2013 | June 30, 2014 | ||||||||||||||||||||||||||
|---|---|---|---|---|---|---|---|---|---|---|---|---|---|---|---|---|---|---|---|---|---|---|---|---|---|---|---|---|---|---|
| |
Weighted- Average Amortization Period (Years) |
|||||||||||||||||||||||||||||
| |
Gross Carrying Value |
Accumulated Amortization |
Net Book Value |
Gross Carrying Value |
Accumulated Amortization |
Net Book Value |
Gross Carrying Value |
Accumulated Amortization |
Net Book Value |
|||||||||||||||||||||
| |
|
|
|
|
|
|
|
(unaudited) |
||||||||||||||||||||||
Trademarks |
5 | $ | 130 | $ | (35 | ) | $ | 95 | $ | 2,030 | $ | (219 | ) | $ | 1,811 | $ | 2,030 | $ | (422 | ) | $ | 1,608 | ||||||||
Customer relationships |
5 | — | — | — | 1,300 | (108 | ) | 1,192 | 1,300 | (238 | ) | 1,062 | ||||||||||||||||||
Non-compete agreements |
3 - 5 | 10 | (3 | ) | 7 | 110 | (19 | ) | 91 | 110 | (36 | ) | 74 | |||||||||||||||||
Technology |
5 | 920 | (245 | ) | 675 | 920 | (430 | ) | 490 | 920 | (523 | ) | 397 | |||||||||||||||||
Other intangibles |
3 | — | — | — | 373 | (47 | ) | 326 | 373 | (103 | ) | 270 | ||||||||||||||||||
Domain names |
5 | 3,016 | (3,013 | ) | 3 | 2,695 | (2,686 | ) | 9 | 2,688 | (2,683 | ) | 5 | |||||||||||||||||
| | | | | | | | | | | | | | | | | | | | | | | | | | | | | | | |
Total |
$ | 4,076 | $ | (3,296 | ) | $ | 780 | $ | 7,428 | $ | (3,509 | ) | $ | 3,919 | $ | 7,421 | $ | (4,005 | ) | $ | 3,416 | |||||||||
| | | | | | | | | | | | | | | | | | | | | | | | | | | | | | | |
| | | | | | | | | | | | | | | | | | | | | | | | | | | | | | | |
F-17
Notes to Consolidated Financial Statements (Continued)
4. Acquisition, Intangible assets and Goodwill (Continued)
The following is a summary of the estimated aggregate amortization expense in future years at December 31, 2013 (in thousands):
2014 |
$ | 1,006 | ||
2015 |
998 | |||
2016 |
903 | |||
2017 |
640 | |||
2018 and thereafter |
372 | |||
| | | | | |
|
$ | 3,919 | ||
| | | | | |
| | | | | |
5. Property and Equipment, net
Property and equipment, net consists of the following:
| |
December 31, | June 30, | ||||||||
|---|---|---|---|---|---|---|---|---|---|---|
| |
2012
|
2013
|
2014
|
|||||||
| |
(in thousands) |
|||||||||
| |
|
|
(unaudited) |
|||||||
Furniture and computer equipment |
$ | 19,812 | $ | 26,218 | $ | 38,389 | ||||
Site and software development costs |
17,529 | 23,715 | 28,533 | |||||||
Leasehold improvements |
1,330 | 1,912 | 13,279 | |||||||
Construction in progress |
— | 184 | — | |||||||
| | | | | | | | | | | |
|
38,671 | 52,029 | 80,201 | |||||||
Less accumulated depreciation and amortization |
(20,301 | ) | (29,941 | ) | (36,060 | ) | ||||
| | | | | | | | | | | |
Property and equipment, net |
$ | 18,370 | $ | 22,088 | $ | 44,141 | ||||
| | | | | | | | | | | |
| | | | | | | | | | | |
Property and equipment depreciation and amortization expense was $8.6 million, $12.5 million, $5.8 million, and $8.3 million for the years ended December 31, 2012 and 2013 and the six month ended June 30, 2013 and 2014, respectively.
6. Accrued Expenses
Accrued expenses consist of the following:
| |
December 31, | June 30, | ||||||||
|---|---|---|---|---|---|---|---|---|---|---|
| |
2012
|
2013
|
2014
|
|||||||
| |
(in thousands) |
|||||||||
| |
|
|
(unaudited) |
|||||||
Employee compensation and related benefits |
$ | 5,118 | $ | 7,470 | $ | 9,106 | ||||
Marketing |
2,020 | 5,329 | 4,530 | |||||||
Credit card |
2,906 | 2,173 | 12,067 | |||||||
Audit, legal and professional fees |
126 | 377 | 1,092 | |||||||
Accrued property, plant and equipment |
— | — | 5,143 | |||||||
Other accrued expenses |
2,426 | 3,890 | 5,034 | |||||||
| | | | | | | | | | | |
|
$ | 12,596 | $ | 19,239 | $ | 36,972 | ||||
| | | | | | | | | | | |
| | | | | | | | | | | |
F-18
Notes to Consolidated Financial Statements (Continued)
7. Commitments and Contingencies
Operating Leases
The Company leases office space under non-cancelable operating leases. These leases expire at various dates through 2024 and include discounted rental periods and fixed escalation clauses, which are amortized straight-line over the terms of the lease. Rental expense under operating leases was $3.0 million, $4.6 million, $1.9 million, and $6.1 million in the years ended December 31, 2012 and 2013 and the six months ended June 30, 2013 and 2014, respectively. The Company has issued letters of credit for approximately $1.7 million as security for these lease agreements.
Future lease payments under non-cancelable operating leases are as follows as of December 31, 2013:
Fiscal Years Ending
|
Amount
|
|||
|---|---|---|---|---|
| |
(in thousands) |
|||
2014 |
$ | 6,988 | ||
2015 |
7,844 | |||
2016 |
7,387 | |||
2017 |
6,981 | |||
2018 |
7,170 | |||
Thereafter |
26,536 | |||
| | | | | |
|
$ | 62,906 | ||
| | | | | |
| | | | | |
Future operating lease payments have not been reduced by minimum sublease rentals of $1.6 million due to the Company in the future under noncancelable subleases.
In March 2014, the Company expanded the lease of office space in Boston, MA to a total of approximately 275,000 square feet in order to accommodate the expansion of the Company's headquarters which commenced in June 2014. This additional lease space will result in additional operating lease obligations of $52.1 million payable through 2024. The Company has an option to extend the lease for two successive 5 year periods.
Collection of Sales or Other Similar Taxes
Based on the location of the Company's current operations, it collects and remits sales tax in Kentucky, Massachusetts, New York and Utah. The Company does not currently collect sales or other similar taxes for the sale of goods in states where no obligation to collect these taxes is required under applicable law. Several states have presented the Company with assessments, alleging that it is required to collect and remit sales or other similar taxes. The aggregate amount of claims from these states is approximately $11.7 million. The Company does not believe that it was obligated to collect and remit such taxes, and intends to vigorously defend its position. At this time, the Company believes a loss is not probable hence a liability has not been recorded, however, no assurance can be given as to the outcome of this situation.
Legal Matters
The Company is subject to legal proceedings and claims in the ordinary course of business. However, the Company is not currently aware of any legal proceedings or claims that it believes will have, individually or in the aggregate, a material adverse effect on the Company's financial position, results of operations or cash flows.
F-19
Notes to Consolidated Financial Statements (Continued)
8. Employee Benefit Plans
The Company has a defined-contribution, incentive savings plan pursuant to Section 401(k) of the Internal Revenue Code. The plan covers all full-time employees who have reached the age of 21 years. Employees may elect to defer compensation up to a dollar limit (as allowable by the Internal Revenue Code), of which up to 4% of an employee's salary will be matched by the Company. The amounts deferred by the employee and the matching amounts contributed by the Company both vest immediately. The amount expensed under the plan totaled approximately $1.1 million, $1.5 million, $0.6 million, and $1.0 million in the years ended December 31, 2012 and 2013 and the six months ended June 30, 2013 and 2014, respectively.
9. Equity-Based Compensation
In July 2010, the Company established the CSN Stores LLC 2010 Common Unit Plan (the Plan). Effective July 1, 2011, the Plan was amended and restated as the Wayfair LLC Amended and Restated 2010 Common Unit Plan (the Amended Plan). The Amended Plan is administered by the Board of Managers of Wayfair and provides for the issuance of option units, deferred units, and restricted units (all common units), which represent an equity interest in Wayfair LLC. The Amended Plan authorizes up to 12,405,879 units to be issued, of which 1,206,547 units and 1,444,758 units were available for issuance at December 31, 2013 and June 30, 2014, respectively.
The deferred units, common unit options, and restricted common units are subject to two vesting triggers: a service period (typically five years) and the occurrence of a liquidity event, which is defined in the Amended Plan as either a change of control or an initial public offering. Employees are able to retain provisionally vested units (defined as service period completed) upon departure. The Company has made a policy election to consider the liquidity event a performance condition. The Company has determined that a liquidity event was not probable at December 31, 2012 or 2013 or June 30, 2013 or 2014, and as such, no expense has been recognized in the years ended December 31, 2012 and 2013 and the six months ended June 30, 2013 and 2014. The common unit options have a contractual life of ten years from the date of issuance, and deferred units have a seven-year life. The restricted common units have no contractual life.
The Company did not grant common unit options and restricted common units in 2012, 2013, and the six months ended June 30, 2014 and has granted only deferred units in 2012, 2013, and the six months ended June 30, 2014. The fair value of deferred units on the date of grant is determined by taking into account the most recently available valuation of deferred units. The Company has the estimated fair value of its deferred units at various dates using contemporaneous valuations performed in accordance with the guidance outlined in the Practice Aid, which prescribes several valuation approaches for setting the value of an enterprise, such as the cost, market and income approaches, and various methodologies for allocating the value of an enterprise to its common units. The Company generally used the income and market approaches, in particular the discounted cash flow method under the income approach which was based on its projections and the guideline public company, guideline transactions and precedent transaction methodologies, based on inputs from comparable public companies' equity valuations, comparable acquisition transactions and transactions in its own equity securities, to estimate the enterprise value of the Company.
In connection with the preparation of the financial statements for the year ended December 31, 2013, the Company undertook a retrospective reassessment of the fair market value of its common units for certain of its 2013 grants for financial reporting purposes. In connection with that reassessment, the Company determined that the grant date fair value of its May, August and November 2013 grants to be $6.46, $10.88 and $20.87 respectively. The Company's fair value
F-20
Notes to Consolidated Financial Statements (Continued)
9. Equity-Based Compensation (Continued)
previously determined increased substantially in 2013 at each of the valuation dates and there was no particular transaction or event that caused this increase. Accordingly, the Company calculated grant date fair value on a linear basis for grants between each valuation date and believes it to be a reasonable method.
In April 2014, the Company completed a tender offer to repurchase provisionally vested (defined as service period completed) common unit options and restricted common units from certain employees at a price of $26.23 per unit. A total of 202,757 restricted common units and 9,028 common unit options were tendered for an aggregate of approximately $5.5 million in net cash after adjusting for the exercise prices associated with the common unit options. This tender offer is accounted for as a modification resulting in a $5.5 million compensation charge when accepted by the employee. The Company recorded an expense of $5.5 million in the six months ended June 30, 2014. The Company recorded the compensation charge as $4.3 million in sales and marketing and $1.2 million in general and administrative in the accompanying consolidated statement of operations for the six months ended June 30, 2014.
A summary of the status and activity for awards of common option units for the year ended December 31, 2013 and the six months ended June 30, 2014, is as follows:
| |
Common Option Units |
Weighted- Average Exericse Price |
Weighted-Average Remaining Contractual Term (Years) |
|||||||
|---|---|---|---|---|---|---|---|---|---|---|
Outstanding at January 1, 2013 |
711,307 | $ | 2.99 | |||||||
Forfeited/cancelled |
(47,075 | ) | $ | 3.03 | ||||||
| | | | | | | | | | | |
Outstanding at December 31, 2013 |
664,232 | $ | 2.99 | 6.7 | ||||||
Repurchased (unaudited) |
(9,028 | ) | $ | 2.93 | ||||||
Forfeited/cancelled (unaudited) |
(8,791 | ) | $ | 3.21 | ||||||
| | | | | | | | | | | |
Outstanding at June 30, 2014 (unaudited) |
646,413 | $ | 2.98 | 6.4 | ||||||
| | | | | | | | | | | |
| | | | | | | | | | | |
Provisionally vested at December 31, 2013 |
514,152 | $ | 2.97 | 6.7 | ||||||
| | | | | | | | | | | |
| | | | | | | | | | | |
Provisionally vested at June 30, 2014 (unaudited) |
555,018 | $ | 2.97 | 6.4 | ||||||
| | | | | | | | | | | |
| | | | | | | | | | | |
As of December 31, 2013 and June 30, 2014, unrecognized share-based compensation related to common option units was approximately $1.2 million and $1.2 million, respectively. The total aggregate intrinsic value of common option units outstanding and provisionally vested as of December 31, 2013 was $14.2 million and $11.0 million, respectively, and as of June 30, 2014 was $19.8 million and $17.0 million, respectively.
F-21
Notes to Consolidated Financial Statements (Continued)
9. Equity-Based Compensation (Continued)
A summary of the status and activity for awards of restricted common units for the year ended December 31, 2013 and the six months ended June 30, 2014, is as follows:
| |
Restricted Common Units |
Weighted- Average Grant Date Fair Value |
|||||
|---|---|---|---|---|---|---|---|
Outstanding at January 1, 2013 |
3,546,942 | $ | 4.75 | ||||
Forfeited/cancelled |
(55,974 | ) | $ | 4.75 | |||
| | | | | | | | |
Outstanding at December 31, 2013 |
3,490,968 | $ | 4.75 | ||||
Repurchased (unaudited) |
(202,757 | ) | $ | 4.75 | |||
Forfeited/cancelled (unaudited) |
(16,695 | ) | $ | 4.75 | |||
| | | | | | | | |
Outstanding at June 30, 2014 (unaudited) |
3,271,516 | $ | 4.75 | ||||
| | | | | | | | |
| | | | | | | | |
Provisionally vested at December 31, 2013 |
2,485,197 | $ | 4.75 | ||||
| | | | | | | | |
| | | | | | | | |
Provisionally vested at June 30, 2014 (unaudited) |
2,673,594 | $ | 4.75 | ||||
| | | | | | | | |
| | | | | | | | |
As of December 31, 2013 and June 30, 2014, unrecognized share-based compensation related to restricted common units was approximately $19.7 million and $15.4 million, respectively. The total aggregate intrinsic value of restricted common units outstanding and provisionally vested as of December 31, 2013 was $84.9 million and $60.4 million, respectively and as of June 30, 2014 was $110.2 million and $90.0 million, respectively.
A summary of the status and activity for awards of deferred units for the year ended December 31, 2013 and the six months ended June 30, 2014, is as follows:
| |
Deferred Common Units |
Weighted- Average Grant Date Fair Value |
Weighted-Average Remaining Contractual Term (Years) |
|||||||
|---|---|---|---|---|---|---|---|---|---|---|
Outstanding at January 1, 2013 |
1,979,763 | $ | 4.30 | |||||||
Granted |
3,546,042 | $ | 9.75 | |||||||
Forfeited/cancelled |
(270,692 | ) | $ | 4.85 | ||||||
| | | | | | | | | | | |
Outstanding at December 31, 2013 |
5,255,113 | $ | 7.95 | 6.0 | ||||||
Granted (unaudited) |
1,037,332 | $ | 24.66 | |||||||
Forfeited/cancelled (unaudited) |
(207,360 | ) | $ | 10.20 | ||||||
| | | | | | | | | | | |
Outstanding at June 30, 2014 (unaudited) |
6,085,085 | $ | 12.15 | 5.7 | ||||||
| | | | | | | | | | | |
| | | | | | | | | | | |
Provisionally vested at December 31, 2013 |
828,008 | $ | 4.29 | 4.9 | ||||||
| | | | | | | | | | | |
| | | | | | | | | | | |
Provisionally vested at June 30, 2014 (unaudited) |
1,454,251 | $ | 5.09 | 4.9 | ||||||
| | | | | | | | | | | |
| | | | | | | | | | | |
As of December 31, 2013 and June 30, 2014, unrecognized share-based compensation related to deferred units was approximately $37.4 million and $55.2 million, respectively. The total aggregate intrinsic value of deferred units outstanding and provisionally vested as of December 31, 2013 was $127.8 million and $20.1 million, respectively and as of June 30, 2014 was $204.9 million and $49.0 million, respectively.
F-22
Notes to Consolidated Financial Statements (Continued)
10. Members' Deficit
At June 30, 2014, the Company's equity structure consists of Series A convertible redeemable preferred units (Series A units), Series B convertible redeemable preferred units (Series B units), common unit options, deferred units and restricted common units.
Series A and Series B Convertible Redeemable Preferred Units
In November 2012, the Company issued 3.9 million Series A units, resulting in net proceeds of $36.2 million to the Company.
In March 2014, the Company issued approximately 6.0 million Series B units at a price of $26.23 per unit, resulting in net proceeds of approximately $154.8 million. This transaction did not result in a change in control due to the Company's majority ownership remaining the same.
Upon the issuance of Series B units, the Company distributed $15.0 million in accrued dividends to Series A unit holders and repurchased 896,052 common units from SK Retail Inc. (SK Retail) at a price of $26.23 per unit for an aggregate purchase price of approximately $23.5 million. The excess of purchase price above the common unit fair value of $1.3 million has been accounted for in members' deficit as the transaction was not the result of a compensatory arrangement or the receipt of stated or unstated rights, privileges or agreements in addition to the capital stock.
The Series A and Series B unit holders are allocated profits and losses in proportion to their ownership percentage with the exception of losses that would cause their basis to go below their original purchase price. The Series A and Series B unit holders also have certain protective provisions that limit the Company's ability to issue securities, make distributions (other than tax distributions), issue debt, appoint Board members, and other rights defined in the Fourth Amended and Restated Limited Liability Company Operating Agreement.
As of June 30, 2014, the Company had issued 21.6 million Series A units that were outstanding with accrued dividend amounts of $20.9 million payable which was included in carrying value. The accrued dividend amounts are payable upon conversion of the units into common stock, which will occur following the reorganization of the Company and upon the closing of this offering.
Liquidation — In a liquidation or sale of the Company, the holders of Series A units would be paid an amount per unit equal to the greater of the original issue price of $9.34 per unit plus the applicable dividend rate, or an amount per unit as would have been payable had each unit been converted into common units prior to the liquidation or sale of the Company.
The holders of Series B units would be paid an amount per unit equal to the greater of the original issue price of $26.23 per unit, or an amount per unit as would have been payable had each unit been converted into common units prior to the liquidation or sale of the Company.
Conversion — Each Series A and Series B unit is convertible into fully paid common units at a one-for-one exchange, adjustable for subdivisions or combinations of common units, reclassification, exchange and substitution and dilutive issuances. Conversion is at the option of the holder of a Series A or Series B unit, although conversion is automatic upon the earlier of (A) a qualified public offering or (B) the consent of at least the majority of the holders of the then outstanding Series A units and at least two-thirds of the holders of the then outstanding Series B units.
With respect to the Series A units that were issued in 2011, if a conversion were to occur on or prior to the four-year anniversary of the issuance (June 21, 2015), a dividend would be paid upon a conversion equal to 43% per annum from November 30, 2012 through February 28, 2013,
F-23
Notes to Consolidated Financial Statements (Continued)
10. Members' Deficit (Continued)
plus a dividend of 6% per annum paid from March 1, 2013 through the date of conversion. If a conversion were to occur after June 21, 2015, a dividend would be paid equal to 43% per annum from November 30, 2012 through February 28, 2013, plus an amount of 8% per annum from March 1, 2013 through the date of the conversion.
With respect to the Series A units that were issued in 2012, if a conversion were to occur on or prior to the four-year anniversary of the issuance (November 30, 2016), a dividend would be paid upon a conversion equal to 6% per annum from the issuance date through the time of conversion. If a conversion were to occur after November 30, 2016, a dividend would be paid equal to 8% per annum from November 30, 2012 through the date of the conversion.
Redemption — After April 21, 2019, the Series A units that were issued in June 2011 can be redeemed at the option of the holder at no less than the face value of $165.0 million plus a dividend of 58.2% per annum accrued from November 30, 2012 through February 28, 2013, plus a dividend of 8% per annum accrued from March 1, 2013 through the redemption date. In addition, after April 21, 2019, the Series A units that were issued in November 2012 can be redeemed at no less than the face value of $36.3 million plus a dividend of 8% per annum accrued from November 30, 2012 through the redemption date. Prior to the issuance of Series B units, the redemption date was April 21, 2018.
After April 21, 2019, the Series B units can be redeemed at the option of the holder at no less than the face value of $157.2 million.
The Company recognizes changes in the redemption value of the convertible redeemable preferred units immediately as they occur by adjusting the carrying amount of the redeemable security to what would be the redemption amount assuming the security was redeemable at the balance sheet date. Accordingly, the Company recorded accretion of the Series A units of $12.2 million, $25.4 million, $15.9 million and $9.3 million for the years ended December 31, 2012 and 2013 and the six months ended June 30, 2013 and 2014, respectively. The Company recorded accretion of the Series B units of $2.5 million for the six months ended June 30, 2014.
Common Units
Holders of common units are entitled to dividends when, as and if, declared by the Company's board of managers, subject to the rights of the holders Series A units having rights to dividends pursuant to the Company's Fourth Amended and Restated Limited Liability Company Operating Agreement. As of June 30, 2014, the Company had not declared any dividends. After payment to the Series A unit holders, the remaining assets are required to be distributed pro-rata to all common unit holders. The holder of each common unit is entitled to one vote.
Pro Forma (Unaudited)
The Company is currently a Delaware limited liability company. Prior to the issuance of the Company's shares of Class A common stock in its initial public offering, the Company will reorganize into a Delaware corporation. Pursuant to this reorganization, Wayfair LLC will become a wholly-owned subsidiary of Wayfair, Inc., and holders of the equity interests in Wayfair LLC will become stockholders of Wayfair Inc. with the expectation that the stockholders will hold the same ownership interests in Wayfair Inc. as they do in Wayfair LLC immediately prior to the reorganization. In connection with the reorganization, all outstanding common units will convert into shares of Class B common stock and all outstanding preferred units will convert into shares of Series A and Series B convertible preferred stock of Wayfair Inc. In addition, the holders of
F-24
Notes to Consolidated Financial Statements (Continued)
10. Members' Deficit (Continued)
outstanding options to purchase common units of Wayfair LLC will receive options to purchase Class B common stock of Wayfair Inc. in exchange for such options and the holders of outstanding deferred units for common units of Wayfair LLC will receive restricted stock units for Class B common stock of Wayfair Inc. in exchange for such deferred units. Upon completion of the Company's proposed initial public offering, all outstanding Series A and Series B convertible preferred stock will automatically convert into shares of Class B common stock. In addition, the Company will record (i) a net adjustment to deferred income tax liabilities of $0.3 million in connection with the Company's reorganization from a Delaware limited liability company to a Delaware corporation, with a resulting net adjustment of $0.3 million to common members' (deficit)/retained earnings, (ii) an adjustment of $13.3 million to reduce the carrying value of the participating preferred units to reflect conversion value assuming the security was converted on the balance sheet date, (iii) a distribution of $20.9 million of cash to the Company's Series A convertible preferred stockholders in connection with the reorganization equal to the members' distribution payable balance, (iv) an adjustment of $40.3 million to give effect to equity-based compensation expense associated with common option units, deferred units and restricted common units that have satisfied the service condition and (v) the net issuance of 925,949 shares of Class B common stock issuable upon the vesting of outstanding deferred units in connection with this offering, net of minimum tax withholding obligations and the associated payment of cash, which amount was approximately $14.0 million as of June 30, 2014. All of the aforementioned adjustments have been reflected in the pro forma consolidated balance sheet as if these events all occurred on June 30, 2014 and (vi) the reclassification of $1.5 million from due to related party to accrued expenses to reflect the effect of consolidation of SK Retail.
11. Segment and Geographic Information
The Company considers operating segments to be components of the Company in which separate financial information is available that is evaluated regularly by our chief operating decision maker (CODM) in managing and accessing the business. The CODM for the Company is the Chief Executive Officer. The CODM reviews financial information presented on a consolidated basis for purposes of making operating decisions, allocating resources and evaluating financial performance. Accordingly, the Company has determined that it has one operating and reportable segment. No country outside of the United States provided greater than 10% of total revenue.
The Company generates net revenue from Direct Retail sales derived through the Company's sites and Other sales derived through sites operated by third parties and fees from third-party advertising distribution providers as set forth below:
| |
Years ended December 31, |
Six months ended June 30, |
|||||||||||
|---|---|---|---|---|---|---|---|---|---|---|---|---|---|
| |
2012
|
2013
|
2013
|
2014
|
|||||||||
| |
(in thousands) |
||||||||||||
| |
|
|
(unaudited) |
||||||||||
Net revenue |
|||||||||||||
Direct Retail |
$ | 389,290 | $ | 673,446 | $ | 268,366 | $ | 469,534 | |||||
Other |
211,738 | 242,397 | 114,842 | 104,610 | |||||||||
| | | | | | | | | | | | | | |
Net revenue |
$ | 601,028 | $ | 915,843 | $ | 383,208 | $ | 574,144 | |||||
| | | | | | | | | | | | | | |
| | | | | | | | | | | | | | |
Revenue from external customers for each group of similar products and services are not reported to the CODM. Separate identification of this information for purposes of segment disclosure is impractical, as it is not readily available and the cost to develop it would be excessive.
F-25
Notes to Consolidated Financial Statements (Continued)
11. Segment and Geographic Information (Continued)
The following table sets forth revenue and long-lived assets by geographic area:
| |
Years ended December 31, |
Six months ended June 30, |
|||||||||||
|---|---|---|---|---|---|---|---|---|---|---|---|---|---|
| |
2012
|
2013
|
2013
|
2014
|
|||||||||
| |
(in thousands) |
||||||||||||
| |
|
|
(unaudited) |
||||||||||
Geographic net revenue: |
|||||||||||||
United States |
$ | 542,736 | $ | 857,001 | $ | 359,652 | $ | 536,829 | |||||
International |
58,292 | 58,842 | 23,556 | 37,315 | |||||||||
| | | | | | | | | | | | | | |
Total |
$ | 601,028 | $ | 915,843 | $ | 383,208 | $ | 574,144 | |||||
| | | | | | | | | | | | | | |
| | | | | | | | | | | | | | |
| |
December 31, | June 30, | ||||||||
|---|---|---|---|---|---|---|---|---|---|---|
| |
2012
|
2013
|
2014
|
|||||||
| |
(in thousands) |
|||||||||
| |
|
|
(unaudited) |
|||||||
Geographic long-lived assets: |
||||||||||
United States |
$ | 18,038 | $ | 21,451 | $ | 43,497 | ||||
International |
332 | 637 | 644 | |||||||
| | | | | | | | | | | |
Total |
$ | 18,370 | $ | 22,088 | $ | 44,141 | ||||
| | | | | | | | | | | |
| | | | | | | | | | | |
12. Income Taxes
The Company is organized as a limited liability company and taxed as a partnership under the Internal Revenue Code, and accordingly, no provision for federal or state and local income taxes is made on income since the members are individually liable for federal and state and local income taxes on their share of the Company's earnings. However, the Company is responsible for distributing monies to pay tax liabilities to its members if due, including SK Retail, its majority member. In addition, the Company is responsible for making distributions to SK Retail for corporate taxes imposed by the Commonwealth of Massachusetts. Due to the Company incurring a taxable loss during the year ended December 31, 2013, the Company would not have been subject to additional income tax had it paid federal income taxes at the corporate level.
The Company's foreign subsidiaries are subject to income tax in those jurisdictions.
The components of loss before provision for (benefit from) income taxes for the years ended December 31, 2012 and 2013, respectively, consisted of the following:
| |
Years ended December 31, |
||||||
|---|---|---|---|---|---|---|---|
| |
2012 | 2013 | |||||
| |
(in thousands) |
||||||
United States |
$ | (13,299 | ) | $ | (9,889 | ) | |
Foreign |
(7,706 | ) | (5,591 | ) | |||
| | | | | | | | |
Loss before provision for (benefit from) income taxes |
$ | (21,005 | ) | $ | (15,480 | ) | |
| | | | | | | | |
| | | | | | | | |
F-26
Notes to Consolidated Financial Statements (Continued)
12. Income Taxes (Continued)
The difference in the Company's "expected" tax provision (benefit) for the years ended December 31, 2012 and 2013, respectively, as computed by applying the U.S. federal corporate rate of 35% to loss before provision for (benefit from) income taxes, and actual tax is reconciled as follows:
| |
Years ended December 31, |
||||||
|---|---|---|---|---|---|---|---|
| |
2012 | 2013 | |||||
| |
(in thousands) |
||||||
Loss before provision for (benefit from) income taxes |
$ | (21,005 | ) | $ | (15,480 | ) | |
Expected tax benefit |
(7,352 | ) | (5,418 | ) | |||
Partnership loss not subject to tax |
4,620 | 3,449 | |||||
Valuation allowance |
1,199 | 1,149 | |||||
Foreign tax rate differential |
1,500 | 1,090 | |||||
Non-deductible expenses and other |
83 | (224 | ) | ||||
| | | | | | | | |
Total |
$ | 50 | $ | 46 | |||
| | | | | | | | |
| | | | | | | | |
The tax effects of temporary differences that give rise to significant portions of deferred tax assets and liabilities for the periods presented are as follows:
| |
December 31, | ||||||
|---|---|---|---|---|---|---|---|
| |
2012 | 2013 | |||||
| |
(in thousands) |
||||||
Deferred tax asset: |
|||||||
Operating loss carryforwards |
$ | 5,423 | $ | 6,129 | |||
| | | | | | | | |
Gross deferred tax asset |
5,423 | 6,129 | |||||
Less: Valuation allowance |
(5,419 | ) | (6,129 | ) | |||
| | | | | | | | |
Net deferred tax asset |
$ | 4 | $ | — | |||
| | | | | | | | |
| | | | | | | | |
At December 31, 2013, the Company had gross foreign country net operating loss carryforwards of approximately $33.1 million that do not expire. Future realization depends on the existence of sufficient taxable income available under the tax law. The Company is currently unable to forecast when there will be sufficient taxable income to utilize these carryforwards and, as such, has recorded a tax-effected valuation allowance of $6.1 million against the deferred tax asset relating to net operating losses of $6.1 million at December 31, 2013. The valuation allowance increased by $0.7 million from December 31, 2012 to December 31, 2013 primarily due to an increase in net operating losses. Of that change, $1.1 million is reflected in income tax expense for the year, and $(0.4) million is related to currency fluctuation.
The provision amounted to $50,000 and $46,000 in 2012 and 2013, respectively and related to various minimum foreign income tax assessments. SK Retail has a potential future income tax liability based on uncertain tax positions taken by SK Retail over the years for which the Company would be liable under the terms of its Fourth Amended and Restated Limited Liability Company Operating Agreement. At December 31, 2013, the total potential liability was $0.3 million, including accrued interest and penalties, and has been reflected as due to related party.
F-27
Notes to Consolidated Financial Statements (Continued)
12. Income Taxes (Continued)
The tax years that remain subject to examination by major taxing jurisdictions are those for the years ended December 31, 2013, 2012, 2011, and 2010.
Pro Forma Income Tax Accounting Related to the Reorganization (Unaudited)
Prior to the transition to a corporate structure, the Company was generally not subject to U.S. federal income taxes. Since U.S. federal taxes related to income earned by the members of the Company were the responsibility of the individual members, the Company's members reported and paid U.S. federal taxes on their share of the Company's income on their individual tax returns. In other countries, however, the Company operated in the form of a corporation or were otherwise subject to entity-level taxes on income and withholding taxes. As a result, prior to transitioning to a corporate structure, the Company paid some entity-level taxes with the amount varying from year to year depending on the mix of earning among the countries. Where applicable, the Company accounted for these taxes under the asset and liability method. Therefore, historical financial statements with respect to periods ended on or prior to June 30, 2014 do not reflect the income tax liability that the Company would have paid as a corporation. Following the transition to a corporate structure, the Company will be subject to corporate tax on income.
The Company prepared and provided the unaudited pro forma consolidated balance sheet as if the reorganization from a limited liability company to a corporation in connection with this offering occurred on June 30, 2014. Pro forma deferred income taxes reflect the net tax effects of temporary differences between the pro forma carrying amounts of our tax assets and liabilities calculated for financial reporting purposes and the amounts that would have been calculated for our income tax returns in accordance with tax regulations and the net pro forma tax effects of operating loss and tax credit carryforwards if we had been a taxable entity.
The ultimate realization of deferred tax assets depends on the generation of sufficient taxable income of the appropriate character and in the appropriate taxing jurisdictions during the future periods in which the related temporary differences become deductible. The Company determined the valuation allowance on pro forma deferred tax assets is in accordance with the accounting standard for income taxes, which require weight of both positive and negative evidence in order to ascertain whether it is more likely than not that the pro forma deferred tax assets would be realized. The Company evaluated all significant available positive and negative evidence, including the existence of cumulative net income, benefits that could be realized from available tax strategies and forecasts of future taxable income, in determining the need for a valuation allowance on pro forma deferred tax assets. After applying the evaluation guidance of the accounting standard for income taxes the Company determined that it was more likely than not that $28.5 million of the pro forma deferred tax assets will not be realized, and as such, a valuation allowance of $28.5 million was required.
As of June 30, 2014, pro forma tax-effected deferred tax assets, net of valuation allowance, and deferred tax liabilities were $7.2 million and $7.5 million respectively. Accordingly the pro forma net deferred tax liability as of June 30, 2014 was determined to be $0.3 million.
13. Credit Agreement
The Company has a credit agreement with Bank of America, which provides the Company with a line of credit for up to $25.0 million, with the committed amounts of $10.0 million to be used for a revolving line of credit and $15.0 million to be used to support the Company's credit card
F-28
Notes to Consolidated Financial Statements (Continued)
13. Credit Agreement (Continued)
program. The Company is required to maintain certain covenants, including debt service coverage, tangible net worth, and unencumbered liquid assets. The Company did not borrow any amounts under the credit agreement during the years ended December 31, 2012 and 2013 and the six months ended June 30, 2013 and 2014. The credit agreement is renewable on an annual basis, and the next renewal date is October 28, 2014.
14. Related-Party Transactions
The Company has done business with a company owned by a family member of one of the Company's members. During the year ended December 31, 2012, the Company paid this related party $2,000 as part of a revenue-sharing agreement. In addition, the Company paid this related party and its affiliates $21,000, $4,000, $2,000 and $0 in the years ended December 31, 2012 and 2013 and the six months ended June 30, 2013 and 2014, respectively, in conjunction with a supplier relationship.
Due to Member
Included in the accompanying consolidated balance sheets is approximately $1.4 million, $1.9 million, and $1.5 million due to SK Retail at December 31, 2012 and 2013 and June 30, 2014, respectively. SK Retail holds a majority ownership interest in the Company at June 30, 2014.
During the years ended December 31, 2012 and 2013 and the six months ended June 30, 2013 and 2014, the Company was cross charged $11.2 million, $12.0 million, $6.3 million, and $6.1 million, respectively, by SK Retail. Accordingly these amounts have been included in general and administrative expense in the accompanying consolidated statements of operations and represent salaries, benefits, and other administrative costs incurred by SK Retail on behalf of the Company.
15. Net Income (Loss) per Common Unit and Unaudited Pro Forma Net Income (Loss) per Common Share
Basic and diluted net (loss) income per common unit is presented using the two-class method required for participating securities. Holders of the Series A units are entitled to receive cumulative dividends payable prior and in preference to any dividends on any of the Company's common units. The Company considers its Series A units to be participating securities and, in accordance with the two-class method, earnings allocated to Series A units and the related number of outstanding participating securities would be excluded from the computation of basic and diluted net income (loss) per common unit.
Under the two-class method, net (loss) income attributable to common unit holders is determined by allocating undistributed earnings between common units and participating securities. Undistributed earnings are calculated as net income (loss) less distributed earnings and accretion of Series A units. As holders of Series A units do not have a contractual obligation to share in the losses of the Company, the net loss attributable to common unit holders for each period is not allocated between common units and participating securities. Accordingly, Series A units are excluded from the calculation of basic and diluted net loss per common unit. The Company's basic and diluted net loss per common unit are the same because the Company has generated net loss to common unit holders and common unit equivalents are excluded from diluted net loss per share because they have an antidilutive impact.
F-29
Notes to Consolidated Financial Statements (Continued)
15. Net Income (Loss) per Common Unit and Unaudited Pro Forma Net Income (Loss) per Common Share (Continued)
Net Income (Loss) per Common Unit
The following table presents the calculation of basic and diluted net loss per common unit:
| |
Years ended December 31, |
Six months ended June 30, |
|||||||||||
|---|---|---|---|---|---|---|---|---|---|---|---|---|---|
| |
2012
|
2013
|
2013
|
2014
|
|||||||||
| |
(in thousands, except share amount) |
||||||||||||
| |
|
|
(unaudited) |
||||||||||
Numerator: |
|||||||||||||
Net loss |
$ | (21,055 | ) | $ | (15,526 | ) | $ | (8,338 | ) | $ | (51,401 | ) | |
Accretion of preferred units to redemption value |
(12,154 | ) | (25,388 | ) | (15,948 | ) | (11,755 | ) | |||||
| | | | | | | | | | | | | | |
Net loss attributable to common unit holders per unit — basic and diluted |
$ | (33,209 | ) | $ | (40,914 | ) | $ | (24,286 | ) | $ | (63,156 | ) | |
| | | | | | | | | | | | | | |
| | | | | | | | | | | | | | |
Denominator: |
|||||||||||||
Weighted average units used for basic and diluted net loss per unit computation |
41,271,992 | 41,331,546 | 41,271,992 | 40,828,976 | |||||||||
| | | | | | | | | | | | | | |
Net loss per common unit attributable to common unit holders: |
|||||||||||||
Basic and Diluted |
$ | (0.80 | ) | $ | (0.99 | ) | $ | (0.59 | ) | $ | (1.55 | ) | |
| | | | | | | | | | | | | | |
| | | | | | | | | | | | | | |
The following have been excluded from the computation of basic and diluted net loss per share attributable to common stockholders as their effect would have been antidilutive:
| |
Years ended December 31, |
Six months ended June 30, |
|||||||||||
|---|---|---|---|---|---|---|---|---|---|---|---|---|---|
| |
2012 | 2013 | 2013 | 2014 | |||||||||
| |
|
|
(unaudited) |
||||||||||
Series A convertible redeemable preferred units |
21,551,801 | 21,551,801 | 21,551,801 | 21,551,801 | |||||||||
Series B convertible redeemable preferred units |
— | — | — | 5,995,133 | |||||||||
Common option units |
711,307 | 664,232 | 687,792 | 646,413 | |||||||||
Restricted common units |
3,546,942 | 3,490,968 | 3,520,452 | 3,271,516 | |||||||||
Deferred common units |
1,979,763 | 5,255,113 | 3,729,207 | 6,085,085 | |||||||||
| | | | | | | | | | | | | | |
|
27,789,813 | 30,962,114 | 29,489,252 | 37,549,948 | |||||||||
| | | | | | | | | | | | | | |
| | | | | | | | | | | | | | |
Unaudited Pro Forma Net Income (Loss) Per Common Share
Pro forma basic and diluted net loss per common share have been computed to give effect to the automatic conversion of all of the Company's convertible preferred stock into Class B common stock using the if-converted method as though the conversion had occurred as of the beginning of
F-30
Notes to Consolidated Financial Statements (Continued)
15. Net Income (Loss) per Common Unit and Unaudited Pro Forma Net Income (Loss) per Common Share (Continued)
the period or the original date of issuance. In addition, the pro forma share amounts give effect to the common option units, deferred units and restricted common units that have satisfied the service condition as of December 31, 2013 and June 30, 2014. These awards will vest and will be settled upon the occurrence of a liquidity event, as previously defined. Equity-based compensation expense associated with the common option units, deferred units and restricted common units that have satisfied the service condition as of December 31, 2013 and June 30, 2014 are included in the pro forma net loss.
Additionally, the pro forma net loss applied in computing the pro forma basic and diluted net loss per share is based upon the Company's historical net loss as adjusted to reflect the intended reorganization of the Company from a Delaware limited liability company into a Delaware corporation as of January 1, 2013. The pro forma net loss, therefore, includes adjustments for income tax benefit of $0.4 million for the year ended December 31, 2013 and income tax expense of less than $0.1 million for the six months ended June 30, 2014, as if the Company had been a corporation and subject to income taxes at an assumed combined federal, state, and local income tax rate of 39.7%.
F-31
Notes to Consolidated Financial Statements (Continued)
15. Net Income (Loss) per Common Unit and Unaudited Pro Forma Net Income (Loss) per Common Share (Continued)
The following table presents the calculation of unaudited pro forma net income (loss) per common share — basic and diluted for the year ended December 31, 2013 and the six months ended June 30, 2014 (in thousands, except per share data):
| |
Year ended December 31, 2013 |
Six months ended June 30, 2014 |
|||||
|---|---|---|---|---|---|---|---|
| |
(unaudited) |
||||||
Numerator: |
|||||||
Net loss attributable to common unit holders per unit — basic and diluted |
$ | (40,914 | ) | $ | (63,156 | ) | |
Adjustment for pro forma income tax (expense) benefit |
375 | (54 | ) | ||||
Pro forma equity-based compensation expense for settlement of provisionally vested common option units, deferred units and restricted common units upon the occurrence of a liquidity event |
(27,827 | ) | (12,487 | ) | |||
| | | | | | | | |
Pro forma net loss |
$ | (68,366 | ) | $ | (75,697 | ) | |
| | | | | | | | |
Pro forma adjustment to reverse previously recognized changes in the carrying value of the participating preferred units |
39,900 | 34,200 | |||||
Pro forma adjustment to reflect assumed dividends distributed on participating preferred units |
(29,265 | ) | (20,896 | ) | |||
| | | | | | | | |
Pro forma net loss attributable to common unit holders — basic and diluted |
$ | (57,731 | ) | $ | (62,393 | ) | |
| | | | | | | | |
| | | | | | | | |
Weighted average shares used to compute pro forma net income (loss) per share, basic and diluted: |
|||||||
Weighted average shares used to compute basic net loss per share |
41,331,546 | 40,828,976 | |||||
Pro forma adjustment to reflect assumed conversion of redeemable preferred units |
21,551,801 | 25,460,230 | |||||
Pro forma adjustment to reflect settlement of provisionally vested deferred units net of shares withheld for taxes and restricted common units upon the occurrence of a liquidity event |
2,412,046 | 3,338,527 | |||||
Pro forma adjustment to reflect number of shares issued at mid-range price per share to settle convertible redeemable preferred units dividend obligations |
1,104,340 | 788,528 | |||||
| | | | | | | | |
Weighted average shares used to compute pro forma net income (loss) per share, basic and diluted: |
66,399,733 | 70,416,261 | |||||
| | | | | | | | |
Pro forma net income (loss) per share attributable to common stockholders: |
|||||||
Basic and Diluted |
$ | (0.87 | ) | $ | (0.89 | ) | |
| | | | | | | | |
| | | | | | | | |
F-32
Notes to Consolidated Financial Statements (Continued)
16. Subsequent Events
We evaluated subsequent events after the audited balance sheet date of December 31, 2013 and after the unaudited balance sheet as of June 30, 2014 through September 19, 2014, the date these financial statements were submitted to the Securities and Exchange Commission, and determined that there were no material recognized or unrecognized subsequent events.
F-33


11,000,000 Shares
Class A Common Stock
Prospectus
| Goldman, Sachs & Co. | BofA Merrill Lynch | Citigroup | ||
Allen & Company LLC |
||||
Pacific Crest Securities |
Piper Jaffray |
Wells Fargo Securities |
||
| Canaccord Genuity | Cowen and Company | Raymond James |
Through and including , 2014 (the 25th day after the date of this prospectus), all dealers effecting transactions in these securities, whether or not participating in this offering, may be required to deliver a prospectus. This is in addition to a dealer's obligation to deliver a prospectus when acting as an underwriter and with respect to an unsold allotment or subscription.
![]()
Part II
INFORMATION NOT REQUIRED IN PROSPECTUS
Item 13. Other Expenses of Issuance and Distribution.
The following table indicates the expenses to be incurred in connection with the offering described in this registration statement, other than underwriting discount, all of which will be paid by us. All amounts are estimated except the Securities and Exchange Commission registration fee, the Financial Industry Regulatory Authority, Inc., or FINRA, filing fee and the New York Stock Exchange, or NYSE, listing fee.
| |
Amount | |||
|---|---|---|---|---|
Securities and Exchange Commission registration fee |
$ | 45,621 | ||
FINRA filing fee |
53,630 | |||
New York Stock Exchange listing fee |
250,000 | |||
Accountants' fees and expenses |
1,300,000 | |||
Legal fees and expenses |
1,100,000 | |||
Blue Sky fees and expenses |
10,000 | |||
Printing and engraving expenses |
250,000 | |||
Miscellaneous |
240,749 | |||
| | | | | |
Total expenses |
$ | 3,250,000 | ||
Item 14. Indemnification of Directors and Officers.
Section 102 of the General Corporation Law of the State of Delaware permits a corporation to eliminate the personal liability of directors of a corporation to the corporation or its stockholders for monetary damages for a breach of fiduciary duty as a director, except where the director breached his duty of loyalty, failed to act in good faith, engaged in intentional misconduct or knowingly violated a law, authorized the payment of a dividend or approved a stock repurchase in violation of Delaware corporate law or obtained an improper personal benefit. Our restated certificate of incorporation provides that no director of the Registrant shall be personally liable to it or its stockholders for monetary damages for any breach of fiduciary duty as a director, notwithstanding any provision of law imposing such liability, except to the extent that the General Corporation Law of the State of Delaware prohibits the elimination or limitation of liability of directors for breaches of fiduciary duty.
Section 145 of the General Corporation Law of the State of Delaware provides that a corporation has the power to indemnify a director, officer, employee, or agent of the corporation, or a person serving at the request of the corporation for another corporation, partnership, joint venture, trust or other enterprise in related capacities against expenses (including attorneys' fees), judgments, fines and amounts paid in settlement actually and reasonably incurred by the person in connection with an action, suit or proceeding to which he was or is a party or is threatened to be made a party to any threatened, ending or completed action, suit or proceeding by reason of such position, if such person acted in good faith and in a manner he reasonably believed to be in or not opposed to the best interests of the corporation, and, in any criminal action or proceeding, had no reasonable cause to believe his conduct was unlawful, except that, in the case of actions brought by or in the right of the corporation, no indemnification shall be made with respect to any claim, issue or matter as to which such person shall have been adjudged to be liable to the corporation unless and only to the extent that the Court of Chancery or other adjudicating court determines that, despite the adjudication of liability but in view of all of the circumstances of the case, such person is fairly and reasonably entitled to indemnity for such expenses which the Court of Chancery or such other court shall deem proper.
II-1
Our restated certificate of incorporation provides that we will indemnify each person who was or is a party or threatened to be made a party to any threatened, pending or completed action, suit or proceeding, whether civil, criminal, administrative or investigative (other than an action by or in our right) by reason of the fact that he or she is or was, or has agreed to become, a director or officer of the company, or is or was serving, or has agreed to serve, at our request, as a director, officer, partner, employee or trustee of, or in a similar capacity with, another corporation, partnership, joint venture, trust or other enterprise (including any employee benefit plan) (all such persons being referred to hereafter as an "Indemnitee"), or by reason of any action alleged to have been taken or omitted in such capacity, against all expenses (including attorneys' fees), judgments, fines and amounts paid in settlement actually and reasonably incurred by or on behalf of Indemnitee in connection with such action, suit or proceeding and any appeal therefrom, if Indemnitee acted in good faith and in a manner which Indemnitee reasonably believed to be in, or not opposed to, our best interests, and, with respect to any criminal action or proceeding, had no reasonable cause to believe his or her conduct was unlawful. The termination of any action, suit or proceeding by judgment, order, settlement, conviction or upon a plea of nolo contendere or its equivalent, shall not, of itself, create a presumption that Indemnitee did not act in good faith and in a manner which Indemnitee reasonably believed to be in, or not opposed to, our best interests, and, with respect to any criminal action or proceeding, had reasonable cause to believe that his or her conduct was unlawful.
Our restated certificate of incorporation also provides that we will indemnify any Indemnitee who was or is a party to or threatened to be made a party to any threatened, pending or completed action or suit by or in our right to procure a judgment in our favor by reason of the fact that Indemnitee is or was, or has agreed to become, a director or officer of the company, or is or was serving, or has agreed to serve, at our request, as a director, officer, partner, employee or trustee of, or in a similar capacity with, another corporation, partnership, joint venture, trust or other enterprise (including any employee benefit plan), or by reason of any action alleged to have been taken or omitted in such capacity, against all expenses (including attorneys' fees) and, to the extent permitted by law, amounts paid in settlement actually and reasonably incurred by or on behalf of Indemnitee in connection with such action, suit or proceeding and any appeal therefrom, if Indemnitee acted in good faith and in a manner which Indemnitee reasonably believed to be in, or not opposed to, our best interests, except that no indemnification shall be made with respect of any claim, issue or matter as to which Indemnitee shall have been adjudged to be liable to us, unless, and only to the extent, that the Court of Chancery of Delaware shall determine upon application that, despite the adjudication of such liability but in view of all the circumstances of the case, Indemnitee is fairly and reasonably entitled to indemnity tor such expenses (including attorneys' fees) which the Court of Chancery of Delaware shall deem proper.
Notwithstanding any other provisions of our restated certificate of incorporation, to the extent that an Indemnitee has been successful, on the merits or otherwise, in defense of any action, suit or proceeding referred to above, or in defense of any claim, issue or matter therein, or on appeal from any such action, suit or proceeding, Indemnitee shall be indemnified against all expenses (including attorneys' fees) actually and reasonably incurred by or on behalf of Indemnitee in connection therewith.
We expect to enter into indemnification agreements with each of our directors and executive officers prior to the completion of this offering. We expect that these agreements will provide that we will indemnify the director or executive officer to the fullest extent permitted by law for claims arising in his or her capacity as a director or executive officer of the company or in connection with his or her service at our request for another corporation or entity.
II-2
We maintain a general liability insurance policy that covers certain liabilities of directors and officers of our corporation arising out of claims based on acts or omissions in their capacities as directors or officers.
In any underwriting agreement we enter into in connection with the sale of common stock being registered hereby, the underwriters will agree to indemnify, under certain conditions, us, our directors, our officers and persons who control us within the meaning of the Securities Act of 1933, as amended, or the Securities Act, against certain liabilities.
Item 15. Recent Sales of Unregistered Securities.
Set forth below is information regarding shares of capital stock issued by us since January 1, 2011. Also included is the consideration received by us for such shares and information relating to the section of the Securities Act, or rule of the SEC, under which exemption from registration was claimed.
- (a)
- Issuances
of preferred stock
- •
- In March 2014, we sold an aggregate of 5,995,133 shares of our Series B preferred stock at a price per share of
$26.2261 for aggregate gross consideration of approximately $157 million.
- •
- In November 2012, we sold an aggregate of 3,885,137 shares of our Series A preferred stock at a price per share of
$9.339624 for aggregate gross consideration of approximately $36 million.
- •
- In June 2011, we sold an aggregate of 17,666,664 shares of our Series A preferred stock at a price per share of
$9.339624 for aggregate gross consideration of approximately $165 million.
- (b)
- Acquisitions
- •
- In July 2013, we issued an aggregate of 141,150 shares of our common stock to DwellStudio Holdings LLC, as partial consideration for the purchase of substantially all of its assets.
The securities described in paragraphs (a) and (b) of this Item 15 were issued to accredited investors in reliance upon the exemption from the registration requirements of the Securities Act, as set forth in Section 4(a)(2) under the Securities Act, relative to transactions by an issuer not involving any public offering, to the extent an exemption from such registration was required.
- (c)
- Equity
Grants and Exercises:
- •
- From the period beginning January 1, 2011 through August 31, 2014, we issued 171,000 profits interests with
respect to Class B common stock, to our employees, consultants, advisors and directors pursuant to our Second Amended and Restated 2010 Incentive Plan, or 2010 Plan, which in June 2011 were
converted into 109,689 restricted common units.
- •
- From the period beginning January 1, 2011 through August 31, 2014, we granted options to purchase an
aggregate of 158,700 shares of our Class B common stock with exercise prices ranging from $2.89 to $3.42 per share, to our employees, consultants, advisors and directors pursuant to our
2010 Plan. During this same period, no shares of our Class B common stock were issued upon the exercise of options.
- •
- From the period beginning January 1, 2011 and through August 31, 2014, we granted 7,016,014 restricted stock units for 7,016,014 shares of our Class B common stock for no
II-3
consideration upon completion of the vesting schedule to our employees, consultants, advisors and directors pursuant to our 2010 Plan. The grant date fair value of these issues restricted stock units ranges from $4.20 to $33.67. During this same period, no shares of our Class B common stock have been issued from restricted stock units.
The issuances of shares of restricted Class B common stock, options, shares of our Class B common stock issuable upon the exercise of the options and restricted stock units for our Class B common stock described in paragraph (c) of this Item 15 were issued pursuant to written compensatory plans or arrangements with our employees, consultants, advisors and directors, in reliance on the exemption provided by Rule 701 promulgated under the Securities Act, or pursuant to Section 4(a)(2) under the Securities Act, relative to transactions by an issuer not involving any public offering, to the extent an exemption from such registration was required.
No underwriters were involved in the foregoing issuances of securities. All of the foregoing securities are deemed restricted securities for purposes of the Securities Act. All certificates representing the issued shares of capital stock described in this Item 15 included appropriate legends setting forth that the securities have not been registered and the applicable restrictions on transfer.
Item 16. Exhibits and Financial Statement Schedules.
(a) Exhibits. See the Exhibit Index attached to this registration statement, which is incorporated by reference herein.
(b) Financial Statement Schedules. Schedules not listed above have been omitted because the information required to be set forth therein is not applicable or is shown in the financial statements or notes thereto.
The undersigned registrant hereby undertakes to provide to the underwriter, at the closing specified in the underwriting agreement, certificates in such denominations and registered in such names as required by the underwriter to permit prompt delivery to each purchaser.
Insofar as indemnification for liabilities arising under the Securities Act may be permitted to directors, officers and controlling persons of the registrant pursuant to the foregoing provisions, or otherwise, the registrant has been advised that in the opinion of the SEC such indemnification is against public policy as expressed in the Securities Act and is, therefore, unenforceable. In the event that a claim for indemnification against such liabilities (other than the payment by the registrant of expenses incurred or paid by a director, officer or controlling person of the registrant in the successful defense of any action, suit or proceeding) is asserted by such director, officer or controlling person in connection with the securities being registered, the registrant will, unless in the opinion of its counsel the matter has been settled by controlling precedent, submit to a court of appropriate jurisdiction the question whether such indemnification by it is against public policy as expressed in the Securities Act and will be governed by the final adjudication of such issue.
The undersigned hereby undertakes that:
- (1)
- For purposes of determining any liability under the Securities Act, the information omitted from the form of prospectus filed as part of this registration statement in reliance upon Rule 430A and contained in a form of prospectus filed by the registrant pursuant to Rule 424(b)(1) or (4) or 497(h) under the Securities Act shall be deemed to be part of this registration statement as of the time it was declared effective.
II-4
- (2)
- For
the purpose of determining any liability under the Securities Act, each post-effective amendment that contains a form of prospectus shall be deemed to
be a new registration statement relating to the securities offered therein, and the offering of such securities at that time shall be deemed to be the initial bona fide offering thereof.
- (3)
- For
the purpose of determining liability under the Securities Act to any purchaser, each prospectus filed pursuant to Rule 424(b) as part of a
registration statement relating to an offering, other than registration statements relying on Rule 430B or other than prospectuses filed in reliance on Rule 430A, shall be deemed to be
part of and included in the registration statement as of the date it is first used after effectiveness. Provided, however, that no statement made in a registration statement or prospectus that is part
of the registration statement or made in a document incorporated or deemed incorporated by reference into the registration statement or prospectus that is part of the registration statement will, as
to a purchaser with a time of contract of sale prior to such first use, supersede or modify any statement that was made in the registration statement or prospectus that was part of the registration
statement or made in any such document immediately prior to such date of first use.
- (4)
- In
a primary offering of securities of the undersigned registrant pursuant to this registration statement, regardless of the underwriting method used to
sell the securities to the purchaser, if the securities are offered or sold to such purchaser by means of any of the following communications, the undersigned registrant will be a seller to the
purchaser and will be considered to offer or sell such securities to such purchaser:
- (i)
- Any
preliminary prospectus or prospectus of the undersigned registrant relating to the offering required to be filed pursuant to Rule 424;
- (ii)
- Any
free writing prospectus relating to the offering prepared by or on behalf of the undersigned registrant or used or referred to by the undersigned
registrant;
- (iii)
- The
portion of any other free writing prospectus relating to the offering containing material information about the undersigned registrant or its
securities provided by or on behalf of the undersigned registrant; and
- (iv)
- Any other communication that is an offer in the offering made by the undersigned registrant to the purchaser.
II-5
Pursuant to the requirements of the Securities Act, the registrant has duly caused this Amendment No. 1 to registration statement to be signed on its behalf by the undersigned, thereunto duly authorized, in the City of Boston, Commonwealth of Massachusetts, on this 19th day of September, 2014.
| WAYFAIR INC. | ||||
By: |
/s/ NIRAJ SHAH Niraj Shah Chief Executive Officer |
|||
Pursuant to the requirements of the Securities Act of 1933, this Amendment No. 1 to Registration Statement has been signed by the following persons in the capacities held on the dates indicated.
Signature
|
Title
|
Date
|
||
|---|---|---|---|---|
| /s/ NIRAJ SHAH Niraj Shah |
Chief Executive Officer and Director (Principal Executive Officer) | September 19, 2014 | ||
/s/ MICHAEL FLEISHER Michael Fleisher |
Chief Financial Officer (Principal Financial Officer) |
September 19, 2014 |
||
/s/ NICHOLAS MALONE Nicholas Malone |
Chief Administrative Officer (Principal Accounting Officer) |
September 19, 2014 |
||
/s/ STEVEN CONINE Steven Conine |
Chief Technology Officer and Director |
September 19, 2014 |
||
* Neeraj Agrawal |
Director |
September 19, 2014 |
||
* Julie Bradley |
Director |
September 19, 2014 |
||
* Alex Finkelstein |
Director |
September 19, 2014 |
||
* Michael Kumin |
Director |
September 19, 2014 |
||
* Ian Lane |
Director |
September 19, 2014 |
||
* Romero Rodrigues |
Director |
September 19, 2014 |
| *By: | /s/ NIRAJ SHAH Niraj Shah Attorney-in-Fact |
Exhibit Number |
Description of Exhibit
|
||
|---|---|---|---|
| 1.1 | Underwriting Agreement | ||
| 2.1 | * | Contribution and Exchange Agreement dated as of August 15, 2014 between the Registrant and the other parties thereto | |
| 3.1 | * | Certificate of Incorporation of the Registrant, as currently in effect | |
| 3.2 | Form of Restated Certificate of Incorporation of the Registrant, to be in effect immediately prior to the consummation of the Corporate Reorganization | ||
| 3.3 | * | Bylaws of the Registrant, as currently in effect | |
| 3.4 | Form of Restated Certificate of Incorporation of the Registrant, to be in effect following the Corporate Reorganization and prior to the consummation of this offering | ||
| 3.5 | Form of Restated Certificate of Incorporation of the Registrant, to be in effect following the consummation of this offering | ||
| 3.6 | Form of Amended and Restated Bylaws, to be in effect immediately prior to the consummation of this offering | ||
| 4.1 | Specimen stock certificate evidencing the shares of Class A common stock of the Registrant | ||
| 5.1 | Opinion of Latham & Watkins LLP | ||
| 10.1 | *# | Second Amended and Restated 2010 Incentive Plan | |
| 10.2 | *# | Form of Deferred Unit Agreement under the Second Amended and Restated 2010 Incentive Plan | |
| 10.3 | # | 2014 Incentive Award Plan, to be effective upon the consummation of this offering | |
| 10.4 | # | Form of Option Agreement under the 2014 Incentive Award Plan | |
| 10.5 | # | Form of Restricted Stock Unit Agreement under the 2014 Incentive Award Plan | |
| 10.6 | # | Form of Restricted Stock Award Agreement under the 2014 Incentive Award Plan | |
| 10.7 | * | Form of Investors' Rights Agreement by and among the Registrant and the other parties thereto, to be in effect upon the Corporate Reorganization | |
| 10.8 | *# | Form of Indemnification Agreement for Directors and Officers | |
| 10.9 | * | Office Lease dated April 18, 2013 between Copley Place Associates, LLC and the Registrant | |
| 10.10 | * | Agreement of Lease dated December 31, 2013 between Distribution I Patent Tenant LLC and the Registrant | |
| 10.11 | *# | Form of Amended and Restated Letter Agreement dated May 6, 2014 between the Registrant and each of Niraj Shah and Steven Conine | |
| 10.12 | *# | Letter Agreement dated October 2, 2013 between the Registrant and Michael Fleisher, as amended May 5, 2014 | |
| 10.13 | * | Loan Agreement dated October 29, 2012 between Bank of America, N.A. and the Registrant, as amended by Amendment No. 1 to Loan Agreement dated October 29, 2013 | |
| 21.1 | * | Subsidiaries of the Registrant | |
| 23.1 | Consent of Ernst & Young LLP | ||
| 23.2 | Consent of Latham & Watkins LLP (included in Exhibit 5.1) | ||
| 24.1 | * | Power of Attorney (included on signature page) | |
- *
- Previously
submitted.
- #
- Indicates management contract or compensatory plan.