Attached files
| file | filename |
|---|---|
| 8-K - 8-K - MOLINA HEALTHCARE, INC. | d791807d8k.htm |
 Investor Day 2014B
September 18, 2014
New York, New York
Exhibit 99.1 |
 2
©
2014 Molina Healthcare, Inc.
Cautionary Statement
Safe
Harbor
Statement
under
the
Private
Securities
Litigation
Reform
Act
of
1995:
This
slide
presentation and our accompanying oral remarks contain numerous
“forward-looking statements” regarding,
without
limitation
to:
our
2014
financial
guidance;
our
revenue,
revenue
mix,
and
membership
projections;
our
business strategy; duals demonstration projects and their expected implementation
start dates; the annual Health
Insurer
Fee
or
excise
tax
and
its
reimbursement
by
states
on
a
grossed-up
basis;
the
2014
rate
environment; the hepatitis C drug Sovaldi; our recent acquisitions in the
State of Florida; and various other matters.
All of our forward-looking statements are subject to numerous risks,
uncertainties, and other factors
that could
cause
our
actual
results
to
differ
materially.
Anyone
viewing
or
listening
to
this
presentation
is
urged
to read the risk factors and cautionary statements found under Item 1A in our
annual report on Form 10-K, as well as the risk factors and cautionary
statements in our quarterly reports and in our other reports and filings
with
the
Securities
and
Exchange
Commission
and
available
for
viewing
on
its
website
at
www.sec.gov.
Except to the extent otherwise required by federal securities laws, we do not
undertake to address or update forward-looking
statements
in
future
filings
or
communications
regarding
our
business
or
operating
results. |
 ©
2014 Molina Healthcare, Inc.
3
Approx. Time
Topic
Speaker
12:30pm-12:35pm
Opening Remarks
Juan José
Orellana, SVP Investor Relations
12:35pm-1:10pm
Business Overview
Dr. J. Mario Molina, Chief Executive Officer
1:10pm-1:45pm
Operations Discussion
Terry Bayer, Chief Operating Officer
1:45pm-2:00pm
Q&A
2:00pm-2:15pm
Break
2:15pm-2:45pm
Recent Financing
Transactions
Joseph White, Chief Accounting Officer
2:45pm-3:05pm
Q&A
3:05pm-3:50pm
Finance Discussion
John Molina, Chief Financial Officer
3:50pm-4:30pm
Q&A
4:30pm
End of Program
Today |
 Business Overview
J. Mario Molina, M.D.
President & Chief Executive Officer
September 18, 2014
New York, New York |
 ©
2014 Molina Healthcare, Inc.
5
Presence in Key Medicaid Markets
2.3 million members
WA
461K
CA
455K
FL
58K
NM
195K
TX
247K
WI
85K
MI
244K
SC
119K
IL
6K
UT
83K
Health Plan Enrollment as of June 2014
Health Plan footprint includes 4 of 5 largest Medicaid Markets
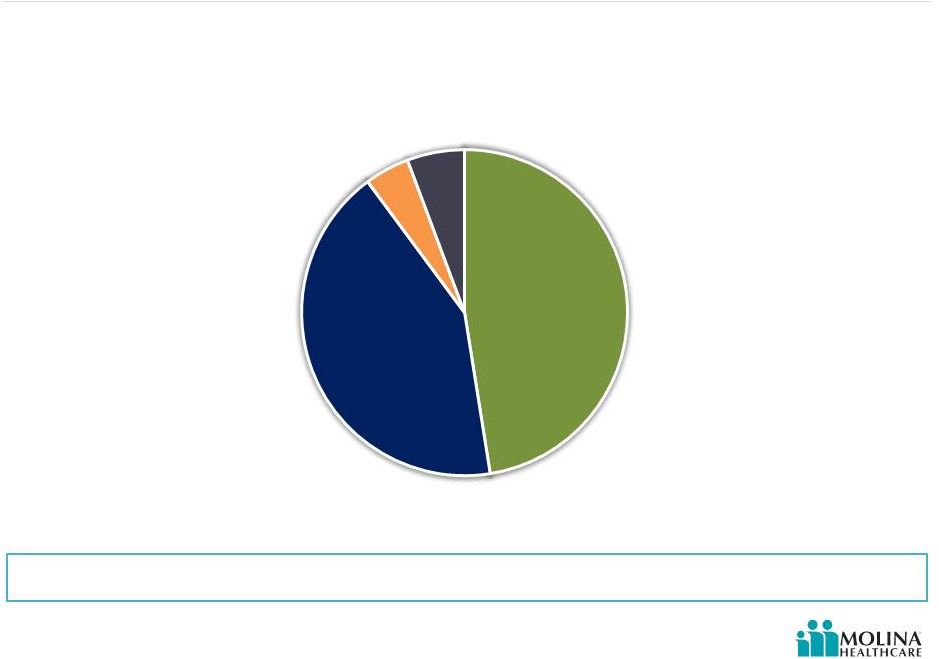
Health Plan Enrollment
by Product
Medicare
2%
80%
TANF
14%
CHIP
3%
Aged, Blind
Marketplace
1%
ID
WV
ME
NJ
VA
Molina Health Plan
Molina Medicaid Solutions
Direct Delivery
USVI
OH
302K
or Disabled |
 ©
2014 Molina Healthcare, Inc.
6
2014 Update –
Short Term
Medicare-Medicaid plan (MMP) program delay –
Michigan
TX Quality Revenue not yet recognized
Delays in recognition and collection of Health Insurer Fee
(HIF) reimbursement
Medicaid expansion enrollment higher than anticipated
Florida Medicaid Managed Medical Assistance (MMA)
program launch
Washington dispute settlements
Convertible Senior Note transactions in September 2014
MMP enrollment on track
Please refer to the Company’s cautionary statements. |
 ©
2014 Molina Healthcare, Inc.
7
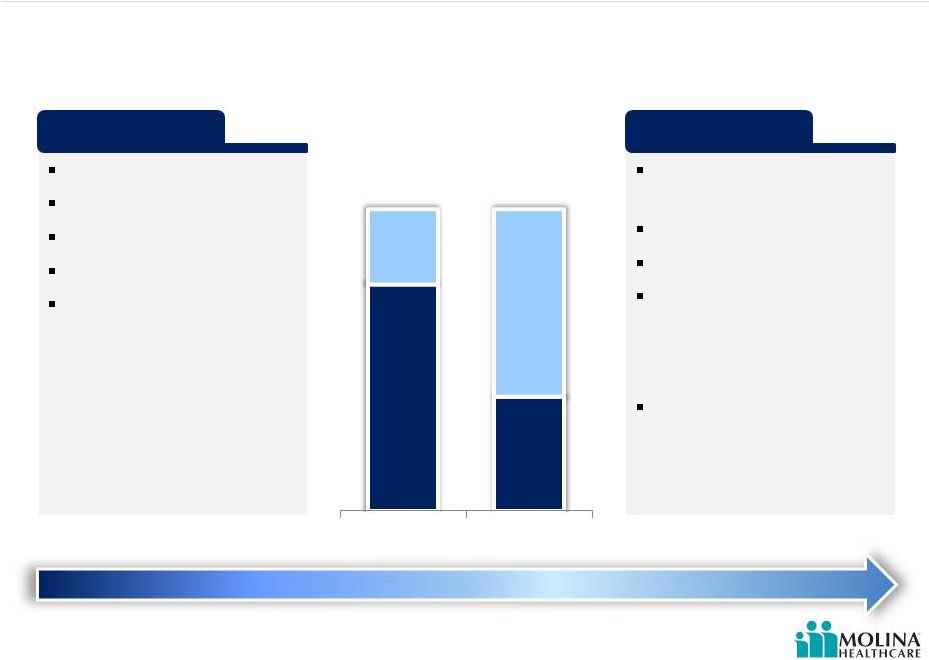
Affordable
Care
Act
–
Effect
on
MOH
after
6
Months
Medicaid Expansion
Enrollment
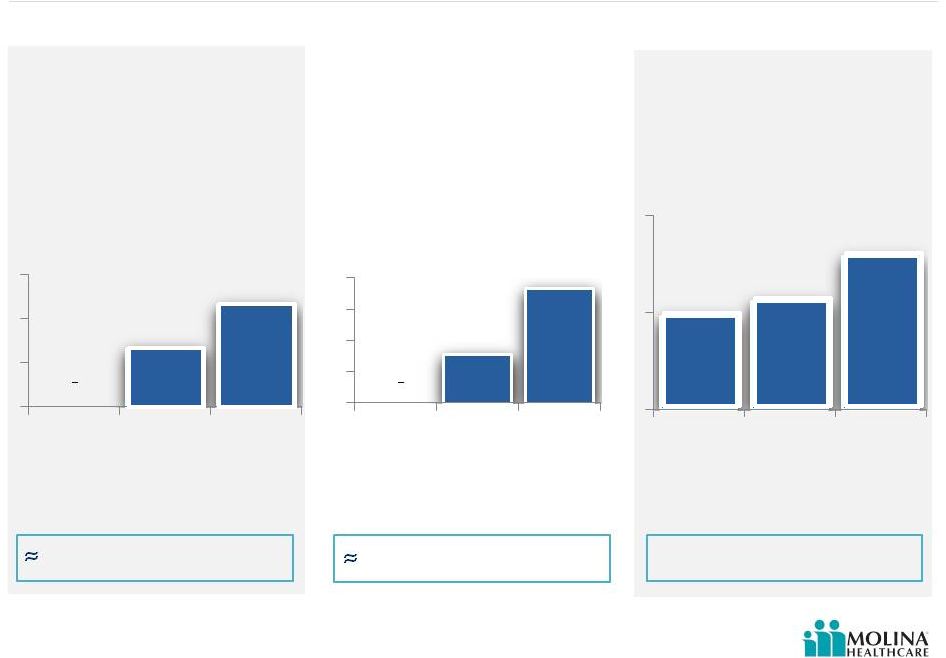
Enrollment from Molina States
participating in Medicaid Expansion
TANF & Welcome Mat
Effect
Medicaid TANF Enrollment from Molina
States participating in Medicaid
Expansion
Marketplace Enrollment
Enrollment in California, Florida,
Michigan, New Mexico, Ohio, Texas,
Utah, Washington and Wisconsin
$20M 1
Half Revenue
Not Materialized
Charts presented with varying scales.
133K
232K
4Q2013
1Q2014
2Q2014
8K
18K
4Q2013
1Q2014
2Q2014
1,148K
1,156K
1,179K
4Q2013
1Q2014
2Q2014
$500M 1
Half Revenue
st
st |
 ©
2014 Molina Healthcare, Inc.
8
Medicaid Expansion
TANF
Enrollment 1.5 Million
Average age: 14
Seniors & Persons with
Disabilities
Enrollment: 227K
Average age: 42
Medicaid Expansion
Enrollment 241K
Average age: 40
age
age
age
Gender Mix
Female
Male
Gender Mix
Female
Male
Gender Mix
Female
Male
Enrollment Demographic Profile
1.
Molina internal analytics. Most recent data available.
78%
5%
9%
8%
1%
0%
0%
15%
25%
41%
19%
0%
17%
7%
12%
30%
24%
9%
45%
55%
46%
54%
50%
50%
1 |
 ©
2014 Molina Healthcare, Inc.
9
Medicaid Expansion
TANF
Enrollment 1.5 Million
Average age: 14
Seniors & Persons with
Disabilities
Enrollment: 227K
Average age: 42
Medicaid Expansion
Enrollment 241K
Average age: 40
Medical Spending Profile by Service Category
1.
Molina internal analytics. Most recent data available.
IP = Inpatient
OP = Outpatient
ER = Emergency Room
MAT = Maternity Related
BH = Behavioral Health
LTC = Long Term Care
RX = Pharmacy
PROF = Professional Services
19%
12%12%
11%
2%
1%
16%
28%
32%
14%
12%
4%
1%
0%
10%
26%
25%
10%
7%
1%
2%
12%
24%
18%
1 |
 ©
2014 Molina Healthcare, Inc.
10
Medicaid Expansion
TANF
Enrollment 1.5 Million
Average age: 14
Seniors & Persons with
Disabilities
Enrollment: 227K
Average age: 42
Medicaid Expansion
Enrollment 241K
Average age: 40
Pharmacy Spending Profile
Top 10 Drugs by Spend
1.
Molina internal analytics. Most recent data available.
1
Abilify
ProAir HFA
QVAR
Synagis
Vyvanse
Methylphenidate
Hydrochloride
Budesonide
Tamiflu
Lantus
Humira
7%
3%
2%
2%
2%
2%
2%
1%
1%
1%
Abilify
Lantus
Humalog
QVAR
Humira
ProAir HFA
Enbrel
Gabapentin
Novolog
Atripla
5%
3%
2%
2%
2%
2%
1%
1%
1%
1%
Lantus
Abilify
Invega Sustenna
Spiriva
Nexium
Truvada
Lantus Solostar
ProAir HFA
QVAR
Humira
3%
3%
2%
2%
2%
2%
2%
2%
2%
1% |
 ©
2014 Molina Healthcare, Inc.
11
ACA Medicaid Expansion Demographics vs. Actual
Experience
Seniors & Persons with
Disabilities
Molina actual enrollment of Seniors and
Persons with Disabilities adjusted
by
removing age bands 0-18 and 65+.
age
age
age
Gender Mix
Female
Male
Gender Mix
Female
Male
Gender Mix
Female
Male
Urban Institute
Demographic expectations prior to
implementation
1.
Urban
Institute.
August
2012.
http://www.urban.org/UploadedPDF/412630-opting-in-medicaid.pdf
2.
Molina internal analytics. Most recent data available
Medicaid Expansion
Actual enrollment experience
Enrollment 241K
Average age: 40
of the Affordable
1
2
2
0%
26%
26%
36%
13%
0%
0%
15%
25%
41%
19%
0%
0%
10%
16%
41%
33%
0%
47%
53%
46%
54%
47%
53%
Care Act |
 ©
2014 Molina Healthcare, Inc.
12
2014 Update –
Long Term
Molina is transforming from
an acute care company to a
chronic care company.
Business requirements are
changing as we take on more
complex patients.
Please refer to the Company’s cautionary statements. |
 ©
2014 Molina Healthcare, Inc.
13
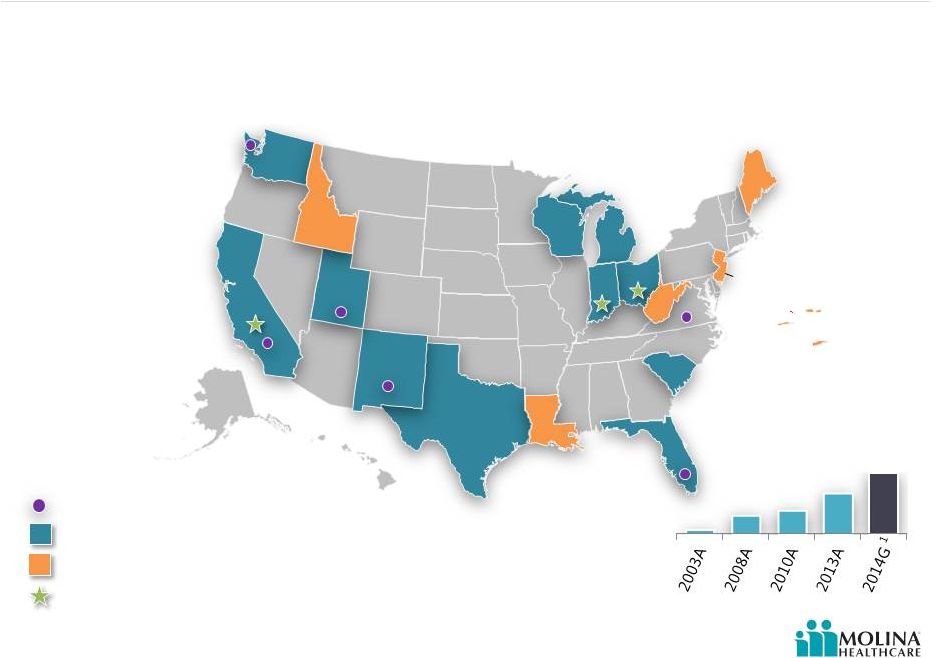
Molina Footprint
Please refer to the Company’s cautionary statements.
2014: Molina launches MMP Demos in three
states…
MMP Demonstrations
CA
NM
MI
WA
UT
TX
OH
FL
WI
ID
LA
WV
NJ
ME
SC
IL
Direct Delivery
Service Areas:
Molina Health Plan
Molina Medicaid Solutions
Total Revenue
$794M
1.2M
$3.1B
$3.9B
$6.6B
560K
Members
1.5M
1.9M
2010: Molina offers services through Molina Medicaid
Solutions…
$9.9B
2.6M
1
1.
Constitutes forward-looking guidance issued on February 2014. Amounts are
estimates and subject to change. Actual results may differ materially. See
our risk factors as discussed in our Form 10-K and other periodic filings.
USVI
VA
2008: Molina offers Medicare services…
2003: Molina becomes publicly traded on the
New York Stock Exchange…
1980: Molina Healthcare is born…
|
 ©
2014 Molina Healthcare, Inc.
14
Medicaid Enrollment and Spending
While most Enrollees are in Managed Care, most Medicaid Spending
is still in Fee-for-Service
Medicaid Enrollment and Spending
FY 2011
1.
Managed care includes only risk based MCOs.
CMS-64 data for 2012, and: MACPAC, ‘Report to Congress on Medicaid and
CHIP’, June 2013. FFS
MCOs
$407B
57M
26%
74%
77%
23%
Managed Care Organizations (MCOs) and Fee-For-Service (FFS)
$92B
$315B
Medicaid Spend 2011
42M
15M
Medicaid Enrollment 2011 |
 ©
2014 Molina Healthcare, Inc.
15
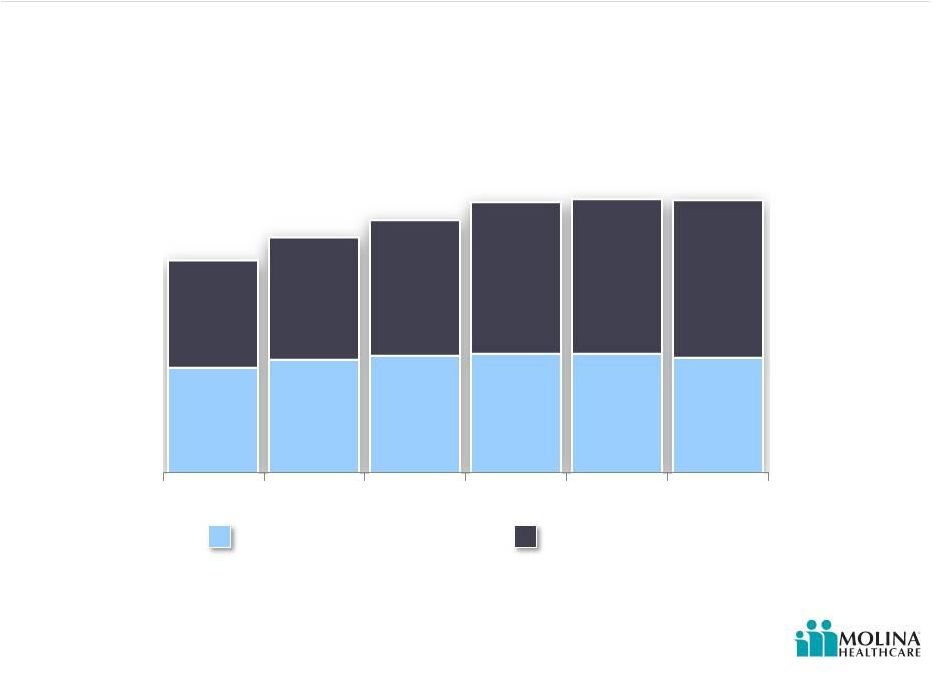
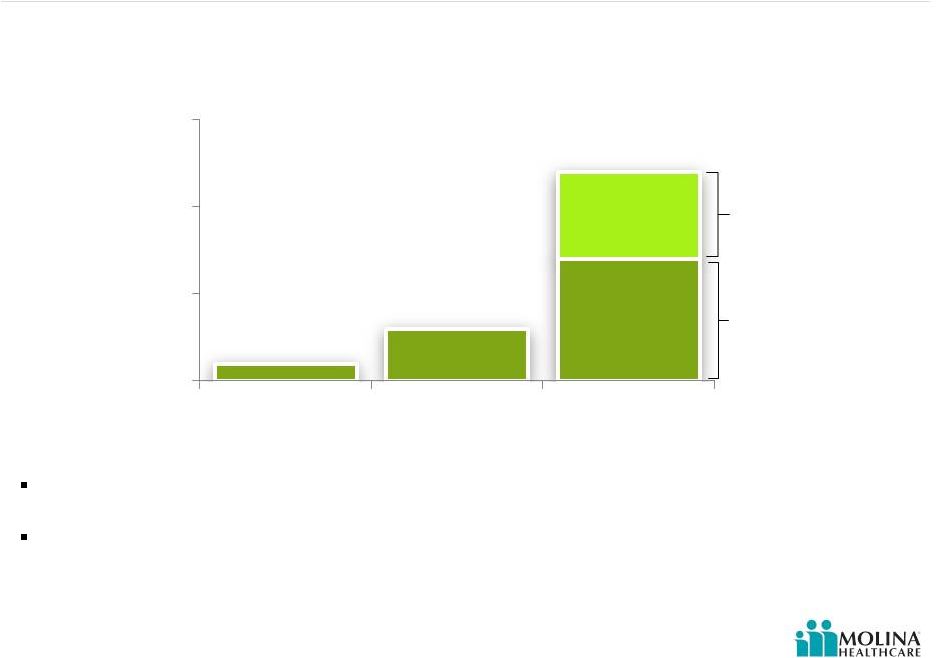
Home & Community-Based Care
Institutional-Based Care
Growing Long-Term Care Needs
Medicaid Long-Term Services and Supports Expenditures
2007-2012
1
$113B
$123B
$131B
$139B
$140B
$140B
1.
Truven Health Analytics. ‘Medicaid Expenditures for Long-Term Services and
Supports in FFY 2012’, April 28, 2014. 59%
57%
55%
52%
52%
50%
41%
43%
45%
48%
48%
50%
2007
2008
2009
2010
2011
2012 |
 ©
2014 Molina Healthcare, Inc.
16
Medicaid Long-Term Services and Supports (LTSS)
Older People &
People with
Physical Disabilities
People with
Developmental
Disabilities
61%
30%
People with
Serious Mental Illness
6%
Other/Multiple Populations
3%
Full Medicaid LTSS spend in 2012: $140B
1.
Truven Health Analytics. ‘Medicaid Expenditures for Long-Term Services and
Supports in FFY 2012’, April 28, 2014. |
 ©
2014 Molina Healthcare, Inc.
17
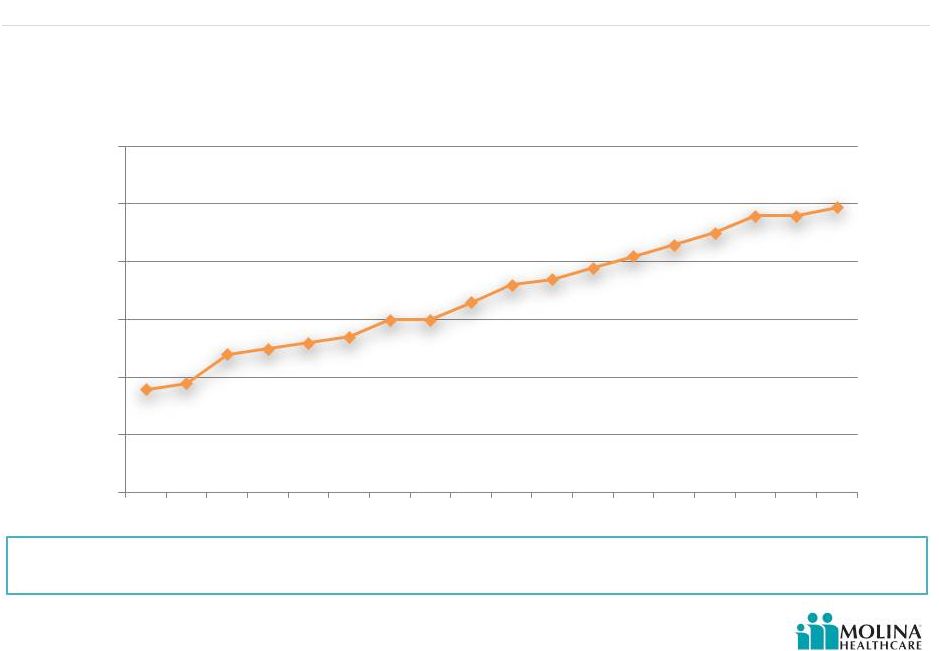
Medicaid Home and Community-Based Services (HCBS) as
% of LTSS Spending
Medicaid HCBS as Percent of Total Medicaid
LTSS Expenditures
1
FY
1995
–
FY
2012
1.
Truven Health Analytics. ‘Medicaid Expenditures for Long-Term Services and
Supports in FFY 2012’, April 28, 2014. Medicaid spend on Long-Term
Care has been shifting toward Community-Based Care
18%
19%
24%
25%
26%
27%
30%
30%
33%
36%
37%
39%
41%
43%
45%
48%
48%
50%
0%
10%
20%
30%
40%
50%
60%
1995
1996
1997
1998
1999
2000
2001
2002
2003
2004
2005
2006
2007
2008
2009
2010
2011
2012 |
 ©
2014 Molina Healthcare, Inc.
18
Medicaid Home and Community-Based Services (HCBS)
People with
Serious Mental Illness
4%
Other/Multiple Populations
6%
Medicaid HCBS total spend in 2012: $69B
1.
Truven Health Analytics. ‘Medicaid Expenditures for Long-Term Services and
Supports in FFY 2012’, April 28, 2014. Older People &
People with
Physical
Disabilities
People with
Developmental
Disabilities
48%
42% |
 ©
2014 Molina Healthcare, Inc.
19
Medicaid Home and Community-Based Services (HCBS)
Medicaid expenditures for long-term care services have gradually shifted from
institutional-based care to home and community-based care.
Medicaid HCBS total spend in 2012: $69B
Medicaid HCBS Expenditures
FY 2010
1
Mental Health
3%
Case Management
4%
Group living, mental health services: 34%
Round-the-clock services, unspecified: 28%
Group living, other: 11%
Shared living, other: 9%
In-home residential habilitation: 5%
In-home round-the-clock services, other: 5%
Group living, residential habilitation: 4%
Shared living, residential habilitation: 3%
In-home round-the-clock mental health
services: 1%
Home-based
habilitation
Home health aide
Personal care
Companion
Homemaker
Chore
Prevocational services
Day habilitation
Education services
Day treatment/partial
hospitalization
Adult day health
Adult day services
Community integration
Medical day care for
children
Round-the-Clock
46%
Home-Based
18%
Day Services
15%
Other
2
14%
1.
Mathematica Policy Research. ‘The HCBS Taxonomy: A New Language for Classifying Home- and
Community-Based Services’, August 2013.
2.
Other includes expenses related to goods and services, interpreters, housing consultation, and claims
where the procedure code could not be interpreted. |
 ©
2014 Molina Healthcare, Inc.
20
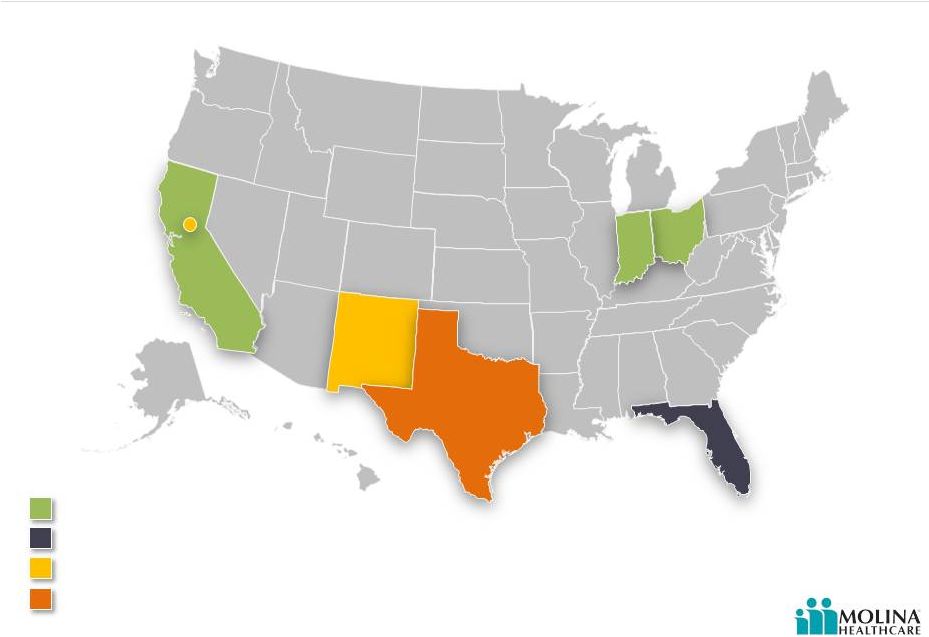
Molina Long Term Services & Support (LTSS) Footprint –
as of September 2014
Service Areas:
MMP Demonstrations
LTSS ”Stand Alone”
LTSS and Acute Care
Home and Community-Based
Services (HCBS)
CA
NM
OH
FL
IL
TX |
 ©
2014 Molina Healthcare, Inc.
21
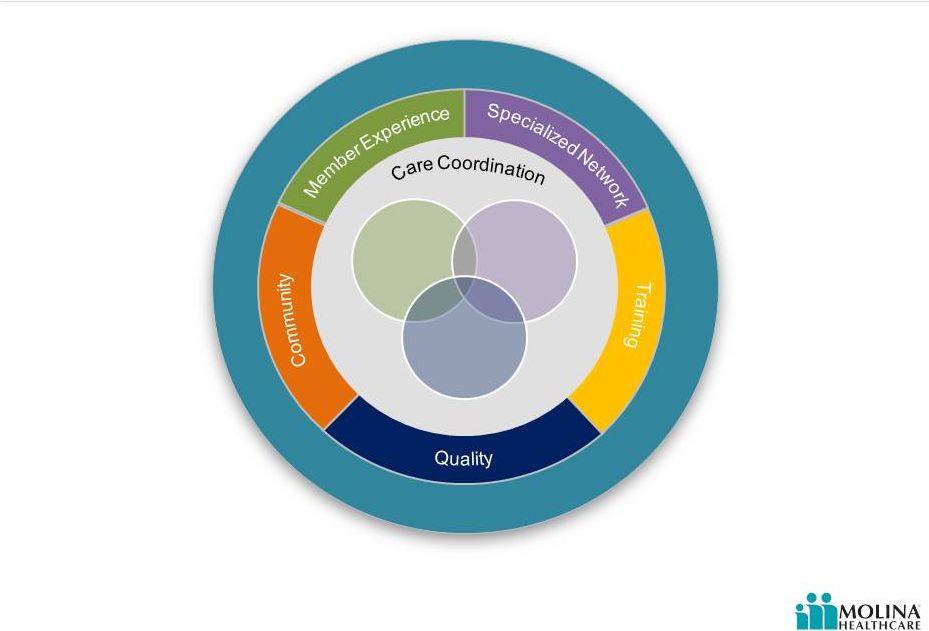
Long Term Services & Supports Continuum of Care
Management Model
LTSS
Medical
Health
Services
Behavioral
Health
Services |
 ©
2014 Molina Healthcare, Inc.
22
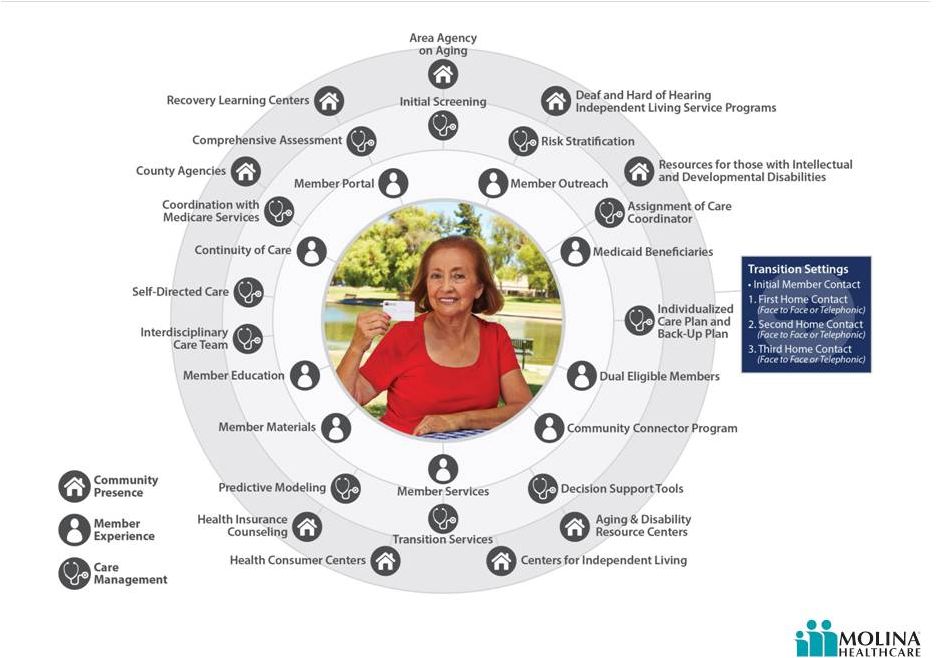
Molina Long Term Model of Care
Functional Elements |
 ©
2014 Molina Healthcare, Inc.
23
Manage our growth
Organic growth
Medicaid expansion
Dual eligible population
RFPs
Leverage our business portfolio
Health plan business
MMS
Direct delivery
Strive for operational excellence
Quality care
STAR ratings
Strategic Priorities
Our mission is to provide quality
health services to financially
vulnerable families and
individuals covered by
government programs.
Mission
Priorities |
 24
©
2014 Molina Healthcare, Inc. |
 Operations Discussion
Terry Bayer
Chief Operating Officer
September 18, 2014
New York, New York |
 ©
2014 Molina Healthcare, Inc.
26
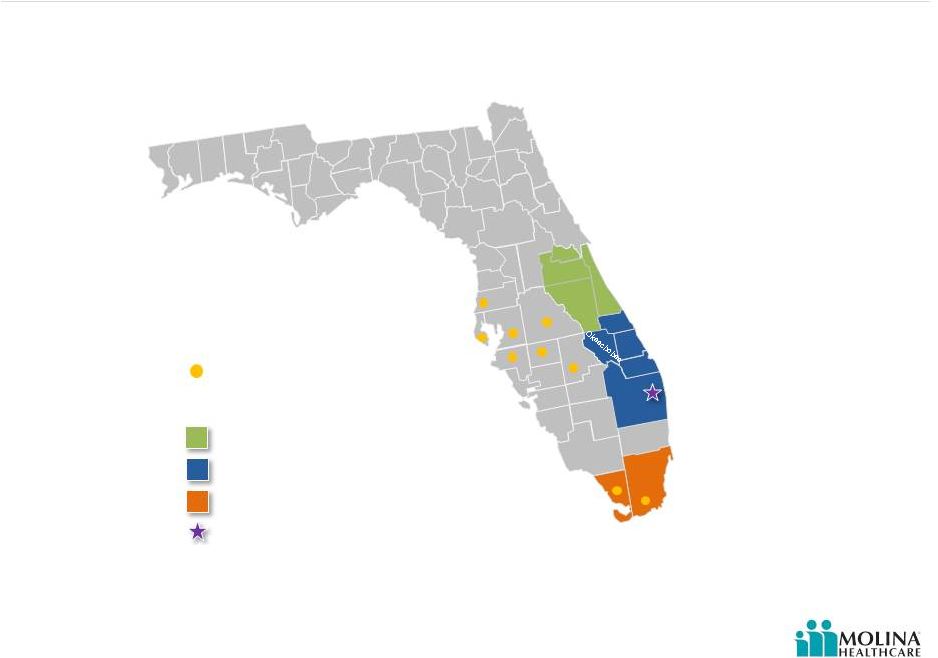
Molina Healthcare of Florida: Service Areas
Yesterday
Pre-Florida Medicaid Managed Care (MMA) and Long Term Care…
Pre-Florida
MMA
Long Term
Care
Service Areas:
Hillsborough
Polk
Osceola
Palm
Beach
Broward
Miami-
Dade
Highlands
Monroe
Seminole
Hardee
Manatee
Pasco
Pinellas |
 ©
2014 Molina Healthcare, Inc.
27
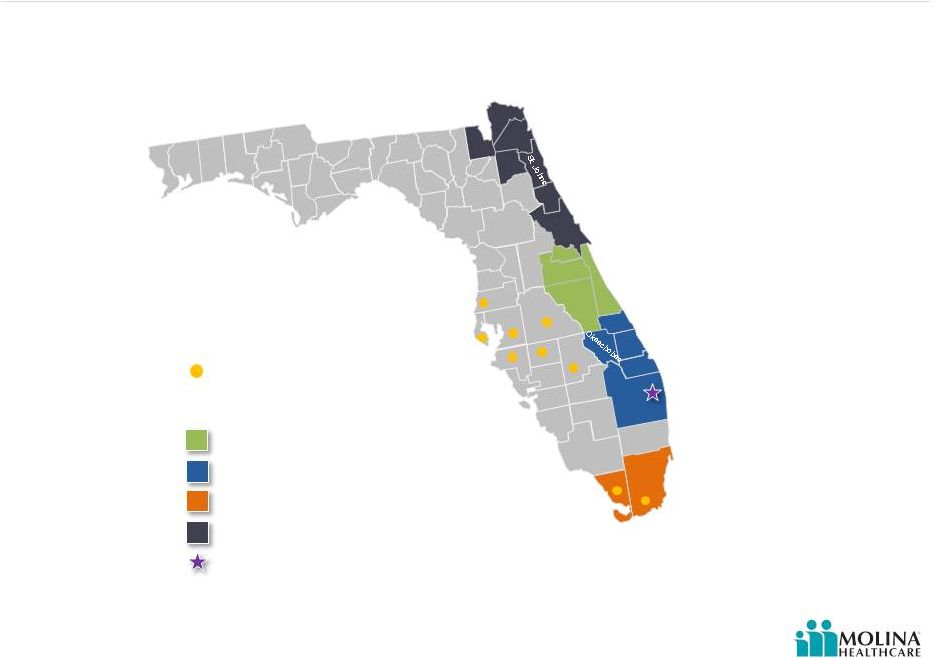
Molina Healthcare of Florida: Service Areas
Long Term Care
Today
Long Term Care, Florida MMA and Healthy Palm Beaches Acquisition…
Service Areas:
Pasco
Hillsborough
Polk
Osceola
Palm
Beach
Miami-
Dade
Pinellas
Manatee
Hardee
Highlands
Monroe
Seminole
Region 7
Region 9
Region 11
Healthy Palm Beaches Asset
Acquisition
1
Florida MMA –
Orange
Brevard
Indian
River
St.
Lucie
Martin
1.
Molina acquired Medicaid assets of Healthy Palm Beaches, with an effective date of August 1, 2014. |
 ©
2014 Molina Healthcare, Inc.
28
Molina Healthcare of Florida: Closed Acquisition
On August 1
st
, Molina acquired Medicaid business
assets of a Florida health plan, Healthy Palm
Beaches
Approximately 11,500 members in Palm Beach
County transferred over effective August 1, 2014
Members transitioned into Molina as part of the
Florida Managed Medical Assistance (MMA) program
implementation |
 ©
2014 Molina Healthcare, Inc.
29
Molina Healthcare of Florida: Service Areas
Long Term Care
Tomorrow
Long Term Care, Florida MMA, and New Acquisitions
1,2
…
Service Areas:
Pasco
Hillsborough
Polk
Osceola
Palm
Beach
Miami-
Dade
Pinellas
Manatee
Hardee
Highlands
Monroe
Seminole
Region 7
Region 9
Region 11
Region 4 (through acquisition)
1
Healthy Palm Beaches Asset
Acquisition
2
Florida MMA –
Orange
Brevard
Nassau
Baker
Duval
Clay
Flage
r
Volusia
Indian
River
St.
Lucie
Martin
1.
New Florida MMA region added through the First Coast Advantage asset acquisition, with an effective
date of December 1, 2014 pending AHCA approval.
2.
Molina acquired Medicaid assets of Healthy Palm Beaches, with an effective date of August 1, 2014. |
 ©
2014 Molina Healthcare, Inc.
30
Molina Healthcare of Florida: Pending Acquisition
On August 8
th
, Molina agreed to acquire certain
assets of a Florida health plan, First Coast Advantage
Approximately 65,500 individuals eligible for transfer
to Molina
Anticipated effective date of December 1, 2014
1
Will assume First Coast Advantage’s Medicaid
contract and certain provider agreements for Region
4 of the Florida MMA program
Region 4 is in Northeast Florida and includes Baker,
Clay, Duval, Flagler, Nassau, St. Johns and Volusia
counties
1.
Pending state approvals and satisfaction or waiver of customary closing
conditions. |
 ©
2014 Molina Healthcare, Inc.
31
Molina Healthcare of Florida: Program Implementations
Region 4
Region 5
Region 6
Region 7
Region 9
Region 9
Region
11
Region 11
Program Type
Florida
MMA
(through
acquisition)
2
Long Term
Care
Long Term
Care
Florida
MMA
Florida
MMA
Florida
MMA
(through
acquisition)
3
Florida
MMA
4
Long Term
Care
4
Implementation
Date
12/1/14
2/1/14
2/1/14
8/1/14
8/1/14
8/1/14
7/1/14
12/1/13
Covered Lives
1
65K
1.6K
1.3K
11K
57K
11.5K
24K
3
3K
1.
Membership is based on August data and rounded to nearest hundred.
2.
New Florida MMA region added through the First Coast Advantage asset acquisition,
with an anticipated effective date of 12/1/14 (pending AHCA approval and satisfaction or waiver of customary closing conditions).
3.
Molina acquired assets of Healthy Palm Beaches in Palm Beach County, with an
effective date of 08/01/14. 4.
In Region 11 there are approximately 1,200 members that are included in both LTC and
MMA. Covered lives and implementation dates |
 ©
2014 Molina Healthcare, Inc.
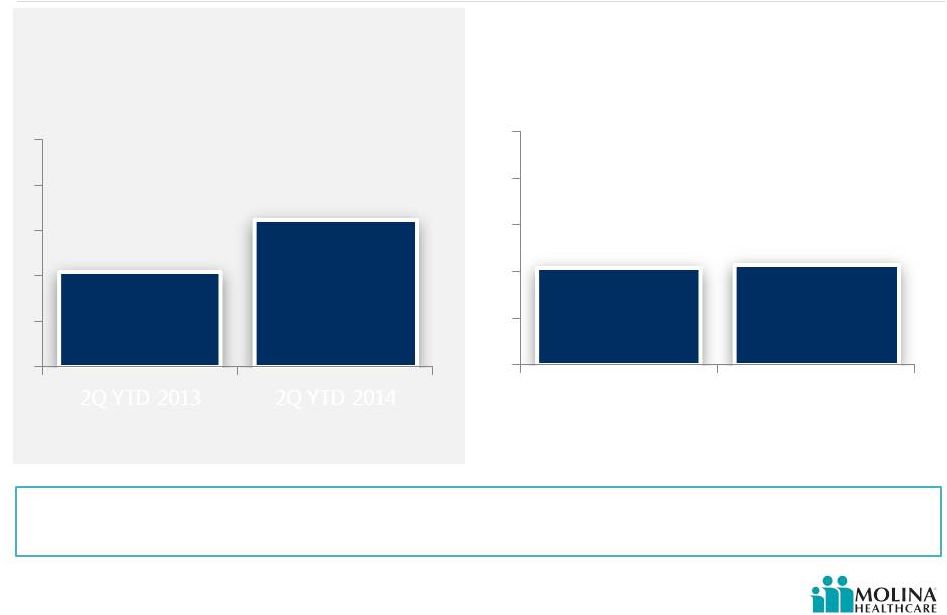
Molina Healthcare of Florida: Medical Care Ratio YoY
Comparison
Same Store MCR remains consistent through first half of 2014.
Higher MCR attributed to new Long Term Care enrollment.
Molina Healthcare of
Florida
Medical Care Ratio
_
Excluding Long Term
Care
Molina Healthcare of
Florida
Medical Care Ratio
_
All Products
84.4%
90.2%
2Q YTD 2013
2Q YTD 2014
84.4%
84.8%
2Q YTD 2013
2Q YTD 2014
32 |
 ©
2014 Molina Healthcare, Inc.
33
Molina Medicare-Medicaid Plan (MMP) Update
Enrollment in MMP demos
15K
1
California opt-out rate
50%
Enrollment tracking with
expectations
33
1.
Enrollment
figure
as
of
September
5
th
,
2014. |
 ©
2014 Molina Healthcare, Inc.
34
MMP Demonstrations –
National View as of June 2014
Over two dozen states submitted applications, with ten states participating in the
MMP demonstration Capitated model –
No
MOU
Capitated Demo –
Started
2014
Capitated Demo –
Starts in
2015
MFFS model –
Started
2014
Withdrawn
CA
NM
OH
IL
AZ
OK
CO
ID
OR
WA
MN
WI
IA
MO
MI
VA
NC
SC
VT
MA
RI
CT
TN
Hybrid Capitated and FFS
model
TX
MFFS model –
No MOU |
 ©
2014 Molina Healthcare, Inc.
35
Molina MMP Footprint
Contracts awarded to MOH
Demonstration is ‘Live’
CA
TX
SC
IL
OH
MI |
 ©
2014 Molina Healthcare, Inc.
36
The MMP Opaque Crystal Ball… |
 ©
2014 Molina Healthcare, Inc.
37
MMP –
Lessons Learned from “Go Live”
Enrollment Files
Lack of common data elements
Contact Centers
Call volume trending lower than expected
Provider and members call to clarify benefits
Average talk time 10 minutes
Contract Management Team (CMT)
Weekly or monthly and vary by state
Includes representatives from CMS and State
Effective way to mange early operational issues
Opportunity to Listen, Learn & Adjust |
 ©
2014 Molina Healthcare, Inc.
38
MMP –
Lessons Learned from “Go Live”
Health Risk Assessments & Initial Care Plans
Member Contact and Engagement
Reaching Members
Opportunity to Listen, Learn & Adjust
Mining claims data, prior auth/referral data
to identify places to find members
Working with providers and pharmacies
Leveraging Community Connectors
Passive enrollment limits opportunity to engage member
Difficult to schedule assessment
Bad phone numbers and addresses
Large numbers and compressed time frames
38 |
 ©
2014 Molina Healthcare, Inc.
39
What Else is New Beyond the 2
nd
Quarter?
Ohio Medicaid expansion
Michigan Medicaid expansion
Illinois new TANF members effective August 2014 |
 ©
2014 Molina Healthcare, Inc.
40
More continuous
eligibility
Chronic illnesses
Behavioral health
More likely to have
greater limitations in
activities of daily living
(ADL)
Require more focused
care including home
care
Caring for the Dual Eligible
Shift from Acute Care company to a Chronic Care company
Two Ends of the Continuum
Duals
TANF
Breaks in eligibility
Episodic care
Pregnancy
Greater ethnic diversity
Larger support system
at clinic visits
1. KFF.org
Under
Age 65
38%
Over
Age 65
62%
Under
Age 65
75%
Over
Age 65
25%
Demographics
1
TANF
ABDs
Duals
TANF
Duals |
 ©
2014 Molina Healthcare, Inc.
41
Shift of Care Model from Inpatient Care to Home-Based
Outpatient Care |
 ©
2014 Molina Healthcare, Inc.
42
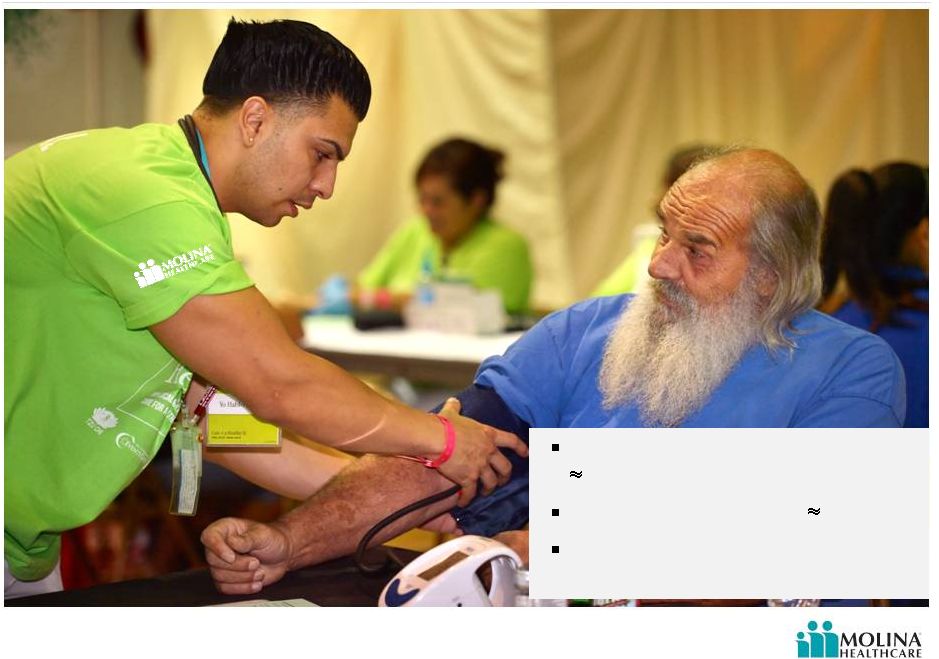
Improving the Member Experience –
Case Study
54 year-old woman,
homeless with behavioral
health issues, unreachable
for health risk assessment.
Image for illustrative purposes only. Not actual patients.
|
 ©
2014 Molina Healthcare, Inc.
43
Improving the Member Experience –
Case Study
Image for illustrative purposes only. Not actual patients.
52 year-old woman, with
COPD, diabetes, high blood
pressure, stroke with
paralysis. |
 ©
2014 Molina Healthcare, Inc.
44
Long Term Services & Supports Continuum of Care
Management Model
LTSS
Medical
Health
Services
Behavioral
Health
Services |
 ©
2014 Molina Healthcare, Inc.
45
Q&A |
 September 18, 2014
New York, New York
Recent Financing Transactions
Joseph White
Chief Accounting Officer |
 ©
2014 Molina Healthcare, Inc.
47
Please refer to the Company’s cautionary statements.
Convertible Note Exchange and Issuance
$301,551,000
September 2014
1.625% Convertible Senior Notes due 2044
Interest payable February 15 and August 15
$302M Convertible Debt ($177M+$125M)
Underlying shares 5.2 million
1.625% coupon
30% conversion premium ($58.09 per share)
No call spread
Net share settlement
Maturity 8/15/2044
Call / put at 8/19/2018
GAAP interest rate 5%
$0.12 diluted EPS (annualized);
$0.05 cash/ $0.07 non-cash diluted EPS |
 ©
2014 Molina Healthcare, Inc.
48
$176.6M of 2044 Notes
2044 Convertible Notes-
Summary of Execution
Please refer to the Company’s cautionary statements.
2014
Convertible
Investors
$187.0M of 2014
Notes
$10.4M Cash
1.8M Shares
1.
$176.6M of the 2014 notes exchanged, maturing in
2044
2.
2014 note holders exchanging their notes for 2044
notes received:
a.
Shares of MOH stock as if they had held the 2014
notes to maturity
b.
Interest payments on the 2014 notes as if they had
held those notes to maturity
3.
Remaining $10.4M of 3.75% convertible notes will
mature on October 1, 2014 as planned
Molina
Healthcare
New
Convertible
Investors
$125M Cash
$125M of 2044 Notes
Interest paid through
2014 note maturity
1.
An additional $125M of 2044 notes were issued to new
investors
Exchange
New Issuance
Molina
Healthcare |
 ©
2014 Molina Healthcare, Inc.
49
MOH Convertible Debt Exchange
2020 Notes
2044 Notes
Principal Amount
$550.0M
$301.6M
Coupon rate
1.125%
1.625%
GAAP Interest rate
6%
5%
Call spread
Yes
No
Contingent interest
No
Yes
Maturity date
1/15/2020
8/15/2044
Settlement
Cash
Net shares
Conversion ratio
24.5277
17.2157
Conversion price
$ 40.77
$ 58.09
High strike
$ 53.85
N/A
Put / call options
No
Yes
–
put
and
call
at
year 4
Conversion premium
32.5% / 75% (high strike)
30%
Basic
terms
summary
–
1.125%
2020
notes
vs.
1.625%
2044
notes
Please refer to the Company’s cautionary statements. |
 ©
2014 Molina Healthcare, Inc.
50
Cost of Capital Comparison
Molina CPDI convertible due 2044
After Tax Cost of Capital
1
1
Assumes a 40% tax rate, $44.68 stock price at issuance.
Convertible vs Straight Debt Break-even
Stock price: $70.60
CAGR: 11.8%
Please refer to the Company’s cautionary statements.
0%
1%
2%
3%
4%
5%
6%
7%
8%
9%
10%
$44.68
$49.35
$54.44
$59.98
$66.02
$72.57
Stock Price
Straight Debt (6.00% coupon area, pre-tax)
CPDI Convertible (1.625% up 30%) |
 ©
2014 Molina Healthcare, Inc.
51
Cost of Capital Comparison
Molina Convertible & Call Spread Due 2020
After Tax Cost of Capital
1
Convertible vs Straight Debt Break-even
Stock price: $62.91
CAGR: 15.4%
1
Assumes a 40% tax rate, $30.77 stock price at issuance.
Please refer to the Company’s cautionary statements.
0%
1%
2%
3%
4%
5%
6%
7%
8%
9%
10%
$30.77
$34.16
$37.54
$40.93
$44.31
$47.70
$51.08
$54.47
$57.86
$61.24
$64.63
Stock Price
1.125% Convertible + Call Spread + 75%
Straight Debt (6.00% coupon area, pre-tax) |
 ©
2014 Molina Healthcare, Inc.
Incremental Interest Impact of New Convert
Interest expense for the 2044 notes exchanged for 2014 notes began accruing
effective 9/5/2014
Interest expense for the additional 2044 notes issued began accruing effect
9/16/2014 Cash
Non-cash
EPS
Please refer to the Company’s cautionary statements.
$0.01
$0.03
3Q
4Q
Annualized
52
$0.1
$0.07
$0.05
Note:
(1) Approximately $1M that had previously been categorized as interest expense in the guidance issued
February, 2014 will be reported as “Other expense” in the Company’s Consolidated Statements of Income
for the quarter ended September 30, 2014. This amount represents interest paid and discount
amortized for the 2014 notes exchanged for the period September 5, 2014 through September 30, 2014. |
 ©
2014 Molina Healthcare, Inc.
53
Estimated Shares Outstanding –
2
nd
half 2014
Bridge from 12/31/2013 to 12/31/2014
(In thousands)
Year ended
12/31/2014
Shares outstanding at the beginning of the period
45,871
Shares issued:
3.75% Senior Notes
1,784
Employee equity incentives and other
945
Subtotal, estimated shares outstanding 12/31/2014
48,600
Adjustments for Weighted Shares Outstanding, Diluted:
Common stock equivalents - employee equity incentives
500
Weighting of shares issued - 3.75% Senior Notes
(160)
Weighting of shares issued - employee equity incentives and other
(440)
Weighted shares outstanding, Diluted (estimate)
48,500
Weighted shares outstanding, Diluted (estimate) - Guidance Issued Feb
2014
47,700
Estimated diluted shares for Q3 2014 EPS
48,700
Estimated diluted shares for Q4 2014 EPS
48,900
|
 ©
2014 Molina Healthcare, Inc.
54
Q&A |
 Financial Discussion
John Molina
Chief Financial Officer
September 18, 2014
New York, New York |
 ©
2014 Molina Healthcare, Inc.
56
Base Rate Update
State
FINAL
Effective Date
Rate Change
Notes
California
Jul-14
+5.5%
Normalized for -3% benefit change
Excludes Medicaid Expansion
1
Florida
Jul-14
NA
MMA New Rates / Regions
Illinois
Jul-14
+2.5%
Michigan
Oct-14
-2.5% to +3.5%
Rate Ranges (Low / High)
New Mexico
Jul-14
+0.0%
Normalized for +6% fee schedule &
benefit changes
Ohio
Jan-14
+2.0%
Excludes new product and benefit
expansions and risk adjustment
South Carolina
Jul-14
+1.5%
Texas
Sep-14
+0.5%
Utah
Jul-14
+0.0%
Washington
Jan-14
+0.0%
Wisconsin
Jan-14
+1.0%
Excludes new product and benefit
expansions
1.
Medicaid Expansion rates will be adjusted retroactively back to 7/1/2014 (CA) and
1/1/2014 (WA). Excludes new product and benefit
expansions; net of fee schedule
adjustments; excludes risk adjustment
1 |
 WA
Overpayment and Member Assignment Settlements September 2014
Item
1
-
Molina
agrees
to
pay
$19M
to
the
state
to
adjust premiums for two rate-related issues for the
period 7/1/2012 to 12/31/2013
Item 2 -
State agrees to pay Molina $8M to adjust
premiums for member assignment issues for the
period 7/1/2012 –
12/31/2013
Two separate one-time items to be
recorded in the 3
quarter of 2014;
reducing pre-tax income by
approximately $11M
Amounts are not included in guidance
issued February 2014
Both matters had been resolved
previously on a go-forward basis
effective January 1, 2014
No impact on premiums or
membership related to January 1,
2014 and later
57
©
2014 Molina Healthcare, Inc.
rd |
 Total Health Insurer Fee (HIF) on Medicaid
revenue
approximately
$80M
due
September
30th,
2014
Lack of tax deductibility requires revenue of $130M
Contractual agreements in hand representing
approximately 50% of required revenue
Payment has not yet been received from any state
Health Insurer Fee (HIF) Reimbursement Update
Please refer to the Company’s cautionary statements.
58
©
2014 Molina Healthcare, Inc. |
 ©
2014 Molina Healthcare, Inc.
59
Texas Quality Revenue
$35M of 2014 revenue based on quality measures
Many quality measures are new this year
Calculation of performance is complex and subject
to interpretation
State has not released its calculation of 2013
performance
Molina will compare its 2013 calculations to those
released by state and adjust its 2014 calculations
accordingly
If Molina’s 2014 calculations support achievement
of the measurements, revenue will be recorded |
 ©
2014 Molina Healthcare, Inc.
60
What Admin Leverage May Do for MOH in Q3 and Q4 of 2014
G&A Expense
1
Note(s):
1.
G&A ratio computed as a percentage of total revenue.
2.
Constitutes forward-looking guidance. Amounts are estimates and subject to
change. Actual results may differ materially. See our risk factors as discussed in our Form 10-K and other periodic filings.
2014 Guidance G&A
Ratio
1H14
2H14
2
Total revenue
$4.4B
$5.5B
G&A expenses
$381M
$430M
G&A ratio
8.7%
7.7%
2
nd
half admin at 1
st
half G&A ratio
$480M
2
nd
half admin at projected G&A
ratio
$430M
2
nd
half benefit from lower ratio
$50M
Guidance
Actual
1Q14
8.9%
9.1%
2Q14
8.6%
8.4%
3Q14
7.9%
-
4Q14
7.5%
-
Please refer to the Company’s cautionary statements. |
 61
©
2014 Molina Healthcare, Inc.
Delays in Revenue Recognition Distort Normal
Seasonality
Please refer to the Company’s cautionary statements.
Q2 YTD reported Adjusted EPS
$1.35
+ HIF revenue we haven’t recognized
$0.29
+ TX Quality Revenue we haven’t recognized
$0.12
Total YTD Adjusted EPS with HIF and TX
Quality Revenue add-backs
$1.76
Adjusted Net Income Per Diluted Share, Continuing
Operations, with Health Insurer Fee (HIF) and TX Quality
Revenue Reimbursement Add-Backs
Note(s):
1.
See Appendix for reconciliation of adjusted net income per diluted share, continuing
operations, to GAAP net income per diluted share, continuing operations.
1 |
 ©
2014 Molina Healthcare, Inc.
62
Delayed recognition of the Health Insurer
Fee (HIF) reimbursement may reduce
third quarter GAAP & Adjusted EPS by
(~$0.14)
Substantial uncertainty around Q3 results
Delays in recognition of Texas quality
revenue may reduce third quarter GAAP
& Adjusted EPS by (~$0.06)
Expected Financial Performance –
Q3 2014 vs. Q4 2014
Delays in revenue recognition may continue
$0.00
$0.00
($0.14)
($0.43)
Q3
Q3 YTD
($0.06)
($0.18)
Q3
Q3 YTD |
 ©
2014 Molina Healthcare, Inc.
63
Excludes
2014 Guidance –
What’s In and What’s Out
Includes
Full Reimbursement of ACA Health Insurer Fee (HIF)
Full Reimbursement of TX Quality Revenue
Increased dilution from convertible debt due to higher than anticipated share
price
Washington settlements and other agreements on contractual disputes
Higher interest expense due to the issuance of 2044 convertible notes
Sovaldi
Please refer to the Company’s cautionary statements. |
 ©
2014 Molina Healthcare, Inc.
64
Levers for Improved Profitability
Please refer to the Company’s cautionary statements.
Rate increases that reach the mid-point of actuarial ranges
Rates that adequately compensate health plans for new drugs/ new procedures /
new technologies
More cost effective delivery of medical care and other member services through
care coordination
Administrative cost leverage
Reimbursement of the Health Insurer Fee (HIF)
Ability
of
health
plans
to
share
in
the
savings
they
generate
–
fair
sharing
of
profits
AND losses through caps and floors on medical care costs
|
 ©
2014 Molina Healthcare, Inc.
65
Please refer to the Company’s cautionary statements.
Convertible Note Exchange and Issuance Update
$301,551,000
September 2014
1.625% Convertible Senior Notes due 2044
Interest payable February 15 and August 15
$302M Convertible Debt ($177M+$125M)
Underlying shares 5.2 million
1.625% coupon
30% conversion premium ($58.09 per share)
No call spread
Net share settlement
Maturity 8/15/2044
Call / put at 8/19/2018
GAAP interest rate 5%
$0.12 diluted EPS (annualized);
$0.05 cash/ $0.07 non-cash diluted EPS |
 ©
2014 Molina Healthcare, Inc.
66
Capital and Revenue Capacity
Estimated Net Worth Revenue Capacity
12/31/14
Parent Cash
$0.4B
Excess Net
Worth (Plans)
$0.2B
Required Net
Worth (Plans)
$0.6B
Expected
Revenue
$9.7B
Excess
Revenue
Capacity
(Plans) $3.3B
Excess
Revenue
Capacity
(Parent)
$5.0B
Caveats:
Regulators may require
maintenance of net worth in
excess of minimum
requirements
Capital demands on health plans
in the event of losses
Costs of acquisitions and other
expansions
Costs of MMS implementations
in new and existing states
Costs of infrastructure
$1.2B
$18.0B
12/31/14
1.
Based upon minimum required net worth. Regulators may require maintenance of net
worth in excess of minimum requirements. Please refer to the Company’s cautionary
statements. 1 |
 ©
2014 Molina Healthcare, Inc.
67
Q&A |
 ©
2014 Molina Healthcare, Inc.
68
Appendix |
 ©
2014 Molina Healthcare, Inc.
69
Glossary of Long Term Care Terminology
Long Term Care Services & Supports
(LTSS)
Refers to services and supports that assist
individuals with performing activities of daily living and
instrumental activities of daily living. These range from
providing assistance with eating, dressing, and toileting, to
assisting with managing a home and medication
management.
Home and Community-Based Services
(HCBS)
Refers to a range of services that help the individual to live
independently, outside of an institutional setting, including
adult day care and services, respite care, homemaker
services, training in activities of daily living skills,
transportation, provision of equipment, and group living.
Institutional-Based Care
Refers to care in institutional facilities, such as nursing
homes, licensed by the state that offer 24-hour room and
board, supervision, and nursing care. These serve not only
long-stay residents, but also short-stay residents who
receive rehabilitation or post-hospital recuperation.
|
    ©
2014 Molina Healthcare, Inc.
70
GAAP reconciliation to Adjusted EPS
Please refer to the Company’s cautionary statements.
The following table reconciles net income per diluted share, continuing operations,
to adjusted net income per diluted share, continuing operations, with Health
Insurer Fee (HIF) and Texas Quality Revenue add-backs for six months
ended June 30, 2014. Net income per diluted share, continuing operations
0.26
$
Adjustments, net of tax:
Depreciation, and amortization of capitalized software
0.58
Stock-based compensation
0.19
Amortization of convertible senior notes and
lease financing obligations
0.18
Amortization of intangible assets
0.14
Adjusted net income per diluted share,
continuing operations 1.35
$
Change in fair value of derivatives, net
—
HIF revenue not recognized
0.29
Texas Quality Revenue not recognized
0.12
Adjusted net income per diluted share,
continuing operations with HIF and Texas Quality add-backs
1.76
$
Ended June 30,
2014 |
   ©
2014 Molina Healthcare, Inc.
71
Status of Reimbursement –
ACA Health Insurer Fee
(HIF) in Molina States
Our guidance assumes the HIF and related tax effects will be fully reimbursed in all
states. Note: Constitutes forward-looking guidance. Amounts are estimates
and subject to change. Actual results may differ materially. See our risk factors as discussed in our Form 10-K and other periodic filings.
Numbers may not add up due to rounding
Please refer to the Company’s cautionary statements.
Comments
ACA Fee
Gross Up
Revenue
Revenue
Recognized
06/30/14
California
Health plan has received letter from state committing to reimbursement of fee
and tax impact upon CMS approval. State is collecting information needed
from health plans to process payment.
$7.3M
$4.4M
$11.6M
No
Florida
Contract amendment specifically calls for reimbursement of fee and tax
impact.
$3.6M
$2.2M
$5.8M
Yes
Illinois
Contract amendment specifically calls for reimbursement of fee and tax
impact.
$0.1M
$0.1M
$0.2M
Yes
Michigan
State legislature has appropriated funds for ACA fee and tax reimbursement.
Awaiting supplemental legislation approving reimbursement.
$10.7M
$6.8M
$17.5M
No
New Mexico
Health plan has received letter from state committing to reimbursement of fee
and tax impact upon CMS approval. Mercer is working on approach now.
Molina has shared information with the state.
$7.1M
$4.3M
$11.3M
No
Ohio
Contract specifically calls for reimbursement of fee and tax impact.
$18.2M
$12.2M
$30.4M
Yes
South Carolina
No revenue in 2013; We have contract amendment for reimbursement of fee
and tax impact
$0.0M
$0.0M
$0.0M
No
Texas
Informal support from state Medicaid agency. Molina has shared information as
requested by the state.
$11.8M
$6.7M
$18.5M
No
Utah
State has proposed rates effective July 1, 2014 that partially reimburses Molina
for financial impact of the ACA fee.
$3.3M
$2.0M
$5.3M
No
Washington
Contract specifically calls for reimbursement of fee and tax impact.
$16.1M
$9.2M
$25.2M
Yes
Wisconsin
Contract specifically calls for reimbursement of fee and tax impact. State has
committed to reimbursement by Sept. 26.
$2.9M
$1.9M
$4.8M
Yes
Medicare
Included in bid pricing
$7.7M
$4.5M
$12.2M
Yes
TOTAL FY 2014
$88.6M
$54.3M
$142.9M |