Attached files
| file | filename |
|---|---|
| 8-K - FORM 8-K - PRUDENTIAL FINANCIAL INC | d787423d8k.htm |
 Exhibit
99.1 PRUDENTIAL FINANCIAL, INC. INVESTOR
DAY SEPTEMBER 18,
2014 |
 PRUDENTIAL FINANCIAL, INC.
INVESTOR DAY
ERIC DURANT
SENIOR VICE
PRESIDENT INVESTOR RELATIONS |
 Tokyo
Investor Day 9.18.2014 Tokyo Investor Day 9.18.2014
3
Certain
of
the
statements
included
in
this
presentation
constitute
forward-looking
statements
within
the
meaning
of
the
U.
S.
Private
Securities
Litigation
Reform
Act
of
1995.
Words
such
as
“expects,”
“believes,”
“anticipates,”
“includes,”
“plans,”
“assumes,”
“estimates,”
“projects,”
“intends,”
“should,”
“will,”
“shall”
or
variations
of
such
words
are
generally
part
of
forward-looking
statements.
Forward-looking
statements
are
made
based
on
management’s
current
expectations
and
beliefs
concerning
future
developments
and
their
potential
effects
upon
Prudential
Financial,
Inc.
and
its
subsidiaries.
There
can
be
no
assurance
that
future
developments
affecting
Prudential
Financial,
Inc.
and
its
subsidiaries
will
be
those
anticipated
by
management.
These
forward-looking
statements
are
not
a
guarantee
of
future
performance
and
involve
risks
and
uncertainties,
and
there
are
certain
important
factors
that
could
cause
actual
results
to
differ,
possibly
materially,
from
expectations
or
estimates
reflected
in
such
forward-looking
statements,
including,
among
others:
(1)
general
economic,
market
and
political
conditions,
including
the
performance
and
fluctuations
of
fixed
income,
equity,
real
estate
and
other
financial
markets;
(2)
the
availability
and
cost
of
additional
debt
or
equity
capital
or
external
financing
for
our
operations;
(3)
interest
rate
fluctuations
or
prolonged
periods
of
low
interest
rates;
(4)
the
degree
to
which
we
choose
not
to
hedge
risks,
or
the
potential
ineffectiveness
or
insufficiency
of
hedging
or
risk
management
strategies
we
do
implement,
with
regard
to
variable
annuity
or
other
product
guarantees;
(5)
any
inability
to
access
our
credit
facilities;
(6)
reestimates
of
our
reserves
for
future
policy
benefits
and
claims;
(7)
differences
between
actual
experience
regarding
mortality,
longevity,
morbidity,
persistency,
surrender
experience,
interest
rates
or
market
returns
and
the
assumptions
we
use
in
pricing
our
products,
establishing
liabilities
and
reserves
or
for
other
purposes;
(8)
changes
in
our
assumptions
related
to
deferred
policy
acquisition
costs,
value
of
business
acquired
or
goodwill;
(9)
changes
in
assumptions
for
retirement
expense;
(10)
changes
in
our
financial
strength
or
credit
ratings;
(11)
statutory
reserve
requirements
associated
with
term
and
universal
life
insurance
policies
under
Regulation
XXX
and
Guideline
AXXX;
(12)
investment
losses,
defaults
and
counterparty
non-performance;
(13)
competition
in
our
product
lines
and
for
personnel;
(14)
difficulties
in
marketing
and
distributing
products
through
current
or
future
distribution
channels;
(15)
changes
in
tax
law;
(16)
economic,
political,
currency
and
other
risks
relating
to
our
international
operations;
(17)
fluctuations
in
foreign
currency
exchange
rates
and
foreign
securities
markets;
(18)
regulatory
or
legislative
changes,
including
the
Dodd-Frank
Wall
Street
Reform
and
Consumer
Protection
Act;
(19)
inability
to
protect
our
intellectual
property
rights
or
claims
of
infringement
of
the
intellectual
property
rights
of
others;
(20)
adverse
determinations
in
litigation
or
regulatory
matters
and
our
exposure
to
contingent
liabilities,
including
in
connection
with
our
divestiture
or
winding
down
of
businesses;
(21)
domestic
or
international
military
actions,
natural
or
man-made
disasters
including
terrorist
activities
or
pandemic
disease,
or
other
events
resulting
in
catastrophic
loss
of
life;
(22)
ineffectiveness
of
risk
management
policies
and
procedures
in
identifying,
monitoring
and
managing
risks;
(23)
effects
of
acquisitions,
divestitures
and
restructurings,
including
possible
difficulties
in
integrating
and
realizing
projected
results
of
acquisitions;
(24)
interruption
in
telecommunication,
information
technology
or
other
operational
systems
or
failure
to
maintain
the
security,
confidentiality
or
privacy
of
sensitive
data
on
such
systems;
(25)
changes
in
statutory
or
U.S.
GAAP
accounting
principles,
practices
or
policies;
(26)
Prudential
Financial,
Inc.’s
primary
reliance,
as
a
holding
company,
on
dividends
or
distributions
from
its
subsidiaries
to
meet
debt
payment
obligations
and
the
ability
of
the
subsidiaries
to
pay
such
dividends
or
distributions
in
light
of
our
ratings
objectives
and/or
applicable
regulatory
restrictions;
and
(27)
risks
due
to
the
lack
of
legal
separation
between
our
Financial
Services
Businesses
and
our
Closed
Block
Business.
Prudential
Financial,
Inc.
does
not
intend,
and
is
under
no
obligation,
to
update
any
particular
forward-looking
statement
included
in
this
presentation.
See
“Risk
Factors”
included
in
Prudential
Financial,
Inc.’s
Annual
Report
on
Form
10-K
for
discussion
of
certain
risks
relating
to
our
businesses
and
investment
in
our
securities.
_______________________________________________________________________________
Prudential
Financial,
Inc.
of
the
United
States
is
not
affiliated
with
Prudential
PLC
which
is
headquartered
in
the
United
Kingdom.
FORWARD-LOOKING
STATEMENTS |
 Tokyo
Investor Day 9.18.2014 4
This
presentation
includes
references
to
“adjusted
operating
income.”
Adjusted
operating
income
is
a
non-GAAP
measure
of
performance
of
our
Financial
Services
Businesses.
Adjusted
operating
income
excludes
“Realized
investment
gains
(losses),
net,”
as
adjusted,
and
related
charges
and
adjustments.
A
significant
element
of
realized
investment
gains
and
losses
are
impairments
and
credit-related
and
interest
rate-related
gains
and
losses.
Impairments
and
losses
from
sales
of
credit-impaired
securities,
the
timing
of
which
depends
largely
on
market
credit
cycles,
can
vary
considerably
across
periods.
The
timing
of
other
sales
that
would
result
in
gains
or
losses,
such
as
interest
rate-related
gains
or
losses,
is
largely
subject
to
our
discretion
and
influenced
by
market
opportunities
as
well
as
our
tax
and
capital
profile.
Realized
investment
gains
(losses)
within
certain
of
our
businesses
for
which
such
gains
(losses)
are
a
principal
source
of
earnings,
and
those
associated
with
terminating
hedges
of
foreign
currency
earnings
and
current
period
yield
adjustments
are
included
in
adjusted
operating
income.
Adjusted
operating
income
excludes
realized
investment
gains
and
losses
from
products
that
contain
embedded
derivatives,
and
from
associated
derivative
portfolios
that
are
part
of
a
hedging
program
related
to
the
risk
of
those
products.
Adjusted
operating
income
also
excludes
gains
and
losses
from
changes
in
value
of
certain
assets
and
liabilities
relating
to
foreign
currency
exchange
movements
that
have
been
economically
hedged
or
considered
part
of
our
capital
funding
strategies
for
our
international
subsidiaries,
as
well
as
gains
and
losses
on
certain
investments
that
are
classified
as
other
trading
account
assets.
Adjusted
operating
income
also
excludes
investment
gains
and
losses
on
trading
account
assets
supporting
insurance
liabilities
and
changes
in
experience-rated
contractholder
liabilities
due
to
asset
value
changes,
because
these
recorded
changes
in
asset
and
liability
values
are
expected
to
ultimately
accrue
to
contractholders.
Trends
in
the
underlying
profitability
of
our
businesses
can
be
more
clearly
identified
without
the
fluctuating
effects
of
these
transactions.
In
addition,
adjusted
operating
income
excludes
the
results
of
divested
businesses,
which
are
not
relevant
to
our
ongoing
operations.
Discontinued
operations,
which
is
presented
as
a
separate
component
of
net
income
under
GAAP,
is
also
excluded
from
adjusted
operating
income.
We
believe
that
the
presentation
of
adjusted
operating
income
as
we
measure
it
for
management
purposes
enhances
understanding
of
the
results
of
operations
of
the
Financial
Services
Businesses
by
highlighting
the
results
from
ongoing
operations
and
the
underlying
profitability
of
our
businesses.
However,
adjusted
operating
income
is
not
a
substitute
for
income
determined
in
accordance
with
GAAP,
and
the
adjustments
made
to
derive
adjusted
operating
income
are
important
to
an
understanding
of
our
overall
results
of
operations.
The
schedules
on
the
following
pages
provide
a
reconciliation
of
adjusted
operating
income
for
the
Financial
Services
Businesses
to
income
from
continuing
operations
in
accordance
with
GAAP.
The
information
referred
to
above,
as
well
as
the
risks
of
our
businesses
described
in
our
Annual
Report
on
Form
10-K
for
the
year
ended
December
31,
2013,
and
subsequent
Quarterly
Reports
on
Form
10-Q
should
be
considered
by
readers
when
reviewing
forward-looking
statements
contained
in
this
presentation.
Additional
historical
information
relating
to
our
financial
performance
is
located
on
our
Web
site
at
www.investor.prudential.com. NON–GAAP MEASURES |
 Tokyo
Investor Day 9.18.2014 RECONCILIATION FOR INTERNATIONAL INSURANCE PRE-TAX ADJUSTED
1)
As disclosed in company earnings releases.
2)
Includes refinements of reserves and amortization of deferred policy acquisition
and other costs. 3)
Represents
one
time
gains
on
a
joint
venture
investment
(2007),
gain
on
sale
of
a
branch
office
(2008)
and
initial
surrenders
of
policies
following
the
restructuring
of
the
acquired
Yamato
Life
business
(2009).
5
OPERATING INCOME EXCLUDING MARKET DRIVEN AND DISCRETE ITEMS
(1) |
 CHARLES LOWREY
EXECUTIVE VICE
PRESIDENT AND CHIEF OPERATING OFFICER
INTERNATIONAL BUSINESSES
2014 TOKYO INVESTOR
DAY PRUDENTIAL INTERNATIONAL INSURANCE |
 •
Captive distribution provides sustainable competitive advantage
•
Emphasis on needs-based sales of protection products
•
Expansion through diversification and agent growth
•
Successful track record of acquisitions and business integrations
•
Solid risk management
•
Strong regulatory ratios and conservatively managed balance sheet
•
Sustained capital generation and deployment
2
Tokyo Investor Day 9.18.2014
Proven, superior business model drives
Proven, superior business model drives
sustainable strong results and returns
sustainable strong results and returns
High ROE
High ROE
(1)
(1)
and low volatility earnings primarily driven
and low volatility earnings primarily driven
by stable mortality and expense margins
by stable mortality and expense margins
1)
Return on Equity (ROE).
PRUDENTIAL INTERNATIONAL INSURANCE |
 •
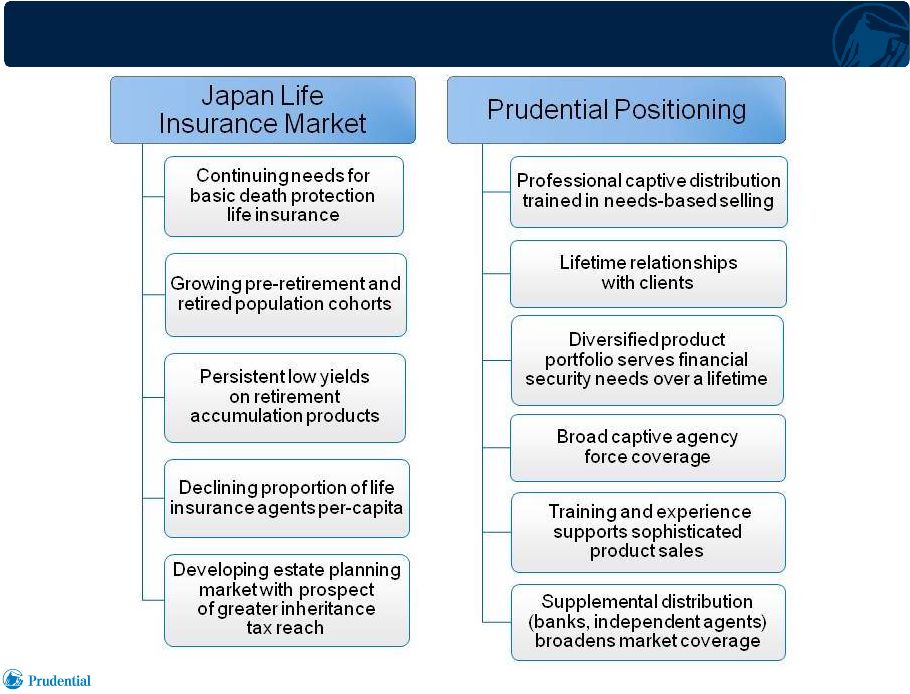
Leading position in highly attractive Japanese insurance market
•
Captive distribution serving lifetime financial security needs:
excellent fit for Japan’s demographic trend
•
Supplemental third party channels
•
Optimistic about Prudential’s opportunities in Japanese life
insurance market
•
Profitability and returns are sustainable
3
Tokyo Investor Day 9.18.2014
Solid prospects driven by strategy and positioning
Solid prospects driven by strategy and positioning
PRUDENTIAL INTERNATIONAL INSURANCE |
 4
•
Began in 1988
•
Differentiated approach for the Japanese life insurance market
•
Proprietary distribution through selective, high-quality sales force
•
Emphasize protection products requiring analysis of client needs
•
Target the affluent and mass affluent consumer; serve small business
and professional markets
Tokyo Investor Day 9.18.2014
THE LIFE PLANNER
MODEL FOUNDATION OF OUR SUCCESS |
 5
•
Life Consultants
(1)
expand proprietary distribution coverage
to middle-market customers, and have strong affinity
group relationships
•
Supplemental distribution through banks and independent agents
expands access to investable wealth, business market and
demographic cohorts
•
Product diversification to meet clients’
financial security needs
over a lifetime
•
Pursue opportunities in limited number of attractive countries
outside Japan
Maintain Discipline, Quality, Solid Execution;
Guided by Life Planner Business Model Concepts
1)
The formal name for Life Consultant is Life Plan Consultant.
Tokyo Investor Day 9.18.2014
EXPANSION THROUGH
DIVERSIFICATION |
 6
Timeline
Timeline
Acquisitions
Acquisitions
2001
•
Kyoei Life, Japan –
acquired in bankruptcy
•
Predecessor of today’s Gibraltar Life
2004
•
Aoba Life, Japan
•
Integrated into Prudential of Japan
2009
•
Yamato Life, Japan
•
Integrated into Gibraltar Life
2011
•
AIG Star Life & AIG Edison Life, Japan
•
Merged into Gibraltar Life in 2012
1)
Japan only.
2)
Foreign
denominated
activity
translated
to
U.S.
dollars
at
uniform
exchange
rates
for
all
periods
presented;
Japanese
yen
82
per
U.S.
dollar.
U.S.
dollar
denominated
activity
is
included
based
on
the
amounts
as
transacted
in
U.S.
dollars.
Tokyo Investor Day 9.18.2014
SUCCESSFUL TRACK RECORD
OF ACQUISITIONS AND BUSINESS
INTEGRATIONS Number of In Force
Policies
(1)
Annualized New
Business Premiums
(1),(2) |
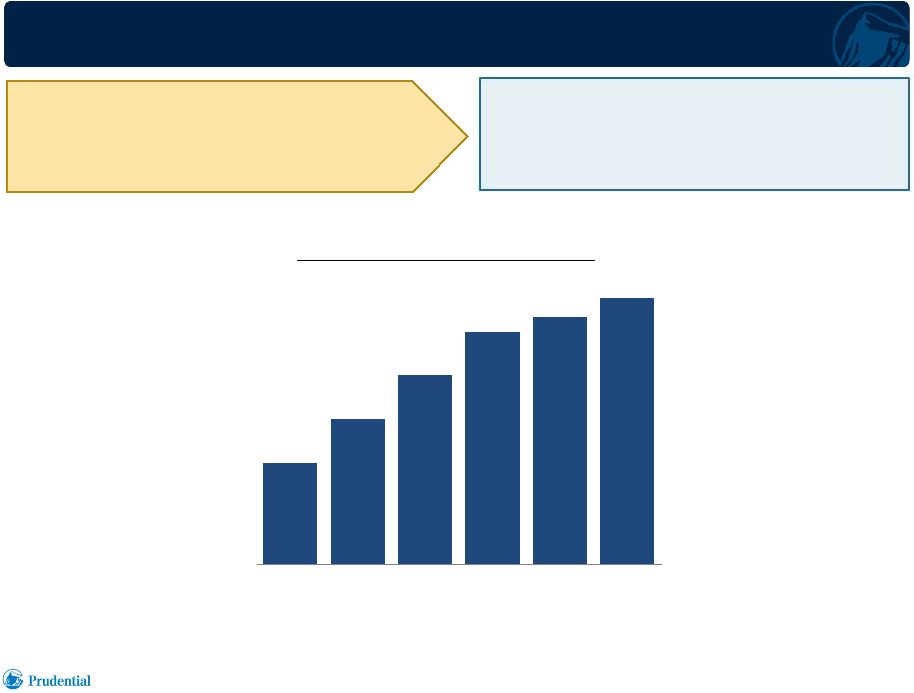 21
30
39
48
51
55
1980
1990
2000
2010
2020
2030
Japanese
Population
55
and
Over
(1)
JAPAN DEMOGRAPHIC CHANGE
DRIVES GROWTH
OPPORTUNITIES FOR PRUDENTIAL
7
1)
In millions; population data for 1980, 1990, 2000 and 2010 from Japan Statistics
Bureau; estimated population in 2020 and 2030 from National Institute of
Population and Social Security Research.
Tokyo Investor Day 9.18.2014
•
Retirement income needs
•
Healthcare needs
•
Inheritance needs
We have an experienced agent force
poised for steady growth that can help
customers meet their evolving needs |
 OPPORTUNITIES AND CHALLENGES
8
Opportunities Suited to
Prudential Strengths
•
Continued robust death protection
market
•
Japanese demographic trends lead
to growing retirement needs
•
Potentially significant Japanese
estate planning market
•
Persistent low yields on investments
available to Japanese retirement-
minded consumers contribute to
attraction of life insurance based
solutions
•
Product purchases with significant
wealth commitment require
sophisticated sales capabilities,
strong brand and reputation
Challenges
•
Changing currency translation rates,
managed by hedging programs
•
Expected gradual attrition of large
acquired blocks of business partly
offsets business growth
•
Potentially moderating pace of
policy size increases
•
Selectivity limits growth of Life
Planner force
Tokyo Investor Day 9.18.2014 |
 JAPANESE INSURANCE OPERATIONS
MITSUO
KURASHIGE
CHIEF EXECUTIVE
OFFICER JAPAN LIFE INSURANCE OPERATIONS |
 JAPANESE INSURANCE
MARKET
REMAINS
HIGHLY
ATTRACTIVE
FOR
PRUDENTIAL
2
Tokyo Investor Day 9.18.2014
Market Context
Market Context
Market Size
•
World’s second largest life insurance market:
Life premiums $423 billion
(1)
Household
Wealth
•
Household sector wealth ¥1,630 trillion ($15.8 trillion)
(2)
Investable
Asset Pool
•
¥864 trillion ($8.3 trillion) household pool of currency and deposits is
among the world’s largest
(2)
Retirement
Market
•
Expanding retirement market driven by aging population, increased
emphasis on individual responsibility for financial security
Product
Trend
•
Customers prefer insurance products to equities for savings
and investments
Distribution
Trend
•
Growing distribution opportunities include banks and independent
distributors
1)
Source: Swiss Re -
World Insurance in 2013, based on 2013 life insurance premiums.
2)
Based on March 31, 2014 data; Sources: Bank of Japan, Oanda. Japanese yen
translated to U.S. dollars at spot currency exchange rate as of March 31, 2014
(103 yen per USD). |
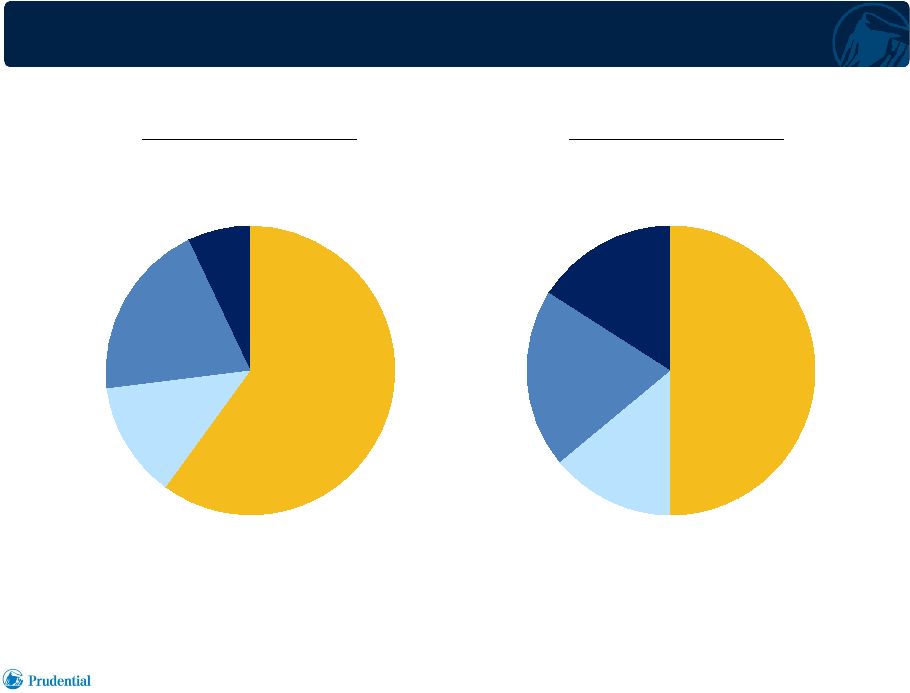
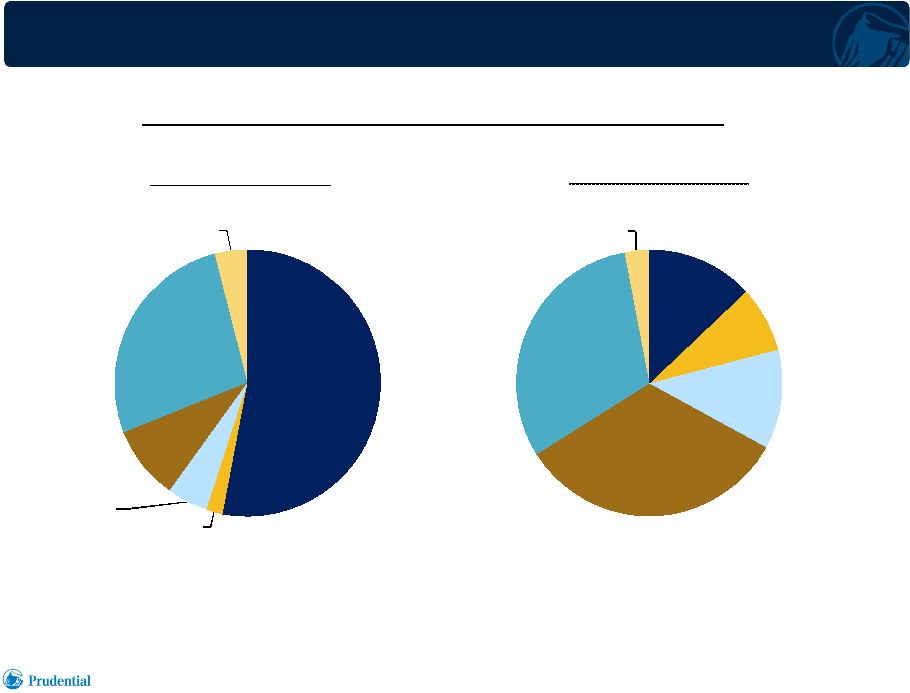 HOUSEHOLD SECTOR FINANCIAL ASSETS –
JAPAN AND THE UNITED
STATES Financial Assets of Japanese and U.S.
Households (1)
Japan
$15.8 Trillion
(2)
United States
$67.2 Trillion
1)
Sources: Japan: Bank of Japan (data as of March 31, 2014). U.S.:
Federal Reserve Statistical Release, Financial Accounts of the United States,
First Quarter 2014.
2)
Translated to U.S. dollars at spot currency exchange rate as of March 31, 2014
(Japanese yen 103 per U.S. dollar). 3
Tokyo Investor Day 9.18.2014
Currency and
deposits
53%
Bonds
2%
Investments
Trusts
5%
Equities
9%
Insurance and
Pension
Reserves
27%
Other
4%
Currency
and
deposits
13%
Bonds
8%
Investments
Trusts
12%
Equities
33%
Insurance
and Pension
Reserves
31%
Other
3% |
 4
Tokyo Investor Day 9.18.2014
•
Japan is the second largest market in the world
•
Southeast Asia is growing fast, but the market size is still small (< 2% of
world) 2013 Life Insurance Premiums
(1)
($ billions)
1)
Source: Swiss Re. Based on 2013 life insurance premium volume, foreign denominated
activity translated to U.S. dollars at average exchange rates for
2013. World total life insurance premiums are $2,608 billion. This chart is
not inclusive of the remainder of Europe, Africa, Oceania and Canada. $533
$423
$80
$223
$160
$118
United States
Japan
Asia ex-
Japan
Latin
America
United
Kingdom
France
Italy
China
Korea
Taiwan
India
SE Asia
Other
$476
ATTRACTIVE MARKET FOR
PRUDENTIAL |
   5
1)
Source: Company data published on individual company websites. Industry /
market share data excludes Japan Post Insurance. Twelve months ended March
31, 2014. 2)
Prudential’s premium income amount was adjusted down for internal reinsurance
transactions. •
New business face amount
•
Annualized new business premiums
•
In force face amount
•
Premium income
(2)
•
Total assets
Ranking Category
Rank
(1)
Prudential is a leading life insurer in Japan
10.3%
7.8%
7.5%
6.9%
5.3%
#3
#5
#5
#5
#5
Market Share
(1)
Tokyo Investor Day 9.18.2014
LEADING POSITION IN
ATTRACTIVE MARKET |
 6
Tokyo Investor Day 9.18.2014
WELL POSITIONED TO
GROW IN EVOLVING JAPANESE MARKET |
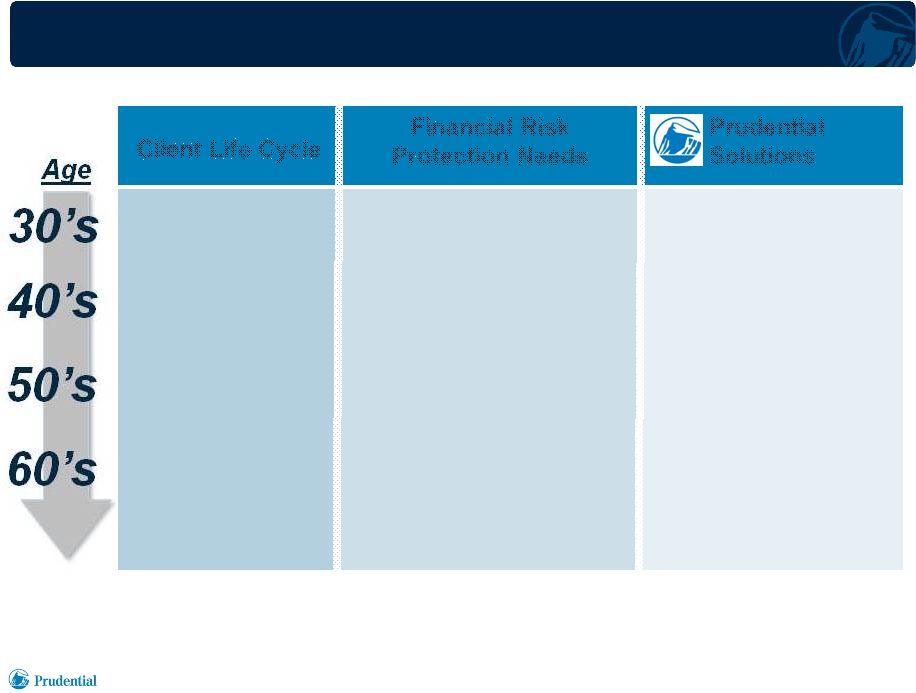 NEEDS-BASED SELLING OVER CUSTOMER’S LIFE CYCLE 7
Note: Specific needs and solutions will vary by customer.
Client
Life Cycle
Financial Risk
Protection Needs
Prudential
Solutions
Young household,
early professional
career
Mid career,
pre-retirement
Retirement
•
Premature death
income replacement
•
Income loss and expenses
due to accident or sickness
•
Accumulation of funds
for retirement
•
Lifetime retirement
income
•
Term insurance
•
Accident and health
policies and riders
•
Whole life insurance
•
Life insurance based
retirement income
products
Tokyo Investor Day 9.18.2014 |
 8
Tokyo Investor Day 9.18.2014
Client Need
Client Need
Product Class
Product Class
Key Features
Key Features
Lower premium
premature death
protection
Term Insurance
•
Death protection for stated period
with level premiums
•
Optional third-sector protection riders
•
“Family Income”: protection declines as
income earning years elapse
Death protection
with savings feature
Whole Life
•
Death protection
•
Embedded savings fund
•
Guaranteed crediting rate
•
Optional third-sector protection riders
Retirement
accumulation
and income
Retirement
•
Death protection in working years
•
Retirement accumulation fund
•
Policy paid-up at retirement age
•
Annuitization options
•
Optional third-sector protection riders
PRODUCT PORTFOLIO: HOW
CUSTOMER NEEDS ARE MET |
   Death
Protection
46%
Accident &
Health
14%
Retirement
27%
Savings
13%
Death
Protection
52%
Accident &
Health
Retirement
22%
Savings
19%
9
1)
In millions; for years ended December 31; Japan only.
2)
Foreign
denominated
activity
translated
to
U.S.
dollars
at
uniform
exchange
rates
for
all
periods
presented;
Japanese
yen
82
per
U.S.
dollar.
3)
Includes annuities and yen based bank channel single premium whole life
(SPWL). 2013 Annualized
New
Business
Premiums
$2,773
Tokyo Investor Day 9.18.2014
2009 Annualized
New
Business
Premiums
$1,252
(3)
(3)
Bank
SPWL
7%
(1),(2)
(1),(2)
EMPHASIS ON PROTECTION
PRODUCTS |
 Death
Protection
50%
Accident
& Health
14%
Retirement
20%
Savings
16%
10
1)
In millions; as of December 31. Annualized premiums in force, including
paid-up policies and 10% of single premium. Japan only. 2)
Foreign
denominated
activity
translated
to
U.S.
dollars
at
uniform
exchange
rates
for
all
periods
presented;
Japanese
yen
82
per
U.S.
dollar.
3)
Includes annuities and yen based bank channel single premium whole life.
2009
Premiums
In
Force
$9,902
Tokyo Investor Day 9.18.2014
2013
Premiums
In
Force
$15,911
Death
Protection
60%
Accident &
Health
13%
Retirement
20%
Savings
7%
(3)
(3)
(1),(2)
(1),(2)
EMPHASIS ON PROTECTION
PRODUCTS |
 1980
1990
2000
2010
2020
2030
117
124
127
128
124
117
Japanese Population 55 and over
17.7%
11
Tokyo Investor Day 9.18.2014
1)
Population
data
for
1980,
1990,
2000,
and
2010
from
Japan
Statistics
Bureau;
estimated
population
in
2020
and
2030
from
National
Institute
of
Population
and
Social Security Research.
Total Population
Total Population
(in millions)
(in millions)
23.8%
30.4%
37.4%
41.3%
46.7%
(1)
GROWING RETIREMENT
OPPORTUNITY COMPLEMENTS DEATH PROTECTION MARKET |
 45%
50%
55%
30%
35%
40%
45%
50%
55%
60%
¥200m -
¥300m
¥300m -
¥600m
Over ¥600m
12
Tokyo Investor Day 9.18.2014
Reduced Basic Exemptions
Higher Inheritance Tax Rates
January
January
2015
2015
inheritance
inheritance
tax
tax
change
change
expected
expected
to
to
expand
expand
tax
tax
reach
reach
to
to
approximately
approximately
20%
20%
of
of
urban
urban
population,
population,
from
from
current
current
national
national
average
average
of
of
about
about
5%
5%
•
Death protection coverage to fund inheritance tax
payment, with benefit amount targeted to expected tax
•
Lifetime gifting through recurring premiums can reduce
estate subject to tax
•
Beneficiary designations can facilitate estate division
•
Needs-based selling opportunity
Prudential Solution:
Recurring Premium
Whole Life
DEVELOPING ESTATE PLANNING
MARKET IN JAPAN |
 13
Tokyo Investor Day 9.18.2014
•
Affluent and mass
affluent consumers
•
Business and
professional market
•
Mass middle-market
•
Affinity group relationships
•
Bank clients with investable
wealth, under-served
protection needs
•
Business and
professional market
Life Planners
Life Planners
Life
Life
Consultants
Consultants
Bank
Bank
Channel
Channel
Independent
Independent
Agency
Agency
Channel
Channel
TARGETED
DISTRIBUTION
SERVING
THE
JAPANESE
MARKET |
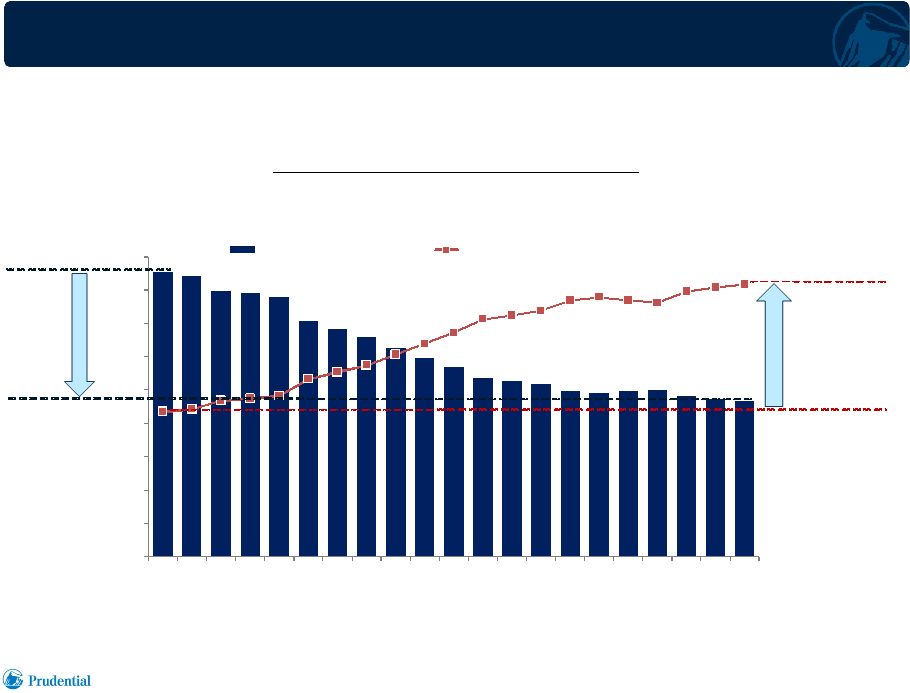 Industry
agent
count
declined
45%
Number
of
Life
Insurance
Captive
Agents
14
1)
Source: Japan Institute of Life Insurance. Data as of March 31 for each indicated
year. Some former captive agents continue their career in the life insurance
industry as independent sales agents.
•
Fewer captive agents to meet customer needs
Tokyo Investor Day 9.18.2014
0
50,000
100,000
150,000
200,000
250,000
300,000
350,000
400,000
450,000
1993
1995
1997
1999
2001
2003
2005
2007
2009
2011
2013
Number of captive agents
Population per captive agent
Captive agents
546
291
(1)
Population
per agent
increased
88%
JAPAN INDUSTRY
– NUMBER OF CAPTIVE AGENTS |
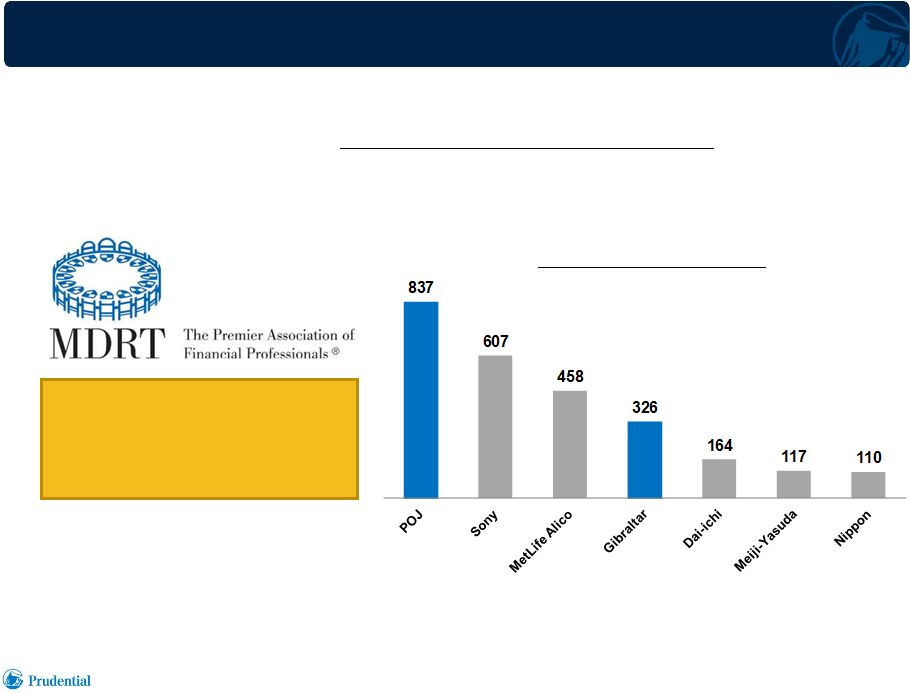 15
1)
Source:
Million
Dollar
Round
Table
Association,
Japan
-
membership
data
as
of
April
14,
2014.
Total
membership
3,680.
MDRT
Japan
Membership
~ One Third of all
MDRT members in Japan
are from
POJ and Gibraltar
(1)
•
Industry leading Million Dollar Round Table memberships
•
Prudential of Japan has the highest number of MDRT members
in the Japanese
industry for 17 consecutive years
(1)
Tokyo Investor Day 9.18.2014
(1)
QUALITY PEOPLE
|
 •
Supplement core production by captive distribution
•
Opportunistic
generation
of
profitable
business
by
meeting
needs
of
market segments not fully penetrated by captive distribution
•
Continue emphasis on protection products, adapting to
specialized markets
16
Tokyo Investor Day 9.18.2014
OUR APPROACH TO THIRD
PARTY DISTRIBUTION
Independent
Agency
Banks
Commenced
fixed annuity
distribution, 2006
Commenced
insurance
product
distribution, 2008
Commenced
distribution, 2010
Added
Star/Edison
relationships,
2011 |
 •
Sales can be volatile due to
changes in interest rates and
competitor actions
•
Less influence over distribution
•
Profitability can vary with
changes in product mix
•
Manage to bottom line, not
top line
•
Balance profitability and
business mix
17
•
Enhances access to expanded
customer base and investable
wealth
•
Growth potential through
development of distribution
relationships
•
Competitive product portfolio
meets customer needs
•
Strong brand name attracts
security focused customers
•
Leverages infrastructure costs
Advantages
Challenges
Tokyo Investor Day 9.18.2014
THIRD PARTY DISTRIBUTION
CHANNELS |
 THIRD PARTY DISTRIBUTION CHANNELS
COMPLEMENT CORE
CAPTIVE AGENT PRODUCTION
18
1)
Foreign
denominated
activity
translated
to
U.S.
dollars
at
uniform
exchange
rates
for
all
periods
presented,
Japanese
yen
82
per
U.S.
dollar.
Japan Annualized New Business Premiums
(1)
Tokyo Investor Day 9.18.2014
-
500
1,000
1,500
2,000
2,500
3,000
3,500
4,000
2009
2010
2011
2012
2013
Life Planner (POJ)
Life Consultant
Bank
Independent Agency
($ millions)
1,252
1,633
2,776
3,612
2,773 |
 PRUDENTIAL OF JAPAN SHOICHIRO ICHITANI
PRESIDENT AND
CHIEF EXECUTIVE
OFFICER PRUDENTIAL OF
JAPAN |
 2
(¥
in billions)
1)
Prudential
of
Japan
(POJ).
As
of
March
31;
year
represents
a
fiscal
year
beginning
on
April
1
of
the
year
and
ending
on
March
31
of
the
following
year.
2)
In
force
face
amount
in
U.S.
dollars
is
translated
at
spot
rate
at
the
end
of
each
fiscal
year.
Tokyo Investor Day 9.18.2014
(1),(2)
HISTORY OF POJ IN FORCE FACE AMOUNT |
 KEY DRIVERS
2009
2009
2010
2010
2011
2011
2012
2012
2013
2013
Annualized Premium Productivity
(1)
$17,441
$19,494
$21,638
$26,314
$22,636
Policy Count Productivity
(2)
7.0
6.9
6.9
7.4
7.3
Life Planner Retention
(3)
-
Initial Year
78.7%
79.7%
80.7%
82.1%
85.2%
Policy Persistency
(4)
95%
95%
95%
95%
95%
3
1)
Annualized
new
business
premiums
per
month
for
each
Prudential
of
Japan
Life
Planner;
foreign
denominated
activity
translated
to
U.S.
dollars
at
uniform
exchange
rates
for
all
periods
presented,
Japanese
yen
82
per
U.S.
dollar.
2)
Number
of
policies
sold
per
Prudential
of
Japan
Life
Planner,
per
month;
includes
medical
and
cancer
policies.
3)
Percentage
of
Prudential
of
Japan
Life
Planners
remaining
at
end
of
period
hired
12
months
earlier,
based
on
rolling
average
for
indicated
years.
4)
Prudential
of
Japan
13
month
policy
persistency
based
on
face
amount;
12
month
rolling
average
data
through
December
31.
Tokyo Investor Day 9.18.2014 |
 PRUDENTIAL OF JAPAN
SALES TRACK
RECORD 4
Annualized New Business Premiums
(1)
Tokyo Investor Day 9.18.2014
1)
Foreign
denominated
activity
translated
to
U.S.
dollars
at
uniform
exchange
rates
for
all
periods
presented,
Japanese
yen
82
per
U.S.
dollar.
($ millions)
800 |
 5
Tokyo Investor Day 9.18.2014
CORE
VALUES |
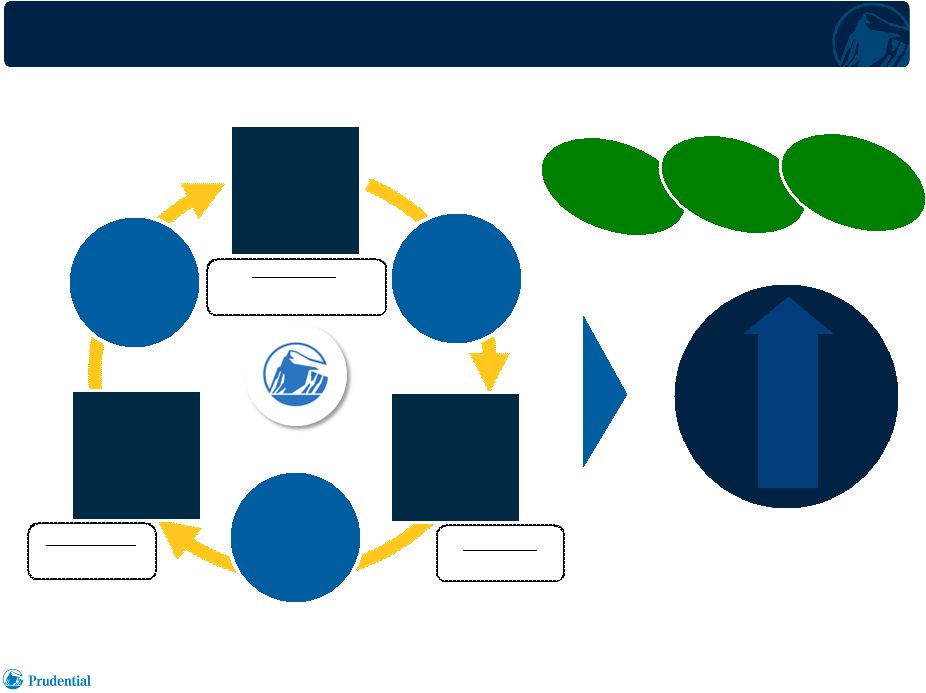       BENEFICIAL CYCLE OF LIFE PLANNER MODEL
6
Tokyo Investor Day 9.18.2014
1)
Data based on 2013 POJ. Annualized new business premiums (AP) produced by
each Life Planner (LP) in a month; foreign denominated activity translated to
U.S. dollars at uniform exchange rate, Japanese yen 82 per U.S. dollar. Number of
new policies sold per LP per month, including medical policies. Total retention
for agents in all service years. 13 month policy persistency measured based
on face amount, 12 month rolling average data for 2013. Superior
Returns &
Steady
Growth
High Income
High Income
for Life
for Life
Planner
Planner
Quality
Quality
Referrals
Referrals
Productivity
$22,636 AP per LP month
7.3 policies per LP month
High Life
High Life
Planner
Planner
Retention
Retention
High Life
High Life
Planner
Planner
Productivity
Productivity
High Policy
High Policy
Persistency
Persistency
Quality
Quality
People
People
Quality
Quality
Products
Products
Quality
Quality
Service
Service
High
High
Customer
Customer
Satisfaction
Satisfaction
Retention
89.6%
(1)
Persistency
95.2%
(1)
(1) |
 QUALITY PEOPLE –
•
Life
Planner’s
Commitment
as
Entrepreneur
•
Life
Planner’s
Business
Vision
&
Mission
•
Life
Planner’s
Development
7
Tokyo Investor Day 9.18.2014
RECRUITING AND DEVELOPMENT
|
 QUALITY SERVICE 8
1)
Life
Support
Insurance
segment
of
J.D.
Power
Asia
Pacific
2011
-
2014
Japan
Life
Insurance
Contract
Customer
Satisfaction
Studies
SM
.
Contract
Customer
Satisfaction
Study
based
on
a
total
of
4,647
life
insurance
policyholders
who
purchased
or
renewed
coverage
during
the
past
year.
japan.jdpower.com
2)
13
month
policy
persistency
measured
based
on
face
amount.
Rolling
average
of
12
months
experience
ending
at
December
31,
2011,
2012,
2013
and
June
30,
2014.
•
According to J.D. Power Asia Pacific, Prudential of Japan is the
highest in
customer satisfaction
(1)
for four years in a row
•
Satisfied customers drive high policy persistency
#1
#1
#1
#1
2011
2012
2013
2014
Tokyo Investor Day 9.18.2014
Customer
Satisfaction
(1)
POJ Policy
Persistency
(2)
95%
95%
95%
95% |
               QUALITY PRODUCTS
MEETING FINANCIAL
SECURITY NEEDS OVER A LIFETIME
Age
High Net Worth Market
Business Insurance Market
Individual Insurance Market
20’s –
40’s
50’s –
60’s+
Tokyo Investor Day 9.18.2014
9
Death
Protection
Owner
Planning for
Post-Retirement
Employee Benefit
Program Funding
Sophisticated
Estate Planning
Business
Succession
Family
Distribution of
Inheritances
Nursing,
Medical Care |
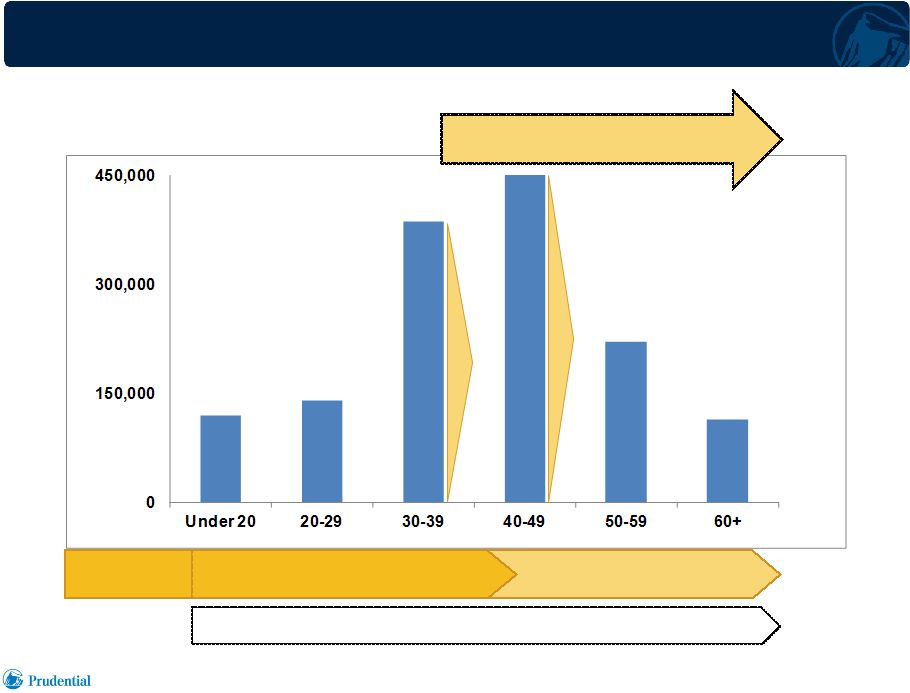     Future
Retirement Sales Opportunity Insured
Clients
(1)
Death Protection
Primary
Client Focus
Retirement Income Security
LIFETIME CLIENT
RELATIONSHIPS PROVIDE SIGNIFICANT OPPORTUNITY FOR RETIREMENT ORIENTED SALES
Age Group
1)
As of August 2014.
Tokyo Investor Day 9.18.2014
10
Inheritance Opportunity |
 11
1)
Data
based
on
Prudential
of
Japan
sales
to
individual
market;
foreign
denominated
activity
translated
to
U.S.
dollars
at
uniform
exchange
rates;
Japanese
yen
82
per
U.S.
dollar.
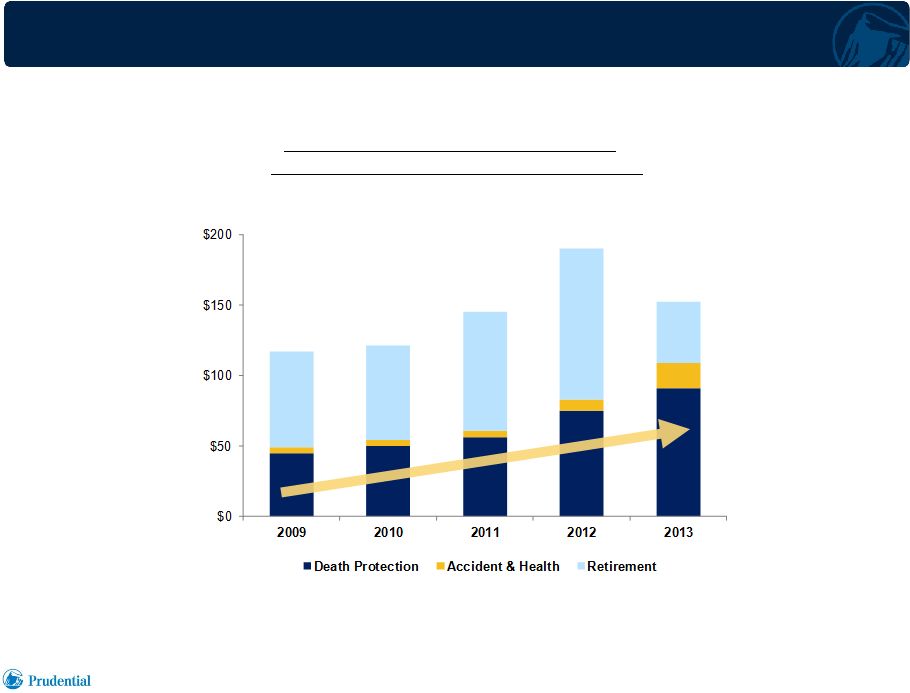
LIFETIME CLIENT
RELATIONSHIPS DRIVE SUBSEQUENT SALES OPPORTUNITIES
Annualized New Business Premiums
(1)
POJ Second Sales to Existing Customers
($ millions)
117
121
145
191
152
Tokyo Investor Day 9.18.2014 |
 SUMMARY 12
•
High Productivity
•
High Retention
•
High Persistency
Tokyo Investor Day 9.18.2014
Superior Returns
and
Steady Growth |
 GIBRALTAR LIFE KEI
SATO PRESIDENT AND CHIEF EXECUTIVE OFFICER
GIBRALTAR LIFE
|
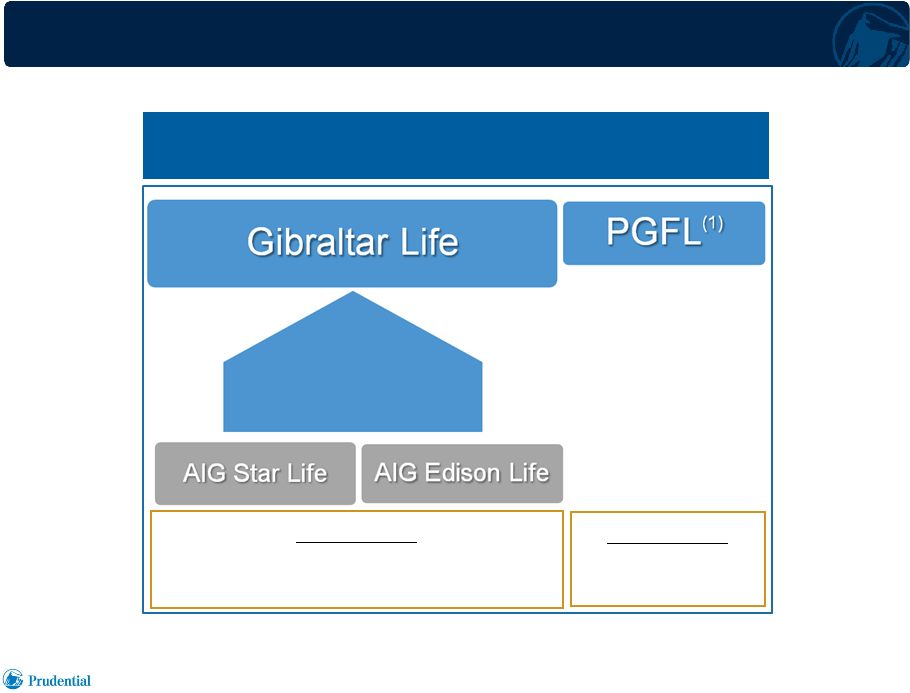 Tokyo
Investor Day 9.18.2014 Consolidated
Consolidated
Gibraltar Life
Gibraltar Life
Distribution
•
Life Consultants
•
Independent Agencies
Legal Entity Merger,
January 2012
GIBRALTAR LIFE
OVERVIEW 2
Distribution
•
Bank Channel
1)
Prudential Gibraltar Financial Life. |
 LIFE CONSULTANT DISTRIBUTION
COMPLEMENTED BY THIRD PARTY
CHANNELS 2013 Sales
(1),(2)
$1.9 billion
2013 Number of Policies In Force
(3)
7.3 million
1)
Annualized new business premiums.
2)
Foreign denominated activity translated to U.S. dollars at uniform exchange rate;
Japanese yen 82 per U.S. dollar. 3)
As of end of period.
Tokyo Investor Day 9.18.2014
Life Consultants
Banks Independent Agencies
3
45%
43%
12%
88%
6%
6% |
 PRODUCT PORTFOLIO HOW
CUSTOMER NEEDS ARE MET
Customer
Segment
Primary
Customer
Needs
Product
Solution
Distribution
Tokyo Investor Day 9.18.2014
4
Middle-market
Affinity groups
Life Consultant
Life Consultant
Channel
Channel
Death protection
Retirement
Whole life & Term
Retirement income
USD products
Accident & Health
Multi-currency fixed
annuities
Third Party Channels
Third Party Channels
Independent Agency
Independent Agency
Upper middle-market
Business and
professional market
Death protection
Retirement
Business planning
Savings
Whole life & Term
Retirement income
USD products
Accident & Health
Multi-currency fixed
annuities
Bank
Bank
High net worth
Business and
professional market
Death protection
Retirement
Business planning
Savings
Whole life & Term
Retirement income
USD products
Multi-currency fixed
annuities |
 GIBRALTAR KEY BUSINESS PHILOSOPHIES
5
Tokyo Investor Day 9.18.2014
•
Stay focused on death protection products for customers with needs-
based approach
•
Differentiate based on “Three Qualities”
–
Quality People
–
Quality
Products
–
Quality Services
•
Maintain “C = C”
principle
–
“Contribution = Compensation” |
 MAJOR BUSINESS INTEGRATION INITIATIVES
6
Tokyo Investor Day 9.18.2014
•
Active management of the sales force, by introducing proven training
and compensation approaches
•
Integration of systems
•
Integration of product lineups
•
Integration of investment portfolios
•
Strengthening of risk management and internal controls
|
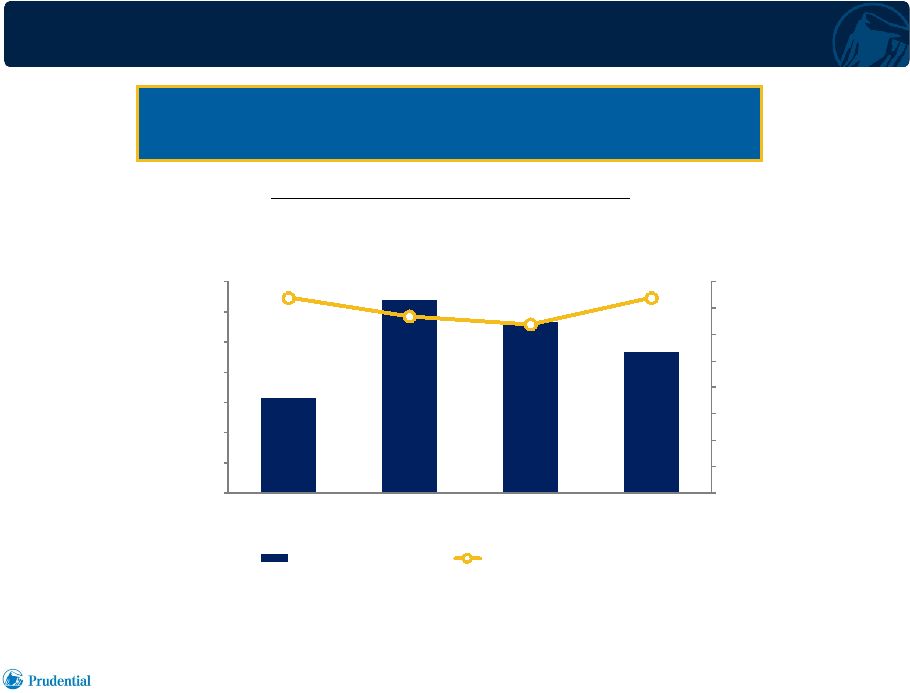 7,400
6,700
6,400
7,400
$0
$1,000
$2,000
$3,000
$4,000
$5,000
$6,000
$7,000
$8,000
0
2,000
4,000
6,000
8,000
10,000
12,000
14,000
2010
2011
2012
2013
Life Consultant Count
Life Consultant AP Productivity
LIFE CONSULTANT
DISTRIBUTION NUMBER AND PRODUCTIVITY 7
Tokyo Investor Day 9.18.2014
1)
Foreign
denominated
activity
translated
to
U.S.
dollars
at
uniform
exchange
rates
for
all
periods
presented;
Japanese
yen
82
per
U.S.
dollar.
Annualized
new
business
premium
(AP)
per
Life
Consultant
per
month.
2)
At
end
of
period.
Life
Consultant
Count
&
AP
Productivity
(1)
Life Consultant Count
(2)
Life Consultant productivity has returned to
Life Consultant productivity has returned to
pre-Star/Edison acquisition levels
pre-Star/Edison acquisition levels
AP Productivity |
 4,300
4,700
$3,800
$4,000
$4,200
$4,400
$4,600
$4,800
$5,000
$5,200
2012
2013
LIFE CONSULTANT
DISTRIBUTION PRODUCTIVITY OF
NEW LIFE CONSULTANTS
8
Tokyo Investor Day 9.18.2014
1)
Foreign
denominated
activity
translated
to
U.S.
dollars
at
uniform
exchange
rates
for
all
periods
presented;
Japanese
yen
82
per
U.S.
dollar.
Annualized
new
business
premium
per
Life
Consultant
per
month.
2)
Life
Consultants
working
for
Gibraltar
Life
less
than
two
years.
AP Productivity
(1)
of New Life Consultants
(2)
New Life Consultants: Productivity has also Increased
New Life Consultants: Productivity has also Increased |
 PROFILE OF A SUCCESSFUL LIFE CONSULTANT
•
Proven training and compensation approaches
•
Steady and continuous activity in our major affinity group markets
•
Networking among customers/community
9
Tokyo Investor Day 9.18.2014
Recruiting based on our experiences –
Recruiting based on our experiences –
High-educational background, Sales experience, etc.
High-educational background, Sales experience, etc.
|
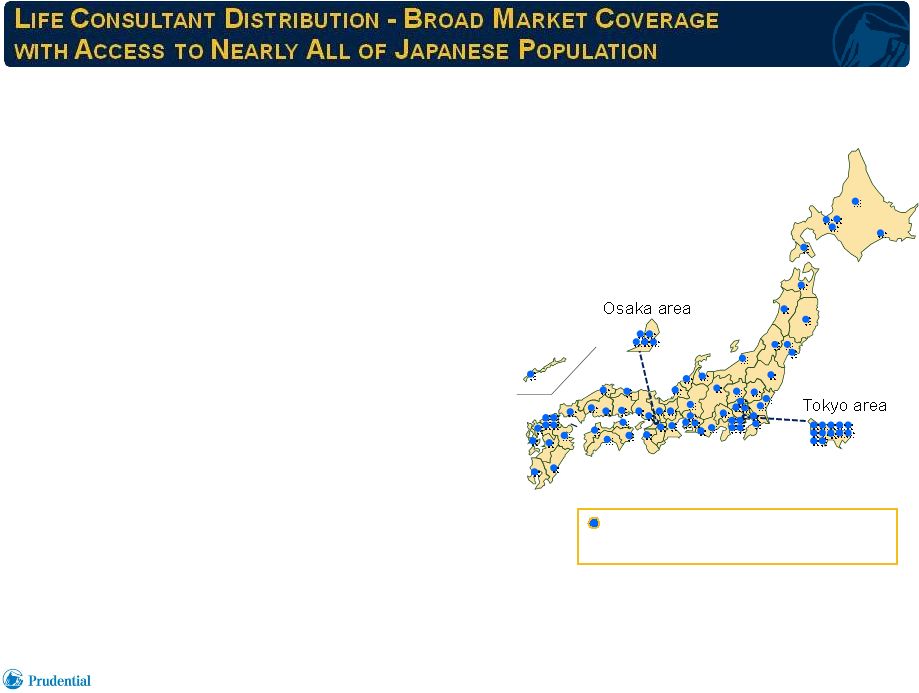 10
83 branch offices
supporting
Life
Consultants
(1)
•
Branch offices established in substantially
all prefectures
•
Prudential training supports emphasis on
death protection products and needs-based
selling
•
Serving expanding need for retirement
income security products
•
Teachers Association and other affinity
group relationships provide recurring
sources of new business
1)
As of April 1, 2014.
Tokyo Investor Day 9.18.2014 |
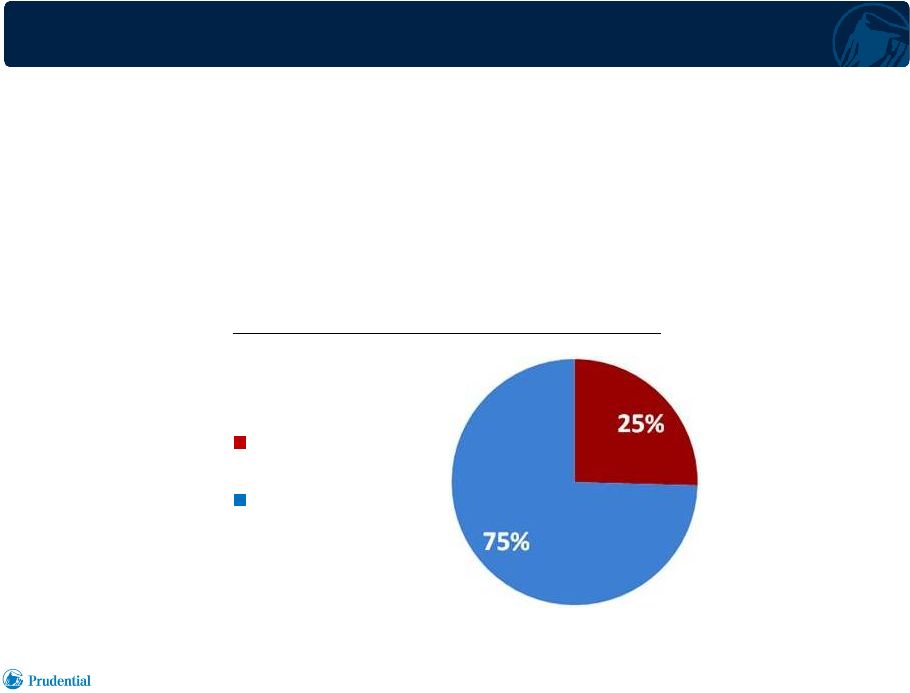 •
Teachers market remains a primary and stable source of business for Gibraltar
•
Approximately one-quarter of Life Consultant channel new business is
derived from this market
•
Perennial source of sales through teacher career spans
–
Protection products to entering and active teachers
–
Retirement products for lump-sum recipients
LIFE CONSULTANT
CHANNEL KEY
DRIVER –
TEACHERS MARKET
2013 Annualized New Business Premiums
(1)
Tokyo Investor Day 9.18.2014
11
1)
Foreign
denominated
activity
translated
to
U.S.
dollars
at
uniform
exchange
rates;
Japanese
yen
82
per
U.S.
dollar.
Teachers
Market
Other Life
Consultant
Sales |
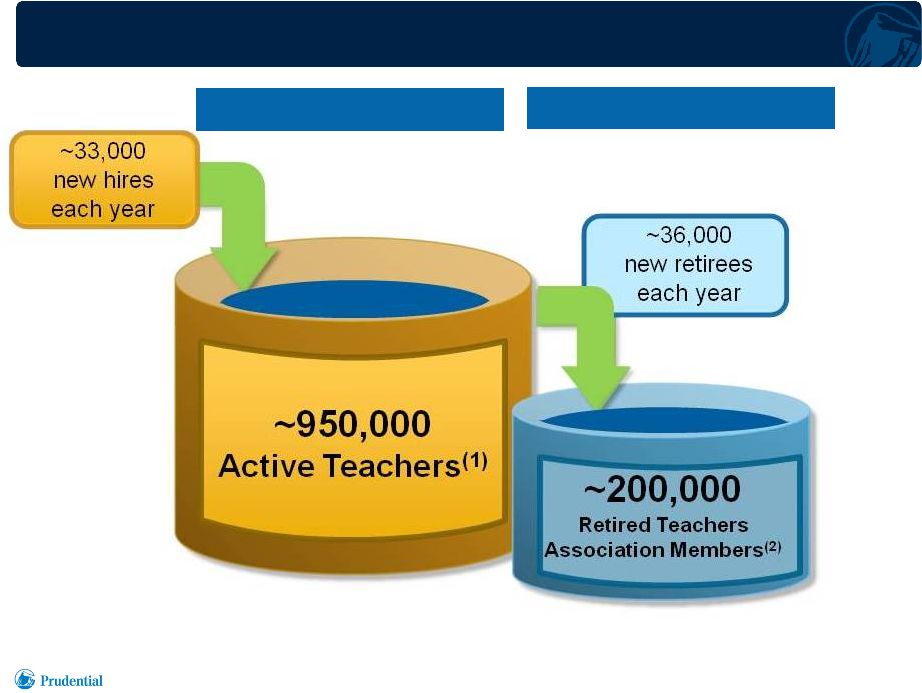
 BROAD COVERAGE OF TEACHERS MARKET
12
Tokyo Investor Day 9.18.2014
Approximately
Life Consultants
(1)
Approximately
Public schools nationwide
(2)
1)
As of May 1, 2014.
2)
As
of
May
1,
2013,
Source:
Japan
Ministry
of
Education,
Culture,
Sports,
Science
and
Technology,
and
Japanese
Educational
Mutual
Aid
Association
of
Welfare
Foundation.
Includes
support
employees
of
public
schools.
Approximately
Public school
teachers nationwide
(2)
Japanese Educational Mutual Aid
Japanese Educational Mutual Aid
Association of Welfare Foundation
Association of Welfare Foundation
5,000
35,000
950,000 |
 TEACHERS ASSOCIATION:
PERENNIAL SALES
OPPORTUNITIES 1)
As
of
May
1,
2013,
Source:
Japan
Ministry
of
Education,
Culture,
Sports,
Science
and
Technology,
and
Japanese
Educational
Mutual
Aid
Association
of
Welfare
Foundation.
Includes
support
employees
of
public
schools.
2)
As of May 1, 2014.
Active Market
Retiree Market
13
Tokyo Investor Day 9.18.2014 |
 INDEPENDENT AGENCY CHANNEL
A DIFFERENTIATED STRATEGY
Key strategies
•
Focus on “Quality”
not just top-line growth
•
Price competition is not our key to winning sales
•
Strong partnership with high performing agencies
Key success factors
•
Develop highly-motivated agencies and producers who subscribe to
our business approach
•
Develop and train qualified marketing representatives to work
with agencies
Tokyo Investor Day 9.18.2014
14 |
 3,419
3,393
3,352
3,248
2,882
2,646
2,685
2,687
37
52
47
76
55
60
67
80
$0
$10
$20
$30
$40
$50
$60
$70
$80
$90
0
500
1,000
1,500
2,000
2,500
3,000
3,500
4,000
3Q 2012
4Q 2012
1Q 2013
2Q 2013
3Q 2013
4Q 2013
1Q 2014
2Q 2014
Number of Agency Relationships
Annualized New Business Premiums
INDEPENDENT AGENCY CHANNEL
GROWING PRODUCTIVITY
15
Number of Agency Relationships and
Annualized New Business Premiums
Tokyo Investor Day 9.18.2014
1)
Foreign
denominated
activity
translated
to
U.S.
dollars
at
uniform
exchange
rates
for
all
periods
presented;
Japanese
yen
82
per
U.S.
dollar.
Number
of
agency
relationships
is
as
of
the
end
of
each
quarter.
Annualized New
Business Premiums
($ millions)
Number of Agency
Relationships
(1) |
 BANCASSURANCE IN JAPAN TAKESHI TANIGAWA
PRESIDENT AND CHIEF
EXECUTIVE OFFICER PRUDENTIAL GIBRALTAR FINANCIAL LIFE |
 •
Japanese household wealth is concentrated among older households
with substantial bank balances
•
Continuing flow of funds through proceeds of investments (e.g.
Japanese government bonds) and maturing annuities
•
Bancassurance has expanded Japan’s life insurance market
2
Tokyo Investor Day 9.18.2014
BANCASSURANCE MARKET IN JAPAN Demographic Structure of Japan
Demographic Structure of Japan
(1)
(1)
(Total population: 127 million)
(Total population: 127 million)
Household Wealth
Household Wealth
(2)
(2)
($15.8 trillion)
($15.8 trillion)
Aged 50 years
old and over
57 million
(45%)
$13.3 trillion
(84%)
Aged less than
50 years old
70 million
(55%)
$2.5 trillion
(16%)
1)
Source:
Final
figures
as
of
February
1,
2014,
released
by
the
National
Institute
of
Population
and
Social
Security
Research.
2)
Compiled
by
Prudential
based
on
Bank
of
Japan’s
“Flow
of
Funds
Accounts”
(as
of
the
end
of
March
2014)
and
Statistics
Bureau,
Ministry
of
Internal
Affairs
and
Communications’
“Family
Income
and
Expenditure
Survey”.
Japanese
yen
translated
to
U.S.
dollars
at
spot
currency
exchange
rate
as
of
March
31,
2014
(103
yen
per
U.S.
dollar).
Bank’s main
customers |
 EMERGING OPPORTUNITY FOR THE BANCASSURANCE MARKET •
Tax system revision effective January 1, 2015
–
More people will be subject to inheritance tax payment
•
People place high confidence in banks for estate planning consultation
–
Highly promising for life insurance sales as inheritance solutions
3
Tokyo Investor Day 9.18.2014
As of 2012
As of 2012
(1)
(1)
After tax law revision
After tax law revision
(2)
(2)
(January, 2015)
(January, 2015)
National
Average
4.1%
~ 6%
Tokyo
7.0%
~ 20%
Percentage of People Subject to Inheritance Tax Payment
1)
Tokyo Regional Taxation Bureau “State of inheritance tax return”.
2)
Ratio of taxable persons after tax system revision:
Survey by Legacy, tax accounting firm, published in 2013.
|
 PRUDENTIAL’S BANK CHANNEL BUSINESS STRATEGY
Product Class
Product Class
(Customer needs)
(Customer needs)
Market
Market
Characteristics
Characteristics
Prudential Bank
Prudential Bank
Channel Strategies
Channel Strategies
Protection Products
(Survivor benefits, wealth
transfer by inheritance)
•
Bank channel sales of
insurance products are
challenging absent solid
support and expertise
•
Provide full sales support
through skilled personnel
•
Quality products suited
to bank channel clients
Savings Products
(Investment goals)
•
Similarity to mutual funds and
other financial products allows
relatively simple sales
•
Sales are largely driven by
price competition
•
Expect sales to reflect
market growth and
competitive landscape
•
Ensure appropriate pricing
4
Tokyo Investor Day 9.18.2014
Emphasis on protection products with differentiated approach
Emphasis on protection products with differentiated approach
supports high quality sales at attractive margins
supports high quality sales at attractive margins |
 BUSINESS BASE OF BANK CHANNEL RELATIONSHIPS
•
Partner
relationships
with
all
of
the
Mega
Banks
and
Major
Trust
Banks
(7
banks
in
total)
5
1)
As of August 1, 2014.
2)
Number of banks/institutions in which Prudential
products are offered.
3)
Japanese yen translated to U.S. dollars at spot
currency exchange rate as of March 31, 2014
(yen 103 per U.S. dollar).
4)
Includes Resona Bank.
Prudential Distribution
Partners
(1),(2)
Deposits, etc
(3)
(Trillion
USD) Mega Bank
(4)
4/4
$3.0
Major Trust Bank
3/3
$1.3
Regional bank, etc.
53
$1.6
Brokerage firm
1
$0.9
Total
61
$6.8
Tokyo Investor Day 9.18.2014 |
 BUSINESS BASE OF BANK CHANNEL
PRODUCT LINE-UP (1)
•
Offering a comprehensive product line-up in Bancassurance with
emphasis on protection products
6
Tokyo Investor Day 9.18.2014
Annuity
Single pay
annuities
USD, EUR,
AUD, Yen
Variable
individual
annuities
(2)
USD
Whole Life
Single pay
whole life
insurance
USD, EUR,
AUD, Yen
Whole life
insurance
Yen, USD
Retirement
Retirement
income
insurance
USD
Term
Family
income
insurance
Yen
Level term
insurance
Yen
Increasing
term
insurance
Yen
Cancer
Whole life
cancer
insurance
Yen
Increasing
whole life
insurance
Yen
1)
As of June 30, 2014.
2)
Products available in portfolio; sales not significant.
|
 BANK CHANNEL SALES SUPPORT
PRUDENTIAL’S DIFFERENTIATED APPROACH 7
With more than 7 years since Japan’s full deregulation of
With more than 7 years since Japan’s full deregulation of
Bancassurance in 2007, Prudential
Bancassurance in 2007, Prudential
has developed substantial marketing expertise and
has developed substantial marketing expertise and
skilled employees to serve the Bank Channel
skilled employees to serve the Bank Channel
Sales personnel
Sales personnel
Role
Role
Headcount
Headcount
(1)
(1)
Wholesaler
•
Provide sales support to bank
employees
~120
Insurance
Consultant
(secondment)
•
Sell insurance products at banks where
“seconded”
•
Provide training to bank employees
~210
(2)
Training
Specialist
•
Provide customized training
~10
1)
As of June 30, 2014.
2)
At certain banks.
Tokyo Investor Day 9.18.2014 |
 PRUDENTIAL’S INSURANCE CONSULTANT
“SECONDMENT”
MODEL
•
Experienced Life Planners “seconded”
as Insurance Consultants to
partner with banks, directly bringing strength of Prudential’s distribution
model to bank channel
(1)
–
Insurance Consultants bring accumulated expertise in insurance sales
to the table
–
Sell insurance policies directly to bank customers
–
Train bank employees so that they can conduct sales on their own
8
Growth of Insurance Consultant –
Secondment Model
People
1)
At certain banks; at end of period.
Tokyo Investor Day 9.18.2014
0
50
100
150
200
250
2007
2008
2009
2010
2011
2012
2013
Jun
2014 |
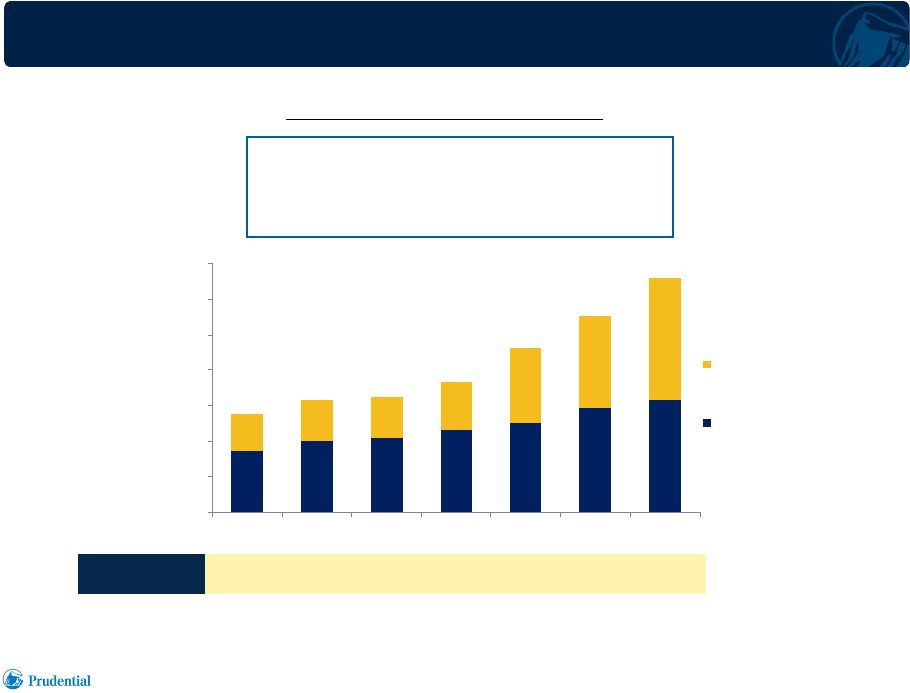
 BANK CHANNEL SALES TRACK RECORD
9
1)
Foreign
denominated
activity
translated
to
U.S.
dollars
at
uniform
exchange
rates
for
all
periods
presented;
Japanese
yen
82
per
U.S.
dollar.
Annualized New Business Premiums
(1)
($ millions)
Tokyo Investor Day 9.18.2014
Yen-based bank channel single premium whole life (limited death benefit)
product All Other Products
22
56
138
339
587
1,386
817
$0
$500
$1,000
$1,500
2007
2008
2009
2010
2011
2012
2013 |
 IN CONCLUSION…
10
Our goal is to realize the full potential for bancassurance
distribution of life insurance protection products in Japan
Bancassurance
Bancassurance
= Investment
= Investment
(Savings Products)
(Savings Products)
Bancassurance
Bancassurance
= Insurance
= Insurance
(Protection Products)
(Protection Products)
Tokyo Investor Day 9.18.2014
We created a unique business model for the bank channel,
We created a unique business model for the bank channel,
taking advantage of our differentiated capabilities
taking advantage of our differentiated capabilities |
 JOHN HANRAHAN SENIOR
VICE PRESIDENT AND CHIEF FINANCIAL OFFICER
INTERNATIONAL
PRUDENTIAL INTERNATIONAL INSURANCE FINANCIAL
OVERVIEW |
 DRIVERS OF SUSTAINABLE FINANCIAL PERFORMANCE
2
Tokyo Investor Day 9.18.2014
•
Core captive agent and supplemental third party
•
High productivity and persistency
•
Scale
•
Needs-based sales
•
High margin death protection product focus
•
Growing retirement needs
•
Asset-liability management discipline
•
High credit quality fixed income portfolio
•
Low allocation to risk assets
•
Well capitalized insurance companies
•
Strong ROE and cash flows
•
Strong track record of capital deployment
through various means
Quality Focused
Quality Focused
Distribution
Distribution
Sound Capital
Sound Capital
Management
Management
Well Managed
Well Managed
Investment Portfolio
Investment Portfolio
Risks
Risks
Servicing Client’s
Servicing Client’s
Protection and
Protection and
Retirement Needs
Retirement Needs |
   0.0%
5.0%
10.0%
15.0%
20.0%
25.0%
2010
2011
2012
2013
HIGH RETURN ON EQUITY
DRIVEN BY FUNDAMENTALS
3
1)
Based
on
after-tax
Adjusted
Operating
Income
(AOI)
of
our
International
Insurance
operations,
excluding
market
driven
and
discrete
items
as
disclosed
in
company
earnings
releases,
using
overall
effective
tax
rate
for
the
Financial
Services
Businesses,
and
associated
attributed
equity
excluding
accumulated
other
comprehensive
income
and
the
impact
of
foreign
currency
exchange
rate
remeasurement.
•
ROE has returned to pre-Star/Edison acquisition levels driven by strong
performance, expense synergies and “tailwinds”
Return on Equity
(1)
22.0%
17.4%
18.3%
21.2%
February 2011
Star/Edison
Acquisition
Tokyo Investor Day 9.18.2014 |
 $0
$500
$1,000
$1,500
$2,000
$2,500
$3,000
$3,500
2007
2008
2009
2010
2011
2012
2013
Gibraltar Life and Other
Operations
Life Planner Operations
4
1)
Pre-tax AOI excludes market driven and discrete items as disclosed in company
earnings releases. 2)
Hedged foreign currency exchange rate for Japanese yen per U.S. dollar.
SUSTAINED EARNINGS
GROWTH Pre-Tax
Adjusted
Operating
Income
(1)
($ millions)
1,622
1,821
2,308
2,762
3,304
•
Organic growth
•
Star/Edison acquisition
•
Favorable hedged currency trend through 2013
•
Other “tailwinds”
in 2013
106
AOI FX Rate
(2)
99
92
85
80
Tokyo Investor Day 9.18.2014
106
102
1,572
1,381 |
 INTERNATIONAL INSURANCE AOI
5
Tokyo Investor Day 9.18.2014
1)
Excludes
market
driven
and
discrete
items
as
disclosed
in
company
earnings
releases.
2)
Star/Edison
results
included
from
date
of
acquisition,
February,
2011.
3)
Reflects
yen
translation
at
hedged
foreign
currency
exchange
rates
of
106,
99,
92,
85,
80
for
2009,
2010,
2011,
2012,
and
2013
respectively.
($ millions)
Pro forma AOI:
All yen earnings translated at constant rate of ¥82
1,622
1,821
2,308
2,762
3,304
Reported AOI
(3)
1,829
1,996
2,474
2,812
3,265
$0
$500
$1,000
$1,500
$2,000
$2,500
$3,000
$3,500
2009
2010
2011
2012
2013
(1),(2) |
     PRODUCT PROFITABILITY CHARACTERISTICS
6
Tokyo Investor Day 9.18.2014
1)
Conceptual
illustration
based
on
typical
products.
Mortality,
Expense &
Other Margin
Investment
Margin
Retirement / Savings Oriented
Term Life
Accident &
Health
Recurring Pay
Whole Life
Retirement
Income
Fixed
Annuity
Single Pay
Whole Life
Source of Earnings
(1)
Protection Oriented |
 INTEREST RATE ENVIRONMENT
10 Year Government Bond Yield
•
Interest rates have been low in Japan for more than fifteen years
–
Majority of POJ’s in force business was written in a low rate
environment –
Rehabilitation measures lowered crediting rates for most of the legacy business of
Gibraltar, Star and Edison
–
High quality long duration investment portfolio
•
Repriced products to maintain profitability
•
Protection products provide stable
earnings from mortality and expense
margins
•
Fixed annuity products designed to
mitigate interest rate risk
–
Pricing updates bi-weekly
–
Early surrenders subject to market
value adjustments (MVA)
7
0%
1%
2%
3%
4%
5%
6%
7%
8%
1997
1999
2001
2003
2005
2007
2009
2011
2013
JGB
UST
Tokyo Investor Day 9.18.2014 |
 1)
Pre-tax
AOI
excludes
market
driven
and
discrete
items
as
disclosed
in
company
earnings
releases.
The
analysis
represents
assumed
investment
of
renewal
premiums
and
reinvestment
of
investment
income
and
proceeds
from
maturing
investments
at
market
interest
rates
25
bps
higher
or
lower
than
actual
rates
during
the
year.
($ millions)
•
In the near-term, earnings are not materially impacted by modest changes in
interest rates •
In a scenario of 25 bps reduction in 2013, the cumulative pro forma negative impact
on pre- tax AOI would be $15 million in 2013, $45 million in 2014, $75
million in 2015 and $105 million in 2016
IMPACT OF CHANGING
INTEREST RATE ENVIRONMENT
8
Tokyo Investor Day 9.18.2014
Pre-Tax Adjusted Operating Income
(1)
+/-
25 bps =
~$15 million
in near-term
3,304
3,289
3,319
2013
If Interest rates
-25 bps
If interest rates
+25bps
Investment Margin
Mortality, Expense &
Other Margin |
       FOREIGN CURRENCY RISK MANAGEMENT
9
Potential Exposure
Risk Management
Asset-Liability
Management
Well Matched FX
Shareholder Value in US$
Comprehensive
Hedging Strategy
•
Income and Cash Flow
•
Equity Value
Accounting
Remeasurement
Non-Economic Noise
Tokyo Investor Day 9.18.2014 |
     COMPREHENSIVE HEDGING STRATEGY
10
Tokyo Investor Day 9.18.2014
Income
Income
Hedges
Hedges
•
We hedge local foreign currency income from Japan
and Korea on a 3-year rolling basis
•
Notional
amount
of
yen
income
hedges
is
~$3
billion
(1)
Equity
Equity
Protection
Protection
•
$10 billion USD
(1)
equivalent of yen equity protected
against currency movement exposure; largely achieved
by holding substantial portion of investment in our
Japanese businesses in USD
1)
As of December 31, 2013.
Benefits
•
More predictable AOI; mitigate income volatility over a 3-year period
•
Hedge income that we expect to repatriate
•
Equity value protected from foreign exchange movements
Considerations
•
Solvency margin volatility
•
AOI, ROE and book value volatility
•
Tax volatility and constraints
•
Leverage volatility |
 JAPANESE YEN EARNINGS HEDGE
11
Tokyo Investor Day 9.18.2014
Historical Yen Spot Rates vs. Hedging Rates
2010
2011
2012
2013
2014
(¥)
¥99
¥92
¥85
¥80
¥82
•
Expected yen-based AOI is hedged over a 36 month rolling period using a
series of FX forwards with laddered maturities –
2014 expected yen
earnings were first hedged in 1Q11, and entirely hedged by 4Q13.
•
Each quarter’s expected yen earnings are hedged over the preceding 9
quarters. The hedged rate is an average of these transactions.
~50% of
Japan’s
2013 AOI
was
Yen-based |
 EARNINGS AND ROE PROTECTION STRATEGY
12
Tokyo Investor Day 9.18.2014
Percentage
of
Expected
Yen
Earnings
Hedged
(1)
100%
93%
54%
2016
2015
2014
•
Yen depreciation lowers the USD value of yen earnings; causes earnings
and ROE dilution
•
Hedging of expected yen earnings protects USD value of near-term
earnings, ROE and potential capital repatriation
1)
As of June 30, 2014. |
 FOREIGN CURRENCY MATCHING –
JAPANESE INSURANCE
OPERATIONS 13
Tokyo Investor Day 9.18.2014
1)
As of June 30, 2014.
2)
Investment portfolio is presented on a U.S. GAAP carrying value basis. Includes
cash and cash equivalents of approximately $4 billion, and net unrealized
gains of $11 billion.
3)
Insurance liability balances represent future policy benefits and policyholder
account balances on a U.S. GAAP basis. 4)
Primarily Australian dollar.
USD
USD
Other
Other
(4)
(4)
$151 billion
JPY
JPY
Investment Portfolio
(1),(2)
Reserves
(1),(3)
USD
USD
Other
Other
(4)
(4)
$131 billion
JPY
JPY |
 Pro
Forma AOI at indicated rates
AOI
HEDGING SENSITIVITY
14
Tokyo Investor Day 9.18.2014
International Insurance 2013 AOI at
Different Hedging Rates for Yen
(1),(2)
($ billions)
Hypothetical Hedging Rates
Hypothetical Hedging Rates
¥90
¥90
90
¥100
¥100
100
¥110
¥110
110
Difference from 2013 Actual
Hedging Rate
13%
25%
38%
Pro Forma Impact to 2013 AOI
(5)%
(10)%
(13)%
1)
Based on actual and alternative assumed hedging rates for Japanese yen income to
U.S. dollars. 2)
Pre-tax AOI; excludes market driven and discrete items as disclosed in company
earnings releases. 3)
Japanese yen 80 per U.S. dollar.
Actual
Rate
(3) |
 HIGH QUALITY INVESTMENT PORTFOLIO
15
1)
As of June 30, 2014. Presented on a U.S. GAAP carrying value basis. Excludes
cash and cash equivalents of approximately $4 billion. 2)
Includes commercial/residential mortgage-backed securities and asset-backed
securities. 3)
Includes commercial/residential mortgage loans.
4)
Includes trading account assets supporting insurance liabilities, policy loans,
other trading account assets and short-term investments. 5)
Other long term investments includes $353 million of joint ventures and limited
partnerships. Japanese
Insurance
Operations
Investment
Portfolio
(1)
Corporate Bonds
(Investment Grade)
2% Corporate Bonds (Below Investment Grade)
2% Equities
1% Other Long Term Investments
(5)
Structured Securities
(2)
Commercial Loans
(3)
Risk Assets
Other
(4)
Government
(JGB & UST)
Tokyo Investor Day 9.18.2014
27%
3%
5%
4%
5%
56%
•
95% of the portfolio invested in low-risk assets
$147 billion |
 STRONG MANAGEMENT OF SOLVENCY MARGIN RATIO (SMR)
SENSITIVITY TO MARKET
MOVEMENT 16
•
~70% of the Japan portfolio is classified as either held-for-reserve (HFR)
or held- to-maturity (HTM)
–
HFR/HTM
bonds
are
not
marked
to
market
for
interest
rate
changes
in
Solvency
Margin results
–
Less than 25% of the assets are available-for-sale (AFS) securities with
relatively short duration
•
Strong currency matching of policy reserves and supporting assets leads to low
volatility in solvency margin ratio from FX movements
Tokyo Investor Day 9.18.2014
1)
Total General Account assets, based on JGAAP. As of March 31, 2014.
2)
“Other”
includes Cash, Cash Deposits, Call Loans, Loans and Real Estate.
Gibraltar Life
(1)
Prudential of Japan
(1) |
 SOLVENCY MARGIN RATIO
17
•
Solvency
margin
position
of
Prudential’s
Japanese
insurance
companies
–
well
capitalized and financially secure
•
We are above our target SMR of 600% -
700%
Stressed Scenario
Stressed Scenario
~680%
~800%
Down 55%
Down 35%
Strengthening 20%
Up 100 bps
Stressed Scenario
Stressed Scenario
(2)
(2)
March 31, 2014
March 31, 2014
777%
Prudential of Japan
Prudential of Japan
Gibraltar Life
Gibraltar Life
(1)
(1)
955%
SMR
1)
Gibraltar Life consolidated basis.
2) Represents indicated change applied to asset valuation
as of March 31, 2014.
Tokyo Investor Day 9.18.2014 |
 CAPITAL MANAGEMENT OPPORTUNITIES
18
Tokyo Investor Day 9.18.2014
1)
As of June 30, 2014. Includes amounts relating to preferred stock
issues. Redeployment
Redeployment
Method
Method
Description
Description
Dividends
•
In accordance with regulatory and solvency standards
Affiliated Debt
Repayment
•
Approximately $2.5 billion outstanding on books of
Prudential’s Japanese insurance companies
(1)
Affiliated
Lending
•
In accordance with regulatory and credit standards
Acquisition
Funding and
Other
•
Local capital provides potential source for
acquisition financing
•
Other opportunities consistent with regulatory standards
•
International Insurance operations redeploy capital through various methods
|
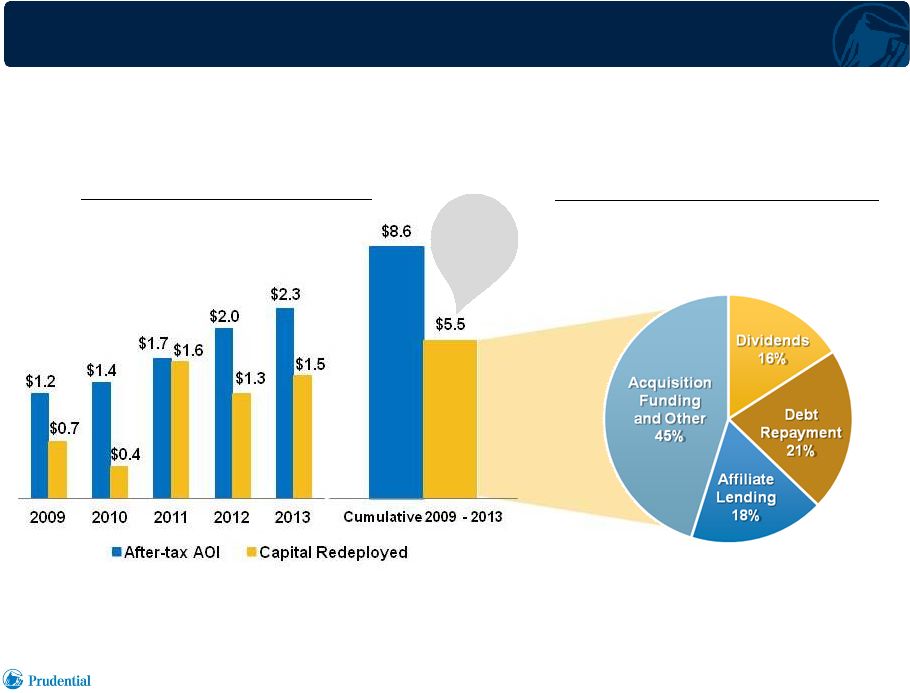 HISTORICAL CAPITAL REDEPLOYMENT
19
Historical Capital Redeployment
($ billions)
•
International Insurance operations have redeployed excess capital of more than
60% of after-tax AOI since 2009
(1)
1)
Through 2013.
Forms of Cumulative Redeployment
Over 60%
of after-tax
AOI
Tokyo Investor Day 9.18.2014 |
 KEY TAKEAWAYS 20
•
Focus on quality distribution drives sustainable high margins and ROE
•
Emphasis on protection products combined with scale provides stable
sources of earnings predominantly driven by mortality and
expense margins
•
High quality investment portfolio is well matched with our insurance
liabilities
•
Comprehensive hedging strategy
•
Insurance operations are well capitalized
•
Significant capital redeployment opportunities
Tokyo Investor Day 9.18.2014 |