Attached files
| file | filename |
|---|---|
| EX-10.2 - EX-10.2 - Bison Merger Sub I, LLC | d744403dex102.htm |
| EX-10.3 - EX-10.3 - Bison Merger Sub I, LLC | d744403dex103.htm |
| EX-10.4 - EX-10.4 - Bison Merger Sub I, LLC | d744403dex104.htm |
| EX-10.1 - EX-10.1 - Bison Merger Sub I, LLC | d744403dex101.htm |
| EX-23.1 - EX-23.1 - Bison Merger Sub I, LLC | d744403dex231.htm |
| EX-10.5 - EX-10.5 - Bison Merger Sub I, LLC | d744403dex105.htm |
Table of Contents
As filed with the Securities and Exchange Commission on September 15, 2014
Registration No. 333-198322
UNITED STATES
SECURITIES AND EXCHANGE COMMISSION
Washington, D.C. 20549
Amendment No. 1
to
FORM S-1
REGISTRATION STATEMENT
UNDER
THE SECURITIES ACT OF 1933
FMSA HOLDINGS INC.
(Exact Name of Registrant as Specified in its Charter)
| Delaware | 1400 | 34-1831554 | ||
| (State or other jurisdiction of incorporation or organization) |
(Primary Standard Industrial Classification Code Number) |
(I.R.S. Employer Identification Number) |
8834 Mayfield Road
Chesterland, Ohio 44026
(800) 255-7263
(Address, including zip code, and telephone number, including area code, of registrant’s principal executive offices)
Jenniffer D. Deckard
President and Chief Executive Officer
FMSA Holdings Inc.
8834 Mayfield Road
Chesterland, Ohio 44026
(800) 255-7263
(Name, address, including zip code, and telephone number, including area code, of agent for service)
Copies of all communications, including communications sent to agent for service, should be sent to:
| David P. Oelman | J. Michael Chambers | |
| Alan Beck | Sean T. Wheeler | |
| Vinson & Elkins L.L.P. | Latham & Watkins LLP | |
| 1001 Fannin Street, Suite 2500 | 811 Main Street, Suite 3700 | |
| Houston, Texas 77002 | Houston, Texas 77002 | |
| (713) 758-2222 | (713) 546-5400 |
Approximate date of commencement of proposed sale to the public: As soon as practicable after this Registration Statement becomes effective.
If any of the securities being registered on this Form are to be offered on a delayed or continuous basis pursuant to Rule 415 under the Securities Act of 1933, check the following box: ¨
If this Form is filed to register additional securities for an offering pursuant to Rule 462(b) under the Securities Act, please check the following box and list the Securities Act registration statement number of the earlier effective registration statement for the same offering. ¨
If this Form is a post-effective amendment filed pursuant to Rule 462(c) under the Securities Act, check the following box and list the Securities Act registration statement number of the earlier effective registration statement for the same offering. ¨
If this Form is a post-effective amendment filed pursuant to Rule 462(d) under the Securities Act, check the following box and list the Securities Act registration statement number of the earlier effective registration statement for the same offering. ¨
Indicate by check mark whether the registrant is a large accelerated filer, an accelerated filer, a non-accelerated filer, or a smaller reporting company. See the definitions of “large accelerated filer,” “accelerated filer” and “smaller reporting company” in Rule 12b-2 of the Exchange Act. (Check one):
| Large accelerated filer ¨ | Accelerated filer ¨ | Non-accelerated filer þ | Smaller reporting company ¨ | |||
| (Do not check if a smaller reporting company) |
The registrant hereby amends this registration statement on such date or dates as may be necessary to delay its effective date until the registrant shall file a further amendment which specifically states that this registration statement shall thereafter become effective in accordance with Section 8(a) of the Securities Act of 1933, as amended, or until this registration statement shall become effective on such date as the Securities and Exchange Commission, acting pursuant to said Section 8(a), may determine.
Table of Contents
The information in this preliminary prospectus is not complete and may be changed. We may not sell these securities until the registration statement filed with the Securities and Exchange Commission becomes effective. This preliminary prospectus is not an offer to sell these securities and we are not soliciting an offer to buy these securities in any jurisdiction where the offer or sale is not permitted.
PRELIMINARY PROSPECTUS
(Subject to Completion, dated September 15, 2014)
Shares

FMSA Holdings Inc.
COMMON STOCK
This is the initial public offering of the common stock of FMSA Holdings Inc., a Delaware corporation. We are not offering any shares of our common stock. The selling stockholders identified in this prospectus are offering shares of our common stock. We will not receive any proceeds from the sale of shares by the selling stockholders. No public market currently exists for our common stock. We are an “emerging growth company” and are eligible for reduced reporting requirements. Please see “Prospectus Summary—Emerging Growth Company Status.”
We have applied to list our common stock on the New York Stock Exchange under the symbol “FMSA.”
We anticipate that the initial public offering price will be between $ and $ per share.
Investing in our common stock involves risks. Please see “Risk Factors” beginning on page 13 of this prospectus.
| Per share |
Total |
|||||||
| Price to the public |
$ | $ | ||||||
| Underwriting discounts and commissions (1) |
$ | $ | ||||||
| Proceeds to the selling stockholders (before expenses) |
$ | $ | ||||||
| (1) | Please see “Underwriting” for a description of all underwriting compensation payable in connection with this offering. |
The selling stockholders have granted the underwriters the option to purchase up to additional shares of common stock on the same terms and conditions set forth above if the underwriters sell more than shares of common stock in this offering.
Neither the Securities and Exchange Commission nor any state securities commission has approved or disapproved of these securities or passed on the adequacy or accuracy of this prospectus. Any representation to the contrary is a criminal offense.
The underwriters expect to deliver the shares on or about , 2014.
| Morgan Stanley | Wells Fargo Securities | Barclays | ||||||||
| Goldman, Sachs & Co. | Jefferies | J.P. Morgan | ||
| KeyBanc Capital Markets | RBC Capital Markets |
| Baird | Cowen and Company | |
| PNC Capital Markets LLC | Raymond James | |
| Scotiabank / Howard Weil | Simmons & Company International | |
| Tudor, Pickering, Holt & Co. | ||
Prospectus dated , 2014
Table of Contents

Table of Contents
| 1 | ||||
| 13 | ||||
| 34 | ||||
| 36 | ||||
| 37 | ||||
| 37 | ||||
| 38 | ||||
| SELECTED HISTORICAL CONSOLIDATED FINANCIAL AND OPERATING DATA |
39 | |||
| MANAGEMENT’S DISCUSSION AND ANALYSIS OF FINANCIAL CONDITION AND RESULTS OF OPERATIONS |
41 | |||
| 60 | ||||
| 68 | ||||
| 96 | ||||
| 100 | ||||
| 111 | ||||
| 116 | ||||
| 118 | ||||
| 123 | ||||
| MATERIAL U.S. FEDERAL INCOME TAX CONSIDERATIONS FOR NON-U.S. HOLDERS |
125 | |||
| 129 | ||||
| 135 | ||||
| 135 | ||||
| 135 | ||||
| F-1 | ||||
| A-1 |
You should rely only on the information contained in this prospectus and any free writing prospectus prepared by us or on behalf of us or to the information which we have referred you. Neither we, the selling stockholders nor the underwriters have authorized anyone to provide you with information different from that contained in this prospectus and any free writing prospectus. We take no responsibility for, and can provide no assurance as to the reliability of, any other information that others may give you. We, the selling stockholders and the underwriters are offering to sell shares of common stock and seeking offers to buy shares of common stock only in jurisdictions where offers and sales are permitted. The information in this prospectus is accurate only as of the date of this prospectus, regardless of the time of delivery of this prospectus or any sale of the common stock. Our business, financial condition, results of operations and prospects may have changed since that date.
This prospectus contains forward-looking statements that are subject to a number of risks and uncertainties, many of which are beyond our control. See “Risk Factors” and “Forward-Looking Statements.”
i
Table of Contents
INDUSTRY AND MARKET DATA
The market data and certain other statistical information used throughout this prospectus are based on independent industry publications, government publications and other published independent sources. The industry data sourced from The Freedonia Group is from their Industry Study #3160, “Well Stimulation Materials,” published in June 2014. The industry data sourced from PacWest Consulting Partners is from their “Proppant Market Analysis: 13Q4 Release,” published in March 2014. Investors are cautioned not to place undue reliance on the market related research statistics. The market data regarding supply and demand is difficult to quantify as the proppant industry continues to evolve and many market participants are privately held, making accurate estimates of supply capacity and market demand difficult to qualify. Some data is also based on our good faith estimates. Although these are third-party sources, we acknowledge our responsibility for all disclosures in this prospectus. The industry in which we operate is subject to a high degree of uncertainty and risk due to a variety of factors, including those described in the section entitled “Risk Factors.” These and other factors could cause results to differ materially from those expressed in these publications.
TRADEMARKS AND TRADE NAMES
We own or have rights to various trademarks, service marks and trade names that we use in connection with the operation of our business. This prospectus may also contain trademarks, service marks and trade names of third parties, which are the property of their respective owners. Our use or display of third parties’ trademarks, service marks, trade names or products in this prospectus is not intended to, and does not imply a relationship with, or endorsement or sponsorship by us. Solely for convenience, the trademarks, service marks and trade names referred to in this prospectus may appear without the ®, TM or SM symbols, but such references are not intended to indicate, in any way, that we will not assert, to the fullest extent under applicable law, our rights or the rights of the applicable licensor to these trademarks, service marks and trade names.
ii
Table of Contents
This summary highlights information contained elsewhere in this prospectus. This summary does not contain all of the information that you should consider before investing in our common stock. For a more complete understanding of us and this offering, you should read and carefully consider the entire prospectus, including the more detailed information set forth under “Risk Factors” and “Management’s Discussion and Analysis of Financial Condition and Results of Operations” and our consolidated financial statements and the related notes. Some of the statements in this prospectus are forward-looking statements. See “Forward-Looking Statements.” Unless we state otherwise or the context otherwise requires, the terms “we,” “us,” “our,” “Fairmount Santrol,” “our business” and “our company” refer to FMSA Holdings Inc. and its consolidated subsidiaries and predecessor companies. On August 15, 2014, FML Holdings, Inc. changed its name to “FMSA Holdings Inc.” We include a glossary of some of the terms used in this prospectus as Appendix A. Unless otherwise indicated, information in this prospectus is adjusted to reflect the for stock split to be effected prior to the effective date of the registration statement of which this prospectus forms a part.
Our Company
We are one of the world’s largest providers of sand-based proppant solutions and for over 30 years have been a pioneer in the development of high performance proppants used by oilfield service and exploration and production (“E&P”) companies to enhance the productivity of their oil and gas wells. Fairmount Santrol offers the broadest range of proppants available in the market today, including high quality sand and a spectrum of resin coated products, all of which exceed American Petroleum Institute (“API”) specifications. Additionally, for more than 120 years, we and our predecessor companies have provided high quality sand-based products, strong technical leadership and applications knowledge to end users in the foundry, glass, building products, and sports and recreation markets (collectively the Industrial and Recreational, or the “I&R” markets). We believe our two primary market segments are complementary. Our ability to sell to a wide range of customers across multiple end markets allows us to maximize the economic recovery of our reserve base.
As one of the nation’s longest continuously operating mining organizations, we have developed a strong commitment to environmental stewardship and to the three pillars of Sustainable Development: People, Planet and Prosperity. Our strong commitment to safety is reflected in the health and safety of our employees and is illustrated by having achieved a lost-time incident rate that is less than half the industry average. From 2011 through June 30, 2014, our employees have demonstrated our commitment to our communities by donating approximately 36,000 hours of company-paid volunteer time, as well as significant personal volunteer time, into the communities in which we live and operate. We are focused on environmental stewardship, and ten of our facilities now generate zero waste to landfills. Additionally, we have successfully executed annual initiatives to reduce our carbon emissions and have planted over 225,000 trees since 2011 in order to offset our Tier I and Tier II carbon emissions. We believe adhering to sustainable development principles is not only the right thing to do, but also results in a higher level of engagement and commitment from our employees, better relationships with our communities and, as a result, a stronger base from which to pursue profitable growth over the long-term. Abiding by these guiding principles, our corporate motto is “Do Good. Do Well.”
We began investing in large scale proppant production capacity in the early 1980s, leveraging our early industry relationships with Halliburton and a predecessor company to Baker Hughes. Since then, our business, and particularly our Proppant Solutions segment, has grown significantly. Today we have vertically integrated operations that combine mining, sand processing, and resin manufacturing and coating operations with a broad logistics network and state-of-the-art research and development capabilities. Our ability to leverage our integrated asset base to provide comprehensive proppant solutions has allowed us to become a long-term, trusted partner to our customers.
1
Table of Contents
Our primary attributes include:
| • | Sand Reserves and Processing Assets. We have one of the largest sand reserves and processing asset bases in the industry, including, as of December 31, 2013, 798.2 million tons of proven mineral reserves, 11 active sand processing facilities with 12.3 million tons of annual sand processing capacity, a resin manufacturing facility and 11 coating facilities with 2.4 million tons of annual coating capacity. From 2009 to 2013, we expanded our annual raw frac sand and coating capacities by approximately 6.0 million and 1.5 million tons, respectively, through a combination of organic growth and acquisitions. Our coating facilities include operations in Mexico, Denmark and China, through which we serve international oil and gas markets. |
| • | Product Delivery. We are capable of Class I railroad deliveries to each of North America’s major oil and gas producing basins and we also have the flexibility to ship our product via barge and trucks to reach our customers in certain basins. We operate an integrated logistics platform consisting of 46 proppant distribution terminals with significant associated storage, 32 of which exclusively handle our products. Since 2011, we have developed or acquired 24 distribution terminals, providing significant additional annual transloading capacity. We also service I&R end markets through seven additional terminals. As of August 15, 2014, we had a fleet of over 8,500 railcars and expect this fleet to grow to over 13,000 through 2016. By the end of the third quarter of 2014, we also expect to have expanded our unit train capabilities to three production facilities and three in-basin terminals, which we expect to reduce freight costs and improve cycle times for our railcar fleet. |
| • | Customers. We currently have approximately 80 proppant customers, including the largest U.S. pressure pumping companies, and a total of nearly 850 customers across all end markets. Our goal is to create long-term, partnering relationships with our customers. We sell product on a purchase order basis and through supply agreements. The majority of our proppant supply agreements have market-based pricing and volumetric provisions based on our customer’s requirements, which we believe has strengthened our customer relationships over multiple market cycles. |
| • | Innovation. We have an established history of proppant innovation and we continue to make substantial investments in engineering, research and development and technical marketing. We pioneered the manufacturing and use of resin coated proppant and continue to introduce new and innovative products. For example PowerProp, our coated product with the greatest crush resistance, has characteristics competitive with lightweight ceramics. We are currently field testing a brand new technology, Propel SSP. This proppant transport technology is a new proppant category in which a polymer, wrapped around sand or ceramic, swells upon contact with water. The shear-stable polymer suspends the proppant in water, transporting each grain farther and higher into fractures. Polymer breaking occurs with conventional chemistry. This better transport expands the hydrocarbon drainage radius with a maximized propped fracture area to increase ultimate recovery. |
We are experiencing high demand for our products and our business is currently experiencing significant growth. Our revenues have grown at a compound annual growth rate of approximately 19% and 25% since 2004 and 2009, respectively. Since 2011, our revenues have grown at a rate of 4% as the market for resin-coated products softened. We have seen considerable strengthening in both the raw and resin-coated markets in 2014, and our revenues for the first six months of this year are up by 40% compared to the same period last year (please see “Results of Operations” beginning on page 47 for further discussion of factors impacting our revenue growth).
For the year ended December 31, 2013, we sold over 7.5 million tons, generated $988 million in revenues, $293 million of Adjusted EBITDA and $105 million of net income. We cannot provide any assurance that we will achieve these growth rates or margins in the future. For a definition of “Adjusted EBITDA” and a reconciliation of Adjusted EBITDA to its most directly comparable financial measures calculated and presented in accordance with generally accepted accounting principles (“GAAP”), please read “—Summary Historical Consolidated Financial and Operating Data—Non-GAAP Financial Measures” beginning on page 10.
2
Table of Contents
Our Competitive Strengths
We believe that we are well positioned to execute our strategy based on the following competitive strengths:
A Leading Proppant Producer; Broadest Product Suite. We have a broad suite of products that address more than 90% of the proppant market. According to PacWest Consulting Partners, we were the second largest supplier of raw frac sand and the largest supplier of resin coated sand in 2013, based on our production capacity and coating capacity, respectively. Our raw sand product suite includes all mesh sizes of high performing API-spec Northern White frac sand and our branded API-spec Texas Gold brown frac sand, which enjoys a delivered cost advantage to certain basins, including the Eagle Ford Shale and Permian Basin. Our portfolio of resin coated products provides a range of strength, flowback and conductivity characteristics. Our product breadth allows us to offer a comprehensive proppant solution across a broad range of well characteristics and our scale provides us with the flexibility to fill large individual orders, often on short notice. As proppant consumption per well has increased, and completion solutions are increasingly tailored, we believe that our scale and product breadth provide us with a competitive advantage.
Industry’s Largest Captive Terminal Footprint and Broadest Logistics Capabilities. In recent years, oilfield service companies have increasingly sought proppant suppliers with logistics capabilities to deliver product in-basin. We sell our proppants directly to customers in all of North America’s major oil and gas producing basins through our 46 proppant distribution terminals, the largest logistics network in the industry. In 2013, approximately 80% of our proppant volume was sold in-basin at one of our distribution terminals, compared to approximately 65% in 2012. We ship our products via North America’s Class I railroads in our fleet of more than 8,500 railcars as of August 15, 2014, which includes approximately 790 railcars made available to us by our customers. By the third quarter of 2014, we expect to have expanded our unit train capabilities to three of our processing facilities and three of our in-basin terminals. We expect these unit train capabilities will reduce our freight costs and improve cycle times for our railcar fleet. We also have the flexibility to ship our product via barge and truck to multiple basins. Importantly, over 70% of our terminal capacity exclusively handles our products. Taken together, we believe the significant scale our distribution network, its geographic scope, and our captive terminal strategy provide us with a competitive advantage.
Focus on Innovation and New Product Development. We have a history of collaborating with our customers to develop innovative solutions to enhance the effectiveness of well completions, from conventional wells to the most complex, multi-stage, horizontal wells. Our vertically integrated model allows us to participate in each phase of proppant development, manufacturing and delivery and provides us a unique perspective into the current and future needs of our customers. Our technical sales team works closely with market participants to demonstrate the value proposition of our performance proppants in order to stimulate market demand. In 1976, our predecessor pioneered the development of resin coated proppants and we have been issued numerous related patents. Our product developments include OptiProp, SLC, THS, PowerProp and CoolSet, each with uniquely tailored down-hole performance characteristics. After acquiring the technology that underlies Propel SSP in May 2013, our team worked to further refine the product’s technology and manufacturing technique. We have successfully produced and shipped Propel SSP in commercial quantities to several key customers who are currently testing the product in field trials.
Trusted Partner to Our Customers. We are a trusted partner and have significant long-term relationships with each of the four largest U.S. pressure pumping companies, who together represent approximately 65% of the market, as well as many small and mid-sized oilfield service companies. These customer relationships are driven by our ability to enhance our customers’ operations and profitability by delivering a full suite of high-quality proppant products, where, when and as-needed. These benefits also extend to the E&P companies serviced by our service company customers, who directly benefit from the enhanced well productivity that our products offer. We believe our customers value the ability of our substantial scale, product diversity and extensive logistics network to meet their evolving proppant needs.
3
Table of Contents
Efficient Operations and Economies of Scale Support Strong Cash Flow Generation. Our vertically integrated operations, low production costs and low maintenance capital expenditures have enabled us to be profitable and generate positive cash flows over an extended period. We own a substantial majority of our reserves, and our processing plants are located on or in close proximity to rail access, reducing the need for on-road transportation and minimizing product movement costs. Our integrated logistics management expertise and geographically advantaged facility network enables us to reliably ship products by the most cost-effective method available. We believe our significant and growing cash flow will enable us to continue to invest in additional sand production, processing, coating and terminal facilities as well as research and development for new products.
Experienced Management Team Aligned with Stockholders. We have an experienced leadership team with extensive industry knowledge and a proven track record of profitable growth. Our executive management team has developed new product offerings and process technologies, and has grown our business through greenfield mine development, capacity expansions, acquisitions and investments in logistics infrastructure. Most of our executive management team has been at Fairmount Santrol for 20 years or more, and as of December 31, 2013 our revenue had grown at a compound annual growth rate of approximately 14% and 25% since 1994 and 2009, respectively. Our founders remain active advisors to our management and are members of our board of directors. Pro forma for this offering, our management, employees and founders will own approximately % of our outstanding common stock. Accordingly, our executive management team and our employees are aligned with our investors and highly incentivized to pursue long-term, profitable growth and a high return on capital deployed.
Our Strategy
Our objective is to create long-term and sustainable value for our stakeholders. We intend to pursue this objective through the execution of the following strategies:
Increase Reserves and Processing Capacity. We have historically grown our reserves and mining and processing capacities by developing greenfield sites, expanding existing facilities and acquiring operating assets and reserves. From 2009 to 2013, we expanded our annual raw frac sand capacity by approximately 6.0 million tons and our annual coating capacity by 1.5 million tons. Currently, we believe our customers’ demand for our products exceeds our production capacity. Accordingly, we expect to continue to invest in production capacity and new reserves. In 2013, we acquired an idled 1.0 million ton per year frac sand processing facility in Brewer, Missouri from FTS International Services, LLC (“FTSI”) and expect to resume operations at this facility within the next six months. We also expect to increase annual frac sand production capacity at a current facility by 1.5 million tons by the end of the first quarter of 2016. In addition to these expansions, we control, or have an option to control, additional reserves on four properties (three with Northern White reserves, one with Texas Gold) and expect to develop one or two frac sand facilities on these greenfield sites by mid-2016. In order to ensure that we have adequate capacities and reserves to meet future demand, we have an active pipeline of expansion opportunities in varying stages of development. We currently have 2.4 million tons of annual coating capacity and are in the process of expanding these capacities by an additional 0.8 million tons per year by the fourth quarter of 2015. We will continue to evaluate the opportunity to expand coating capacity based on market demand for coated products.
Expand Logistics Capabilities. Since 2011, we have developed or acquired 24 distribution terminals, providing 13.1 million tons of additional annual transloading capacity. We will continue to invest in terminals, storage and rail infrastructure as our customers continue to demand more product delivered closer to producing basins. We will also continue to enhance our unit train capabilities to reduce freight costs and improve cycle times for our railcar fleet. Since 2009, we have increased our railcar fleet by approximately 140% and expect to increase the size of our railcar fleet by over 35% through the second half of 2015 to accommodate our growing customer demands.
4
Table of Contents
Increase Market Penetration of Our Resin Coated Proppants. We believe that resin coated proppants offer compelling performance advantages relative to other proppants. Our field data indicates that high quality resin coated proppants enhance oil and gas reservoir conductivity compared to raw sand and are a cost-effective alternative to lightweight ceramic proppants. Field data also indicate that resin coated proppants reduce proppant flowback. Our resin coating capacity is the largest in the industry, providing our customers enhanced assurance of supply. Due to superior performance and value added formulation and manufacturing processes, sales of our resin coated products generate a higher per ton profit as compared to our raw frac sand. We will continue to work with market participants by hosting technical sales meetings, obtaining field data, and producing scientific papers which highlight the value proposition of resin coated proppant. Through these efforts, we will seek to increase overall market penetration of our resin coated proppant.
Develop and Commercialize High Performance Proprietary Proppants. We pioneered the manufacturing and use of resin coated proppants and have a history of developing innovative technologies that increase the effectiveness of downhole completions, from conventional wells to the most complex, multi-stage horizontal wells. In 2012, we made a significant investment in a new state-of-the-art research and development facility and strengthened our team of scientists, material engineers and process engineers focused on developing innovative and proprietary proppants. As a result of our commitment, our new product development record is strong. For example, we successfully developed and commercialized PowerProp, a patented resin coated sand proppant with characteristics competitive with lightweight ceramic proppants, and CoolSet, a resin coated sand proppant that works at low temperatures with no chemical activators. Additionally, we are currently conducting field trials for Propel SSP after developing a commercialized processing capability and expect full commercial launch by early 2015. We are in constant dialogue with our customers regarding evolving product needs and have a number of new products in various stages of development.
Execute all of our Corporate Initiatives with a Commitment to Customers, Employees and Communities. Our corporate culture emphasizes People, Planet and Prosperity, and our sustainability strategy defines our approach to operations and community engagement. We work to minimize our environmental impact and continue to find ways to reduce waste while also reducing operating costs. We are honored to receive recognition from our communities for our focus on sustainable mining practices, reclamation and community investment. We believe that positive community engagement is both a privilege and a responsibility, and that it enhances our ability to recruit and retain employees, obtain mining and other operating permits and strengthen relationships with our customers. Our corporate motto is “Do Good. Do Well” and we intend to continue to execute our growth strategy with a focus on sustainable development.
Industry Trends
Over the past decade, E&P companies have increasingly focused on exploiting the vast hydrocarbon reserves contained in North America’s oil and gas reservoirs. Using advanced techniques, such as horizontal drilling and hydraulic fracturing, North American production of oil and gas has grown rapidly as the development of horizontal drilling technologies has evolved. More recently, E&P companies are increasing their focus on optimizing the use of proppant as a critical component of these efforts to improve well productivity and maximize their returns on invested capital.
This focus on efficiency and profitability has led to new development techniques, such as increased use of pad drilling which results in a greater number of wells drilled per rig, and incorporating longer lateral lengths and shorter intervals between frac stages, which results in more fracturing stages per well. In addition, the amount of proppant used per stage has increased dramatically, compounding the increase in total demand for proppant. In recent months, individual wells have been completed with more than 6,000 tons of proppant, which is the equivalent of 60 railcars or 240 truckloads. This represents a several fold increase in large scale completions from just a few years ago.
5
Table of Contents
Both E&P companies as well as oilfield service providers with whom they contract, are more precisely selecting the type and volume of proppants employed to optimize conductivity and improve well productivity. Specifications for proppant type and quantity can be made by the E&P companies, the oilfield service providers or collaboratively. These specifications are resulting in not only the use of increasing amounts of proppant per well, they are also incorporating a broader selection of proppant types, a wider range of mesh sizes, and a selection of high performance proppants to tailor the proppant solution to the specific geologic characteristics of the well. Furthermore, both E&P companies and oilfield service providers are investing in value-added proppants when the improvement in well production and efficiencies justifies the increased proppant investment. These recent trends are resulting in increased demand for resin coated proppants, which provides enhanced performance characteristics relative to raw sand but at a lower cost than ceramic proppants.
As a result of these trends, according to The Freedonia Group, an international business research company, U.S. demand for all proppants has increased rapidly, growing at an average annual rate of 26% from 2008 to 2013, when proppant sales reached more than 31 million tons. The Freedonia Group estimates that total annual proppant sales will exceed 49 million tons in 2018 and 74 million tons by 2023. They also estimate that resin coated sands and other value added products will comprise a growing share of the overall proppant market. The market for resin coated sand is expected to grow 10.5% annually through 2018 as compared to 9.3% for raw frac sand and 9.0% for ceramic proppants according to the Freedonia Group’s estimates.
As demand for sand-based proppants has increased dramatically in recent years, the supply of quality API-spec raw frac sand has struggled to keep pace, resulting, at times, in a supply-demand disparity. While a number of existing and new proppant vendors have announced supply expansions and greenfield projects, we do not expect the magnitude of these supply expansions to fully meet the expected growth in demand. There are numerous key constraints to increasing raw frac sand production on an industry-wide basis, including:
| • | the difficulty of finding frac sand deposits that meet API specifications; |
| • | the difficulty of securing contiguous frac sand reserves large enough to justify the capital investment required to develop a processing facility; |
| • | the challenges of identifying reserves with the above characteristics that are either located in close proximity to oil and gas reservoirs or have rail access needed for low-cost transportation to major shale basins; |
| • | the hurdles of securing mining, production, water, air, refuse and other federal, state and local operating permits from the proper authorities; |
| • | local opposition to the development of mining facilities, especially those that require the use of on-road transportation, including moratoria on raw frac sand facilities in multiple counties in Wisconsin and Minnesota which hold potential sand reserves; and |
| • | proximity to logistics infrastructure and the ability to develop comprehensive logistics capabilities. |
E&P companies’ and oilfield service providers’ preferences and expectations have also been evolving in recent years. A proppant vendor’s logistics capabilities have become an important differentiating factor when competing for business, on both a spot and contract basis. Proppant consumers have an increasing preference for convenient in-basin proppant delivery capability. We believe that, over time, the largest proppant customers will prefer to consolidate their purchases across a smaller group of suppliers with robust logistics capabilities and a broad offering of high performance proppants.
Risk Factors
Investing in our common stock involves risks that include the demand for sand-based proppants and other risks. For a discussion of these risks and other considerations that could negatively affect us, including risks related to this offering and our common stock, see “Risk Factors” and “Forward-Looking Statements.”
6
Table of Contents
Ownership
We have a long history of employee ownership as well as ownership by financial sponsors. Our current ownership is comprised of employees, including members of our management team and our employee stock bonus plan, our founders, other non-employee stockholders and ASP FML Holdings, LLC (“ASP FML”), an affiliate of American Securities LLC (“American Securities”). American Securities is a leading U.S. middle-market private equity firm that invests in market-leading North American companies. American Securities currently has over $10 billion of assets under management and is investing from its sixth fund. American Securities focuses its core investments in the industrial sector including general industrial, aerospace and defense, agriculture, environmental, recycling paper and packaging, power and energy, and specialty chemicals. American Securities has a proven track record of successfully working with management teams to develop and implement strategies for sustained profitability.
Emerging Growth Company Status
We are an “emerging growth company” as defined in the Jumpstart Our Business Startups Act, or “JOBS Act.” For as long as we are an emerging growth company, unlike other public companies, we will not be required to:
| • | provide an auditor’s attestation report on management’s assessment of the effectiveness of our system of internal control over financial reporting pursuant to Section 404(b) of the Sarbanes-Oxley Act of 2002; |
| • | comply with any new requirements adopted by the Public Company Accounting Oversight Board, or the PCAOB, requiring mandatory audit firm rotation or a supplement to the auditor’s report in which the auditor would be required to provide additional information about the audit and the financial statements of the issuer; |
| • | comply with any new audit rules adopted by the PCAOB after April 5, 2012, unless the Securities and Exchange Commission determines otherwise; |
| • | provide certain disclosure regarding executive compensation required of larger public companies; or |
| • | obtain stockholder approval of any golden parachute payments not previously approved. |
We will cease to be an “emerging growth company” upon the earliest of:
| • | when we have $1.0 billion or more in annual revenues; |
| • | when we have at least $700 million in market value of our common stock held by non-affiliates; |
| • | when we issue more than $1.0 billion of non-convertible debt over a three-year period; or |
| • | the last day of the fiscal year following the fifth anniversary of our initial public offering. |
In addition, Section 107 of the JOBS Act also provides that an emerging growth company can take advantage of the extended transition period provided in Section 7(a)(2)(B) of the Securities Act for complying with new or revised accounting standards. In other words, an emerging growth company can delay the adoption of certain accounting standards until those standards would otherwise apply to private companies. However, we are choosing to “opt out” of such extended transition period and, as a result, will comply with new or revised accounting standards on the relevant dates on which adoption of such standards is required for non-emerging growth companies. Section 107 of the JOBS Act provides that our decision to opt out of the extended transition period for complying with new or revised accounting standards is irrevocable.
Stock Split
On , 2014, we amended and restated our Second Amended and Restated Certificate of Incorporation to effect a for stock split of our issued and outstanding common stock. For additional information, see “Stock Split.”
7
Table of Contents
Corporate History Information
We were incorporated as a Delaware corporation in 1986. Our predecessor companies began operations over 120 years ago. In August 2010, we partnered with American Securities when affiliated funds managed by American Securities (collectively with American Securities, the “AS Group”) acquired indirect control over ASP FML, who acquired 51% of our stock (the “AS Group Acquisition”). Our corporate headquarters is located at 8834 Mayfield Road, Chesterland, Ohio 44026. Our telephone number is (800) 255-7263. Following the completion of this offering, our website will be located at www.fairmountsantrol.com. The information on our website is not deemed to be part of this prospectus.
8
Table of Contents
The Offering
| Common stock offered by the selling stockholders |
shares (or shares, if the underwriters exercise in full their option to purchase additional shares) |
| Common stock to be outstanding after the offering |
shares |
| Common stock owned by the selling stockholders after the offering |
shares (or shares, if the underwriters exercise in full their option to purchase additional shares) |
| Over-allotment option |
The selling stockholders have granted the underwriters a 30-day option to purchase up to an aggregate of additional shares of our common stock to cover over-allotments. |
| Use of proceeds |
We will not receive any of the proceeds from the sale of shares of our common stock by the selling stockholders. |
| Dividend policy |
We do not anticipate paying any cash dividends on our common stock. In addition, our revolving credit facility and term loans place certain restrictions on our ability to pay cash dividends. |
| Listing and trading symbol |
We have applied to list our common stock on the New York Stock Exchange (“NYSE”) under the symbol “FMSA.” |
The information above excludes 519,113 shares ( shares after giving effect to our proposed stock split) of common stock issuable upon the exercise of stock options outstanding as of June 30, 2014 under our existing equity incentive plan, as well as shares of common stock reserved for issuance under our new 2014 Long-Term Incentive Plan, or the LTIP, that we intend to adopt in connection with the completion of this offering.
Unless otherwise indicated, all information in this prospectus reflects and assumes the for stock split of our common stock to be effected prior to the effective date of the registration statement of which this prospectus forms a part.
9
Table of Contents
Summary Historical Consolidated Financial and Operating Data
The following table sets forth our summary historical consolidated financial and operating data as of the dates and for the periods indicated. We have derived the summary historical consolidated financial and operating data as of and for the years ended December 31, 2009, 2010 and 2011 from our unaudited consolidated financial statements, which are not included in this prospectus. We have derived the summary historical consolidated financial and operating data as of, and for the years ended December 31, 2012 and 2013 from our audited consolidated financial statements, which are included elsewhere in this prospectus. We have derived the summary historical consolidated financial and operating data for the six months ended June 30, 2013 and as of and for the six months ended June 30, 2014 from our unaudited condensed consolidated financial statements that are included elsewhere in this prospectus. We have derived the financial data as of June 30, 2013 from our unaudited condensed consolidated financial statements that are not included in this prospectus. Our unaudited condensed consolidated financial statements have been prepared on the same basis as our audited consolidated financial statements and, in our opinion, include all adjustments, consisting of normal recurring adjustments, that we consider necessary for a fair presentation of our financial position, results of operations and cash flows for such periods. Historical results are not necessarily indicative of future results.
The summary historical consolidated data presented below should be read in conjunction with “Risk Factors,” “Management’s Discussion and Analysis of Financial Condition and Results of Operations” and our consolidated financial statements and the related notes and other financial data included elsewhere in this prospectus.
| Year Ended December 31, | Six Months Ended June 30, |
|||||||||||||||||||||||||||
| 2009 | 2010 | 2011 | 2012 | 2013 | 2013 | 2014 | ||||||||||||||||||||||
| (In thousands) | ||||||||||||||||||||||||||||
| Statement of Income Data: |
||||||||||||||||||||||||||||
| Revenue |
$ | 398,660 | $ | 667,089 | $ | 909,742 | $ | 885,190 | $ | 988,386 | $ | 448,241 | $ | 629,223 | ||||||||||||||
| Income from operations |
78,711 | 173,034 | 296,903 | 278,426 | 227,956 | 125,621 | 146,246 | |||||||||||||||||||||
| Income before provision for income taxes |
69,526 | 146,602 | 217,855 | 219,842 | 149,876 | 98,510 | 111,227 | |||||||||||||||||||||
| Net income |
49,506 | 100,494 | 146,098 | 149,473 | 104,657 | 68,816 | 78,815 | |||||||||||||||||||||
| Net income attributable to FML Holdings, Inc. |
48,901 | 99,454 | 145,183 | 148,886 | 103,961 | 68,564 | 78,460 | |||||||||||||||||||||
| Earnings per share: |
||||||||||||||||||||||||||||
| Basic(1) |
n/a | n/a | $ | 32.28 | $ | 32.49 | $ | 22.66 | $ | 14.95 | $ | 17.04 | ||||||||||||||||
| Diluted(1) |
n/a | n/a | $ | 30.70 | $ | 30.80 | $ | 21.47 | $ | 14.17 | $ | 16.11 | ||||||||||||||||
| Statement of Cash Flows Data: |
||||||||||||||||||||||||||||
| Net cash provided by (used in): |
||||||||||||||||||||||||||||
| Operating activities |
$ | 96,566 | $ | 75,722 | $ | 167,861 | $ | 186,433 | $ | 174,635 | $ | 93,657 | $ | 49,982 | ||||||||||||||
| Investing activities |
(13,156 | ) | (45,165 | ) | (102,572 | ) | (107,366 | ) | (579,517 | ) | (161,575 | ) | (60,613 | ) | ||||||||||||||
| Financing activities |
(82,076 | ) | 3,783 | (49,202 | ) | (119,070 | ) | 410,515 | 70,901 | 5,347 | ||||||||||||||||||
| Other Financial Data: |
||||||||||||||||||||||||||||
| Capital expenditures |
$ | 20,158 | $ | 41,928 | $ | 77,827 | $ | 109,016 | $ | 111,514 | $ | 41,276 | $ | 61,827 | ||||||||||||||
| EBITDA(2) |
96,522 | 192,820 | 303,227 | 303,659 | 248,877 | 140,352 | 172,872 | |||||||||||||||||||||
| Adjusted EBITDA(2) |
102,854 | 239,144 | 335,110 | 318,650 | 292,584 | 146,330 | 179,984 | |||||||||||||||||||||
| Operating Data: |
||||||||||||||||||||||||||||
| Proppant Solutions: |
||||||||||||||||||||||||||||
| Total tons sold |
1,730 | 2,609 | 3,402 | 3,765 | 5,117 | 2,134 | 3,352 | |||||||||||||||||||||
| Revenue |
$ | 325,542 | $ | 580,117 | $ | 807,849 | $ | 757,851 | $ | 856,212 | $ | 378,286 | $ | 567,185 | ||||||||||||||
| Average selling price (per ton) |
$ | 188 | $ | 222 | $ | 237 | $ | 201 | $ | 167 | $ | 177 | $ | 169 | ||||||||||||||
| Segment contribution margin(3) |
n/a | 248,187 | 339,050 | 316,251 | 296,320 | 150,267 | 192,928 | |||||||||||||||||||||
| Industrial & Recreational Products: |
||||||||||||||||||||||||||||
| Total tons sold |
1,918 | 2,228 | 2,296 | 2,375 | 2,462 | 1,261 | 1,193 | |||||||||||||||||||||
| Revenue |
$ | 73,118 | $ | 86,972 | $ | 101,893 | $ | 127,339 | $ | 132,174 | $ | 69,955 | $ | 62,038 | ||||||||||||||
| Average selling price (per ton) |
$ | 38 | $ | 39 | $ | 44 | $ | 53 | $ | 54 | $ | 55 | $ | 52 | ||||||||||||||
| Segment contribution margin(3) |
n/a | 20,904 | 29,142 | 37,837 | 34,765 | 17,002 | 16,835 | |||||||||||||||||||||
10
Table of Contents
| Year Ended December 31, | Six Months Ended June 30, |
|||||||||||||||||||||||||||
| 2009 | 2010 | 2011 | 2012 | 2013 | 2013 | 2014 | ||||||||||||||||||||||
| (In thousands) | ||||||||||||||||||||||||||||
| Balance Sheet Data (at period end): |
||||||||||||||||||||||||||||
| Cash and cash equivalents |
$ | 3,841 | $ | 38,788 | $ | 51,765 | $ | 11,866 | $ | 17,815 | $ | 14,934 | $ | 12,514 | ||||||||||||||
| Total assets |
340,521 | 522,179 | 646,176 | 679,601 | 1,283,431 | 860,400 | 1,375,488 | |||||||||||||||||||||
| Long term debt (including current portion) |
235,409 | 709,925 | 947,447 | 831,195 | 1,262,146 | 906,010 | 1,264,972 | |||||||||||||||||||||
| Total liabilities |
314,458 | 857,475 | 1,094,168 | 965,529 | 1,448,789 | 1,073,788 | 1,457,461 | |||||||||||||||||||||
| Total equity (deficit)(4) |
26,063 | (335,296 | ) | (447,992 | ) | (285,928 | ) | (165,358 | ) | (213,388 | ) | (81,973 | ) | |||||||||||||||
| (1) | Basic and diluted earnings per share are not disclosed for 2009 and 2010 since they are not considered meaningful for the periods prior to the AS Group Acquisition. |
| (2) | EBITDA and Adjusted EBITDA are non-GAAP financial measures. For a definition of EBITDA and Adjusted EBITDA and a reconciliation to net income, see “—Non GAAP Financial Measures” below. |
| (3) | Segment contribution margin is not available for the year ended December 31, 2009. |
| (4) | The reduction in equity in 2010 resulted from our purchase of treasury stock in connection with the AS Group Acquisition. |
Non-GAAP Financial Measures
We define EBITDA as net income before interest expense, income tax expense, depreciation, depletion, and amortization. We define Adjusted EBITDA as EBITDA before non-cash stock-based compensation, management fees and reimbursement of expenses to sponsor, transaction expenses, impairment of assets, loss on extinguishment of debt, gain or loss on disposal of assets, and other non-cash income or expenses. Management believes EBITDA and Adjusted EBITDA are useful because they allow management to more effectively evaluate our operating performance and compare the results of our operations from period to period without regard to our financing methods or capital structure.
Disclosure in this prospectus of EBITDA and Adjusted EBITDA, which are “non-GAAP financial measures,” as defined under the rules of the SEC, are intended as supplemental measures of our performance that are not required by, or presented in accordance with, GAAP. EBITDA and Adjusted EBITDA should not be considered as alternatives to net income, cash flow provided by operating activities or any other performance measure derived in accordance with GAAP. Our presentation of EBITDA and Adjusted EBITDA should not be construed to imply that our future results will be unaffected by unusual or non-recurring items. EBITDA and Adjusted EBITDA are included in this prospectus because they are key metrics used by management to assess our operating performance. Adjusted EBITDA is also used by our lenders to evaluate our compliance with covenants. Additionally, performance targets associated with our annual incentive plans and stock-based compensation vesting targets are tied to our Adjusted EBITDA.
We believe these measures are meaningful to our investors to enhance their understanding of our financial performance. Although EBITDA and Adjusted EBITDA are not necessarily measures of our ability to fund our cash needs, we understand that they are frequently used by securities analysts, investors and other interested parties as measures of financial performance. Our calculation of Adjusted EBITDA may not be comparable to the similarly titled measure reported by other companies.
11
Table of Contents
The following tables set forth a reconciliation of net income, the most directly comparable GAAP financial measure, to EBITDA and Adjusted EBITDA.
| Year Ended December 31, | Six Months Ended June 30, |
|||||||||||||||||||||||||||
| 2009 | 2010 | 2011 | 2012 | 2013 | 2013 | 2014 | ||||||||||||||||||||||
| (In thousands) | ||||||||||||||||||||||||||||
| Net income attributable to FML Holdings, Inc. |
$ | 48,901 | $ | 99,454 | $ | 145,183 | $ | 148,886 | $ | 103,961 | $ | 68,564 | $ | 78,460 | ||||||||||||||
| Interest expense, net |
8,539 | 22,927 | 64,665 | 56,714 | 61,926 | 26,541 | 34,478 | |||||||||||||||||||||
| Income taxes |
20,020 | 46,108 | 71,757 | 70,369 | 45,219 | 29,694 | 32,412 | |||||||||||||||||||||
| Depreciation, depletion, and amortization |
19,062 | 24,331 | 21,622 | 27,690 | 37,771 | 15,553 | 27,522 | |||||||||||||||||||||
|
|
|
|
|
|
|
|
|
|
|
|
|
|
|
|||||||||||||||
| EBITDA |
96,522 | 192,820 | 303,227 | 303,659 | 248,877 | 140,352 | 172,872 | |||||||||||||||||||||
| Non-cash stock based compensation(1) |
3,906 | 23,278 | 17,539 | 11,434 | 10,133 | 3,709 | 4,313 | |||||||||||||||||||||
| Management fees and reimbursement of expenses paid to sponsor(2) |
— | 503 | 1,119 | 1,274 | 2,928 | 570 | 541 | |||||||||||||||||||||
| Transaction expenses(3) |
580 | 17,536 | — | 1,414 | 12,462 | 1,699 | 637 | |||||||||||||||||||||
| Impairment of long-lived assets(4) |
1,846 | 2,100 | — | 273 | — | — | — | |||||||||||||||||||||
| Loss on extinguishment of debt(5) |
— | — | 12,682 | — | 11,760 | — | — | |||||||||||||||||||||
| (Gain) / Loss on disposal of assets(6) |
— | |
— |
|
|
— |
|
596 | 6,424 | — | — | |||||||||||||||||
| IPO-related fees |
— | — | — | — | — | — | 1,621 | |||||||||||||||||||||
| Non-recurring payments relating to sponsor buyout(7) |
— | 2,907 | 543 | — | — | — | — | |||||||||||||||||||||
|
|
|
|
|
|
|
|
|
|
|
|
|
|
|
|||||||||||||||
| Adjusted EBITDA |
$ | 102,854 | $ | 239,144 | $ | 335,110 | $ | 318,650 | $ | 292,584 | $ | 146,330 | $ | 179,984 | ||||||||||||||
|
|
|
|
|
|
|
|
|
|
|
|
|
|
|
|||||||||||||||
| (1) | Represents cost of stock-based awards issued to our employees attributable to each year presented. |
| (2) | Includes fees and expenses paid to American Securities for ongoing consulting and management services provided pursuant to a management consulting agreement. In connection with the completion of this offering, the management consulting agreement will be terminated. See “Certain Relationships and Related Party Transactions—American Securities.” |
| (3) | These expenses are associated with the evaluation of potential acquisitions of assets or businesses, some of which were completed. Expenses in 2010 are associated with the AS Group Acquisition. |
| (4) | Represents the impairment charges related to certain closed facilities. |
| (5) | Upon entering into new credit facilities, we were required to write-off a portion of the remaining unamortized deferred financing fees related to the previous credit facilities. |
| (6) | Includes the non-cash loss related to the sale and disposal of certain assets, including property, plant and equipment, discontinued inventory and an investment in foreign operations. |
| (7) | Represents the employer portion of income taxes on options that were exercised in connection with the AS Group Acquisition. |
12
Table of Contents
This offering and an investment in our common stock involve a high degree of risk. You should carefully consider the risks described below, together with the financial and other information contained in this prospectus, before you decide to purchase shares of our common stock. If any of the following risks actually occurs, our business, financial condition, results of operations, cash flows and prospects could be materially and adversely affected. As a result, the trading price of our common stock could decline and you could lose all or part of your investment in our common stock.
Risks Related to Our Business
Our business and financial performance depend on the level of activity in the oil and gas industries.
Approximately 87% of our revenues for the year ended December 31, 2013 were derived from sales to companies in the oil and gas industry. As a result, our operations are materially dependent on the levels of activity in oil and gas exploration, development and production. More specifically, the demand for the proppants we produce is closely related to the number of oil and gas wells completed in geological formations where sand-based proppants are used in fracturing activities. These activity levels are affected by both short- and long-term trends in oil and gas prices, among other factors.
In recent years, oil and gas prices and, therefore, the level of exploration, development and production activity, have experienced significant fluctuations. Worldwide economic, political and military events, including war, terrorist activity, events in the Middle East and initiatives by the Organization of the Petroleum Exporting Countries (“OPEC”), have contributed, and are likely to continue to contribute, to price and volume volatility. Furthermore, the availability of key resources that impact drilling activity have experienced significant fluctuations and could impact product demand.
A prolonged reduction in oil and gas prices would generally depress the level of oil and gas exploration, development, production and well completion activity and result in a corresponding decline in the demand for the proppants we produce. Such a decline would likely have a material adverse effect on our business, results of operations and financial condition. In addition, certain U.S. federal income tax deductions currently available with respect to oil and gas exploration and development, including the repeal of the percentage depletion allowance for oil and gas properties, may be eliminated as a result of proposed legislation. Any future decreases in the rate at which oil and gas reserves are discovered or developed, whether due to the passage of legislation, increased governmental regulation leading to limitations or prohibitions on exploration and drilling activity, including hydraulic fracturing, or other factors, could have a material adverse effect on our business, even in a stronger oil natural gas price environment.
Increasing logistics costs, a lack of dependability or availability of transportation services or infrastructure and geographic shifts in demand could have a material adverse effect on our business.
Transportation and handling costs are a significant component of the total delivered cost of our products. In many instances, transportation costs can represent 70 to 80% of the delivered cost of frac sand. The high relative cost of transportation could favor suppliers located in close proximity to the customer. In addition, as we continue to expand our sand-based proppant production, we will need increased investment in transportation infrastructure, including terminals and railcars. We contract with truck, rail, ship and barge services to move sand-based proppants from our production facilities to distribution terminals. Labor disputes, derailments, adverse weather conditions or other environmental events, an increasingly tight railcar leasing market, increased railcar congestion and other changes to rail freight systems could interrupt or limit available transportation services or result in a significant increase in transportation service rates. Increased costs resulting from these types of events that we are not able to pass on to our customers could impair our ability to deliver our products economically to our customers or to expand our markets. Accordingly, because we are so dependent on rail
13
Table of Contents
infrastructure, if there are disruptions of the rail transportation services utilized by us or our customers, and we or our customers are unable to find alternative transportation providers to transport our products, our business and results of operations could be adversely affected.
A significant portion of our distribution infrastructure is located in or near oil and gas producing areas. A shift in demand away from areas where we have significant distribution infrastructure or relocation of our customers’ businesses to areas farther from our plants or distribution infrastructure could have a material adverse effect on our business, financial condition and results of operations.
Our operations are dependent on timely securing and maintaining various permits and approvals from governmental authorities and other third parties.
We hold numerous governmental, environmental, mining and other permits, water rights and approvals authorizing operations at each of our facilities. A decision by a governmental agency or other third party to deny or delay issuing a new or renewed permit or approval, or to revoke or substantially modify an existing permit or approval, could have a material adverse effect on our ability to continue operations at the affected facility. Furthermore, state and local governments could impose a moratorium on mining operations in certain areas. Expansion of our existing operations is also predicated on securing the necessary environmental or other permits, including air permits for our resin coated manufacturing, and water rights or approvals, which we may not receive in a timely manner or at all. In addition, our facilities are located near existing and proposed third-party industrial operations that could affect our ability to fully extract, or the manner in which we extract, the mineral reserves to which we have mining rights.
We may be adversely affected by decreased or shifted demand for sand-based proppants or the development of either effective alternative proppants or new processes to replace hydraulic fracturing.
Frac sand and resin coated sand are proppants used in the completion and re-completion of oil and gas wells through the process of hydraulic fracturing. A significant shift in demand from sand-based proppants to other proppants, or a shift in demand from higher-margin sand-based proppants to lower-margin sand-based proppants, could have a material adverse effect on our business, financial condition and results of operations. The development and use of new technology for effective alternative proppants, or the development of new processes to replace hydraulic fracturing altogether, could also cause a decline in demand for the sand-based proppants we produce and could have a material adverse effect on our business, financial condition and results of operations.
Our proppant sales are subject to fluctuations in market pricing.
Substantially all of our supply agreements involving the sale of sand-based proppants have market-based pricing mechanisms. Accordingly, in periods with decreasing prices, our results of operations may be lower than if our agreements had fixed prices. In periods with increasing prices, our agreements permit us to increase prices; however, our customers may elect to cease purchasing our sand-based proppants if they do not agree with our price increases or are able to find alternative, cheaper sources of supply. Furthermore, certain of our supply agreements contain most favored nation clauses that may prevent us from capturing current market prices in an increasing price environment. These pricing provisions may result in significant variability in our results of operations and cash flows from period to period.
Changes in supply and demand dynamics could also impact market pricing for proppants. A number of existing frac sand providers and new market entrants have recently announced reserve acquisitions, processing capacity expansions and greenfield projects. In periods where sources of supply of raw frac sand exceed market demand, market prices for frac sand may decline and our results of operations and cash flows may decline or be volatile or otherwise be adversely affected.
14
Table of Contents
We may not be able to complete greenfield development or expansion projects or, if we do, we may not realize the expected benefits.
Any greenfield development or expansion project requires us to raise substantial capital and obtain numerous state and local permits. A decision by any governmental agency not to issue a required permit or substantial delays in the permitting process could prevent us from pursuing the development or expansion project. In addition, if the demand for our products declines during the period we experience delays in raising capital or completing the permitting process, we may not realize the expected benefits from our greenfield facility or expansion project. Furthermore, our new or modified facilities may not operate at designed capacity or may cost more to operate than we expect. The inability to complete greenfield development or expansion projects or to complete them on a timely basis and in turn grow our business could adversely affect our business and results of operations.
We rely upon trade secrets, contractual restrictions and patents to protect our proprietary rights. Failure to protect our intellectual property rights may undermine our competitive position, and protecting our rights or defending against third-party allegations of infringement may be costly.
Our commercial success depends on our proprietary information and technologies, know-how and other intellectual property. Because of the technical nature of our business, we rely on patents, trade secrets, trademarks and contractual restrictions to protect our intellectual property rights, particularly with respect to our resin coated products. The measures we take to protect our trade secrets and other intellectual property rights may be insufficient. Failure to protect, monitor and control the use of our existing intellectual property rights could cause us to lose our competitive advantage and incur significant expenses. It is possible that our competitors or others could independently develop the same or similar technologies or otherwise obtain access to our unpatented technologies. In such case, our trade secrets would not prevent third parties from competing with us. As a result, our results of operations may be adversely affected. Furthermore, third parties or our employees may infringe or misappropriate our proprietary technologies or other intellectual property rights, which could also harm our business and results of operations. Policing unauthorized use of intellectual property rights can be difficult and expensive, and adequate remedies may not be available.
In addition, third parties may claim that our products infringe or otherwise violate their patents or other proprietary rights and seek corresponding damages or injunctive relief. Defending ourselves against such claims, with or without merit, could be time-consuming and result in costly litigation. An adverse outcome in any such litigation could subject us to significant liability to third parties (potentially including treble damages) or temporary or permanent injunctions prohibiting the manufacture or sale of our products, the use of our technologies or the conduct of our business. Any adverse outcome could also require us to seek licenses from third parties (which may not be available on acceptable terms, or at all) or to make substantial one-time or ongoing royalty payments. Protracted litigation could also result in our customers or potential customers deferring or limiting their purchase or use of our products until resolution of such litigation. In addition, we may not have insurance coverage in connection with such litigation and may have to bear all costs arising from any such litigation to the extent we are unable to recover them from other parties. Any of these outcomes could have a material adverse effect on our business, financial condition and results of operations.
The development and marketing of Propel SSP may prove to be unsuccessful.
In April 2013, we acquired intellectual property rights to self-suspending proppant technology which led to the development of Propel SSP. We are currently conducting field trials on Propel SSP and are attempting to secure a patent for this technology. The technology supporting Propel SSP is still unproven. Although the results of initial field trials have been encouraging, additional testing ultimately may demonstrate that the product is ineffective or not commercially viable. A failure to successfully develop Propel SSP for commercial application would result in a significant unrecouped investment and the failure to realize certain anticipated benefits from this product launch, each of which could have a material adverse effect on our business, financial condition and results of operations. For more information on Propel SSP, please read “Management’s Discussion and Analysis of Financial Condition and Results of Operations—Acquisitions.”
15
Table of Contents
Our future performance will depend on our ability to succeed in competitive markets, and on our ability to appropriately react to potential fluctuations in demand for and supply of sand-based proppants.
We operate in a highly competitive market that is characterized by several large, national producers and a larger number of small, regional or local producers. Competition in the industry is based on price, consistency and quality of product, site location, distribution capability, customer service, reliability of supply, breadth of product offering and technical support. In the proppant business, we compete with producers such as Badger Mining Corporation, CARBO Ceramics Inc., Emerge Energy Services LP, Hi-Crush Partners, LP, Momentive Performance Materials Inc., Preferred Sands LLC, Unimin Corporation and U.S. Silica Holdings, Inc. Certain of our large competitors may have greater financial and other resources than we do, may develop technology superior to ours or may have production facilities that are located closer to key customers than ours.
We also compete with smaller, regional or local producers. In recent years there has been an increase in the number of small producers servicing the sand-based proppants market which could result in increased competition and pricing pressure in certain market conditions. In addition, oil and gas exploration and production companies and other providers of hydraulic fracturing services could acquire their own sand reserves, expand their existing sand-based proppant production capacity or otherwise fulfill their own proppant requirements and existing or new sand-based proppant producers could add to or expand their sand-based proppants production capacity, which could increase competition in the proppant industry. We may not be able to compete successfully against either our larger or smaller competitors in the future, and competition could have a material adverse effect on our business, financial condition and results of operations.
A large portion of our sales is generated by a limited number of customers, and the loss of, or a significant reduction in purchases by, our largest customers could adversely affect our operations.
For the year ended December 31, 2013 and the six months ended June 30, 2014, our top two proppant customers, Halliburton and FTSI, collectively accounted for approximately 30% and 36% of our sales, respectively. These customers may not continue to purchase the same levels of our sand-based proppants in the future due to a variety of reasons. Over the course of our relationships, we have sold proppant to Halliburton and FTSI on a purchase order basis and pursuant to supply agreements. We currently have supply agreements with both customers that contain customary termination provisions for bankruptcy related events and uncured breaches of the applicable agreement. The Halliburton supply agreement may also be terminated for unresolved pricing disputes. If any of our major customers substantially reduces or altogether ceases purchasing our sand-based proppants and we are not able to generate replacement sales of sand-based proppants into the market, our business, financial condition and results of operations could be adversely affected for a short-term period until such time as we generate replacement sales in the market.
We are exposed to the credit risk of our customers, and any material nonpayment or nonperformance by our customers could adversely affect our financial results.
We are subject to the risk of loss resulting from nonpayment or nonperformance by our customers, many of whose operations are concentrated in a single industry, the global oilfield services industry. Our credit procedures and policies may not be adequate to fully reduce customer credit risk. If we fail to adequately assess the creditworthiness of existing or future customers or unanticipated deterioration in their creditworthiness, any resulting increase in nonpayment or nonperformance by them and our inability to re-market or otherwise use the production could have a material adverse effect on our business, financial condition and results of operations.
The demand for industrial and recreational sand fluctuates, which could adversely affect our results of operations.
A portion of our sales are to customers in industries that have historically been cyclical, such as glassmaking, building products and foundry. During periods of economic slowdown, our customers often reduce their production rates and also reduce capital expenditures and defer or cancel pending projects. Such developments occur even among customers that are not experiencing financial difficulties.
16
Table of Contents
Demand in many of the end markets for industrial and recreational sand is driven by the construction and automotive industries. For example, the flat glass market depends on the automotive and commercial and residential construction and remodeling markets. The market for industrial and recreational sand used to manufacture building products is driven primarily by demand in the construction markets. The demand for foundry silica substantially depends on the rate of automobile, light truck and heavy equipment production. Other factors influencing the demand for industrial and recreational sand include (i) the substitution of plastic or other materials for glass, (ii) competition from offshore producers of glass products, (iii) changes in demand for our products due to technological innovations and (iv) prices, availability and other factors relating to our products.
We cannot predict or control the factors that affect demand for our products. Negative developments in the above factors, among others, could cause the demand for industrial and recreational sand to decline, which could adversely affect our business, financial condition, results of operations, cash flows and prospects.
Our operations are subject to operating risks that are often beyond our control and could adversely affect production levels and costs, and such risks may not be covered by insurance.
Our mining, processing and production facilities are subject to risks normally encountered in the proppant and industrial and recreational sand industries. These risks include:
| • | changes in the price and availability of transportation; |
| • | changes in the price and availability of natural gas or electricity; |
| • | unusual or unexpected geological formations or pressures; |
| • | cave-ins, pit wall failures or rock falls, particularly in underground mines; |
| • | unanticipated ground, grade or water conditions; |
| • | extreme seasonal weather conditions; |
| • | hazardous or catastrophic weather conditions or events, including flooding, tornadoes and hurricanes, and the physical impacts of climate change; |
| • | environmental hazards; |
| • | industrial accidents; |
| • | changes in laws and regulations (or the interpretation thereof) or increased public scrutiny related to the mining and the drilling and well completion industries, silica dust exposure or the environment; |
| • | inability to acquire or maintain necessary permits or mining or water rights; |
| • | restrictions on blasting and mining operations, including potential moratoriums on mining as result of local activism or complaints; |
| • | inability to obtain necessary production equipment or replacement parts; |
| • | reduction in the amount of water available for processing; |
| • | labor disputes; |
| • | late delivery of supplies; |
| • | fires, explosions or other accidents; and |
| • | facility shutdowns in response to environmental regulatory actions. |
Any of these risks could result in damage to, or destruction of, our mining properties or production facilities, personal injury, environmental damage, delays in mining or processing, losses or possible legal liability. Any prolonged downtime or shutdowns at our mining properties or production facilities could have a material adverse effect on us.
17
Table of Contents
Not all of these risks are reasonably insurable, and our insurance coverage contains limits, deductibles, exclusions and endorsements. Our insurance coverage may not be sufficient to meet our needs in the event of loss and any such loss may have a material adverse effect on us.
A significant portion of our sales is generated at our Wedron Silica facility. Any adverse developments at this plant could have a material adverse effect on our business, financial condition and results of operations.
For the year ended December 31, 2013, approximately 49% of our total volumes were produced at our Wedron Silica Facility and this percentage may increase in the future. Considering capacities acquired in 2013 on a full-year basis, this facility accounts for approximately 35% of our annual sand processing capacity and approximately 24% of our annual coating capacity. A casualty event or other adverse event affecting the production at this plant, including adverse developments due to catastrophic events or weather (including floods), adverse government regulatory impacts, private actions by residents of Wedron or surrounding communities, decreased demand for the products this plant produces, adverse developments affecting this plant’s customers or transportation-related constraints, could have a material adverse effect on our business, financial condition and results of operations.
The manufacture of resin coated proppants is an important process for us and is dependent on the availability of raw materials.
If we are unable to secure adequate, cost effective supply commitments for the raw materials associated with resin coated proppants our ability to sell this product to the marketplace at profitable margins may be adversely impacted. Decreased sales of resin coated proppants or the inability to control the costs associated with manufacturing and distribution of these products could have a material adverse effect on our business, financial condition and results from operations.
Diminished access to water may adversely affect our operations or the operations of our customers.
Our operations require the use of significant quantities of water. The mining and processing activities in which we engage at a number of our facilities require significant amounts of water, and some of our facilities are located in areas that are water-constrained. Additionally, the development of oil and gas properties through fracture stimulation likewise requires significant water use. We have obtained water rights that we currently use to service the activities on our various properties, and we plan to obtain all required water rights to service other properties we may develop or acquire in the future. However, the amount of water that we and our customers are entitled to use pursuant to our water rights must be determined by the appropriate regulatory authorities in the jurisdictions in which we and our customers operate. Such regulatory authorities may amend the regulations regarding such water rights, increase the cost of maintaining such water rights or eliminate our current water rights, and we and our customers may be unable to retain all or a portion of such water rights. These new regulations, which could also affect local municipalities and other industrial operations, could have a material adverse effect on our operating costs and effectiveness if implemented. Such changes in laws, regulations or government policy and related interpretations pertaining to water rights may alter the environment in which we and our customers do business, which may negatively affect our financial condition and results of operations.
Title to our mineral properties and water rights, and royalties related to our production of sand may be disputed.
Title to, and the area of, mineral properties and water rights, and royalties related to our production of sand, may be disputed. A successful claim that we lack appropriate mineral and water rights on one or more of our properties could cause us to lose any rights to explore, develop and operate mines on that property. Any decrease or disruption in our mineral rights may adversely affect our operations. In some instances, we have received access rights or easements from third parties, which allow for a more efficient operation than would exist without the access or easement. A third party could take action to suspend the access or easement, and any such action could be materially adverse to our results of operations or financial condition.
18
Table of Contents
If we cannot successfully complete acquisitions or integrate acquired businesses, our growth may be limited and our financial condition may be adversely affected.
Our business strategy includes supplementing internal growth by pursuing acquisitions. Any acquisition may involve potential risks, including, among other things:
| • | the validity of our assumptions about mineral reserves and future production, sales, capital expenditures, operating expenses and costs, including synergies; |
| • | an inability to successfully integrate the businesses we acquire; |
| • | the use of a significant portion of our available cash or borrowing capacity to finance acquisitions and the subsequent decrease in our liquidity; |
| • | a significant increase in our interest expense or financial leverage if we incur additional debt to finance acquisitions; |
| • | the assumption of unknown liabilities, losses or costs for which we are not indemnified or for which our indemnity is inadequate; |
| • | the diversion of management’s attention from other business concerns; |
| • | an inability to hire, train or retain qualified personnel both to manage and to operate our growing business and assets; |
| • | the incurrence of other significant charges, such as impairment of goodwill or other intangible assets, asset devaluation or restructuring charges; |
| • | unforeseen difficulties encountered in operating in new geographic areas; |
| • | customer or key employee losses at the acquired businesses; and |
| • | the accuracy of data obtained from production reports and engineering studies, geophysical and geological analyses and other information used when deciding to acquire a property, the results of which are often inconclusive and subject to various interpretations. |
If we cannot successfully complete acquisitions or integrate acquired businesses, our growth may be limited and our financial condition may be adversely affected.
We will be required to make substantial capital expenditures to maintain, develop and increase our asset base. The inability to obtain needed capital or financing on satisfactory terms, or at all, could have a material adverse effect on our growth and profitability.
Although we currently use a significant amount of our cash reserves and cash generated from our operations to fund the maintenance and development of our existing mineral reserves and our acquisitions of new mineral reserves, we may depend on the availability of credit to fund future capital expenditures. Our ability to obtain bank financing or to access the capital markets for future equity or debt offerings may be limited by our financial condition at the time of any such financing or offering, the covenants contained in our existing credit facility, term loans or future debt agreements, adverse market conditions or other contingencies and uncertainties that are beyond our control. Our failure to obtain the funds necessary to maintain, develop and increase our asset base could adversely impact our growth and profitability.
Even if we are able to obtain financing or access the capital markets, incurring additional debt may significantly increase our interest expense and financial leverage, and our level of indebtedness could restrict our ability to fund future development and acquisition activities. In addition, the issuance of additional common stock in an equity offering may result in significant stockholder dilution.
19
Table of Contents
Our substantial indebtedness could adversely affect our financial flexibility and our competitive position.
Our substantial level of indebtedness increases the risk that we may be unable to generate cash sufficient to pay amounts due in respect of our indebtedness. As of June 30, 2014, we had approximately $1.26 billion of outstanding long-term debt (including the current portion of long-term debt). Our substantial indebtedness could have other important consequences to you and significant effects on our business. For example, it could:
| • | increase our vulnerability to adverse changes in general economic, industry and competitive conditions; |
| • | require us to dedicate a substantial portion of our cash flow from operations to make payments on our indebtedness, thereby reducing the availability of our cash flow to fund working capital, capital expenditures and other general corporate purposes; |
| • | limit our flexibility in planning for, or reacting to, changes in our business and the industry in which we operate; |
| • | restrict us from exploiting business opportunities; |
| • | make it more difficult to satisfy our financial obligations, including payments on our indebtedness; |
| • | place us at a disadvantage compared to our competitors that have less debt; and |
| • | limit our ability to borrow additional funds for working capital, capital expenditures, acquisitions, debt service requirements, execution of our business strategy or other general corporate purposes. |
Our revolving credit facility and term loans contain substantial restrictions and financial covenants that may restrict our business and financing activities.
Our revolving credit facility and term loans contain, and any future financing agreements that we may enter into will likely contain, operating and financial restrictions and covenants that may restrict our ability to finance future operations or capital needs or to engage in, expand or pursue our business activities.
Our ability to comply with these restrictions and covenants is uncertain and will be affected by the levels of cash flow from our operations and events or circumstances beyond our control. If market or other economic conditions deteriorate, our ability to comply with these covenants may be impaired. If we violate any of the restrictions, covenants, ratios or tests in our debt agreements, a significant portion of our indebtedness may become immediately due and payable and our lenders’ commitment to make further loans to us may terminate. We might not have, or be able to obtain, sufficient funds to make these accelerated payments. In addition, our obligations under our debt agreements are secured by substantially all of our assets, and if we are unable to repay our indebtedness under these agreements, the lenders could seek to foreclose on our assets.
We may incur substantial debt in the future to enable us to maintain or increase our production levels and to otherwise pursue our business plan. This debt may impair our ability to operate our business.
Our business plan requires a significant amount of capital expenditures to maintain and grow our production levels. If prices for the products we produce were to decline for an extended period of time, if the costs of our acquisition and development operations were to increase substantially or if other events were to occur which reduced our sales or increased our costs, we may be required to borrow in the future to enable us to finance the expenditures necessary to replace the reserves we produce. The cost of the borrowings and our obligations to repay the borrowings could have important consequences to us, including:
| • | our ability to obtain additional financing, if necessary, for working capital, capital expenditures, acquisitions or other purposes may be impaired or such financing may not be available on favorable terms, or at all; |
| • | covenants contained in our existing and future credit and debt arrangements will require us to meet financial tests that may affect our flexibility in planning for, and reacting to, changes in our business, including possible acquisition opportunities; |
20
Table of Contents
| • | we will need a substantial portion of our cash flow to make principal and interest payments on our indebtedness, reducing the funds that would otherwise be available for operations and future business opportunities; and |
| • | our debt level will make us more vulnerable than our less leveraged competitors to competitive pressures or a downturn in our business or the economy generally. |
Our ability to service our indebtedness will depend on, among other things, our future financial and operating performance, which will be affected by prevailing economic conditions and financial, business, regulatory and other factors, some of which are beyond our control. If our operating results are not sufficient to service our current or future indebtedness, we will be forced to take actions such as reducing or delaying business activities, acquisitions, investments and/or capital expenditures; selling assets; restructuring or refinancing our indebtedness; or seeking additional equity capital or bankruptcy protection. We may not be able to effect any of these remedies on satisfactory terms or at all.
Inaccuracies in our estimates of mineral reserves could result in lower than expected sales and higher than expected costs.
We base our mineral reserve estimates on engineering, economic and geological data assembled and analyzed by our engineers and geologists, which are reviewed by outside firms. However, sand reserve estimates are necessarily imprecise and depend to some extent on statistical inferences drawn from available drilling data, which may prove unreliable. There are numerous uncertainties inherent in estimating quantities and qualities of mineral reserves and costs to mine recoverable reserves, including many factors beyond our control. Estimates of economically recoverable mineral reserves necessarily depend on a number of factors and assumptions, all of which may vary considerably from actual results, such as:
| • | geological and mining conditions and/or effects from prior mining that may not be fully identified by available data or that may differ from experience; |
| • | assumptions concerning future prices of sand-based products, operating costs, mining technology improvements, development costs and reclamation costs; and |
| • | assumptions concerning future effects of regulation, including the issuance of required permits and taxes by governmental agencies. |
Any inaccuracy in our estimates related to our mineral reserves could result in lower than expected sales and higher than expected costs.
Mine closures entail substantial costs, and if we close one or more of our mines sooner than anticipated, our results of operations may be adversely affected.
We base our assumptions regarding the life of our mines on detailed studies that we perform from time to time, but our studies and assumptions do not always prove to be accurate. If we close any of our mines sooner than expected, sales will decline unless we are able to increase production at any of our other mines, which may not be possible. The closure of an open pit mine also involves significant fixed closure costs, including accelerated employment legacy costs, severance-related obligations, reclamation and other environmental costs and the costs of terminating long-term obligations, including energy contracts and equipment leases. We accrue for the costs of reclaiming open pits, stockpiles, tailings ponds, roads and other mining support areas over the estimated mining life of our property. If we were to reduce the estimated life of any of our mines, the fixed mine closure costs would be applied to a shorter period of production, which would increase production costs per ton produced and could materially and adversely affect our results of operations and financial condition.
Applicable statutes and regulations require that mining property be reclaimed following a mine closure in accordance with specified standards and an approved reclamation plan. The plan addresses matters such as
21
Table of Contents
removal of facilities and equipment, regrading, prevention of erosion and other forms of water pollution, re-vegetation and post-mining land use. We may be required to post a surety bond or other form of financial assurance equal to the cost of reclamation as set forth in the approved reclamation plan. The establishment of the final mine closure reclamation liability is based on permit requirements and requires various estimates and assumptions, principally associated with reclamation costs and production levels. If our accruals for expected reclamation and other costs associated with mine closures for which we will be responsible were later determined to be insufficient, our business, results of operations and financial condition would be adversely affected.
A shortage of skilled labor together with rising labor costs in the mining industry may further increase operating costs, which could adversely affect our results of operations.
Efficient mining using modern techniques and equipment requires skilled laborers, preferably with several years of experience and proficiency in multiple mining tasks, including processing of mined minerals. If the shortage of experienced labor continues or worsens or if we are unable to train the necessary number of skilled laborers, there could be an adverse impact on our labor productivity and costs and our ability to expand production.
As a result of current market conditions and the high demand for skilled labor in certain regions in which we operate, we are experiencing a record level of labor costs, and we expect the cost of labor to increase in the future. The continued increase in labor costs could adversely affect our profitability.
Our production process consumes large amounts of natural gas and electricity. An increase in the price or a significant interruption in the supply of these or any other significant raw material costs could have a material adverse effect on our business, financial condition or results of operations.
Natural gas is the primary fuel source used for drying in the sand production process and, as such, our profitability is impacted by the price and availability of natural gas we purchase from third parties. The price and supply of natural gas are unpredictable and can fluctuate significantly based on international, political and economic circumstances, as well as other events outside our control, such as changes in supply and demand due to weather conditions, actions by OPEC and other oil and gas producers, regional production patterns and environmental concerns. Furthermore, utility companies could enforce natural gas curtailments which affect our operations. In addition, potential climate change regulations or carbon or emissions taxes could result in higher production costs for energy, which may be passed on to us in whole or in part. In the past, the price of natural gas has been extremely volatile, and we expect this volatility to continue. For example, during the year ended December 31, 2013, the monthly closing price of natural gas on the New York Mercantile Exchange ranged from a high of $4.15 per million British Thermal Units (“BTUs”) to a low of $3.23 per million BTUs.
Phenol is the primary component of the resins we buy, and our resin supply agreements contain market based pricing provisions based on the cost of phenol. As a result, we are exposed to fluctuations in the prices for phenol.
We have not historically hedged natural gas prices through the use of derivative financial instruments, such as forwards, swaps and futures. Furthermore, a significant increase in the price of phenol or of energy that is not recovered through an increase in the price of our products or an extended interruption in the supply of natural gas or electricity to our production facilities could have a material adverse effect on our business, financial condition and results of operations.
Our business may suffer if we lose, or are unable to attract and retain, key personnel.
We depend to a large extent on the services of our senior management team and other key personnel. Members of our senior management and other key employees have extensive experience and expertise in evaluating and analyzing industrial mineral properties, maximizing production from such properties, marketing
22
Table of Contents
industrial mineral production and developing and executing financing and hedging strategies. Competition for management and key personnel is intense, and the pool of qualified candidates is limited. Further, we have not entered into employment agreements with any of our named executive officers. The loss of any of these individuals or the failure to attract additional personnel, as needed, could have a material adverse effect on our operations and could lead to higher labor costs or the use of less-qualified personnel. In addition, due to the broad base of shares and options owned by our current employee base, a significant amount of wealth and liquidity could be generated as a result of this offering. If any of our executives or other key employees were to retire as a result of this wealth creation, join a competitor or form a competing company, we could lose customers, suppliers, know-how and key personnel. We do not maintain key-man life insurance with respect to any of our employees. Our success is dependent on our ability to continue to attract, employ and retain highly skilled personnel.
Our profitability could be negatively affected if we fail to maintain satisfactory labor relations.
As of December 31, 2013, various labor unions represented 14% of our domestic employees. If we are unable to renegotiate acceptable collective bargaining agreements with these labor unions in the future, we could experience, among other things, strikes, work stoppages or other slowdowns by our workers and increased operating costs as a result of higher wages, health care costs or benefits paid to our employees. An inability to maintain good relations with our workforce could cause a material adverse effect on our business, financial condition and results of operations.
Silica-related health issues and litigation could have a material adverse effect on our business, reputation or results of operations.
The inhalation of respirable crystalline silica can lead to the lung disease silicosis. There is disputed evidence of an association between respirable silica exposure and lung cancer as well as a possible association with other diseases, including immune system disorders such as scleroderma. These health risks have been, and may continue to be, a significant issue confronting the silica industry. Concerns over silicosis and other potential adverse health effects, as well as concerns regarding potential liability from the use of silica, may have the effect of discouraging our customers’ use of our silica products. The actual or perceived health risks of mining, processing and handling silica could materially and adversely affect silica producers, including us, through reduced use of silica products, the threat of product liability or employee lawsuits, increased scrutiny by federal, state and local regulatory authorities of us and our customers or reduced financing sources available to the silica industry.
We and/or our predecessors have been named as a defendant, usually among many defendants, in numerous products liability lawsuits brought by or on behalf of current or former employees of our customers alleging damages caused by silica exposure. As of June 30, 2014, we were subject to approximately 46 active silica exposure claims. Almost all of the claims pending against us arise out of the alleged use of our silica products in foundries or as an abrasive blast media and have been filed in the states of Texas, Mississippi, Kentucky and Illinois, although cases have been brought in many other jurisdictions over the years. In accordance with our insurance obligations, these claims are being defended by our subsidiaries’ insurance carriers, subject to our payment of approximately 7% of the defense costs. If our insurance coverage or indemnities prove to be insufficient or unavailable, it could have a material adverse effect on our business, financial condition and results of operation.
Failure to maintain effective quality control systems at our mining, processing and production facilities could have a material adverse effect on our business, financial condition and operations.
The performance, quality and safety of our products are critical to the success of our business. These factors depend significantly on the effectiveness of our quality control systems, which, in turn, depends on a number of factors, including the design of our quality control systems, our quality-training program and our ability to ensure that our employees adhere to the quality control policies and guidelines. Any significant failure or deterioration
23
Table of Contents
of our quality control systems could have a material adverse effect on our business, financial condition, results of operations and reputation.
Seasonal impacts may impact our ability to process sand and our customers’ demand for our products.
Because raw sand cannot be wet-processed during extremely cold temperatures, frac sand is typically washed only eight months out of the year at our surface mines in Wisconsin and our Minnesota and Ohio operations. Our inability to mine and process frac sand year round in our surface mines in Wisconsin and our Minnesota and Ohio operations results in a seasonal build-up of inventory as we excavate excess sand to build a stockpile that will feed our drying facilities during the winter months. Unexpected winter weather conditions may result in our having an insufficient sand stockpile to supply feedstock for our drying plants for the winter months and result in our being unable to satisfy customer requirements during these periods. As a result of these seasonal supply impacts, the cash flows of our North American operations can fluctuate if plant operations must remain shut down due to harsh winter weather conditions.
In addition to supply considerations, severe weather conditions may curtail our customers’ drilling activities and impair rail shipment and transportation services and, as a result, our sales volumes to customers may similarly be adversely affected. Unexpected winter weather conditions may compound these seasonal impacts, and could result in a material adverse effect on our business, financial condition and results of operation.
We may be subject to interruptions or failures in our information technology systems.
We rely on sophisticated information technology systems and infrastructure to support our business, including process control technology. Any of these systems may be susceptible to outages due to fire, floods, power loss, telecommunications failures and similar events. The failure of any of our information technology systems may cause disruptions in our operations, which could adversely affect our sales and profitability.
Our international operations expose us to risks inherent in doing business abroad.
We conduct business in many parts of the world, including Argentina, Mexico, China, northern Europe and the Middle East. Our ability to comply with the Foreign Corrupt Practices Act (“FCPA”) is dependent on the success of our ongoing compliance program, including our ability to continue to manage our agents and business partners, and supervise, train and retain competent employees. We could be subject to sanctions and civil and criminal prosecution as well as fines and penalties in the event of a finding of a violation of the FCPA by us or any of our employees.
In addition, our international operations are subject to the various laws and regulations of those respective countries as well as various risks peculiar to each country, which may include, but are not limited to:
| • | global economic conditions; |
| • | political actions and requirements of national governments including trade restrictions, embargoes, seizure, detention, nationalization and expropriations of assets; |
| • | interpretation of tax statutes and requirements of taxing authorities worldwide, routine examination by taxing authorities and assessment of additional taxes, penalties and/or interest; |
| • | civil unrest; |
| • | acts of terrorism; |
| • | fluctuations and changes in currency exchange rates; |
| • | the impact of inflation; and |
| • | difficulty in repatriating foreign currency received in excess of the local currency requirements. |
24
Table of Contents
Significant impairment losses related to goodwill and intangibles could have a material adverse effect on our business, financial condition and results of operation.
We recorded approximately $161 million of goodwill and intangibles in connection with our acquisition activity in 2013. We assess the impairment of goodwill and intangibles at least annually and also whenever events or changes in circumstances indicate that goodwill may be impaired. Any significant impairment of the goodwill or intangibles from these acquisitions could have a material adverse effect on our business, financial condition and results of operations.
A terrorist attack or armed conflict could harm our business.
Terrorist activities, anti-terrorist efforts and other armed conflicts involving the United States could adversely affect the U.S. and global economies and could prevent us from meeting financial and other obligations. We could experience loss of business, delays or defaults in payments from payors or disruptions of fuel supplies and markets if pipelines, production facilities, processing plants or refineries are direct targets or indirect casualties of an act of terror or war. Such activities could reduce the overall demand for oil and gas, which, in turn, could also reduce the demand for our products and services. Terrorist activities and the threat of potential terrorist activities and any resulting economic downturn could adversely affect our results of operations, impair our ability to raise capital or otherwise adversely impact our ability to realize certain business strategies.
Risks Related to Environmental, Mining and Other Regulation
Federal, state and local legislative and regulatory initiatives relating to hydraulic fracturing and the potential for related litigation could result in increased costs and additional operating restrictions or delays for our customers, which could cause a decline in the demand for our sand-based proppants and negatively impact our business, financial condition and results of operations.
We supply proppants to oilfield service companies. Hydraulic fracturing is a widely used industry production technique that is used to stimulate production of natural gas and/or oil from dense subsurface rock formations. The process involves the injection of water, sand and chemicals, under pressure, into the formation to fracture the surrounding rock and stimulate production. The hydraulic fracturing process is typically regulated by state or local governmental authorities. However, the practice of hydraulic fracturing has become controversial in some areas and is undergoing increased scrutiny. Several federal agencies, regulatory authorities, and legislative entities are investigating the potential environmental impacts of hydraulic fracturing and whether additional regulation may be necessary. The U.S. Environmental Protection Agency (“EPA”) has asserted limited federal regulatory authority over hydraulic fracturing and has indicated it may seek to further expand its regulation of hydraulic fracturing. The Bureau of Land Management has proposed regulations applicable to hydraulic fracturing conducted on federal and Indian oil and gas leases. Congress has from time to time considered the adoption of legislation to provide for federal regulation of hydraulic fracturing. In addition, various state, local and foreign governments have implemented, or are considering, increased regulatory oversight of hydraulic fracturing through additional permitting requirements, operational restrictions, disclosure requirements and temporary or permanent bans on hydraulic fracturing in certain areas such as environmentally sensitive watersheds. For example, many states—including the major oil and gas producing states of North Dakota, Ohio, Oklahoma, Pennsylvania, Texas, and West Virginia—have imposed disclosure requirements on hydraulic fracturing well owners and operators. Some local governments have adopted and others may seek to adopt ordinances prohibiting or regulating the time, place and manner of drilling activities in general or hydraulic fracturing activities within their jurisdictions.
Although we do not conduct hydraulic fracturing, the adoption of new laws or regulations at the federal, state, local or foreign levels imposing reporting obligations on, or otherwise limiting or delaying, the hydraulic fracturing process could make it more difficult to complete oil and gas wells, increase our customers’ costs of compliance and doing business, and otherwise adversely affect the hydraulic fracturing services they perform, which could negatively impact demand for our sand-based proppants. In addition, heightened political, regulatory
25
Table of Contents
and public scrutiny of hydraulic fracturing practices, including nuisance lawsuits, could expose us or our customers to increased legal and regulatory proceedings, which could be time-consuming, costly or result in substantial legal liability or significant reputational harm. We could be directly affected by adverse litigation involving us, or indirectly affected if the cost of compliance limits the ability of our customers to operate. Such costs and scrutiny could directly or indirectly, through reduced demand for our sand-based proppants, have a material adverse effect on our business, financial condition and results of operations.
We and our customers are subject to extensive environmental and health and safety regulations that impose, and will continue to impose, significant costs and liabilities. In addition, future regulations, or more stringent enforcement of existing regulations, could increase those costs and liabilities, which could adversely affect our results of operations.
We are subject to a variety of federal, state and local regulatory environmental requirements affecting the mining and mineral processing industry, including among others, those relating to employee health and safety, environmental permitting and licensing, air and water emissions, greenhouse gas emissions, water pollution, waste management, remediation of soil and groundwater contamination, land use, reclamation and restoration of properties, hazardous materials and natural resources. Some environmental laws impose substantial penalties for noncompliance, and others, such as the federal Comprehensive Environmental Response, Compensation, and Liability Act (“CERCLA”), impose strict, retroactive and joint and several liability for the remediation of releases of hazardous substances. Liability under CERCLA, or similar state and local laws, may be imposed as a result of conduct that was lawful at the time it occurred or for the conduct of, or conditions caused by, prior operators or other third parties. Failure to properly handle, transport, store or dispose of hazardous materials or otherwise conduct our operations in compliance with environmental laws could expose us to liability for governmental penalties, cleanup costs and civil or criminal liability associated with releases of such materials into the environment, damages to property or natural resources and other damages, as well as potentially impair our ability to conduct our operations. In addition, future environmental laws and regulations could restrict our ability to expand our facilities or extract our mineral reserves or could require us to acquire costly equipment or to incur other significant expenses in connection with our business. These laws, regulations and permits have had, and will continue to have, a significant effect on our business.
We may not be able to comply with any new laws and regulations that are adopted, and any new laws and regulations could have a material adverse effect on our operating results by requiring us to modify our operations or equipment or shut down some or all of our facilities. Additionally, our customers may not be able to comply with any new laws and regulations, which could cause our customers to curtail or cease operations. We cannot at this time reasonably estimate our costs of compliance or the timing of any costs associated with any new laws and regulations, or any material adverse effect that any new standards will have on our customers and, consequently, on our operations.
We are subject to the Federal Mine Safety and Health Act of 1977, which imposes stringent health and safety standards on numerous aspects of our operations.
Our operations are subject to the Federal Mine Safety and Health Act of 1977, as amended by the Mine Improvement and New Emergency Response Act of 2006, which imposes stringent health and safety standards on numerous aspects of mineral extraction and processing operations, including the training of personnel, operating procedures, operating equipment and other matters. Our failure to comply with such standards, or changes in such standards or the interpretation or enforcement thereof, could have a material adverse effect on our business, financial condition and results of operation or otherwise impose significant restrictions on our ability to conduct mineral extraction and processing operations.
26
Table of Contents
We and our customers are subject to other extensive regulations, including licensing, plant and wildlife protection and reclamation regulation, that impose, and will continue to impose, significant costs and liabilities. In addition, future regulations, or more stringent enforcement of existing regulations, could increase those costs and liabilities, which could adversely affect our results of operations.
In addition to the regulatory matters described above, we and our customers are subject to extensive governmental regulation on matters such as permitting and licensing requirements, plant and wildlife protection, wetlands protection, reclamation and restoration of mining properties after mining is completed. Our future success depends, among other things, on the quantity of our mineral reserves and our ability to extract these reserves profitably, and our customers being able to operate their businesses as they currently do.
In order to obtain permits and renewals of permits in the future, we may be required to prepare and present data to governmental authorities pertaining to the impact that any proposed exploration or production activities, individually or in the aggregate, may have on the environment. Certain approval procedures may require preparation of archaeological surveys, endangered species studies and other studies to assess the environmental impact of new sites or the expansion of existing sites. Compliance with these regulatory requirements is expensive and significantly lengthens the time needed to develop a site. Finally, obtaining or renewing required permits is sometimes delayed or prevented due to community opposition, including nuisance lawsuits, and other factors beyond our control. The denial of a permit essential to our operations or the imposition of conditions with which it is not practicable or feasible to comply could impair or prevent our ability to develop or expand a site. New legal requirements, including those related to the protection of the environment, could be adopted that could materially adversely affect our mining operations (including our ability to extract mineral reserves), our cost structure or our customers’ ability to use our sand-based proppants. Such current or future regulations could have a material adverse effect on our business and we may not be able to obtain or renew permits in the future.
Our inability to acquire, maintain or renew financial assurances related to the reclamation and restoration of mining property could have a material adverse effect on our business, financial condition and results of operations.
We are generally obligated to restore property in accordance with regulatory standards and our approved reclamation plan after it has been mined. We are required under federal, state and local laws to maintain financial assurances, such as surety bonds, to secure such obligations. The inability to acquire, maintain or renew such assurances, as required by federal, state and local laws, could subject us to fines and penalties as well as the revocation of our operating permits. Such inability could result from a variety of factors, including:
| • | the lack of availability, higher expense or unreasonable terms of such financial assurances; |
| • | the ability of current and future financial assurance counterparties to increase required collateral; and |
| • | the exercise by financial assurance counterparties of any rights to refuse to renew the financial assurance instruments. |
Our inability to acquire, maintain or renew necessary financial assurances related to the reclamation and restoration of mining property could have a material adverse effect on our business, financial condition and results of operations.
Risks Related to This Offering and Ownership of Our Common Stock
The requirements of being a public company, including compliance with the reporting requirements of the Securities Exchange Act of 1934, as amended (the “Exchange Act”), and the requirements of the Sarbanes-Oxley Act, may strain our resources, increase our costs and distract management, and we may be unable to comply with these requirements in a timely or cost-effective manner.
As a public company, we will need to comply with new laws, regulations and requirements, certain corporate governance provisions of the Sarbanes-Oxley Act of 2002, related regulations of the SEC and the
27
Table of Contents
requirements of the NYSE, with which we are not required to comply as a private company. Complying with these statutes, regulations and requirements will occupy a significant amount of time of our board of directors and management and will significantly increase our costs and expenses. We will need to:
| • | institute a more comprehensive compliance function; |
| • | comply with rules promulgated by the NYSE; |
| • | continue to prepare and distribute periodic public reports in compliance with our obligations under the federal securities laws; |
| • | establish new internal policies, such as those relating to insider trading; and |
| • | involve and retain to a greater degree outside counsel and accountants in the above activities. |
Furthermore, while we generally must comply with Section 404 of the Sarbanes Oxley Act of 2002 for our second annual report on Form 10-K, which will be for our year ending December 31, 2015, we will not be required to have our independent registered public accounting firm attest to the effectiveness of our internal controls until the later of our second annual report on Form 10-K or our first annual report subsequent to our ceasing to be an “emerging growth company” within the meaning of Section 2(a)(19) of the Securities Act. Accordingly, we may not be required to have our independent registered public accounting firm attest to the effectiveness of our internal controls until as late as our annual report for the year ending December 31, 2019. Once it is required to do so, our independent registered public accounting firm may issue a report that is adverse in the event it is not satisfied with the level at which our controls are documented, designed, operated or reviewed. Compliance with these requirements may strain our resources, increase our costs and distract management; and we may be unable to comply with these requirements in a timely or cost-effective manner.
In addition, we expect that being a public company subject to these rules and regulations may make it more difficult and more expensive for us to obtain director and officer liability insurance and we may be required to accept reduced policy limits and coverage or incur substantially higher costs to obtain the same or similar coverage. As a result, it may be more difficult for us to attract and retain qualified individuals to serve on our board of directors or as executive officers. We are currently evaluating these rules, and we cannot predict or estimate the amount of additional costs we may incur or the timing of such costs.
There is no existing market for our common stock, and we do not know if one will develop to provide you with adequate liquidity to sell our common stock at prices equal to or greater than the price you paid in this offering.
Prior to this offering, there has not been a public market for our common stock. We cannot predict the extent to which investor interest in our company will lead to the development of an active trading market on the stock exchange on which we list our common stock or otherwise or how liquid that market might become. If an active trading market does not develop, you may have difficulty selling any of our common stock that you buy.
The concentration of our capital stock ownership among our largest stockholders and their affiliates will limit your ability to influence corporate matters.
Upon completion of this offering (assuming no exercise of the underwriters’ option to purchase additional shares), the AS Group will indirectly own approximately % of our outstanding common stock. Consequently, the AS Group will continue to have significant influence over all matters that require approval by our stockholders, including the election of directors and approval of significant corporate transactions. This concentration of ownership will limit your ability to influence corporate matters, and as a result, actions may be taken that you may not view as beneficial.
Furthermore, conflicts of interest could arise in the future between us, on the one hand, and American Securities and its affiliates, including its portfolio companies, on the other hand, concerning among other things,
28
Table of Contents
potential competitive business activities or business opportunities. American Securities is a private equity firm in the business of making investments in entities in a variety of industries. As a result, American Securities’ existing and future portfolio companies which it controls may compete with us for investment or business opportunities. These conflicts of interest may not be resolved in our favor.
We have also renounced our interest in certain business opportunities. See “— Our amended and restated certificate of incorporation contains a provision renouncing our interest and expectancy in certain corporate opportunities, which could adversely affect our business or prospects.”
The initial public offering price of our common stock may not be indicative of the market price of our common stock after this offering. In addition, an active, liquid and orderly trading market for our common stock may not develop or be maintained, and our stock price may be volatile.
Prior to this offering, our common stock was not traded on any market. An active, liquid and orderly trading market for our common stock may not develop or be maintained after this offering. Active, liquid and orderly trading markets usually result in less price volatility and more efficiency in carrying out investors’ purchase and sale orders. The market price of our common stock could vary significantly as a result of a number of factors, some of which are beyond our control. In the event of a drop in the market price of our common stock, you could lose a substantial part or all of your investment in our common stock. The initial public offering price was determined by negotiations between us, the selling stockholder and representatives of the underwriters, based on numerous factors which we discuss in “Underwriting,” and may not be indicative of the market price of our common stock after this offering. Consequently, you may not be able to sell shares of our common stock at prices equal to or greater than the price paid by you in this offering.
The following factors could affect our stock price:
| • | our operating and financial performance; |
| • | quarterly variations in the rate of growth of our financial indicators, such as net income per share, net income and revenues; |
| • | the public reaction to our press releases, our other public announcements and our filings with the SEC; |
| • | strategic actions by our competitors; |
| • | our failure to meet revenue or earnings estimates by research analysts or other investors; |
| • | changes in revenue or earnings estimates, or changes in recommendations or withdrawal of research coverage, by equity research analysts; |
| • | speculation in the press or investment community; |
| • | the failure of research analysts to cover our common stock; |
| • | sales of our common stock by us, the selling stockholders or other stockholders, or the perception that such sales may occur; |
| • | changes in accounting principles, policies, guidance, interpretations or standards; |
| • | additions or departures of key management personnel; |
| • | actions by our stockholders; |
| • | general market conditions, including fluctuations in commodity prices, sand-based proppants or industrial and recreational sand-based products; |
| • | domestic and international economic, legal and regulatory factors unrelated to our performance; and |
| • | the realization of any risks describes under this “Risk Factors” section. |
29
Table of Contents
The stock markets in general have experienced extreme volatility that has often been unrelated to the operating performance of particular companies. These broad market fluctuations may adversely affect the trading price of our common stock. Securities class action litigation has often been instituted against companies following periods of volatility in the overall market and in the market price of a company’s securities. Such litigation, if instituted against us, could result in very substantial costs, divert our management’s attention and resources and harm our business, operating results and financial condition.
Our amended and restated certificate of incorporation contains a provision renouncing our interest and expectancy in certain corporate opportunities.
Our amended and restated certificate of incorporation provides for the allocation of certain corporate opportunities between us and American Securities. Under these provisions, neither American Securities, its affiliates and subsidiaries, nor any of their officers, directors, agents, stockholders, members or partners will have any duty to refrain from engaging, directly or indirectly, in the same business activities or similar business activities or lines of business in which we operate, other than opportunities related to hydraulic fracturing proppants. For instance, a director of our company who also serves as a director, officer or employee of American Securities or any of its subsidiaries or affiliates may pursue certain acquisitions or other opportunities that may be complementary to our business and, as a result, such acquisition or other opportunities may not be available to us. These potential conflicts of interest could have a material adverse effect on our business, financial condition and results of operations if attractive corporate opportunities are allocated by American Securities to itself or its subsidiaries or affiliates instead of to us. The terms of our certificate of incorporation are more fully described in “Description of Capital Stock.”
Our amended and restated certificate of incorporation and amended and restated bylaws, as well as Delaware law, contain provisions that could discourage acquisition bids or merger proposals, which may adversely affect the market price of our common stock.
Our amended and restated certificate of incorporation authorizes our board of directors to issue preferred stock without stockholder approval. If our board of directors elects to issue preferred stock, it could be more difficult for a third party to acquire us. In addition, some provisions of our amended and restated certificate of incorporation and amended and restated bylaws could make it more difficult for a third party to acquire control of us, even if the change of control would be beneficial to our stockholders, including:
| • | a classified board of directors; |
| • | limitations on the removal of directors; |
| • | limitations on the ability of our stockholders to call special meetings; |
| • | advance notice provisions for stockholder proposals and nominations for elections to the board of directors to be acted upon at meetings of stockholders; |
| • | providing that the board of directors is expressly authorized to adopt, or to alter or repeal our bylaws; and |
| • | establishing advance notice and certain information requirements for nominations for election to our board of directors or for proposing matters that can be acted upon by stockholders at stockholder meetings. |
Investors in this offering will experience immediate and substantial dilution of $ per share.
Based on an assumed initial public offering price of $ per share (the midpoint of the price range set forth on the cover of this prospectus), purchasers of our common stock in this offering will experience an immediate and substantial dilution of $ per share in the net tangible book value per share of common stock from the initial public offering price, and our as adjusted net tangible book value as of June 30, 2014 would be $ per share. This dilution is due in large part to earlier investors having paid substantially less than the initial public offering price when they purchased their shares. Please see “Dilution.”
30
Table of Contents
We do not intend to pay dividends on our common stock, and our debt agreements place certain restrictions on our ability to do so. Consequently, your only opportunity to achieve a return on your investment is if the price of our common stock appreciates.
We do not plan to declare dividends on shares of our common stock in the foreseeable future. Additionally, our existing revolving credit facility and our term loan both place certain restrictions on our ability to pay cash dividends. Consequently, unless we revise our dividend policy, your only opportunity to achieve a return on your investment in us will be if you sell your common stock at a price greater than you paid for it. There is no guarantee that the price of our common stock that will prevail in the market will ever exceed the price that you pay in this offering.
Future sales of our common stock in the public market could reduce our stock price, and any additional capital raised by us through the sale of equity or convertible securities may dilute your ownership in us.
We may sell additional shares of common stock in subsequent public offerings. We may also issue additional shares of common stock or convertible securities. After the completion of this offering, we will have outstanding shares of common stock. This number includes shares that the selling stockholders are selling in this offering and shares that the selling stockholders may sell in this offering if the underwriters’ option to purchase additional shares is fully exercised, which may be resold immediately in the public market. Following the completion of this offering, assuming no exercise of the underwriters’ option to purchase additional shares, the AS Group will indirectly own shares of our common stock, or approximately % of our total outstanding shares, all of which are restricted from immediate resale under the federal securities laws and are subject to the lock-up agreements with the underwriters described in “Underwriting,” but may be sold into the market in the future. The Stockholders’ Agreement of the Company will be amended to provide for certain revised registration rights which will require us to effect the registration of shares in certain circumstances. Please see “Shares Eligible for Future Sale” and “Certain Relationships and Related Party Transactions—Stockholders’ Agreement.”
In connection with this offering, we intend to file a registration statement with the SEC on Form S-8 providing for the registration of shares of our common stock issued or reserved for issuance under our equity incentive plans. Subject to the satisfaction of vesting conditions, the expiration of lock-up agreements and the requirements of Rule 144, shares registered under the registration statement on Form S-8 will be available for resale immediately in the public market without restriction.
We cannot predict the size of future issuances of our common stock or securities convertible into common stock or the effect, if any, that future issuances and sales of shares of our common stock will have on the market price of our common stock. Sales of substantial amounts of our common stock (including shares issued in connection with an acquisition), or the perception that such sales could occur, may adversely affect prevailing market prices of our common stock.
The underwriters of this offering may waive or release parties to the lock-up agreements entered into in connection with this offering, which could adversely affect the price of our common stock.
We, ASP FML, all of our directors and executive officers and certain of our principal stockholders and the selling stockholders will enter into lock-up agreements with respect to their common stock, pursuant to which they are subject to certain resale restrictions for a period of 180 days following the effectiveness date of the registration statement of which this prospectus forms a part. At least two of the representatives of the underwriters, consisting of Morgan Stanley & Co. LLC, Wells Fargo Securities, LLC and Barclays Capital Inc., may, at any time and without notice, release all or any portion of the common stock subject to the foregoing lock-up agreements. If the restrictions under the lock-up agreements are waived, then common stock will be available for sale into the public markets, which could cause the market price of our common stock to decline and impair our ability to raise capital.
31
Table of Contents
For as long as we are an emerging growth company, we will not be required to comply with certain reporting requirements, including those relating to accounting standards and disclosure about our executive compensation, that apply to other public companies.
We are classified as an “emerging growth company” under the JOBS Act. For as long as we are an emerging growth company, which may be up to five full fiscal years, unlike other public companies, we will not be required to, among other things, (1) provide an auditor’s attestation report on management’s assessment of the effectiveness of our system of internal control over financial reporting pursuant to Section 404(b) of the Sarbanes-Oxley Act, (2) comply with any new requirements adopted by the PCAOB requiring mandatory audit firm rotation or a supplement to the auditor’s report in which the auditor would be required to provide additional information about the audit and the financial statements of the issuer, (3) provide certain disclosure regarding executive compensation required of larger public companies or (4) hold nonbinding advisory votes on executive compensation. We will remain an emerging growth company for up to five years, although we will lose that status sooner if we have more than $1.0 billion of revenues in a fiscal year, have more than $700 million in market value of our common stock held by non-affiliates, or issue more than $1.0 billion of non-convertible debt over a three-year period.
We may issue preferred stock whose terms could adversely affect the voting power or value of our common stock.
Our amended and restated certificate of incorporation authorizes us to issue, without the approval of our stockholders, one or more classes or series of preferred stock having such designations, preferences, limitations and relative rights, including preferences over our common stock respecting dividends and distributions, as our board of directors may determine. The terms of one or more classes or series of preferred stock could adversely impact the voting power or value of our common stock. For example, we might grant holders of preferred stock the right to elect some number of our directors in all events or on the happening of specified events or the right to veto specified transactions. Similarly, the repurchase or redemption rights or liquidation preferences we might assign to holders of preferred stock could affect the residual value of the common stock.
If securities or industry analysts do not publish research or reports about our business, if they adversely change their recommendations regarding our common stock or if our operating results do not meet their expectations, our stock price could decline.
The trading market for our common stock will be influenced by the research and reports that industry or securities analysts publish about us or our business. If one or more of these analysts cease coverage of our company or fail to publish reports on us regularly, we could lose visibility in the financial markets, which in turn could cause our stock price or trading volume to decline. Moreover, if one or more of the analysts who cover our company downgrades our common stock or if our operating results do not meet their expectations, our stock price could decline.
Our amended and restated certificate of incorporation will designate the Court of Chancery of the State of Delaware as the sole and exclusive forum for certain types of actions and proceedings that may be initiated by our stockholders, which could limit our stockholders’ ability to obtain a favorable judicial forum for disputes with us or our directors, officers, employees or agents.
Our amended and restated certificate of incorporation will provide that unless we consent in writing to the selection of an alternative forum, the Court of Chancery of the State of Delaware will, to the fullest extent permitted by applicable law, be the sole and exclusive forum for (i) any derivative action or proceeding brought on our behalf, (ii) any action asserting a claim of breach of a fiduciary duty owed by any of our directors, officers, employees or agents to us or our stockholders, (iii) any action asserting a claim arising pursuant to any provision of the Delaware General Corporation Law (the “DGCL”), our amended and restated certificate of incorporation or our bylaws, or (iv) any action asserting a claim against us that is governed by the internal affairs
32
Table of Contents
doctrine, in each such case subject to such Court of Chancery having personal jurisdiction over the indispensable parties named as defendants therein. Any person or entity purchasing or otherwise acquiring any interest in shares of our capital stock will be deemed to have notice of, and consented to, the provisions of our amended and restated certificate of incorporation described in the preceding sentence. This choice of forum provision may limit a stockholder’s ability to bring a claim in a judicial forum that it finds favorable for disputes with us or our directors, officers, employees or agents, which may discourage such lawsuits against us and such persons. Alternatively, if a court were to find these provisions of our amended and restated certificate of incorporation inapplicable to, or unenforceable in respect of, one or more of the specified types of actions or proceedings, we may incur additional costs associated with resolving such matters in other jurisdictions, which could adversely affect our business, financial condition or results of operations.
33
Table of Contents
This prospectus contains forward-looking statements that are subject to risks and uncertainties. All statements other than statements of historical fact included in this prospectus are forward-looking statements. Forward-looking statements give our current expectations and projections relating to our financial condition, results of operations, plans, objectives, future performance and business. You can identify forward-looking statements by the fact that they do not relate strictly to historical or current facts. These statements may include words such as “anticipate,” “estimate,” “expect,” “project,” “plan,” “intend,” “believe,” “may,” “will,” “should,” “can have,” “likely” and other words and terms of similar meaning in connection with any discussion of the timing or nature of future operating or financial performance or other events. For example, all statements we make relating to our estimated and projected costs, expenditures, cash flows, growth rates and financial results, our plans and objectives for future operations, growth or initiatives, strategies or the expected outcome or impact of pending or threatened litigation are forward-looking statements. All forward-looking statements are subject to risks and uncertainties that may cause actual results to differ materially from those that we expected, including:
| • | the level of activity in the oil and gas industries; |
| • | increasing costs or a lack of dependability or availability of transportation services or infrastructure and geographic shifts in demand; |
| • | our rights and ability to mine our properties and our renewal or receipt of the required permits and approvals from governmental authorities and other third parties; |
| • | decreased demand for sand-based proppants or the development of either effective alternative proppants or new processes to replace hydraulic fracturing; |
| • | fluctuations in market based pricing; |
| • | our ability to complete greenfield development or expansion projects, or our ability to realize the benefits if we do complete them; |
| • | our ability to protect our intellectual property rights; |
| • | our ability to successfully develop and market Propel SSP; |
| • | our ability to succeed in competitive markets; |
| • | loss of, or reduction in, business from our largest customers; |
| • | our exposure to the credit risk of our customers and any potential material nonpayment or nonperformance by our customers; |
| • | fluctuations in demand for industrial and recreational sand; |
| • | operating risks that are beyond our control, such as changes in the price and availability of transportation, natural gas or electricity; unusual or unexpected geological formations or pressures; cave-ins, pit wall failures or rock falls; or unanticipated ground, grade or water conditions; |
| • | our dependence on our Wedron Silica sand-mining facility for a significant portion of our sales; |
| • | the availability of raw materials to support our manufacturing of resin coated proppants; |
| • | diminished access to water; |
| • | challenges to our title to our mineral properties and water rights; |
| • | our ability to successfully complete acquisitions or integrate acquired businesses; |
| • | our ability to make capital expenditures to maintain, develop and increase our asset base and our ability to obtain needed capital or financing on satisfactory terms; |
| • | substantial indebtedness and pension obligations; |
34
Table of Contents
| • | restrictions imposed by our indebtedness on our current and future operations; |
| • | the accuracy of our estimates of our mineral reserves; |
| • | substantial costs of mine closures; |
| • | a shortage of skilled labor and rising labor costs in the mining industry; |
| • | increases in the prices of, or interruptions in the supply of, natural gas and electricity, or any other energy sources; |
| • | our ability to attract and retain key personnel; |
| • | our ability to maintain satisfactory labor relations; |
| • | silica-related health issues and corresponding litigation; |
| • | our ability to maintain effective quality control systems at our mining, processing and production facilities; |
| • | fluctuations in our sales and results of operations due to seasonality and other factors; |
| • | interruptions or failures in our information technology systems; |
| • | failure to comply with the FCPA; |
| • | significant impairment losses related to goodwill in relation to our acquisition of assets from FTSI; |
| • | the impact of a terrorist attack or armed conflict; |
| • | our failure to maintain adequate internal controls; |
| • | extensive and evolving environmental, mining, health and safety, licensing, reclamation and other regulation (and changes in their enforcement or interpretation); |
| • | our ability to acquire, maintain or renew financial assurances related to the reclamation and restoration of mining property; and |
| • | other factors disclosed in the section entitled “Risk Factors” and elsewhere in this prospectus. |
We derive many of our forward-looking statements from our operating budgets and forecasts, which are based on many detailed assumptions. While we believe that our assumptions are reasonable, we caution that it is very difficult to predict the impact of known factors, and it is impossible for us to anticipate all factors that could affect our actual results. Important factors that could cause actual results to differ materially from our expectations, or cautionary statements, are disclosed under the sections entitled “Risk Factors” and “Management’s Discussion and Analysis of Financial Condition and Results of Operations” in this prospectus. All written and oral forward-looking statements attributable to us, or persons acting on our behalf, are expressly qualified in their entirety by these cautionary statements as well as other cautionary statements that are made from time to time in our other SEC filings and public communications. You should evaluate all forward-looking statements made in this prospectus in the context of these risks and uncertainties.
We caution you that the important factors referenced above may not contain all of the factors that are important to you. In addition, we cannot assure you that we will realize the results or developments we expect or anticipate or, even if substantially realized, that they will result in the consequences or affect us or our operations in the way we expect. The forward-looking statements included in this prospectus are made only as of the date hereof. We undertake no obligation to update or revise any forward-looking statement as a result of new information, future events or otherwise, except as otherwise required by law.
35
Table of Contents
The common stock being offered by this prospectus, including the common stock offered if the underwriters’ option to purchase additional shares is exercised in full, is solely for the account of the selling stockholders. We will not receive any proceeds from the sale of common stock by the selling stockholders. We will pay all expenses related to this offering, other than underwriting discounts and commissions related to the shares sold by the selling stockholders.
The selling stockholders have granted to the underwriters a 30-day over-allotment option to purchase up to additional shares of common stock. The exercise of this underwriters’ over-allotment option will not affect the total number of shares outstanding.
36
Table of Contents
On , 2014, we amended and restated our Second Amended and Restated Certificate of Incorporation to effect a stock split on a for basis to be effected prior to the effective date of the registration statement of which this prospectus forms a part. The stock split will be effected simultaneously for all our then-existing common stock and common stock options and the exchange ratio will be the same for all of our shares of issued and outstanding common stock. The stock split will affect all of our stockholders uniformly and will not affect any stockholder’s percentage ownership interests in us. Unless otherwise indicated, information presented in this prospectus is adjusted to reflect the for stock split.
We do not anticipate declaring or paying any cash dividends to holders of our common stock in the foreseeable future. We currently intend to retain future earnings, if any, to finance the growth of our business. Our future dividend policy is within the discretion of our board of directors and will depend upon then-existing conditions, including our results of operations, financial condition, capital requirements, investment opportunities, statutory restrictions on our ability to pay dividends and other factors our board of directors may deem relevant. In addition, our revolving credit facility and term loans place restrictions on our ability to pay cash dividends.
37
Table of Contents
Dilution is the amount by which the offering price paid by the purchasers of shares of common stock sold in this offering will exceed the net tangible book value per share of common stock after the offering. Assuming an initial public offering price of $ per share (which is the midpoint of the price range set forth on the cover page of this prospectus), on a pro forma basis as of June 30, 2014, our net tangible book value would have been approximately $ million, or $ per share of common stock. This remains unchanged when adjusted for the sale by the selling stockholders of shares of common stock in this offering at an assumed initial public offering price of $ per share of common stock. Purchasers of shares of our common stock in this offering will experience substantial and immediate dilution in net tangible book value per share of common stock for financial accounting purposes, as illustrated in the following table.
| Assumed Initial public offering price per share |
$ | |||
| Pro forma net tangible book value per share before and after the offering |
||||
| Immediate dilution in net tangible book value per share to purchasers in the offering (1) |
$ | |||
|
|
|
| (1) | Because the total number of shares outstanding following this offering will not be impacted by any exercise of the underwriters’ option to purchase additional shares of common stock from the selling stockholders and we will not receive any net proceeds from such exercise, there will be no change to the dilution in net tangible book value per share of common stock to purchasers in the offering due to any such exercise of the option. |
38
Table of Contents
SELECTED HISTORICAL CONSOLIDATED FINANCIAL AND OPERATING DATA
The following table sets forth our selected historical consolidated financial and operating data as of the dates and for the periods indicated. We have derived the selected historical consolidated financial and operating data as of and for the years ended December 31, 2009, 2010 and 2011 from our unaudited consolidated financial statements, which are not included in this prospectus. We have derived the selected historical consolidated financial and operating data as of, and for the years ended December 31, 2012 and 2013 from our audited consolidated financial statements, which are included elsewhere in this prospectus. We have derived the selected historical consolidated financial and operating data for the six months ended June 30, 2013 and as of and for the six months ended June 30, 2014 from our unaudited condensed consolidated financial statements that are included elsewhere in this prospectus. We have derived the financial data as of June 30, 2013 from our unaudited condensed consolidated financial statements that are not included in this prospectus. Our unaudited condensed consolidated financial statements have been prepared on the same basis as our audited consolidated financial statements and, in our opinion, include all adjustments, consisting of normal recurring adjustments, that we consider necessary for a fair presentation of our financial position, results of operations and cash flows for such periods. Historical results are not necessarily indicative of future results.
The selected historical consolidated data presented below should be read in conjunction with “Risk Factors,” “Management’s Discussion and Analysis of Financial Condition and Results of Operations” and our consolidated financial statements and the related notes and other financial data included elsewhere in this prospectus.
| Year Ended December 31, | Six Months Ended June 30, |
|||||||||||||||||||||||||||
| 2009 | 2010 | 2011 | 2012 | 2013 | 2013 | 2014 | ||||||||||||||||||||||
| (In thousands) | ||||||||||||||||||||||||||||
| Statement of Income Data: |
||||||||||||||||||||||||||||
| Revenue |
$ | 398,660 | $ | 667,089 | $ | 909,742 | $ | 885,190 | $ | 988,386 | $ | 448,241 | $ | 629,223 | ||||||||||||||
| Income from operations |
78,711 | 173,034 | 296,903 | 278,426 | 227,956 | 125,621 | 146,246 | |||||||||||||||||||||
| Income before provision for income taxes |
69,526 | 146,602 | 217,855 | 219,842 | 149,876 | 98,510 | 111,227 | |||||||||||||||||||||
| Net income |
49,506 | 100,494 | 146,098 | 149,473 | 104,657 | 68,816 | 78,815 | |||||||||||||||||||||
| Net income attributable to FML Holdings, Inc. |
48,901 | 99,454 | 145,183 | 148,886 | 103,961 | 68,564 | 78,460 | |||||||||||||||||||||
| Earnings per share: |
||||||||||||||||||||||||||||
| Basic(1) |
n/a | n/a | $ | 32.28 | $ | 32.49 | $ | 22.66 | $ | 14.95 | $ | 17.04 | ||||||||||||||||
| Diluted(1) |
n/a | n/a | $ | 30.70 | $ | 30.80 | $ | 21.47 | $ | 14.17 | $ | 16.11 | ||||||||||||||||
| Statement of Cash Flows Data: |
||||||||||||||||||||||||||||
| Net cash provided by (used in): |
||||||||||||||||||||||||||||
| Operating activities |
$ | 96,566 | $ | 75,722 | $ | 167,861 | $ | 186,433 | $ | 174,635 | $ | 93,657 | $ | 49,982 | ||||||||||||||
| Investing activities |
(13,156 | ) | (45,165 | ) | (102,572 | ) | (107,366 | ) | (579,517 | ) | (161,575 | ) | (60,613 | ) | ||||||||||||||
| Financing activities |
(82,076 | ) | 3,783 | (49,202 | ) | (119,070 | ) | 410,515 | 70,901 | 5,347 | ||||||||||||||||||
| Other Financial Data: |
||||||||||||||||||||||||||||
| Capital expenditures |
$ | 20,158 | $ | 41,928 | $ | 77,827 | $ | 109,016 | $ | 111,514 | $ | 41,276 | $ | 61,827 | ||||||||||||||
| EBITDA(2) |
96,522 | 192,820 | 303,227 | 303,659 | 248,877 | 140,352 | 172,872 | |||||||||||||||||||||
| Adjusted EBITDA(2) |
102,854 | 239,144 | 335,110 | 318,650 | 292,584 | 146,330 | 179,984 | |||||||||||||||||||||
| Operating Data: |
||||||||||||||||||||||||||||
| Proppant Solutions: |
||||||||||||||||||||||||||||
| Total tons sold |
1,730 | 2,609 | 3,402 | 3,765 | 5,117 | 2,134 | 3,352 | |||||||||||||||||||||
| Revenue |
$ | 325,542 | $ | 580,117 | $ | 807,849 | $ | 757,851 | $ | 856,212 | $ | 378,286 | $ | 567,185 | ||||||||||||||
| Average selling price (per ton) |
$ | 188 | $ | 222 | $ | 237 | $ | 201 | $ | 167 | $ | 177 | $ | 169 | ||||||||||||||
| Segment contribution margin(3) |
n/a | 248,187 | 339,050 | 316,251 | 296,320 | 150,267 | 192,928 | |||||||||||||||||||||
| Industrial & Recreational Products: |
||||||||||||||||||||||||||||
| Total tons sold |
1,918 | 2,228 | 2,296 | 2,375 | 2,462 | 1,261 | 1,193 | |||||||||||||||||||||
| Revenue |
$ | 73,118 | $ | 86,972 | $ | 101,893 | $ | 127,339 | $ | 132,174 | $ | 69,955 | $ | 62,038 | ||||||||||||||
| Average selling price (per ton) |
$ | 38 | $ | 39 | $ | 44 | $ | 53 | $ | 54 | $ | 55 | $ | 52 | ||||||||||||||
| Segment contribution margin(3) |
n/a | 20,904 | 29,142 | 37,837 | 34,765 | 17,002 | 16,835 | |||||||||||||||||||||
| Balance Sheet Data (at period end): |
||||||||||||||||||||||||||||
| Cash and cash equivalents |
$ | 3,841 | $ | 38,788 | $ | 51,765 | $ | 11,866 | $ | 17,815 | $ | 14,934 | $ | 12,514 | ||||||||||||||
| Total assets |
340,521 | 522,179 | 646,176 | 679,601 | 1,283,431 | 860,400 | 1,375,488 | |||||||||||||||||||||
| Long term debt (including current portion) |
235,409 | 709,925 | 947,447 | 831,195 | 1,262,146 | 906,010 | 1,264,972 | |||||||||||||||||||||
| Total liabilities |
314,458 | 857,475 | 1,094,168 | 965,529 | 1,448,789 | 1,073,788 | 1,457,461 | |||||||||||||||||||||
| Total equity (deficit)(4) |
26,063 | (335,296 | ) | (447,992 | ) | (285,928 | ) | (165,358 | ) | (213,338 | ) | (81,973 | ) | |||||||||||||||
39
Table of Contents
| (1) | Basic and diluted earnings per share are not disclosed for 2009 and 2010 since they are not considered meaningful for the periods prior to the AS Group Acquisition. |
| (2) | EBITDA and Adjusted EBITDA are non-GAAP financial measures. For a definition of EBITDA and Adjusted EBITDA and a reconciliation to net income, please see “—Summary Historical Consolidated Financial and Operating Data—Non-GAAP Financial Measures” beginning on page 10. |
| (3) | Segment contribution margin is not available for the year ended December 31, 2009. |
| (4) | The reduction in equity in 2010 resulted from our purchase of treasury stock in connection with the AS Group Acquisition. |
40
Table of Contents
MANAGEMENT’S DISCUSSION AND ANALYSIS OF FINANCIAL CONDITION AND RESULTS OF OPERATIONS
The following discussion and analysis summarizes the significant factors affecting the consolidated operating results, financial condition, liquidity and cash flows of our company as of and for the periods presented below. The following discussion and analysis should be read in conjunction with our consolidated financial statements and the related notes included elsewhere in this prospectus. This discussion contains forward-looking statements that are based on the beliefs of our management, as well as assumptions made by, and information currently available to, our management. Actual results could differ materially from those discussed in or implied by forward-looking statements as a result of various factors, including those discussed below and elsewhere in this prospectus, particularly in the section entitled “Risk Factors.”
Overview
We are one of the world’s largest providers of sand-based proppant solutions and for over 30 years have been a pioneer in the development of high performance proppants used by oilfield service and E&P companies to enhance the productivity of their oil and gas wells. Fairmount Santrol offers the broadest range of proppants available in the market today, including high quality sand and a spectrum of resin coated products, all of which exceed API specifications. Additionally, for more than 120 years, we and our predecessor companies have provided high quality sand-based products, strong technical leadership and applications knowledge to end users in the I&R markets. We believe our two primary market segments are complementary. Our ability to sell to a wide range of customers across multiple end markets allows us to maximize the economic recovery of our reserve base.
We have one of the largest sand reserves and processing asset bases in the industry, including, as of December 31, 2013, 798.2 million tons of proven mineral reserves, 11 active sand processing facilities with 12.3 million tons of annual sand processing capacity, a resin manufacturing facility and 11 coating facilities with 2.4 million tons of annual coating capacity. From 2009 to 2013, we expanded our annual raw frac sand and coating capacities by approximately 6.0 million and 1.5 million tons, respectively, through a combination of organic growth and acquisitions. Our coating facilities include operations in Mexico, Denmark and China, through which we serve international oil and gas markets.
We are capable of Class I railroad deliveries to each of North America’s major oil and gas producing basins and we also have the flexibility to ship our product via barge and trucks to reach our customers in certain basins. We operate an integrated logistics platform consisting of 46 proppant distribution terminals with significant associated storage, 32 of which exclusively handle our products. Since 2011, we have developed or acquired 24 distribution terminals, providing significant additional annual transloading capacity. We also service I&R end markets through seven additional terminals. As of August 15, 2014, we had a fleet of over 8,500 railcars and expect this fleet to grow to over 13,000 through 2016. By the end of the third quarter of 2014, we also expect to have expanded our unit train capabilities to three production facilities and three in-basin terminals, which we expect to significantly reduce freight costs and improve cycle times for our railcar fleet.
As one of the nation’s longest continuously operating mining organizations, we have developed a strong commitment to environmental stewardship and to the three pillars of Sustainable Development: People, Planet and Prosperity. Our strong commitment to safety is reflected in the health and safety of our employees and is illustrated by achieving a lost-time incident rate that is less than half the industry average. From 2011 through June 30, 2014, our employees have demonstrated our commitment to our communities by donating approximately 36,000 hours of company-paid volunteer time, as well as significant personal volunteer time, into the communities in which we live and operate. We are focused on environmental stewardship, and ten of our facilities now generate zero waste to landfills. Additionally, we have successfully executed annual initiatives to reduce our carbon emissions and have planted over 225,000 trees since 2011 in order to offset our Tier I and Tier II carbon emissions. We believe adhering to sustainable development principles is not only the right thing to do, but also results in a higher level of engagement and commitment from our employees, better relationships
41
Table of Contents
with our communities and, as a result, a stronger base from which to pursue profitable growth over the long-term. Abiding by these guiding principles, our corporate motto is “Do Good. Do Well.”
Our period-to-period results will be materially impacted by, among other market factors, the volumes of products we sell, the relative segment mix comprising our revenues, the mix of products we sell within each segment, prevailing market prices for the products we offer, transportation costs, operational cost factors, and the resulting margins we earn on products sold. The relatively higher per unit margins generated within our Proppant Solutions segment largely reflect the demand for their specific product performance characteristics and qualities, the higher investments required to develop and distribute these products, and the more constricted and geographically limited product supply available to these markets. Our average I&R selling prices trend below those generated within our Proppant Solutions segment, reflecting local or regional supply and demand dynamics and the relative economics of the I&R end markets.
For the year ended December 31, 2013, we sold over 7.5 million tons, generating approximately $988 million of revenues, $293 million of Adjusted EBITDA and $105 million of net income (see our discussion of the use of non-GAAP measures of profitability on page 10 of this prospectus).
Recent Trends and Outlook
Recent trends driving demand for our proppants and commercial silica include:
| • | Increasing activity in the oil and gas market. The growth in the use of horizontal drilling utilizing hydraulic fracturing as a means to extract hydrocarbons from shale formations has resulted in increases in the number of new wells drilled and completed in North America. This increased completion activity has contributed to the growth in the demand for proppants, and we expect this trend to continue. |
| • | Evolving completion techniques that favor increased proppant use. E&P companies, in partnership with oilfield service companies, continue to refine their well design and hydraulic fracturing techniques to maximize hydrocarbon recovery from each well. These techniques vary based on formation and well geology, but some of the more pervasive recent trends include longer lateral drilling lengths coupled with an increased number of hydraulic fracturing stages per well. E&P and oilfield service companies have also been increasing the amount of proppant used per frac stage and, together, these techniques have greatly increased the volume of proppant used in the completion of each well, which we expect will continue to drive growth in our volumes sold. |
| • | Shift in drilling activity and demand mix. Following declines in the price of natural gas in late 2011 and early 2012, E&P companies generally moved their primary operating activity away from dry gas-focused regions like the Haynesville and Barnett Shales towards liquids-rich plays like the Eagle Ford Shale and the Williston and Permian Basins. Rigs drilling for natural gas in the U.S. declined from 64% of the total rig count in the beginning of 2010 to 21% by the end of 2013. This shift away from natural gas production negatively impacted the demand for certain types of proppant products. During this period, sales of our resin coated proppants used in deep, high pressure wells in the Haynesville Shale declined significantly. However, also during this period, E&P companies increased their drilling activity directed towards oil and natural gas liquids rich acreage. In addition, many E&P companies found improved well production results as a result of using greater quantities of proppant per well. As a consequence of these trends, we experienced a significant increase in demand for raw frac sand, which generally carries a lower margin per ton and a lower margin as a percentage of selling price than our resin coated products. Accordingly, a shift in sales mix toward raw frac sand will reduce our overall margin and results of operations. |
| • | Increased demand for in-basin delivery of proppant. From 2010 to 2012, when demand for proppant significantly outstripped available supply and distribution infrastructure across the industry was largely underdeveloped, a larger portion of our volumes was provided to customers at our processing site (i.e., our customers would arrange for the transportation and storage logistics of our products). Increasingly, |
42
Table of Contents
| customers seek to outsource proppant logistics and obtain in-basin product delivery. In 2013, approximately 80% of our proppant volume was sold in-basin at one of our distribution terminals, compared to approximately 65% in 2012. While the resulting profit per ton is roughly in-line across the industry for minegate or delivered proppant, we believe this shift will favor the larger, integrated providers and have a favorable impact on our demand. |
| • | Continued stable demand in industrial end markets. Sales in our I&R Products segment are driven by macroeconomic factors such as housing starts, light vehicle sales, repair and remodel activity and industrial production. To the extent these demand drivers continue on their current trends, we expect to experience relatively stable demand for commercial silica. |
We expect many of the recent trends in the oil and gas industry to continue to drive increased proppant demand into the future. In its 2014 report, The Freedonia Group’s research indicates that total proppant volumes in the U.S. increased at an annual rate of approximately 26% since 2008. Looking forward, The Freedonia Group projects that raw frac sand sales will increase at an annual growth rate of approximately 9% between 2013 and 2018, and that resin coated sand volumes will increase at a nearly 11% rate over the same period.
Acquisitions
Our 2013 results may not be comparable to past or future results because of the impact of these acquisitions. We completed three acquisitions in 2013, each of which is described below.
In April 2013, we acquired Self-Suspending Proppant LLC (“SSP LLC”) for $55 million. Under the term of the acquisition agreement, we are required to make contingent payments based on our sales of Propel SSP or products incorporating similar proprietary technology during a five-year period commencing on October 1, 2015. Pursuant to the contingent payment provisions, we are generally required to pay the former owner of SSP LLC 50% of the cumulative product margin we earn from such sales during the pay-out period, less certain adjustments. The contingent obligation will be recorded as an increase in acquired assets and a corresponding contingent liability, and the payments are required to be made on an annual basis, within 60 days of each anniversary of the commencement of the pay-out period. During the pay-out period, our net cash flows realized from sales of Propel SSP and related products will be reduced as a result of these contingent payments. In the event that the contingent payments for the first and second annual pay-out periods do not exceed $45 million (less certain adjustments) and we do not make up any shortfall in such minimum payment amount, the former owner of SSP LLC will have the right to reacquire a 51% interest in SSP LLC. In the event that the aggregate amount of all contingent payments does not exceed $195 million (less certain adjustments) and we do not make up any shortfall in such minimum payment amount, the former owner of SSP LLC will have the right to reacquire an 80% interest in SSP LLC. As the owner of SSP LLC, we own intellectual property related to providing proppants with enhanced performance attributes through proprietary coating technology.
In June 2013, we acquired Great Plains Sands, LLC (“Great Plains”) located in Minnesota for total consideration of $74 million including $10 million of contingent consideration. This transaction provided us with approximately 15.3 million tons of API-spec Northern White frac sand reserves and 700,000 tons of annual production capacity.
In September 2013, we purchased certain assets and assumed certain liabilities from FTSI and its affiliates. We acquired 353 million tons of sand reserves; 2.7 million tons per year of frac sand production capacity; 0.6 million tons per year of resin coating capacity; and logistics assets consisting of 13 terminals and 2,798 railcars. We recorded the acquired assets and assumed liabilities at fair value on the date of the acquisition, including $95.5 million of sand reserves, $127.7 million of property, plant and equipment, $26.0 million of inventory, $50.1 million of goodwill and other intangibles, and $2.3 million of assumed liabilities. We also have an option to purchase 33 million tons of API-spec Northern White sand reserves and an additional 1.0 million tons per year of frac sand production capacity. In connection with this acquisition, we also entered into a ten-year supply agreement with FTSI (“FTSI Supply Agreement”). The fair value of the FTSI Supply Agreement was
43
Table of Contents
determined to be $50.7 million. The total consideration for the FTSI transaction of $350 million, including $2.3 million of assumed liabilities, was financed with long-term debt.
After completing the FTSI transaction, we integrated the acquired production facilities, terminals and railcars into our existing network, such that we do not distinguish assets and operations acquired from FTSI from our legacy assets and operations when optimizing the efficiency of product delivery to our customers. The operations acquired from FTSI are being operated and managed similar to our legacy operations. Volumes sold to FTSI under the FTSI Supply Agreement are being supplied from both legacy and acquired assets as the capacity that we acquired from FTSI was not adequate to satisfy FTSI’s proppant demand. Additionally, volumes sold to other customers are being supplied from both legacy assets and assets acquired from FTSI.
How We Generate Our Sales
We derive our sales by mining, processing and transporting sand-based proppants and silica sand products that our customers purchase for use in a wide variety of applications. We maintain long-term relationships with many of the largest North American hydraulic fracturing service providers, and currently have approximately 80 customers for our proppant products. Our collaborative approach to product development and innovation, reputation for high-quality products and expansive logistics network have solidified us as a critical component within our customers’ supply chains. Certain of our top customer relationships date back over 30 years.
Our customers are not the ultimate end users of our products. Overall market demand is driven by the activity of E&P companies who ultimately drive and are increasingly dictating the specific type and volume of our proppants that are consumed in their wells. Our technical sales team works closely with oilfield services companies and E&P companies to demonstrate the value proposition of our performance proppants in order to stimulate market demand from the ultimate beneficiaries of our products.
Demand for sand-based proppants is closely linked to proppant consumption patterns for the completion of oil and natural gas wells in North America. These consumption patterns in a particular basin are influenced by numerous factors, including the price for hydrocarbons, the drilling rig count and hydraulic fracturing activity levels, including the number of stages completed and the amount of proppant used per stage. Further, these consumption patterns are also influenced by the location, quality, selling price and availability of sand-based proppants and other types of proppants such as ceramic proppant. Selling prices for sand-based proppants vary by basin and are determined based on supply and demand dynamics within each basin.
In our Proppant Solutions business, we sell over 80% of our volume through our network of terminals at selling prices that are set by local market dynamics. The remaining volume in the Proppant Solutions business is sold to customers directly from our production facilities. The average selling prices for products sold through our terminals is higher than the average selling prices for comparable product sold from our production facilities due to costs incurred to handle and transport the products from the production facilities to the terminals. Generally, logistics costs can comprise 70-80% of the delivered cost of Northern White frac sand, depending on the basin into which the product is delivered. Due to the closer proximity of distribution terminals to our production facility, the amount of logistics costs included in the total delivered cost of our Texas Gold brown sand generally will be lower than that for our Northern White frac sand.
Our Proppant Solutions segment represented 87% of our revenues in 2013. During 2012 and 2013, our top ten proppant customers represented 65% and 64% of our revenues, respectively. Our I&R Products segment has approximately 770 customers and represented 13% of our revenues in 2013.
Throughout our history we have sold proppants both on a purchase order basis and pursuant to supply agreements. The duration, volume provisions and other terms of our proppant supply agreements vary by customer. Our proppant supply agreements generally have initial terms between two and ten years, and typically require our customers to purchase a fixed minimum volume or a specified percentage of their product
44
Table of Contents
requirements. Those with fixed volumes typically include penalty provisions which apply where our customer fails to purchase the required minimum volume. Our proppant supply agreements typically include market pricing mechanisms. Under many of our proppant sales agreements we are able to propose price increases to our customers, with such price increases to take effect after a notice period of 30 to 45 days. If the customer does not accept the proposed increase, we have the option to maintain the agreement under its existing terms or to terminate it. In addition, many of our proppant supply agreements also include pricing protection provisions for the benefit of our customers where, after providing us with notice, they are able to obtain product from another source at a price that is materially less than the price at which we are willing to provide the product. Our supply agreements contain customary termination provisions for matters such as bankruptcy related events, uncured breaches of the applicable agreement and unresolved pricing disputes.
In September 2013, in connection with the purchase of FTSI assets, we entered into a ten-year supply agreement with FTSI. During the period ending December 31, 2018, FTSI is required to purchase stated minimum amounts of product from us at fixed prices (subject to adjustment for transportation charges). A make-whole payment applies if FTSI does not purchase the minimum amounts required by the agreement. During the remainder of the term of the agreement FTSI is required to purchase a percentage of its proppant requirements based on market pricing. Neither party can terminate the agreement except in connection with a breach by the other party.
The Costs of Conducting Our Business
The principal costs involved in operating our business are logistics costs associated with transporting products from our production facilities to our terminals; payroll costs for personnel at our production, terminal and administrative facilities; resin and other raw materials used in the production of our products; and maintenance and supply costs at our production facilities. We own, or pay modest royalties on, the majority of our sand reserves, which we believe helps us maintain a competitive cost position.
Logistics costs, including freight, railcar leases, demurrage and handling, were our largest expense category in 2013, representing 31% of our revenues over the same period. Freight costs primarily represent charges to transport our product by rail, but we also ship product by truck and barge. In order to move product by rail, we lease a substantial number of railcars under operating leases with durations ranging from three to seven years. As of August 15, 2014, we had 7,720 railcars under lease and 787 railcars made available to us from our customers giving us a total fleet of over 8,500 railcars. Demurrage costs are charged by the railroads based on the time a railcar spends on the rail in excess of the allotted time. These costs can vary significantly from period to period driven by high levels of rail activity at a terminal and changes in the timing of fulfilling customer orders. Handling costs are incurred at our distribution and terminal facilities to move product from one mode of transportation to another (e.g., truck to railcar) and to move product into storage facilities.
Labor costs, including wages and benefits, represented 9% of revenues in 2013. Approximately 14% of our domestic workforce was party to collective bargaining contracts as of December 31, 2013.
We use a significant amount of resins and additives in the production of our coated products in both our Proppant Solutions and I&R businesses. We purchase these resins and additives under supply agreements that contain annual pricing adjustments based on the cost of phenol, the primary component of the resins we buy. We also supply a portion of our resin requirements from our resin manufacturing facility located in Michigan. The cost of resins and additives represented 9% of revenues in 2013.
Our selling, general and administrative costs were 8% of our revenues in 2013 and include the wages and benefits costs noted above. These costs are related to our corporate operations, including costs for the sales and marketing; research and development; finance; legal; and environmental, health and safety functions of our organization. We anticipate that as a public company we will incur additional legal, accounting, insurance and
45
Table of Contents
other expenses that we have not incurred as a private company, including costs associated with public company reporting requirements. These requirements include compliance with the Sarbanes-Oxley Act as well as other rules implemented by the SEC, and applicable stock exchange rules. We expect these rules and regulations to substantially increase our legal and financial compliance costs and to make certain financial reporting and other activities more time-consuming and costly.
We capitalize the costs of our mining and processing equipment and depreciate it over its expected useful life. We also capitalize the pre-production costs to remove overburden on our sand reserves and amortize them based on the actual tons mined. Depreciation, depletion and amortization costs represented 3.8% of our revenues for 2013. Repair and maintenance costs that do not involve the replacement of major components of our equipment and facilities are expensed as incurred. These repair and maintenance costs can be significant due to the abrasive nature of our products and represented 2% of our revenues in 2013.
How We Evaluate Our Business
Our management uses a variety of financial and operational metrics to analyze our performance across our Proppant Solutions and I&R Products segments. This segmentation is based on the primary end markets we serve, our management structure and the financial information that is reviewed by the chief operating decision maker in deciding how to allocate resources and assess performance. We evaluate the performance of these segments based on their volumes sold, average selling price and segment contribution margin. We do not evaluate the performance of the segments on a margin percentage basis, as that is a function of the manner in which a given product is sold (for example in-basin sales generate higher selling price but comparable per ton margin, resulting in a reduced margin percentage) and product mix. Additionally, we consider a number of factors in evaluating the performance of the business as a whole, including total volumes sold and Adjusted EBITDA. We view these metrics as important factors in evaluating our profitability and review these measurements frequently to analyze trends and make decisions.
Segment Contribution Margin
Segment contribution margin is a key metric that management uses to evaluate our operating performance and to determine resource allocation between segments. We define segment contribution margin as segment revenues less cost of goods sold less selling, general and administrative expenses directly attributable to that segment. These selling, general and administrative expenses exclude costs related to corporate functional areas such as administration, accounting, information technology, human resources, research and development, business development and sustainable development.
EBITDA and Adjusted EBITDA
EBITDA and Adjusted EBITDA are supplemental non-GAAP financial measures that are used by management and external users of our financial statements, such as lenders and rating agencies.
We define EBITDA as net income before interest expense, income tax expense, depreciation, depletion and amortization. We define Adjusted EBITDA as EBITDA before non-cash stock-based compensation, management fees and reimbursement of expenses to sponsor, transaction expenses, impairment of assets, loss on extinguishment of debt, gain or loss on disposal of assets, and other non-cash income or expenses.
Management believes EBITDA and Adjusted EBITDA are useful because they allow us to more effectively evaluate our operating performance and compare the results of our operations from period to period without regard to our financing methods, capital structure or non-recurring or non-operating expenses. EBITDA and Adjusted EBITDA have limitations as analytical tools and should not be considered as alternatives to, or more meaningful than, net income or cash flows from operating activities as determined in accordance with GAAP or as indicators of
46
Table of Contents
our operating performance or liquidity. Certain items excluded from EBITDA and Adjusted EBITDA are significant components in understanding and assessing a company’s financial performance, such as a company’s cost of capital and tax structure, as well as the historic costs of depreciable assets, none of which are components of EBITDA or Adjusted EBITDA. Our computations of EBITDA and Adjusted EBITDA may not be comparable to other similarly titled measures of other companies. We believe that EBITDA and Adjusted EBITDA are widely followed measures of operating performance and may also be used by investors to measure our ability to meet debt service requirements.
For a reconciliation of Adjusted EBITDA to its most directly comparable financial measures calculated and presented in accordance with GAAP, please read “—Summary Historical Consolidated Financial and Operating Data—Non-GAAP Financial Measures” beginning on page 10.
Results of Operations
The following table presents our consolidated statement of operations and certain operating data. The results of operations by segment are discussed in further detail following the consolidated overview.
| Year ended December 31, | Six months ended June 30, | |||||||||||||||
| 2012 | 2013 | 2013 | 2014 | |||||||||||||
| (In thousands, except selling data) | ||||||||||||||||
| Statement of Income Data: |
||||||||||||||||
| Revenues |
$ | 885,190 | $ | 988,386 | $ | 448,241 | $ | 629,223 | ||||||||
| Cost of sales (excluding depreciation, depletion, amortization and stock compensation expense) |
502,417 | 627,842 | 266,406 | 402,302 | ||||||||||||
| Selling, general and administrative expenses |
65,430 | 81,858 | 36,280 | 49,168 | ||||||||||||
| Depreciation, depletion and amortization expense |
27,690 | 37,771 | 15,553 | 27,522 | ||||||||||||
| Stock compensation expense |
11,434 | 10,133 | 3,709 | 4,313 | ||||||||||||
| Other operating expense (income) |
(207 | ) | 2,826 | 672 | (328 | ) | ||||||||||
|
|
|
|
|
|
|
|
|
|||||||||
| Income from operations |
278,426 | 227,956 | 125,621 | 146,246 | ||||||||||||
| Interest expense, net |
56,714 | 61,926 | 26,541 | 34,478 | ||||||||||||
| Loss on extinguishment of debt |
— | 11,760 | — | — | ||||||||||||
| Other non-operating expense |
1,870 | 4,394 | 570 | 541 | ||||||||||||
|
|
|
|
|
|
|
|
|
|||||||||
| Income before provision for income taxes |
219,842 | 149,876 | 98,510 | 111,227 | ||||||||||||
| Provision for income taxes |
70,369 | 45,219 | 29,694 | 32,412 | ||||||||||||
|
|
|
|
|
|
|
|
|
|||||||||
| Net income |
$ | 149,473 | $ | 104,657 | $ | 68,816 | $ | 78,815 | ||||||||
|
|
|
|
|
|
|
|
|
|||||||||
| Other Financial Data: |
||||||||||||||||
| EBITDA |
$ | 303,659 | $ | 248,877 | $ | 140,352 | $ | 172,872 | ||||||||
| Adjusted EBITDA |
318,650 | 292,584 | 146,330 | 179,984 | ||||||||||||
| Operating Data: |
||||||||||||||||
| Proppant Solutions: |
||||||||||||||||
| Total tons sold |
3,765 | 5,117 | 2,134 | 3,352 | ||||||||||||
| Revenue |
$ | 757,851 | $ | 856,212 | $ | 378,286 | $ | 567,185 | ||||||||
| Average selling price (per ton) |
$ | 201 | $ | 167 | $ | 177 | $ | 169 | ||||||||
| Segment contribution margin |
$ | 316,251 | $ | 296,320 | $ | 150,267 | $ | 192,928 | ||||||||
| Industrial & Recreational Products: |
||||||||||||||||
| Total tons sold |
2,375 | 2,462 | 1,261 | 1,193 | ||||||||||||
| Revenue |
$ | 127,339 | $ | 132,174 | $ | 69,955 | $ | 62,038 | ||||||||
| Average selling price (per ton) |
$ | 53 | $ | 54 | $ | 55 | $ | 52 | ||||||||
| Segment contribution margin |
$ | 37,837 | $ | 34,765 | $ | 17,002 | $ | 16,835 | ||||||||
47
Table of Contents
Six Months Ended June 30, 2014 Compared to Six Months Ended June 30, 2013
Revenues
Revenues increased $181.0 million, or 40%, from $448.2 million for the six months ended June 30, 2013 to $629.2 million for the six months ended June 30, 2014, primarily due to increased sales volumes in our Proppant Solutions segment.
Revenues in the Proppant Solutions segment increased $188.9 million, or 50%, from $378.3 million for the six months ended June 30, 2013 to $567.2 million for the six months ended June 30, 2014. Total volumes increased 57% from 2.1 million tons in the six months ended June 30, 2013 to 3.4 million tons in the six months ended June 30, 2014. Raw sand volumes increased by 63% from 1.6 million tons in the first half of 2013 to 2.7 million tons in the first half of 2014. Volumes sold under the FTSI Supply Agreement accounted for 86% of the increase in raw sand volumes. Additional volume growth for raw sand was limited by adverse weather conditions and logistical constraints (primarily rail) in the first half of 2014. The average selling price for raw sand increased 8% from the first half of 2013 to the first half of 2014, which was primarily the result of an increase in the proportion of raw sand sold through our terminal network and an increase in the market price of certain grades of sand, partially offset by a shift in volumes sold towards finer grades of raw sand and the volume of Texas Gold brown sand sold under the FTSI Supply Agreement in the six months ended June 30, 2014. Resin coated proppant volumes increased 37% from 501,000 tons in the six months ended June 30, 2013 to 687,000 tons in the six months ended June 30, 2014. Volumes sold under the FTSI Supply Agreement accounted for 21% of the increase in resin coated proppant volumes. The average selling price for resin coated proppant decreased 5% from the first half of 2013 to the first half of 2014, which was primarily the result of a decline in the market price of resin coated proppant products.
Revenues in the I&R Products segment decreased $7.9 million, or 11%, from $69.9 million for the six months ended June 30, 2013 to $62.0 million for the six months ended June 30, 2014. Volumes decreased 67,000 tons, or 5%, from 1.3 million tons in the first half of 2013 to 1.2 million tons in the first half of 2014, primarily due to a decrease in volume sold into the specialty and foundry end markets. The average selling price decreased 6%, from $55 per ton in the first half of 2013 to $52 per ton in the first half of 2014 which was primarily due to us no longer paying and billing for freight for a customer in our glass end market.
Segment Contribution Margin
Contribution margin in the Proppant Solutions segment increased $42.7 million, or 28%, from $150.3 million for the six months ended June 30, 2013 to $193.0 million for the six months ended June 30, 2014. The increase was primarily due to additional raw sand and resin coated volumes, most notably those associated with the FTSI Supply Agreement, partially offset by reduced selling prices on resin coated products and a shift to lower-margin coated products for the six months ended June 30, 2014 compared to the six months ended June 30, 2013.
Contribution margin in the I&R Products segment decreased $0.2 million, or 1%, from $17.0 million for the six months ended June 30, 2013 to $16.8 million for the six months ended June 30, 2014 primarily due to decreased volumes and a mix shift to lower-margin glass products, partially offset by increases in the prices of foundry products.
Selling, General and Administrative Expenses
Selling, general and administrative expenses increased $12.9 million, or 36%, from $36.3 million for the six months ended June 30, 2013 to $49.2 million for the six months ended June 30, 2014. The increase was primarily due to increased sale and marketing costs for our Proppant Solutions segment (included in Segment Contribution Margin noted above) and increased corporate costs to support the growth of the business.
48
Table of Contents
Depreciation, Depletion and Amortization
Depreciation, depletion and amortization increased $12.0 million, or 77%, from $15.5 million for the six months ended June 30, 2013 to $27.5 million for the six months ended June 30, 2014 due to the increase in fixed and intangible assets arising from the FTSI transaction and capital expenditures primarily due to increased production and logistics capacities.
Income from Operations
Income from operations increased $20.6 million, or 16%, from $125.6 million for the six months ended June 30, 2013 to $146.2 million for the six months ended June 30, 2014.
Interest Expense
Interest expense increased $8.0 million, or 30%, from $26.5 million for the six months ended June 30, 2013 to $34.5 million for the six months ended June 30, 2014, primarily due to additional borrowings to fund the FTSI transaction.
Provision for Income Taxes
Provision for income taxes increased $2.7 million, or 9%, from $29.7 million for the six months ended June 30, 2013 to $32.4 million for the six months ended June 30, 2014. Our effective tax rate was 30.1% for the six months ended June 30, 2013 compared to the 29.1% for the six months ended June 30, 2014.
Net Income
Net income increased $9.9 million, or 14%, from $68.9 million for the six months ended June 30, 2013 to $78.8 million for the six months ended June 30, 2014. The increase was due to the factors noted above.
Adjusted EBITDA
Adjusted EBITDA increased from $146.3 million for the six months ended June 30, 2013 to $180.0 million for the same period in 2014, due primarily to an increase in segment contribution margin.
Year Ended December 31, 2013 Compared to Year Ended December 31, 2012
Revenues
Revenues increased $103.2 million, or 12%, from $885.2 million for the year ended December 31, 2012 to $988.4 million for the year ended December 31, 2013, primarily due to increased sand volumes in our Proppant Solutions segment.
Revenues in the Proppant Solutions segment increased $98.3 million, or 13%, from $757.9 million for the year ended December 31, 2012 to $856.2 million for the year ended December 31, 2013. Total volumes increased 36% from 3.8 million tons in 2012 to 5.1 million tons in 2013. Raw sand volumes increased 1.4 million tons, or 52%, from 2.7 million tons in the year ended December 31, 2012 to 4.1 million tons in the year ended December 31, 2013, 49% of which resulted from the FTSI transaction. The average selling price for raw sand increased 2% from 2012 to 2013. The proportion of raw sand sold through our terminal network increased from 57% in 2012 to 78% in 2013, which offset a decline in the market price of raw sand from 2012 to 2013, a mix shift toward finer grades of raw sand and sales of Texas Gold brown sand. Resin coated proppant volumes decreased 4% from 1.1 million tons in the year ended December 31, 2012 to 1.0 million tons in the year ended December 31, 2013. Resin coated proppants sold as a result of the FTSI transaction accounted for 4% of the total resin coated proppant volumes in the year ended December 31, 2013. The average selling price for resin coated sand decreased 4% from 2012 to 2013, which was primarily due to declines in market prices.
49
Table of Contents
Revenues in the I&R Products segment increased $4.9 million, or 4%, from $127.3 million for the year ended December 31, 2012 to $132.2 million for the year ended December 31, 2013. Volume increased 87,000 tons or 4% from 2.4 million tons in the year ended December 31, 2012 to 2.5 million tons in the year ended December 31, 2013, primarily due to an increase in volumes sold into our glass end market. The average selling price remained relatively constant, increasing from $53 per ton in 2012 to $54 per ton in 2013.
Segment Contribution Margin
Contribution margin in the Proppant Solutions segment decreased $20.0 million, or 6%, from $316.3 million for the year ended December 31, 2012 to $296.3 million for the year ended December 31, 2013. The decrease was driven by the decline in volume and selling prices for resin coated proppants, the shift in sales mix for raw sand toward finer grade sands which carry a lower margin profile and a non-recurring charge associated with the disposition of obsolete ceramic product. Incremental margin resulting from additional raw sand volume was partially offset by increased logistical and integration expenses to service volumes under the FTSI Supply Agreement.
Contribution margin in the I&R Products segment decreased $3.0 million, or 8%, from $37.8 million for the year ended December 31, 2012 to $34.8 million for the year ended December 31, 2013, primarily due to a decline in volumes and profitability in our resin coated foundry business.
Selling, General and Administrative Expenses
Selling, general and administrative expenses increased $16.5 million, or 25%, from $65.4 million for the year ended December 31, 2012 to $81.9 million for the year ended December 31, 2013. The increase was primarily due to non-recurring diligence, transaction and integration costs associated with our acquisition activity in 2013, increased sales and marketing costs for our Proppant Solutions segment and increased corporate costs to support the growth of our business.
Depreciation, Depletion and Amortization
Depreciation, depletion and amortization increased $10.1 million, or 36%, from $27.7 million for the year ended December 31, 2012 to $37.8 million for the year ended December 31, 2013. Approximately $4.4 million of the increase in depreciation, depletion and amortization was associated with assets acquired in the FTSI transaction. The remaining increase was the result of capital expenditures, primarily to increase production and logistics capacities.
Income from Operations
Income from operations decreased $50.4 million, or 18%, from $278.4 million for the year ended December 31, 2012 to $228.0 million for the year ended December 31, 2013, primarily as a result of decreased gross margins and increased selling, general and administrative expenses described above.
Interest Expense
Interest expense increased $5.2 million, or 9%, from $56.7 million for the year ended December 31, 2012 to $61.9 million for the year ended December 31, 2013. The increase was primarily due to additional borrowings to finance the Great Plains and FTSI transactions.
Provision for Income Taxes
Provision for income taxes decreased $25.1 million, or 36%, from $70.3 million for the year ended December 31, 2012 to $45.2 million for the year ended December 31, 2013. Income before provision for income
50
Table of Contents
taxes decreased $69.9 million or 32%, from $219.8 million for the year ended December 31, 2012 to $149.9 million for the year ended December 31, 2013. The effective tax rate for the year ended December 31, 2013 was 30% compared to 32% for the year ended December 31, 2012. The decrease in the effective tax rate was primarily due to larger depletion allowances in 2013 due to increased production.
Net Income
Net income decreased $44.8 million, or 30%, from $149.5 million for the year ended December 31, 2012 to $104.7 million for the year ended December 31, 2013 due to the factors noted above.
Adjusted EBITDA
Adjusted EBITDA decreased $26.1 million, or 8% from $318.7 million for the year ended December 31, 2012 to $292.6 million for the year ended December 31, 2013 due primarily to a decrease in segment contribution margin.
Liquidity and Capital Resources
Overview
Our principal liquidity requirements historically have been to service our debt, to meet our working capital and capital expenditure needs, to finance acquisitions and to occasionally pay dividends to our stockholders. We have met our liquidity and capital investment needs with funds generated through operations and through incremental borrowings.
We believe that cash generated through operations and our financing arrangements will be sufficient to meet working capital requirements, anticipated capital expenditures and scheduled debt payments for at least the next 12 months. As of June 30, 2014 we had $52.2 million of availability under our revolving credit facility. See “—Credit Facilities” for more information regarding our revolving credit facility.
Working Capital
Working capital is the amount by which current assets exceed current liabilities and is a measure of our ability to pay our liabilities as they become due. Our working capital was $170.9 million at December 31, 2013 and $232.3 million at June 30, 2014. The following table presents the components of our working capital as of December 31, 2012 and 2013 and June 30, 2014:
| December 31, | June
30, 2014 |
|||||||||||
| 2012 | 2013 | |||||||||||
| (In thousands) | ||||||||||||
| Current assets |
||||||||||||
| Cash and cash equivalents |
$ | 11,866 | $ | 17,815 | $ | 12,514 | ||||||
| Accounts receivable, net |
123,388 | 146,851 | 209,766 | |||||||||
| Inventories |
91,432 | 118,349 | 127,355 | |||||||||
| Deferred income tax benefit |
5,315 | 11,748 | 9,363 | |||||||||
| Prepaid expenses and other assets |
4,975 | 10,575 | 7,209 | |||||||||
|
|
|
|
|
|
|
|||||||
| Total current assets |
236,976 | 305,338 | 366,207 | |||||||||
|
|
|
|
|
|
|
|||||||
| Current liabilities |
||||||||||||
| Current portion of long-term debt |
3,332 | 15,687 | 15,687 | |||||||||
| Accounts payable |
43,456 | 89,998 | 89,047 | |||||||||
| Accrued expenses |
28,277 | 28,706 | 29,153 | |||||||||
|
|
|
|
|
|
|
|||||||
| Total current liabilities |
75,065 | 134,391 | 133,887 | |||||||||
|
|
|
|
|
|
|
|||||||
| Net working capital |
$ | 161,911 | $ | 170,947 | $ | 232,320 | ||||||
|
|
|
|
|
|
|
|||||||
51
Table of Contents
Accounts receivable
Accounts receivable increased $23.5 million from $123.4 million at December 31, 2012 to $146.9 million at December 31, 2013, primarily due to sales under the FTSI Supply Agreement. Accounts receivable increased $62.9 million from $146.9 million at December 31, 2013 to $209.8 million at June 30, 2014. December sales and accounts receivable are typically lower than at other points in the year due to seasonal weather conditions. However, weather conditions during December 2013 were unusually severe, causing significant logistics challenges that limited our ability to fulfill customer orders. Further, revenues increased each month during the first half of 2014, also contributing to the increase in accounts receivable since December 31, 2013.
Inventory
Inventory consists of raw materials, work-in-process and finished goods. The cost of finished goods includes processing costs and transportation costs to terminals. The increase in inventory from December 31, 2012 to December 31, 2013 was primarily driven by a $25.5 million increase in finished goods, primarily due to inventory held at terminals acquired in the FTSI transaction. The increase in inventory from $118.1 million at December 31, 2013 to $127.4 million at June 30, 2014 was primarily due to a general increase in sales volume and an increase in the number of distribution terminals to support customer needs.
Accounts Payable
The increase in accounts payable from $43.5 million at December 31, 2012 to $90.0 million at December 31, 2013 was primarily due to increased operating expenses related to the FTSI transaction and increased production volumes from 2012 to 2013. There was no significant change in accounts payable from December 31, 2013 to June 30, 2014.
Accrued Expenses
Accrued expenses stayed relatively constant from $28.3 million at December 31, 2012 to $28.7 million at December 31, 2013 to $29.2 million at June 30, 2014.
Cash Flow Analysis
| (amounts in millions) | ||||||||||||||||
| Year ended December 31, | Six months ended June 30, | |||||||||||||||
| 2012 | 2013 | 2013 | 2014 | |||||||||||||
| Net cash provided by (used in): |
||||||||||||||||
| Operating activities |
$ | 186.4 | $ | 174.6 | $ | 93.7 | $ | 50.0 | ||||||||
| Investing activities |
(107.4 | ) | (579.5 | ) | (161.6 | ) | (60.6 | ) | ||||||||
| Financing activities |
(119.1 | ) | 410.5 | 70.9 | 5.3 | |||||||||||
Net Cash Provided by Operating Activities
Net cash provided by operating activities consist primarily of net income adjusted for non-cash items, including depreciation, depletion and amortization and the effect of working capital changes.
Net cash provided by operating activities was $50.0 million for the six months ended June 30, 2014 compared to $93.7 million in the six months ended June 30, 2013. This $43.7 million decrease was primarily the result of accounts receivable increasing $62.9 million in the six months ended June 30, 2014 compared to an increase of $13.7 million in the six months ended June 30, 2013.
52
Table of Contents
Net cash provided by operating activities was $174.6 million in the year ended December 31, 2013 compared to $186.4 million in the year ended December 31, 2012. The $11.8 million decrease in cash provided by operating activities was due primarily to a $44.8 million decrease in net income, partially offset by a decrease in working capital for 2013 compared to 2012.
Net Cash Used in Investing Activities
Investing activities consist primarily of capital expenditures for growth and maintenance, and in certain periods, investments to acquire strategic assets or businesses. Growth capital expenditures generally are for expansions of production or terminal capacities or new greenfield development. Maintenance capital expenditures generally are for asset replacement and health, safety and quality improvements.
Net cash used in investing activities was $60.6 million in the six months ended June 30, 2014, compared to $161.6 million for the six months ended June 30, 2013. In the six months ended June 30, 2013, $120.3 million was used for the Great Plains acquisition and the purchase of SSP LLC. The increase in capital expenditures of $20.6 million from the first half of 2013 to the first half of 2014 was primarily due to investments in production capacity for Propel SSP and distribution terminals.
Net cash used in investing activities was $579.5 million in the year ended December 31, 2013. Investing activities in the year ended December 31, 2013 included $347.7 million for the acquisition of the FTSI assets, which significantly expanded our sand reserves and production capacity, $64.0 million for the Great Plains acquisition and $56.3 million (including capitalized transaction costs of $1.3 million) for the acquisition of SSP LLC. Capital expenditures for 2012 and 2013 were relatively unchanged at $109.0 million and $111.5 million, respectively. Maintenance capital spending was $12.3 million in 2012 and $17.5 million in 2013.
Capital investments in 2012 focused on expansion of our sand processing capacity and expansion of our terminal network. Spending in 2013 focused on accelerating the expansion of our terminal infrastructure and enhancing our unit train capabilities.
We anticipate that our capital expenditures in 2014 will be approximately $150 million, which is primarily associated with the continued development of self-suspending proppant production facilities, construction of distribution terminals, continued expansion of rail logistics, acquisition of mineral reserves and various maintenance projects. The increase in capital expenditures from 2013 to 2014 resulted primarily from increased spending on sand processing capacity, production capacity for Propel SSP and unit train capabilities. The anticipated capital expenditures for the year may increase as we continue to evaluate opportunities to expand our production capacities. We believe that cash flows from operations will be sufficient to fund our anticipated capital expenditures, but additional borrowings may be required to fund larger expansion opportunities.
Net Cash Provided by (Used in) Financing Activities
Financing activities consist primarily of borrowings and repayments under our term loans and revolving credit facility.
Net cash provided by financing activities was $5.3 million in the six months ended June 30, 2014 compared to $70.9 million in the six months ended June 30, 2013. Net cash provided by financing activities in the six months ended June 30, 2013 primarily relate to borrowings used to acquire Great Plains and purchase SSP LLC. In order to improve liquidity, we borrowed $41.0 million under our term loans in February 2014 to repay a similar amount outstanding under our revolving credit facility. We also made payments of approximately $2.3 million against capital lease obligations.
Net cash provided by financing activities was $410.5 million in the year ended December 31, 2013. This primarily relates to borrowings under our revolving credit facility to fund the acquisitions of Great Plains and the FTSI assets. The cash provided by financing activities is net of $14.2 million of financing costs.
53
Table of Contents
Net cash used in financing activities was $119.1 million in the year ended December 31, 2012, primarily related to prepayments of long term debt.
Credit Facilities
On September 5, 2013, we entered into the Second Amended and Restated Credit Agreement (our “Credit Agreement”) with Barclays Bank plc, as administrative agent. Our Credit Agreement contains a revolving credit facility with a commitment amount of $75 million (“Revolving Credit Facility”) and two tranches of term loans, pursuant to which we have borrowed $325 million in aggregate principal amount under the term B-1 facility (such loans, “Term B-1 Loans”) and $885 million in aggregate principal amount under a term B-2 facility (such loans, “Term B-2 Loans”). The proceeds of the borrowings under our Credit Agreement were used to repay amounts outstanding under the previous credit facility and to fund the acquisition of the proppant assets of FTSI.
The Term B-1 Loans mature on March 15, 2017 and requires quarterly principal repayments of $0.8 million (1% annually) with the balance due at maturity. The Term B-2 Loans mature on September 5, 2019 and requires quarterly principal repayments of $2.2 million (1% annually) with the balance due at maturity. Borrowings under the Revolving Credit Facility mature on September 5, 2018. Until they were repriced in March 2014, the Term B-1 Loans, the Term B-2 Loans and borrowings under the Revolving Credit Facility bore interest, at our discretion, at either the base rate (the greater of prime rate, federal funds rate (subject to a 1.0% flow) plus 0.5%, 2%, or one-month LIBOR plus 1.0%) plus 3.0% or the adjusted Eurodollar Rate (subject to a 1.0% floor) plus 4.0%. With respect to borrowings under the Term B-1 Loans and Revolving Credit Facility, the 2% minimum for Base Rate borrowings and 1% for Eurodollar Rate borrowings did not apply. The applicable margin on the loans could be reduced by 0.25% if our leverage ratio fell below 2.75.
The terms of our Credit Agreement provide for customary representations and warranties and affirmative covenants. The credit facility also contains customary negative covenants setting forth limitations on further indebtedness, liens, investments, disposition of assets, acquisitions, junior payments and restrictions on subsidiary distributions. We must maintain a pro forma leverage ratio as of the end of each quarter of no more than 4.75 if the aggregate revolver borrowing is equal to or greater than 25% of the total revolver commitment. As of June 30, 2014, our pro forma leverage ratio was 3.7.
In February 2014 we executed a joinder agreement to borrow $41 million in aggregate principal amount of additional Term B-2 Loans. The proceeds of this borrowing were used to repay then outstanding amounts under the Revolving Credit Facility. The additional borrowings mature on the same date as the then existing Term B-2 Loans (September 5, 2019) and the required quarterly principal repayments for the Term B-2 Loans were increased by one-quarter of 1% of the amount borrowed with the balance due at maturity. There were no other changes in the terms, interest rates or covenants of our Credit Agreement. In August 2014 we executed a joinder agreement to increase the revolving commitment amount by $46.6 million. There were no other changes in the terms, interest rates or covenants of our Credit Agreement.
In March 2014 we further amended our Credit Agreement to reduce the applicable margin for Term B-1 and B-2 Base Rate loans to 2.50% and for Term B-1 and B-2 Eurodollar Rate loans to 3.50%. As of June 30, 2014, Term B-1 Loans, Term B-2 Loans and the borrowings under Revolving Credit Facility bore interest at 3.75%, 4.5% and 4.25%, respectively.
Off-Balance Sheet Arrangements
We have no off-balance sheet arrangements that have or are likely to have a current or future material effect on our financial condition, changes in financial condition, revenues, expenses, results of operations, liquidity, capital expenditures or capital resources.
54
Table of Contents
Contractual Obligations
A summary of our contractual obligations as of December 31, 2013 is provided in the following table:
| Payments Due by Period | ||||||||||||||||||||
| (In thousands) | ||||||||||||||||||||
| Contractual Obligations |
Total | Less than 1 year |
1-3 years | 3-5 years | More than 5 years |
|||||||||||||||
| Long-term debt obligations (including interest and interest rate swaps)(1) |
$ | 1,595,490 | $ | 75,548 | $ | 152,897 | $ | 494,317 | $ | 872,728 | ||||||||||
| Capital lease obligations |
8,469 | 3,768 | 4,515 | 186 | — | |||||||||||||||
| Operating lease obligations |
6,159 | 1,560 | 2,397 | 1,147 | 1,055 | |||||||||||||||
| Retirement plans(2) |
8,107 | 595 | 1,364 | 1,578 | 4,570 | |||||||||||||||
| Asset retirement obligations |
2,680 | — | — | — | 2,680 | |||||||||||||||
|
|
|
|
|
|
|
|
|
|
|
|||||||||||
| Total contractual cash obligations |
$ | 1,620,905 | $ | 81,471 | $ | 161,173 | $ | 497,228 | $ | 881,033 | ||||||||||
| (1) | Payments are based on debt balances and interest rate swaps outstanding at December 31, 2013, and are based on the interest rates in effect as of that date. |
| (2) | Excludes plan assets. |
Environmental Matters
We are subject to various federal, state and local laws and regulations governing, among other things, hazardous materials, air and water emissions, environmental contamination and reclamation and the protection of the environment and natural resources. We have made, and expect to make in the future, expenditures to comply with such laws and regulations, but cannot predict the full amount of such future expenditures. We may also from time to time incur fines and penalties associated with noncompliance with such laws and regulations. As of December 31, 2013, we had $2.7 million accrued for future reclamation costs.
We discuss certain environmental matters relating to our various production and other facilities, certain regulatory requirements relating to human exposure to crystalline silica and our mining activity and how such matters may affect our business in the future under “Business—Regulation and Legislation.”
Critical Accounting Policies and Estimates
Our discussion and analysis of our financial condition and results of operations are based upon our consolidated financial statements, which have been prepared in accordance with accounting principles generally accepted in the United States of America (“GAAP”). The preparation of these financial statements requires us to make estimates and assumptions that affect the reported amounts of assets and liabilities and the disclosure of contingent assets and liabilities at the dates of the financial statements and the reported revenues and expenses during the reporting periods. We evaluate these estimates and assumptions on an ongoing basis and base our estimates on historical experience, current conditions and various other assumptions that are believed to be reasonable under the circumstances. The results of these estimates form the basis for making judgments about the carrying values of assets and liabilities as well as identifying and assessing the accounting treatment with respect to commitments and contingencies. Our actual results may materially differ from these estimates.
Listed below are the accounting policies we believe are critical to our financial statements due to the degree of uncertainty regarding the estimates or assumptions involved, and that we believe are critical to the understanding of our operations.
Inventory Valuation
Certain subsidiaries value sand inventory at the lower of cost or market using the last-in, first-out method. All other sand inventory is stated at the lower of cost or market using the first-in, first-out method. Costs applied
55
Table of Contents
to inventory include direct excavation costs, processing costs, overhead allocation, depreciation and depletion. Stockpile tonnages are calculated by measuring the number of tons added and removed from the stockpile. Tonnages are verified periodically by an independent surveyor. Costs are calculated on a per ton basis and are applied to the stockpiles based on the number of tons in the stockpile.
Depletion
We amortize the cost to acquire land and mineral rights using a units of production method, based on the total estimated reserves and tonnage extracted each period.
Asset Retirement Obligations
We estimate the future cost of dismantling, restoring and reclaiming operating excavation sites and related facilities in accordance with federal, state and local regulatory requirements. We record the initial estimated present value of reclamation costs as an asset retirement obligation and increase the carrying amount of the related asset by a corresponding amount. We allocate reclamation costs to expense over the life of the related assets and adjust the related liability for changes resulting from the passage of time and revisions to either the timing or amount of the original present value estimate. If the asset retirement obligation is settled for more or less than the carrying amount of the liability, a loss or gain will be recognized, respectively.
Impairment of Long-Lived Assets
We periodically evaluate whether current events or circumstances indicate that the carrying value of our property, plant and equipment and definite-lived intangible assets may not be recoverable. If circumstances indicate that the carrying value may not be recoverable, we estimate future undiscounted net cash flows using estimates of proven sand reserves, estimated future sales prices (considering historical and current prices, price trends and related factors) and operating costs and anticipated capital expenditures. If the undiscounted cash flows are less than the carrying value of the assets, we recognize an impairment loss equal to the amount by which the carrying value exceeds the fair value of the assets.
Our estimates of prices, recoverable proven reserves and operating and capital costs are subject to certain risks and uncertainties which may affect the recoverability of our long lived assets. Although we have made our best estimate of these factors based on current conditions, it is reasonably possible that changes could occur, which could adversely affect our estimate of the net cash flows expected to be generated from our operating property. No impairment charges were recorded during the years ended December 31, 2013 or 2012, or the six-month period ended June 30, 2014.
Employee Benefit Plans
We provide a range of benefits to our employees and retired employees, including pensions. We record annual amounts relating to these plans based on calculations specified by generally accepted accounting principles, which include various actuarial assumptions, including discount rates, assumed rates of returns, compensation increases, turnover rates and healthcare cost trend rates. We review the actuarial assumptions on an annual basis and make modifications to the assumptions based on current rates and trends when it is deemed appropriate to do so. The effect of the modifications is generally recorded or amortized over future periods. We believe that the assumptions utilized in recording our obligations under the plans, which are presented in note 16 to our audited consolidated financial statements included elsewhere in this prospectus, are reasonable based on advice from our actuaries and information as to assumptions used by other employers.
Equity-Based Awards
Equity-based compensation expense is recorded based upon the fair value of the award at grant date. Such costs are recognized as expense over the corresponding requisite service period. The fair value of the awards
56
Table of Contents
granted was calculated based on a Black-Scholes valuation model. The application of this valuation model involves inputs and assumptions that are judgmental and highly sensitive in the valuation of incentive awards, which affects compensation expense related to these awards. These inputs and assumptions include the value of a share of Fairmount Holdings, Inc. Class B common stock, the expected life of the option, volatility and risk free rate over a period of time corresponding to the expected life of the option.
Value of underlying share—We use a combination of the guideline company approach and a discounted cash flow analysis to determine the fair value of our stock. The key assumptions in this estimate include our projections of future cash flows, company-specific cost of capital used as a discount rate, lack of marketability discount, and qualitative factors to compare the company to comparable guideline companies. During 2013, factors that contributed to changes in the underlying value of our stock included the continued recovery of the oil and gas fracking market, changes to future cash flows projected from the recent acquisitions, increases in operating leverage due to increased debt, product mix including mix of raw versus resin coated proppant, and other factors. As our operations are highly dependent on sales to the oil and gas industry, the market conditions for this industry have a high degree of impact on the company’s value.
Expected volatility—This is a measure of the amount by which the price of various comparable companies’ common stock has fluctuated or is expected to fluctuate, as the company’s common stock is not publicly traded. The comparable companies were selected by analyzing public companies in the industry based on various factors including, but not limited to, company size, financial data availability, active trading volume, and capital structure.
Risk free interest rate—This is an interpolated rate from the U.S. constant maturity treasury rate for a term corresponding to the time to the expected option life, as described below.
Expected option life—This is the period of time over which the options are expected to remain outstanding before being exercised. Because we did not have sufficient historical data to provide a reasonable basis to estimate the expected life of the options, we used the simplified method, which assumes the expected life is the mid-point between the vesting date and the end of the contractual term.
Dividend yield—we have no current plans to declare a dividend that would require a dividend yield assumption other than zero.
We will continue to use judgment in evaluating the risk-free interest rate, expected volatility and expected lives related to our equity-based compensation on a prospective basis and incorporating these factors into our pricing model. However, once our shares are publicly traded, we will use the actual market price as an input in the Black Scholes model, and will no longer estimate the value of the shares underlying the options.
The following is a summary of the inputs and assumptions used in estimating the fair value of stock options granted in the years ended December 31, 2013 and 2012.
| Six Months Ended June 30, 2014 |
2013 | 2012 | ||||||||||
| Fair value of underlying share |
$ | 396.51 | $ | 355.40 – $379.05 | $ | 371.20 – $381.05 | ||||||
| Expected volatility |
41.36 | % | 46.38 | % | 49.66 | % | ||||||
| Risk free interest rate |
1.96 | % | 1.12 – 2.00 | % | 0.97 – 1.25 | % | ||||||
| Expected option life |
6.5 years | 6.5 years | 6.5 years | |||||||||
As of June 30, 2014 and December 31, 2013, the aggregate intrinsic value of vested and unvested stock options was $259.2 million and $136.1 million, respectively. The amount of unearned stock-based compensation related to unvested stock options at December 31, 2013 and June 30, 2014 was $16.0 million and $14.7 million, respectively. As of each of December 31, 2013 and June 30, 2014, the weighted-average period over which the unearned stock based compensation expense related to stock options is expected to be recognized was 2.4 years.
57
Table of Contents
Taxes
Deferred taxes are provided on the liability method whereby deferred tax assets are recognized for deductible temporary differences and operating loss and tax credit carryforwards and deferred tax liabilities are recognized for taxable temporary differences. This approach requires recognition of deferred tax liabilities and assets for the expected future tax consequences of events that have been included in the financial statements or tax returns. Under this method, deferred tax liabilities and assets are determined based upon the difference between the financial statement and tax basis of assets and liabilities using enacted tax rates in effect for the year in which the expenses are expected to reverse. Valuation allowances are provided if, based on the weight of available evidence, it is more likely than not that some or all of the deferred tax assets will not be realized.
We recognize a tax benefit associated with an uncertain tax position when, in our judgment, it is more likely than not that the position will be sustained upon examination by a taxing authority. For a tax position that meets the more-likely-than-not recognition threshold, we initially and subsequently measure the tax benefit as the largest amount that we judge to have a greater than 50% likelihood of being realized upon ultimate settlement with a taxing authority. The liability associated with unrecognized tax benefits is adjusted periodically due to changing circumstances, such as the progress of tax audits, case law developments and new or emerging legislation. Such adjustments are recognized entirely in the period in which they are identified. The effective tax rate includes the net impact of changes in the liability for unrecognized tax benefits and subsequent adjustments as considered appropriate by management.
We evaluate quarterly the realizability of our deferred tax assets by assessing the need for a valuation allowance and by adjusting the amount of such allowance, if necessary. The factors used to assess the likelihood of realization are our forecast of future taxable income and available tax planning strategies that could be implemented to realize the net deferred tax assets. Failure to achieve forecasted taxable income might affect the ultimate realization of the net deferred tax assets. Factors that may affect our ability to achieve sufficient forecasted taxable income include, but are not limited to, a decline in sales or margins, increased competition or loss of market share. In addition, we operate within multiple taxing jurisdictions and are subject to audit in these jurisdictions. These audits can involve complex issues, which may require an extended time to resolve. We believe that adequate provisions for income taxes have been made for all years.
The largest permanent item in computing both our effective tax rate and taxable income is the deduction allowed for U.S. statutory depletion. The impact of statutory depletion on the effective tax rate is presented in note 14 to our audited consolidated financial statements included elsewhere in this prospectus.
Recent Accounting Pronouncements
New accounting guidance that has been recently issued but not yet adopted by us, is included in note 1 to our unaudited condensed consolidated financial statements included elsewhere in this prospectus.
Quantitative and Qualitative Disclosures About Market Risk
Interest Rate Swaps
Due to our variable-rate indebtedness, we are exposed to fluctuations in interest rates. We use interest rate swaps to manage this exposure. These derivative instruments are recorded on the balance sheet at their fair values. Changes in the fair value of derivatives are recorded each period in current earnings or in other comprehensive income, depending on whether a derivative is designated as part of a hedging relationship and, if it is, depending on the type of hedging relationship. For cash flow hedges in which we are hedging the variability of cash flows related to a variable-rate liability, the effective portion of the gain or loss on the derivative instrument is reported in other comprehensive income in the periods during which earnings are impacted by the variability of the cash flows of the hedged item. The ineffective portion of all hedges is recognized in current period earnings.
58
Table of Contents
We do not use derivative financial instruments for trading or speculative purposes. By their nature, all such instruments involve risk, including the possibility that a loss may occur from the failure of another party to perform according to the terms of a contract (credit risk) or the possibility that future changes in market price may make a financial instrument less valuable or more onerous (market risk). As is customary for these types of instruments, we do not require collateral or other security from other parties to these instruments. In management’s opinion, there is no significant risk of loss in the event of nonperformance of the counterparties to these financial instruments.
We formally designate and document instruments at inception that qualify for hedge accounting of underlying exposures in accordance with GAAP. We assess, both at inception and for each reporting period, whether the financial instruments used in hedging transactions are effective in offsetting changes in cash flows of the related underlying exposure.
The following is a summary of our outstanding derivative financial instruments:
| (In thousands) | ||||||||||||||||||||||||||||
| December 31, 2012 | December 31, 2013 | |||||||||||||||||||||||||||
| Maturity Date |
Contract
/ Notional Amount |
Carrying Amount |
Fair Value |
Contract/ Notional Amount |
Carrying Amount |
Fair Value |
||||||||||||||||||||||
| Interest rate swap agreements |
2013 | $ | 20,000 | $ | (33 | ) | $ | (33 | ) | $ | — | $ | — | $ | — | |||||||||||||
| Interest rate swap agreements |
2014 | 55,000 | (295 | ) | (295 | ) | $ | 55,000 | (59 | ) | (59 | ) | ||||||||||||||||
| Interest rate swap agreements |
2015 | 340,000 | (4,981 | ) | (4,981 | ) | $ | 340,000 | (3,280 | ) | (3,280 | ) | ||||||||||||||||
| Interest rate swap agreements |
2017 | 70,000 | (3,429 | ) | (3,429 | ) | $ | 165,550 | (1,659 | ) | (1,659 | ) | ||||||||||||||||
| Interest rate swap agreements |
2019 | — | — | — | (a) | 2,067 | 2,067 | |||||||||||||||||||||
| (a) | The interest rate swap agreements that mature in 2019 currently do not provide an offset to cash flows. In 2015 these agreements will have a notional value of $275 million increasing to $420 million between 2017 and 2019. |
A hypothetical increase in interest rates by 1.0% would have increased our interest expense by $2.9 million for the year ended December 31, 2013.
Market Risk
We are exposed to various market risks, including changes in interest rates. Market risk related to interest rates is the potential loss arising from adverse changes in interest rates. We do not believe that inflation has a material impact on our financial position or results of operations during periods covered by the financial statements included in this prospectus.
Credit Risk
We are subject to risks of loss resulting from nonpayment or nonperformance by our customers. For the year ended December 31, 2013, our top two proppant customers, Halliburton and FTSI, accounted for approximately 30% of our sales. Approximately 39% and 38% of our accounts receivable balance at December 31, 2013 and 2012, respectively, was outstanding from just three customers. We examine the creditworthiness of third-party customers to whom we extend credit and manage our exposure to credit risk through credit analysis, credit approval, credit limits and monitoring procedures, and for certain transactions, we may request letters of credit, prepayments or guarantees, although collateral is generally not required.
Internal Control Over Financial Reporting
If we fail to maintain effective internal controls in the future, it could result in a material misstatement of our financial statements that would not be prevented or detected on a timely basis, which could cause investors to lose confidence in our financial information or cause our stock price to decline.
59
Table of Contents
Overview
The silica sand industry consists of businesses that are involved in the mining, processing and sale of silica sand and silica sand-based products. Monocrystalline silica, also referred to as “silica,” “industrial sand and gravel,” “silica sand” and “quartz sand,” is a term applied to sands and gravels containing a high percentage of silica (also known as silicon dioxide or SiO2) in the form of quartz. Monocrystalline silica deposits with widely varying physical characteristics occur throughout the United States, but mines and processing facilities are typically located near developed rail infrastructure, which facilitates access to markets. Other factors affecting the feasibility of monocrystalline silica production include deposit composition, product quality specifications, land-use, environmental regulation, permitting requirements, access to electricity, gas and water and a producer’s expertise and know-how.
The low relative cost and special properties of monocrystalline silica—chemistry, purity, grain size, color, inertness, hardness and resistance to high temperatures—make it critical to a variety of industries and end-use markets, the production of molds and cores for metal castings, glass production and the manufacturing of building products. In particular, monocrystalline silica is a key input in the hydraulic fracturing techniques used in the development of oil and gas resource basins.
Oil and Gas Proppant End Market Dynamics
Advances in oil and gas extraction techniques, such as horizontal drilling and hydraulic fracturing, have allowed for significantly greater extraction of oil and gas trapped within shale formations. The hydraulic fracturing process consists of pumping fluids down a well at pressures sufficient to create fractures in the targeted hydrocarbon-bearing rock formation in order to increase the flow rate of hydrocarbons from the well. A granular material, called proppant, is suspended and transported in the fluid and fills the fracture, “propping” it open once high-pressure pumping stops. The proppant-filled fracture creates a conductive channel through which the hydrocarbons can flow more freely from the formation into the wellbore and then to the surface. Proppants therefore perform the vital function of promoting the flow, or conductivity, of hydrocarbons over a well’s productive life. In fracturing a well, operators select a proppant that is transportable into the fracture, is compatible with frac and wellbore fluids, permits acceptable cleanup of frac fluids and can resist proppant flowback. In addition, the proppant must be resistant to crushing under the earth’s closure stress and reservoir temperature.
60
Table of Contents
There are three primary types of proppant that are utilized in the hydraulic fracturing process: raw frac sand, resin coated sand and manufactured ceramic beads. Current in-basin delivered prices for proppant range between $80 to $120 per ton for raw frac sand, $350 to $550 per ton for resin coated sand and $500 to $900 per ton for ceramics. Customers choose among these proppant types based on the geology of the reservoir, expected well pressures, proppant flowback concerns and product cost. Given these price differences and well specific considerations, E&P companies are continually evaluating the optimal mix of lower cost, lower conductivity frac sand and higher cost, higher conductivity resin coated sand and ceramics in order to best address the geology of the well and to maximize well productivity and economic returns. The following chart illustrates the composition of the U.S. market for proppant by type:
2013 Proppant Demand by Type (volumes in millions of tons)
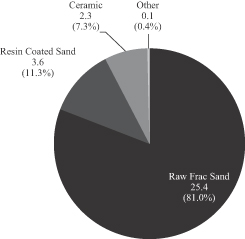
Source: The Freedonia Group, study #3160 Well Stimulation Materials, June 2014.
Proppant Characteristics
API specification proppants must meet stringent technical specifications set forth by the API including, among others, coarseness, crush resistance, sphericity, roundness, acid solubility, purity and turbidity. These characteristics are of particular importance because they have a significant impact on hydrocarbon conductivity, and ultimately the production rate and profitability of a well. Conductivity is a function of the permeability of the proppant and the width of the fracture, which dictates the proppant’s ability to prop open a fracture and allow hydrocarbons to flow. Some of the key characteristics impacting conductivity are:
Coarseness. Proppant grain size is critical to hydraulic fracturing operations in order to satisfy down-hole conditions and well completion design. Mesh size is used to describe proppant grain size and is determined by sieving the proppant through screens with uniform openings corresponding to the desired grain size. The vast majority of products range from 12 to 100 mesh (representing the number of openings per linear inch on a sizing screen) and include standard sizes, such as 12/20, 16/30, 20/40, 30/50 and 40/70. To receive a standard size designation, 90% of a particular batch of product must fall within the designated sieve sizes. For example, for a proppant to be designated as 12/20 mesh, 90% of that proppant must pass through a 12 mesh sieve and be retained by a 20 mesh sieve. Larger, coarser proppants (such as 16/30, 20/40 and 30/50 mesh) are typically used in hydraulic fracturing processes targeting oil and liquids-rich natural gas recovery, while smaller, finer proppants (such as 40/70 and higher mesh) are used primarily in dry gas drilling applications. In general, notwithstanding strength characteristics, a larger and more uniformly distributed proppant size will result in higher permeability and conductivity.
Crush Resistance. Crush resistance is an important factor in fracturing applications where downhole pressures intensify. Proppant crush results in finer particles, or “fines,” which reduce permeability in the
61
Table of Contents
proppant pack and narrow the fracture width, all leading to reduced conductivity. Technical research suggests that the crushing of just five percent of the frac sand in a fracture can reduce hydrocarbon flow conductivity by 60%. Generally, the more pure the grain and the smaller its size, the better the proppant’s crush resistance. Ideally, raw frac sand proppants should be nearly pure quartz, spherical, round and have a resistance to crush sufficient to withstand the closure stress of lower to intermediate-pressure wells. Resin coated sand proppants have a higher resistance to crush and are suitable for intermediate to high closure stress of up to 10,000 psi (12,000 psi in the case of PowerProp), and high strength ceramics have the greatest resistance to crush and are suitable for intermediate to the highest closure stresses of up to 15,000 psi.
Proppant Shape and Uniformity. Proppant shape influences proppant pack space, permeability and conductivity. For optimal long-term conductivity, the proppant particles should have an optimized spherical shape and roundness (roundness is a measure of the relative sharpness of corners and curvatures), as well as uniform size and shape distribution.
Low Acid Solubility. Proppant acid solubility is an indication of the amount of soluble materials (i.e., carbonates, feldspars, iron oxides and clays) present in the proppant which can potentially react with acid. There are various frac related applications wherein the proppant may come into contact with acid. Therefore, proppant stability in acidic environments can be an important attribute.
Purity. Purity is a measure of the content of monocrystalline silica within each grain of silica sand. The greater the monocrystalline silica composition in a grain of silica sand, the stronger the grain and the lower instances of chemical reactions.
Turbidity. Turbidity is a measure of the level of particles or fines in the proppant, such as silt and clay. High turbidity can be an indication of poor proppant manufacturing, transportation or handling practices, or inherent geological characteristics of the ultimate sand reserves. High-turbidity proppants can interfere with fractures, negatively impacting conductivity.
Proppant Types
Comparison of Key Proppant Characteristics
The following table sets forth what we believe to be the key comparative characteristics of our products and the three primary types of proppant.
| Raw Frac Sand |
Resin Coated Sand |
Ceramics | ||||
| Product and Characteristics |
• Natural resource • Primary types include Northern White, Brown • Quality of sand varies widely depending on source |
• Raw frac sand substrate with resin coating • Coating increases crush resistance • Bond together to prevent proppant flowback |
• Manufactured product • Typically highest crush resistance | |||
| Relative Crush Resistance(1) |
Up to 6,000 psi |
Up to 10,000 psi |
Up to 15,000 psi | |||
| Fairmount Santrol Products(2) |
Yes |
Yes |
No(2) | |||
| 2013 Total Proppant Market by Volume(3) |
25.4 |
3.6 |
2.3 | |||
| Current Delivered In-Basin Pricing Per Ton |
$80-$120 |
$350-$550 |
$500-$900 | |||
| (1) | Crush resistance within a product category will vary by differing proppant characteristics including, size, roundness, purity, type of coating, etc. For purposes of relative comparability, we are showing recommended well pressures for |
62
Table of Contents
| 20/40 Northern White raw frac sand, 20/40 THS and OptiProp (two of Fairmount Santrol’s resin coated sand products), and 20/40 high strength ceramics. |
| (2) | Fairmount Santrol’s PowerProp product competes with lightweight ceramics offered by competitors up to 12,000 psi. |
| (3) | Source: The Freedonia Group: presented in million tons; total proppant market size of 31.3 million tons (excludes 0.1 million tons classified as “other”). |
Raw Frac Sand
Of the three primary types of proppant, raw frac sand represents the lowest cost and largest volume of proppant supplied to oilfield service providers and E&P companies. Raw frac sand is ideally suited for wells with relatively lower levels of closure pressure. Generally, raw frac sand is produced and sold in whole grain (unground) form. There are two broad types of API spec raw frac sand: Northern White and brown, both of which are produced by Fairmount Santrol.
Northern White frac sand is considered to be the highest quality raw frac sand available and is known for its high crush resistance, roundness and sphericity and monocrystalline grain structure. Northern White frac sand exists predominantly in the upper Midwest region of the United States (including Wisconsin, Illinois and Minnesota). Fairmount Santrol’s Northern White sand is a spherical monocrystalline that is 99.8%+ pure-quartz and has superior conductivity and crush resistance compared to other types of raw frac sand.
Brown sand is less monocrystalline in nature and more angular than Northern White sand. Brown sand consists of both API and non API-spec material. API-spec brown sand, such as Fairmount Santrol’s Texas Gold sand, is mined from the Hickory Formation near Brady, Texas. Brown sand typically has lower crush resistance than Northern White, but is often sufficient for lower pressure wells. Due to its proximity to the well, Fairmount’s Texas Gold has a meaningful delivered cost advantage into key basins in South and West Texas, including the Eagle Ford Shale and the Permian Basin.
Resin Coated Sand
Resin coated frac sand consists of raw frac sand that is coated with a resin that increases the sand’s crush resistance and reduces the likelihood of crushed sand dispersing throughout the fracture. Resin coated sand withstands significant reservoir pressures and results in higher conductivity than raw frac sand. Consequently, resin coated sand is ideally suited for wells with intermediate to high levels of closure stress, or for wells where reducing proppant flowback is a key consideration. By reducing proppant flowback, resin coated sand reduces the potential downtime and cost of a well as well as increasing long term productivity of the well.
The strength and shape of resin coated product is largely influenced by the material science underlying the resin coating and the process technology in how the resins are applied. Tempered (or precured) resin coated sand primarily enhances crush resistance, thermal stability and chemical resistance, allowing the sand to perform under harsh downhole conditions, including withstanding medium to high closure pressures of up to 10,000 psi (12,000 psi in the case of PowerProp) and encapsulating fines which are inherently created downhole. In addition to the value-added characteristics of tempered resin coated proppant, curable (or bonding) resin coated frac sand uses a resin that is designed to bond together under closure stress and high temperatures, preventing proppant flowback and reducing imbedment.
Manufactured Ceramic Proppant
Manufactured ceramic proppant is a product of comparatively consistent size and spherical shape that typically offers the highest crush resistance relative to other types of proppants. As a result, ceramic proppant is most often used in the medium to highest pressure (up to 15,000 psi in the case of high strength ceramics) and temperature drilling environments. Ceramic proppant derives its product strength from the molecular structure of its underlying raw material and is designed to withstand extreme heat, depth and pressure environments. The deepest, highest temperature and highest pressure wells typically require heavy weight ceramics with high alumina/bauxite content and coarser mesh sizes. The lower crush resistant ceramic proppants are lighter weight and derived from kaolin clay, with densities closer to raw frac sand.
63
Table of Contents
Proppant Selection
The selection of proppant to maximize hydrocarbon productivity in a well involves a multi-variant optimization decision, driven by drilling factors and challenges, which include hydrocarbon type, geologic attributes, well depth and lateral lengths, heat, and pressure, among others. As fracture lengths and pressures increase, fracturing challenges multiply. Well engineers today are rapidly accelerating their ability to utilize mixes of proppant in order to address the challenges, while also balancing the tradeoff of cost.
| Challenges |
Proppant Selection Considerations | |
| Ability to Resist Pressure |
• Stronger, proppants such as resin coated sand and ceramics are less likely to crush under higher pressures in each case, providing better conductivity | |
| Optimizing Size and Shape |
• Larger proppant grains typically offer greater conductivity, as does sphericity, roundness and uniformity of size
• Smaller, lighter grains typically can be carried deeper into the formation, enhancing the overall surface area of the fracture | |
| Minimizing Flowback |
• Resin coating provides a seal to the proppant pack, reducing flowback | |
| Minimizing Proppant Fines |
• Proppant fines, and their resulting migration in the fractures, contribute to reduced permeability and well performance
• Resin coated proppants, and particularly curable resin coated proppants, generate more uniform stress distribution throughout the pack and are less likely to create fines
• Resin coating also encapsulates fines that are generated under pressure | |
| Maintaining Width of Fracture |
• Under closure stress, proppant grains and particularly ceramic proppant grains embed into the surrounding rock, especially in soft shale formations | |
|
• This embedment reduces the width of the fracture and the overall surface area of the fracture, as well as reduces the permeability of the proppant pack
• Resin coating reduces proppant embedment by providing a broader point of contact between the proppant and the reservoir as well as proppant to proppant contact | ||
| Minimizing Chemical Reactions |
• Proppant diagenesis occurs as the proppant, under heat and pressure, reacts with the fracturing fluids and/or formation face to degrade the proppant
• Improved coating technologies and sand with a high monocrystalline silica composition experience lower diagenesis | |
| Reduced Proppant Scaling |
• Minerals from the water and the formation can attach to the surface of the proppant grains, forming deposits (“scaling”) and reducing proppant pack permeability
• Resin coating improves resistance to scaling | |
64
Table of Contents
Proppant Industry-Demand Trends
The following trends have favorably influenced proppant demand growth.
Increasing drilling activity and wells per rig
Over the past decade, E&P companies have increasingly focused on exploiting the vast hydrocarbon reserves contained in North America’s oil and gas reservoirs. While the well counts have remained relatively stable, drilling activity and the number of wells per rig has increased dramatically through the increased use of pad drilling. With the establishment of advanced techniques such as horizontal drilling and hydraulic fracturing, E&P companies initially focused on establishing and delineating their large acreage positions. Using these advanced techniques, their development plans were largely driven by a desire to grow production quickly, but were not yet optimized for maximum efficiency and economic returns.
Increasing proppant intensity
In recent years, with their acreage positions largely established, E&P companies have evolved their capital plans to focus on full-scale, long term development, with the underlying goals of increased efficiencies and optimizing their returns on invested capital. This has led to new development techniques, such as longer lateral lengths and shorter intervals between frac stages, which results in more fracturing stages per well. In addition, the amount of proppant used per stage has increased dramatically, compounding the increase in total demand for proppant.
In recent months, individual wells have been completed with more than 6,000 tons of proppant, which is the equivalent of 60 railcars or 240 truckloads. This represents a several fold increase in large scale completions from just a few years ago. Given all of the factors above, we believe that demand for proppant will continue to grow.
Opportunity for more resin coated proppant use to improve well economics
In addition to evolving well construction techniques, E&P companies are increasingly focused on proppant selection as a means to improve recovery rates and return on investment. Optimized proppant selection can enable them to increase fracture surface areas and contact with the reservoir, while improving the permeability and porosity of the proppant pack, both of which provide improved well recoveries.
Specifications for proppant type and quantity can be made by E&P companies, oilfield service companies, or collaboratively. These specifications often call for increasing amounts of proppant per well, but also the incorporation of a broader selection of proppant types, a wider range of mesh sizes, and a selection of high performance proppants to tailor the proppant solution to specific geologic characteristics of the well. Furthermore, both E&P companies and oilfield service companies are investing in value-added proppants when the improvement in well production and efficiencies justifies the increased proppant investment. These recent trends are resulting in increased demand for resin coated proppants which provide enhanced performance characteristics relative to raw sand but at a lower cost than ceramic proppants.
As a result of the trends described above, the global proppant market has increased rapidly over the past 10 years, with the U.S. being the single largest consumer of proppants. The Freedonia Group estimates that in 2013 the U.S. sand proppant market was approximately 31.4 million tons with annual sales of $3.3 billion. This represented an average annual volume growth rate of 27% from 2008 to 2013. The Freedonia Group also estimates that total annual proppant sales will exceed 49 million tons in 2018 and 74 million tons by 2023, representing average annual growth rates of 9.4% and 9.0% over 2013 volumes, respectively. Raw frac sand and resin coated sand are expected to drive a growth in overall proppant demand with annual growth rates from 2013 to 2018 of 9.3% and 10.5%, respectively.
65
Table of Contents
The Freedonia Group Estimates of Proppant Demand by Type
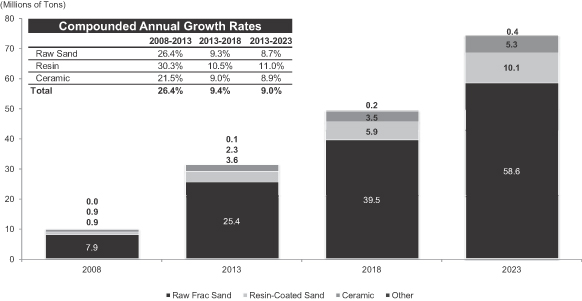
Source: The Freedonia Group, study #3160 Well Stimulation Materials, June 2014
PropTester, Inc. & KELRIK, LLC, market research firms specializing in the proppant sector, estimate 2013 market supply (based on capacity) of raw frac sand and resin coated sand as reflected in the charts. As indicated, based on their relative share of capacity, the six largest frac sand suppliers represent approximately 50% of supply capacity and the six largest resin coated sand suppliers represent over 80% of supply capacity.
PropTester, Inc. & KELRIK, LLC Estimated Market Share Based on Capacity
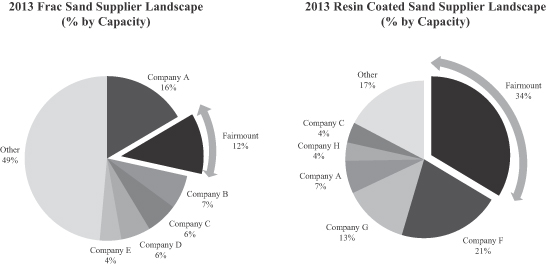
Source: PropTester, Inc. & KELRIK, LLC, Proppant Market Report, February 14, 2014
66
Table of Contents
Proppant Industry – Supply Trends
As demand for proppants has increased dramatically in recent years, the supply of quality API-spec raw frac sand has struggled to keep pace, resulting, at times, in a market with limited, if any, excess capacity. While a number of existing and new proppant vendors have announced supply expansions and greenfield projects, we do not expect the magnitude of these supply expansions to fully meet the expected growth in demand. There are numerous key constraints to increasing raw frac sand production on an industry-wide basis, including:
| • | the difficulty of finding frac sand deposits that meet API specifications; |
| • | the difficulty of securing contiguous frac sand reserves large enough to justify the capital investment required to develop a processing facility; |
| • | the challenges of identifying reserves with the above characteristics that are either located in close proximity to oil and gas reservoirs or have rail access needed for low-cost transportation to major shale basins; |
| • | the hurdles of securing mining, production, water, air, refuse and other federal, state and local operating permits from the proper authorities; |
| • | local opposition to the development of mining facilities, especially those that require the use of on-road transportation, including moratoria on raw frac sand facilities in multiple counties in Wisconsin and Minnesota which hold potential sand reserves; and |
| • | proximity to logistics infrastructure and the ability to develop comprehensive logistics capabilities. |
Proppant Industry – Logistics Trends
E&P companies’ and oilfield service providers’ preferences and expectations have been evolving in recent years. A proppant vendor’s logistics capabilities have become an important differentiating factor when competing for business, on both a spot and contract basis. Many of our customers increasingly seek convenient in-basin proppant delivery capability from their proppant supplier. We believe that, over time, proppant customers will prefer to consolidate their purchases across a smaller group of suppliers with robust logistics capabilities and a broad offering of high performance proppants.
I&R Industry Trends
Demand in the I&R end markets is relatively stable and is primarily influenced by key macroeconomic drivers such as housing starts, light vehicle sales, repair and remodel activity and industrial production. The economic downturn beginning in 2008 decreased demand in the foundry, building products and glassmaking end markets, however, the recent economic recovery has significantly increased demand in these same end markets. The primary end markets served by our I&R Products segment are foundry, building products, sports and recreation, glassmaking and filtration.
67
Table of Contents
Our Company
We are one of the world’s largest providers of sand-based proppant solutions and for over 30 years have been a pioneer in the development of high performance proppants used by oilfield service and E&P companies to enhance the productivity of their oil and gas wells. Fairmount Santrol offers the broadest range of proppants available in the market today, including high quality sand and a spectrum of resin coated products, all of which exceed API specifications. Additionally, for more than 120 years, we and our predecessor companies have provided high quality sand-based products, strong technical leadership and applications knowledge to end users in the I&R markets. We believe our two primary market segments are complementary. Our ability to sell to a wide range of customers across multiple end markets allows us to maximize the economic recovery of our reserve base.
As one of the nation’s longest continuously operating mining organizations, we have developed a strong commitment to environmental stewardship and to the three pillars of Sustainable Development: People, Planet and Prosperity. Our strong commitment to safety is reflected in the health and safety of our employees and is illustrated by having achieved a lost-time incident rate that is less than half the industry average. From 2011 through June 30, 2004, our employees have demonstrated our commitment to our communities by donating approximately 36,000 hours of company-paid volunteer time, as well as significant personal volunteer time, into the communities in which we live and operate. We are focused on environmental stewardship, and ten of our facilities now generate zero waste to landfills. Additionally, we have successfully executed annual initiatives to reduce our carbon emissions and have planted over 225,000 trees since 2011 in order to offset our Tier I and Tier II carbon emissions. We believe adhering to sustainable development principles is not only the right thing to do, but also results in a higher level of engagement and commitment from our employees, better relationships with our communities and, as a result, a stronger base from which to pursue profitable growth over the long-term. Abiding by these guiding principles, our corporate motto is “Do Good. Do Well.”
We began investing in large scale proppant production capacity in the early 1980s, leveraging our early industry relationships with Halliburton and a predecessor company to Baker Hughes. Since then, our business, and particularly our Proppant Solutions segment, has grown significantly. Today we have vertically integrated operations that combine mining, sand processing, and resin manufacturing and coating operations with a broad logistics network and state-of-the-art research and development capabilities. Our ability to leverage our integrated asset base to provide comprehensive proppant solutions has allowed us to become a long-term, trusted partner to our customers.
Our primary attributes include:
| • | Sand Reserves and Processing Assets. We have one of the largest sand reserves and processing asset bases in the industry, including, as of December 31, 2013, 798.2 million tons of proven mineral reserves, 11 active sand processing facilities with 12.3 million tons of annual sand processing capacity, a resin manufacturing facility and 11 coating facilities with 2.4 million tons of annual coating capacity. From 2009 to 2013, we expanded our annual raw frac sand and coating capacities by approximately 6.0 million and 1.5 million tons, respectively, through a combination of organic growth and acquisitions. Our coating facilities include operations in Mexico, Denmark and China, through which we serve international oil and gas markets. |
| • | Product Delivery. We are capable of Class I railroad deliveries to each of North America’s major oil and gas producing basins and we also have the flexibility to ship our product via barge and trucks to reach our customers in certain basins. We operate an integrated logistics platform consisting of 46 proppant distribution terminals with significant associated storage, 32 of which exclusively handle our products. Since 2011, we have developed or acquired 24 distribution terminals, providing significant additional annual transloading capacity. We also service I&R end markets through seven additional terminals. As of August 15, 2014, we currently have a private fleet of over 8,500 railcars and expect this fleet to grow to |
68
Table of Contents
| over 13,000 through 2016. By the end of the third quarter of 2014, we also expect to have expanded our unit train capabilities to three production facilities and three in-basin terminals, which we expect to reduce freight costs and improve cycle times for our railcar fleet. |
| • | Customers. We currently have approximately 80 proppant customers, including the largest U.S. pressure pumping companies, and a total of nearly 850 customers across all end markets. Our goal is to create long-term, partnering relationships with our customers. We sell product on a purchase order basis and through supply agreements. The majority of our proppant supply agreements have market-based pricing and volumetric provisions based on our customer’s requirements, which we believe has strengthened our customer relationships over multiple market cycles. |
| • | Innovation. We have an established history of proppant innovation and we continue to make substantial investments in engineering, research and development and technical marketing. We pioneered the manufacturing and use of resin coated proppant and continue to introduce new and innovative products. For example, PowerProp, our coated product with the greatest crush resistance has characteristics competitive with lightweight ceramics. We are currently field testing a brand new technology, Propel SSP. This proppant transport technology is a new proppant category in which a polymer, wrapped around sand or ceramic, swells upon contact with water. The shear-stable polymer suspends the proppant in water, transporting each grain farther and higher into fractures. Polymer breaking occurs with conventional chemistry. This better transport expands the hydrocarbon drainage radius with a maximized propped fracture area to increase ultimate recovery. |
We are experiencing high demand for our products and our business is currently experiencing significant growth. Our revenues have grown at a compound annual growth rate of approximately 19% and 25% since 2004 and 2009, respectively. Since 2011, our revenues have grown at a rate of 4% as the market for resin-coated products softened. We have seen considerable strengthening in both the raw and resin-coated markets in 2014, and our revenues for the first six months of this year are up by 40% compared to the same period last year (please see “Results of Operations” beginning on page 47 for further discussion of factors impacting our revenue growth).
For the year ended December 31, 2013, we sold over 7.5 million tons, generated $988 million in revenues, $293 million of Adjusted EBITDA and $105 million of net income. We cannot provide any assurance that we will achieve these growth rates or margins in the future. For a definition of “Adjusted EBITDA” and a reconciliation of Adjusted EBITDA to its most directly comparable financial measures calculated and presented in accordance with generally accepted accounting principles (“GAAP”), please read “—Prospectus Summary—Summary Historical Consolidated Financial and Operating Data—Non-GAAP Financial Measures” beginning on page 10.
Our Competitive Strengths
We believe that we are well positioned to execute our strategy based on the following competitive strengths:
A Leading Proppant Producer; Broadest Product Suite. We have a broad suite of products that address more than 90% of the proppant market. We are one of the largest producers of API spec raw frac sand and according to PacWest Consulting Partners, we were the second largest supplier of raw frac sand, and the largest supplier of resin coated sand in 2013 based on our production capacity and coating capacity, respectively. Our raw sand product suite includes all mesh sizes of high performing API-spec Northern White frac sand and our branded API-spec Texas Gold brown frac sand, which enjoys a delivered cost advantage to certain basins, including the Eagle Ford shale and Permian Basin. Our portfolio of resin coated products provides a range of strength, flowback and conductivity characteristics. Our product breadth allows us to offer a comprehensive proppant solution across a broad range of well characteristics and our scale provides us with the flexibility to fill large individual orders, often on short notice. As proppant consumption per well has increased, and completion solutions are increasingly tailored, we believe that our scale and product breadth provide us with a competitive advantage.
Industry’s Largest Captive Terminal Footprint and Broadest Logistics Capabilities. In recent years, oilfield service companies have increasingly sought proppant suppliers with logistics capabilities to deliver
69
Table of Contents
product in-basin. We sell our proppants directly to customers in North America’s major oil and gas producing basins through our 46 proppant distribution terminals, the largest logistics network in the industry. In 2013, approximately 80% of our proppant volume was sold in-basin at one of our distribution terminals, compared to approximately 65% in 2012. We ship our products via all of North America’s Class I railroads in our fleet of more than 8,500 railcars as of August 15, 2014, which includes approximately 790 railcars made available to us by our customers. By the third quarter of 2014, we expect to have expanded our unit train capabilities to three of our processing facilities and three of our in-basin terminals. We expect these unit train capabilities will reduce our freight costs and improve cycle times for our railcar fleet. We also have the flexibility to ship our product via barge and truck to multiple basins. Importantly, over 70% of our terminal capacity exclusively handles our products. Taken together, we believe the significant scale our distribution network, its geographic scope, and our captive terminal strategy provide us with a competitive advantage.
Focus on Innovation and New Product Development. We have a history of collaborating with our customers to develop innovative solutions to enhance the effectiveness of well completions, from conventional wells to the most complex, multi-stage, horizontal wells. Our vertically integrated model allows us to participate in each phase of proppant development, manufacturing and delivery and provides us a unique perspective into the current and future needs of our customers. Our technical sales team works closely with market participants to demonstrate the value proposition of our performance proppants in order to stimulate market demand. In 1976, our predecessor pioneered the development of resin coated proppants and we have been issued numerous related patents. Our product developments include OptiProp, SLC, THS, PowerProp and CoolSet, each with uniquely tailored down-hole performance characteristics. After acquiring the technology that underlies Propel SSP in May 2013, our team worked to further refine the product’s technology and manufacturing techniques. We have successfully produced and shipped Propel SSP product in commercial quantities to several key customers who are currently testing the product in field trials.
Trusted Partner to Our Customers. We are a trusted partner and have significant long-term relationships with each of the four largest U.S. pressure pumping companies, who together represent approximately 65% of the market, as well as many small and mid-sized oilfield service companies. These customer relationships are driven by our ability to enhance our customers’ operations and profitability by delivering a full suite of high-quality proppant products, where, when and as-needed. These benefits also extend to the E&P companies serviced by our service company customers, who directly benefit from the enhanced well productivity that our products offer. We believe our customers value the ability of our substantial scale, product diversity and extensive logistics network to meet their evolving proppant needs.
Efficient Operations and Economies of Scale Support Strong Cash Flow Generation. Our vertically integrated operations, low production costs and low maintenance capital expenditures have enabled us to be profitable and generate positive cash flows over an extended period. We own a substantial majority of our reserves, and our processing plants are located on or in close proximity to rail access, reducing the need for on-road transportation and minimizing product movement costs. Our integrated logistics management expertise and geographically advantaged facility network enables us to reliably ship products by the most cost-effective method available. We believe our significant and growing cash flow will enable us to continue to invest in additional sand production, processing, coating and terminal facilities as well as research and development for new products.
Experienced Management Team Aligned with Stockholders. We have an experienced leadership team with extensive industry knowledge and a proven track record of profitable growth. Our executive management team has developed new product offerings and process technologies, and has grown our business through greenfield mine development, capacity expansions, acquisitions and investments in logistics infrastructure. Most of our executive management team has been at Fairmount Santrol for 20 years or more, and as of December 31, 2013 our revenue had grown at a compound annual growth rate of approximately 14% and 25% since 1994 and 2009, respectively. Our founders remain active advisors to our management and are members of our board of directors.
70
Table of Contents
Pro forma for this offering, our management, employees and founders will own approximately % of our outstanding common stock. Accordingly, our executive management team and our employees are aligned with our investors and highly incentivized to pursue long-term, profitable growth and a high return on capital deployed.
Our Strategy
Our objective is to create long-term and sustainable value for our stakeholders. We intend to pursue this objective through the execution of the following strategies:
Increase Reserves and Processing Capacity. We have historically grown our reserves and mining and processing capacities by developing greenfield sites, expanding existing facilities and acquiring operating assets and reserves. From 2009 to 2013, we expanded our annual raw frac sand capacity by approximately 6.0 million tons and our annual coating capacity by 1.3 million tons. Currently, we believe our customers’ demand for our products exceeds our production capacity. Accordingly, we expect to continue to invest in production capacity and new reserves. In 2013, we acquired an idled 1.0 million ton per year frac sand processing facility in Brewer, Missouri from FTSI and expect to resume operations at this facility within the next six months. We also expect to increase annual frac sand production capacity at a current facility by 1.5 million tons by the end of the first quarter of 2016. In addition to these expansions, we control, or have an option to control, additional reserves on four properties (three with Northern White reserves, one with Texas Gold) and expect to develop one or two frac sand facilities or these greenfield sites by mid-2016. In order to ensure that we have adequate capacities and reserves to meet future demand, we have an active pipeline of expansion opportunities in varying stages of development. We currently have 2.4 million tons of annual coating capacity and are in the process of expanding these capacities by an additional 0.8 million tons per year by the fourth quarter of 2015. We will continue to evaluate the opportunity to expand coating capacity based on market demand for coated products.
Expand Logistics Capabilities. Since 2011, we have developed or acquired 24 distribution terminals, providing 13.1 million tons of additional annual transloading capacity. We will continue to invest in terminals, storage and rail infrastructure as our customers continue to demand more product delivered closer to producing basins. We will also continue to enhance our unit train capabilities to reduce freight costs and improve cycle times for our railcar fleet. Since 2009, we have increased our railcar fleet by approximately 140% and we expect to increase the size of our railcar fleet by over 35% through the second half of 2015 to accommodate our growing asset base and evolving customer demands.
Increase Market Penetration of Our Resin Coated Proppants. We believe that resin coated proppants offer compelling performance advantages relative to other proppants. Our field data indicates that high quality resin coated proppants enhance oil and gas reservoir conductivity compared to raw sand and are a cost-effective alternative to lightweight ceramic proppants. Field data also indicate that resin coated proppants reduce proppant flowback. Our resin coating capacity is the largest in the industry, providing our customers enhanced assurance of supply. Due to superior performance and value added formulation and manufacturing processes, sales of our resin coated products generate a higher per ton profit as compared to our raw frac sand. We will continue to work with market participants by hosting technical sales meetings, obtaining field data, and producing scientific papers which highlight the value proposition of resin coated proppant. Through these efforts, we will seek to increase overall market penetration of our resin coated proppant.
Develop and Commercialize High Performance Proprietary Proppants. We pioneered the manufacturing and use of resin coated proppants and have a history of developing innovative technologies that increase the effectiveness of downhole completions, from conventional wells to the most complex, multi-stage horizontal wells. In 2012, we made a significant investment in a new state-of-the-art research and development facility and strengthened our team of scientists, material engineers and process engineers focused on developing innovative and proprietary proppants. As a result of our commitment, our new product development record is strong. For example, we successfully developed and commercialized PowerProp, a patented resin coated sand proppant with characteristics competitive with lightweight ceramic proppants, and CoolSet, a resin coated sand proppant that
71
Table of Contents
works at low temperatures with no chemical activators. Additionally, we are currently conducting field trials for Propel SSP after developing a commercialized processing capability and we expect full commercial launch by early 2015. We are in constant dialogue with our customers regarding evolving product needs and have a number of new products in various stages of development.
Execute All of Our Corporate Initiatives with a Commitment to Customers, Employees and Communities. Our corporate culture emphasizes People, Planet and Prosperity, and our sustainability strategy defines our approach to operations and community engagement. We work to minimize our environmental impact and continue to find ways to reduce waste while also reducing operating costs. We are honored to receive recognition from our communities for our focus on sustainable mining practices, reclamation and community investment. We believe that positive community engagement is both a privilege and a responsibility, and that it enhances our ability to recruit and retain employees, obtain mining and other operating permits and strengthen relationships with our customers. Our corporate motto is “Do Good. Do Well.” and we intend to continue to execute our growth strategy with a focus on sustainable development.
Our Products
We provide a wide range of high quality silica sands to various industries, including oil and gas and I&R end markets. We believe our two primary business segments are complementary. Our ability to sell to a wide range of customers across multiple end markets allows us to maximize the recovery of our reserve base within our mining operations and to reduce the cyclicality of our earnings.
Proppant Solutions Segment
We offer proppant products in each of the most common API specified proppant categories, which we believe address more than 90% of the proppant market. In 2013, The Freedonia Group estimated that raw frac sand comprised approximately 81% of the proppant market, resin coated sand comprised approximately 11% of the market and ceramic comprise approximately 7% of the market. We offer a resin coated ceramic product that competes in this segment of the ceramic market. The following chart demonstrates the proppant markets segments that our sand-based proppants address:
2013 Proppant Demand by Type (volume in millions of tons)
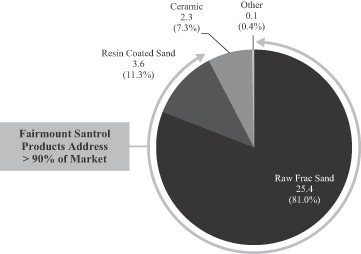
Source: The Freedonia Group, study #3160 Well Stimulation Materials, June 2014
72
Table of Contents
API-Spec Northern White Frac Sand. Our Northern White frac sand is mined from deposits located in our Illinois, Wisconsin and Minnesota facilities. These reserves are generally characterized by high purity, significant roundness and sphericity and low turbidity. These reserves are referred to as “Northern White” sands and are produced in all standard mesh sizes, including 12/20, 16/30, 20/40, 30/50, 40/70 and 100 mesh. All of our Northern White raw sand proppant products meet the standards set by the API.
API-Spec Brown Frac Sand. Our API-spec brown sand reserves are located in Texas and are sourced from the Hickory Formation. We market this sand under the name “Texas Gold” and sell it in standard mesh sizes consistent with our Northern White frac sand. Our Texas Gold frac sand has lower crush resistance than our Northern White frac sand, but it is an effective solution for low pressure wells. These reserves are in close proximity to major oil and gas producing basins in Texas, including the Eagle Ford Shale and the Permian Basin, which provides them with a significant transportation cost advantage relative to API spec frac sand sourced from more distant locations.
Resin Coated Proppant. We coat a portion of our API-spec sand with resin to enhance its performance as a proppant using proprietary resin formulations and coating technologies. Our resin coated proppants are generally used in higher temperature and higher pressure well environments and are marketed to end users who require increased conductivity in higher pressure wells, high crush resistance and/or enhanced flowback control in order to enhance the productivity of their wells. Independent technical research has quantified the conductivity advantage from resin coated sand and our resin coated proppant, PowerProp versus raw sand as depicted in the chart below.
Relative Conductivity Over a Range of Closure Pressures
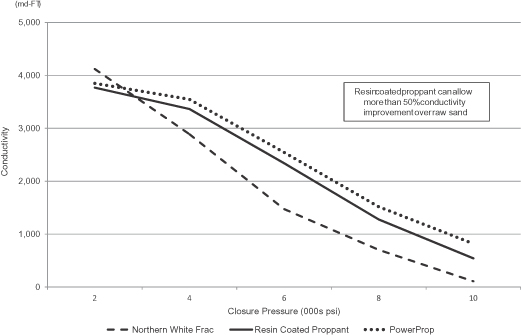
Source: Company data
Our resin coated sand products are sold as both tempered (or precured) and curable (or bonding) products. Curable proppants help to prevent flowback by distributing stress in the fracture and by reducing crushing and the generation of crushed sand grains, commonly known as “fines.” For certain resin products, the resin’s chemical properties are triggered by the introduction of an activator into the frac fluid. Tempered products do not
73
Table of Contents
require activation as their chemical properties are already active. We formulate, manufacture and sell activators which work with the specific chemistry of our resins.
We manufacture proprietary coatings designed to address the evolving needs of our customers, and have recently invested significantly in our research and development and technical marketing capabilities to maximize the sales of our coated products. We also coat ceramic proppant purchased from third-party suppliers. This product is marketed as HyperProp and has the strength characteristics of ceramic and the flowback performance characteristics of resin coated sand.
Recent Proprietary Performance Products
PowerProp. Our PowerProp product was introduced in late 2010 as a unique resin coated sand product with higher crush resistance and conductivity than any other sand-based proppant available on the market. PowerProp utilizes our existing resin coating facilities and proprietarily developed resin chemistry to create substantially increased product performance.
During in-house testing, PowerProp exhibited performance characteristics similar to or better than lightweight ceramics which allows us to compete in that market segment. Based on further in-house testing, in an API dry crush comparison, our PowerProp product exhibited less than 3% crush at 10,000 psi as compared to greater than 10% crush for a competing lightweight ceramic product. PowerProp also performed more favorably than lightweight ceramics at other pressures between 6,000 psi and 12,000 psi. Similarly, in alternative testing designed to better simulate downhole pressure, temperature and chemical conditions, PowerProp exhibited approximately 2% crush at 10,000 psi as compared to approximately 10% crush for a competing lightweight ceramic product.
Propel SSP. Our Propel SSP product utilizes a polymer coating applied to a proppant substrate. Upon contact with water, the coating hydrates and swells rapidly to create a hydrogel around the proppant substrate. The hydrogel layer, which is primarily water, is attached to the proppant particle and provides a nearly threefold increase in the hydrostatic radius of the proppant. Initial test results indicate that the lower specific gravity allows greater volumes of proppant and/or coarser mesh sizes coated with Propel SSP to be carried deep into the fracture, which in turn allow more hydrocarbons to escape into the wellbore. This technology reduces or eliminates the need for certain frac fluid additives, including guar, which are used to enhance the transport of proppants into the geologic formation.
74
Table of Contents
The graphic below illustrates, as a guideline, up to what closure pressures different raw sand and resin coated proppant products perform efficiently. A proppant’s actual performance (crush rate, flow back control, etc.) is subject to a range of factors beyond closure pressure, including temperature, pressure, well depth and other geological and engineering characteristics.
Fairmount Santrol Proppants vs. Closure Pressure(1)
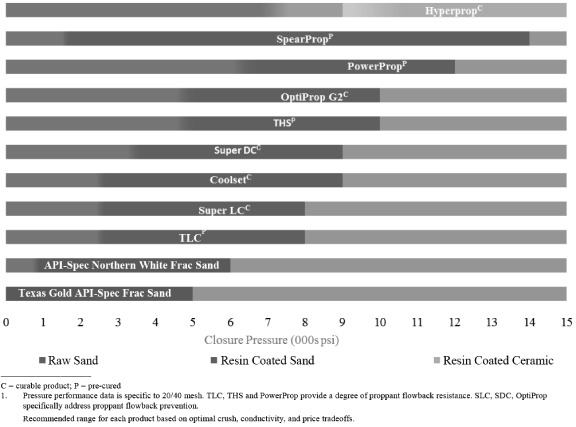
I&R Products
We provide high quality sand and coated products, strong technical leadership and applications knowledge to the following primary end markets served by our I&R Products segment: foundry, building products, sports and recreation, glassmaking and filtration.
Foundry. We currently supply the foundry industry with multiple grades of high purity, round, angular and sub-angular sands for molding and core making applications, with products sold primarily in the U.S., Canada, Mexico, Japan and China. Foundry sands are characterized by high purity, round and sub-angular sands precisely screened to perform under a variety of metal casting conditions. These factors dictate the refractory level and physical characteristics of the mold and core, which have a significant effect on the quality of the castings produced in the foundry. Our resin binders provide the necessary bonding of molds and cores in casting applications and are designed to improve overall productivity and environment conditions in the workplace.
Our extensive production experience and technical knowledge of the foundry industry have driven several industry advances. For example, we have developed our Signature Series of low smoke, low odor resin coated sands that provide lower overall emissions while providing a safer and more favorable work environment. Our expertise with resin coated sands enables us to provide coated sand for molds and cores where exceptional dimensional accuracy and surface finish are required.
75
Table of Contents
We believe we were the first sand operator to blend sands, which has proven a successful product for use in specialty iron and aluminum applications. As foundries continue to utilize higher cost binders to improve the quality of their castings and minimize the use of binders (which also reduces overall environmental impact), the industry continues to demand higher quality sands to realize the value of these binders. Our chemists and technicians support these applications with customized products that minimize binder usage, resulting in lower costs to foundries and higher prices for our products.
Glass. We provide a wide variety of high purity, low iron silica sands to the glass market.
Building Products. Various grades and types of our sands are used for roofing shingles, asphalt, industrial flooring ballast sand, bridge decking, pipe lining and tank underlayment. We also work with our customers to blend minerals and chemicals to create colored flooring aggregates, concrete countertops, grout and plaster.
Sports and Recreation. We are a leading supplier of various turf and landscape infill products to contractors, municipalities, nurseries and mass merchandisers. Our turf products are used in multiple major sporting venues, including Cleveland Browns Stadium, PNC Park, Notre Dame Stadium and Progressive Field. In addition, we are a significant supplier of bunker sand, top dressing sands and all-purpose sands to golf clubs and landscape contractors throughout North America. The sub angular shape of our sands provides for excellent drainage and resistance to crushing and allows the grains to hold well to bunker sides and slopes. Our sands are also supplied to horse tracks and training facilities. We also provide colored and private labeled sand directly to a variety of major retailers for use as play sand and arts and crafts.
Filtration. We provide high-quality industrial sands and gravels in a wide variety of water and wastewater filtration applications. Over the past several years, we increased our focus on the filtration market. Our full range of products are monitored with an active statistical process control program to ensure compliance with all government and customer specifications, including the American Water Works and National Sanitation Foundation standards. Due to our efforts, we have emerged as a leader in sand and gravel products for private, public and institutional water filtration systems.
Our Customers
Since our inception, we have remained focused on developing and sustaining a loyal, diversified customer base. Currently, we maintain long-term relationships with many of the largest North American oilfield service companies. We believe the strength of our customer base is driven by our collaborative approach to product innovation and development, reputation for high-quality products and extensive logistics network. Certain of our top customer relationships date back over 30 years. We have approximately 80 customers for our oil and gas proppants and nearly 850 customers across all our end markets. For the year ended December 31, 2013 and the six-month period ending June 30, 2014, our top two proppant customers, Halliburton and FTSI, accounted for approximately 30% and 36% of our sales, respectively. For a description of our agreements, please read “—Management’s Discussion and Analysis of Financial Condition and Results of Operations—How We Generate Our Sales”.
Our Reserves
We control one of the largest bases of silica sand reserves in the United States. From our reserves, we are able to produce a large selection of high-purity silica sand, lake sand, resin-coated sand, silica gravel and other specialty sands. According to the Securities and Exchange Commission (SEC) Industry Guide 7, reserves are defined as that part of a mineral deposit which could be economically and legally extracted or produced at the time of the reserve determination. Reserves are categorized into proven (measured) reserves and probable (indicated) reserves which are defined as follows:
| • | Proven (measured) reserves. Reserves for which (1) quantity is computed from dimensions revealed in outcrops, trenches, workings or drill holes; grade and/or quality are computed from the results of detailed |
76
Table of Contents
| sampling and (2) the sites for inspection, sampling and measurement are spaced so closely and the geologic character is so well defined that size, shape, depth and mineral content of reserves are well-established. |
| • | Probable (indicated) reserves. Reserves for which quantity and grade and/or quality are computed from information similar to that used for proven (measured) reserves, but the sites for inspection, sampling, and measurement are farther apart or are otherwise less adequately spaced. The degree of assurance, although lower than that for proven (measured) reserves, is high enough to assume continuity between points of observation. |
Our reserves meet the definition of proven reserves in accordance with SEC Industry Guide 7. We estimate that the company has approximately 798.2 million tons of proven recoverable mineral reserves as of December 31, 2013. Mineral reserve estimated quantities and characteristics at our properties were developed by an independent third party consulting company, GZA GeoEnvironmental Inc. Our reserve estimates are based on in-place material. Our recovery rates are estimated internally. Prospective properties are surveyed, drilled, and analyzed to determine the quality and quantity of the reserve. Reserve estimates were generally determined based on a full reserve evaluation rather than an audit of previous work. Process and methods were deterministic with methods ranging from simple calculations of area times thickness to obtain cubic feet, multiplied times a sand density in pounds per cubic feet to obtain tons; to more complex methods utilizing three dimensional modelling.
The following map identifies the location of our reserves and the associated mining or processing facilities:
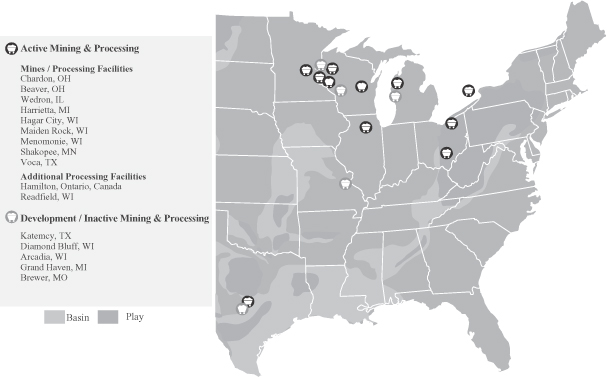
77
Table of Contents
Summary of Reserves
The following table provides information on each of our sand mining and processing facilities. Included is the location and area of the facility; the type, amount and ownership status of its reserves and whether or not they meet API standards; and the primary end markets that it serves.
| Facilities/Mines |
Acres Owned / Leased * |
Meets API RC 19C (1) |
Proven Reserves (Thousand Tons) |
Estimated recovery percentages (3) |
2013
Sales Volume (Thousand Tons) (2) |
Primary End Markets | ||||||||||||||||
| API White |
||||||||||||||||||||||
| Wedron, IL |
|
1,818 0 |
|
O L |
API White | 230,716 | 80 | % | 3,677 | proppant, glass, foundry, specialty products | ||||||||||||
| Maiden Rock, WI |
|
987 576 377 |
|
O OM L |
API White | 29,140 | 70 | % | 1,209 | proppant, glass, foundry | ||||||||||||
| Menomonie, WI |
|
2 366 |
|
O L |
API White | 25,548 | 75 | % | 635 | proppant, glass, foundry, specialty products | ||||||||||||
| Bay City, WI |
|
40 322 1,131 |
|
O OM L |
API White | 20,751 | 70 | % | 682 | proppant, glass, foundry | ||||||||||||
| Shakopee, MN |
|
93 115 |
|
O L |
API White | 15,346 | 80 | % | 146 | proppant, glass, foundry, specialty products | ||||||||||||
| API Brown | ||||||||||||||||||||||
| Voca, TX(4) |
1,962 | O | API Brown | 195,978 | 50 | % | 252 | proppant, glass, foundry | ||||||||||||||
| Non-API | ||||||||||||||||||||||
| Chardon, OH(5) |
617 | O | Non-API | 16,089 | 80 | % | 638 | glass, turf, landscaping, construction, filler & extender, foundry, industrial, proppant, filtration | ||||||||||||||
| Beaver, OH |
|
91 216 |
|
O L |
Non-API | 12,718 | 75 | % | 54 | turf, landscaping, industrial | ||||||||||||
| Harrietta, MI |
|
284 80 |
|
O L |
Non-API | 11,087 | 75 | % | 157 | foundry, construction | ||||||||||||
| Development | ||||||||||||||||||||||
| Katemcy, TX(4) |
848 | O | API Brown | 113,278 | 50 | % | N/A | potential to serve proppant, glass, foundry | ||||||||||||||
| Diamond Bluff, WI |
|
10 2,674 |
|
O L |
API White | 44,539 | 70 | % | N/A | potential to serve proppant, glass, foundry | ||||||||||||
| Arcadia, WI(4) |
438 | O | API White | 43,770 | 85 | % | N/A | potential to serve proppant, glass, foundry | ||||||||||||||
| Inactive | ||||||||||||||||||||||
| Grand Haven, MI |
|
134 0 |
|
O L |
Non-API | 6,555 | 85 | % | N/A | N/A | ||||||||||||
| Brewer, MO(4) |
353 | O | API White | 32,680 | 80 | % | N/A | potential to serve proppant, glass, foundry | ||||||||||||||
|
|
|
|
|
|||||||||||||||||||
| Total (6) |
798,195 | 7,450 | ||||||||||||||||||||
|
|
|
|
|
|||||||||||||||||||
| * | OM = Owned Mineral Acreage |
O = Owned Acreage
L = Leased Acreage
| 1. | API RC 19C Recommended Practice for Measurement of Proppants Used in Hydraulic Fracturing and Gravel-packing Operations, First Edition (ISO 13503-2:2006, Identical). |
| 2. | Sales volumes for facilities/mines purchased from FTSI only include a portion of FTSI’s 2013 results and are not pro forma for a full year of FTSI Integration. |
| 3. | Estimated recovery percentages represent yield after mining recoveries and processing recoveries. Data for inactive or developmental mines are based on historical data or estimates. |
| 4. | Facility/mine was acquired from FTSI. |
| 5. | Chardon estimate includes 2,201,349 tons not permitted. |
| 6. | Our 2013 sales volume does not include sales of coated ceramics. |
78
Table of Contents
We have developed a customized approach to both our mining activities and our reclamation philosophy. Our Wedron, Illinois facility utilizes hydraulic mining techniques, which provide access to sands that can be blended from different parts of the quarry. In Wisconsin, we utilize underground mining at our Bay City and Maiden Rock facilities, and plan to do the same at our Diamond Bluff facility, thereby minimizing surface disruption. In addition, we maintain certification with the Wildlife Habitat Counsel for our reclamation methodology and have won numerous awards for our approach to restoring mined properties. For example, we recently completed reclamation activities at a former mine in Michigan. At that site, which was donated back to the state of Michigan, we worked with environmental consultants to harvest region-specific plants and berries which were raised in a nursery and planted back on-site to ensure biological continuity with an adjacent state park. We develop reclamation plans for each quarry for implementation concurrently with the depletion of the mineral reserves.
Descriptions of Sand Facilities
The following is a detailed description of our nine active sand mining and processing operations facilities, our currently undeveloped mines in Katemcy, Texas, Diamond Bluff, Wisconsin and Arcadia, Wisconsin and our inactive Brewer, Missouri mine. We also have an inactive mine at Grand Haven, Michigan and two sand processing facilities located in Readfield, Wisconsin and Hamilton, Ontario, Canada that do not have any sand reserves but together have an annual processing capacity of approximately 625,000 tons per year.
The mineral rights and access to mineral reserves for the majority of our facilities are secured through land that is owned in fee. There are no underlying agreements and/or royalties associated with these properties. Where there are agreements and/or royalties associated with our properties, we have provided more information in the facility descriptions below. We are required to pay production royalties on a per ton basis pursuant to our mineral reserve leases. For the year ended December 31, 2013, we paid $2.1 million in royalty payments representing approximately 0.2% of our total revenues. We generally perform comprehensive title and survey due diligence prior to entering into leases.
API White
Wedron, Illinois. Our Wedron, IL facility is located in Wedron, LaSalle County, IL and consists of owned real property. The facility, which is approximately 6 miles northeast of Ottawa, Illinois, is accessible via County Highway 21 off of State Highway 71 and State Highway 23. The site utilizes natural gas and electricity to process sand. Mining methods include mechanical removal of glacial overburden followed by drilling, blasting and hydraulic mining. Hydraulically mined sand is pumped to the wash plant to be hydraulically sized, and sent to the dry plant where it is dried and screened.
Our Wedron facility was originally opened in 1890 by the Garden City Sand Co and was sold in 1894 to the Wedron White Sand Co. which became Wedron Silica Co. in 1916. Martin Marietta acquired the company in 1979. In 1984 Best Sand and the Wedron management group purchased the operation. Our company was formed from the merger of Wedron Silica and Best Sand in 1986. The washing and drying operations at our Wedron facility were upgraded in 2012 and 2013 in conjunction with significant capacity and reserve base increases. Processed sand is shipped from the facility via truck or rail on the Burlington Northern Santa Fe (“BNSF”) and CSX Railroads via the Illinois Railnet. Our Wedron facility utilizes approximately 15,000 linear feet of rail, enlarged in 2013, to accommodate unit trains. A portion of the sand is transferred by conveyor or trucked from Wedron facility and is resin-coated at the Technisand Wedron, Troy Grove and/or Cutler, Illinois resin coating facilities. Future plans for this facility include increasing mining capacity, adding an additional wash plant and dry plant and bringing a new SSP facility online in 2015. The total net book value of the Wedron facility’s real property and fixed assets as of June 30, 2014 was $64.5 million.
The sand reserve mined from the open-pit mine at the Wedron facility is the St. Peter Sandstone formation. The Wedron facility produces high purity, round grain silica sand that meets the API requirements for proppant application. The Wedron facility capacity is approximately 4.4 million tons per year. This facility sold 3.7 million tons in 2013.
79
Table of Contents
The surface deposit at the Wedron facility is a high purity, round grain sand with a minimum silica content of 99% which meets API requirements for proppant application. The controlling attributes are iron grain size. Iron is concentrated near the surface, where orange iron staining is evident and also increases where the bottom contact becomes concentrated in iron pyrite. Maximum average full face iron content is 0.020%. The deposit tends to exhibit a coarser grain size distribution in top half of deposit. The grain size distribution averages greater than 45% plus 50 mesh. Fine and coarse areas are blended to meet the grain size average.
Maiden Rock, Wisconsin. Our Maiden Rock, WI facility is located in Maiden Rock, Pierce County, WI and consists of owned and leased real property. The mineral reserves at the Maiden Rock facility are secured under mineral leases that, with the exercise of renewal options, expire between 2021 and 2046. The facility is within the Village and Town of Maiden Rock along State Highway 35. The Maiden Rock facility utilizes natural gas and electricity to process sand. This is an underground mine and mining methods include drilling and blasting. The reserves are located at a depth of 230 feet. The sand is removed from the face of the tunnels with a front end loader and deposited into a container where it is combined with water to form a slurry. The slurry is pumped to the surface wash plant to be hydraulically sized and sent to the dry plant where it is dried and screened.
The Maiden Rock facility was originally developed in the 1920s. We acquired a 50% equity interest in the facility from Wisconsin Industrial Sand in 1997, and acquired the remaining equity interest in 1999. The washing and drying operations at the Maiden Rock facility were upgraded in 2012 in conjunction with a significant capacity increase. Processed sand is shipped from the Maiden Rock facility via truck or rail on the BNSF Railroad. The Maiden Rock facility utilizes a new rail loadout facility and approximately 5,000 linear feet of rail constructed in 2012. The total net book value of the Maiden Rock facility’s real property and fixed assets as of June 30, 2014 was $40.0 million.
The sand reserve mined from the underground mine at the Maiden Rock facility is the Jordan Sandstone formation. The Maiden Rock facility produces high purity, round grain silica that meets API requirements for proppant application. The mining capacity is approximately 1.3 million tons per year. The Maiden Rock facility sold 1.2 million tons in 2013.
The underground deposit at this facility is a high purity, round grain sand with a minimum silica content of 99% which meets API requirements for proppant application. The controlling attributes are turbidity, acid solubility, and grain size. The deposit tends to exhibit a coarser grain size distribution near the top of the deposit. Grain size distribution is maintained through control of mine horizon. Turbidity and acid solubility are controlled though the use of hydrosizers during wet processing. The grain size distribution averages greater than 80% plus 50 mesh.
Menomonie, Wisconsin. Our Menomonie, WI facility is located in Menomonie, Dunn County, WI and consists of owned and leased real property. The mineral reserves at our Menomonie facility are secured under mineral subleases that expire in 2044. We constructed the Menomonie facility in 2007 approximately 2 miles east of Menomonie and it is accessible via US Highway 12 / State Highway 16. The Menomonie facility utilizes natural gas and electricity to process sand. Mining methods include the mechanical removal of glacial overburden followed by drilling, blasting and mechanical mining. The sand is removed from the mine face with a front end loader and deposited into a container where it is combined with water to form a slurry. The slurry is pumped to the wash plant to be hydraulically sized and then sent to the dry plant where it is dried and screened. Mined sand is processed and shipped by truck or rail. A remote transload facility adjacent to the Union Pacific (UP) Railroad is located approximately one mile north of the site. The total net book value of the Menomonie facility’s real property and fixed assets as of June 30, 2014 was $13.2 million.
The sand reserve mined from the open-pit at the Menomonie facility is the Wonewoc Sandstone formation. The Menomonie facility produces high purity, round grain silica sand that meets the API requirements for proppant application. The mining capacity is approximately 750,000 tons per year. The Menomonie facility sold 635,000 tons in 2013.
80
Table of Contents
The surface deposit at the Menomonie facility is a high purity, round grain sand with a minimum silica content of 99% which meets API requirements for proppant application. The controlling attributes are turbidity, iron, and grain size. Maximum average full face iron content is 0.080%. The deposit tends to exhibit a coarser grain size distribution in top half of deposit. Turbidity is controlled though the use of attrition scrubbers during wet processing. Iron is controlled during processing through the use of magnetic separators. Fine and coarse areas are blended to meet the grain size average. The grain size distribution averages greater than 55% plus 50 mesh.
Bay City, Wisconsin. Our Bay City, WI facility is located in Isabelle and Hartland Township, Pierce County, WI and consists of owned and leased real property. The mineral reserves at the Bay City facility are secured under mineral leases that, with the exercise of renewal terms, expire between 2045 and 2106. The Bay City facility was opened in 1919 and operated continuously until 1989. We acquired the mine through the acquisition of Wisconsin Specialty Sand and constructed the associated Hager City processing (drying) plant in 2007. This underground mine is approximately 1.5 miles northeast of Bay City on State Highway 35. The reserves are located at a depth of 230 feet. The mine utilizes electricity to process sand. Mining methods include drilling and blasting. The sand is removed from the face of the tunnels with a front end loader and deposited into a container where it is combined with water to form a slurry. The slurry is then pumped to the wash plant to be hydraulically sized and allowed to drain.
Mined sand washed at the facility is shipped approximately five miles to the Hager City plant for further processing and eventual shipment via truck or rail on the BNSF Railroad. The Hager City plant, constructed by Wisconsin Industrial Sand Company, LLC in 2007, was expanded in 2013 and 2014 with the addition of a new rail yard containing approximately 17,000 linear feet of rail for assembling unit trains. The expansion is expected to be operational during the third quarter of 2014. The total net book value of the Bay City facility’s real property and fixed assets as of June 30, 2014 was $12.8 million.
The sand reserve mined from the underground mine at the Bay City facility is the Jordan Sandstone formation. The Bay City facility produces high purity, round grain silica that meets API requirements for proppant application. The mining capacity is approximately 780,000 tons per year. The Bay City facility sold 682,000 tons in 2013.
The underground deposit at the Bay City facility is a high purity, round grain sand with a minimum silica content of 99% which meets API requirements for proppant application. The controlling attributes are turbidity, acid solubility, and grain size. The deposit tends to exhibit a coarser grain size distribution near the top of the deposit. Grain size distributions are maintained through control of mine horizon. Turbidity and acid solubility are controlled though the use of hydrosizers during wet processing. The grain size distribution averages greater than 75% plus 50 mesh.
Shakopee, Minnesota. Our Shakopee, MN facility is located in Shakopee, Scott County, MN and consists of owned and leased real property. The mineral reserves at our mine are secured by fee ownership and a lease agreement that, with the exercise of renewal options, expires in 2030. The facility is approximately four miles south of Shakopee, Minnesota and is accessible via US Highway 169. The Shakopee facility utilizes natural gas and electricity to process sand. Mining methods include the mechanical removal of glacial overburden followed by drilling, blasting and mechanical mining. Mined sand is transported to the wash plant to be hydraulically sized, and sent to the dry plant where it is dried and screened.
Mining occurred at the Shakopee facility for a short time in the 1980s by others until the property was reclaimed. The mine was permitted by Great Plains Sand in 2012 and acquired by us in 2013, at which time we changed the name to Shakopee Sand LLC. We upgraded the washing and drying operations at the facility following the acquisition. Processed sand is shipped from the Shakopee facility via truck or by rail on the Union Pacific Railroad. Future plans for the Shakopee facility include expansion of the railyard into an approximately 50 acre parcel to the north of the site and the construction of approximately 10,000 linear feet of rail to assemble
81
Table of Contents
unit trains. The total net book value of the Shakopee facility’s real property and fixed assets as of June 30, 2014 was $25.2 million.
The sand reserve mined from the open-pit mine at the Shakopee facility is the Jordan Sandstone formation. The deposit produces high purity, round grain silica sand which meets API requirements for proppant application. The mining capacity is approximately 720,000 tons per year with estimated annual products shipped at approximately 680,000 tons per year. The Shakopee facility sold 146,000 tons in 2013.
This surface deposit at the Shakopee facility is a high purity, round grain sand with a minimum silica content of 99% which meets API requirements for proppant application. The controlling attributes are turbidity and grain size. The deposit tends to exhibit a coarser grain size distribution in the top half of deposit. Turbidity is controlled through the use of hydrosizers and attrition scrubbers during wet processing. Fine and coarse areas are blended to meet the grain size average. The grain size distribution averages greater than 50% plus 50 mesh.
API Brown
Voca, Texas. Our Voca, TX facility is located in Voca, Mason and McCulloch Counties, Texas and consists of owned real property. The facility, which is approximately 1.5 miles southeast of Voca, is accessible via County Highway 1851, south of State Highway 71. Sand mining and processing operations were developed at the facility during 2008, with the construction of existing plants completed in 2012. We acquired the operations in 2013. The Voca facility utilizes propane and electricity to process sand. Mining methods include the mechanical removal of thin overburden followed by drilling, blasting and mechanical mining. Sand is transferred by conveyor to the wash plant to be hydraulically sized, and sent to the dry plant where it is dried and screened. Processed sand is shipped from the facility via truck. A portion of the sand is trucked from the Voca facility and is resin-coated at the co-located FML Resin, LLC. The total net book value of the Voca facility’s real property and fixed assets as of June 30, 2014 was $33.4 million.
The sand reserve mined at our Voca property is the Hickory Sandstone Member of the Riley formation. The Voca facility produces high purity, round grain silica which meets API requirements for proppant application. The mining capacity is approximately 1.8 million tons per year with the estimated annual products shipped at approximately 1.2 million tons per year. The Voca facility sold 252,000 tons in 2013.
The surface deposit at the Voca facility is a high purity, round grain sand with a minimum silica content of 98% which meets API requirements for proppant application. The controlling attributes are turbidity and grain size. Turbidity is controlled through the use of hydrosizers and attrition scrubbers during wet processing. Grain size is controlled through the use of hydrosizers and wet screening. The grain size distribution averages greater than 65% plus 50 mesh.
Non-API
Chardon, Ohio. Our Chardon, OH facility is located in Geauga County, Ohio and consists of owned real property. The facility, which is approximately two miles south of Chardon, is accessible via State Route 44. The site utilizes natural gas and electricity to process sand. Mining methods include the mechanical removal of glacial overburden followed by drilling, blasting and mechanical mining. Sand is hauled to a crusher, then transferred by conveyor to a wash plant to be hydraulically sized, crushed and sent to the dry plant where it is dried and screened. Mined sand is processed and shipped by truck.
The mine was opened in 1938 and acquired by Best Sand in 1978. We acquired the mine as a result of the merger of Wedron Silica and Best Sand in 1986. Upgrades were made to the wash plant in 2009, the fluid bed dryer in 2012 and the rotary dryer circuit in 2012. Our future plans include continued expansion of the reserve
82
Table of Contents
base. The total net book value of the Chardon facility’s real property and fixed assets as of June 30, 2014 was $7.3 million.
The sand reserve mined from the open-pit mine at the Chardon facility is the Sharon Conglomerate formation. This plant produces high purity, sub-angular grain silica sand and gravel used for industrial and recreational markets. The mining capacity is approximately 1.1 million tons per year. The Chardon facility sold 638,000 tons in 2013.
The surface deposit at the Chardon facility is a high purity, sub-round grain silica sand/gravel. The deposit has a minimum silica content of 99% ideal for glass and foundry applications. The contributing attributes are iron and grain size distribution. The mine’s iron averages 0.084%. Iron is controlled during processing through the use of magnetic separators. The grain size distribution averages greater than 60% plus 50 mesh. Fine and coarse areas are blended to meet the grain size average.
Beaver, Ohio. Our Beaver, OH facility, acquired in 1994 from Schrader Sand and Gravel, is located in Jackson Township, Pike County, Ohio and consists of owned and leased real property. The mineral reserves at this facility are secured under mineral leases that, with the exercise of renewal options, expire in 2024. The facility, which is approximately six miles northeast of Beaver, Ohio, is accessible via County Road 521. The facility utilizes electricity to process sand. Mining methods include the mechanical removal of glacial overburden followed by drilling, blasting and mechanical mining. Mechanically mined sand is hauled to the wash plant to be hydraulically sized and stockpiled. The finished product is shipped by truck. The total net book value of the Beaver facility’s real property and fixed assets as of June 30, 2014 was $0.2 million.
The sand reserve mined from the open-pit mine at the Beaver facility is the Sharon Conglomerate formation. The Beaver facility produces high purity, sub-angular grain silica sand and gravel. The mining capacity is approximately 260,000 tons per year. The Beaver facility sold 54,000 tons in 2013.
The surface deposit at the Beaver facility is a high purity, sub-angular grain silica sand/gravel. The deposit has a minimum silica content of 99% and is ideal for turf/landscaping and industrial. The controlling attribute is cleanliness. Cleanliness is controlled through wet processing. The grain size distribution averages greater than 60% plus 50 mesh.
Harrietta, Michigan. Our Harrietta, MI facility is located in Slagle Township, Wexford County, MI and consists of owned and leased real property. The facility, which is approximately three miles northeast of Harrietta, Michigan, is accessible via West 28th Road and State Highway 37. The facility utilizes recycled oil and electricity to process sand. Mining methods include mechanical removal of overburden and excavation of sand. The sand is transferred by conveyor to the wash plant to be hydraulically sized, and sent to the dry plant where it is dried and screened. The finished product is shipped by truck or rail.
We acquired Wexford Sand from Sargent Sand in 1998. A new screen plant was installed in 2008. The processed sand is shipped from the Harrietta facility by bulk via truck or rail on the Great Lakes Central Railroad. Future plans for the mine include a recently secured permit to develop a dredge pond and dredge mine to access sub-aqueous reserves. The total net book value of the Harrietta facility’s real property and fixed assets as of June 30, 2014 was $4.8 million.
The sand reserve mined from the open-pit mine at the Harrietta facility is a glacial outwash sand deposit that does not meet API requirements for proppant application. Glacial outwash is glacial sediments deposited by melting glacial ice at the terminus of a glacier. The mining capacity is approximately 593,000 tons per year. The Harrietta facility sold 157,000 tons in 2013.
This surface deposit at the Harrietta is sub-round grain sand with minimum silica content of 96% ideal for foundry applications. The controlling attributes are Acid Demand Value (ADV) and grain size distribution. The
83
Table of Contents
mine’s ADV ranges from 40-100. ADV is controlled through floatation during wet processing. The grain size distribution averages greater than 45% plus 50 mesh.
Development
Katemcy, Texas. Our Katemcy, TX reserves are located in Katemcy, Mason County, TX and consist of owned real property. The mine property was purchased in September 2013 and is accessed via County Road 1222 and State Highway 87. The mine has not yet been developed and the property is currently used as agricultural land. This deposit is capable of producing high purity, round grain silica sand that meets API requirements for proppant application. Plans to develop the mine property are under review. The sand reserve at this proposed open-pit mine is the Hickory Sandstone Member of the Riley formation.
The surface reserve is a high purity, round grain sand with a minimum silica content of 98% which meets API requirements for proppant application. The controlling attributes will be turbidity and grain size. Turbidity will be controlled through the use of hydrosizers and attrition scrubbers during wet processing. Grain size will be controlled through the use of hydrosizers and wet screening. The grain size distribution averages greater than 49% plus 50 mesh.
Diamond Bluff, Wisconsin. Our Diamond Bluff, WI reserves are located in Diamond Bluff and Oak Grove Townships, Pierce County, WI and consist of owned and leased real property. The mineral reserves are secured under mineral leases that expire between 2063 and 2064. The mine property was purchased in 2014 and is undeveloped. The mine was permitted by the Diamond Bluff Township in 2012 and by the Oak Grove Township in 2014. The facility, which is located approximately one mile northwest of the unincorporated community of Diamond Bluff, is accessible off of 1005th Street via State Highway 35. The proposed underground mine site will be at a depth of 230 feet and will utilize electricity to process sand through drilling, blasting, mechanical and hydraulic mining methods. Mined sand will be shipped approximately eight miles to the Hager City plant for further processing and eventual shipment via truck or rail on the BNSF Railroad. The total net book value of the facility’s real property as of June 30, 2014 was approximately $997,000.
The sand reserve at this proposed underground mine is the Jordan Sandstone formation. This deposit is capable of producing high purity, round grain silica sand which meets API requirements for proppant application. This underground reserve is a high purity, round grain sand with a minimum silica content of 99% which meets API requirements for proppant application. The controlling attributes are turbidity, acid solubility, and grain size. The deposit tends to exhibit a coarser grain size distribution near the top of the deposit. Grain size distribution will be maintained through control of mine horizon. Turbidity and acid solubility will be controlled though the use of hydrosizers during wet processing. The grain size distribution averages greater than 75% plus 50 mesh.
Arcadia, Wisconsin. Our Arcadia, WI reserves are located in Arcadia, Trempealeau County, WI and consist of owned real property. The mine property, which was purchased in September 2013, is located approximately 1.5 miles northeast of Arcadia and is accessed via State Highway 95. This deposit is capable of producing high purity, round grain silica sand that meets API requirements for proppant application. The mine has not been developed and is utilized as agricultural land. Plans to develop the mine property are under review. The sand reserve at this proposed open-pit mine at the facility is the Wonewoc Sandstone formation.
The surface reserve is a high purity, round grain sand with a minimum silica content of 99% which meets API requirements for proppant application. The controlling attributes are turbidity and grain size. The deposit tends to exhibit a coarser grain size distribution in the top half of deposit. Turbidity will be controlled though the use of attrition scrubbers during wet processing. Fine and coarse areas will be blended to meet the grain size average. The grain size distribution averages greater than 55% plus 50 mesh.
84
Table of Contents
Inactive
Brewer, Missouri. Our inactive Brewer, MO mine is located in Brewer Perry County, MO. The facility, approximately one-half mile northwest of Brewer, Missouri, is accessible via State Highway M. We acquired the mine in August 2014. Mining methods include the mechanical removal of overburden followed by drilling, blasting and mechanical mining. Sand is pumped to the wash plant to be hydraulically sized, and sent to the dry plant where it is dried and screened. The total net book value of the facility’s real property and fixed assets as of June 30, 2014 was $12.9 million.
The sand reserve mined from the open-pit mine at the Brewer facility is the St. Peter Sandstone formation. The Brewer facility is capable of producing high purity, round grain silica that meets API requirements for proppant application. The mining capacity is approximately 1.0 million tons per year.
The surface deposit at the Brewer facility is a high purity, round grain sand with a minimum silica content of 99% which meets API requirements for proppant application. The controlling attributes are turbidity and grain size. The deposit tends to exhibit a coarser grain size distribution in top half of deposit. Turbidity is controlled through the use of hydrosizers and attrition scrubbers during wet processing. The grain size distribution averages greater than 90 percent minus 50 mesh.
Coating, Resin Manufacturing, Specialty Blending and Research and Development Facilities
We have 11 strategically located coating facilities in Wisconsin, Illinois, Michigan, Oklahoma and Texas, as well as Mexico, Denmark and China, with a combined annual production capacity of 2.4 million tons. In over 30 years of coating experience, we have developed significant know-how and proprietary processes to apply resin to sand and, in some instances, ceramic substrates destined for both the proppant and I&R end markets. Our customers require uniform products with their desired characteristics, and we use our know-how to meet these required customer specifications.
We also have a phenolic resin manufacturing facility located in Michigan that we acquired from Alpha Resins in 2011. This operation collaborates with our research and development group and our strategic marketing group to develop and manufacture our own proprietary resins. We expanded our own resin manufacturing capabilities in order to ensure the reliability of resin supply to our coating operations and to protect the confidentiality of our resin formulations.
To complement our sand processing capabilities, we have three specialty blending facilities, located in Ohio, Illinois and Texas. These operations make custom blends of aggregates for use in industrial and commercial flooring, polymer cements, grouts and performance mortars. An additional specialty facility, Mineral Visions, located in Illinois, produces specialty colored quartz for use in pools and colored play sand.
Furthermore, our research and development facilities are also strategically located near these facilities to enhance new product development.
85
Table of Contents
The following map reflects the location of our mining and processing, resin manufacturing, coating, specialty blending and R&D facilities and our administrative offices:
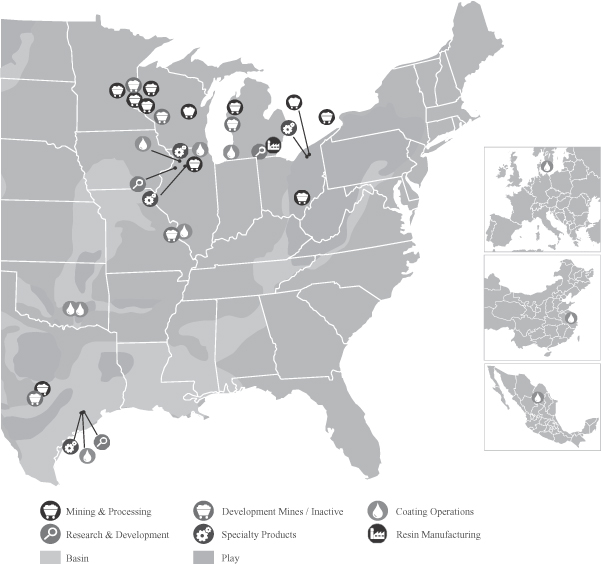
86
Table of Contents
Product Delivery
We have established an oil and gas logistics network that we believe is highly responsive to our customers’ needs. Among the most important purchasing criteria of our proppant customer relates to our ability to deliver the products our customers demand at their desired time and location. Our oil and gas logistics network includes 46 terminals and approximately over 8,500 railcars, including approximately 790 railcars provided by customers. The following map reflects the location of our destination terminals:
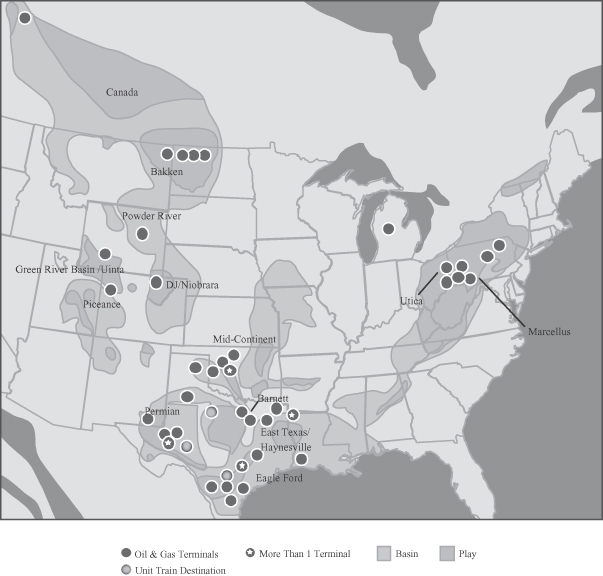
We believe we have the largest private fleet in the industry, enabling us to maximize efficiency and reduce demurrage costs. We are one of the few proppant producers capable of Class I railroad deliveries in each of North America’s major oil and gas producing basins. We generally ship sand to either a terminal location, where it is stored until utilized by a customer, or to one of our processing facilities for value-added processing. For the year ended December 31, 2013, approximately 81% of our North American oil and gas proppant volumes were transported through our terminal network. The direct rail access of our processing and distribution facilities significantly reduces handling costs and lead-times while enhancing production throughput, resulting in improved responsiveness to our customers.
87
Table of Contents
As industry dynamics evolve to multi-well pads and the proppant market matures, customers and railroads are increasingly requesting proppant to be shipped via unit trains. Currently, we have one outbound site which is unit train capable and has shipped 32 unit trains in the first five months of 2014. We expect to add an additional three outbound and three inbound unit train sites within the next twelve months and believe this enhanced infrastructure should provide us with a competitive advantage. We also ship our product via barge to basins where this is an option. 32 of our 46 proppant terminals are captive to our needs, providing long-term, secure access.
Research and Development and Technical Innovation
We have a history of partnering with our customers to develop innovative solutions to enhance the effectiveness of well completions, from conventional shallow wells to the most complex, multi-stage, horizontal wells. The nature of our vertically integrated model allows us to participate in each phase of proppant manufacturing and delivery and provides us a unique perspective into the current and future needs of our customers. Our technical sales team works closely with market participants to demonstrate the value proposition our proppants offer and stimulate market demand using data indicating enhanced hydrocarbon recoveries.
The table below summarizes some of our most significant product innovations.
| Innovation |
Year | Result | ||||
| Self-Suspending Proppant |
|
2014 |
|
• Improves hydraulic fracturing efficiency by allowing proppant to transport further into the fracture, substantially increasing fracture length and improving productivity of well • Applicable to all forms of proppant (white, brown, resin coated, ceramic) | ||
| PowerProp |
2010 | • Technology that delivers strength and performance characteristics similar to a lightweight ceramic (patent-pending) | ||||
| Bio-based Binder System |
2010 | • Technology for use in metal casting industry (patent-pending) | ||||
| BioBalls |
2006 | • Water soluble ball sealers that are environmentally safe and do not require retrieval after treatment | ||||
| Encapsulated Curable Proppant |
1997 | • High performance resin coated proppant used in flowback control | ||||
| Dual Coat Technology |
1995 | • Dual coat curable resin coated sand for enhanced conductivity and flowback control | ||||
Our research and development team consists of 24 professionals (scientists, engineers, technicians), with eight of them holding Ph.Ds, located at three locations in Sugar Land, TX, Ottawa, IL and Detroit, MI. After acquiring Propel SSP in May 2013, our team has worked to further refine the technology and manufacturing techniques of our Propel SSP product in order to successfully launch the product in commercial quantities. Propel SSP is currently undergoing field trials with several key customers. Propel SSP relies on a polymer coating applied to a proppant substrate. Upon contact with water, the coating hydrates and swells rapidly to create a hydrogel around the proppant substrate. The hydrogel layer, which is primarily water, is attached to the proppant particle and provides a nearly threefold increase in the hydrostatic radius of the proppant. This reduces the effective specific gravity to about 1.3, compared to 2.6 for a typical uncoated sand grain. Initial test results indicate that the lower specific gravity allows greater volumes of proppant and/or coarser mesh sizes coated with Propel SSP to be carried deep into the fracture, which in turn allow more hydrocarbons to escape into the wellbore. This technology reduces or eliminates the need for certain frac fluid additives, including guar, which are used to enhance the transport of proppants into the geologic formation. Lab testing shows that original proppant substrate crush resistance and conductivity are not affected by the coating process, which suggests that a broad range of proppant types, including resin coated sand and ceramics, could benefit from this transport technology. Propel SSP is stable over a wide range of temperatures.
88
Table of Contents
Acquisitions
Throughout our history, we have made and successfully integrated strategic acquisitions in order to strengthen our market leadership position. For example, in 2013 we acquired FTSI, SSP LLC and Great Plains and have completed over 20 acquisitions over the past 20 years.
Competition
There are numerous large and small producers in all sand producing regions of the United States with whom we compete. Our main competitors in the raw frac sand market include Badger Mining Corporation, Ceramics Inc., Emerge Energy Services LP, Hi-Crush Partners, LP, Preferred Sands LLC, Unimin Corporation and U.S. Silica Holdings, Inc. Many new entrants to the raw frac sand market primarily compete on an FOB-plant basis and lack comparable transportation infrastructure to meet customer demands in-basin. Our main competitors in the coated products market include Momentive Performance Materials Inc., Unimin Corporation, Atlas Resin Proppants LLC, Preferred Sands LLC and CARBO Ceramics Inc. The most important factors on which we compete in both markets are product quality, performance and sand and proppant characteristics, transportation capabilities, proximity of supply to well site, reliability of supply and price. Our only substantial competitors across both markets are Unimin Corporation and Badger Mining Corporation (which owns Atlas Resin Proppants LLC). We believe we are uniquely positioned to utilize our scale of raw sand production to supply high-quality substrate for coated products and leverage our transportation infrastructure for reliable delivery in-basin.
Due to increased demand for sand based proppants in recent years, there has been an increase in the number of frac sand producers. Moreover, as a result of this increased demand, existing frac sand producers have added to or expanded their frac sand production capacity, thereby increasing competition. Demand for sand-based proppants is closely linked to proppant consumption patterns for the completion of oil and natural gas wells in North America. These consumption patterns in a particular basin are influenced by numerous factors, including the price for hydrocarbons, the drilling rig count and hydraulic fracturing activity levels, including the number of stages completed and the amount of proppant used per stage. Further, these consumption patterns are also influenced by the location, quality, selling price and availability of sand-based proppants and other types of proppants such as ceramic proppant. Selling prices for sand-based proppants vary by basin and are determined based on supply and demand dynamics within each basin.
Competitors in the I&R markets include some of our larger proppant competitors such as Unimin Corporation and U.S. Silica Holdings, Inc. but also typically include smaller, local or regional producers of sand and gravel.
Intellectual Property
Our intellectual property primarily consists of patents, trade secrets, know-how, trademarks, including our name “Fairmount Santrol”, and products such as “PowerProp”, “Propel SSP” (patent pending), “HyperProp” and “CoolSet.” The Company holds numerous U.S. and foreign granted patents that are still in force as well as many U.S. and foreign patent applications that are still pending. We own patents on each of our major, differentiated proppant product lines, except CoolSet. We have not granted any third-party rights with respect to our patents. The majority of our patents have an expiration date after 2025. We have not yet filed a patent for CoolSet and our patents for HyperProp have recently expired. With respect to trade secrets and know how, our extensive experience with a variety of different products enables us to offer our customers a wide range of proppants for their particular application.
Employees
As of June 30, 2014, we employed a workforce of 1,113 employees. We believe our culture of “People, Planet and Prosperity” has enabled us to achieve a long-tenured workforce and good relations with our workforce.
89
Table of Contents
We maintain an active dialogue with employees and provide salaried and hourly employees a comprehensive benefits package including medical, life and accidental insurance, as well as educational assistance and incentive bonus programs. We offer an employee stock bonus plan and a 401(k) plan, covering substantially all non-union employees. Additionally, we maintain various other forms of retirement plans, including an employee supplemental executive retirement plan.
As of June 30, 2014, approximately 136 of our 1,018 domestic employees are parties to collective bargaining contracts. We believe we have strong relationships with and maintain an active dialogue with union representatives. We have historically been able to successfully extend and renegotiate collective bargaining agreements as they expire.
Seasonality
Our business is affected to some extent by seasonal fluctuations in weather that impact our production levels and our customers’ business needs. For example, our proppant sales levels are lower in the first and fourth quarters due to lower market demand as adverse weather tends to slow oil and gas operations to varying degrees depending on the severity of the weather. Our inability to mine and process frac sand year round in our surface mines in Wisconsin and our Minnesota and Ohio operations results in a seasonal build-up of inventory as we excavate excess sand to build a stockpile that will feed our drying facilities during the winter months. Additionally, in the second and third quarters, we sell more sand to our customers in the I&R end markets due to the seasonal rise in demand driven by more favorable weather conditions.
Legal Proceedings
We and/or our predecessors have been named as a defendant, usually among many defendants, in numerous products liability lawsuits brought by or on behalf of current or former employees of our customers alleging damages caused by silica exposure. As of June 30, 2014, we were the subject to approximately 46 active silica exposure claims. Almost all of the claims pending against us arise out of the alleged use of our silica products in foundries or as an abrasive blast media and have been filed in the states of Texas, Mississippi, Kentucky and Illinois, although some cases have been brought in many other jurisdictions over the years. In accordance with our insurance obligations, these claims are being defended by our subsidiaries’ insurance carriers, subject to our payment of approximately 7% of the defense costs. We believe that our level of existing and available insurance coverage combined with various open indemnities is sufficient to cover any exposure to silicosis-related expenses. Should our insurance coverage or indemnities prove to be insufficient or unavailable, it could have an adverse effect on our business, reputation, financial condition, cash flows and prospects.
Regulation and Legislation
Mining and Workplace Safety
Federal Regulation
The U.S. Mine Safety and Health Administration (“MSHA”) is the primary regulatory organization governing the commercial silica industry. Accordingly, MSHA regulates quarries, surface mines, underground mines and the industrial mineral processing facilities associated with quarries and mines. The mission of MSHA is to administer the provisions of the Federal Mine Safety and Health Act of 1977 and to enforce compliance with mandatory safety and health standards. MSHA works closely with the Industrial Minerals Association, a trade association, in pursuing this mission. As part of MSHA’s oversight, representatives perform at least two unannounced inspections annually for each above-ground facility. To date these inspections have not resulted in any citations for material violations of MSHA standards.
90
Table of Contents
We also are subject to the requirements of the U.S. Occupational Safety and Health Act (“OSHA”) and comparable state statutes that regulate the protection of the health and safety of workers. In addition, the OSHA Hazard Communication Standard requires that information be maintained about hazardous materials used or produced in operations and that this information be provided to employees, state and local government authorities and the public. OSHA regulates users of commercial silica and provides detailed regulations requiring employers to protect employees from overexposure to silica through the enforcement of permissible exposure limits.
Internal Controls
We adhere to a strict occupational health program aimed at controlling exposure to silica dust, which includes dust sampling, a respiratory protection program, medical surveillance, training and other components. Our safety program is designed to ensure compliance with the standards of our Occupational Health and Safety Manual and MSHA regulations. For both health and safety issues, extensive training is provided to employees. We have safety committees at our plants made up of salaried and hourly employees. We perform annual internal health and safety audits and conduct semi-annual crisis management drills to test our plants’ abilities to respond to various situations. Health and safety programs are administered by our corporate health and safety department with the assistance of plant Environmental, Health and Safety Coordinators.
Environmental Matters
We and the proppant industry are subject to extensive governmental regulation on, among other things, matters such as permitting and licensing requirements, plant and wildlife protection, hazardous materials, air and water emissions and environmental contamination and reclamation. A variety of federal, state, and local agencies implement and enforce these regulations.
Federal Regulation
At the federal level, we may be required to obtain permits under Section 404 of the Clean Water Act from the U.S. Army Corps of Engineers for the discharge of dredged or fill material into waters of the United States, including wetlands and streams, in connection with our operations. We also may be required to obtain permits under Section 402 of the Clean Water Act from the EPA (or the relevant state environmental agency in states where the permit program has been delegated to the state) for discharges of pollutants into waters of the United States, including discharges of wastewater or storm water runoff associated with construction activities. Failure to obtain these required permits or to comply with their terms could subject us to administrative, civil and criminal penalties as well as injunctive relief.
The U.S. Clean Air Act and comparable state laws regulate emissions of various air pollutants through air emissions permitting programs and the imposition of other requirements, such as monitoring and reporting requirements. These regulatory programs may require us to install expensive emissions abatement equipment, modify our operational practices and obtain permits for our existing operations, and before commencing construction on a new or modified source of air emissions, such laws may require us to obtain pre-approval for the construction or modification of certain projects or facilities extended to produce or significantly increase air emissions. In addition, air permits are required for our processing and terminal operations, and our frac sand mining operations that result in the emission of regulated air contaminants. Obtaining air emissions permits has the potential to delay the development or continued performance of our operations. As a result, we may be required to incur increased capital and operating costs because of these regulations. We could be subject to administrative, civil and criminal penalties as well as injunctive relief for noncompliance with air permits or other requirements of the U.S. Clean Air Act and comparable state laws and regulations.
Methane, a primary component of natural gas, and carbon dioxide, a byproduct of the burning of natural gas, are examples of greenhouse gases (“GHGs”). In recent years, the U.S. Congress has considered legislation to
91
Table of Contents
reduce emissions of GHGs. It presently appears unlikely that comprehensive climate legislation will be passed by either house of Congress in the near future, although energy legislation and other regulatory initiatives are expected to be proposed that may be relevant to GHG emissions issues.
Independent of Congress, the EPA has adopted regulations controlling GHG emissions under its existing authority under the CAA. In 2009, the EPA officially published its findings that emissions of carbon dioxide, methane and other GHGs present an endangerment to human health and the environment because emissions of such gases are, according to the EPA, contributing to warming of the earth’s atmosphere and other climatic changes. These findings by the EPA allow the agency to proceed with the adoption and implementation of regulations that would restrict emissions of GHGs under existing provisions of the CAA. For example, in 2009, the EPA issued a final rule requiring the annual reporting of GHG emissions from specified large GHG emission sources. In 2010, the EPA published a final rule expanding its existing GHG emissions reporting rule for certain petroleum and natural gas facilities that emit 25,000 metric tons or more of carbon dioxide equivalent per year. The rule requires reporting of GHG emissions by such regulated facilities to the EPA annually. The EPA also requires certain large stationary sources that are already subject to permitting requirements under the CAA to obtain permits for GHG emissions as well.
Although it is not currently possible to predict how any proposed or future GHG legislation or regulation by Congress, the EPA, the states or multi-state regions will impact our business, any legislation or regulation of GHG emissions that may be imposed in areas in which we conduct business could result in increased compliance costs or additional operating restrictions or reduced demand for our services, and could have a material adverse effect on our business, financial condition and results of operations.
As part of our operations, we utilize or store petroleum products and other substances such as diesel fuel, lubricating oils and hydraulic fluid. We are subject to regulatory programs pertaining to the storage, use, transportation and disposal of these substances, including Spill Prevention, Control and Countermeasure planning requirements. Spills or releases may occur in the course of our operations, and we could incur substantial costs and liabilities as a result of such spills or releases, including those relating to claims for damage or injury to property and persons. Additionally, some of our operations are located on properties that historically have been used in ways that resulted in the release of contaminants, including hazardous substances, into the environment, and we could be held liable for the remediation of such historical contamination. The Comprehensive Environmental Response, Compensation, and Liability Act (“CERCLA,” also known as the Superfund law) and comparable state laws impose joint and several liability, without regard to fault or legality of conduct, on classes of persons who are considered to be responsible for the release of hazardous substances into the environment. These persons include the owner or operator of the site where the release occurred and anyone who disposed or arranged for the disposal of a hazardous substance released at the site. Under CERCLA, such persons may be subject to liability for the costs of cleaning up the hazardous substances, for damages to natural resources, and for the costs of certain health studies. In addition, it is not uncommon for neighboring landowners and other third parties to file claims for personal injury and property damage allegedly caused by the hazardous substances released into the environment.
In the course of our operations, we generate industrial solid wastes that may be regulated as hazardous wastes. The Resource Conservation and Recovery Act (“RCRA”) and comparable state statutes regulate the generation, transportation, treatment, storage, disposal and cleanup of hazardous and non-hazardous wastes. The EPA and the individual states to which the EPA has delegated portions of the RCRA program for local implementation, administer the RCRA program.
In September 2013, the EPA issued RCRA consent orders to several companies, including us, in connection with historic contamination of residential drinking water wells near the Wedron, Illinois facility. The EPA identified benzene and other volatile organic compounds in some drinking water wells, some (including benzene) in excess of established standards. The consent orders required the companies to analyze soil conditions at their sites to determine whether operations at their sites are potential sources of groundwater contamination. We completed the
92
Table of Contents
study for our site, and our consultant submitted a site conditions report to the EPA in August 2014, which report concluded that our current operations at the site are not a source of groundwater impacts in the Wedron community. The report recommended that no further work should be required under the consent order. We have also submitted a work plan to the Illinois Environmental Protection Agency to perform additional investigation of potential releases of petroleum at the Wedron facility south of the residential areas of the community. If the government agencies do require us to conduct any additional work or remediation that could increase our costs, and depending on the scope of any such additional work (if any), could be material.
Although we do not directly engage in hydraulic fracturing activities, we supply sand-based proppants to hydraulic fracturing operators in the oil and natural gas industry. Hydraulic fracturing involves the injection of water, sand and chemicals, under pressure, into the formation to fracture the surrounding rock and stimulate production. The hydraulic fracturing process is typically regulated by state or local governmental authorities. However, the practice of hydraulic fracturing has become controversial in some areas and is undergoing increased scrutiny. Several federal agencies and regulatory authorities are investigating the potential environmental impacts of hydraulic fracturing and whether additional regulation may be necessary. The U.S. Environmental Protection Agency has asserted limited federal regulatory authority over hydraulic fracturing and has indicated it may seek to further expand its regulation of hydraulic fracturing. The Bureau of Land Management has proposed regulations applicable to hydraulic fracturing conducted on federal and Indian oil and gas leases. Congress has from time to time considered the adoption of legislation to provide for federal regulation of hydraulic fracturing. In addition, various state, local and foreign governments have implemented, or are considering, increased regulatory oversight of hydraulic fracturing through additional permitting requirements, operational restrictions, disclosure requirements and temporary or permanent bans on hydraulic fracturing in certain areas such as environmentally sensitive watersheds. Numerous states have imposed disclosure requirements on hydraulic fracturing well owners and operators. Some local governments have adopted and others may seek to adopt ordinances prohibiting or regulating the time, place and manner of drilling activities in general or hydraulic fracturing activities within their jurisdictions.
The adoption of new laws or regulations at the federal, state, local or foreign levels imposing reporting obligations on, or otherwise limiting or delaying, the hydraulic fracturing process could make it more difficult to complete oil and natural gas wells, increase our customers’ costs of compliance and doing business, and otherwise adversely affect the hydraulic fracturing services they perform, which could negatively impact demand for our sand-based proppants.
Our operations may also be subject to broad environmental review under the National Environmental Policy Act (“NEPA”). NEPA requires federal agencies to evaluate the environmental impact of all “major federal actions” significantly affecting the quality of the human environment. The granting of a federal permit for a major development project, such as a mining operation, may be considered a “major federal action” that requires review under NEPA. Therefore, our projects may require review and evaluation under NEPA. As part of this evaluation, the federal agency considers a broad array of environmental impacts, including, among other things, impacts on air quality, water quality, wildlife (including threatened and endangered species), historical and archeological resources, geology, socioeconomics and aesthetics. NEPA also requires the consideration of alternatives to the project. The NEPA review process, especially the preparation of a full environmental impact statement, can be time consuming and expensive. The purpose of the NEPA review process is to inform federal agencies’ decision-making on whether federal approval should be granted for a project and to provide the public with an opportunity to comment on the environmental impacts of a proposed project. Though NEPA requires only that an environmental evaluation be conducted and does not mandate a result, a federal agency could decide to deny a permit, or impose certain conditions on its approval, based on its environmental review under NEPA, or a third party may challenge the adequacy of a NEPA review and thereby delay the issuance of a federal permit or approval.
Federal agencies granting permits for our operations also must consider impacts to endangered and threatened species and their habitat under the Endangered Species Act. We also must comply with and are
93
Table of Contents
subject to liability under the Endangered Species Act, which prohibits and imposes stringent penalties for the harming of endangered or threatened species and their habitat. Some of our operations are conducted in areas where protected species or their habitats are known to exist. In these areas, we may be obligated to develop and implement plans to avoid potential adverse effects to protected species and their habitats, and we may be prohibited from conducting operations in certain locations or during certain times, such as breeding and nesting seasons, when our operations could have an adverse effect on the species. Federal agencies also must consider a project’s impacts on historic or archeological resources under the National Historic Preservation Act, and we may be required to conduct archeological surveys of project sites and to avoid or preserve historical areas or artifacts.
State and Local Regulation
Because our operations are located in numerous states, we are also subject to a variety of different state and local environmental review and permitting requirements. Some states in which our projects are located or are being developed have state laws similar to NEPA; thus our development of new sites or the expansion of existing sites may be subject to comprehensive state environmental reviews even if it is not subject to NEPA. In some cases, the state environmental review may be more stringent than the federal review. Our operations may require state-law based permits in addition to federal permits, requiring state agencies to consider a range of issues, many the same as federal agencies, including, among other things, a project’s impact on wildlife and their habitats, historic and archaeological sites, aesthetics, agricultural operations and scenic areas. Some states also have specific permitting and review processes for commercial silica mining operations, and states may impose different or additional monitoring or mitigation requirements than federal agencies. The development of new sites and our existing operations also are subject to a variety of local environmental and regulatory requirements, including land use, zoning, building and transportation requirements.
As demand for sand-based proppants in the oil and natural gas industry has driven a significant increase in current and expected future production of silica sand, some local communities have expressed concern regarding silica sand mining operations. These concerns have generally included exposure to ambient silica sand dust, truck traffic, water usage and blasting. In response, certain state and local communities have developed or are in the process of developing regulations or zoning restrictions intended to minimize dust from getting airborne, control the flow of truck traffic, significantly curtail the amount of practicable area for mining activities, require compensation to local residents for potential impacts of mining activities and, in some cases, ban issuance of new permits for mining activities. To date, we have not experienced any material impact to our existing mining operations or planned capacity expansions as a result of these types of concerns. We are not aware of any proposals for significant increased scrutiny on the part of state or local regulators in the jurisdictions in which we operate or community concerns with respect to our operations that would reasonably be expected to have a material adverse effect on our business, financial condition or results of operations going forward.
Planned expansion of our mining and production capacity or construction and operation of related facilities in new communities could be more significantly impacted by increased regulatory activity. Difficulty or delays in obtaining or inability to obtain new mining permits or increased costs of compliance with future state and local regulatory requirements could have a material negative impact on our ability to grow our business. In an effort to minimize these risks, we continue to be engaged with local communities in order to grow and maintain strong relationships with residents and regulators.
Costs of Compliance
We may incur significant costs and liabilities as a result of environmental, health and safety requirements applicable to our activities. Failure to comply with environmental laws and regulations may result in the assessment of administrative, civil and criminal penalties, imposition of investigatory, cleanup and site restoration costs and liens, the denial or revocation of permits or other authorizations and the issuance of injunctions to limit or cease
94
Table of Contents
operations. Compliance with these laws and regulations may also increase the cost of the development, construction and operation of our projects and may prevent or delay the commencement or continuance of a given project. In addition, claims for damages to persons or property may result from environmental and other impacts of our activities. In addition, the clear trend in environmental regulation is to place more restrictions on activities that may affect the environment, and thus, any changes in, or more stringent enforcement of, these laws and regulations that result in more stringent and costly pollution control equipment, waste handling, storage, transport, disposal or remediation requirements could have a material adverse effect on our operations and financial position.
The process for performing environmental impact studies and reviews for federal, state and local permits for our operations involves a significant investment of time and monetary resources. We cannot control the permit approval process. We cannot predict whether all permits required for a given project will be granted or whether such permits will be the subject of significant opposition. The denial of a permit essential to a project or the imposition of conditions with which it is not practicable or feasible to comply could impair or prevent our ability to develop a project. Significant opposition by neighboring property owners, members of the public or other third parties, as well as any delay in the environmental review and permitting process, could impair or delay our ability to develop or expand a project. Additionally, the passage of more stringent environmental laws could impair our ability to develop new operations and have an adverse effect on our financial condition and results of operations.
95
Table of Contents
Directors and Executive Officers
The following table sets forth the names, ages and titles of our directors and executive officers as of June 30, 2014:
| Name |
Age | Title | ||||
| Jenniffer D. Deckard |
48 | President and Chief Executive Officer and Director | ||||
| Christopher L. Nagel |
52 | Chief Financial Officer and Vice President of Finance | ||||
| Joseph D. Fodo |
57 | Executive Vice President and Chief Operating Officer | ||||
| Van T. Smith |
45 | Executive Vice President | ||||
| Gerald L. Clancey |
44 | Executive Vice President | ||||
| William E. Conway |
86 | Director | ||||
| Charles D. Fowler |
68 | Director | ||||
| William P. Kelly |
64 | Director | ||||
| Matthew F. LeBaron |
43 | Director | ||||
| Michael E. Sand |
32 | Director | ||||
| Lawrence N. Schultz |
66 | Director | ||||
Set forth below is the description of the backgrounds of our directors and executive officers.
Jenniffer D. Deckard. Ms. Deckard has served as our President and Chief Executive Officer since 2013. Previously, Ms. Deckard served as our President from January 2011 until May 2013, our Vice President of Finance and Chief Financial Officer from 1999 until 2011, our Corporate Controller from 1996 to 1999 and our Accounting Manager from 1994 until 1996. In her local community, Ms. Deckard serves on the Boards of Directors for the Cleveland Foundation, the Greater Cleveland Partnership, the Chardon Healing Fund, and the First Tee of Cleveland. She also serves on the Case Western Weatherhead School of Management’s Visiting Committee and the Board of Directors for the Fairmount Santrol Foundation. Ms. Deckard received a B.S. from the University of Tulsa and an MBA from Case Western Reserve University. We believe that Ms. Deckard’s experience in a variety of roles in the Company, and her contributions to its continued growth, qualify her to serve on our board of directors.
Christopher L. Nagel. Mr. Nagel has served as the Chief Financial Officer of Fairmount Santrol since joining the Company in June 2011. Prior to joining Fairmount, Mr. Nagel was the Chief Financial Officer of Enesco, Inc. from 2010 until May 2011. He was the Chief Financial Officer of FreightCar America from 2009 until 2010. Mr. Nagel has previously held management positions at Wallick Companies and Scotts MiracleGro. Mr. Nagel received a B.S. from Ohio State University and holds a CPA (inactive).
Joseph D. Fodo. Mr. Fodo has served as our Executive Vice President and Chief Operating Officer since January 2011. Previously, Mr. Fodo served as our Vice President of Operations from January 2002 until January 2011 and Director of Operations and Vice President of Operations within the Industrial Sand Division, from October 1999 until January 2002. Prior to joining the company, Mr. Fodo was Vice President of Operations for Oglebay Norton. He currently serves as the Chairman of the Sustainable Development Task Force for The Industrial Minerals Association of North America. Mr. Fodo received a B.S. in Mining Engineering from Ohio State University.
Van T. Smith. Mr. Smith has served as our Executive Vice President of Santrol since 2012. Previously, Mr. Smith served as Vice President of Santrol from 2010 until 2012 and Corporate Account Manager of Santrol from 2007 until 2010. Prior to 2007, Mr. Smith served in a variety of technical and sales roles since joining the company in 1991. He is as an active member of the Society of Petroleum Engineers and currently serves on Fairmount Santrol’s advisory committee for sustainable development. Mr. Smith received a B.S. from the University of Virginia and an Executive M.B.A. from Rice University.
96
Table of Contents
Gerald L. Clancey. Mr. Clancey has served as our Executive Vice President of Supply Chain and I&R since 2011. Mr. Clancey previously served as Vice President of Sales for the Industrial and Recreational Markets from 2002 to 2011 and as General Sales Manager for our TechniSand resin coated foundry division from 1998 to 2002. He has served on the Board of Directors for the Foundry Educational Foundation and was the President of the foundation for the 2009 to 2010 term. Mr. Clancey received a B.S. from Kent State University and an M.B.A. from the University of Notre Dame.
William E. Conway. Mr. Conway has served as Chairman of the Board (emeritus) since 2010. Mr. Conway acquired Best Sand in 1978 and invested in Wedron Silica in 1984 (along with Chuck Fowler and the Wedron Silica management team). Best Sand and Wedron Silica then merged to form Fairmount Santrol in 1986, Mr. Conway served as Chairman of the Board and Chief Executive Officer from 1978 until 1996. From 1996 until 2011, he served as Chairman of the Board. Prior to entering the industrial minerals business in 1978, Mr. Conway held management positions with Pickands Mather & Co., Diamond Shamrock Corporation and Midland-Ross Corporation. Mr. Conway serves on the Board of Directors for the Cleveland Clinic Foundation, University School and Cleveland Botanical Garden, He received a B.S. from Yale University and completed the Executive M.B.A. Program at the University of California, Berkeley. We believe that Mr. Conway’s experience as a founder, President and Chief Executive Officer of the Company, as well as his broad knowledge of the proppant industry, qualify him for service on our board of directors.
Charles D. Fowler. Mr. Fowler has served as a director since 1984 and is chairman of the Executive Committee of the Board. Mr. Fowler and the Wedron Silica management team partnered with Mr. Conway in 1984 to acquire Wedron Silica Company, and ultimately to merge the two sand companies to create Fairmount Minerals in 1986. Mr. Fowler served as the President and Chief Executive Officer of Fairmount from 1996 until his retirement in 2013. Mr. Fowler serves as Chairman of the Board of Trustees of Case Western Reserve University and serves on the Board of Directors for Flying Horse Farms, DDC Clinic and the Greater Cleveland Water Alliance. He received a B.S. from Purdue University and completed the Executive M.B.A. program at Case Western University. We believe that Mr. Fowler’s experience as a founder, President and Chief Executive Officer of the Company, and his broad knowledge of the proppant industry, qualify him for service on our board of directors.
William P. Kelly. Mr. Kelly has been a member of the Board since 2005. Mr. Kelly served as Chairman and Chief Executive Officer of Unifrax Corporation from 1996 to 2006 and is currently a Board member. Mr. Kelly also sits on the Board of Smart Source computer and AV Rentals. In 2010, Mr. Kelly joined the Executive Council of American Securities. He received a B.S. degree from Alfred University and an M.B.A. from Duquesne University. He also attended the Tuck Executive Program at Dartmouth. We believe that Mr. Kelly’s executive and boardroom experience qualify him for service on our board of directors.
Matthew F. LeBaron. Mr. LeBaron has served as Chairman of the Board since 2010. Mr. LeBaron joined American Securities in 1999 and currently serves as a Managing Director. Previously, Mr. LeBaron was a private equity investor at Bain Capital, Inc. and a consultant at The Boston Consulting Group. Mr. LeBaron is Chairman of the Board of FiberMark, GT Technologies, Lakeside Energy, Liberty Tire Recycling and The United Distribution Group. He received a B.A. from Amherst College and an M.B.A. from the Harvard Business School. We believe that Mr. LeBaron’s background in finance and private equity investing and as his extensive boardroom experience qualify him to serve on our board of directors.
Michael E. Sand. Mr. Sand has served as a director since 2010. Mr. Sand joined American Securities in 2005 and currently serves as a Principal at the firm. Previously, Mr. Sand worked at Goldman Sachs, where he focused on mergers and acquisitions and strategic advisory assignments. Mr. Sand is a member of the Board of Directors of Unison Site Management. He received a B.S. from the University of Pennsylvania and an M.B.A. from Columbia University. We believe that Mr. Sand’s background in finance, private equity investing and mergers and acquisitions qualify him to serve on our board of directors.
97
Table of Contents
Lawrence N. Schultz. Mr. Schultz has been a member of the Board since 2010 and currently serves as chairman of the Audit Committee of the Board. Until June of 1978, Mr. Schultz served as an officer of Central National Bank of Cleveland, now a part of KeyBank N.A., while attending the M.B.A. and J.D. programs at Cleveland State University. He joined Calfee, Halter & Griswold L.P. in 1978 after receiving his J.D. degree from Cleveland State University. Mr. Schultz served on Calfee’s Executive Committee (from 1995) and its Management Committee (from 2005), in each case through his retirement. He served as principal outside counsel and Secretary to Agilysys, Inc., a NASDAQ listed company, from 1999 until his retirement in 2010 and serves on the Advisory Boards of L.D. Kichler Company and Austin Powder Holding Co., Inc. Mr. Schultz received his B.A. degree from Ohio Northern University in 1970. At the time of his retirement, Mr. Schultz served on the Boards and Executive Committees of University Circle Inc. and The Deaconess Foundation, including as chair of their Audit Committees, and was chairman of the Board of The Gordon Square Arts District. We believe that Mr. Schultz’s legal background and boardroom experience qualify him to serve on our board of directors.
Board of Directors
Our board of directors currently consists of seven members, Ms. Deckard and Messrs. Conway, Fowler, Kelly, LeBaron, Sand and Schultz. We anticipate that our board will determine that each of Messrs. , Conway, Kelly, LeBaron and Sand are independent under the independence standards of the NYSE.
In evaluating director candidates, we will assess whether a candidate possesses the integrity, judgment, knowledge, experience, skills and expertise that are likely to enhance the board’s ability to manage and direct our affairs and business, including, when applicable, to enhance the ability of the committees of the board to fulfill their duties. We currently are in the process of identifying individuals who meet these standards and the relevant independence requirements. Our directors hold office until the earlier of their death, resignation, retirement, disqualification or removal or until their successors have been duly elected and qualified.
In connection with the completion of this offering, our directors will be divided into three classes serving staggered three-year terms. Class I, Class II and Class III directors will serve until our annual meetings of stockholders in 2015, 2016 and 2017, respectively. We anticipate that Ms. Deckard and Mr. Kelly will be assigned to Class I, Messrs. Conway and Sand will be assigned to Class II and Messrs. LeBaron, Fowler and Schultz will be assigned to Class III. At each annual meeting of stockholders held after the initial classification, directors will be elected to succeed the class of directors whose terms have expired. This classification of our board of directors could have the effect of increasing the length of time necessary to change the composition of a majority of the board of directors. In general, at least two annual meetings of stockholders will be necessary for stockholders to effect a change in a majority of the members of the board of directors.
Committees of the Board of Directors
Upon the completion of this offering, we intend to have an audit committee, a compensation committee and a nominating and governance committee of our board of directors, and may have such other committees as the board of directors shall determine from time to time. We anticipate that each of the standing committees of the board of directors will have the composition and responsibilities described below.
Audit Committee
Our audit committee currently consists of Messrs. Schultz, Kelly and Sand. Messrs. Schultz and Kelly are independent under the rules of the SEC. As required by the rules of the SEC and listing standards of the NYSE, we expect to appoint an additional director meeting applicable audit committee independence standards within one year of the effective date of this registration statement. SEC rules also require that a public company disclose whether or not its audit committee has an “audit committee financial expert” as a member. An “audit committee financial expert” is defined as a person who, based on his or her experience, possesses the attributes outlined in such rules. At least one of our independent directors satisfies the definition of “audit committee financial expert.”
98
Table of Contents
This committee will oversee, review, act on and report on various auditing and accounting matters to our board of directors, including: the selection of our independent accountants, the scope of our annual audits, fees to be paid to the independent accountants, the performance of our independent accountants and our accounting practices. In addition, the audit committee will oversee our compliance programs relating to legal and regulatory requirements. We expect to adopt an audit committee charter defining the committee’s primary duties in a manner consistent with the rules of the SEC and applicable stock exchange or market standards.
Compensation Committee
Our compensation committee currently consists of Messrs. Conway, Kelly and LeBaron all of whom are “independent” under the rules of the SEC. This committee will establish salaries, incentives and other forms of compensation for officers and other employees. Our compensation committee will also administer our incentive compensation and benefit plans. We expect to adopt a compensation committee charter defining the committee’s primary duties in a manner consistent with the rules of the SEC and applicable stock exchange or market standards.
Nominating and Corporate Governance Committee
Our nominating and corporate governance committee currently consists of Messrs. Conway, Kelly and Sand. Messrs. Conway and Kelly are independent under the rules of the SEC. This committee will identify, evaluate and recommend qualified nominees to serve on our board of directors, develop and oversee our internal corporate governance processes and maintain a management succession plan. We expect to adopt a nominating and corporate governance committee charter defining the committee’s primary duties in a manner consistent with the rules of the SEC and applicable stock exchange or market standards.
Compensation Committee Interlocks and Insider Participation
None of our executive officers serve on the board of directors or compensation committee of a company that has an executive officer that serves on our board or compensation committee. No member of our board is an executive officer of a company in which one of our executive officers serves as a member of the board of directors or compensation committee of that company.
Code of Business Conduct and Ethics
Prior to the completion of this offering, our board of directors will adopt a code of business conduct and ethics applicable to our employees, directors and officers, in accordance with applicable U.S. federal securities laws and the corporate governance rules of the NYSE. Any waiver of this code may be made only by our board of directors and will be promptly disclosed as required by applicable U.S. federal securities laws and the corporate governance rules of the NYSE.
Corporate Governance Guidelines
Prior to the completion of this offering, our board of directors will adopt corporate governance guidelines in accordance with the corporate governance rules of the NYSE.
99
Table of Contents
2013 Summary Compensation Table
The following table summarizes the compensation awarded to, earned by, or paid to our principal executive officer and our next two most highly-compensated executive officers (our “Named Executive Officers”) for the year ended December 31, 2013. All numbers included in this Executive Compensation disclosure below are represented without reflecting our stock split.
| Name and Principal Position |
Year | Salary | Option Awards (1) |
Non-Equity Incentive Plan Compensation (2) |
All
Other Compensation (3) |
Total | ||||||||||||||||||
| Jenniffer D. Deckard, President and Chief Executive Officer |
2013 | $ | 360,500 | $ | 473,050 | $ | 173,490 | $ | 39,909 | $ | 1,046,949 | |||||||||||||
| Christopher L. Nagel, Executive Vice President and Chief Financial Officer |
2013 | $ | 318,270 | $ | 473,050 | $ | 153,321 | $ | 28,641 | $ | 973,282 | |||||||||||||
| Joseph D. Fodo, Executive Vice President, Chief of Operations |
2013 | $ | 275,834 | $ | 473,050 | $ | 133,053 | $ | 39,362 | $ | 921,299 | |||||||||||||
| (1) | Amounts reported in this column reflect the aggregate grant date fair value of stock options that vest based on either time or performance metrics, computed in accordance with FASB ASC Topic 718, for awards made to each Named Executive Officer during 2013. See Note 15 to our consolidated financial statements for the year ended December 31, 2013 for additional detail regarding assumptions underlying the value of these equity awards. |
| (2) | Reflects amounts earned for services performed in 2013 pursuant to our annual cash incentive program, which amounts were paid during the first quarter of 2014. This amount also includes a safety bonus payment received by each Named Executive Officer for 2013. Ms. Deckard, Mr. Nagel, and Mr. Fodo each received a safety bonus payment in the amount of $1,315. |
| (3) | Amounts reported in the “All Other Compensation” column include company contributions on the Named Executive Officers’ behalf to our 401(k) retirement plan, employee stock bonus plan, and supplemental executive retirement plan, as well as the cost of providing supplemental life insurance, supplemental disability insurance, car allowance amounts and club dues, as shown in the following table: |
| Name |
401(k)
Plan Contributions(1) |
Employee Stock Bonus Plan(2) |
Supplemental Executive Retirement Plan(3) |
Life Insurance(4) |
Disability Insurance(5) |
Car Allowance(6) |
Club Dues(7) |
Total | ||||||||||||||||||||||||
| Jenniffer D. Deckard |
$ | 6,375 | $ | 11,705 | $ | 5,936 | $ | 4,453 | $ | 271 | — | $ | 11,169 | $ | 39,909 | |||||||||||||||||
| Christopher L. Nagel |
— | $ | 11,705 | $ | 3,876 | $ | 961 | — | — | $ | 12,099 | $ | 28,641 | |||||||||||||||||||
| Joseph D. Fodo |
$ | 6,375 | $ | 11,705 | $ | 1,807 | $ | 7,341 | $ | 842 | $ | 11,292 | — | $ | 39,362 | |||||||||||||||||
| (1) | Amounts included in this column represent the value of our match of the Named Executive Officers’ contributions in 2013 to the Fairmount Minerals Retirement Savings Trust and Plan, which we refer to as our “401(k) plan.” |
| (2) | Amounts included in this column represent the value of our contributions on behalf of each Named Executive Officer to the Fairmount Minerals Employee Stock Bonus Trust and Plan for services provided during 2013, which we refer to as our “stock bonus plan.” |
| (3) | Amounts included in this column represent the value of company contributions on behalf of each Named Executive Officer under the Fairmount Minerals Supplemental Executive Retirement Plan for services provided during 2013, which we refer to as the “supplemental executive retirement plan.” |
100
Table of Contents
| (4) | Amounts included in this column represent the cost of supplemental life insurance premiums paid by us in 2013 on behalf of each Named Executive Officer. |
| (5) | Amounts included in this column represent the cost of supplemental disability insurance premiums paid by us in 2013 on behalf of each Named Executive Officer. |
| (6) | The amount included in this column represents the full car allowance paid by us in 2013 to Mr. Fodo. |
| (7) | Amounts included in this column represent the full amount of the club dues and associated initiation fee, if applicable, paid by us on behalf of Ms. Deckard and Mr. Nagel. |
Base Salary
Each Named Executive Officer’s base salary is a fixed component of compensation each year for performing specific job duties and functions. Historically, our compensation committee established the annual base salary rate for our Chief Executive Officer. As for the other Named Executive Officers, the compensation committee of our board of directors has established the annual base salary rate at a level necessary to retain the individual’s services, and reviews base salaries on an annual basis in consultation with the Chief Executive Officer, as well as at the time of any promotion or significant change in job responsibility. The compensation committee has historically made adjustments to the base salary rates of the Named Executive Officers upon consideration of any factors that it deems relevant, including but not limited to: (a) any increase or decrease in the executive’s responsibilities, (b) the executive’s job performance, and (c) the level of compensation paid to executives of other companies with which we compete for executive talent, as estimated based on publicly available information and the experience of members of our board of directors and our Chief Executive Officer. The base salary paid to each Named Executive Officer in the 2013 fiscal year is reported in the Summary Compensation Table above.
Annual Bonus
The goal of our annual bonus program is to incentivize our employees and executives to achieve certain performance objectives. Our compensation committee works with our Chief Executive Officer to establish a target bonus for each of our Named Executive Officers. Our compensation committee establishes the target bonus level for our Chief Executive Officer. For 2013 the target bonus for each of our Named Executive Officers was 60% of base salary. The amount of that target bonus actually paid to each Named Executive Officer in any given year is dependent upon the extent to which we achieve the performance objectives established under the annual bonus program for that year.
In an effort to create a set of clear, concise, effective and measurable performance indicators which are most directly correlated to value creation and sustainable corporate growth, we carefully selected two performance metric categories to make up the annual cash bonus program for 2013: (i) sustainable development, and (ii) EBITDA. The relative weighting of these performance metrics is established by the compensation committee after reviewing recommendations from the management team. In 2013, each was weighted equally.
Sustainable development objectives are set at the beginning of the year by each of our thirteen sustainable development teams and approved by the Sustainable Development Advisory Committee. Following the end of the year, each of those teams calculates the percentage of their sustainable development objective that was achieved during the year and submits that analysis to our Sustainable Development Advisory Committee, which reviews and analyzes the performance of each sustainable development team. Once the performance percentages have been reviewed and approved, all thirteen team performance percentages are averaged to calculate the total sustainable development performance percentage. Each of the thirteen sustainable development performance percentages are capped at 125% of objective, with a floor of 0% of each objective, as is the overall sustainable development performance percentage. The overall sustainable development performance percentage is then presented to and approved by the compensation committee. Examples of sustainable development objectives established by our sustainable development teams and used during the 2013 Fiscal Year include the development
101
Table of Contents
of a five year water management and reduction plan and the reduction of year-end solid waste volume by 50% compared to the 2012 fiscal year.
Before the beginning of each year, the board of directors works with our management team to establish a budget for our company for the next year. Once the budget has been approved, our compensation committee approves the threshold level of EBITDA that will result in any payment with respect to the EBITDA performance metric as well as the performance percentage applicable to varying levels of EBITDA performance above and below that threshold level for the upcoming year. At the end of each year the compensation committee works with management to approve their recommendation as to the performance percentage achieved based on our actual EBITDA performance as compared to budget. The chart below outlines the levels of achievement of budgeted EBITDA and correlating performance percentages established by the compensation committee for years after 2013. Performance between the levels outlined below will be calculated using straight line interpolation.
| Percentage of Budgeted EBITDA Achieved |
Performance Percentage for
EBITDA Performance Metric | |
| 85.0% |
0.0% | |
| 86.6% |
10.8% | |
| 88.0% |
19.7% | |
| 89.3% |
28.6% | |
| 90.6% |
37.6% | |
| 92.0% |
46.5% | |
| 93.3% |
55.4% | |
| 94.6% |
64.3% | |
| 96.0% |
73.2% | |
| 97.3% |
82.2% | |
| 98.7% |
91.1% | |
| 100.0% |
100.0% | |
| 101.3% |
116.4% | |
| 102.7% |
132.8% | |
| 104.0% |
149.2% | |
| 105.4% |
165.6% | |
| 106.7% |
182.0% |
In order to calculate the amount of the annual bonus payable to each of our Named Executive Officers under the annual bonus plan, the average of the performance percentage for sustainable development is multiplied by one-half of the Named Executive Officer’s target bonus amount, and the performance percentage for EBITDA is multiplied by one-half of each Named Executive Officer’s target bonus amount. The sum of these two amounts is equivalent to the actual bonus earned. Notwithstanding the above, the compensation committee retains the authority to increase or decrease the amount of the actual bonuses paid under the annual bonus program. The Named Executive Officers must generally be employed on the date the awards are actually paid in order to receive payment.
In 2013, the board of directors adopted a pro forma budget as a result of certain acquisitions, and the compensation committee used its discretion to apply the performance percentages and EBITDA achievement levels established earlier in the year to the EBITDA level used in the pro forma budget rather than the original budgeted EBITDA levels. The final EBITDA performance percentage was 67% of the pro forma EBITDA target and the overall sustainable development performance percentage was approximately 92%, resulting in a total payout of 80% of target bonus. As a result, each Named Executive Officer was eligible for approximately 80% (the average of the EBITDA and sustainable development performance percentages) of his or her target bonus subject to the discretion of the compensation committee.
102
Table of Contents
Safety Bonus
Additionally, our Named Executive Officers are eligible for a safety bonus payment of up to $1,800 per year. Such bonus payments are payable in equal monthly installments and calculated based on three equally weighted categories: 1) individual safety, 2) facility safety, and 3) overall safety record of the company. Each monthly installment is decreased if an incident/accident occurs. The amount of the decrease is dependent on how many of the aforementioned categories are applicable to the accident, with each category reducing the payment by one-third.
The total amount paid under the annual bonus program and the safety bonus program to each of our Named Executive Officers is enumerated in the Non-Equity Incentive Plan Compensation column of the Summary Compensation Table, above.
Option Awards
On December 7, 2010, in order to incentivize our management, employees, and directors to continue to grow and develop our business, the board of directors adopted our current LTIP, the FML Holdings, Inc. Stock Option Plan (the “2010 Plan”), for the officers, employees, and consultants of our company and its subsidiaries who perform services for us. Unless earlier terminated, the term of the 2010 Plan will continue for a period of ten years after adoption. There are 350,000 shares of our common stock reserved for issuance under the 2010 Plan. As of June 30, 2014, 21,550 shares remain available for issuance under the plan and 328,450 shares are subject to outstanding stock options. The 2010 Plan allows for the issuance of either nonqualified stock options or incentive stock options; however, all options granted under the 2010 Plan as of December 31, 2013 have been nonqualified stock options.
In December 2013, our Chief Executive Officer evaluated the performance of each Named Executive Officer (other than herself) in order to make recommendations to the compensation committee regarding the number of stock options to be granted to each of the Named Executive Officers under the 2010 Plan for the 2013 fiscal year. When determining the size and terms of the stock option awards granted to our Named Executive Officers in December 2013, our compensation committee considered our Chief Executive Officer’s recommendations along with other factors that include, but are not limited to, overall company performance, each executive’s level and scope of responsibility, and the compensation paid to similarly situated executives of companies with which we compete for executive talent (to the extent such information is publically available).
The option awards granted to our Named Executive Officers under the 2010 Plan during 2013 will be fully vested and exercisable on the seventh anniversary of the grant date, provided that the Named Executive Officers continue to provide services to us through that date. However, if EBITDA for a year prior to the seventh anniversary equals or exceeds the annual or cumulative target enumerated in the option agreement, all or a portion of the option may become vested and exercisable prior to the seven year anniversary. All stock options granted under the 2010 Plan expire on the tenth anniversary of the grant date. For additional information regarding the terms of the 2010 Plan and award agreements issued to our Named Executive Officers thereunder please see the section below entitled “—Additional Narrative Disclosure—Stock Options.
Other Compensation Elements
We offer participation in broad-based retirement, health and welfare plans to all of our employees. We currently maintain a retirement plan intended to provide benefits under Section 401(k) of the Internal Revenue Code (the “Code”) where employees, including our Named Executive Officers, are allowed to contribute portions of their base compensation and bonus payments to a tax-qualified retirement account. We also maintain a defined contribution profit sharing plan for the benefit of all of our employees as well as a separate supplemental executive retirement plan. See “Additional Narrative Disclosure—Retirement Benefits” for more information. In addition, minimal perquisites have historically been provided to our Named Executive Officers, including a car
103
Table of Contents
allowance and club dues. Details regarding these perquisites and the value of all such benefits provided during 2013 are available in the notes to the column of the Summary Compensation Table entitled “All Other Compensation”.
Outstanding Equity Awards at Fiscal Year-End
The following table reflects information regarding outstanding equity-based awards held by our Named Executive Officers as of December 31, 2013.
| Option Awards | ||||||||||||||||
| Name (a) |
Number of Securities Underlying Unexercised Options (#) Exercisable (b) |
Equity Incentive Plan Awards: Number of Securities Underlying Unexercised Unearned Options (#) (d) (2) |
Option Exercise Price ($) (e) |
Option Expiration Date (f) |
||||||||||||
| Jenniffer Deckard |
12,000 | (1) | — | $ | 48.40 | 10/22/2019 | ||||||||||
| 4,500 | 3,000 | $ | 121.05 | 12/7/2020 | ||||||||||||
| — | 2,500 | $ | 355.40 | 12/10/2023 | ||||||||||||
| Christopher Nagel |
4,500 | 3,000 | $ | 193.10 | 5/31/2021 | |||||||||||
| — | 2,500 | $ | 355.40 | 12/10/2023 | ||||||||||||
| Joseph Fodo |
5,660 | (1) | — | $ | 29.20 | 6/23/2016 | ||||||||||
| 40,000 | (1) | — | $ | 48.40 | 6/1/2017 | |||||||||||
| 25,000 | (1) | — | $ | 48.40 | 5/1/2018 | |||||||||||
| 15,000 | (1) | — | $ | 48.40 | 10/22/2019 | |||||||||||
| 4,500 | 3,000 | $ | 121.05 | 12/7/2020 | ||||||||||||
| — | 2,500 | $ | 355.40 | 12/10/2023 | ||||||||||||
| (1) | These stock option awards were granted to our Named Executive Officers under the 2006 Plan. All options granted under the 2006 Plan were granted with respect to Class A Common Stock. All other stock options enumerated above were granted under the 2010 Plan with respect to Class B Non-Voting Common Stock. |
| (2) | The option awards in this column were granted to our Named Executive Officers under the 2010 Plan and will be fully vested and exercisable on the seventh anniversary of the grant date, provided that the Named Executive Officers continue to provide services to us through that date. However, if EBITDA for the year equals or exceeds the annual or cumulative target enumerated in the option agreement, all or a portion of the option may become exercisable prior to the seven year anniversary. |
Stock Options
2006 Plan. On April 20, 2006, our company adopted a new stock option plan (the “2006 Plan”) and reserved 2,000,000 shares of common stock for issuance thereunder. Only 930,716 stock options were actually issued under the 2006 Plan before it was frozen on October 29, 2009. No stock options have been granted under the 2006 Plan since October 29, 2010 and no stock options will be granted thereunder in the future. 730,732 shares have been purchased pursuant to the exercise of awards granted under the 2006 Plan and, as of June 30, 2014, 199,984 shares are subject to outstanding stock options.
To the extent not already vested, all option awards granted under the 2006 Plan fully vested upon the AS Group Acquisition, which was considered a “change in control” under our 2006 Plan. Named Executive Officers are able to exercise such options at any time, or from time to time, prior to expiration, provided they continue to provide services to us.
Additionally, pursuant to the applicable award agreement, all options granted under the 2006 Plan, if not previously exercised, generally expire on (i) the ten year anniversary of the option grant date, (ii) the one year
104
Table of Contents
anniversary of the Named Executive Officer’s death, (iii) the expiration of thirty days from the Named Executive Officer’s separation of services within one year of change of control or (iv) immediately on the date the Named Executive Officer ceases to be an employee, officer, or member of the board of directors, unless by reason of death or separation of services within one year of change in control.
2010 Plan. Pursuant to the terms of the 2010 Plan, in the event a corporate event occurs that affects the common stock in such a way that an adjustment is required in order to preserve the benefits intended to be made available under the 2010 Plan, the board of directors will adjust any or all of (i) the number and kind of common stock subject to outstanding stock options and (ii) the exercise price with respect to any outstanding stock option or, if deemed appropriate, make a cash payment to an option holder.
The 2010 Plan also provides that in the event of a transaction (as defined in the 2010 Plan), we may, in our sole discretion and without the consent of the participants, provide for (i) the assumption of the 2010 Plan by the surviving company, (ii) substitute new options at the surviving company with substantially the same terms for options in us, (iii) require the exercise of outstanding options and terminate all unexercised or unexercisable options, or (iv) settle outstanding vested stock options in cash or equity and cancel all such stock options. The following events typically constitute a “transaction” under the 2010 Plan: (a) the sale of all or substantially all of our consolidated assets in any single transaction or series of related transactions, (b) the acquisition by a person or group (other than by us, our subsidiaries or our benefit plans) in one or more transactions of our voting securities representing the majority of the outstanding voting power to elect our directors, (c) any merger or consolidation of us with or into another company unless the holders of our voting securities own voting securities of the surviving company representing a majority of the voting power to elect directors in the same proportions that they held their shares prior to the merger.
Unless otherwise provided in the option agreement or another agreement between the individual and us, the 2010 Plan provides that in the event a payment or right accruing to the recipient would constitute a “parachute payment” (as defined in Section 280G of the Code and the regulations issued thereunder) such payment or right will be reduced to the largest amount or greatest right that will result in no portion of the amount payable or right accruing under the 2010 Plan to be subject to an excise tax under Section 4999 of the Code or being disallowed as a deduction under Section 280G of the Code.
Pursuant to the applicable award agreement, and except as provided below, the Named Executive Officers will forfeit any stock option that is not vested and exercisable as of the date they cease performing services for us, for any reason. If the executive’s employment is terminated for cause (as defined in the 2010 Plan) then the Named Executive Officer will forfeit any outstanding stock options, whether vested or unvested, as of the date of his or her termination of employment. The Named Executive Officer or his or her estate, as applicable, will generally be able to exercise all outstanding and vested stock options until the earlier of (i) the expiration of the option term and (ii) (a) the 12 month anniversary of the executive’s termination of employment due to death or disability (as defined in the 2010 Plan) or (b) the three month anniversary of the date of termination for any reason other than cause, death, or disability.
The award agreements used to grant stock options to the Named Executive Officers under the 2010 Plan further provide that if a Named Executive Officer ceases to provide services to us due to his or her death or disability, and we achieve a level of EBITDA performance for the year of his or her termination of employment that would have caused some or all of his or her stock option award to vest, then the Named Executive Officer or the officer’s estate, as applicable, shall vest in that portion of the stock option award that would have vested had his employment not terminated due to death or disability for that year.
The award agreements also provide that all unvested stock options will vest in the event of a transaction (as defined under the 2010 Plan and summarized above) provided that the Named Executive Officer has continuously provided services to us through the date of the transaction. The award agreements do not provide for any accelerated vesting in connection with any other events or termination of employment.
105
Table of Contents
Retirement Plans Generally
We currently maintain two defined benefit pension plans, but Named Executive Officers are not eligible to participate in such plans. Additionally, we maintain a retirement plan intended to provide benefits under Section 401(k) of the Code which allows employees, including our Named Executive Officers, to contribute portions of their base compensation and bonus payments to a tax-qualified retirement account. We provide matching contributions equal to 50% of the first 5% of employees’ eligible compensation contributed to the plan. Amounts deposited in our 401(k) plan, including matching amounts, are fully vested upon deposit. Because of their higher compensation levels, our Named Executive Officers are generally prevented from receiving what would otherwise be their full employer match under the 401(k) plan. Once the maximum employer match allowable under the 401(k) plan has been made, the remainder of the match is contributed on behalf of the executive to the supplemental executive retirement plan (if the executive elected to participate in that plan).
We may also make contributions under a defined contribution stock bonus plan on behalf of all eligible employees, including the Named Executive Officers. Our compensation committee has full control and discretion over the annual contribution rate which is consistent for every eligible participant, and such amounts are subject to the limits established in the Code. Named Executive Officers’ accounts fully vest after three years of service.
Additionally, under our supplemental executive retirement plan, certain employees, including our Named Executive Officers, may elect to defer up to 15% of their base compensation and bonus compensation. The deferral amount under such plan is equal to the base compensation and bonus deferral elected by the employee minus salary and bonus deferrals credited to their 401(k) plan. We provide contributions under this plan, as well, equal to the excess, if any, of the full intended stock bonus contribution, without regard to limitations under the Code, and the actual stock bonus contribution credited to the Named Executive Officer’s stock bonus plan account. Any amount that would have been contributed under the 401(k) plan but could not be contributed due to limitations under the Code, and is instead contributed to the supplemental executive retirement plan on the Named Executive Officers behalf, is fully vested on deposit. Amounts that would have been contributed under the stock bonus plan but could not be contributed due to limitations under the Code, vest in full after three years of service.
Retirement Plans Upon Retirement, Termination or Change in Control
Amounts in a Named Executive Officer’s 401(k) plan account are fully vested upon deposit and, therefore, no acceleration of vesting occurs on termination of employment, retirement, or change of control.
A Named Executive Officer’s account under the stock bonus plan will become 100% vested (i) upon the Named Executive Officer’s termination of employment due to death or “disability,” or (ii) upon the Named Executive Officer’s involuntary termination of employment following the occurrence of a restructuring. Any amount that would have been contributed under the stock bonus plan but could not be contributed due to limitations under the Code, and was contributed to the supplemental executive retirement plan on the Named Executive Officers behalf, shall vest in the event in the change of control so long as the Named Executive Officer is employed by us on the date of such event. Amounts distributed to the Named Executive Officers under the stock bonus plan are paid in one lump sum payment and may generally be paid upon death, disability, normal retirement, late retirement, or, at the employee’s election, upon any other termination of employment. Amounts under the supplemental executive retirement plan are distributed as soon as possible on or after January 1 coincident with or immediately following the Named Executive Officer’s termination of employment, retirement, death or disability.
Actions Taken After 2013 Fiscal Year
Base Salary
Our board of directors is currently in the process of reevaluating our executive compensation program in light of the additional responsibilities and duties our Named Executive Officers will have as the executives of a
106
Table of Contents
publicly traded company. As part of that review, our board of directors has determined that it is appropriate to increase Ms. Deckard and Messrs. Nagel and Fodo’s base salary from $374,900 to $450,000; $327,800 to $360,000; and from $290,000 to $310,000, respectively, effective September 2014.
Annual Bonus
The target annual bonuses established by our compensation committee for our Named Executive Officers with respect to 2014 performance for Ms. Deckard and Messrs. Nagel and Fodo are 100%, 75%, and 75%, respectively. Additionally, our compensation committee established the target annual bonuses for our Named Executive Officers with respect to 2015 performance as 100%, 100% and 75% for Ms. Deckard and Messrs. Nagel and Fodo, respectively. The amount of the target bonus that will actually be paid to each of our Named Executive Officers for 2014 and 2015 performance will be dependent on the extent to which we achieve the performance objectives established under the annual bonus program for that year. We currently expect that the performance metric categories for our annual bonus program in 2014 and 2015 will continue to be sustainable development and EBITDA, although the specific sustainable development goals and EBITDA targets are subject to change from year to year.
Stock Option and Restricted Stock Unit Awards
As part of our board of director’s reevaluation of our executive compensation program, our board of directors has determined that an award of non-qualified stock options and stock settled restricted stock units will be granted to our named executive officers in connection with the closing of this offering. We expect that Ms. Deckard and Mr. Fodo will each receive a grant of approximately 1,050 stock options and 129 restricted stock units and that Mr. Nagel will receive a grant of approximately 1,750 stock options and 214 restricted stock units, in each case subject to change at the discretion of our board of directors. Each award will be subject to the terms and vesting conditions set forth in the applicable grant documents.
2014 Long Term Incentive Plan
On September 11, 2014, subject to approval by our stockholders, our board of directors adopted a Long-Term Incentive Plan, or LTIP, to attract and retain employees, directors, and other service providers to become effective on the date immediately prior to the effective date of this offering. The description of the LTIP set forth below is a summary of the material features of the LTIP. This summary, however, does not purport to be a complete description of all of the provisions of the LTIP and is qualified in its entirety by reference to the LTIP, a copy of which is filed as an exhibit to this registration statement. The LTIP provides for the grant of cash and equity-based awards, including options to purchase shares of our common stock, stock appreciation rights, restricted stock, restricted stock units, bonus stock, dividend equivalents, other stock-based awards, performance awards and annual incentive awards.
Share Limits. Subject to adjustment in accordance with the LTIP, shares of our common stock will initially be reserved for issuance pursuant to awards under the LTIP, and more specifically, that total amount will be available for issuance of incentive stock options. Shares subject to an award under the LTIP that are canceled, forfeited, exchanged, settled in cash or otherwise terminated, including withheld to satisfy exercise prices or tax withholding obligations, will be available for delivery pursuant to other awards. The shares of our common stock to be delivered under the LTIP will be made available from authorized but unissued shares, shares held in treasury, or previously issued shares reacquired by us, including by purchase on the open market.
In each calendar year, during any part of which the LTIP is in effect, an employee who is a “Covered Employee” as defined in Section 162(m) of the Internal Revenue Code of 1986, as amended (the “Code”) may not be granted (a) awards (other than awards designated to be paid only in cash or the settlement of which is not based on a number of shares) relating to more than shares of our common stock, subject to adjustment as provided in the LTIP and (b) awards designated to be paid only in cash, or the settlement of which is not based on a number of shares of our common stock, having a value determined on the date of grant in excess of $30,000,000.
107
Table of Contents
Administration. The LTIP will be administered by the compensation committee of our board of directors, which is referred to herein as the “committee,” except in the event our full board of directors chooses to administer the LTIP. Unless otherwise determined by our board of directors, the committee will be comprised of two or more individuals, each of whom qualifies as an “outside director” as defined in Section 162(m) of the Code and a “nonemployee director” as defined in Rule 16b-3 under the Exchange Act. Subject to the terms and conditions of the LTIP and applicable law, the committee has broad discretion to administer the LTIP, including the power to determine the employees, directors and other service providers to whom awards will be granted, to determine the type of awards to be granted and the number of shares of our common stock to be subject to awards and the terms and conditions of awards, to determine and interpret the terms and provisions of each award agreement, to accelerate the vesting or exercise of any award and to make all other determinations and to take all other actions necessary or advisable for the administration of the LTIP.
Eligibility. Officers, directors, employees, and other individuals who provide services to us may be eligible to receive awards under the LTIP. However, the committee has the sole discretion to determine which eligible individuals receive awards under the LTIP.
Stock Options. The committee may grant incentive stock options and options that do not qualify as incentive stock options, except that incentive stock options may only be granted to persons who are our employees or employees of one of our subsidiaries, in accordance with Section 422 of the Code. Except with respect to substitute awards granted in connection with a transaction, the exercise price of a stock option cannot be less than the fair market value of a share of our common stock on the date on which the option is granted and the option must not be exercisable more than ten years from the date of grant. In the case of an incentive stock option granted to an individual who owns (or is deemed to own) at least 10% of the total combined voting power of all classes of our capital stock, the exercise price of the stock option must be at least 110% of the fair market value of a share of our common stock on the date of grant and the option must not be exercisable more than five years from the date of grant.
Stock Appreciation Rights. Stock appreciation rights, or SARs, may be granted in connection with, or independent of, a stock option. A SAR is the right to receive an amount equal to the excess of the fair market value of one share of our common stock on the date of exercise over the grant price of the SAR. SARs will be exercisable on such terms as the committee determines. The term of a SAR will be for a period determined by the committee but will not exceed ten years. SARs may be paid in cash, common stock or a combination of cash and common stock, as determined by the committee in the relevant award agreement.
Restricted Stock. Restricted stock is a grant of shares of our common stock subject to a substantial risk of forfeiture, restrictions on transferability and any other restrictions determined by the committee. Common stock distributed in connection with a stock split or stock dividend, and other property distributed as a dividend, may be subject to the same restrictions and risk of forfeiture as the restricted stock with respect to which the distribution was made.
Restricted Stock Units. Restricted stock units are rights to receive cash, common stock or a combination of cash and common stock at the end of a specified period. Restricted stock units may be subject to restrictions, including a risk of forfeiture, as determined by the committee. The committee may, in its sole discretion, grant dividend equivalents with respect to restricted stock units.
Other Awards. Subject to limitations under applicable law and the terms of the LTIP, the committee may grant other awards including, without limitation, common stock awarded as a bonus, dividend equivalents, convertible or exchangeable debt securities, other rights convertible or exchangeable into common stock, purchase rights for common stock, awards with value and payment contingent upon our performance or any other factors designated by the committee, and awards valued by reference to the book value of our common stock or the value of securities of the securities or the performance of specified subsidiaries. The committee will determine the terms and conditions of all such awards. Cash awards may granted as an element of, or a
108
Table of Contents
supplement to, any awards permitted under the LTIP. Awards may also be granted in lieu of obligations to pay cash or deliver other property under the LTIP or under other plans or compensatory arrangements, subject to the terms of the LTIP and applicable law.
Performance and Annual Incentive Awards. The LTIP will also permit the committee to designate certain awards as performance awards or annual incentive awards. Performance and annual incentive awards represent awards with respect to which a participant’s right to receive cash, shares of our common stock, or a combination of both, is contingent upon the attainment of one or more specified performance measures within a specified period. The committee will determine the applicable performance period, the performance goals and such other conditions that apply to each performance and annual incentive award. If an award is intended to qualify as “performance-based compensation” for purposes of section 162(m) of the Code, and will be granted to a participant who is designated by the committee as likely to be a covered employee (as defined in section 162(m) of the Code), then the grant, exercise and/or settlement of such award will be contingent upon achievement of one or more of the following business criteria: (1) earnings per share; (2) revenues; (3) cash flow; (4) cash flow from operations; (5) cash flow return; (6) return on net assets; (7) return on assets; (8) return on investment; (9) return on capital; (10) return on invested capital; (11) return on equity; (12) economic value added; (13) operating margin; (14) contribution margin; (15) net income; (16) net income per share; (17) pretax earnings; (18) pretax earnings before interest, depreciation and amortization; (19) pretax operating earnings after interest expense and before incentives, service fees, and extraordinary or special items; (20) total stockholder return; (21) debt reduction; (22) market share; (23) change in the Fair Market Value of the Stock; (24) operating income; and (25) any of the above goals determined on an absolute or relative basis or as compared to the performance of a published or special index deemed applicable by the committee including, but not limited to, the Standard & Poor’s 500 Stock Index or a group of comparable companies.
Termination of Employment and Non-Competition Agreements. The treatment of an award under the LTIP upon a termination of employment or service to us will be specified in the agreement controlling such award. Additionally, each participant to whom an award is granted under the LTIP may be required to agree in writing as a condition of the granting of such award not to engage in conduct in competition with us or our affiliates after the termination of such participant’s employment or service with us.
Change in Control. Subject to the terms of the applicable award agreement, upon a “change in control” (as defined in the LTIP), the committee may, in its discretion, (i) accelerate the time of exercisability of an award, (ii) require awards to be surrendered in exchange for a cash payment (or no payment if awards are unvested or the price paid in the change of control is equal to or less than the exercise price), (iii) provide for the assumption or substitution or continuation of awards by the successor company or a parent or subsidiary of the successor, or (iv) make other adjustments to awards as the committee deems appropriate to reflect the applicable transaction or event.
Amendment and Termination. The LTIP will automatically expire on the tenth anniversary of its effective date. Our board of directors may amend or terminate the LTIP at any time, subject to any requirement of stockholder approval required by applicable law, rule or regulation. The committee may generally amend the terms of any outstanding award under the LTIP at any time. However, no action may be taken by our board of directors or the committee under the LTIP that would materially and adversely affect the rights of a participant under a previously granted award without the participant’s consent.
Director Compensation
The following individuals served as members of our board of directors during 2013: Ms. Jenniffer D. Deckard and Messrs. William E. Conway, Charles D. Fowler, William P. Kelly, Matthew E. LeBaron, Michael E. Sand, and Lawrence N. Schultz.
Directors who are our employees or employees of American Securities do not receive any compensation from us for their service on our board of directors. In 2013, Messrs. LeBaron and Sand were each employed by
109
Table of Contents
American Securities and Ms. Deckard was employed by us. As such, neither Ms. Deckard nor Messrs. LeBaron and Sand received compensation from us for their service on our board of directors.
Mr. Fowler served as our acting Chief Executive Officer in years prior to 2013. Through May 24, 2013, Mr. Fowler provided transitional advisory services to Ms. Deckard, as his successor to the office of Chief Executive. During this period, Mr. Fowler received payments of base salary, was eligible to receive a monthly safety bonus, and received other benefits available to similarly situated executives, including the provision of supplemental life insurance and supplemental disability insurance, as well as our match of amounts contributed by him to his 401(k) account. On May 24, 2013, Mr. Fowler, retired from employment with us but continued to serve as a member of our board of directors.
Messrs. Conway, Fowler, Kelly, and Schultz were compensated for the 2013 fiscal year as outlined below.
| Name |
Fees Earned or Paid in Cash (1) |
Non-Equity Incentive Plan Compensation (2) |
All
Other Compensation (3) |
Total | ||||||||||||
| William E. Conway |
$ | 200,000 | — | — | $ | 200,000 | ||||||||||
| Charles D. Fowler |
$ | 20,000 | $ | 685 | $ | 185,669 | $ | 206,354 | ||||||||
| William P. Kelly |
$ | 20,000 | — | — | $ | 20,000 | ||||||||||
| Lawrence N. Schultz |
$ | 20,000 | — | — | $ | 20,000 | ||||||||||
| (1) | This column includes all amounts paid for service on our board of directors. |
| (2) | For the period of time during which Mr. Fowler was an employee, he received a safety bonus payment in the amount of $685. |
| (3) | Mr. Fowler received payments in the amount of $164,011 as compensation for the provision of transitional advisory services. Additionally, we paid supplement life and supplemental disability insurance premiums on his behalf in the amounts of $14,090 and $1,193, respectively, and matched his 401(k) contributions in the amount of $6,375. |
As of December 31, 2013, Messrs. William Kelly and Lawrence Schultz each held 700 unvested stock options and 1,050 vested stock options. These options will be fully vested and exercisable on the seventh anniversary of the grant date, which is December 7, 2017, provided that the directors continue to provide services to us through that date. However, if EBITDA for the year equals or exceeds the annual or cumulative target enumerated in the option agreement, all or a portion of the option may become exercisable prior to the seven year anniversary. As of December 31, 2013, Messrs. Fowler and Conway held no outstanding stock options.
Following the closing of this initial public offering, we plan to implement a new director compensation program to reflect the increased time and responsibility that being the director of a publicly traded company entails. We anticipate that directors who are not our employees will receive a combination of cash and restricted stock unit grants as compensation for attending meetings of our board of directors and committees thereof. We expect that such compensation will consist of an annual retainer of approximately $62,500 for each non-employee board member. We expect that each non-employee director will also receive an annual grant of the number of restricted stock units having a grant date fair value of approximately $62,500, subject to the terms and vesting schedules set forth in the applicable grant documents. Further, we expect that non-employee directors serving as a chairman of the compensation committee and executive committee of our board of directors will receive an additional annual retainer of $10,000. The chair of our audit committee is expected to receive an additional annual retainer of $15,000 and the chair of our board of directors is expected to receive an additional annual retainer of $25,000.
110
Table of Contents
PRINCIPAL AND SELLING STOCKHOLDERS
The following table sets forth the beneficial ownership of our common stock that, in connection with the completion of this offering, will be owned by:
| • | each stockholder known by us to be the beneficial owner of more than 5% of our outstanding shares of common stock; |
| • | each member of our board of directors; |
| • | each of our executive officers; |
| • | all of our directors and executive officers as a group; and |
| • | the selling stockholders. |
Except as otherwise noted, the person or entities listed below have sole voting and investment power with respect to all shares of our common stock beneficially owned by them, except to the extent this power may be shared with a spouse. All information with respect to beneficial ownership has been furnished by the selling stockholders, directors or named executive officers, as the case may be. Unless otherwise noted, the mailing address of each listed beneficial owner is c/o FMSA Holdings Inc., 8834 Mayfield Road, Chesterland, Ohio 44026.
Applicable percentage ownership is based on shares of our common stock outstanding as of September , 2014.
To the extent that the underwriters sell more than shares of common stock, the underwriters have the option to purchase up to an additional shares from the selling stockholders. The number of shares being offered by the selling stockholders in the table below assumes a full exercise of the underwriters’ option to purchase additional shares of common stock.
| Shares Beneficially Owned Before this Offering |
Shares Offered Hereby |
Shares Beneficially
Owned After this Offering |
Shares Beneficially
Owned After Full Exercise of Over-Allotment Option | |||||||||||||
| Name of Beneficial Owner |
Number | Percentage | Number | Percentage | Number | Percentage | ||||||||||
| 5% Stockholders |
||||||||||||||||
| ASP FML Holdings, LLC(1) |
53.3 | % | ||||||||||||||
| Fairmount Minerals, Ltd. Stock Bonus Trust & Plan |
5.1 | % | ||||||||||||||
| Charles D. Fowler, under the Charles D. Fowler Declaration of Trust(2) |
7.5 | % | ||||||||||||||
| Directors and Executive Officers: |
||||||||||||||||
| Matthew F. LeBaron(3) |
— | |||||||||||||||
| Michael E. Sand(4) |
— | |||||||||||||||
| Charles D. Fowler(2) |
7.5 | % | ||||||||||||||
| Jenniffer D. Deckard(5) |
3.5 | % | ||||||||||||||
| Joseph D. Fodo(6) |
3.0 | % | ||||||||||||||
| Gerald L. Clancey(7) |
2.1 | % | ||||||||||||||
| William E. Conway(8) |
* | |||||||||||||||
| Van T. Smith(9) |
* | |||||||||||||||
| Christopher L. Nagel(10) |
* | |||||||||||||||
| William P. Kelly(11) |
* | |||||||||||||||
| Lawrence W. Schultz(12) |
* | |||||||||||||||
| Directors and named executive officers as a group (11 persons) |
16.8 | % | ||||||||||||||
111
Table of Contents
| Shares Beneficially Owned Before this Offering |
Shares Offered Hereby |
Shares Beneficially
Owned After this Offering |
Shares Beneficially
Owned After Full Exercise of Over-Allotment Option | |||||||||||||
| Name of Beneficial Owner |
Number | Percentage | Number | Percentage | Number | Percentage | ||||||||||
| Certain Other Selling Stockholders: |
||||||||||||||||
| Chaolley Limited Partnership(13) |
4.2 | % | ||||||||||||||
| Anne Conway Juster(14) |
3.6 | % | ||||||||||||||
| William T. Conway(15) |
2.5 | % | ||||||||||||||
| Peter F. Conway(16) |
2.5 | % | ||||||||||||||
| Cody C. Barber(17) |
2.0 | % | ||||||||||||||
| GrandSand LLC(18) |
1.7 | % | ||||||||||||||
| Jane C. Barber(19) |
1.5 | % | ||||||||||||||
| Patrick R. Okell(20) |
1.0 | % | ||||||||||||||
| Robert G. Hauzie(21) |
* | |||||||||||||||
| W. Alexander McAfee(22) |
* | |||||||||||||||
| Stephen E. King(23) |
* | |||||||||||||||
| Maureen P. Lynn(24) |
* | |||||||||||||||
| Michelle Pezanoski(25) |
* | |||||||||||||||
| Robert B. Larson(26) |
* | |||||||||||||||
| Michael R. Kline |
* | |||||||||||||||
| Christie M. Osmond(27) |
* | |||||||||||||||
| Molly M. Marshall(28) |
* | |||||||||||||||
| Amy L. Gray |
* | |||||||||||||||
| Gerald L. Clancey Irrevocable Trust(29) |
* | |||||||||||||||
| Connie J. Clancey Irrevocable Trust(30) |
* | |||||||||||||||
| Wayne T. Williams(31) |
* | |||||||||||||||
| William H. Thompson(32) |
* | |||||||||||||||
| Other Current Employees(33) |
3.0 | % | ||||||||||||||
| Former Employees and Others(34) |
1.5 | % | ||||||||||||||
| * | Less than 1%. |
| (1) | Represents shares held by ASP FML Holdings, LLC, a Delaware limited liability company referred to as ASP FML Holdings. American Securities Partners V, L.P., American Securities Partners V(B), L.P. and American Securities Partners V(C), L.P., collectively referred to as the ASP Sponsors, are owners of approximately 74% of the limited liability company interests of ASP FML Investco, LLC, a Delaware limited liability company, referred to as ASP FML Investco. ASP FML Co-Invest I, LLC, a Delaware limited liability company referred to as ASP FML Co-Invest I, is the owner of approximately 26% of the limited liability company interests of ASP FML Investco. ASP FML Investco is the owner of approximately 89% of the limited liability company interests of ASP FML Holdings. American Securities Associates V, LLC, a Delaware limited liability company referred to as ASA V, is the general partner of each ASP Sponsor. American Securities LLC, a New York limited liability company referred to as American Securities, provides investment advisory services to each ASP Sponsor and to ASA V, and is the owner of 100% of the issued and outstanding shares of ASP Manager Corp., the manager of each of ASP FML Holdings, ASP FML Investco and ASP FML Co-Invest I. As such, American Securities may be deemed to have indirect beneficial ownership of the shares held by ASP FML Holdings. The address for ASP FML Holdings is c/o American Securities LLC, 299 Park Avenue, 34th Floor, New York, NY 10171. As referenced in footnotes (2) and (3) below, each of Messrs. LeBaron and Sand may be deemed to have shared voting and investment power over the shares held by ASP FML Holdings. Such individuals disclaim beneficial ownership of the shares of common stock held by ASP FML Holdings, except to the extent of their pecuniary interests therein. Additionally, (a) David L. Horing and Michael G. Fisch, in their capacities as the managing members of ASA V, and (b) Michael G. Fisch, in his capacity as trustee of The Michael G. Fisch 2006 Revocable Trust, which is the manager of ASCP, LLC, which is the managing member of American Securities, may be deemed to have shared voting and investment power over the shares held by ASP FML Holdings. Such individuals disclaim beneficial ownership of the shares of common stock held by ASP FML Holdings, except to the extent of their pecuniary interests therein. |
112
Table of Contents
| (2) | Consists of shares held under the Charles D. Fowler Declaration of Trust dated September 26, 1991, as amended to date (the “Fowler Trust”). Given the revocable nature of the Fowler Trust, Mr. Fowler is deemed to have voting and investment power over the shares held by the Fowler Trust. In addition to the shares described above, Mr. Fowler through the Fowler Trust’s ownership of ASP FML Holdings, LLC (described in footnote 1 above) has an indirect economic ownership in shares of common stock held by ASP FML Holdings. Mr. Fowler disclaims beneficial ownership of shares held by ASP FML Holdings, except to the extent of his pecuniary interest therein. |
| (3) | Mr. LeBaron may be deemed to have shared voting and investment power of the shares held by ASP FML Holdings in his capacity as a Managing Director of American Securities, and as a designee of ASP FML Holdings on our board of directors. Mr. LeBaron disclaims beneficial ownership of the shares of common stock owned by ASP FML Holdings, except to the extent of his pecuniary interest therein, as such shares are owned and held by the ASP Sponsors referenced in footnote (1) above. |
| (4) | Mr. Sand may be deemed to have shared voting and investment power of the shares held by ASP FML Holdings in his capacity as a Principal of American Securities, and as a designee of ASP FML Holdings on our board of directors. Mr. Sand disclaims beneficial ownership of the shares of common stock owned by ASP FML Holdings, except to the extent of his pecuniary interest therein, as such shares are owned and held by the ASP Sponsors referenced in footnote (1) above. |
| (5) | Includes (i) shares held f/b/o/ Abbey Jo Deckard Trust, (ii) shares held f/b/o Connor John Deckard Trust, (iii) shares held under the Jenniffer D. Deckard Family U/A/D dated February 28, 2010 (iv) shares held under the Daryl K. Deckard Irrevocable Trust dated August 29, 2014 and (v) shares held under the Jenniffer Deckard Grantor Retained Annuity Trust #3 dated August 7, 2014 (collectively, the “Deckard Trusts”). Given Ms. Deckard’s position as trustee of the Deckard Trusts, Ms. Deckard is deemed to have voting and investment power over the shares held by the Deckard Trusts. Includes shares held under the Jenniffer D. Deckard Irrevocable Trust dated December 27, 2012 (the “JDD Trust”). Given Ms. Deckard’s spouse’s position as trustee of the JDD Trust, Ms. Deckard is deemed to have voting and investment power over the shares held by the JDD Trust. Includes options to purchase shares of common stock that are exercisable within 60 days of September , 2014. In addition to the shares described above, Ms. Deckard’s spouse has an ownership interest in ASP FML Holdings, LLC (described in footnote 1 above), representing indirect economic ownership in shares of common stock held by ASP FML Holdings. Given this spousal relationship, Ms. Deckard may be deemed to share voting and investment control of these shares, but disclaims beneficial ownership of such shares, except to the extent of her pecuniary interest therein. |
| (6) | Includes shares held under the Joseph Darrell Fodo Revocable Trust dated September 10, 2007 (the “Fodo Revocable Trust”) and shares held under the Joseph D. Fodo Grantor Retained Annuity Trust dated June 24, 2011 (the “Fodo Grantor Retained Annuity Trust”). Given the revocable nature of the Fodo Revocable Trust, Mr. Fodo is deemed to have voting and investment power over the shares held by the Fodo Revocable Trust. Given Mr. Fodo’s position as trustee of the Fodo Grantor Retained Annuity Trust, Mr. Fodo is deemed to have voting and investment power over the shares held by the Fodo Grantor Retained Annuity Trust. Includes options to purchase shares of common stock that are exercisable within 60 days of September , 2014. |
| (7) | Includes (i) shares held under the Gerald L. Clancey Trust No. 1, (ii) shares held under the Gerald L. Clancey Grantor Retained Annuity Trust No. 1. (iii) shares held under the Gerald L. Clancey Grantor Retained Annuity Trust No. 2, (iv) shares held under the Gerald L. Clancey Grantor Retained Annuity Trust No. 3, (v) shares held under the Gerald L. Clancey Grantor Retained Annuity Trust No. 4, (vi) shares held under the Gerald L. Clancey Grantor Retained Annuity Trust No. 5, (vii) shares held under the Gerald L. Clancey Grantor Retained Annuity Trust No. 6, (viii) shares held under the Gerald L. Clancey Grantor Retained Annuity Trust No. 7, (ix) shares held under the Gerald L. Clancey Grantor Retained Annuity Trust No. 8 and (x) shares held under the Gerald L. Clancey Grantor Retained Annuity Trust No. 9 (collectively, the “Clancey Trusts”). Given Mr. Clancey’s position as trustee of the Clancey Trusts, Mr. Clancey is deemed to have voting and investment power over the shares held by the Clancey Trusts. In addition to the shares described above, Mr. Clancey through his ownership of ASP FML Holdings, LLC (described in footnote 1 above) has an indirect economic ownership in shares of common stock held by ASP FML Holdings. Mr. Clancey disclaims beneficial ownership of shares held by ASP FML Holdings, except to the extent of his pecuniary interest therein. Includes options to purchase shares of common stock that are exercisable within 60 days of September , 2014. |
| (8) | Includes shares held under the Mary F. Conway Declaration of Trust dated December 13, 1980 (the “Mary Conway Trust”) and shares held under the Under Trust Agreement dated March 10, 1992 (the “Conway UTA”). Given Mr. Conway’s spouse’s position as trustee under the Mary Conway Trust and Mr. Conway’s position as trustee under the Conway UTA, Mr. Conway is deemed to have voting and investment power over the shares held by the Mary Conway Trust and the Conway UTA. Includes shares held by The Sand Fair Foundation. Given Mr. Conway’s position |
113
Table of Contents
| as President of The Sand Fair Foundation, Mr. Conway is deemed to have voting and investment power over the shares held by The Sand Fair Foundation. |
| (9) | Includes shares held by the Van Smith Grantor Retained Annuity Trust #1 Under Trust Agreement dated June 26, 2014 (“Smith Trust”). Given Mr. Smith’s position as trustee of the Smith Trust, Mr. Smith is deemed to have voting and investment power over the shares held by the Smith Trust. Includes options to purchase shares of common stock that are exercisable within 60 days of September , 2014. |
| (10) | Includes options to purchase shares of common stock that are exercisable within 60 days of September , 2014. |
| (11) | Includes options to purchase shares of common stock that are exercisable within 60 days of September , 2014. |
| (12) | Includes options to purchase shares of common stock that are exercisable within 60 days of September , 2014. |
| (13) | Chann Spellman is the General Partner of Chaolley Limited Partnership. Voting and investment power of the shares owned by the Chaolley Limited Partnership reside with Chann Spellman as General Partner and Holley Power Martens as trustee. The address of Chaolley Limited Partnerships is 5885 Landerbrook Dr., #300, Mayfield Heights, Ohio 44124. |
| (14) | Includes (i) shares held by the Anne C. Juster Declaration of Trust dated November 14, 1996, (ii) shares held by the Anne C. Juster Irrevocable Trust dated November 13, 2011, (iii) shares held by the William E. Conway Irrevocable Trust for the benefit of Grace S. Juster Under Trust Agreement dated November 29, 1993, (iv) shares held by the William E. Conway Irrevocable Trust for the benefit of J. Harold Juster Under Trust Agreement dated December 23, 1997, (v) shares held by the William E. Conway Irrevocable Trust for the benefit of Julia F. Juster Under Trust Agreement dated November 29, 1993 and (vi) shares held by the Joseph K. Juster Irrevocable Trust dated November 13, 2012 (collectively, the “Juster Trusts”). Given Ms. Juster’s position as trustee of the Juster Trusts, Ms. Juster is deemed to have voting and investment power over the shares held by the Juster Trusts. Includes shares held by Apple Seed Investment Partners, LLC. Given Ms. Juster’s position as a member of Apple Seed Investment Partners, LLC, Ms. Juster is deemed to have voting and investment power over the shares held by Apple Seed Investment Partners, LLC. In addition to the shares described above, Ms. Juster through her ownership of ASP FML Holdings, LLC (described in footnote 1 above) has an indirect economic ownership in shares of common stock held by ASP FML Holdings. Ms. Juster disclaims beneficial ownership of shares held by ASP FML Holdings, except to the extent of her pecuniary interest therein. |
| (15) | Includes shares held by the Conway Family Trust dated October 11, 1995, as amended (the “Conway Family Trust”). Given Mr. Conway’s position as co-trustee of the Conway Family Trust, Mr. Conway is deemed to have shared voting and investment power over the shares held by the Conway Family Trust. Includes shares held by ConJon II, LLC. Given Mr. Conway’s position as manager of ConJon II, LLC, Mr. Conway is deemed to have voting and investment power over the shares held by ConJon II, LLC. In addition to the shares described above, Mr. Conway through ConJon II, LLC’s ownership of ASP FML Holdings, LLC (described in footnote 1 above) has an indirect economic ownership in shares of common stock held by ASP FML Holdings. Mr. Conway disclaims beneficial ownership of shares held by ASP FML Holdings, except to the extent of his pecuniary interest therein. |
| (16) | Includes shares held by the Peter F. Conway Declaration of Trust dated January 16, 1995, as modified (the “Peter Conway Trust”). Given Mr. Conway’s position as trustee of the Peter Conway Trust, Mr. Conway is deemed to have voting and investment power over the shares held by the Peter Conway Trust. Includes shares held by TurtleCo II, LLC. Given Mr. Conway’s position as manager of TurtleCo II, LLC, Mr. Conway is deemed to have voting and investment power over the shares held by TurtleCo II, LLC. In addition to the shares described above, Mr. Conway through TurtleCo II, LLC’s ownership of ASP FML Holdings, LLC (described in footnote 1 above) has an indirect economic ownership in shares of common stock held by ASP FML Holdings. Mr. Conway disclaims beneficial ownership of shares held by ASP FML Holdings, except to the extent of his pecuniary interest therein. |
| (17) | Includes shares held by Peak Eight LLC and Peak Eight II LLC (collectively, the “Peak Eight Entities”). Given Mr. Barber’s position as a partner in the Peak Eight Entities, Mr. Barber is deemed to have voting and investment power over the shares held by the Peak Eight Entities. In addition to the shares described above, Mr. Barber through Peak Eight II, LLC’s ownership of ASP FML Holdings, LLC (described in footnote 1 above) has an indirect economic ownership in shares of common stock held by ASP FML Holdings. Mr. Barber disclaims beneficial ownership of shares held by ASP FML Holdings, except to the extent of his pecuniary interest therein. |
| (18) | Holley Martens and Chann Spellman are trustees of GrandSand LLC. Voting and investment power of the shares owned by GrandSand LLC reside with Holley Martens and Chann Spellman as trustees. The address of GrandSand LLC is 5885 Landerbrook Dr., #300, Mayfield Heights, Ohio 44124. |
114
Table of Contents
| (19) | Includes shares held by the Jane Conway Barber Declaration of Trust dated March 2, 1995 (the “Jane Barber Trust”). Given Ms. Barber’s position as trustee of the Jane Barber Trust, Ms. Barber is deemed to have voting and investment power over the shares held by the Jane Barber Trust. Includes shares held by Four C’s Capital, LLC. Given Ms. Barber’s position as partner and manager of Four C’s Capital, LLC, Ms. Barber is deemed to have voting and investment power over the shares held by Four C’s. Ms. Barber disclaims any beneficial ownership of the shares held by Four C’s Capital LLC, except to the extent of any pecuniary interest therein. |
| (20) | Includes options to purchase shares of common stock that are exercisable within 60 days of September , 2014. |
| (21) | Includes options to purchase shares of common stock that are exercisable within 60 days of September , 2014. |
| (22) | Includes (i) shares held by the Alexander McAfee Grantor Retained Annuity Trust dated November 11, 2012, (ii) shares held by the Alexander McAfee Grantor Retained Annuity Trust dated February 25, 2013, (iii) shares held by the Alexander McAfee Grantor Retained Annuity Trust dated April 22, 2014, (iv) shares held by the Alexander McAfee Grantor Retained Annuity Trust dated June 30, 2014 and (v) shares held by the William Andrew McAfee 2012 Trust (collectively, the “McAfee Trusts”). Given Mr. McAfee’s position as trustee of the McAfee Trusts, Mr. McAfee is deemed to have voting and investment power over the shares held by the McAfee Trusts. |
| (23) | Includes shares held by the Stephen E. King, III Grantor Retained Annuity Trust No. 1 (the “King Trust”). Given Mr. King’s position as trustee of the King Trust, Mr. King is deemed to have voting and investment power over the shares held by the King Trusts. |
| (24) | Includes shares held by the Maureen P. Lynn Irrevocable Trust dated December 19, 2012 (the “Lynn Trust”). Given Ms. Lynn’s position as trustee of the Lynn Trust, Ms. Lynn is deemed to have voting and investment power over the shares held by the Lynn Trust. |
| (25) | Includes shares held by Michelle Pezanoski Grantor Retained Annuity Trust #1 Under Trust Agreement (the “Pezanoski Trust”). Given Ms. Pezanoski’s position as trustee of the Pezanoski Trust, Ms. Pezanoski is deemed to have voting and investment power over the shares held by the Pezanoski Trust. |
| (26) | Includes options to purchase shares of common stock that are exercisable within 60 days of September , 2014. |
| (27) | Includes shares held by the Christie McAfee Osmond 2014 Grantor Retained Annuity Trust dated June 30, 2014 (the “Osmond Trust”). Given Ms. Osmond’s position as trustee, Ms. Osmond is deemed to have voting and investment power over the shares held by the Osmond Trust. |
| (28) | Includes shares held by the Molly Marshall Grantor Retained Annuity Trust dated July 25, 2014 (the “Marshall Trust”). Given Ms. Marshall’s position as trustee, Ms. Marshall is deemed to have voting and investment power over the shares held by the Marshall Trust. |
| (29) | Sherri Furda is the trustee of the Gerald L. Clancey Irrevocable Trust. |
| (30) | Sherri Furda is the trustee of the Connie J. Clancey Irrevocable Trust. |
| (31) | Includes shares held by the Irrevocable Trust Agreement of Wayne T. Williams dated June 27, 2014 (the “Williams Family Trust”). Given Mr. Williams spouse’s position as trustee of the Williams Family Trust, Mr. Williams is deemed to have voting and investment power over the shares held by the Williams Family Trust. |
| (32) | Includes shares held by the W. Hayden Thompson Trust UAD dated October 29, 1975 (the “Thompson Trust”). Given Mr. Thompson’s position as trustee, Mr. Thompson is deemed to have voting and investment power over the shares held by the Thompson Trust. |
| (33) | Includes approximately 75 employees not otherwise listed above, none of which currently owns more than 0.25% of the company’s common stock. Of the shares presented in the table, of the shares are subject to options held by such selling stockholders that are exercisable within 60 days of September , 2014. All of these selling stockholders are current employees of the company. |
| (34) | Includes approximately 28 persons not otherwise listed above, none of which currently owns more than 0.17% of the company’s common stock. These selling stockholders include three former employees of the company (all three of which were employed by the company within the past three years) and other holders of the company’s common stock. |
115
Table of Contents
CERTAIN RELATIONSHIPS AND RELATED PARTY TRANSACTIONS
Procedures for Approval of Related Party Transactions
Prior to the closing of this offering, we have not maintained a policy for approval of Related Party Transactions. A “Related Party Transaction” is a transaction, arrangement or relationship in which we or any of our subsidiaries was, is or will be a participant, the amount of which involved exceeds $120,000, and in which any Related Person had, has or will have a direct or indirect material interest. A “Related Person” means:
| • | any person who is, or at any time during the applicable period was, one of our executive officers or one of our directors; |
| • | any person who is known by us to be the beneficial owner of more than 5% of our common stock; |
| • | any immediate family member of any of the foregoing persons, which means any child, stepchild, parent, stepparent, spouse, sibling, mother-in-law, father-in-law, son-in-law, daughter-in-law, brother-in-law or sister-in-law of a director, executive officer or a beneficial owner of more than 5% of our common stock, and any person (other than a tenant or employee) sharing the household of such director, executive officer or beneficial owner of more than 5% of our common stock; and |
| • | any firm, corporation or other entity in which any of the foregoing persons is a partner or principal or in a similar position or in which such person has a 10% or greater beneficial ownership interest. |
We anticipate that our board of directors will adopt a written related party transactions policy prior to the completion of this offering. Pursuant to this policy, we expect that our audit committee will review all material facts of all Related Party Transactions.
American Securities
American Securities is a leading U.S. middle-market private equity firm that currently has over $10 billion of assets under management. In August 2010, affiliated funds managed by American Securities acquired control over ASP FML, which owns 53.5% of the outstanding common stock of the Company. Upon completion of this offering (assuming no exercise of the underwriters’ over-allotment option), affiliated funds managed by American Securities will own approximately % of our outstanding common stock.
We paid American Securities $1 million annually for management and consulting fees provided pursuant to a management consulting agreement, in addition to approximately $0.1 million, $0.3 million and $1.9 million in separate transaction fees for mergers and acquisitions by the Company and out of pocket expenses for the years ended 2011, 2012 and 2013, respectively. In connection with the completion of this offering, the management consulting agreement, and any obligation to pay transaction fees, will be terminated.
Stockholders’ Agreement
In connection with the investment in our common stock by ASP FML, certain of our stockholders, including ASP FML entered into an amended and restated stockholders’ agreement on April 28, 2009 between certain stockholders and previous equity sponsors. The stockholders’ agreement provides, among other things, that ASP FML is currently entitled to elect (or cause to be elected) three of our directors. The stockholders’ agreement will be amended and restated (the “Fourth Amended and Restated Stockholders’ Agreement”) contingent upon, and effective at the time of, consummation of this offering to, among certain other things, remove ASP FML’s right to elect (or cause to be elected) three of our directors and to revise certain registration rights.
Registration Rights
Pursuant to the Fourth Amended and Restated Stockholders’ Agreement , we will be obligated to register the sale of shares of our common stock under certain circumstances.
116
Table of Contents
Demand Rights. At any time after the closing of this offering, subject to the limitations set forth below, certain major stockholders (or their permitted transferees), including ASP FML, will have the right to require us by written notice to prepare and file a registration statement registering the offer and sale of a number of their shares of common stock. Generally, we will be required to provide notice of a request by such a major stockholder within one business day following the receipt of such demand request to all other such major stockholders, who may, in certain circumstances, participate in the registration.
We will also not be obligated to effect any demand registration in which a notice is received within 90 days after the closing of an underwritten offering, during a Company blackout period, or in which the anticipated aggregate offering price included in such offering is less than $50 million. Once we are eligible to effect a registration on Form S-3, any such demand registration may be for a shelf registration statement. Any demand for an underwritten offering pursuant to an effective shelf registration statement shall constitute a demand request subject to the limitations set forth above. We will be required to maintain the effectiveness of any such registration statement until the consummation of the distribution by the participating holders.
Piggy-back Rights. If, at any time, subject to certain customary limitations we propose to register an offering of common stock (subject to certain exceptions) for our own account or for the account of any third party (including a demand registration), then we must give written notice to all holders who own registrable securities, the gross offering price of which is anticipated to be at least $5 million to allow them to include a specified number of their shares in that registration statement.
Conditions and Limitations; Expenses. These registration rights are subject to certain conditions and limitations, including the right of the underwriters to limit the number of shares to be included in a registration and our right to delay or withdraw a registration statement under certain circumstances. We will generally pay all registration expenses in connection with our obligations under the registration rights agreement, regardless of whether a registration statement is filed or becomes effective.
117
Table of Contents
Upon completion of this offering, the authorized capital stock of FMSA Holdings Inc., will consist of shares of common stock, $0.01 par value per share, of which shares will be issued and outstanding, and shares of preferred stock, $0.01 par value per share, of which no shares will be issued and outstanding.
The following summary of the capital stock and amended and restated certificate of incorporation and amended and restated bylaws of FMSA Holdings Inc., does not purport to be complete and is qualified in its entirety by reference to the provisions of applicable law and to our amended and restated certificate of incorporation and amended and restated bylaws, which are filed as exhibits to the registration statement of which this prospectus is a part.
Common Stock
Except as provided by law or in a preferred stock designation, holders of common stock are entitled to one vote for each share held of record on all matters submitted to a vote of the stockholders, will have the exclusive right to vote for the election of directors and do not have cumulative voting rights. Except as otherwise required by law, holders of common stock, are not entitled to vote on any amendment to the amended and restated certificate of incorporation (including any certificate of designations relating to any series of preferred stock) that relates solely to the terms of any outstanding series of preferred stock if the holders of such affected series are entitled, either separately or together with the holders of one or more other such series, to vote thereon pursuant to the amended and restated certificate of incorporation (including any certificate of designations relating to any series of preferred stock) or pursuant to the DGCL. Subject to prior rights and preferences that may be applicable to any outstanding shares or series of preferred stock, holders of common stock are entitled to receive ratably in proportion to the shares of common stock held by them such dividends (payable in cash, stock or otherwise), if any, as may be declared from time to time by our board of directors out of funds legally available for dividend payments. All outstanding shares of common stock are fully paid and non-assessable. The holders of common stock have no preferences or rights of conversion, exchange, pre-emption or other subscription rights. There are no redemption or sinking fund provisions applicable to the common stock. In the event of any voluntary or involuntary liquidation, dissolution or winding-up of our affairs, holders of common stock will be entitled to share ratably in our assets in proportion to the shares of common stock held by them that are remaining after payment or provision for payment of all of our debts and obligations and after distribution in full of preferential amounts to be distributed to holders of outstanding shares of preferred stock, if any.
Preferred Stock
Our amended and restated certificate of incorporation authorizes our board of directors, subject to any limitations prescribed by law, without further stockholder approval, to establish and to issue from time to time one or more series of preferred stock, par value $0.01 per share. Each such series of preferred stock will cover the number of shares and will have the powers, preferences, rights, qualifications, limitations and restrictions determined by the board of directors, which may include, among others, dividend rights, liquidation preferences, voting rights, conversion rights, preemptive rights and redemption rights. Except as provided by law or in a preferred stock designation, the holders of preferred stock will not be entitled to vote at or receive notice of any meeting of stockholders.
Anti-Takeover Effects of Provisions of Our Amended and Restated Certificate of Incorporation, our Amended and Restated Bylaws and Delaware Law
Some provisions of Delaware law, our amended and restated certificate of incorporation and our amended and restated bylaws will contain provisions that could make the following transactions more difficult: acquisitions of us by means of a tender offer, a proxy contest or otherwise or removal of our directors. These
118
Table of Contents
provisions may also have the effect of preventing changes in our management. It is possible that these provisions could make it more difficult to accomplish or could deter transactions that stockholders may otherwise consider to be in their best interest or in our best interests, including transactions that might result in a premium over the market price for our shares.
These provisions are expected to discourage coercive takeover practices and inadequate takeover bids. These provisions are also designed to encourage persons seeking to acquire control of us to first negotiate with us. We believe that the benefits of increased protection and our potential ability to negotiate with the proponent of an unfriendly or unsolicited proposal to acquire or restructure us outweigh the disadvantages of discouraging these proposals because, among other things, negotiation of these proposals could result in an improvement of their terms.
Delaware Law
Section 203 of the DGCL prohibits a Delaware corporation, including those whose securities are listed for trading on the NYSE, from engaging in any business combination (as defined in Section 203) with any interested stockholder (as defined in Section 203) for a period of three years following the date that the stockholder became an interested stockholder, unless:
| • | the business combination or the transaction which resulted in the stockholder becoming an interested stockholder is approved by the board of directors before the date the interested stockholder attained that status; |
| • | upon consummation of the transaction that resulted in the stockholder becoming an interested stockholder, the interested stockholder owned at least 85% of the voting stock of the corporation outstanding at the time the transaction commenced; or |
| • | on or after such time the business combination is approved by the board of directors and authorized at a meeting of stockholders by at least two-thirds of the outstanding voting stock that is not owned by the interested stockholder. |
A corporation may elect not to be subject to Section 203 of the DGCL. We have elected to not be subject to the provisions of Section 203 of the DGCL.
Amended and Restated Certificate of Incorporation and Amended and Restated Bylaws
Provisions of our amended and restated certificate of incorporation and amended and restated bylaws, which will become effective upon the closing of this offering, may delay or discourage transactions involving an actual or potential change in control or change in our management, including transactions in which stockholders might otherwise receive a premium for their shares, or transactions that our stockholders might otherwise deem to be in their best interests. Therefore, these provisions could adversely affect the price of our common stock.
Among other things, upon the completion of this offering, our amended and restated certificate of incorporation and amended and restated bylaws will:
| • | establish advance notice procedures with regard to stockholder proposals relating to the nomination of candidates for election as directors or new business to be brought before meetings of our stockholders. These procedures provide that notice of stockholder proposals must be timely given in writing to our corporate secretary prior to the meeting at which the action is to be taken. Generally, to be timely, notice must be received at our principal executive offices not less than 90 days nor more than 120 days prior to the first anniversary date of the annual meeting for the preceding year. Our amended and restated bylaws specify the requirements as to form and content of all stockholders’ notices. These requirements may preclude stockholders from bringing matters before the stockholders at an annual or special meeting; |
119
Table of Contents
| • | provide our board of directors the ability to authorize undesignated preferred stock. This ability makes it possible for our board of directors to issue, without stockholder approval, preferred stock with voting or other rights or preferences that could impede the success of any attempt to change control of us. These and other provisions may have the effect of deferring hostile takeovers or delaying changes in control or management of our company; |
| • | provide that the authorized number of directors may be changed only by resolution of the board of directors; |
| • | provide that all vacancies, including newly created directorships, shall, except as otherwise required by law or, if applicable, the rights of holders of a series of preferred stock, be filled exclusively by the affirmative vote of a majority of directors then in office, even if less than a quorum; |
| • | at any time after the earlier to occur of (i) the close of business on the tenth business day following the date at which American Securities and its affiliates no longer collectively beneficially own more than 35% of the outstanding shares of our common stock, and (ii) the close of business on the business day following public disclosure that American Securities elected that the following shall occur, |
| • | provide that any action required or permitted to be taken by the stockholders must be effected at a duly called annual or special meeting of stockholders and may not be effected by any consent in writing in lieu of a meeting of such stockholders, subject to the rights of the holders of any series of preferred stock with respect to such series (prior to such time, such actions may be taken without a meeting by written consent of holders of common stock having not less than the minimum number of votes that would be necessary to authorize such action at a meeting); |
| • | provide that our bylaws may be amended by the stockholders only by the affirmative vote of the holders of at least two-thirds of our then outstanding common stock (prior to such time, our bylaws may be amended by the affirmative vote of the holders of a majority of our then outstanding common stock); and |
| • | provide that special meetings of our stockholders may only be called by the board of directors, (prior to such time, a special meeting may also be called at the request of stockholders holding a majority of the outstanding shares of our common stock); |
| • | provide that certain provisions of our certificate of incorporation may be amended by the affirmative vote of the holders of at least 75% of our then outstanding common stock (prior to such time, our certificate of incorporation may amended by the affirmative vote of the majority of our then outstanding common stock); |
| • | provide that, subject to the rights of the preferred stockholders, if any, any director may be removed only for cause and upon the affirmative vote of the holders of at least 75% of our then outstanding common stock (prior to such time, subject to the rights of the preferred stockholders, if any, any director may be removed, with or without cause, upon the affirmative vote of the holders of a majority of our outstanding common stock); |
| • | provide for our board of directors to be divided into three classes of directors, with each class as nearly equal in number as possible, serving staggered three year terms, other than directors which may be elected by holders of preferred stock, if any. This system of electing and removing directors may tend to discourage a third party from making a tender offer or otherwise attempting to obtain control of us, because it generally makes it more difficult for stockholders to replace a majority of the directors; |
| • | provide that we renounce any interest in certain business opportunities presented to American Securities or any of its officers, directors, agents, members, affiliates and subsidiaries (other than business opportunities presented to such person in his or her capacity as an officer or director of the company) and that to the fullest extent permitted by law they have no obligation to offer us those opportunities, other than opportunities relating to hydraulic fracturing proppants; and |
| • | provide that our bylaws can be amended or repealed by the board of directors. |
120
Table of Contents
Forum Selection
Our amended and restated certificate of incorporation will provide that unless we consent in writing to the selection of an alternative forum, the Court of Chancery of the State of Delaware will, to the fullest extent permitted by applicable law, be the sole and exclusive forum for:
| • | any derivative action or proceeding brought on our behalf; |
| • | any action asserting a claim of breach of a fiduciary duty owed by any of our directors, officers, employees or agents to us or our stockholders; |
| • | any action asserting a claim against us arising pursuant to any provision of the DGCL, our amended and restated certificate of incorporation or our bylaws; or |
| • | any action asserting a claim against us that is governed by the internal affairs doctrine, in each such case subject to such Court of Chancery having personal jurisdiction over the indispensable parties named as defendants therein. |
Our amended and restated certificate of incorporation will also provide that any person or entity purchasing or otherwise acquiring any interest in shares of our capital stock will be deemed to have notice of and to have consented to this forum selection provision. However, it is possible that a court could find our forum selection provision to be inapplicable or unenforceable.
Limitation of Liability and Indemnification Matters
Our amended and restated certificate of incorporation limits the liability of our directors for monetary damages for breach of their fiduciary duty as directors, except for liability:
| • | for any breach of their duty of loyalty to us or our stockholders; |
| • | for acts or omissions not in good faith or which involve intentional misconduct or a knowing violation of law; |
| • | for unlawful payment of dividend or unlawful stock repurchase or redemption, as provided under Section 174 of the DGCL; or |
| • | for any transaction from which the director derived an improper personal benefit. |
Any amendment, repeal or modification of these provisions will be prospective only and would not affect any limitation on liability of a director for acts or omissions that occurred prior to any such amendment, repeal or modification.
Our amended and restated certificate of incorporation and amended and restated bylaws also provide that we will indemnify and advance expenses to our directors and officers to the fullest extent permitted by Delaware law. Under Delaware law we may purchase insurance on behalf of any officer, director, employee or other agent for any liability arising out of that person’s actions as our officer, director, employee or agent, regardless of whether Delaware law would permit indemnification. We intend to enter into indemnification agreements with each of our current and future directors and officers. These agreements will require us to indemnify these individuals to the fullest extent permitted under Delaware law against liability that may arise by reason of their service to us, and to advance expenses incurred as a result of any proceeding against them as to which they could be indemnified. We believe that the limitation of liability, indemnification and advancement of expenses provisions in our amended and restated certificate of incorporation and the indemnification agreements will facilitate our ability to continue to attract and retain qualified individuals to serve as directors and officers.
121
Table of Contents
Transfer Agent and Registrar
The transfer agent and registrar for our common stock is American Stock Transfer of Trust Company, LLC.
Listing
We have applied to list our common stock on the NYSE under the symbol “FMSA.”
122
Table of Contents
SHARES ELIGIBLE FOR FUTURE SALE
Prior to this offering, there has been no public market for our common stock. Future sales of our common stock in the public market, or the availability of such shares for sale in the public market, could adversely affect the market price of our common stock prevailing from time to time. As described below, only a limited number of shares will be available for sale shortly after this offering due to contractual and legal restrictions on resale. Nevertheless, sales of a substantial number of shares of our common stock in the public market after such restrictions lapse, or the perception that those sales may occur, could adversely affect the prevailing market price of our common stock at such time and our ability to raise equity-related capital at a time and price we deem appropriate.
Sales of Restricted Shares
Upon completion of this offering, we will have outstanding an aggregate of shares of common stock, after giving effect to the for stock split of our common stock to be effected prior to the effective date of the registration statement of which this prospectus forms a part. Of these shares, all of the shares of common stock to be sold in this offering (or shares assuming the underwriters exercise the option to purchase additional shares in full) will be freely tradable without restriction or further registration under the Securities Act, unless the shares are held by any of our “affiliates” as such term is defined in Rule 144 under the Securities Act. All remaining shares of common stock will be deemed “restricted securities” as such term is defined under Rule 144. The restricted securities were, or will be, issued and sold by us in private transactions and are eligible for public sale only if registered under the Securities Act or if they qualify for an exemption from registration under Rule 144 or Rule 701 under the Securities Act, which rules are summarized below.
As a result of the lock-up agreements described below and the provisions of Rule 144 and Rule 701 under the Securities Act, all of the shares of our common stock (excluding the shares to be sold in this offering) will be available for sale in the public market upon the expiration of the lock-up agreements, beginning 180 days after the date of this prospectus (subject to extension) and when permitted under Rule 144 or Rule 701.
Lock-up Agreements
We, ASP FML, all of our directors and executive officers and certain of our principal stockholders and the selling stockholders will agree not to sell any common stock or securities convertible into or exchangeable for shares of common stock for a period of 180 days from the date of this prospectus, subject to certain exceptions. Please see “Underwriting” for a description of these lock-up provisions.
Rule 144
In general, under Rule 144 under the Securities Act as currently in effect, a person (or persons whose shares are aggregated) who is not deemed to have been an affiliate of ours at any time during the three months preceding a sale, and who has beneficially owned restricted securities within the meaning of Rule 144 for a least six months (including any period of consecutive ownership of preceding non-affiliated holders) would be entitled to sell those shares, subject only to the availability of current public information about us. A non-affiliated person who has beneficially owned restricted securities within the meaning of Rule 144 for at least one year would be entitled to sell those shares without regard to the provisions of Rule 144.
A person (or persons whose shares are aggregated) who is deemed to be an affiliate of ours and who has beneficially owned restricted securities within the meaning of Rule 144 for at least six months would be entitled to sell within any three-month period a number of shares that does not exceed the greater of one percent of the then outstanding shares of our common stock or the average weekly trading volume of our common stock reported through the NYSE during the four calendar weeks preceding the filing of notice of the sale. Such sales are also subject to certain manner of sale provisions, notice requirements and the availability of current public information about us.
123
Table of Contents
Rule 701
In general, under Rule 701 under the Securities Act, any of our employees, directors, officers, consultants or advisors who purchases shares from us in connection with a compensatory stock or option plan or other written agreement before the effective date of this offering is entitled to sell such shares 90 days after the effective date of this offering in reliance on Rule 144, without having to comply with the holding period requirement of Rule 144 and, in the case of non-affiliates, without having to comply with the public information, volume limitation or notice filing provisions of Rule 144. The SEC has indicated that Rule 701 will apply to typical stock options granted by an issuer before it becomes subject to the reporting requirements of the Exchange Act, along with the shares acquired upon exercise of such options, including exercises after the date of this prospectus.
Stock Issued Under Employee Plans
We intend to file a registration statement on Form S-8 under the Securities Act to register stock issuable under our LTIP. This registration statement on Form S-8 is expected to be filed following the effective date of the registration statement of which this prospectus is a part and will be effective upon filing. Accordingly, shares registered under such registration statement will be available for sale in the open market following the effective date, unless such shares are subject to vesting restrictions with us, Rule 144 restrictions applicable to our affiliates or the lock-up restrictions described above.
124
Table of Contents
MATERIAL U.S. FEDERAL INCOME TAX CONSIDERATIONS FOR NON-U.S. HOLDERS
The following is a summary of the material U.S. federal income tax consequences related to the purchase, ownership and disposition of our common stock by a non-U.S. holder (as defined below), that holds our common stock as a “capital asset” (generally property held for investment). This summary is based on the provisions of the Internal Revenue Code of 1986, as amended (the “Code”), U.S. Treasury regulations and administrative rulings and judicial decisions, all as in effect on the date hereof, and all of which are subject to change, possibly with retroactive effect. We have not sought any ruling from the U.S. Internal Revenue Service (the “IRS”) with respect to the statements made and the conclusions reached in the following summary, and there can be no assurance that the IRS or a court will agree with such statements and conclusions.
This summary does not address all aspects of U.S. federal income taxation that may be relevant to non-U.S. holders in light of their personal circumstances. In addition, this summary does not address the Medicare contribution tax on certain investment income, any U.S. federal estate and gift tax laws, any state, local or foreign tax laws or any tax treaties. This summary also does not address tax considerations applicable to investors that may be subject to special treatment under the U.S. federal income tax laws, such as (without limitation):
| • | banks, insurance companies or other financial institutions; |
| • | tax-exempt or governmental organizations; |
| • | dealers in securities or foreign currencies; |
| • | traders in securities that use the mark-to-market method of accounting for U.S. federal income tax purposes; |
| • | persons subject to the alternative minimum tax; |
| • | partnerships or other pass-through entities for U.S. federal income tax purposes or holders of interests therein; |
| • | persons deemed to sell our common stock under the constructive sale provisions of the Code; |
| • | persons that acquired our common stock through the exercise of employee stock options or otherwise as compensation or through a tax-qualified retirement plan; |
| • | certain former citizens or long-term residents of the United States; and |
| • | persons that hold our common stock as part of a straddle, appreciated financial position, synthetic security, hedge, conversion transaction or other integrated investment or risk reduction transaction. |
PROSPECTIVE INVESTORS ARE ENCOURAGED TO CONSULT THEIR TAX ADVISORS WITH RESPECT TO THE APPLICATION OF THE U.S. FEDERAL INCOME TAX LAWS TO THEIR PARTICULAR SITUATION, AS WELL AS ANY TAX CONSEQUENCES OF THE PURCHASE, OWNERSHIP AND DISPOSITION OF OUR COMMON STOCK ARISING UNDER THE U.S. FEDERAL ESTATE AND GIFT TAX LAWS OR UNDER THE LAWS OF ANY STATE, LOCAL, NON-U.S. OR OTHER TAXING JURISDICTION OR UNDER ANY APPLICABLE TAX TREATY.
Non-U.S. Holder Defined
For purposes of this discussion, a “non-U.S. holder” is a beneficial owner of our common stock that for U.S. federal income tax purposes is neither a partnership nor any of the following:
| • | an individual who is a citizen or resident of the United States; |
| • | a corporation (or other entity taxable as a corporation for U.S. federal income tax purposes) created or organized in or under the laws of the United States, any state thereof or the District of Columbia; |
125
Table of Contents
| • | an estate, the income of which is subject to U.S. federal income tax regardless of its source; or |
| • | a trust (i) whose administration is subject to the primary supervision of a U.S. court and which has one or more United States persons who have the authority to control all substantial decisions of the trust or (ii) which has made a valid election under applicable U.S. Treasury regulations to be treated as a United States person. |
If a partnership (including an entity treated as a partnership for U.S. federal income tax purposes) holds our common stock, the tax treatment of a partner in the partnership generally will depend upon the status of the partner and upon the activities of the partnership. Accordingly, we urge partners in partnerships (including entities treated as partnerships for U.S. federal income tax purposes) considering the purchase of our common stock to consult their tax advisors regarding the U.S. federal income tax considerations of the purchase, ownership and disposition of our common stock by such partnership.
Distributions
As described in the section entitled “Dividend Policy,” we do not plan to make any distributions on our common stock for the foreseeable future. However, if we do make distributions of cash or property on our common stock, those payments will constitute dividends for U.S. federal income tax purposes to the extent paid from our current or accumulated earnings and profits, as determined under U.S. federal income tax principles. To the extent those distributions exceed our current and accumulated earnings and profits, the distributions will be treated as a non-taxable return of capital to the extent of the non-U.S. holder’s tax basis in our common stock and thereafter as capital gain from the sale or exchange of such common stock. See “—Gain on Disposition of Common Stock.” Subject to the discussion below on backup withholding and FATCA withholding, distribution made to a non-U.S. holder on our common stock generally will be subject to U.S. withholding tax at a rate of 30% of the gross amount of the distribution unless an applicable income tax treaty provides for a lower rate. To receive the benefit of a reduced treaty rate, a non-U.S. holder must provide the withholding agent with an IRS Form W-8BEN or W-8BEN-E (or other appropriate form) certifying qualification for the reduced rate. A non-U.S. holder that does not timely furnish the applicable withholding agent with the required certification, but that qualifies for a reduced treaty rate, may obtain a refund of any excess amounts withheld by timely filing an appropriate claim for refund with the IRS.
Dividends paid to a non-U.S. holder that are effectively connected with a trade or business conducted by the non-U.S. holder in the United States (and, if required by an applicable income tax treaty, are treated as attributable to a permanent establishment maintained by the non-U.S. holder in the United States) generally will be taxed on a net income basis at the rates and in the manner generally applicable to United States persons (as defined under the Code). Such effectively connected dividends will not be subject to U.S. withholding tax if the non-U.S. holder satisfies certain certification requirements by providing the withholding agent a properly executed IRS Form W-8ECI certifying eligibility for exemption. If the non-U.S. holder is a foreign corporation, it may also be subject to a branch profits tax (at a 30% rate or such lower rate as specified by an applicable income tax treaty) on its effectively connected earnings and profits (as adjusted for certain items).
Gain on Disposition of Common Stock
Subject to the discussion below on backup withholding and FATCA withholding, a non-U.S. holder generally will not be subject to U.S. federal income tax on any gain realized upon the sale or other disposition of our common stock unless:
| • | the non-U.S. holder is an individual who is present in the United States for a period or periods aggregating 183 days or more during the calendar year in which the sale or disposition occurs and certain other conditions are met; |
| • | the gain is effectively connected with a trade or business conducted by the non-U.S. holder in the United States (and, if required by an applicable tax treaty, is attributable to a permanent establishment maintained by the non-U.S. holder in the United States); or |
126
Table of Contents
| • | our common stock constitutes a U.S. real property interest by reason of our status as a United States real property holding corporation (“USRPHC”) for U.S. federal income tax purposes. |
A non-U.S. holder described in the first bullet point above will be subject to U.S. federal income tax at a rate of 30% (or such lower rate as specified by an applicable income tax treaty) on the amount of such gain, which generally may be offset by U.S. source capital losses.
A non-U.S. holder whose gain is described in the second bullet point above generally will be taxed on a net income basis at the rates and in the manner generally applicable to United States persons (as defined under the Code) unless an applicable income tax treaty provides otherwise. If the non-U.S. holder is a corporation, it may also be subject to a branch profits tax (at a 30% rate or such lower rate as specified by an applicable income tax treaty) on its effectively connected earnings and profits (as adjusted for certain items) which will include such gain.
Generally, a corporation is a USRPHC if the fair market value of its U.S. real property interests equals or exceeds 50% of the sum of the fair market value of its worldwide real property interests and its other assets used or held for use in a trade or business. We have not determined whether we currently are, a USRPHC for U.S. federal income tax purposes. However, as long as our common stock is considered to be regularly traded on an established securities market, within the meaning of applicable Treasury Regulations, only a non-U.S. holder that actually or constructively owns or owned at any time during the shorter of the five-year period ending on the date of the disposition or the non-U.S. holder’s holding period for the common stock, more than 5% of our common stock will be taxable on gain recognized on the disposition of our common stock as a result of our status as a USRPHC. If our common stock were not considered to be regularly traded on an established securities market, and we were considered a USRPHC, all non-U.S. holders generally would be subject to U.S. federal income tax on a taxable disposition of our common stock, and a 10% withholding tax would apply to the gross proceeds from the sale of our common stock by such non-U.S. holders.
Non-U.S. holders should consult their tax advisors with respect to the application of the foregoing rules to their ownership and disposition of our common stock.
Backup Withholding and Information Reporting
Any dividends paid to a non-U.S. holder must be reported annually to the IRS and to the non-U.S. holder. Copies of these information returns may be made available to the tax authorities in the country in which the non-U.S. holder resides or is established. Payments of dividends to a non-U.S. holder generally will not be subject to backup withholding if the non-U.S. holder establishes an exemption by properly certifying its non-U.S. status on an IRS Form W-8BEN or W-8BEN-E or other appropriate version of IRS Form W-8.
Payments of the proceeds from a sale or other disposition by a non-U.S. holder of our common stock effected by or through a U.S. office of a broker generally will be subject to information reporting and backup withholding (at the applicable rate) unless the non-U.S. holder establishes an exemption by properly certifying its non-U.S. status on an IRS Form W-8BEN or W-8BEN-E or other appropriate version of IRS Form W-8 and certain other conditions are met. Information reporting and backup withholding generally will not apply to any payment of the proceeds from a sale or other disposition of our common stock effected outside the United States by a foreign office of a broker. However, unless such broker has documentary evidence in its records that the holder is a non-U.S. holder and certain other conditions are met, or the non-U.S. holder otherwise establishes an exemption, information reporting will apply to a payment of the proceeds of the disposition of our common stock effected outside the United States by such a broker if it has certain relationships within the United States.
Backup withholding is not an additional tax. Rather, the U.S. income tax liability (if any) of persons subject to backup withholding will be reduced by the amount of tax withheld. If withholding results in an overpayment of taxes, a refund may be obtained, provided that the required information is timely furnished to the IRS.
127
Table of Contents
Additional Withholding Requirements
Sections 1471 through 1474 of the Code, and the Treasury regulations and administrative guidance issued thereunder (“FATCA”), impose a 30% withholding tax on any dividends on our common stock and on the gross proceeds from a disposition of our common stock in each case if paid to a “foreign financial institution” or a “non-financial foreign entity” (each as defined in the Code) (including, in some cases, when such foreign financial institution or entity is acting as an intermediary), unless (i) in the case of a foreign financial institution, such institution enters into an agreement with the U.S. government to withhold on certain payments, and to collect and provide to the U.S. tax authorities substantial information regarding U.S. account holders of such institution (which includes certain equity and debt holders of such institution, as well as certain account holders that are foreign entities with U.S. owners), (ii) in the case of a non-financial foreign entity, such entity certifies that it does not have any “substantial United States owners” (as defined in the Code) or provides the withholding agent with a certification identifying the direct and indirect substantial United States owners of the entity, or (iii) the foreign financial institution or non-financial foreign entity otherwise qualifies for an exemption from these rules. Foreign financial institutions located in jurisdictions that have an intergovernmental agreement with the United States governing these rules may be subject to different rules. Under certain circumstances, a holder might be eligible for refunds or credits of such taxes.
Payments subject to FATCA withholding generally include dividends paid on common stock of a U.S. corporation after June 30, 2014, and gross proceeds from sales or other dispositions of such common stock after December 31, 2016. Non-U.S. holders are encouraged to consult their tax advisors regarding the possible implications of the FATCA withholding rules.
THE FOREGOING DISCUSSION IS FOR GENERAL INFORMATION ONLY AND SHOULD NOT BE VIEWED AS TAX ADVICE. INVESTORS CONSIDERING THE PURCHASE OF OUR COMMON STOCK ARE URGED TO CONSULT THEIR OWN TAX ADVISORS REGARDING THE APPLICATION OF THE U.S. FEDERAL INCOME TAX LAWS TO THEIR PARTICULAR SITUATIONS AND THE APPLICABILITY AND EFFECT OF U.S. FEDERAL ESTATE AND GIFT TAX LAWS AND ANY STATE, LOCAL OR FOREIGN TAX LAWS AND TAX TREATIES.
128
Table of Contents
Morgan Stanley & Co. LLC, Wells Fargo Securities, LLC and Barclays Capital Inc. are acting as representatives of the underwriters. Under the terms of an underwriting agreement, which will be filed as an exhibit to the registration statement, each of the underwriters named below has severally agreed to purchase from the selling stockholders the respective number of common stock shown opposite its name below:
| Underwriters |
Number of Shares | |
| Morgan Stanley & Co. LLC |
||
| Wells Fargo Securities, LLC |
||
| Barclays Capital Inc. |
||
| Goldman, Sachs & Co. |
||
| Jefferies LLC |
||
| J.P. Morgan Securities LLC |
||
| KeyBanc Capital Markets Inc. |
||
| RBC Capital Markets, LLC |
||
| Robert W. Baird & Co. Incorporated |
||
| Cowen and Company, LLC |
||
| PNC Capital Markets LLC |
||
| Raymond James & Associates, Inc. |
||
| Scotia Capital (USA) Inc. |
||
| Simmons & Company International |
||
| Tudor, Pickering, Holt & Co. Securities, Inc. |
||
|
| ||
| Total |
||
|
|
The underwriting agreement provides that the underwriters’ obligation to purchase shares of common stock depends on the satisfaction of the conditions contained in the underwriting agreement including:
| • | the obligation to purchase all of the shares of common stock offered hereby (other than those shares of common stock covered by their option to purchase additional shares as described below), if any of the shares are purchased; |
| • | the representations and warranties made by us and the selling stockholders to the underwriters are true; |
| • | there is no material change in our business or the financial markets; and |
| • | we and the selling stockholders deliver customary closing documents to the underwriters. |
Commissions and Expenses
The following table summarizes the underwriting discounts and commissions the selling stockholders will pay to the underwriters. These amounts are shown assuming both no exercise and full exercise of the underwriters’ option to purchase additional shares. The underwriting fee is the difference between the initial price to the public and the amount the underwriters pay to the selling stockholders for the shares.
| No Exercise | Full Exercise | |||||||
| Per Share |
$ | $ | ||||||
| Total |
$ | $ | ||||||
The representatives have advised us that the underwriters propose to offer the shares of common stock directly to the public at the public offering price on the cover of this prospectus and to selected dealers, which may include the underwriters, at such offering price less a selling concession not in excess of $ per share. After the offering, the representatives may change the offering price and other selling terms.
129
Table of Contents
The expenses of the offering that are payable by us are estimated to be approximately $ (excluding underwriting discounts and commissions). We have agreed to pay expenses incurred by the selling stockholders in connection with the offering, other than the underwriting discounts and commissions. We have also agreed to reimburse the underwriters for certain of their expenses in an amount up to $ .
The management team may elect to cause the underwriters to direct a portion of the gross underwriting discounts and commissions to the Fairmount Foundation. If elected, the contribution will be treated as a shared expense amongst the underwriters.
Option to Purchase Additional Shares
The selling stockholders have granted the underwriters an option exercisable for 30 days after the date of this prospectus to purchase, from time to time, in whole or in part, up to an aggregate of shares from the selling stockholders at the public offering price less underwriting discounts and commissions. This option may be exercised to the extent the underwriters sell more than shares in connection with this offering. To the extent that this option is exercised, each underwriter will be obligated, subject to certain conditions, to purchase its pro rata portion of these additional shares based on the underwriter’s percentage underwriting commitment in the offering as indicated in the table at the beginning of this Underwriting Section.
Lock-Up Agreements
We, ASP FML, all of our directors and executive officers and certain of our principal stockholders and the selling stockholders will agree that, for a period of 180 days after the date of this prospectus, we and they will not directly or indirectly, without the prior written consent of at least two of the representatives consisting of Morgan Stanley & Co. LLC, Wells Fargo Securities, LLC and Barclays Capital Inc. and subject to certain exceptions (1) offer, pledge, sell, contract to sell, sell any option or contract to purchase, purchase any option or contract to sell, grant any option, right or warrant to purchase, lend, or otherwise transfer or dispose of, directly or indirectly, any shares of common stock (including, without limitation, shares of common stock that may be deemed to be beneficially owned by us or them in accordance with the rules and regulations of the SEC and shares of common stock that may be issued upon exercise of any options or warrants) or securities convertible into or exercisable or exchangeable for common stock (other than the stock and shares issued pursuant to employee benefit plans, qualified stock option plans, or other employee compensation plans existing on the date of this prospectus or pursuant to currently outstanding options, warrants or rights not issued under one of those plans), (2) enter into any swap or other arrangement that transfers to another, in whole or in part, any of the economic consequences of ownership of shares of common stock, whether any such transaction described in clause (1) or (2) above is to be settled by delivery of common stock or such other securities, in cash or otherwise or (3) file any registration statement with the SEC relating to the offering of any shares of common stock or any securities convertible or exchangeable into common stock.
Morgan Stanley & Co. LLC, Wells Fargo Securities, LLC and Barclays Capital Inc., in their sole discretion, may release the common stock and other securities subject to the lock-up agreements described above in whole or in part at any time. When determining whether or not to release common stock and other securities from lock-up agreements, Morgan Stanley & Co. LLC, Wells Fargo Securities, LLC and Barclays Capital Inc. will consider, among other factors, the holder’s reasons for requesting the release, the number of shares of common stock and other securities for which the release is being requested and market conditions at the time. At least three business days before the effectiveness of any release or waiver of any of the restrictions described above with respect to an officer or director of the Company, at least two of the representatives consisting of Morgan Stanley & Co. LLC, Wells Fargo Securities, LLC and Barclays Capital Inc. will notify us of the impending release or waiver and we have agreed to announce the impending release or waiver by press release through a major news service at least two business days before the effective date of the release or waiver, except where the release or waiver is effected solely to permit a transfer of common stock that is not for consideration and where the transferee has agreed in writing to be bound by the same terms as the lock-up agreements described above to the extent and for the duration that such terms remain in effect at the time of transfer.
130
Table of Contents
Offering Price Determination
Prior to this offering, there has been no public market for our common stock. The initial public offering price was negotiated between the representatives and the selling stockholders. In determining the initial public offering price of our common stock, the representatives considered:
| • | the history and prospects for the industry in which we compete; |
| • | our financial information; |
| • | the ability of our management and our business potential and earning prospects; |
| • | the prevailing securities markets at the time of this offering; and |
| • | the recent market prices of, and the demand for, publicly traded shares of generally comparable companies. |
Indemnification
We and the selling stockholders have agreed to indemnify the underwriters against certain liabilities, including liabilities under the Securities Act, and to contribute to payments that the underwriters may be required to make for these liabilities.
Stabilization, Short Positions and Penalty Bids
The representative may engage in stabilizing transactions, short sales and purchases to cover positions created by short sales, and penalty bids or purchases for the purpose of pegging, fixing or maintaining the price of the common stock, in accordance with Regulation M under the Exchange Act:
| • | Stabilizing transactions permit bids to purchase the underlying security so long as the stabilizing bids do not exceed a specified maximum. |
| • | A short position involves a sale by the underwriters of shares in excess of the number of shares the underwriters are obligated to purchase in the offering, which creates the syndicate short position. This short position may be either a covered short position or a naked short position. In a covered short position, the number of shares involved in the sales made by the underwriters in excess of the number of shares they are obligated to purchase is not greater than the number of shares that they may purchase by exercising their option to purchase additional shares. In a naked short position, the number of shares involved is greater than the number of shares in their option to purchase additional shares. The underwriters may close out any short position by either exercising their option to purchase additional shares and/or purchasing shares in the open market. In determining the source of shares to close out the short position, the underwriters will consider, among other things, the price of shares available for purchase in the open market as compared to the price at which they may purchase shares through their option to purchase additional shares. A naked short position is more likely to be created if the underwriters are concerned that there could be downward pressure on the price of the shares in the open market after pricing that could adversely affect investors who purchase in the offering. |
| • | Syndicate covering transactions involve purchases of the common stock in the open market after the distribution has been completed in order to cover syndicate short positions. |
| • | Penalty bids permit the representative to reclaim a selling concession from a syndicate member when the common stock originally sold by the syndicate member is purchased in a stabilizing or syndicate covering transaction to cover syndicate short positions. |
These stabilizing transactions, syndicate covering transactions and penalty bids may have the effect of raising or maintaining the market price of our common stock or preventing or retarding a decline in the market price of the common stock. As a result, the price of the common stock may be higher than the price that might otherwise exist in the open market. These transactions may be effected on the NYSE or otherwise and, if commenced, may be discontinued at any time.
131
Table of Contents
Neither we nor any of the underwriters make any representation or prediction as to the direction or magnitude of any effect that the transactions described above may have on the price of the common stock. In addition, neither we nor any of the underwriters make any representation that the representative will engage in these stabilizing transactions or that any transaction, once commenced, will not be discontinued without notice.
Listing on the New York Stock Exchange
We have applied to list our common stock on the NYSE under the symbol “FMSA.”
Stamp Taxes
If you purchase shares of common stock offered in this prospectus, you may be required to pay stamp taxes and other charges under the laws and practices of the country of purchase, in addition to the offering price listed on the cover page of this prospectus.
Other Relationships
The underwriters and certain of their affiliates are full service financial institutions engaged in various activities, which may include securities trading, commercial and investment banking, financial advisory, investment management, investment research, principal investment, hedging, financing and brokerage activities. The underwriters and certain of their affiliates have, from time to time, performed, and may in the future perform, various commercial and investment banking and financial advisory services for the issuer and its affiliates, for which they received or may in the future receive customary fees and expenses.
In the ordinary course of their various business activities, the underwriters and certain of their affiliates may make or hold a broad array of investments and actively trade debt and equity securities (or related derivative securities) and financial instruments (including bank loans) for their own account and for the accounts of their customers, and such investment and securities activities may involve securities and/or instruments of the issuer or its affiliates. If the underwriters or their affiliates have a lending relationship with us, certain of those underwriters or their affiliates routinely hedge, and certain other of those underwriters or their affiliates may hedge, their credit exposure to us consistent with their customary risk management policies. Typically, the underwriters and their affiliates would hedge such exposure by entering into transactions which consist of either the purchase of credit default swaps or the creation of short positions in our securities or the securities of our affiliates, including potentially the shares of common stock offered hereby. Any such credit default swaps or short positions could adversely affect future trading prices of the shares of common stock offered hereby. The underwriters and certain of their affiliates may also communicate independent investment recommendations, market color or trading ideas and/or publish or express independent research views in respect of such securities or instruments and may at any time hold, or recommend to clients that they acquire, long and/or short positions in such securities and instruments.
Selling Restrictions
This prospectus does not constitute an offer to sell to, or a solicitation of an offer to buy from, anyone in any country or jurisdiction (i) in which such an offer or solicitation is not authorized, (ii) in which any person making such offer or solicitation is not qualified to do so or (iii) in which any such offer or solicitation would otherwise be unlawful. No action has been taken that would, or is intended to, permit a public offer of the shares of common stock or possession or distribution of this prospectus or any other offering or publicity material relating to the shares of common stock in any country or jurisdiction (other than the United States) where any such action for that purpose is required. Accordingly, each underwriter has undertaken that it will not, directly or indirectly, offer or sell any shares of common stock or have in its possession, distribute or publish any prospectus, form of application, advertisement or other document or information in any country or jurisdiction except under circumstances that will, to the best of its knowledge and belief, result in compliance with any applicable laws and regulations and all offers and sales of shares of common stock by it will be made on the same terms.
132
Table of Contents
European Economic Area
In relation to each Member State of the European Economic Area which has implemented the Prospectus Directive (each, a “Relevant Member State”) an offer to the public of any common stock which are the subject of the offering contemplated herein may not be made in that Relevant Member State, except that an offer to the public in that Relevant Member State of any common stock may be made at any time under the following exemptions under the Prospectus Directive, if they have been implemented in that Relevant Member State:
| • | to legal entities which are qualified investors as defined under the Prospectus Directive; |
| • | by the underwriters to fewer than 100, or, if the Relevant Member State has implemented the relevant provisions of the 2010 PD Amending Directive, 150, natural or legal persons (other than qualified investors as defined in the Prospectus Directive), as permitted under the Prospectus Directive, subject to obtaining the prior consent of the representative of the underwriters for any such offer; or |
| • | in any other circumstances falling within Article 3(2) of the Prospectus Directive, |
provided that no such offer of common stock shall result in a requirement for us, the selling stockholders or any underwriter to publish a prospectus pursuant to Article 3 of the Prospectus Directive or supplement a prospectus pursuant to Article 16 of the Prospectus Directive.
Each person in a Relevant Member State who receives any communication in respect of, or who acquires any common stock under, the offers contemplated here in this prospectus will be deemed to have represented, warranted and agreed to and with each underwriter, the selling stockholders and us that:
| • | it is a qualified investor as defined under the Prospectus Directive; and |
| • | in the case of any common stock acquired by it as a financial intermediary, as that term is used in Article 3(2) of the Prospectus Directive, (i) the common stock acquired by it in the offering have not been acquired on behalf of, nor have they been acquired with a view to their offer or resale to, persons in any Relevant Member State other than qualified investors, as that term is defined in the Prospectus Directive, or in the circumstances in which the prior consent of the representative of the underwriters has been given to the offer or resale or (ii) where common stock have been acquired by it on behalf of persons in any Relevant Member State other than qualified investors, the offer of such common stock to it is not treated under the Prospectus Directive as having been made to such persons. |
For the purposes of this representation and the provision above, the expression an “offer of common stock to the public” in relation to any common stock in any Relevant Member State means the communication in any form and by any means of sufficient information on the terms of the offer and any common stock to be offered so as to enable an investor to decide to purchase or subscribe for the common stock, as the same may be varied in that Relevant Member State by any measure implementing the Prospectus Directive in that Relevant Member State, the expression “Prospectus Directive” means Directive 2003/71/EC (and amendments thereto, including the 2010 PD Amending Directive, to the extent implemented in the Relevant Member State), and includes any relevant implementing measure in each Relevant Member State and the expression “2010 PD Amending Directive” means Directive 2010/73/EU.
United Kingdom
This prospectus has only been communicated or caused to have been communicated and will only be communicated or caused to be communicated as an invitation or inducement to engage in investment activity (within the meaning of Section 21 of the Financial Services and Markets Act of 2000 (the “FSMA”)) as received in connection with the issue or sale of the common stock in circumstances in which Section 21(1) of the FSMA does not apply to us. All applicable provisions of the FSMA will be complied with in respect to anything done in relation to the common stock in, from or otherwise involving the United Kingdom.
133
Table of Contents
Notice to Residents of Canada
The common stock may be sold only to purchasers purchasing as principal that are both “accredited investors” as defined in National Instrument 45-106 Prospectus and Registration Exemptions and “permitted clients” as defined in National Instrument 31-103 Registration Requirements, Exemptions and Ongoing Registrant Obligations. Any resale of the common stock must be made in accordance with an exemption from the prospectus requirements and in compliance with the registration requirements of applicable securities laws.
134
Table of Contents
The validity of the common stock offered hereby will be passed upon for us by Vinson & Elkins, LLP, Houston, Texas. Certain legal matters will be passed upon for the underwriters by Latham & Watkins LLP, Houston, TX.
The consolidated financial statements as of December 31, 2013 and 2012 and for each of the two years in the period ended December 31, 2013 included in this prospectus have been so included in reliance on the report of PricewaterhouseCoopers LLP, an independent registered public accounting firm, given on the authority of said firm as experts in auditing and accounting.
The information appearing in this prospectus concerning estimates of our proven mineral reserves was derived from the report of GZA GeoEnvironmental, Inc., independent mining engineers and geologists, and has been included herein under the authority of said firm as experts with respect to the matters covered by such report and in giving such report.
WHERE YOU CAN FIND MORE INFORMATION
We have filed with the SEC a registration statement on Form S-1 under the Securities Act to register our common stock being offered in this prospectus. This prospectus, which forms part of the registration statement, does not contain all of the information included in the registration statement and the attached exhibits. You will find additional information about us and our common stock in the registration statement. References in this prospectus to any of our contracts, agreements or other documents are not necessarily complete, and you should refer to the exhibits attached to the registration statement for copies of the actual contracts, agreements or documents.
You may read and copy the registration statement, the related exhibits and other information we file with the SEC at the SEC’s Public Reference Room at 100 F Street, N.E., Room 1580, Washington, D.C. 20549. You may also obtain copies of this information by mail from the Public Reference Room at prescribed rates. You may obtain information regarding the operation of the Public Reference Room by calling 1-800-SEC-0330. The SEC also maintains a website that contains reports, proxy statements and other information about companies like us, who file electronically with the SEC. The address of that website is http://www.sec.gov. This reference to the SEC’s website is an inactive textual reference only and is not a hyperlink.
Upon the effectiveness of the registration statement, we will be subject to the reporting, proxy and information requirements of the Exchange Act, and will be required to file periodic reports, proxy statements and other information with the SEC. These periodic reports, proxy statements and other information will be available for inspection and copying at the SEC’s Public Reference Room and the website of the SEC referred to above, as well as on our website, http://www.fairmountminerals.com. This reference to our website is an inactive textual reference only and is not a hyperlink. The contents of our website are not part of this prospectus, and you should not consider the contents of our website in making an investment decision with respect to our common stock. We will furnish our stockholders with annual reports containing audited financial statements and quarterly reports containing unaudited interim financial statements for each of the first three quarters of each year.
135
Table of Contents
INDEX TO CONSOLIDATED FINANCIAL STATEMENTS
F-1
Table of Contents
REPORT OF INDEPENDENT REGISTERED PUBLIC ACCOUNTING FIRM
To the Board of Directors and Stockholders of FML Holdings, Inc.:
In our opinion, the accompanying consolidated balance sheets and the related consolidated statements of income, comprehensive income, equity and cash flows present fairly, in all material respects, the financial position of FML Holdings, Inc. and its subsidiaries (the “Company”) at December 31, 2013 and 2012, and the results of their operations and their cash flows for each of the two years in the period ended December 31, 2013 in conformity with accounting principles generally accepted in the United States of America. These financial statements are the responsibility of the Company’s management. Our responsibility is to express an opinion on these financial statements based on our audits. We conducted our audits of these statements in accordance with the standards of the Public Company Accounting Oversight Board (United States). Those standards require that we plan and perform the audit to obtain reasonable assurance about whether the financial statements are free of material misstatement. An audit includes examining, on a test basis, evidence supporting the amounts and disclosures in the financial statements, assessing the accounting principles used and significant estimates made by management, and evaluating the overall financial statement presentation. We believe that our audits provide a reasonable basis for our opinion.
/s/ PricewaterhouseCoopers LLP
Cleveland, OH
July 11, 2014
F-2
Table of Contents
FML Holdings, Inc. and Subsidiaries
Consolidated Statements of Income
Years Ended December 31, 2013 and 2012
| Year Ended December 31, | ||||||||
| 2013 | 2012 | |||||||
| (in thousands, except share and per share amounts) |
||||||||
| Revenue |
$ | 988,386 | $ | 885,190 | ||||
| Cost of sales (excluding depreciation, depletion, amortization, and stock compensation expense shown separately) |
627,842 | 502,417 | ||||||
| Operating expenses |
||||||||
| Selling, general, and administrative expenses |
81,858 | 65,430 | ||||||
| Depreciation, depletion, and amortization expense |
37,771 | 27,690 | ||||||
| Stock compensation expense |
10,133 | 11,434 | ||||||
| Other operating expense (income) |
2,826 | (207 | ) | |||||
|
|
|
|
|
|||||
| Income from operations |
227,956 | 278,426 | ||||||
| Interest expense, net |
61,926 | 56,714 | ||||||
| Loss on extinguishment of debt |
11,760 | — | ||||||
| Other non-operating expense |
4,394 | 1,870 | ||||||
|
|
|
|
|
|||||
| Income before provision for income taxes |
149,876 | 219,842 | ||||||
| Provision for income taxes |
45,219 | 70,369 | ||||||
|
|
|
|
|
|||||
| Net income |
104,657 | 149,473 | ||||||
| Less: Net income attributable to the noncontrolling interest |
696 | 587 | ||||||
|
|
|
|
|
|||||
| Net income attributable to FML Holdings, Inc. |
$ | 103,961 | $ | 148,886 | ||||
|
|
|
|
|
|||||
| Earnings per share |
||||||||
| Basic |
$ | 22.66 | $ | 32.49 | ||||
| Diluted |
$ | 21.47 | $ | 30.80 | ||||
| Weighted average shares outstanding |
||||||||
| Basic |
4,588,477 | 4,583,141 | ||||||
| Diluted |
4,842,281 | 4,833,186 | ||||||
The accompanying notes are an integral part of these consolidated financial statements.
F-3
Table of Contents
FML Holdings, Inc. and Subsidiaries
Consolidated Statements of Comprehensive Income
Years Ended December 31, 2013 and 2012
| Year Ended December 31, | ||||||||
| 2013 | 2012 | |||||||
| (in thousands) | ||||||||
| Net income |
$ | 104,657 | $ | 149,473 | ||||
| Other comprehensive income (loss), net of tax: |
||||||||
| Foreign currency translation adjustment |
(2 | ) | 308 | |||||
| Pension obligations |
914 | 166 | ||||||
| Change in fair value of derivative swap agreements |
4,751 | (643 | ) | |||||
|
|
|
|
|
|||||
| Total other comprehensive income (loss), net of tax |
5,663 | (169 | ) | |||||
|
|
|
|
|
|||||
| Comprehensive income |
110,320 | 149,304 | ||||||
| Comprehensive income (loss) attributable to the noncontrolling interest |
696 | 791 | ||||||
|
|
|
|
|
|||||
| Comprehensive income attributable to FML Holdings, Inc. |
$ | 109,624 | $ | 148,513 | ||||
|
|
|
|
|
|||||
The accompanying notes are an integral part of these consolidated financial statements.
F-4
Table of Contents
FML Holdings, Inc. and Subsidiaries
Consolidated Balance Sheets
December 31, 2013 and 2012
| December 31, | ||||||||
| 2013 | 2012 | |||||||
| (in thousands, except share and per share amounts) |
||||||||
| Assets |
||||||||
| Current assets |
||||||||
| Cash and cash equivalents |
$ | 17,815 | $ | 11,866 | ||||
| Accounts receivable, net |
146,851 | 123,388 | ||||||
| Inventories |
118,349 | 91,432 | ||||||
| Deferred income taxes |
11,748 | 5,315 | ||||||
| Prepaid expenses and other assets |
10,575 | 4,975 | ||||||
|
|
|
|
|
|||||
| Total current assets |
305,338 | 236,976 | ||||||
| Property, plant and equipment, net |
748,838 | 375,162 | ||||||
| Goodwill |
87,452 | 35,137 | ||||||
| Intangibles, net |
106,236 | 383 | ||||||
| Other assets |
35,567 | 31,943 | ||||||
|
|
|
|
|
|||||
| Total assets |
$ | 1,283,431 | $ | 679,601 | ||||
|
|
|
|
|
|||||
| Liabilities and Equity |
||||||||
| Current liabilities |
||||||||
| Current portion of long-term debt |
15,687 | 3,332 | ||||||
| Accounts payable |
89,998 | 43,456 | ||||||
| Accrued expenses |
28,706 | 28,277 | ||||||
|
|
|
|
|
|||||
| Total current liabilities |
134,391 | 75,065 | ||||||
| Long-term debt |
1,246,459 | 827,863 | ||||||
| Deferred income taxes |
46,851 | 36,472 | ||||||
| Other long-term liabilities |
21,088 | 26,129 | ||||||
|
|
|
|
|
|||||
| Total liabilities |
1,448,789 | 965,529 | ||||||
|
|
|
|
|
|||||
| Commitments and contingencies (Note 19) |
||||||||
| Equity |
||||||||
| Class A common stock: $0.01 par value, 8,000,000 authorized shares |
||||||||
| Shares outstanding: 4,594,501 and 4,580,726 at December 31, 2013 and 2012, respectively |
69 | 69 | ||||||
| Class B common stock: $0.01 par value, 2,000,000 authorized shares |
||||||||
| Shares outstanding: 7,333 and 3,901 at December 31, 2013 and 2012, respectively |
— | — | ||||||
| Additional paid-in capital |
735,360 | 722,123 | ||||||
| Retained earnings |
326,729 | 222,768 | ||||||
| Accumulated other comprehensive income (loss) |
(3,536 | ) | (9,199 | ) | ||||
|
|
|
|
|
|||||
| Total equity attributable to FML Holdings, Inc. before treasury stock |
1,058,622 | 935,761 | ||||||
| Less: Treasury stock at cost |
||||||||
| Shares in treasury: 2,285,475 and 2,280,824 at December 31, 2013 and 2012, respectively |
(1,227,001 | ) | (1,225,299 | ) | ||||
|
|
|
|
|
|||||
| Total equity (deficit) attributable to FML Holdings, Inc. |
(168,379 | ) | (289,538 | ) | ||||
| Noncontrolling interest |
3,021 | 3,610 | ||||||
|
|
|
|
|
|||||
| Total equity (deficit) |
(165,358 | ) | (285,928 | ) | ||||
|
|
|
|
|
|||||
| Total liabilities and equity |
$ | 1,283,431 | $ | 679,601 | ||||
|
|
|
|
|
|||||
The accompanying notes are an integral part of these consolidated financial statements.
F-5
Table of Contents
FML Holdings, Inc. and Subsidiaries
Consolidated Statements of Equity
Years Ended December 31, 2013 and 2012
| Equity (deficit) attributable to FML Holdings, Inc. | Non Controlling Interest |
Total Equity (Deficit) |
||||||||||||||||||||||||||||||
| Common Stock |
Additional Paid-in Capital |
Retained Earnings |
Other Comprehensive Income (Loss) |
Treasury Stock |
Subtotal | |||||||||||||||||||||||||||
| (in thousands) | ||||||||||||||||||||||||||||||||
| Balances at December 31, 2011 |
$ | 69 | $ | 708,111 | $ | 73,882 | $ | (8,826 | ) | $ | (1,224,285 | ) | $ | (451,049 | ) | $ | 3,057 | $ | (447,992 | ) | ||||||||||||
| Purchase of treasury stock |
— | — | — | — | (1,014 | ) | (1,014 | ) | — | (1,014 | ) | |||||||||||||||||||||
| Stock options exercised |
— | 716 | — | — | — | 716 | — | 716 | ||||||||||||||||||||||||
| Stock compensation expense |
— | 11,434 | — | — | — | 11,434 | — | 11,434 | ||||||||||||||||||||||||
| Tax effect of stock options exercised |
— | 901 | — | — | — | 901 | — | 901 | ||||||||||||||||||||||||
| Tax effect for deferred stockholder payments |
— | 961 | — | — | — | 961 | — | 961 | ||||||||||||||||||||||||
| Purchase of noncontrolling interest |
— | — | — | — | — | — | (238 | ) | (238 | ) | ||||||||||||||||||||||
| Net income |
— | — | 148,886 | — | — | 148,886 | 587 | 149,473 | ||||||||||||||||||||||||
| Other comprehensive income (loss) |
— | — | — | (373 | ) | — | (373 | ) | 204 | (169 | ) | |||||||||||||||||||||
|
|
|
|
|
|
|
|
|
|
|
|
|
|
|
|
|
|||||||||||||||||
| Balances at December 31, 2012 |
69 | 722,123 | 222,768 | (9,199 | ) | (1,225,299 | ) | (289,538 | ) | 3,610 | (285,928 | ) | ||||||||||||||||||||
| Purchase of treasury stock |
— | — | — | — | (1,702 | ) | (1,702 | ) | — | (1,702 | ) | |||||||||||||||||||||
| Stock options exercised |
— | 1,277 | — | — | — | 1,277 | — | 1,277 | ||||||||||||||||||||||||
| Stock compensation expense |
— | 10,133 | — | — | — | 10,133 | — | 10,133 | ||||||||||||||||||||||||
| Tax effect of stock options exercised |
— | 1,827 | — | — | — | 1,827 | — | 1,827 | ||||||||||||||||||||||||
| Transactions with noncontrolling interest |
— | — | — | — | — | — | (1,285 | ) | (1,285 | ) | ||||||||||||||||||||||
| Net income |
— | — | 103,961 | — | — | 103,961 | 696 | 104,657 | ||||||||||||||||||||||||
| Other comprehensive income |
— | — | — | 5,663 | — | 5,663 | — | 5,663 | ||||||||||||||||||||||||
|
|
|
|
|
|
|
|
|
|
|
|
|
|
|
|
|
|||||||||||||||||
| Balances at December 31, 2013 |
$ | 69 | $ | 735,360 | $ | 326,729 | $ | (3,536 | ) | $ | (1,277,001 | ) | $ | (168,379 | ) | $ | 3,021 | $ | (165,358 | ) | ||||||||||||
|
|
|
|
|
|
|
|
|
|
|
|
|
|
|
|
|
|||||||||||||||||
The accompanying notes are an integral part of these consolidated financial statements.
F-6
Table of Contents
FML Holdings, Inc. and Subsidiaries
Consolidated Statements of Cash Flows
Years Ended December 31, 2013 and 2012
| Year Ended December 31, | ||||||||
| 2013 | 2012 | |||||||
| (in thousands) | ||||||||
| Net income |
$ | 104,657 | $ | 149,473 | ||||
| Adjustments to reconcile net income to net cash provided by operating activities: |
||||||||
| Depreciation and depletion |
35,917 | 27,562 | ||||||
| Amortization of deferred financing costs |
6,199 | 6,615 | ||||||
| Amortization of original issue discount |
393 | — | ||||||
| Amortization of intangible assets |
1,854 | 128 | ||||||
| Non-cash portion of loss on extinguishment of debt |
11,358 | — | ||||||
| Impairment of long-lived assets |
— | 273 | ||||||
| Unrealized loss (gain) on interest rate swaps |
3,009 | (123 | ) | |||||
| Deferred income taxes |
826 | 10,085 | ||||||
| Stock compensation expense |
10,133 | 11,434 | ||||||
| Change in operating assets and liabilities, net of acquired balances: |
||||||||
| Accounts receivable |
(23,463 | ) | (3,504 | ) | ||||
| Inventories |
158 | 4,502 | ||||||
| Prepaid expenses and other assets |
(10,332 | ) | (2,735 | ) | ||||
| Accounts payable |
46,542 | (14,263 | ) | |||||
| Accrued expenses |
(12,616 | ) | (3,014 | ) | ||||
|
|
|
|
|
|||||
| Net cash provided by operating activities |
174,635 | 186,433 | ||||||
|
|
|
|
|
|||||
| Cash flows from investing activities |
||||||||
| Proceeds from sale of fixed assets |
— | 1,650 | ||||||
| Capital expenditures |
(111,514 | ) | (109,016 | ) | ||||
| Purchase of companies and asset acquisitions |
(468,003 | ) | — | |||||
|
|
|
|
|
|||||
| Net cash used in investing activities |
(579,517 | ) | (107,366 | ) | ||||
|
|
|
|
|
|||||
| Cash flows from financing activities |
||||||||
| Proceeds from issuance of term loans |
1,226,950 | — | ||||||
| Payments on term debt |
(841,025 | ) | (115,000 | ) | ||||
| Change in other long-term debt and capital leases |
(2,356 | ) | (5,634 | ) | ||||
| Proceeds from revolving credit facility |
148,100 | — | ||||||
| Payments on revolving credit facility |
(107,100 | ) | — | |||||
| Proceeds from issuance of common stock pursuant to option exercises |
1,277 | 716 | ||||||
| Purchase of treasury stock |
(1,702 | ) | (1,014 | ) | ||||
| Tax effect of stock options exercised and dividend equivalents |
1,827 | 901 | ||||||
| Transactions with noncontrolling interest |
(1,285 | ) | — | |||||
| Tax effect for deferred stockholder payments |
— | 961 | ||||||
| Financing costs |
(14,171 | ) | — | |||||
|
|
|
|
|
|||||
| Net cash provided by (used in) financing activities |
410,515 | (119,070 | ) | |||||
|
|
|
|
|
|||||
| Foreign currency adjustment |
316 | 104 | ||||||
|
|
|
|
|
|||||
| Increase (decrease) in cash and cash equivalents |
5,949 | (39,899 | ) | |||||
| Cash and cash equivalents: |
||||||||
| Beginning of year |
11,866 | 51,765 | ||||||
|
|
|
|
|
|||||
| End of year |
$ | 17,815 | $ | 11,866 | ||||
|
|
|
|
|
|||||
| Supplemental disclosure of cash flow information: |
||||||||
| Interest paid |
$ | 57,694 | $ | 52,047 | ||||
| Income taxes paid |
56,319 | 55,085 | ||||||
| Non-cash investing activities: |
||||||||
| Equipment purchased under capital lease |
$ | 5,989 | $ | 4,381 | ||||
The accompanying notes are an integral part of these consolidated financial statements.
F-7
Table of Contents
FML Holdings, Inc. and Subsidiaries
Notes to Consolidated Financial Statements
Years Ended December 31, 2013 and 2012
(in thousands, except share and per share data)
| 1. | Organization |
FML Holdings, Inc. and its consolidated subsidiaries (the “Company”) is a supplier of proppants and sand products. The Company is organized into two segments: Proppant Solutions and Industrial & Recreational Products. This segmentation is based on the end markets we serve, our management structure and the financial information that is reviewed by the chief operating decision maker in deciding how to allocate resources and assess performance.
The Proppant Solutions business serves the oil and gas recovery markets in the United States, Canada, Argentina, Mexico, China, northern Europe and the Middle East, providing raw and coated proppants primarily for use in hydraulic fracturing. The raw sand and substrate for our coated sand generally consists of high-purity silica sands produced at our facilities in Illinois, Wisconsin, Minnesota and Texas.
The Industrial & Recreational Products business provides raw and coated sands to the foundry, building products, glass, turf and landscape and filtration industries.
In addition to its wholly-owned subsidiaries, the Company owns 90% of a holding company, Technimat LLC, which owns 70% of Santrol (Yixing) Proppant Co., a manufacturer of resin-based proppants located in China. During 2013, the company liquidated its interest in Santrol (Tianjin) Proppant Company Ltd., which was owned by Technimat. The noncontrolling interests in both entities are presented as “Noncontrolling interest” on the balance sheet.
| 2. | Summary of Significant Accounting Policies |
Principles of Consolidation
The consolidated financial statements include the accounts of FML Holdings, Inc. and its wholly-owned and majority-owned subsidiaries (collectively, the “Company”). All significant intercompany balances and transactions have been eliminated in consolidation.
Use of Estimates
The preparation of financial statements in conformity with generally accepted accounting principles requires management to make estimates and assumptions that affect the reported amounts of assets and liabilities and disclosures of contingent assets and liabilities at the date of the financial statements and the reported amounts of revenue and expenses during the reporting period. Actual results could differ from those estimates.
Revenue Recognition
Revenue is recognized when persuasive evidence of an arrangement exists, delivery of products has occurred, the selling price is fixed or determinable, collectability is reasonably assured and title and risk of loss transfer to the customer. This generally occurs when products leave a storage terminal or, in the case of direct shipments, when products leave a production facility. Transportation costs to move product from a production facility to a storage terminal are borne by the Company and capitalized into the cost of inventory. These costs are included in the cost of sales as the product is sold.
The Company derives its revenue by mining and processing minerals that its customers purchase for various uses. Its net sales are primarily a function of the price per ton realized and the volumes sold. In some instances,
F-8
Table of Contents
FML Holdings, Inc. and Subsidiaries
Notes to Consolidated Financial Statements
Years Ended December 31, 2013 and 2012
(in thousands, except share and per share data)
its net sales also include a charge for transportation services it provides to its customers. The Company’s transportation revenue fluctuates based on a number of factors, including the volume of product it transports under contract, service agreements with its customers, the mode of transportation used and the distance between its plants and customers.
The Company primarily sells its products under market rate agreements with terms typically ranging from two to ten years. The Company invoices the majority of its customers on a per shipment basis when the customer takes possession of the product.
Cash and Cash Equivalents
The Company considers all highly liquid debt instruments purchased with a maturity of three months or less to be cash equivalents. At various times, the Company maintains funds on deposit at its banks in excess of FDIC insurance limits.
Accounts Receivable
Trade accounts receivable are stated at the amount management expects to collect, and do not bear interest. Management provides for uncollectible amounts based on its assessment of the current status of individual accounts. Accounts receivable are net of allowance for doubtful accounts of $796, and $1,189 as of December 31, 2013 and 2012, respectively.
The following table presents the activity in the Company’s allowance for doubtful accounts for the years ended December 31, 2012 and 2013:
| Balance at Beginning of Period |
Net Additions Charged to Expense |
Accounts Receivable Written Off |
Balance at End of Period |
|||||||||||||
| Year ended December 31, 2012 |
$ | 761 | $ | 502 | $ | (74 | ) | $ | 1,189 | |||||||
| Year ended December 31, 2013 |
1,189 | 1,741 | (2,134 | ) | 796 | |||||||||||
Included in accounts receivable is $7,163 and $5,797 of recoverable value-added taxes and other taxes remitted in Mexico, as of December 31, 2013 and 2012, respectively.
Inventories
Inventories are stated at the lower of cost or market. Certain subsidiaries determine cost using the last-in, first-out (LIFO) method. If the first-in, first-out (FIFO) method of inventory accounting had been used, inventories would have been higher by $176 and $4,287 at December 31, 2013 and 2012, respectively. The significant decrease in the LIFO inventory reserve is due to the impact of purchase accounting for FTSI, whereby acquired work-in-process inventory was stepped up to fair value, creating a significant increase in the LIFO inventory on hand at the end of the year, as well as an ending quantity decrement at another location (see note 8).
Such inventories comprise 24% and 20% of inventories reflected in the accompanying Consolidated Balance Sheets as of December 31, 2013 and 2012, respectively. The cost of inventories of all other subsidiaries is determined using the FIFO method. The Company recognized a $4,958 permanent write-down in the value of finished goods inventory, net of expected recoveries from suppliers, in the year ended December 31, 2013. The inventory write-down is included in cost of sales.
F-9
Table of Contents
FML Holdings, Inc. and Subsidiaries
Notes to Consolidated Financial Statements
Years Ended December 31, 2013 and 2012
(in thousands, except share and per share data)
Property, Plant and Equipment
Property, plant and equipment are stated at cost. Expenditures, including interest, for property, plant and equipment and items that substantially increase the useful lives of existing assets are capitalized, while expenditures for repairs and maintenance are expensed as incurred.
Depreciation on property, plant and equipment is computed on a straight-line basis over the estimated useful lives of the related assets. Amortization of leasehold improvements is computed using the straight-line method over the shorter of the remaining lease term or the estimated useful lives of the improvements.
Depletion expense calculated for depletable land and mineral rights is based on cost multiplied by a depletion factor. The depletion factor varies based on production and other factors, but is generally equal to annual tons mined divided by total estimated remaining reserves for the mine.
The estimated service lives of property and equipment are principally as follows:
| Land improvements |
10-40 years | |||
| Machinery and equipment |
3-20 years | |||
| Buildings and improvements |
10-40 years | |||
| Furniture, fixtures, and other |
3-10 years |
Construction in progress is stated at cost, which includes the cost of construction and other direct costs attributable to the construction. No provision for depreciation is made on construction in progress until such time as the relevant assets are completed and put into use. Construction in progress at December 31, 2013, represents machinery and facilities under installation.
The Company capitalizes interest cost incurred on funds used to construct property, plant, and equipment. The capitalized interest is recorded as part of the asset to which it relates and is amortized over the asset’s estimated useful life. Interest cost capitalized was $2,540 and $2,654 in 2013 and 2012, respectively.
Depreciation and depletion expense was $35,917 and $27,562 in 2013 and 2012, respectively.
Included in land and improvements are occupancy rights in China of $354 that are held for a term of 50 years until December 2057.
The Company reviews property, plant and equipment for impairment whenever events or changes in circumstances indicate that the carrying amount of property, plant and equipment may not be recoverable from the estimated future cash flows expected to result from its use and eventual disposition. In cases where undiscounted expected future cash flows are less than the carrying value, an impairment loss is recognized equal to an amount by which the carrying value exceeds the fair value of assets or asset groups. The factors considered by management in performing this assessment include current operating results, trends, and prospects, as well as the effects of obsolescence, demand, competition, and other economic factors. As a result of these tests, the Company recorded a write down in the carrying value of certain minerals rights of $0 and $273 in the years ended December 31, 2013 and 2012, respectively.
F-10
Table of Contents
FML Holdings, Inc. and Subsidiaries
Notes to Consolidated Financial Statements
Years Ended December 31, 2013 and 2012
(in thousands, except share and per share data)
Deferred Financing Costs
Deferred financing costs are amortized over the terms of the related debt obligations and are included in other assets. In connection with the refinancing of the Company’s debt in September 2013 (see note 10), the Company incurred financing costs of $15,132 of which $14,171 were capitalized. In connection with the refinancing, the Company wrote off $11,358 of costs that were previously capitalized. The following table presents deferred financing costs as of December 31, 2013 and 2012:
| 2013 | 2012 | |||||||
| Deferred financing costs |
$ | 36,705 | $ | 43,721 | ||||
| Accumulated amortization |
(12,475 | ) | (16,105 | ) | ||||
|
|
|
|
|
|||||
| Deferred financing costs, net |
$ | 24,230 | $ | 27,616 | ||||
|
|
|
|
|
|||||
Goodwill and Intangible Assets
Goodwill and intangible assets are reviewed for impairment by applying a fair-value based test on an annual basis or more frequently if circumstances indicate that impairment may have occurred. The Company assesses goodwill for possible impairment using a two-step method. The first step of the goodwill impairment test, used to identify potential impairment, compares the fair value of a reporting unit with its carrying amount, including goodwill. If the carrying amount of a reporting unit exceeds its fair value, an indication of goodwill impairment exists. The second step of the goodwill impairment test is performed to measure the amount of the impairment loss, if any. If the carrying amount of goodwill exceeds its implied fair value, an impairment loss is recognized equal to the excess. The implied fair value of goodwill is determined by allocating the fair value of the reporting unit in a manner similar to a purchase price allocation, and the residual fair value after this allocation is the implied fair value of the reporting unit goodwill.
The Company reviews definite-lived intangible assets for impairment whenever events or changes in circumstances indicate that the carrying amount of a definite-lived intangible asset may not be recoverable from the estimated future cash flows expected to result from its use and eventual disposition. In cases where undiscounted expected future cash flows are less than the carrying value, an impairment loss is recognized equal to an amount by which the carrying value exceeds the fair value of the assets or asset groups.
The evaluation of goodwill or other intangible assets for possible impairment includes estimating fair value using one or a combination of valuation techniques, such as discounted cash flows or based on comparable companies or transactions. These valuations require the Company to make estimates and assumptions regarding future operating results, cash flows, changes in working capital and capital expenditures, selling prices, profitability, and the cost of capital. Although the Company believes its assumptions and estimates are reasonable, deviations from the assumptions and estimates could produce a materially different result.
The Company did not recognize any impairment losses for goodwill or other intangible assets in the years ended December 31, 2013 and 2012.
Earnings per Share
Basic and diluted earnings per share is presented for net income attributable to FML Holdings, Inc. Basic earnings per share is computed by dividing income available to FML Holdings, Inc. common stockholders by the weighted-average number of outstanding common shares for the period. Diluted earnings per share is computed
F-11
Table of Contents
FML Holdings, Inc. and Subsidiaries
Notes to Consolidated Financial Statements
Years Ended December 31, 2013 and 2012
(in thousands, except share and per share data)
by increasing the weighted-average number of outstanding common shares to include the additional common shares that would be outstanding after exercise of outstanding stock options. Potential common shares in the diluted earnings per share calculation are excluded to the extent that they would be anti-dilutive.
Derivatives and Hedging Activities
Due to its variable-rate indebtedness, the Company is exposed to fluctuations in interest rates. The Company uses interest rate swaps to manage this exposure. These derivative instruments are recorded on the balance sheet at their fair values. Changes in the fair value of derivatives are recorded each period in current earnings or in other comprehensive income, depending on whether a derivative is designated as part of a hedging relationship and, if it is, depending on the type of hedging relationship. For cash flow hedges in which the Company is hedging the variability of cash flows related to a variable-rate liability, the effective portion of the gain or loss on the derivative instrument is reported in other comprehensive income in the periods during which earnings are impacted by the variability of the cash flows of the hedged item. The ineffective portion of all hedges is recognized in current period earnings. As interest expense is accrued on the debt obligation, amounts in accumulated other comprehensive income (loss) related to the interest rate swaps are reclassified into income to obtain a net cost on the debt obligation equal to the effective yield of the fixed rate of each swap. In the event that an interest rate swap is terminated prior to maturity, gains or losses in accumulated other comprehensive income (loss) remain deferred and are reclassified into earnings in the periods during which the hedged forecasted transaction affects earnings.
The Company formally designates and documents instruments at inception that qualify for hedge accounting of underlying exposures in accordance with GAAP. Both at inception and for each reporting period, the Company assesses whether the financial instruments used in hedging transactions are effective in offsetting changes in cash flows of the related underlying exposure.
Foreign Currency Translation
Assets and liabilities of all foreign operations are translated at the rate of exchange in effect on the balance sheet date; income and expenses are translated at the average rates of exchange prevailing during the year. The related translation adjustments are reflected as accumulated other comprehensive income (loss) in equity.
Concentration of Labor
Approximately 14% of the Company’s domestic labor force is covered under eight union agreements that expire at various times through November 2016. None of the contracts expire before March 2015.
Concentration of Credit Risk
Approximately 39% and 38% of the accounts receivable balance at December 31, 2013 and 2012, respectively, was outstanding from three customers.
Income Taxes
The Company uses the asset and liability method to account for deferred income taxes. Deferred tax assets and liabilities are recognized for the anticipated future tax consequences attributable to differences between financial statement amounts and their respective tax bases. Management reviews the Company’s deferred tax
F-12
Table of Contents
FML Holdings, Inc. and Subsidiaries
Notes to Consolidated Financial Statements
Years Ended December 31, 2013 and 2012
(in thousands, except share and per share data)
assets to determine whether their value can be realized based upon available evidence. A valuation allowance is established if management believes it is more likely than not that some portion of the deferred tax assets will not be realized.
Changes in valuation allowances from period to period are included in the Company’s tax provision in the period of change.
The Company recognizes a tax benefit associated with an uncertain tax position when the tax position is more-likely-than-not to be sustained upon examination by taxing authorities. The amount recognized is measured as the amount of benefit that is greater than 50% likely of being realized upon ultimate settlement. The Company recognizes interest and penalties accrued related to unrecognized tax uncertainties in income tax expense.
Asset Retirement Obligations
We estimate the future cost of dismantling, restoring and reclaiming operating excavation sites and related facilities in accordance with federal, state and local regulatory requirements. We record the initial estimated present value of reclamation costs as an asset retirement obligation and increase the carrying amount of the related asset by a corresponding amount. We allocate reclamation costs to expense over the life of the related assets and adjust the related liability for changes resulting from the passage of time and revisions to either the timing or amount of the original present value estimate. If the asset retirement obligation is settled for more or less than the carrying amount of the liability, a loss or gain will be recognized, respectively.
Research and Development
The Company’s research and development expenses consist of personnel and other direct and indirect costs for internally funded project development. Total expenses for R&D for the years ended December 31, 2013 and 2012 were $5,364 and $1,815, respectively. Total research and development expenditures represented 0.54% and 0.21% of revenues in 2013 and 2012, respectively.
Accumulated Other Comprehensive Income (Loss)
Accumulated other comprehensive income (loss) is a separate line within equity that reports the Company’s cumulative income that has not been reported as part of net income. Items that are included in this line are the income or loss from foreign currency translation, actuarial gains and losses and prior service cost related to pension liabilities, and the unrealized gains and losses on certain investments or hedges, net of taxes. The components of accumulated other comprehensive income (loss) attributable to FML Holdings, Inc. at December 31, 2013 and 2012 were as follows:
| December 31, 2013 | ||||||||||||
| Gross | Tax Effect | Net Amount | ||||||||||
| Foreign currency translation |
$ | (2,626 | ) | — | $ | (2,626 | ) | |||||
| Additional pension liability |
(2,717 | ) | 1,019 | (1,698 | ) | |||||||
| Unrealized gain on interest rate hedges |
1,260 | (472 | ) | 788 | ||||||||
|
|
|
|
|
|
|
|||||||
| $ | (4,083 | ) | $ | 547 | $ | (3,536 | ) | |||||
|
|
|
|
|
|
|
|||||||
F-13
Table of Contents
FML Holdings, Inc. and Subsidiaries
Notes to Consolidated Financial Statements
Years Ended December 31, 2013 and 2012
(in thousands, except share and per share data)
| December 31, 2012 | ||||||||||||
| Gross | Tax Effect | Net Amount | ||||||||||
| Foreign currency translation |
$ | (2,624 | ) | — | $ | (2,624 | ) | |||||
| Additional pension liability |
(4,179 | ) | 1,567 | (2,612 | ) | |||||||
| Unrealized losses on interest rate hedges |
(6,341 | ) | 2,378 | (3,963 | ) | |||||||
|
|
|
|
|
|
|
|||||||
| $ | (13,144 | ) | $ | 3,945 | $ | (9,199 | ) | |||||
|
|
|
|
|
|
|
|||||||
The following table presents the changes in accumulated other comprehensive income by component for the year ended December 31, 2013:
| Year Ended December 31, 2013 | ||||||||||||||||
| Unrealized gain (loss) on interest rate hedges |
Additional pension liability |
Foreign currency translation |
Total | |||||||||||||
| Beginning balance |
$ | (3,963 | ) | $ | (2,612 | ) | $ | (2,624 | ) | $ | (9,199 | ) | ||||
| Other comprehensive income (loss) before reclassifications |
3,368 | 744 | (2 | ) | 4,110 | |||||||||||
| Amounts reclassified from accumulated other comprehensive income |
1,383 | 170 | — | 1,553 | ||||||||||||
|
|
|
|
|
|
|
|
|
|||||||||
| Ending balance |
$ | 788 | $ | (1,698 | ) | $ | (2,626 | ) | $ | (3,536 | ) | |||||
|
|
|
|
|
|
|
|
|
|||||||||
The following table presents the reclassifications out of accumulated comprehensive income during the year ended December 31, 2013:
| Details about accumulated other comprehensive income |
Amount reclassified from accumulated other comprehensive income |
Affected line item on the | ||||
| Change in fair value of derivative swap agreements |
||||||
| Interest rate contracts |
$ | 2,212 | Interest expense | |||
| (829 | ) | Tax expense (benefit) | ||||
|
|
|
|||||
| $ | 1,383 | Net of tax | ||||
| Amortization of pension obligations |
||||||
| Prior service cost |
$ | 19 | Cost of sales | |||
| Actuarial gains (losses) |
253 | Cost of sales | ||||
|
|
|
|||||
| 272 | Total before tax | |||||
| (102 | ) | Tax expense | ||||
|
|
|
|||||
| $ | 170 | Net of tax | ||||
|
|
|
|||||
| Total reclassifications for the period |
$ | 1,553 | Net of tax | |||
|
|
|
|||||
| 3. | Recent Accounting Pronouncements |
In July 2013, the FASB issued Accounting Standards Update No. 2013-11, Presentation of Unrecognized Tax Benefit When a Net Operating Loss Carryforward, a Similar Tax Loss, or a Tax Credit Carryforward Exists
F-14
Table of Contents
FML Holdings, Inc. and Subsidiaries
Notes to Consolidated Financial Statements
Years Ended December 31, 2013 and 2012
(in thousands, except share and per share data)
(ASU 2013-11). ASU 2013-11 requires the netting of unrecognized tax benefits against a deferred tax asset for a loss or other carryforward that would apply in settlement of the uncertain tax positions except where the deferred tax asset or other carryforward are not available for use. The guidance is effective for reporting periods beginning after December 15, 2013. The adoption of the guidance has not had a material impact on the Company’s consolidated financial statements.
In April 2014, the FASB issued Accounting Standards Update No. 2014-08, Presentation of Financial Statements (Topic 205) and Property, Plant and Equipment (Topic 360): Reporting Discontinued Operations and Disclosures of Disposals of Components of an Entity (ASU 2014-08), which amended existing requirements for reporting discontinued operations. Under the new guidance, discontinued operations reporting will be limited to disposal transactions that represent strategic shifts having a major effect on operations and financial results. The amended guidance also enhances disclosures and requires assets and liabilities of a discontinued operation to be classified as such for all periods presented in the financial statements. The guidance is effective for disposal transactions occurring in reporting periods beginning after December 15, 2014. Presentation and disclosures of future disposal transactions after adoption of the guidance may be different than under current standards.
In May 2014, the FASB issued Accounting Standards Update No. 2014-09, Revenue from Contracts with Customers (ASU 2014-09). Under ASU 2014-09, companies recognize revenue in a manner that depicts the transfer of promised goods or services to customers in an amount that reflects the consideration to which the entity expects to be entitled, in exchange for those goods or services. Additionally, the guidance requires improved disclosures to help users of financial statements better understand the nature, amount, timing, and uncertainty of revenue that is recognized. The guidance is effective for reporting periods beginning after December 15, 2016. The Company is in the process of evaluating the effect of the new guidance on its financial statements and disclosures.
| 4. | Inventories |
At December 31, 2013 and 2012, inventories consisted of the following:
| 2013 | 2012 | |||||||
| Raw materials |
$ | 16,766 | $ | 20,667 | ||||
| Work-in-process |
24,576 | 23,342 | ||||||
| Finished goods |
77,183 | 51,710 | ||||||
|
|
|
|
|
|||||
| 118,525 | 95,719 | |||||||
| Less: LIFO reserve |
(176 | ) | (4,287 | ) | ||||
|
|
|
|
|
|||||
| Inventories |
$ | 118,349 | $ | 91,432 | ||||
|
|
|
|
|
|||||
F-15
Table of Contents
FML Holdings, Inc. and Subsidiaries
Notes to Consolidated Financial Statements
Years Ended December 31, 2013 and 2012
(in thousands, except share and per share data)
| 5. | Property, Plant, and Equipment |
At December 31, 2013 and 2012, property, plant and equipment consisted of the following:
| 2013 | 2012 | |||||||
| Land and improvements |
$ | 38,557 | $ | 23,445 | ||||
| Mineral reserves and mine development |
280,727 | 124,066 | ||||||
| Machinery and equipment |
426,798 | 253,875 | ||||||
| Buildings and improvements |
100,217 | 76,091 | ||||||
| Furniture, fixtures and other |
2,558 | 2,459 | ||||||
| Construction in progress |
112,819 | 77,982 | ||||||
|
|
|
|
|
|||||
| 961,676 | 557,918 | |||||||
| Accumulated depletion and depreciation |
(212,838 | ) | (182,756 | ) | ||||
|
|
|
|
|
|||||
| Property, plant and equipment, net |
$ | 748,838 | $ | 375,162 | ||||
|
|
|
|
|
|||||
| 6. | Accrued Expenses |
At December 31, 2013 and 2012, accrued expenses consisted of the following:
| 2013 | 2012 | |||||||
| Accrued payroll and fringe benefits |
$ | 12,386 | $ | 8,981 | ||||
| Contingent consideration |
9,833 | — | ||||||
| Accrued income taxes |
— | 11,497 | ||||||
| Other accrued expenses |
6,487 | 7,799 | ||||||
|
|
|
|
|
|||||
| Accrued Expenses |
$ | 28,706 | $ | 28,277 | ||||
|
|
|
|
|
|||||
Contingent consideration relates to the Great Plains acquisition and was initially recorded at $9,600 which represented fair value at the time of acquisition. Changes in fair value, primarily relating to the passage of time, are recorded through earnings.
| 7. | Other Long-Term Liabilities |
At December 31, 2013 and 2012, other long-term liabilities consisted of the following:
| 2013 | 2012 | |||||||
| Interest rate swaps |
$ | 5,637 | $ | 8,738 | ||||
| Accrued asset retirement obligations |
2,680 | 2,901 | ||||||
| Accrued compensation and benefits |
8,057 | 9,365 | ||||||
| Other |
4,714 | 5,125 | ||||||
|
|
|
|
|
|||||
| Other long term liabilities |
$ | 21,088 | $ | 26,129 | ||||
|
|
|
|
|
|||||
F-16
Table of Contents
FML Holdings, Inc. and Subsidiaries
Notes to Consolidated Financial Statements
Years Ended December 31, 2013 and 2012
(in thousands, except share and per share data)
| 8. | Acquisitions |
The Company made three acquisitions in 2013. On April 30, 2013, the Company acquired 100% of Self-Suspending Proppant LLC (“SSP”) for total consideration of $56,320 plus contingent consideration. The Company accounted for this transaction as an acquisition of a group of assets. SSP owned the exclusive rights to certain intellectual property related to providing proppant with enhanced performance attributes through proprietary coating technology. The contingent consideration is a fixed percentage of the cumulative product margin, less certain adjustments, generated by our Propel SSP sales for the five years commencing on October 1, 2015. Because the earnout is dependent on future sales and the related cost of sales, the amounts of which are highly uncertain, it is not possible to estimate the amount that will be paid. The contingent consideration will be capitalized, and the associated amortization expense will be recognized, at the time a payment is probable and reasonably estimable.
On June 12, 2013, the Company purchased Great Plains Sands, LLC (“Great Plains”), located in Minnesota, for total purchase consideration of $73,579. The Company accounted for this acquisition under ASC 805 as a business combination. Included in the purchase amount is contingent consideration of $9,600 for additional payments due to the seller based on the acquired plant meeting certain operating targets. The Company believes it is highly likely these targets will be met and therefore has discounted the payments only to reflect the time value of money until the expected payment date, which is within one year. The goodwill of $3,887 is primarily attributable to the synergies expected to arise after the acquisition. The Company expects that all of the goodwill generated in this acquisition will be deductible for tax purposes. The production facilities were not complete at the time of the acquisition, and accordingly there were no preacquisition revenues or cost of sales. As a result, pro forma results would not be meaningful in evaluating the financial effect of this acquisition. It is not practicable to determine revenue and net income included in the Company’s operating results relating to Great Plains since the date of acquisition because Great Plains has been fully integrated into the Company’s operations, and the operating results of Great Plains can therefore not be separately identified.
On September 6, 2013, the Company purchased certain assets and assumed certain liabilities from FTS International Services, LLC (“FTSI”) and affiliates. The Company acquired sand reserves, frac sand production capacity, resin coating capacity and logistics assets consisting of terminals and railcars. The assets are located in various states, including Texas, Wisconsin, Missouri, Alabama, and Illinois. In connection with this acquisition, the Company also entered into a ten year supply agreement with FTSI. In April 2014, the agreed upon quantities of certain raw sand required under the supply agreement were lowered to 80% of the original quantity. The total consideration was $347,704. The Company accounted for this acquisition under ASC 805 as a business combination. The goodwill of $49,456 is primarily attributable to the synergies expected to arise after the acquisition. The Company expects that all of the goodwill generated in this acquisition will be deductible for tax purposes. The historical financial information for the assets acquired was impracticable to obtain, and inclusion of pro forma information would require the Company to make estimates and assumptions regarding these assets’ historical financial results that may not be reasonable or accurate. As a result, pro forma results are not presented. It is not practicable to determine revenue and net income included in the Company’s operating results relating to FTSI since the date of acquisition because FTSI has been fully integrated into the Company’s operations, and the operating results of FTSI can therefore not be separately identified.
The purchase price for each of these acquisitions was assigned to the fair value of the assets acquired. Such determination of fair value is based on valuation models that incorporate the present value of expected future cash flows and profitability projections. There are many assumptions and estimates underlying the determination of the fair value. Although the Company believes its assumptions and estimates are reasonable, deviations from the assumptions and estimates could produce a materially different result.
F-17
Table of Contents
FML Holdings, Inc. and Subsidiaries
Notes to Consolidated Financial Statements
Years Ended December 31, 2013 and 2012
(in thousands, except share and per share data)
The purchase price for the three transactions in 2013 has been allocated to the fair value of the assets acquired and liabilities assumed as follows:
| SSP | Great Plains Sands |
FTSI | ||||||||||
| Land and buildings |
$ | — | $ | 7,623 | $ | 2,428 | ||||||
| Inventory |
— | 1,085 | 25,990 | |||||||||
| Machinery and equipment |
— | 13,200 | 125,239 | |||||||||
| Mineral reserves |
— | 48,100 | 95,500 | |||||||||
| Other assets |
— | 1,568 | — | |||||||||
| Acquired technology |
56,320 | — | — | |||||||||
| Supply agreement |
— | — | 50,700 | |||||||||
| Other intangibles |
— | — | 687 | |||||||||
| Goodwill |
— | 3,887 | 49,456 | |||||||||
| Liabilities assumed |
— | (1,884 | ) | (2,296 | ) | |||||||
|
|
|
|
|
|
|
|||||||
| Net assets acquired |
$ | 56,320 | $ | 73,579 | $ | 347,704 | ||||||
|
|
|
|
|
|
|
|||||||
| Cash consideration |
$ | 56,320 | $ | 63,979 | $ | 347,704 | ||||||
| Contingent consideration |
— | 9,600 | — | |||||||||
|
|
|
|
|
|
|
|||||||
| Total purchase consideration |
$ | 56,320 | $ | 73,579 | $ | 347,704 | ||||||
|
|
|
|
|
|
|
|||||||
The company capitalized $1,320 of transaction related expenses in connection with the SSP transaction. The Company recognized $7,113 of transaction related expenses in connection with the Great Plains and FTSI acquisitions, which is included in selling, general and administrative expenses.
| 9. | Goodwill and Other Intangible Assets |
The following table summarizes the activity in goodwill for the years ended December 31, 2013 and 2012.
| Balance at Beginning of Year |
Current Year Acquisitions |
Current Year Dispositions |
Currency Translation |
Balance at End of Year |
||||||||||||||||
| Year Ended December 31, 2013: |
||||||||||||||||||||
| Proppant Solutions |
$ | 18,676 | $ | 53,343 | $ | (1,050 | ) | $ | 22 | $ | 70,991 | |||||||||
| Industrial & Recreational |
16,461 | — | — | — | 16,461 | |||||||||||||||
|
|
|
|
|
|
|
|
|
|
|
|||||||||||
| Total |
$ | 35,137 | $ | 53,343 | $ | (1,050 | ) | $ | 22 | $ | 87,452 | |||||||||
|
|
|
|
|
|
|
|
|
|
|
|||||||||||
| Year Ended December 31, 2012: |
||||||||||||||||||||
| Proppant Solutions |
$ | 18,589 | $ | — | $ | — | $ | 87 | $ | 18,676 | ||||||||||
| Industrial & Recreational |
16,461 | — | — | — | 16,461 | |||||||||||||||
|
|
|
|
|
|
|
|
|
|
|
|||||||||||
| Total |
$ | 35,050 | $ | — | $ | — | $ | 87 | $ | 35,137 | ||||||||||
|
|
|
|
|
|
|
|
|
|
|
|||||||||||
F-18
Table of Contents
FML Holdings, Inc. and Subsidiaries
Notes to Consolidated Financial Statements
Years Ended December 31, 2013 and 2012
(in thousands, except share and per share data)
Information regarding our acquired intangible assets as of December 31, 2013 and 2012 is as follows:
| December 31, 2013 | ||||||||||||
| Gross Carrying Amount |
Accumulated Amortization |
Intangible Assets, net |
||||||||||
| Acquired technology and patents |
$ | 57,128 | $ | (553 | ) | $ | 56,575 | |||||
| Supply agreement |
50,700 | (1,690 | ) | 49,010 | ||||||||
| Other intangible assets |
687 | (36 | ) | 651 | ||||||||
|
|
|
|
|
|
|
|||||||
| Intangible assets |
$ | 108,515 | $ | (2,279 | ) | $ | 106,236 | |||||
|
|
|
|
|
|
|
|||||||
| December 31, 2012 | ||||||||||||
| Gross Carrying Amount |
Accumulated Amortization |
Intangible Assets, net |
||||||||||
| Acquired technology and patents |
$ | 808 | $ | (425 | ) | $ | 383 | |||||
|
|
|
|
|
|
|
|||||||
| Intangible assets |
$ | 808 | $ | (425 | ) | $ | 383 | |||||
|
|
|
|
|
|
|
|||||||
The acquired technology from the SSP acquisition will be amortized ratably over its estimated useful life once product using the technology is first commercialized. The supply agreement is being amortized ratably over 10 years. Capitalized patents will be fully amortized by the end of 2014.
Estimated future amortization expense related to intangible assets at December 31, 2013 is as follows:
| Amortization | ||||
| 2014 |
$ | 5,268 | ||
| 2015 |
5,213 | |||
| 2016 |
5,210 | |||
| 2017 |
5,192 | |||
| 2018 |
5,147 | |||
| Thereafter |
23,686 | |||
|
|
|
|||
| Total |
$ | 49,716 | ||
|
|
|
|||
| 10. | Long-Term Debt |
| Total | ||||||||
| 2013 | 2012 | |||||||
| Term Loans—Term B-1, closing March 15, 2011 |
$ | — | $ | 815,000 | ||||
| Term Loans—Term B-1, closing September 5, 2013 |
322,714 | — | ||||||
| Term Loans—Term B-2 |
878,605 | — | ||||||
| Industrial Revenue bond |
10,000 | 10,000 | ||||||
| Revolving credit facility and other |
42,775 | 1,027 | ||||||
| Capital leases, net |
8,052 | 5,168 | ||||||
|
|
|
|
|
|||||
| 1,262,146 | 831,195 | |||||||
| Less: current portion |
(15,687 | ) | (3,332 | ) | ||||
|
|
|
|
|
|||||
| Long-term debt including leases |
$ | 1,246,459 | $ | 827,863 | ||||
|
|
|
|
|
|||||
F-19
Table of Contents
FML Holdings, Inc. and Subsidiaries
Notes to Consolidated Financial Statements
Years Ended December 31, 2013 and 2012
(in thousands, except share and per share data)
On March 15, 2011, the Company entered into an amendment (“Amended Credit Agreement”) to the Credit and Guaranty Agreement dated August 5, 2010 (“Original Credit Agreement”). The Amended Credit Agreement provided for revolving loans up to $75,000 and a Senior Secured Tranche B Term Loan in an aggregate principal amount of $1,000,000. Unless otherwise accelerated, the Revolving Commitment was due to expire on August 5, 2015 and the Tranche B Term Loan was due to mature on March 15, 2017.
On September 5, 2013, the Company entered into an amendment (“2013 Amended Credit Agreement”) to the Amended Credit Agreement. The 2013 Amended Credit Agreement caused the issuance of two new term loans, Senior Secured Term B-1 (“B-1 Term Loan”) of $325,000 and Senior Secured Term B-2 (“B-2 Term Loan”) of $885,000, and a new Revolving Credit Agreement (“New Revolver”) with a commitment amount of $75,000. The proceeds of the borrowings under the 2013 Amended Credit Agreement were used to repay amounts outstanding under the previous credit facility and to fund the acquisition of the proppant assets of FTSI (see note 8).
The B-1 Term Loan matures on March 15, 2017 and requires quarterly principal repayments of $800 (1% annually) with the balance due at maturity. The B-2 Term Loan matures on September 5, 2019 and requires quarterly principal repayments of $2,200 (1% annually) with the balance due at maturity. The New Revolver expires on September 5, 2018. Until they were repriced in March 2014, borrowings under the B-1 Term Loan, the B-2 Term Loan and the revolving credit facility bore interest, at the Company’s discretion, at the base rate (the greater of prime rate, federal funds rate plus 0.5%, 2.0%, or one-month LIBOR plus 1.0%) plus 3.0% or the adjusted Eurodollar Rate (subject to a 1.0% floor) plus 4.0%. With respect to borrowings under the B-1 Term Loan and Revolving Credit Facility, the 2.0% minimum for Base Rate borrowings and 1.0% for Eurodollar Rate borrowings did not apply. The applicable margin on the loans could be reduced by 0.25% if the Company’s leverage ratio fell below 2.75. As of December 31, 2013, the borrowings for the B-1 Term Loan and the New Revolver bore interest at 4.3% and the B-2 Term Loan at 5.0%. Additionally, the Company pays a commitment fee of 0.5% per annum, based on the daily average of the unused commitment under the New Revolver.
The terms of the 2013 Amended Credit Agreement provide for customary representations and warranties and affirmative covenants. The credit facility also contains customary negative covenants setting forth limitations on further indebtedness, liens, investments, disposition of assets, acquisitions, junior payments and restrictions on subsidiary distributions. The Company must maintain a leverage ratio as of the end of each quarter of no more than 4.75 if the aggregate revolver borrowing is equal to or greater than 25% of the total revolver commitment.
In February 2014 the Company executed a joinder agreement to borrow $41,000 as an additional B-2 Term Loan. The proceeds of this borrowing were used to repay then outstanding amounts under the New Revolver. The additional borrowings mature on the same date as the then existing B-2 Term Loan (September 5, 2019) and the required quarterly principal repayments for the B-2 Term Loan were increased by one-quarter of 1% of the amount borrowed with the balance due at maturity. There were no other changes in the terms, interest rates or covenants of the 2013 Amended Credit Agreement.
In March 2014 the Company amended the existing credit agreement whereby the applicable margin for B-1 and B-2 Base Rate loans was reduced to 2.5% and B-1 and B-2 Eurodollar Rate loans was reduced to 3.5%.
The Company granted the lenders a first priority lien on substantially all of the Company’s assets.
The Company has a $10,000 Industrial Revenue Bond outstanding related to the construction of a manufacturing facility in Wisconsin. The bond bears interest, which is payable monthly, at a variable rate. The
F-20
Table of Contents
FML Holdings, Inc. and Subsidiaries
Notes to Consolidated Financial Statements
Years Ended December 31, 2013 and 2012
(in thousands, except share and per share data)
rate was 0.1% at December 31, 2013. The bond matures on September 1, 2027 and is collateralized by a letter of credit of $10,000.
Maturities of long-term debt are as follows:
| Capital Lease Obligations | Other Long-term Debt |
Total Principal Payments |
||||||||||||||||||
| Year Ended |
Lease Payment |
Less Interest |
Present Value |
|||||||||||||||||
| 2014 |
$ | 3,768 | $ | 254 | $ | 3,514 | $ | 12,173 | $ | 15,687 | ||||||||||
| 2015 |
3,031 | 130 | 2,901 | 12,113 | 15,014 | |||||||||||||||
| 2016 |
1,484 | 29 | 1,455 | 12,114 | 13,569 | |||||||||||||||
| 2017 |
169 | 3 | 166 | 323,303 | 323,469 | |||||||||||||||
| 2018 |
17 | 1 | 16 | 8,866 | 8,882 | |||||||||||||||
| Thereafter |
— | — | — | 885,525 | 885,525 | |||||||||||||||
|
|
|
|
|
|
|
|
|
|
|
|||||||||||
| $ | 8,469 | $ | 417 | $ | 8,052 | $ | 1,254,094 | $ | 1,262,146 | |||||||||||
|
|
|
|
|
|
|
|
|
|
|
|||||||||||
Information pertaining to assets and related accumulated depreciation in the balance sheet for capital lease items is as follows:
| 2013 | 2012 | |||||||
| Cost |
$ | 11,648 | $ | 11,023 | ||||
| Accumulated depreciation |
(2,011 | ) | (3,661 | ) | ||||
|
|
|
|
|
|||||
| Net book value |
$ | 9,637 | $ | 7,362 | ||||
|
|
|
|
|
|||||
| 11. | Earnings per Share |
The table below shows the computation of basic and diluted earnings per share of Class A and Class B common stock for the years ended December 31, 2013 and 2012.
| 2013 | 2012 | |||||||
| Numerator: |
||||||||
| Net income attributable to FML Holdings, Inc. |
$ | 103,961 | $ | 148,886 | ||||
| Denominator: |
||||||||
| Basic weighted average shares outstanding |
4,588,477 | 4,583,141 | ||||||
| Dilutive effect of employee stock options |
253,804 | 250,045 | ||||||
|
|
|
|
|
|||||
| Diluted weighted average shares outstanding |
4,842,281 | 4,833,186 | ||||||
|
|
|
|
|
|||||
| Earnings per common share—basic |
$ | 22.66 | $ | 32.49 | ||||
| Earnings per common share—diluted |
$ | 21.47 | $ | 30.80 | ||||
The calculation of diluted weighted average shares outstanding for 2013 and 2012 excludes 32,707 and 42,430 potential common shares, respectively, because the effect of including those potential common shares would be antidilutive.
F-21
Table of Contents
FML Holdings, Inc. and Subsidiaries
Notes to Consolidated Financial Statements
Years Ended December 31, 2013 and 2012
(in thousands, except share and per share data)
| 12. | Derivative Instruments |
The Company enters into interest rate swap agreements as a means to hedge its variable interest rate risk on debt instruments. The notional value of these swap agreements is $560,550 at December 31, 2013 and effectively fixes the variable rate in a range of 0.830% to 3.115%. The notional amount of these instruments is scheduled to increase over time to provide a hedge against variable interest rate debt. The interest rate swap agreements mature at various dates between December 31, 2013 and September 5, 2019.
Certain of the interest rate swaps qualify for cash flow hedge accounting treatment. The following table summarizes the fair values and the respective classification in the Consolidated Balance Sheets as of December 31, 2013 and 2012:
| Assets (Liabilities) | ||||||||||
| Interest Rate Swap Agreements |
Balance Sheet Classification |
2013 | 2012 | |||||||
| Designated as hedges |
Other long-term liabilities | $ | (2,297 | ) | $ | (5,870 | ) | |||
| Not designated as hedges |
Other long-term liabilities | (3,340 | ) | (2,868 | ) | |||||
| Designated as hedges |
Other assets | 2,706 | — | |||||||
|
|
|
|
|
|||||||
| $ | (2,931 | ) | $ | (8,738 | ) | |||||
|
|
|
|
|
|||||||
We recognized $(15) and $0 in interest expense, representing the ineffective portion of our interest rate swap agreements designated as hedges, in the years ended December 31, 2013 and 2012, respectively. We expect $2,490 to be reclassified from accumulated other comprehensive income into interest expense in the year ending December 31, 2014.
| 13. | Fair Value Measurements |
Financial instruments held by the Company include cash equivalents, accounts receivable, accounts payable, long-term debt and interest rate swaps. The Company is also liable for contingent consideration from an acquisition that is subject to fair value measurement. Fair value is defined as the price that would be received to sell an asset, or paid to transfer a liability, in an orderly transaction between market participants at the measurement date. In determining fair value, the Company utilizes certain assumptions that market participants would use in pricing the asset or liability, including assumptions about risk and/or the risks inherent in the inputs to the valuation technique. Based on the examination of the inputs used in the valuation techniques, the Company is required to provide the following information according to the fair value hierarchy. The fair value hierarchy ranks the quality and reliability of the information used to determine fair values. Financial assets and liabilities carried at fair value will be classified and disclosed in one of the following three categories:
| Level 1 |
Quoted market prices in active markets for identical assets or liabilities | |
| Level 2 |
Observable market based inputs or unobservable inputs that are corroborated by market data | |
| Level 3 |
Unobservable inputs that are not corroborated by market data | |
A financial instrument’s categorization within the valuation hierarchy is based upon the lowest level of input that is significant to the fair value measurement.
The book value of cash equivalents, accounts receivable and accounts payable are considered to be representative of their fair values because of their short maturities. The carrying value of the Company’s debt is
F-22
Table of Contents
FML Holdings, Inc. and Subsidiaries
Notes to Consolidated Financial Statements
Years Ended December 31, 2013 and 2012
(in thousands, except share and per share data)
also considered to be representative of its fair value since the interest rate is variable and fluctuates with the market.
The following table presents the amounts carried at fair value as of December 31, 2013 and 2012 for the Company’s other financial instruments.
| Quoted Prices in Active Markets (Level 1) |
Other Observable Inputs (Level 2) |
Unobservable Inputs (Level 3) |
Total | |||||||||||||
| December 31, 2013 |
||||||||||||||||
| Contingent consideration liability |
$ | — | $ | — | $ | (9,833 | ) | $ | (9,833 | ) | ||||||
| Interest rate swap agreements |
— | (2,931 | ) | — | (2,931 | ) | ||||||||||
|
|
|
|
|
|
|
|
|
|||||||||
| $ | — | $ | (2,931 | ) | $ | (9,833 | ) | $ | (12,764 | ) | ||||||
|
|
|
|
|
|
|
|
|
|||||||||
| December 31, 2012 |
||||||||||||||||
| Interest rate swap agreements |
$ | — | $ | (8,738 | ) | $ | — | $ | (8,738 | ) | ||||||
|
|
|
|
|
|
|
|
|
|||||||||
| $ | — | $ | (8,738 | ) | $ | — | $ | (8,738 | ) | |||||||
|
|
|
|
|
|
|
|
|
|||||||||
The contingent consideration related to the Great Plains acquisition is valued based on the expected cash flows using a discount rate of 5.0%.
| 14. | Income Taxes |
Income before provision for income taxes includes the following components:
| 2013 | 2012 | |||||||
| United States |
$ | 137,456 | $ | 205,493 | ||||
| Foreign |
12,420 | 14,349 | ||||||
|
|
|
|
|
|||||
| $ | 149,876 | $ | 219,842 | |||||
|
|
|
|
|
|||||
The components of the provision for income taxes are as follows:
| 2013 | 2012 | |||||||
| Federal |
$ | 34,578 | $ | 51,537 | ||||
| State and local |
3,329 | 2,429 | ||||||
| Foreign |
6,486 | 6,318 | ||||||
|
|
|
|
|
|||||
| Sub-total |
44,393 | 60,284 | ||||||
| Change in deferred |
826 | 10,085 | ||||||
|
|
|
|
|
|||||
| Total |
$ | 45,219 | $ | 70,369 | ||||
|
|
|
|
|
|||||
F-23
Table of Contents
FML Holdings, Inc. and Subsidiaries
Notes to Consolidated Financial Statements
Years Ended December 31, 2013 and 2012
(in thousands, except share and per share data)
The difference between the statutory federal and state income tax rates and the Company’s effective tax rate is due principally to tax depletion and nondeductible expenses. A reconciliation of the statutory federal income tax rate to the Company’s effective tax rate is as follows:
| 2013 | 2012 | |||||||
| U.S. Statutory rate |
35.0 | % | 35.0 | % | ||||
| Increase (decrease) resulting from: |
||||||||
| State income taxes, net |
2.2 | 1.1 | ||||||
| Foreign tax rate differential and adjustment |
1.4 | 0.6 | ||||||
| U.S. statutory depletion |
(6.9 | ) | (3.2 | ) | ||||
| Manufacturers deduction |
(2.1 | ) | (2.4 | ) | ||||
| Other |
0.6 | 0.9 | ||||||
|
|
|
|
|
|||||
| Effective rate |
30.2 | % | 32.0 | % | ||||
|
|
|
|
|
|||||
Significant components of deferred tax assets and liabilities as of December 31, 2013 and 2012 are as follows:
| 2013 | 2012 | |||||||
| Current: |
||||||||
| Accrued liabilities |
$ | 2,976 | $ | 3,115 | ||||
| Inventory |
8,346 | 1,536 | ||||||
| Foreign tax credit carryforwards |
426 | 664 | ||||||
|
|
|
|
|
|||||
| 11,748 | 5,315 | |||||||
|
|
|
|
|
|||||
| Long-term: |
||||||||
| Property, plant and equipment |
(65,028 | ) | (55,378 | ) | ||||
| Stock compensation |
15,921 | 12,821 | ||||||
| Deferred compensation |
1,372 | 1,438 | ||||||
| Interest rate derivatives |
1,026 | 3,549 | ||||||
| Additional pension liability |
978 | 1,504 | ||||||
| Intangibles |
(542 | ) | (176 | ) | ||||
| Other liabilities |
(578 | ) | (230 | ) | ||||
|
|
|
|
|
|||||
| (46,851 | ) | (36,472 | ) | |||||
|
|
|
|
|
|||||
| Net deferred tax (liabilities) assets |
$ | (35,103 | ) | $ | (31,157 | ) | ||
|
|
|
|
|
|||||
At December 31, 2013 and 2012, the Company had $426 and $664, respectively, of gross deferred tax assets related to U.S. foreign tax credits which will begin expiring in 2021.
At December 31, 2013 and 2012, cumulative undistributed earnings of foreign subsidiaries included in consolidated retained earnings amounted to $7,165 and $12,583, respectively. These earnings are indefinitely reinvested in international operations. Accordingly, no provision has been made for U.S. deferred taxes related to future repatriation of these earnings, nor is it practical to estimate the amount of income taxes that would have to be provided if the Company was to conclude that such earnings will be remitted in the foreseeable future.
F-24
Table of Contents
FML Holdings, Inc. and Subsidiaries
Notes to Consolidated Financial Statements
Years Ended December 31, 2013 and 2012
(in thousands, except share and per share data)
The Company or its subsidiaries file income tax returns in the United States, Canada, China, Mexico, and Denmark. The Company is subject to income tax examinations for its U.S. Federal income taxes for the preceding three fiscal years and, in general, is subject to state and local income tax examinations for the same periods. The Company is subject to income tax examinations in Canada, China, Mexico, and Denmark for calendar years 2009 through 2012.
A reconciliation of the beginning and ending amount of unrecognized tax benefits is as follows:
| 2013 | 2012 | |||||||
| Uncertain tax benefits balance as of January 1 |
$ | 4,767 | $ | 3,144 | ||||
| Increases (decreases) for tax positions in prior years |
(267 | ) | 655 | |||||
| Increases (decreases) for tax positions in current year |
182 | 1,304 | ||||||
| Lapses in statutes of limitations |
(138 | ) | (336 | ) | ||||
|
|
|
|
|
|||||
| $ | 4,544 | $ | 4,767 | |||||
|
|
|
|
|
|||||
At December 31, 2013 and 2012, the Company had $4,544 and $4,767, respectively, of unrecognized tax benefits. If the $4,544 were recognized, the full amount would affect the effective tax rate. We do not expect that the amount of unrecognized tax benefits will change significantly within the next twelve months. Interest and penalties are recorded in provision for income taxes. At December 31, 2013 and 2012, the Company had $1,506 and $1,400, respectively, of accrued interest and penalties related to unrecognized tax benefits recorded.
| 15. | Common Stock and Stock Based Compensation |
The Company has two classes of common stock. Class A and Class B common stock have similar rights, with the only difference being that Class B shares do not have voting rights.
The Company’s bylaws provide for certain rights with respect to share transactions. Transfers of shares are, except in limited circumstances, subject to certain rights of refusal by the Company and other existing stockholders, as defined. In addition, each stockholder has the right to request the Company to repurchase the shares he or she owns during designated semi-annual redemption request periods (redemption requests). The Board of Directors shall then determine, in its unconditional, sole and absolute discretion, the aggregate number of shares, if any, that the Company will purchase. Further, employee stockholders are subject to mandatory repurchase provisions in the event of termination of employment under certain circumstances. The purchase price under the redemption requests and the mandatory repurchase provisions shall be at fair market value, as defined, payable in cash either immediately or on a deferred basis.
The Company has a stock option plan that allows for granting of options to acquire 350,000 Class B shares to employees and key non-employees. The options are exercisable for a ten year period. Options are exercisable at times determined by the compensation committee of the Company and, as set forth in each individual option agreement. The options may become exercisable over a period of years or become exercisable only if performance or other goals set by the Board are attained, or may be a combination of both. Options may be exercised, in whole or in part, at any time after becoming exercisable, but not later than the date the option expires, which is typically 10 years from the grant date. Options granted after 2009 contain a 7 year vesting period that may be shortened to five years upon attainment of certain Company performance goals as determined by the compensation committee. The stock option plan also contains a change in control provision that provides for immediate vesting upon certain changes of ownership of the company. All options granted prior to 2010 are fully vested. The Company uses shares available in treasury when options are exercised, to the extent available.
F-25
Table of Contents
FML Holdings, Inc. and Subsidiaries
Notes to Consolidated Financial Statements
Years Ended December 31, 2013 and 2012
(in thousands, except share and per share data)
The weighted-average fair value of options granted during the years ended December 31, 2013 and 2012 was $181.80 and $185.19, respectively, based on the Black-Scholes-Merton options-pricing model, with the following assumptions:
| 2013 | 2012 | |||||||
| Dividend yield |
0.00 | % | 0.00 | % | ||||
| Expected volatility |
46.38 | % | 49.66 | % | ||||
| Risk free interest rate |
1.12 - 2.00 | % | 0.97 - 1.26 | % | ||||
| Expected option life |
6.5 years | 6.5 years | ||||||
The Company has no current plans to declare a dividend that would require a dividend yield assumption other than zero. Expected volatility is based on the volatilities of various comparable companies’ common stock. The comparable companies were selected by analyzing public companies in the industry based on various factors including, but not limited to, company size, financial data availability, active trading volume, and capital structure. The risk free interest rate is an interpolated rate from the U.S. constant maturity treasury rate for a term corresponding to the expected option life. Because the Company does not have sufficient historical data to provide a reasonable basis to estimate the expected life of the options, the Company uses the simplified method, which assumes the expected life is the mid-point between the vesting date and the end of the contractual term.
In determining the underlying value of the Company’s stock, the company used a combination of the guideline company approach and a discounted cash flow analysis. The key assumptions in this estimate include management’s projections of future cash flows, the Company-specific cost of capital used as a discount rate, lack of marketability discount, and qualitative factors to compare the Company to comparable guideline companies. During 2013, factors that contributed to changes in the underlying value of the Company’s stock included the continued recovery of the oil and gas fracking market, changes to future cash flows projected from the Company’s acquisitions, increases in operating leverage due to increased debt, product mix including mix of raw versus resin coated sand, and other factors. As the Company is highly dependent on sales to the oil and gas industry, the market conditions for this industry have a high degree of impact on the Company’s value.
The Company recorded $10,133 and $11,434 of stock compensation expense related to these options, which is included in additional paid-in capital, for the years ended December 31, 2013 and 2012, respectively.
Option activity during 2013 is as follows:
| Options | Weighted Average Exercise Price |
|||||||
| Outstanding at December 31, 2012 |
538,288 | $ | 104.34 | |||||
| Granted |
66,450 | 355.40 | ||||||
| Exercised |
(21,908 | ) | 58.28 | |||||
| Forfeited |
(24,567 | ) | 120.17 | |||||
| Expired |
— | — | ||||||
|
|
|
|
|
|||||
| Outstanding at December 31, 2013 |
558,263 | $ | 135.33 | |||||
| Exercisable at December 31, 2013 |
388,912 | $ | 93.17 | |||||
F-26
Table of Contents
FML Holdings, Inc. and Subsidiaries
Notes to Consolidated Financial Statements
Years Ended December 31, 2013 and 2012
(in thousands, except share and per share data)
Options outstanding as of December 31, 2013 have an aggregate intrinsic value of $136,059 and a weighted average remaining contractual life of 6.3 years. Options that are exercisable as of December 31, 2013 have an aggregate intrinsic value of $113,027 and a weighted average remaining contractual life of 5.6 years. The aggregate intrinsic value represents the difference between the fair value of the Company’s shares of $379.05 per share at December 31, 2013 and the exercise price of the dilutive options, multiplied by the number of dilutive options outstanding at that date.
The aggregate intrinsic value of stock options exercised during the years ended December 31, 2013 and 2012 was $6,564 and $2,574, respectively.
Net cash proceeds from the exercise of stock options were $1,277 and $716 in the years ended December 31, 2013 and 2012, respectively.
There was $2,461 and $965 of income tax benefits realized from stock option exercises in the years ended December 31, 2013 and 2012, respectively.
At December 31, 2013, options to purchase 240,573 Class A shares and 317,690 Class B shares were outstanding. At December 31, 2012, options to purchase 267,098 Class A shares and 271,190 Class B shares were outstanding. As of December 31, 2013, $15,997 of unrecognized compensation cost related to non-vested stock options is expected to be recognized over a weighted-average period of approximately 2.4 years.
| 16. | Defined Benefit Plans |
The Company maintains two defined benefit pension plans covering all union employees at certain facilities that provide benefits based upon years of service or a combination of employee earnings and length of service. The plans are underfunded by $926 and $2,553 as of December 31, 2013 and 2012, respectively. The Company is expected to fund the minimum annual contributions as determined by applicable regulations, which will be $234 for 2014; the Company reserves the right to make contributions in excess of this amount.
The following assumptions were used to determine the Company’s obligations under the plans:
| Wedron Pension | Troy Grove Pension | |||||||||||||||
| 2013 | 2012 | 2013 | 2012 | |||||||||||||
| Discount rate |
4.50 | % | 3.75 | % | 5.00 | % | 4.00 | % | ||||||||
| Long-term rate of return on plan assets |
9.00 | % | 9.00 | % | 9.00 | % | 9.00 | % | ||||||||
The difference in the discount rates used for the Wedron Pension and the Troy Grove Pension is due to the differing characteristics of the two plans, including employee characteristics and plan size. The Company uses a cash flow matching approach to determine its discount rate using each plan’s projected cash flows and the Citigroup Discount Curve.
The long term rate of return on assets is based on management’s estimate of future long term rates of return on similar assets and is consistent with historical returns on such assets.
F-27
Table of Contents
FML Holdings, Inc. and Subsidiaries
Notes to Consolidated Financial Statements
Years Ended December 31, 2013 and 2012
(in thousands, except share and per share data)
The written investment policy for the pension plans includes a target allocation of about 70% in equities and 30% in fixed income investments. Only high-quality diversified securities similar to stocks and bonds are used. Higher-risk securities or strategies (such as derivatives) are not currently used but could be used incidentally by mutual funds held by the plan. The pension plans’ obligations are long-term in nature and the investment policy is therefore focused on the long-term. Goals include achieving gross returns at least equal to relevant indices. Management and the plans’ investment advisor regularly review and discuss investment performance, adherence to the written investment policy, and the investment policy itself.
Benefits under the Wedron plan were frozen effective December 31, 2012.
The following relates to the defined benefit plans as of December 31, 2013 and 2012:
| 2013 | 2012 | |||||||
| Change in benefit obligation |
||||||||
| Benefit obligation at beginning of year |
$ | 8,105 | $ | 7,613 | ||||
| Service cost |
86 | 211 | ||||||
| Interest cost |
300 | 306 | ||||||
| Actuarial (gain)/loss |
(805 | ) | 196 | |||||
| Benefit payments |
(268 | ) | (221 | ) | ||||
|
|
|
|
|
|||||
| Benefit obligation at end of year |
$ | 7,418 | $ | 8,105 | ||||
|
|
|
|
|
|||||
| Change in plan assets |
||||||||
| Fair value of plan assets at beginning of year |
$ | 5,552 | $ | 4,543 | ||||
| Actual return on plan assets |
887 | 604 | ||||||
| Employer contributions |
321 | 626 | ||||||
| Benefit payments |
(268 | ) | (221 | ) | ||||
|
|
|
|
|
|||||
| Fair value of plan assets at end of year |
$ | 6,492 | $ | 5,552 | ||||
|
|
|
|
|
|||||
| Accrued benefit cost |
$ | (926 | ) | $ | (2,553 | ) | ||
|
|
|
|
|
|||||
The accrued benefit cost is included in the Consolidated Balance Sheets in other long-term liabilities.
F-28
Table of Contents
FML Holdings, Inc. and Subsidiaries
Notes to Consolidated Financial Statements
Years Ended December 31, 2013 and 2012
(in thousands, except share and per share data)
The following relates to the defined benefit plans as of December 31, 2013 and 2012:
| 2013 | 2012 | |||||||
| Components of net periodic benefit cost |
||||||||
| Service cost |
$ | 86 | $ | 211 | ||||
| Interest cost |
300 | 306 | ||||||
| Expected return on plan assets |
(503 | ) | (433 | ) | ||||
| Amortization of prior service cost |
19 | 19 | ||||||
| Amortization of net actuarial loss |
253 | 265 | ||||||
|
|
|
|
|
|||||
| Net periodic benefit cost |
$ | 155 | $ | 368 | ||||
|
|
|
|
|
|||||
| Changes in other comprehensive income (loss) |
||||||||
| Net actuarial gain (loss) |
$ | 1,189 | $ | (25 | ) | |||
| Amortization of prior service costs |
19 | 19 | ||||||
| Amortization of net actuarial loss |
253 | 265 | ||||||
| Deferred tax asset |
(565 | ) | (93 | ) | ||||
|
|
|
|
|
|||||
| Other comprehensive loss |
$ | 896 | $ | 166 | ||||
|
|
|
|
|
|||||
The net actuarial loss and prior service cost that the Company expects will be amortized from accumulated other comprehensive loss into periodic benefit cost in the year ending December 31, 2014 are $151 and $18, respectively.
Benefits expected to be paid out over the next ten years:
| Year Ending |
Benefit Payment | |||
| 2014 |
$ | 291 | ||
| 2015 |
331 | |||
| 2016 |
357 | |||
| 2017 |
384 | |||
| 2018 |
414 | |||
| 2019-2023 |
2,411 | |||
Fair value measurements for assets held in the benefit plans as of December 31, 2013 are as follows:
| Quoted Prices in Active Markets (Level 1) |
Other Observable Inputs (Level 2) |
Unobservable Inputs (Level 3) |
Balance at December 31, 2013 |
|||||||||||||
| Cash |
$ | 31 | $ | — | $ | — | $ | 31 | ||||||||
| Fixed income |
2,275 | — | — | 2,275 | ||||||||||||
| Mutual funds |
4,186 | — | — | 4,186 | ||||||||||||
|
|
|
|
|
|
|
|
|
|||||||||
| $ | 6,492 | $ | — | $ | — | $ | 6,492 | |||||||||
|
|
|
|
|
|
|
|
|
|||||||||
| 17. | Other Benefit Plans |
Certain union employees participate in a multiemployer defined benefit pension plan under which monthly contributions are made by the Company based upon payroll costs as governed by the collective bargaining
F-29
Table of Contents
Fairmount Minerals LTD. and Subsidiaries
Notes to Consolidated Financial Statements
Years Ended December 31, 2013 and 2012
(in thousands, except share and per share data)
agreement. The risks of participating in a multiemployer plan are different from a single-employer plan in the following aspects (a) assets contributed to the multiemployer plan by one employer may be used to provide benefits to employees of other participating employers; (b) if a participating employer stops contributing to the plan, the unfunded obligations of the plan may be borne by the remaining participating employers; and (c) if the Company chooses to stop participating in the multiemployer plan, the Company may be required to pay the multiemployer plan an amount based on the underfunded status of the multiemployer plan, referred to as a withdrawal liability. The Company has no plans or intentions to stop participating in the plan as of December 31, 2013. Pension expense for such plans totaled $155 and $367 for the years ended December 31, 2013 and 2012, respectively.
The Company has a defined contribution retirement savings trust and plan covering substantially all employees. Under the provisions of the plan, the Company matches 50% of each employee’s contribution up to 5% of an employee’s annual salary. Company contributions were $965 and $739 for the years ended December 31, 2013 and 2012, respectively.
The Company has a profit sharing plan (Stock Bonus Trust and Plan). This plan covers substantially all nonunion employees. Company contributions are discretionary and plan funds will be allocated to participating employees based upon compensation, as defined. Discretionary contributions accrued at December 31, 2013 and 2012 were $2,103 and $3,320, respectively. The Stock Bonus Trust and Plan held 238,679 of class A shares as of December 31, 2013 and 2012.
Effective January 1, 1999, the Company adopted a Supplemental Executive Retirement Plan (SERP) for certain employees who participate in the Company’s qualified 401(k) plan and/or the Qualified Employee Stock Bonus Plan (ESBP). The purpose of the SERP is to provide an opportunity for the participants of the SERP to defer compensation and to receive their pro rata share of former ESBP contributions. Due to income restrictions imposed by the IRS code, such contributions were formerly made to the ESBP but, in some instances, were forfeited by these employees to the remaining ESBP participant accounts. Company contributions to the SERP were $15 and $163 for the years ended December 31, 2013 and 2012, respectively.
The Company has deferred compensation agreements with various management employees that provide for supplemental payments upon retirement. These amounts are being accrued for over the estimated employment periods of these individuals.
| 18. | Self-Insured Plans |
Certain subsidiaries, located in Illinois and Michigan, are self-insured for workers’ compensation up to $1,000 per occurrence and $3,000 in the aggregate. The Company has an accrued liability of $748 and $364 as of December 31, 2013 and 2012, respectively, for anticipated future payments on claims incurred to date. Management believes these amounts are adequate to cover all required payments.
The Company is also self-insured for medical benefits. The Company has an accrued liability of $2,017 and $2,092 as of December 31, 2013 and 2012, respectively, for anticipated future payments on claims incurred to date. Management believes this amount is adequate to cover all required payments.
| 19. | Commitments and Contingencies |
Certain subsidiaries are defendants in lawsuits in which the alleged injuries are claimed to be silicosis-related and to have resulted, in whole or in part, from exposure to silica-containing products, allegedly
F-30
Table of Contents
FML Holdings, Inc. and Subsidiaries
Notes to Consolidated Financial Statements
Years Ended December 31, 2013 and 2012
(in thousands, except share and per share data)
including those sold by certain subsidiaries. In the majority of cases, there are numerous other defendants. In accordance with its insurance obligations, the defense of these actions has been tendered to and the cases are being defended by the subsidiaries’ insurance carriers. Management believes that the Company’s substantial level of existing and available insurance coverage combined with various open indemnities is more than sufficient to cover any exposure to silicosis-related expenses.
The Company has entered into numerous mineral rights agreements, in which payments under the agreements are expensed as incurred. Certain agreements require annual payments while other agreements require payments based upon annual tons mined and others a combination thereof. Total royalty expense was $1,818 and $1,503 for the years ended December 31, 2013 and 2012, respectively.
The Company leases certain machinery, equipment (including railcars), buildings and office space under operating lease arrangements. Total rent expense associated with these leases was $34,195 and $25,375 for the years ended December 31, 2013 and 2012, respectively.
Minimum lease payments, primarily for equipment and office leases, due under the long-term operating lease obligations:
| Equipment | Real Estate | Total | ||||||||||
| 2014 |
$ | 90 | $ | 1,470 | $ | 1,560 | ||||||
| 2015 |
90 | 1,208 | 1,298 | |||||||||
| 2016 |
— | 1,029 | 1,029 | |||||||||
| 2017 |
— | 621 | 621 | |||||||||
| 2018 |
526 | 526 | ||||||||||
| Thereafter |
— | 1,055 | 1,055 | |||||||||
|
|
|
|
|
|
|
|||||||
| Total |
$ | 180 | $ | 5,909 | $ | 6,089 | ||||||
|
|
|
|
|
|
|
|||||||
| 20. | Transactions With Related Parties |
The Company had purchases from an affiliated entity for freight, logistic services and consulting services related to its operations in China of $1,382 and $3,463 in the years ended December 31, 2013 and 2012, respectively.
The Company had purchases from an affiliated entity for material purchases related to its operations in China of $32 and $334 in the years ended December 31, 2013 and 2012, respectively.
The Company pays a management fee to an affiliated entity. The Company paid a management fee of $2,821 and $1,000 in the years ended December 31, 2013 and 2012, respectively.
| 21. | Segment Reporting |
The Company organizes its business into two reportable segments, Proppant Solutions and Industrial & Recreational Products. The reportable segments are consistent with how management views the markets served by the Company and the financial information reviewed by the chief operating decision maker in deciding how to allocate resources and assess performance.
F-31
Table of Contents
FML Holdings, Inc. and Subsidiaries
Notes to Consolidated Financial Statements
Years Ended December 31, 2013 and 2012
(in thousands, except share and per share data)
The chief operating decision maker primarily evaluates an operating segment’s performance based on segment contribution margin, which excludes certain corporate costs not associated with the operations of the segment. These corporate costs are separately stated below and include costs that are related to functional areas such as operations management, corporate purchasing, accounting, treasury, information technology, legal and human resources. The other accounting policies of the segments are the same as those in the summary of significant accounting policies included in Note 2.
| 2013 | 2012 | |||||||
| Revenue |
||||||||
| Proppant Solutions |
$ | 856,212 | $ | 757,851 | ||||
| Industrial & Recreational Products |
132,174 | 127,339 | ||||||
|
|
|
|
|
|||||
| Total revenue |
988,386 | 885,190 | ||||||
| Segment contribution margin |
||||||||
| Proppant Solutions |
296,320 | 316,251 | ||||||
| Industrial & Recreational Products |
34,765 | 37,837 | ||||||
|
|
|
|
|
|||||
| Total segment contribution margin |
331,085 | 354,088 | ||||||
| Operating expenses excluded from segment contribution margin |
||||||||
| Cost of sales |
4,959 | — | ||||||
| Selling, general, and administrative |
47,440 | 36,745 | ||||||
| Depreciation, depletion, and amortization |
37,771 | 27,690 | ||||||
| Stock compensation expense |
10,133 | 11,434 | ||||||
| Other operating expense (income) |
2,826 | (207 | ) | |||||
| Interest expense, net |
61,926 | 56,714 | ||||||
| Loss on extinguishment of debt |
11,760 | — | ||||||
| Other non-operating expense |
4,394 | 1,870 | ||||||
|
|
|
|
|
|||||
| Income before provision for income taxes |
$ | 149,876 | $ | 219,842 | ||||
|
|
|
|
|
|||||
Asset information, including capital expenditures and depreciation, depletion and amortization, by segment is not included in the reports used by management in monitoring performance, and therefore it is not reported by segment.
The Company’s two largest customers accounted for 19% and 11% of consolidated net sales in the year ended December 31, 2013 and 25% and 11% of consolidated net sales in the year ended December 31, 2012. Both are customers of our Proppant Solutions segment.
F-32
Table of Contents
FML Holdings, Inc. and Subsidiaries
Notes to Consolidated Financial Statements
Years Ended December 31, 2013 and 2012
(in thousands, except share and per share data)
| 22. | Geographic Information |
The following tables show total Company revenues and long-lived assets. Revenues are attributed to geographic regions based on the selling location. Long-lived assets are located in the respective geographic regions.
| Year Ended December 31, |
||||||||
| 2013 | 2012 | |||||||
| Revenue |
||||||||
| Domestic |
$ | 920,636 | $ | 795,372 | ||||
| International |
67,750 | 89,818 | ||||||
|
|
|
|
|
|||||
| Net sales |
$ | 988,386 | $ | 885,190 | ||||
|
|
|
|
|
|||||
| As of December 31, | ||||||||
| 2013 | 2012 | |||||||
| Long-lived assets |
||||||||
| Domestic |
$ | 737,652 | $ | 361,959 | ||||
| International |
11,186 | 13,203 | ||||||
|
|
|
|
|
|||||
| Long-lived assets |
$ | 748,838 | $ | 375,162 | ||||
|
|
|
|
|
|||||
| 23. | Subsequent Events |
Management evaluates events occurring subsequent to the date of the financial statements in determining the accounting for and disclosure of transactions and events that affect the financial statements. Subsequent events have been evaluated through July 11, 2014, which is the date the financial statements were available to be issued.
| 24. | Subsequent Events (unaudited) |
On August 15, 2014, FML Holdings, Inc. changed its name to FMSA Holdings Inc.
F-33
Table of Contents
FML Holdings, Inc. and Subsidiaries
Condensed Consolidated Statements of Income
Six Months Ended June 30, 2014 and 2013
(unaudited)
| Six Months Ended June 30, | ||||||||
| 2014 | 2013 | |||||||
| (in thousands, except share and per share amounts) |
||||||||
| Revenue |
$ | 629,223 | $ | 448,241 | ||||
| Cost of sales (excluding depreciation, depletion, amortization, and stock compensation expense shown separately) |
402,302 | 266,406 | ||||||
| Operating expenses |
||||||||
| Selling, general and administrative expenses |
49,168 | 36,280 | ||||||
| Depreciation, depletion, and amortization expense |
27,522 | 15,553 | ||||||
| Stock compensation expense |
4,313 | 3,709 | ||||||
| Other operating expense (income) |
(328 | ) | 672 | |||||
|
|
|
|
|
|||||
| Income from operations |
146,246 | 125,621 | ||||||
| Interest expense, net |
34,478 | 26,541 | ||||||
| Other non-operating expense |
541 | 570 | ||||||
|
|
|
|
|
|||||
| Income before provision for income taxes |
111,227 | 98,510 | ||||||
| Provision for income taxes |
32,412 | 29,694 | ||||||
|
|
|
|
|
|||||
| Net income |
78,815 | 68,816 | ||||||
| Less: Net income attributable to the noncontrolling interest |
355 | 252 | ||||||
|
|
|
|
|
|||||
| Net income attributable to FML Holdings, Inc. |
$ | 78,460 | $ | 68,564 | ||||
|
|
|
|
|
|||||
| Earnings per share |
||||||||
| Basic |
$ | 17.04 | $ | 14.95 | ||||
| Diluted |
$ | 16.11 | $ | 14.17 | ||||
| Weighted average number of shares outstanding |
||||||||
| Basic |
4,605,094 | 4,585,585 | ||||||
| Diluted |
4,870,152 | 4,839,676 | ||||||
The accompanying notes are an integral part of these condensed consolidated financial statements.
F-34
Table of Contents
FML Holdings, Inc. and Subsidiaries
Condensed Consolidated Statements of Comprehensive Income
Six Months Ended June 30, 2014 and 2013
(unaudited)
| Six Months Ended June 30, | ||||||||
| 2014 | 2013 | |||||||
| (in thousands) | ||||||||
| Net income |
$ | 78,815 | $ | 68,816 | ||||
| Other comprehensive income (loss), net of tax: |
||||||||
| Foreign currency translation adjustment |
(372 | ) | (380 | ) | ||||
| Pension obligations |
56 | 86 | ||||||
| Change in fair value of derivative swap agreements |
(5,006 | ) | 978 | |||||
|
|
|
|
|
|||||
| Total other comprehensive income (loss), net of tax |
(5,322 | ) | 684 | |||||
|
|
|
|
|
|||||
| Comprehensive income |
73,493 | 69,500 | ||||||
| Comprehensive income attributable to the noncontrolling interest |
355 | 252 | ||||||
|
|
|
|
|
|||||
| Comprehensive income attributable to FML Holdings, Inc. |
$ | 73,138 | $ | 69,248 | ||||
|
|
|
|
|
|||||
The accompanying notes are an integral part of these condensed consolidated financial statements.
F-35
Table of Contents
FML Holdings, Inc. and Subsidiaries
Condensed Consolidated Balance Sheets
June 30, 2014 and December 31, 2013
(unaudited)
| June 30, 2014 | December 31, 2013 | |||||||
| (in thousands, except share and per share amounts) |
||||||||
| Assets |
||||||||
| Current assets |
||||||||
| Cash and cash equivalents |
$ | 12,514 | $ | 17,815 | ||||
| Accounts receivable, net |
209,766 | 146,851 | ||||||
| Inventories |
127,355 | 118,349 | ||||||
| Deferred income taxes |
9,363 | 11,748 | ||||||
| Prepaid expenses and other assets |
7,209 | 10,575 | ||||||
|
|
|
|
|
|||||
| Total current assets |
366,207 | 305,338 | ||||||
| Property, plant and equipment, net |
786,500 | 748,838 | ||||||
| Goodwill |
87,457 | 87,452 | ||||||
| Intangibles, net |
103,575 | 106,236 | ||||||
| Other assets |
31,749 | 35,567 | ||||||
|
|
|
|
|
|||||
| Total assets |
$ | 1,375,488 | $ | 1,283,431 | ||||
|
|
|
|
|
|||||
| Liabilities and Equity |
||||||||
| Current liabilities |
||||||||
| Current portion of long-term debt |
$ | 15,687 | $ | 15,687 | ||||
| Accounts payable |
89,047 | 89,998 | ||||||
| Accrued expenses |
29,153 | 28,706 | ||||||
|
|
|
|
|
|||||
| Total current liabilities |
133,887 | 134,391 | ||||||
| Long-term debt |
1,249,285 | 1,246,459 | ||||||
| Deferred income taxes |
47,953 | 46,851 | ||||||
| Other long-term liabilities |
26,336 | 21,088 | ||||||
|
|
|
|
|
|||||
| Total liabilities |
1,457,461 | 1,448,789 | ||||||
|
|
|
|
|
|||||
| Equity |
||||||||
| Class A common stock: $0.01 par value, 8,000,000 authorized shares |
||||||||
| Shares outstanding: 4,627,751 and 4,594,501 at June 30, 2014 and December 31, 2013, respectively |
69 | 69 | ||||||
| Class B common stock: $0.01 par value, 2,000,000 authorized shares |
||||||||
| Shares outstanding: 14,688 and 7,333 at June 30, 2014 and December 31, 2013, respectively |
— | — | ||||||
| Additional paid-in capital |
746,345 | 735,360 | ||||||
| Retained earnings |
405,189 | 326,729 | ||||||
| Accumulated other comprehensive income (loss) |
(8,858 | ) | (3,536 | ) | ||||
|
|
|
|
|
|||||
| Total equity attributable to FML Holdings, Inc. before treasury stock |
1,142,745 | 1,058,622 | ||||||
| Less: Treasury stock at cost |
||||||||
| Shares in treasury: 2,286,544 and 2,285,475 at June 30, 2014 and December 31, 2013, respectively |
(1,227,663 | ) | (1,227,001 | ) | ||||
|
|
|
|
|
|||||
| Total equity (deficit) attributable to FML Holdings, Inc. |
(84,918 | ) | (168,379 | ) | ||||
| Noncontrolling interest |
2,945 | 3,021 | ||||||
|
|
|
|
|
|||||
| Total equity (deficit) |
(81,973 | ) | (165,358 | ) | ||||
|
|
|
|
|
|||||
| Total liabilities and equity |
$ | 1,375,488 | $ | 1,283,431 | ||||
|
|
|
|
|
|||||
The accompanying notes are an integral part of these condensed consolidated financial statements.
F-36
Table of Contents
FML Holdings, Inc. and Subsidiaries
Condensed Consolidated Statements of Equity
Six Months Ended June 30, 2014 and 2013
(unaudited)
| Equity (deficit) attributable to FML Holdings, Inc. | ||||||||||||||||||||||||||||||||
| Common Stock |
Additional Paid-in Capital |
Retained Earnings |
Other Comprehensive Income (Loss) |
Treasury Stock |
Subtotal | Non Controlling Interest |
Total | |||||||||||||||||||||||||
| (in thousands) | ||||||||||||||||||||||||||||||||
| Balances at December 31, 2012 |
$ | 69 | $ | 722,123 | $ | 222,768 | $ | (9,199 | ) | $ | (1,225,299 | ) | $ | (289,538 | ) | $ | 3,610 | $ | (285,928 | ) | ||||||||||||
| Purchase of treasury stock |
— | — | — | — | (1,678 | ) | (1,678 | ) | — | (1,678 | ) | |||||||||||||||||||||
| Stock options exercised |
— | 497 | — | — | — | 497 | — | 497 | ||||||||||||||||||||||||
| Stock compensation expense |
— | 3,709 | — | — | — | 3,709 | — | 3,709 | ||||||||||||||||||||||||
| Tax effect of stock options exercised |
— | 751 | — | — | — | 751 | — | 751 | ||||||||||||||||||||||||
| Transactions with noncontrolling interest |
— | — | — | — | — | — | (239 | ) | (239 | ) | ||||||||||||||||||||||
| Net income |
— | — | 68,564 | — | — | 68,564 | 252 | 68,816 | ||||||||||||||||||||||||
| Other comprehensive income |
— | — | — | 684 | — | 684 | — | 684 | ||||||||||||||||||||||||
|
|
|
|
|
|
|
|
|
|
|
|
|
|
|
|
|
|||||||||||||||||
| Balances at June 30, 2013 |
$ | 69 | $ | 727,080 | $ | 291,332 | $ | (8,515 | ) | $ | (1,226,977 | ) | $ | (217,011 | ) | $ | 3,623 | $ | (213,388 | ) | ||||||||||||
|
|
|
|
|
|
|
|
|
|
|
|
|
|
|
|
|
|||||||||||||||||
| Balances at December 31, 2013 |
$ | 69 | $ | 735,360 | $ | 326,729 | $ | (3,536 | ) | $ | (1,227,001 | ) | $ | (168,379 | ) | $ | 3,021 | $ | (165,358 | ) | ||||||||||||
| Purchase of treasury stock |
— | — | — | — | (662 | ) | (662 | ) | — | (662 | ) | |||||||||||||||||||||
| Stock options exercised |
— | 2,306 | — | — | — | 2,306 | — | 2,306 | ||||||||||||||||||||||||
| Stock compensation expense |
— | 4,313 | — | — | — | 4,313 | — | 4,313 | ||||||||||||||||||||||||
| Tax effect of stock options exercised |
— | 4,366 | — | — | — | 4,366 | — | 4,366 | ||||||||||||||||||||||||
| Transactions with noncontrolling interest |
— | — | — | — | — | — | (431 | ) | (431 | ) | ||||||||||||||||||||||
| Net income |
— | — | 78,460 | — | — | 78,460 | 355 | 78,815 | ||||||||||||||||||||||||
| Other comprehensive income (loss) |
— | — | — | (5,322 | ) | — | (5,322 | ) | — | (5,322 | ) | |||||||||||||||||||||
|
|
|
|
|
|
|
|
|
|
|
|
|
|
|
|
|
|||||||||||||||||
| Balances at June 30, 2014 |
$ | 69 | $ | 746,345 | $ | 405,189 | $ | (8,858 | ) | $ | (1,227,663 | ) | $ | (84,918 | ) | $ | 2,945 | $ | (81,973 | ) | ||||||||||||
|
|
|
|
|
|
|
|
|
|
|
|
|
|
|
|
|
|||||||||||||||||
The accompanying notes are an integral part of these condensed consolidated financial statements.
F-37
Table of Contents
FML Holdings, Inc. and Subsidiaries
Condensed Consolidated Statements of Cash Flows
Six Months Ended June 30, 2014 and 2013
(unaudited)
| Six Months Ended June 30, | ||||||||
| 2014 | 2013 | |||||||
| (in thousands) | ||||||||
| Net income |
$ | 78,815 | $ | 68,816 | ||||
| Adjustments to reconcile net income to net cash provided by operating activities: |
||||||||
| Depreciation and depletion |
24,861 | 15,488 | ||||||
| Amortization of deferred financing costs |
2,637 | 3,339 | ||||||
| Amortization of original issue discount |
599 | — | ||||||
| Amortization of intangible assets |
2,662 | 64 | ||||||
| (Gain) loss on sale of fixed assets |
(953 | ) | — | |||||
| Unrealized loss (gain) on interest rate swaps |
145 | (10 | ) | |||||
| Stock compensation expense |
4,313 | 3,709 | ||||||
| Change in operating assets and liabilities, net of acquired balances: |
||||||||
| Accounts receivable |
(62,915 | ) | (13,730 | ) | ||||
| Inventories |
(9,006 | ) | (2,056 | ) | ||||
| Prepaid expenses and other assets |
8,272 | (1,783 | ) | |||||
| Accounts payable |
(951 | ) | 9,461 | |||||
| Accrued expenses |
1,503 | 10,359 | ||||||
|
|
|
|
|
|||||
| Net cash provided by operating activities |
49,982 | 93,657 | ||||||
|
|
|
|
|
|||||
| Cash flows from investing activities |
||||||||
| Proceeds from sale of fixed assets |
1,214 | — | ||||||
| Capital expenditures |
(61,827 | ) | (41,276 | ) | ||||
| Purchase of business and assets |
— | (120,299 | ) | |||||
|
|
|
|
|
|||||
| Net cash used in investing activities |
(60,613 | ) | (161,575 | ) | ||||
|
|
|
|
|
|||||
| Cash flows from financing activities |
||||||||
| Proceeds from issuance of term loans |
41,000 | 23,000 | ||||||
| Payments on term debt |
(6,256 | ) | — | |||||
| Change in other long-term debt and capital leases |
(2,277 | ) | (1,430 | ) | ||||
| Proceeds from borrowing on revolving credit facility |
32,000 | 82,500 | ||||||
| Payments on revolving credit facility |
(63,000 | ) | (32,500 | ) | ||||
| Proceeds from option exercises |
2,306 | 497 | ||||||
| Purchase of treasury stock |
(662 | ) | (1,678 | ) | ||||
| Tax effect of stock options exercised |
4,366 | 751 | ||||||
| Transactions with noncontrolling interest |
(431 | ) | (239 | ) | ||||
| Financing costs |
(1,699 | ) | — | |||||
|
|
|
|
|
|||||
| Net cash provided by financing activities |
5,347 | 70,901 | ||||||
|
|
|
|
|
|||||
| Foreign currency adjustment |
(17 | ) | 85 | |||||
|
|
|
|
|
|||||
| (Decrease) increase in cash and cash equivalents |
(5,301 | ) | 3,068 | |||||
| Cash and cash equivalents: |
||||||||
| Beginning of period |
17,815 | 11,866 | ||||||
|
|
|
|
|
|||||
| End of period |
$ | 12,514 | $ | 14,934 | ||||
|
|
|
|
|
|||||
The accompanying notes are an integral part of these condensed consolidated financial statements.
F-38
Table of Contents
FML Holdings, Inc. and Subsidiaries
Notes to Condensed Consolidated Financial Statements
(in thousands, except share and per share data)
(unaudited)
| 1. | Significant Accounting Policies |
Basis of Presentation
The unaudited condensed consolidated financial statements of FML Holdings, Inc. and its consolidated subsidiaries (the “Company”) have been prepared in accordance with accounting principles generally accepted in the United States of America (“GAAP”) for interim financial information. Accordingly, they do not include all of the information and footnotes required by GAAP for complete financial statements. In the opinion of management, the unaudited condensed consolidated financial statements reflect all adjustments (which are of a normal, recurring nature) and disclosures necessary for a fair presentation of the financial position, results of operations, comprehensive income and cash flows of the reported interim periods. The condensed consolidated balance sheet as of December 31, 2013 was derived from audited financial statements, but does not include all disclosures required by GAAP. Interim results are not necessarily indicative of the results to be expected for the full year or any other interim period. These unaudited condensed consolidated financial statements should be read in conjunction with the Company’s consolidated financial statements and notes thereto included elsewhere in this prospectus.
Use of Estimates
The preparation of financial statements in conformity with GAAP requires management to make estimates and assumptions that affect the reported amounts of assets and liabilities and disclosures of contingent assets and liabilities at the date of the financial statements and the reported amounts of revenue and expenses during the reporting period. Actual results could differ from those estimates.
Recent Accounting Pronouncements
In April 2014, the FASB issued Accounting Standards Update No. 2014-08, Presentation of Financial Statements (Topic 205) and Property, Plant and Equipment (Topic 360): Reporting Discontinued Operations and Disclosures of Disposals of Components of an Entity (ASU 2014-08), which amended existing requirements for reporting discontinued operations. Under the new guidance, discontinued operations reporting will be limited to disposal transactions that represent strategic shifts having a major effect on operations and financial results. The amended guidance also enhances disclosures and requires assets and liabilities of a discontinued operation to be classified as such for all periods presented in the financial statements. The guidance is effective for disposal transactions occurring in reporting periods beginning after December 15, 2014. Presentation and disclosures of future disposal transactions after adoption of the guidance may be different than under current standards.
In May 2014, the FASB issued Accounting Standards Update No. 2014-09, Revenue from Contracts with Customers (ASU 2014-09). Under ASU 2014-09, companies recognize revenue in a manner that depicts the transfer of promised goods or services to customers in an amount that reflects the consideration to which the entity expects to be entitled, in exchange for those goods or services. The new requirements significantly enhance comparability of revenue recognition practices across entities, industries, jurisdictions, and capital markets. Additionally, the guidance requires improved disclosures to help users of financial statements better understand the nature, amount, timing, and uncertainty of revenue that is recognized. The Company is not required to adopt this reporting standard until reporting periods beginning after December 15, 2016. We are in the process of evaluating the effect of the new guidance on our financial statements and disclosures.
F-39
Table of Contents
FML Holdings, Inc. and Subsidiaries
Notes to Condensed Consolidated Financial Statements
(in thousands, except share and per share data)
(unaudited)
| 2. | Inventories |
At June 30, 2014 and December 31, 2013, inventories consisted of the following:
| June 30, 2014 |
December 31, 2013 |
|||||||
| Raw materials |
$ | 17,568 | $ | 16,766 | ||||
| Work-in-process |
22,874 | 24,576 | ||||||
| Finished goods |
86,975 | 77,183 | ||||||
|
|
|
|
|
|||||
| 127,417 | 118,525 | |||||||
| Less: LIFO reserve |
(62 | ) | (176 | ) | ||||
|
|
|
|
|
|||||
| $ | 127,355 | $ | 118,349 | |||||
|
|
|
|
|
|||||
| 3. | Property, Plant and Equipment |
At June 30, 2014 and December 31, 2013, property, plant and equipment consisted of the following:
| June 30, 2014 |
December 31, 2013 |
|||||||
| Land and improvements |
$ | 40,320 | $ | 38,557 | ||||
| Mineral reserves and mine development |
288,776 | 280,727 | ||||||
| Machinery and equipment |
446,980 | 426,798 | ||||||
| Buildings and improvements |
108,076 | 100,217 | ||||||
| Furniture, fixtures and other |
3,064 | 2,558 | ||||||
| Construction in progress |
136,081 | 112,819 | ||||||
|
|
|
|
|
|||||
| 1,023,297 | 961,676 | |||||||
| Accumulated depreciation and depletion |
(236,797 | ) | (212,838 | ) | ||||
|
|
|
|
|
|||||
| Property, plant and equipment, net |
$ | 786,500 | $ | 748,838 | ||||
|
|
|
|
|
|||||
| 4. | Long-Term Debt |
At June 30, 2014 and December 31, 2013, long-term debt consisted of the following:
| June 30, 2014 |
December 31, 2013 |
|||||||
| Term Loan B-1 |
$ | 321,315 | $ | 322,714 | ||||
| Term Loan B-2 |
915,148 | 878,605 | ||||||
| Industrial Revenue bond |
10,000 | 10,000 | ||||||
| Revolving credit facility and other |
11,286 | 42,775 | ||||||
| Capital leases, net |
7,223 | 8,052 | ||||||
|
|
|
|
|
|||||
| 1,264,972 | 1,262,146 | |||||||
| Less: current portion |
(15,687 | ) | (15,687 | ) | ||||
|
|
|
|
|
|||||
| Long-term debt including leases |
$ | 1,249,285 | $ | 1,246,459 | ||||
|
|
|
|
|
|||||
F-40
Table of Contents
FML Holdings, Inc. and Subsidiaries
Notes to Condensed Consolidated Financial Statements
(in thousands, except share and per share data)
(unaudited)
In February 2014 the Company executed a joinder agreement to borrow $41,000 as an additional Term Loan B-2. The proceeds of this borrowing were used to repay then outstanding amounts under the revolving credit facility. The additional borrowings mature on the same date as the then existing Term Loan B-2 (September 5, 2019) and the required quarterly principal repayments for the Term Loan B-2 were increased by one-quarter of 1% of the amount borrowed with the balance due at maturity. There were no other changes in the terms, interest rates or covenants of the 2013 Amended Credit Agreement.
In March 2014 the Company amended the existing 2013 Amended Credit Agreement whereby the applicable margin for the Term Loan B-1 and the Term Loan B-2 base rate loans was reduced to 2.50% and the applicable margin for the Term Loan B-1 and the Term Loan B-2 Eurodollar rate loans was reduced to 3.50% .
| 5. | Earnings per Share |
The table below shows the computation of basic and diluted earnings per share for the six months ended June 30, 2014 and 2013:
| Six Months Ended June 30, | ||||||||
| 2014 | 2013 | |||||||
| Numerator: |
||||||||
| Net income attributable to FML Holdings, Inc. |
$ | 78,460 | $ | 68,564 | ||||
| Denominator: |
||||||||
| Basic weighted average shares outstanding |
4,605,094 | 4,585,585 | ||||||
| Dilutive effect of employee stock options |
265,058 | 254,091 | ||||||
|
|
|
|
|
|||||
| Diluted weighted average shares outstanding |
4,870,152 | 4,839,676 | ||||||
|
|
|
|
|
|||||
| Earnings per common share—basic |
$ | 17.04 | $ | 14.95 | ||||
| Earnings per common share—diluted |
$ | 16.11 | $ | 14.17 | ||||
The calculation of diluted weighted average shares outstanding for the six months ended June 30, 2014 and 2013 excludes 55,764 and 23,642 potential common shares, respectively, because the effect of including these potential common shares would be antidilutive.
| 6. | Derivative Instruments |
The Company enters into interest rate swap agreements as a means to hedge its variable interest rate risk on debt instruments. The notional value of these swap agreements is $542,300 at June 30, 2014 and effectively fixes the variable rate in a range of 0.83% to 3.115% . The notional amount of these instruments is scheduled to increase over time to provide a hedge against variable interest rate debt. The interest rate swap agreements mature at various dates between March 31, 2015 and September 5, 2019.
The derivative instruments are recorded on the balance sheet at their fair values. Changes in the fair value of derivatives are recorded each period in current earnings or in other comprehensive income, depending on whether a derivative is designated as part of a hedging relationship and, if it is, depending on the type of hedging relationship. For cash flow hedges in which the Company is hedging the variability of cash flows related to a variable-rate liability, the effective portion of the gain or loss on the derivative instrument is reported in other comprehensive income in the periods during which earnings are impacted by the variability of the cash flows of the hedged item. The ineffective portion of all hedges is recognized in current period earnings. As interest
F-41
Table of Contents
FML Holdings, Inc. and Subsidiaries
Notes to Condensed Consolidated Financial Statements
(in thousands, except share and per share data)
(unaudited)
expense is accrued on the debt obligation, amounts in accumulated other comprehensive income (loss) related to the interest rate swaps are reclassified into income to obtain a net cost on the debt obligation equal to the effective yield of the fixed rate of each swap. In the event that an interest rate swap is terminated prior to maturity, gains or losses in accumulated other comprehensive income (loss) remain deferred and are reclassified into earnings in the periods which the hedged forecasted transaction affects earnings.
The Company formally designated and documents instruments at inception that qualify for hedge accounting of underlying exposures in accordance with GAAP. Both at inception and for each reporting period, the Company assesses whether the financial instruments used in hedging transactions are effective in offsetting changes in cash flows of the related underlying exposure.
The following table summarizes the fair values and the respective classification in the Condensed Consolidated Balance Sheets as of June 30, 2014 and December 31, 2013:
| Assets (Liabilities) | ||||||||||
| June 30, 2014 |
December 31, 2013 |
|||||||||
| Interest Rate Swap Agreements |
Balance Sheet Classification | |||||||||
| Designated as hedges |
Other long-term liabilities | $ | (8,175 | ) | $ | (2,297 | ) | |||
| Not designated as hedges |
Other long-term liabilities | (2,410 | ) | (3,340 | ) | |||||
| Designated as hedges |
Other assets | 146 | 2,706 | |||||||
|
|
|
|
|
|||||||
| $ | (10,439 | ) | $ | (2,931 | ) | |||||
|
|
|
|
|
|||||||
We recognized $21 and $0 in interest expense, representing the ineffective portion of our interest rate swap agreements designated as hedges, in the six months ended June 30, 2014 and 2013, respectively.
| 7. | Fair Value Measurements |
Financial instruments held by the Company include cash equivalents, accounts receivable, accounts payable, long-term debt and interest rate swaps. The Company is also liable for contingent consideration from an acquisition that is subject to fair value measurement. Fair value is defined as the price that would be received to sell an asset, or paid to transfer a liability, in an orderly transaction between market participants at the measurement date. In determining fair value, the Company utilizes certain assumptions that market participants would use in pricing the asset or liability, including assumptions about risk and/or the risks inherent in the inputs to the valuation technique. Based on the examination of the inputs used in the valuation techniques, the Company is required to provide the following information according to the fair value hierarchy. The fair value hierarchy ranks the quality and reliability of the information used to determine fair values. Financial assets and liabilities carried at fair value will be classified and disclosed in one of the following three categories:
| Level 1 | Quoted market prices in active markets for identical assets or liabilities | |
| Level 2 | Observable market based inputs or unobservable inputs that are corroborated by market data | |
| Level 3 | Unobservable inputs that are not corroborated by market data | |
A financial instrument’s categorization within the valuation hierarchy is based upon the lowest level of input that is significant to the fair value measurement.
F-42
Table of Contents
FML Holdings, Inc. and Subsidiaries
Notes to Condensed Consolidated Financial Statements
(in thousands, except share and per share data)
(unaudited)
The book value of cash equivalents, accounts receivable and accounts payable are considered to be representative of their fair values because of their short maturities. The carrying value of the Company’s debt is also considered to be representative of its fair value since the interest rate is variable and fluctuates with the market. The contingent consideration related to the Great Plains acquisition is valued based on the expected cash flows using a discount rate of 5%.
The following table presents the amounts carried at fair value as of June 30, 2014 and December 31, 2013 for the Company’s other financial instruments.
| Quoted Prices in Active Markets (Level 1) |
Other Observable Inputs (Level 2) |
Unobservable Inputs (Level 3) |
Total | |||||||||||||
| Contingent consideration liability |
$ | — | $ | — | $ | (10,000 | ) | $ | (10,000 | ) | ||||||
| Interest rate swap agreements |
— | (10,438 | ) | — | (10,438 | ) | ||||||||||
|
|
|
|
|
|
|
|
|
|||||||||
| June 30, 2014 |
$ | — | $ | (10,438 | ) | $ | (10,000 | ) | $ | (20,438 | ) | |||||
|
|
|
|
|
|
|
|
|
|||||||||
| Contingent consideration liability |
$ | — | $ | — | $ | (9,833 | ) | $ | (9,833 | ) | ||||||
| Interest rate swap agreements |
— | (2,931 | ) | — | (2,931 | ) | ||||||||||
|
|
|
|
|
|
|
|
|
|||||||||
| December 31, 2013 |
$ | — | $ | (2,931 | ) | $ | (9,833 | ) | $ | (12,764 | ) | |||||
|
|
|
|
|
|
|
|
|
|||||||||
The contingent consideration related to the Great Plains Sands, LLC acquisition is revalued each period based on the expected cash flows, using a discount rate of 5.0% . The amount due under the earnout agreement was determined to be $10 million and was paid in July 2014.
| 8. | Common Stock and Stock Based Compensation |
The Company granted options to purchase 9,750 and 9,000 shares of common stock in the six months ended June 30, 2014 and 2013, respectively. The average exercise price was $379.05 and $355.40 in the six months ended June 30, 2014 and 2013, respectively.
| 9. | Defined Benefit Plans |
The Company maintains two defined benefit pension plans covering all union employees at certain facilities that provide benefits based upon years of service or a combination of employee earnings and length of service. Net periodic benefit cost recognized for these plans for the six months ended June 30, 2014 and 2013 is as follows:
| Six Months Ended June 30, |
||||||||
| 2014 | 2013 | |||||||
| Service cost |
$ | 38 | $ | 44 | ||||
| Interest cost |
166 | 150 | ||||||
| Expected return on plan assets |
(292 | ) | (252 | ) | ||||
| Amortization of prior service cost |
10 | 10 | ||||||
| Amortization of net actuarial loss |
80 | 126 | ||||||
|
|
|
|
|
|||||
| Net periodic benefit cost |
$ | 2 | $ | 78 | ||||
|
|
|
|
|
|||||
F-43
Table of Contents
FML Holdings, Inc. and Subsidiaries
Notes to Condensed Consolidated Financial Statements
(in thousands, except share and per share data)
(unaudited)
The Company contributed $130 and $226 during the six months ended June 30, 2014 and 2013, respectively. Total expected employer contributions during the year ending December 31, 2014 are $234.
| 10. | Accumulated Other Comprehensive Income |
The components of accumulated other comprehensive income (loss) attributable to FML Holdings, Inc. at June 30, 2014 and December 31, 2013 were as follows:
| June 30, 2014 | ||||||||||||
| Gross | Tax effect | Net Amount | ||||||||||
| Foreign currency translation |
$ | (2,998 | ) | $ | — | $ | (2,998 | ) | ||||
| Additional pension liability |
(2,627 | ) | 985 | (1,642 | ) | |||||||
| Unrealized loss on interest rate hedges |
(6,749 | ) | 2,531 | (4,218 | ) | |||||||
|
|
|
|
|
|
|
|||||||
| $ | (12,374 | ) | $ | 3,516 | $ | (8,858 | ) | |||||
|
|
|
|
|
|
|
|||||||
| December 31, 2013 | ||||||||||||
| Gross | Tax effect | Net Amount | ||||||||||
| Foreign currency translation |
$ | (2,626 | ) | $ | — | $ | (2,626 | ) | ||||
| Additional pension liability |
(2,717 | ) | 1,019 | (1,698 | ) | |||||||
| Unrealized loss on interest rate hedges |
1,260 | (472 | ) | 788 | ||||||||
|
|
|
|
|
|
|
|||||||
| $ | (4,083 | ) | $ | 547 | $ | (3,536 | ) | |||||
|
|
|
|
|
|
|
|||||||
The following table presents the changes in accumulated other comprehensive income by component for the six months ended June 30, 2014:
| Six Months Ended June 30, 2014 | ||||||||||||||||
| Unrealized gain (loss) on interest rate hedges |
Additional pension liability |
Foreign currency translation |
Total | |||||||||||||
| Beginning balance |
$ | 788 | $ | (1,698 | ) | $ | (2,626 | ) | $ | (3,536 | ) | |||||
| Other comprehensive income (loss) before reclassifications |
(5,822 | ) | — | (372 | ) | (6,194 | ) | |||||||||
| Amounts reclassified from accumulated other comprehensive income |
816 | 56 | — | 872 | ||||||||||||
|
|
|
|
|
|
|
|
|
|||||||||
| Ending balance |
$ | (4,218 | ) | $ | (1,642 | ) | $ | (2,998 | ) | $ | (8,858 | ) | ||||
|
|
|
|
|
|
|
|
|
|||||||||
F-44
Table of Contents
FML Holdings, Inc. and Subsidiaries
Notes to Condensed Consolidated Financial Statements
(in thousands, except share and per share data)
(unaudited)
The following table presents the reclassifications out of accumulated other comprehensive income during the six months ended June 30, 2014:
| Details about accumulated other comprehensive income |
Amount reclassified from accumulated other comprehensive income |
Affected line item on the statement of income | ||||
| Change in fair value of derivative swap agreements |
||||||
| Interest rate contracts |
$ | 1,305 | Interest expense | |||
| (489 | ) | Tax expense (benefit) | ||||
|
|
|
|||||
| $ | 816 | Net of tax | ||||
| Amortization of pension obligations |
||||||
| Prior service cost |
$ | 8 | Cost of sales | |||
| Actuarial gains (losses) |
82 | Cost of sales | ||||
|
|
|
|||||
| 90 | Total before tax | |||||
| (34 | ) | Tax expense | ||||
|
|
|
|||||
| $ | 56 | Net of tax | ||||
|
|
|
|||||
| Total reclassifications for the period |
$ | 872 | Net of tax | |||
|
|
|
|||||
| 11. | Commitments and Contingencies |
Certain subsidiaries are defendants in lawsuits in which the alleged injuries are claimed to be silicosis-related and to have resulted, in whole or in part, from exposure to silica-containing products, allegedly including those sold by certain subsidiaries. In the majority of cases, there are numerous other defendants. In accordance with its insurance obligations, the defense of these actions has been tendered to and the cases are being defended by the subsidiaries’ insurance carriers. Management believes that the Company’s substantial level of existing and available insurance coverage combined with various open indemnities is more than sufficient to cover any exposure to silicosis-related expenses.
The Company has entered into numerous mineral rights agreements, in which payments under the agreements are expensed as incurred. Certain agreements require annual payments while other agreements require payments based upon annual tons mined and others a combination thereof.
The Company leases certain machinery, equipment (including railcars), buildings and office space under operating lease arrangements. Total rent expense associated with these leases was $25,458 and $12,398 for the six months ended June 30, 2014 and 2013, respectively.
The Company is subject to a contingent consideration arrangement related to the purchase of Self-Suspending Proppant LLC (“SSP”), which was accounted for as an acquisition of a group of assets. The contingent consideration is based on a fixed percentage of the cumulative product margin, less certain adjustments, generated by sales of Propel SSP for the five years commencing on October 1, 2015. Because the earnout is dependent on future sales and the related cost of sales, the amounts of which are highly uncertain, it is not currently possible to estimate the amounts that will be paid. The contingent consideration will be accrued and capitalized as part of the cost of the SSP assets at the time a payment is probable and reasonably estimable.
F-45
Table of Contents
FML Holdings, Inc. and Subsidiaries
Notes to Condensed Consolidated Financial Statements
(in thousands, except share and per share data)
(unaudited)
| 12. | Transactions with Related Parties |
The Company had purchases from an affiliated entity for freight, logistic services and consulting services related to its operations in China of $976 and $608 in the six months ended June 30, 2014 and 2013, respectively.
The Company had purchases from an affiliated entity for material purchases related to its operations in China of $0 and $8 in the six months ended June 30, 2014 and 2013, respectively.
The Company paid management fees of $526 and $500 in the six months ended June 30, 2014 and 2013, respectively, to an affiliated entity.
| 13. | Segment Reporting |
The Company organizes its business into two reportable segments, Proppant Solutions and Industrial & Recreational Products. The reportable segments are consistent with how management views the markets served by the Company and the financial information reviewed by the chief operating decision maker in deciding how to allocate resources and assess performance.
The chief operating decision maker primarily evaluates an operating segment’s performance based on segment contribution margin, which excludes certain corporate costs not associated with the operations of the segment. These corporate costs are separately stated below and include costs that are related to functional areas such as operations management, corporate purchasing, accounting, treasury, information technology, legal and human resources.
| Six Months Ended June 30, | ||||||||
| 2014 | 2013 | |||||||
| Revenue |
||||||||
| Proppant Solutions |
$ | 567,185 | $ | 378,286 | ||||
| Industrial & Recreational Products |
62,038 | 69,955 | ||||||
|
|
|
|
|
|||||
| Total revenue |
629,223 | 448,241 | ||||||
| Segment contribution margin |
||||||||
| Proppant Solutions |
192,928 | 150,267 | ||||||
| Industrial & Recreational Products |
16,835 | 17,002 | ||||||
|
|
|
|
|
|||||
| Total segment contribution margin |
209,763 | 167,269 | ||||||
| Operating expenses excluded from segment contribution margin |
||||||||
| Selling, general, and administrative |
32,010 | 21,714 | ||||||
| Depreciation, depletion, and amortization |
27,522 | 15,553 | ||||||
| Stock compensation expense |
4,313 | 3,709 | ||||||
| Other operating expense (income) |
(328 | ) | 672 | |||||
| Interest expense, net |
34,478 | 26,541 | ||||||
| Other non-operating expense |
541 | 570 | ||||||
|
|
|
|
|
|||||
| Income before provision for income taxes |
$ | 111,227 | $ | 98,510 | ||||
|
|
|
|
|
|||||
F-46
Table of Contents
FML Holdings, Inc. and Subsidiaries
Notes to Condensed Consolidated Financial Statements
(in thousands, except share and per share data)
(unaudited)
| 14. | Subsequent Events |
Management evaluates events occurring subsequent to the date of the financial statements in determining the accounting for and disclosure of transactions and events that affect the financial statements. Subsequent events have been evaluated through August 22, 2014, which is the date the financial statements were available to be issued.
On August 15, 2014, FML Holdings, Inc. changed its name to FMSA Holdings Inc.
F-47
Table of Contents
activator: A substance that triggers chemical properties which create an increased propensity for undergoing a specified chemical reaction.
API: American Petroleum Institute
BTU: British Thermal Unit
captive terminal: A terminal owned by or operated exclusively for the benefit of the Company.
ceramic proppant: An artificially manufactured proppant of consistent size and sphere shape that offers a high crush resistance.
Class I Railroad: A designation by the Surface Transportation Board of the largest railroads based upon annual carrier operating revenues.
curable resin: A resin that bonds together under closure stress and high temperatures. This resin is designed to generate more uniform stress distribution.
diagenesis: A chemical reaction where proppants, under heat and pressure, react with the fracturing fluids and/or formation face to degrade the proppant.
downhole completions: A set of events and protocols necessary to bring a wellbore into production once drilling operations have been concluded, including but not limited to fracturing, pumping of frac fluid system, and shut-in after installation of downhole hardware and equipment required to enable safe and efficient production from an oil or gas well.
EBITDA: A non-GAAP supplemental financial measure defined as net income (loss) before net interest expense, income tax expense and depreciation and depletion expense.
embedment: The ability of a proppant to embed into the surrounding rock formation, which results in reduced flow capacity by decreasing the overall width of the fracture.
fines: Crushed sand grains.
frac sand: A proppant used in the completion and re-completion of oil and gas wells to stimulate and maintain oil and natural gas production through the process of hydraulic fracturing.
GAAP: Generally accepted accounting principles in the United States.
hydraulic fracturing: The process of pumping fluids, mixed with granular proppants, into a geological formation at pressures sufficient to create fractures in the hydrocarbon-bearing rock.
in-basin: Refers to sales from one of our distribution terminals where a customer picks up our proppant in a truck to transport directly to a well site. These distribution terminals are geographically situated to efficiently and economically serve the applicable oil and gas basin.
md-FT: The most common unit of measure for conductivity. It represents the product of fracture permeability and fracture width.
mesh size: Measurement of the size of a grain of sand indicating it will pass through a sieve of a certain size.
A-1
Table of Contents
mine horizon: The mix of grades of sand from top to bottom of the reserves deposit.
Northern White sand: A monocrystalline sand with greater sphericity and roundness enabling higher crush resistances and conductivity.
polymer breaking: After higher viscosity fracturing fluid serves its purpose of fracturing the formation, it is necessary to “break” the gelled polymer in order for hydrocarbons to flow. The polymer gel viscosity is reduced significantly upon breaking. In short, polymer breaking means reduction in the molecular chain length of the starting material. The chemical breakers used are either oxidizers, acids or enzymes.
proppant: A sized particle mixed with fracturing fluid to hold fractures open after a hydraulic fracturing treatment.
proven reserves: Quantity of sand estimated with reasonable certainty, from the analysis of geologic and engineering data, to be recoverable from well-established or known reservoirs with the existing equipment and under the existing operating conditions.
reserves: Sand that can be economically extracted or produced at the time of determination based on relevant legal, economic and technical considerations.
resin coated sand: Raw sand that is coated with a flexible resin that increases the sand’s crush resistance and prevents crushed sand from dispersing throughout the fracture.
roundness: A measure of how round the curvatures of an object are. The opposite of round is angular. It is possible for an object to be round but not spherical (e.g. an egg-shaped particle is round, but not spherical). When used to describe proppant, roundness is a reference to having a curved shape which promotes hydrocarbon flow, as the curvature creates a space through which the hydrocarbons can flow.
silica: A chemically resistant dioxide of silicon that occurs in crystalline, amorphous and cryptocrystalline forms.
sold in-basin: Sales of proppant products in oil and gas producing basins proximate to their end use.
sphericity: A measure of how well an object is formed in a shape where all points are equidistant from the center. The more spherical a proppant, the more highly it is desired relative to non-spherical proppant, as the gaps created by it are typically the largest and this promotes maximum hydrocarbon flow.
tempered resin: A sand-grain coating that is designed to increase the strength of individual grains by adding a thin deformable coating onto the grain. This coating allows greater grain-to-grain contact and more evenly distributes the point stresses. These products do not require activation, as their chemical properties are already active.
transloading capacity: The annual aggregate throughput volume of proppants at the Company’s terminals.
Tier I emissions: Direct greenhouse gas emissions from sources owned or controlled by a company.
Tier II emissions: Indirect greenhouse gas emissions from goods or resources used by a company.
turbidity: Measurement of the level of contaminants, such as silt and clay, in a sample.
unit train: A train made up of 100 or more railcars which are all shipped from the same origin to the same destination without being split up or stored en route.
A-2
Table of Contents
Shares
FMSA Holdings Inc.
COMMON STOCK
PROSPECTUS
, 2014
Morgan Stanley
Wells Fargo Securities
Barclays
Goldman, Sachs & Co.
Jefferies
J.P. Morgan
KeyBanc Capital Markets
RBC Capital Markets
Baird
Cowen and Company
PNC Capital Markets LLC
Raymond James
Scotiabank / Howard Weil
Simmons & Company
International
Tudor, Pickering, Holt & Co.
Through and including , 2014 (the 25th day after the date of this prospectus), all dealers effecting transactions in these securities, whether or not participating in this offering, may be required to deliver a prospectus. This is in addition to a dealer’s obligation to deliver a prospectus when acting as underwriters and with respect to an unsold allotment or subscription.
Table of Contents
Part II
INFORMATION NOT REQUIRED IN PROSPECTUS
| Item 13. | Other expenses of issuance and distribution |
The following table sets forth an itemized statement of the amounts of all expenses (excluding underwriting discounts and commissions) payable by us in connection with the registration of the common stock offered hereby. With the exception of the Registration Fee, FINRA Filing Fee and New York Stock Exchange listing fee), the amounts set forth below are estimates.
| SEC Registration Fee |
$ | 12,880 | ||
| FINRA Filing Fee |
$ | 15,500 | ||
| New York Stock Exchange listing fee |
* | |||
| Accountants’ fees and expenses |
* | |||
| Legal fees and expenses |
* | |||
| Printing and engraving expenses |
* | |||
| Transfer agent and registrar fees |
* | |||
| Miscellaneous |
* | |||
|
|
|
|||
| Total |
$ | * | ||
|
|
|
| * | To be filed by amendment. |
| Item 14. | Indemnification of Directors and Officers |
Our amended and restated certificate of incorporation will provide that a director will not be liable to the corporation or its stockholders for monetary damages to the fullest extent permitted by the DGCL. In addition, if the DGCL is amended to authorize the further elimination or limitation of the liability of directors, then the liability of a director of the corporation, in addition to the limitation on personal liability provided for in our certificate of incorporation, will be limited to the fullest extent permitted by the amended DGCL. Our amended and restated bylaws will provide that the corporation will indemnify, and advance expenses to, any officer or director to the fullest extent authorized by the DGCL.
Section 145 of the DGCL provides that a corporation may indemnify directors and officers as well as other employees and individuals against expenses, including attorneys’ fees, judgments, fines and amounts paid in settlement in connection with specified actions, suits and proceedings whether civil, criminal, administrative, or investigative, other than a derivative action by or in the right of the corporation, if they acted in good faith and in a manner they reasonably believed to be in or not opposed to the best interests of the corporation and, with respect to any criminal action or proceeding, had no reasonable cause to believe their conduct was unlawful. A similar standard is applicable in the case of derivative actions, except that indemnification extends only to expenses, including attorneys’ fees, incurred in connection with the defense or settlement of such action and the statute requires court approval before there can be any indemnification where the person seeking indemnification has been found liable to the corporation. The statute provides that it is not exclusive of other indemnification that may be granted by a corporation’s certificate of incorporation, bylaws, disinterested director vote, stockholder vote, agreement or otherwise.
Our amended and restated certificate of incorporation will also contain indemnification rights for our directors and our officers. Specifically, our amended and restated certificate of incorporation will provide that we shall indemnify our officers and directors to the fullest extent authorized by the DGCL. Further, we may maintain insurance on behalf of our officers and directors against expense, liability or loss asserted incurred by them in their capacities as officers and directors.
II-1
Table of Contents
We have obtained directors’ and officers’ insurance to cover our directors, officers and some of our employees for certain liabilities.
We will enter into written indemnification agreements with our directors and executive officers. Under these proposed agreements, if an officer or director makes a claim of indemnification to us, either a majority of the independent directors or independent legal counsel selected by the independent directors must review the relevant facts and make a determination whether the officer or director has met the standards of conduct under Delaware law that would permit (under Delaware law) and require (under the indemnification agreement) us to indemnify the officer or director.
The underwriting agreement provides for indemnification by the underwriters of us and our officers and directors, and by us of the underwriters, for certain liabilities arising under the Securities Act or otherwise in connection with this offering.
| Item 15. | Recent Sales of Unregistered Securities |
During the past three years, we have issued unregistered securities to a limited number of persons, as described below. None of these transactions involved any underwriters, underwriting discounts or commissions or any public offering, and we believe that each of these transactions was exempt from the registration requirements pursuant to Section 4(2) of the Securities Act, Regulation D or Regulation S promulgated thereunder or Rule 701 of the Securities Act. All share and price information included in this section does not reflect the impact of the expected pre-offering split of our common stock.
The following table sets forth information on the restricted stock awards issued by us and common stock issued pursuant to the exercise of stock options in the three years preceding the filing of this registration statement.
| Shared Issued Pursuant to Exercise of Option |
||||||||||||||
| Common Stock Issued | ||||||||||||||
| Date |
Person or Class of Person |
Class A | Class B | Total Consideration | ||||||||||
| March 18, 2011 |
Executive Officer | 36,878 | $ | 1,034,579.90 | ||||||||||
| March 21, 2011 |
Executive Officer | 3,000 | $ | 145,200.00 | ||||||||||
| March 28, 2011 |
Executive Officer | 25,000 | $ | 1,210,000.00 | ||||||||||
| March 30, 2011 |
Employee | 1,421 | $ | 68,776.40 | ||||||||||
| March 30, 2011 |
Employee | 1,000 | $ | 48,400.00 | ||||||||||
| April 28, 2011 |
Employee | 1,250 | $ | 60,500.00 | ||||||||||
| April 28, 2011 |
Employee | 400 | $ | 5,020.00 | ||||||||||
| April 28, 2011 |
Executive Officer | 3,500 | $ | 169,400.00 | ||||||||||
| April 28, 2011 |
Employee | 2,400 | $ | 116,160.00 | ||||||||||
| May 02, 2011 |
Employee | 8,399 | $ | 406,511.60 | ||||||||||
| May 23, 2011 |
Executive Officer | 50,000 | $ | 2,036,000.00 | ||||||||||
| May 23, 2011 |
Employee | 29,011 | $ | 1,404,132.40 | ||||||||||
| May 23, 2014 |
Employee | 500 | $ | 24,200.00 | ||||||||||
| May 25, 2011 |
Employee | 8,500 | $ | 411,400.00 | ||||||||||
| May 23, 2011 |
Executive Officer | 2,200 | $ | 15,675.00 | ||||||||||
| May 23, 2011 |
Employee | 5,000 | $ | 242,000.00 | ||||||||||
| June 7, 2011 |
Employee | 300 | $ | 14,520.00 | ||||||||||
| June 27, 2011 |
Employee | 3,000 | $ | 145,200.00 | ||||||||||
| September 2, 2011 |
Employee | 1,779 | $ | 86,103.60 | ||||||||||
| September 26, 2011 |
Employee | 7,500 | $ | 363,000.00 | ||||||||||
| November 1, 2011 |
Executive Officer | 15,000 | $ | 242,000.00 | ||||||||||
II-2
Table of Contents
| Shared Issued Pursuant to Exercise of Option |
||||||||||||||
| Common Stock Issued | ||||||||||||||
| Date |
Person or Class of Person |
Class A | Class B | Total Consideration | ||||||||||
| November 15, 2011 |
Employee | 2,000 | $ | 10,640.00 | ||||||||||
| December 2, 2011 |
Employee | 600 | $ | 29,040.00 | ||||||||||
| December 13, 2011 |
Employee | 567 | $ | 27,442.80 | ||||||||||
| February 29, 2012 |
Employee | 100 | $ | 12,105.00 | ||||||||||
| February 29, 2012 |
Employee | 4,900 | 850 | $ | 340,052.50 | |||||||||
| March 08, 2012 |
Employee | 350 | $ | 42,367.50 | ||||||||||
| April 06, 2012 |
Executive Officer | 1,400 | $ | 169,470.00 | ||||||||||
| May 15, 2012 |
Employee | 1,100 | $ | 133,155.00 | ||||||||||
| May 23, 2012 |
Employee | 10 | $ | 1,210.50 | ||||||||||
| May 7, 2013 |
Employee | 300 | $ | 36,315.00 | ||||||||||
| May 07, 2013 |
Employee | 400 | $ | 19,360.00 | ||||||||||
| May 07, 2013 |
Employee | 700 | $ | 33,880.00 | ||||||||||
| May 07, 2013 |
Employee | 300 | $ | 14,520.00 | ||||||||||
| May 07, 2013 |
Employee | 300 | $ | 14,520.00 | ||||||||||
| May 31, 2013 |
Employee | 4,533 | 1,200 | $ | 364,657.20 | |||||||||
| June 07, 2013 |
Employee | 275 | $ | 13,310.00 | ||||||||||
| September 30, 2013 |
Employee | 200 | $ | 24,210.00 | ||||||||||
| November 8, 2013 |
Employee | 1,200 | $ | 145,260.00 | ||||||||||
| November 22, 2013 |
Employee | 600 | $ | 72,630.00 | ||||||||||
| November 22, 2013 |
Employee | 200 | $ | 9,680.00 | ||||||||||
| November 25, 2013 |
Executive Officer | 10,500 | $ | 508,200.00 | ||||||||||
| December 9, 2013 |
Employee | 100 | $ | 12,105.00 | ||||||||||
| December 10, 2013 |
Employee | 1,000 | $ | 5,320.00 | ||||||||||
| December 13, 2013 |
Employee | 100 | $ | 2,920.00 | ||||||||||
| April 7, 2014 |
Employee | 450 | 1,050 | $ | 148,882.50 | |||||||||
| June 2, 2014 |
Employee | 100 | $ | 12,105.00 | ||||||||||
| June 04, 2014 |
Executive Officer | 6,615 | $ | 47,131.88 | ||||||||||
| June 6, 2014 |
Employee | 1,325 | $ | 50,690.00 | ||||||||||
| June 11, 2014 |
Employee | 1,050 | $ | 127,102.50 | ||||||||||
| June 13, 2014 |
Executive Officer | 13,500 | $ | 653,400.00 | ||||||||||
| June 18, 2014 |
Employee | 500 | $ | 24,200.00 | ||||||||||
| June 19, 2014 |
Employee | 475 | $ | 22,990.00 | ||||||||||
| June 23, 2014 |
Employee | 700 | $ | 108,170.00 | ||||||||||
| June 24, 2014 |
Executive Officer | 1,000 | $ | 121,050.00 | ||||||||||
| June 24, 2014 |
Executive Officer | 5,660 | $ | 165,272.00 | ||||||||||
| June 25, 2014 |
Employee | 175 | $ | 8,470.00 | ||||||||||
| June 25, 2014 |
Employee | 5,000 | $ | 242,000.00 | ||||||||||
| June 26, 2014 |
Employee | 2,200 | $ | 266,310.00 | ||||||||||
| June 26, 2014 |
Employee | 2,550 | $ | 308,677.50 | ||||||||||
| June 30, 2014 |
Employee | 1,500 | $ | 72,600.00 | ||||||||||
| June 30, 2014 |
Employee | 1,500 | $ | 72,600.00 | ||||||||||
| June 30, 2014 |
Employee | 300 | $ | 36,315.00 | ||||||||||
| June 30, 2014 |
Employee | 889 | $ | 43,027.60 | ||||||||||
| June 30, 2014 |
Employee | 3,000 | $ | 363,150.00 | ||||||||||
II-3
Table of Contents
The following table sets forth information on the stock options issued by us in the three years preceding the filing of this registration statement.
| Non-qualified Stock Options Granted Through 6/30/14 |
||||||||||
| Date of Issuance |
Number of options Granted |
Strike Price | ||||||||
| May 30, 2011 |
Employee | 1,000 | $ | 193.10 | ||||||
| May 31, 2011 |
Executive Officer | 7,500 | $ | 193.10 | ||||||
| June 13, 2011 |
Employee | 7,000 | $ | 193.10 | ||||||
| August 15, 2011 |
Employee | 5,000 | $ | 334.45 | ||||||
| August 22, 2011 |
Employee | 5,100 | $ | 334.45 | ||||||
| August 29, 2011 |
Employee | 7,500 | $ | 334.45 | ||||||
| September 1, 2011 |
Employee | 1,500 | $ | 334.45 | ||||||
| October 1, 2011 |
Employees | 7,000 | $ | 334.45 | ||||||
| November 14, 2011 |
Employee | 500 | $ | 334.45 | ||||||
| January 1, 2012 |
Employees | 1,000 | $ | 371.20 | ||||||
| January 9, 2012 |
Employee | 5,000 | $ | 371.20 | ||||||
| January 23, 2012 |
Employee | 1,750 | $ | 371.20 | ||||||
| June 18, 2012 |
Employees | 4,000 | $ | 371.20 | ||||||
| July 27, 2012 |
Employee | 500 | $ | 381.05 | ||||||
| August 7, 2012 |
Employee | 2,500 | $ | 381.05 | ||||||
| September 27, 2012 |
Employee | 500 | $ | 371.05 | ||||||
| October 10, 2012 |
Employee | 1,500 | $ | 381.05 | ||||||
| April 1, 2013 |
Employees | 1,500 | $ | 355.40 | ||||||
| July 15, 2013 |
Employees | 7,500 | $ | 355.40 | ||||||
| July 22, 2013 |
Employee | 500 | $ | 355.40 | ||||||
| July 31, 2013 |
Executive Officer | 500 | $ | 355.40 | ||||||
| July 31, 2013 |
Employee | 1,000 | $ | 355.40 | ||||||
| August 23, 2013 |
Employee | 500 | $ | 355.40 | ||||||
| September 20, 2013 |
Employee | 1,500 | $ | 355.40 | ||||||
| September 30, 2013 |
Employees | 9,000 | $ | 355.40 | ||||||
| October 7, 2013 |
Employee | 1,500 | $ | 355.40 | ||||||
| October 17, 2013 |
Employees | 16,500 | $ | 355.40 | ||||||
| December 10, 2013 |
Employees | 11,450 | $ | 355.40 | ||||||
| December 10, 2013 |
Executive Officers | 12,500 | $ | 355.40 | ||||||
| December 16, 2013 |
Employee | 2,500 | $ | 355.40 | ||||||
| May 31, 2014 |
Employees | 8,750 | $ | 379.05 | ||||||
| June 2, 2014 |
Employee | 500 | $ | 379.05 | ||||||
| June 17, 2014 |
Employees | 1,000 | $ | 379.05 | ||||||
The issuances of common stock described above either represent grants of restricted stock under, or were made pursuant to the exercise of stock options granted under our compensation plans to our officers, directors, employees and consultants in reliance upon an available exemption from the registration requirements of the Securities Act, including those contained in Rule 701 promulgated under Section 3(b) of the Securities Act. Among other things, we relied on the fact that, under Rule 701, companies that are not subject to the reporting requirements of Section 13 or Section 15(d) of the Exchange Act are exempt from registration under the Securities Act with respect to certain offers and sales of securities pursuant to “compensatory benefit plans” as defined under that rule.
II-4
Table of Contents
| Item 16. | Exhibits and financial statement schedules |
See the Exhibit Index immediately following the signature page hereto, which is incorporated by reference as if fully set forth herein.
| Item 17. | Undertakings |
The undersigned registrant hereby undertakes to provide to the underwriters at the closing specified in the underwriting agreement certificates in such denominations and registered in such names as required by the underwriters to permit prompt delivery to each purchaser.
Insofar as indemnification for liabilities arising under the Securities Act may be permitted to directors, officers and controlling persons of the registrant pursuant to the foregoing provisions, or otherwise, the registrant has been advised that in the opinion of the Securities and Exchange Commission such indemnification is against public policy as expressed in the Securities Act and is, therefore, unenforceable. In the event that a claim for indemnification against such liabilities (other than the payment by the registrant of expenses incurred or paid by a director, officer or controlling person of the registrant in the successful defense of any action, suit or proceeding) is asserted by such director, officer or controlling person in connection with the securities being registered, the registrant will, unless in the opinion of its counsel the matter has been settled by controlling precedent, submit to a court of appropriate jurisdiction the question whether such indemnification by it is against public policy as expressed in the Securities Act and will be governed by the final adjudication of such issue.
The undersigned registrant hereby undertakes that:
(1) For purposes of determining any liability under the Securities Act, the information omitted from the form of prospectus filed as part of this registration statement in reliance upon Rule 430A and contained in a form of prospectus filed by the registrant pursuant to Rule 424(b)(1) or (4) or 497(h) under the Securities Act shall be deemed to be part of this registration statement as of the time it was declared effective.
(2) For the purpose of determining any liability under the Securities Act, each post-effective amendment that contains a form of prospectus shall be deemed to be a new registration statement relating to the securities offered therein, and the offering of such securities at that time shall be deemed to be the initial bona fide offering thereof.
(3) For purposes of determining any liability under the Securities Act, each prospectus filed pursuant to Rule 424(b) as part of a registration statement relating to an offering, other than registration statements relying on Rule 430B or other than prospectuses filed in reliance on Rule 430A, shall be deemed to be part of and included in the registration statement as of the date it is first used after effectiveness. Provided, however, that no statement made in a registration statement or prospectus that is part of the registration statement or made in a document incorporated or deemed incorporated by reference into the registration statement or prospectus that is part of the registration statement will, as to a purchaser with a time of contract of sale prior to such first use, supersede or modify any statement that was made in the registration statement or prospectus that was part of the registration statement or made in any such document immediately prior to such date of first use.
(4) For purposes of determining any liability under the Securities Act of 1933 to any purchaser in the initial distribution of the securities, in a primary offering of securities of the undersigned registrant pursuant to this registration statement, regardless of the underwriting method used to sell the securities to the purchaser, if the securities are offered or sold to such purchaser by means of any of the following communications, the undersigned registrant will be a seller to the purchaser and will be considered to offer or sell such securities to such purchaser:
| i. | Any preliminary prospectus or prospectus of the undersigned registrant relating to the offering required to be filed pursuant to Rule 424; |
II-5
Table of Contents
| ii. | Any free writing prospectus relating to the offering prepared by or on behalf of the undersigned registrant or used or referred to by the undersigned registrant; |
| iii. | The portion of any other free writing prospectus relating to the offering containing material information about the undersigned registrant or its securities provided by or on behalf of the undersigned registrant; and |
| iv. | Any other communication that is an offer in the offering made by the undersigned registrant to the purchaser. |
II-6
Table of Contents
SIGNATURES
Pursuant to the requirements of the Securities Act of 1933, the registrant has duly caused this Registration Statement to be signed on its behalf by the undersigned, thereunto duly authorized, in the City of Chesterland, State of Ohio, on September 15, 2014.
| FMSA Holdings Inc. | ||
| By: | /s/ Jenniffer D. Deckard | |
| Name: | Jenniffer D. Deckard | |
| Title: | President and Chief Executive Officer | |
* * *
Pursuant to the requirements of the Securities Act of 1933, as amended, this Registration Statement has been signed below by the following persons on September 15, 2014.
| Name |
Title | |
| /s/ Jenniffer D. Deckard | President, Chief Executive Officer and Director (Principal Executive Officer) | |
| Jenniffer D. Deckard | ||
| /s/ Christopher L. Nagel | Chief Financial Officer and Executive Vice President of Finance (Principal Financial and Accounting Officer) | |
| Christopher L. Nagel | ||
| *
|
Director | |
| William E. Conway | ||
| *
|
Director | |
| Charles D. Fowler | ||
| *
|
Director | |
| William P. Kelly | ||
| *
|
Director | |
| Matthew F. LeBaron | ||
| *
|
Director | |
| Michael E. Sand | ||
| *
|
Director | |
| Lawrence W. Schultz | ||
| *By: |
/s/ Christopher L. Nagel | |
| Christopher L. Nagel Attorney-in-Fact | ||
II-7
Table of Contents
INDEX TO EXHIBITS
| Exhibit |
Description | |||
| *1.1 | Form of Underwriting Agreement | |||
| *3.1 | Third Amended and Restated Certificate of Incorporation of FMSA Holdings Inc. | |||
| *3.2 | Fourth Amended and Restated Bylaws of FMSA Holdings Inc. | |||
| *4.1 | Specimen Common Stock Certificate | |||
| *5.1 | Opinion of Vinson & Elkins L.L.P. as to the legality of the securities being registered | |||
| 10.1 | Second Amended and Restated Credit and Guaranty Agreement dated as of September 5, 2013 by and among Fairmount Minerals, Ltd., Fairmount Minerals Holdings, Inc., certain subsidiaries of Fairmount Minerals, Ltd., Lake Shore Sand Company (Ontario) Ltd., the Lenders party thereto from time to time, Barclays Bank PLC, as Administrative Agent, as Collateral Agent and as Revolving Administrative Agent and the other agents referred to therein. | |||
| 10.2 | Amendment Agreement dated as of September 5, 2013 by and among Fairmount Minerals, Ltd., Fairmount Minerals Holdings, Inc., certain subsidiaries of Fairmount Minerals, Ltd., Lake Shore Sand Company (Ontario) Ltd., the Lenders party thereto from time to time, Barclays Bank PLC, as Administrative Agent and as Collateral Agent and the other agents referred to therein. | |||
| 10.3 | First Amendment to Second Amended and Restated Credit and Guaranty Agreement dated as of March 27, 2014 by and among Fairmount Minerals, Ltd., Fairmount Minerals Holdings, Inc., certain subsidiaries of Fairmount Minerals, Ltd., Lake Shore Sand Company (Ontario) Ltd., the Lenders party thereto from time to time, Barclays Bank PLC, as Administrative Agent, as Collateral Agent and as Revolving Administrative Agent and the other agents referred to therein. | |||
| 10.4 | Joinder Agreement, dated as of February 14, 2014 by and among Barclays Bank PLC, Fairmount Minerals, Ltd., as borrower representative and Barclays Bank PLC, as administrative agent. | |||
| 10.5 | Joinder Agreement, dated as of August 29, 2014 by and among Barclays Bank PLC, Morgan Stanley Bank, N.A., Wells Fargo Bank, National Association, Goldman Sachs Bank USA, Jefferies Finance LLC, Keybank National Association and Royal Bank of Canada (collectively, the “Incremental Revolving Loan Lenders”), Fairmount Santrol Inc., as borrower representative and Barclays Bank PLC, as administrative agent. | |||
| *10.6 | Form of Fourth Amended and Restated Stockholders Agreement | |||
| *10.7 | † | Form of Indemnification Agreement | ||
| *10.8 | † | FML Holdings, Inc. Non-Qualified Stock Option Plan | ||
| *10.9 | † | Form of Stock Option Agreement for FML Holdings, Inc. Non-Qualified Stock Option Plan | ||
| *10.10 | † | FML Holdings, Inc. Long Term Incentive Compensation Plan | ||
| *10.11 | † | Form of Stock Option Agreement for FML Holdings, Inc. Long Term Incentive Compensation Plan | ||
| *10.12 | † | FML Holdings, Inc. Stock Option Plan | ||
| *10.13 | † | Form of Stock Option Agreement for FML Holdings, Inc. Stock Option Plan | ||
| *10.14 | † | Form of FMSA Holdings, Inc. 2014 Long Term Incentive Plan | ||
| *10.15 | Interest Purchase Agreement, dated as of April 30, 2013, by and among Fairmont Minerals, Ltd., Soane Energy LLC and Self-Suspending Proppant LLC | |||
| **21.1 | List of Subsidiaries of FMSA Holdings Inc. | |||
| 23.1 | Consent of PricewaterhouseCoopers LLP | |||
| **23.2 | Consent of GZA, GeoEnvironmental, Inc. | |||
II-8
Table of Contents
| Exhibit |
Description | |||
| **23.3 | Consent of Vinson & Elkins L.L.P. (included as part of Exhibit 5.1) | |||
| **23.4 | Consent of Freedonia Group, Inc. | |||
| **23.5 | Consent of PacWest Consulting Partners | |||
| **23.6 | Consent of PropTester, Inc. | |||
| **24.1 | Power of Attorney | |||
| * | To be filed by amendment. |
| ** | Previously filed. |
| † | Compensatory plan or arrangement. |
II-9