Attached files
| file | filename |
|---|---|
| EXCEL - IDEA: XBRL DOCUMENT - Pike Corp | Financial_Report.xls |
| EX-3.2 - EX-3.2 - Pike Corp | d758945dex32.htm |
| EX-23.2 - EX-23.2 - Pike Corp | d758945dex232.htm |
| EX-31.1 - EX-31.1 - Pike Corp | d758945dex311.htm |
| EX-23.1 - EX-23.1 - Pike Corp | d758945dex231.htm |
| EX-21.1 - EX-21.1 - Pike Corp | d758945dex211.htm |
| EX-32.1 - EX-32.1 - Pike Corp | d758945dex321.htm |
| EX-31.2 - EX-31.2 - Pike Corp | d758945dex312.htm |
Table of Contents
UNITED STATES
SECURITIES AND EXCHANGE COMMISSION
Washington, D.C. 20549
FORM 10-K
(Mark One)
| x | ANNUAL REPORT PURSUANT TO SECTION 13 OR 15(d) OF THE SECURITIES EXCHANGE ACT OF 1934 |
For the fiscal year ended June 30, 2014
or
| ¨ | TRANSITION REPORT PURSUANT TO SECTION 13 OR 15(d) OF THE SECURITIES EXCHANGE ACT OF 1934 |
For the transition period from to
Commission file number 001-32582

PIKE CORPORATION
(Exact name of registrant as specified in its charter)
| North Carolina | 20-3112047 | |
| (State or other jurisdiction of incorporation or organization) |
(I.R.S. Employer Identification No.) | |
| 100 Pike Way, Mount Airy, NC | 27030 | |
| (Address of principal executive offices) | (Zip Code) | |
Registrant’s telephone number, including area code: (336) 789-2171
Securities registered pursuant to Section 12(b) of the Act:
| Title of each class |
Name of each exchange on which registered | |
| Common Stock, par value $0.001 | New York Stock Exchange |
Securities registered pursuant to Section 12(g) of the Act:
None
Indicate by check mark if the registrant is a well-known seasoned issuer, as defined in Rule 405 of the Securities Act. Yes ¨ No x
Indicate by check mark if the registrant is not required to file reports pursuant to Section 13 or Section 15(d) of the Act. Yes ¨ No x
Indicate by check mark whether the registrant (1) has filed all reports required to be filed by Section 13 or 15(d) of the Securities Exchange Act of 1934 during the preceding 12 months (or for such shorter period that the registrant was required to file such reports), and (2) has been subject to such filing requirements for the past 90 days. Yes x No ¨
Indicate by check mark whether the registrant has submitted electronically and posted on its corporate Web site, if any, every Interactive Data File required to be submitted and posted pursuant to Rule 405 of Regulation S-T (§232.405 of this chapter) during the preceding 12 months (or for such shorter period that the registrant was required to submit and post such files). Yes x No ¨
Indicate by check mark if disclosure of delinquent filers pursuant to Item 405 of Regulation S-K (§229.405) is not contained herein, and will not be contained, to the best of registrant’s knowledge, in definitive proxy or information statements incorporated by reference in Part III of this Form 10-K or any amendment to this Form 10-K. x
Indicate by check mark whether the registrant is a large accelerated filer, an accelerated filer, a non-accelerated filer, or a smaller reporting company. See the definitions of “large accelerated filer,” “accelerated filer” and “smaller reporting company” in Rule 12b-2 of the Exchange Act.
| Large accelerated filer | ¨ | Accelerated filer | x | |||
| Non-accelerated filer | ¨ (Do not check if a smaller reporting company) | Smaller reporting company | ¨ | |||
Indicate by check mark whether the registrant is a shell company (as defined in Rule 12b-2 of the Act). Yes ¨ No x
The aggregate market value of the voting and non-voting common equity held by non-affiliates of the registrant, as of December 31, 2013, was approximately $307,371,499 based on the closing sales price of the common stock on such date as reported on the New York Stock Exchange.
The number of shares of the registrant’s common stock outstanding at September 5, 2014 was 31,940,619.
Table of Contents
Annual Report on Form 10-K for the fiscal year ended June 30, 2014
Index
| Items | ||||||
| Part I | ||||||
| Item 1. |
Business | 1 | ||||
| Item 1A. |
Risk Factors | 10 | ||||
| Item 1B. |
Unresolved Staff Comments | 18 | ||||
| Item 2. |
Properties | 18 | ||||
| Item 3. |
Legal Proceedings | 19 | ||||
| Item 4. |
Mine Safety Disclosures | 19 | ||||
| Part II | ||||||
| Item 5. |
20 | |||||
| Item 6. |
22 | |||||
| Item 7. |
Management’s Discussion and Analysis of Financial Condition and Results of Operations |
23 | ||||
| Item 7A. |
43 | |||||
| Item 8. |
44 | |||||
| Item 9. |
Changes in and Disagreements With Accountants on Accounting and Financial Disclosure |
80 | ||||
| Item 9A. |
80 | |||||
| Item 9B. |
80 | |||||
| Part III | ||||||
| Item 10. |
81 | |||||
| Item 11. |
85 | |||||
| Item 12. |
Security Ownership of Certain Beneficial Owners and Management and Related Stockholder Matters |
102 | ||||
| Item 13. |
Certain Relationships and Related Transactions, and Director Independence |
105 | ||||
| Item 14. |
106 | |||||
| Part IV | ||||||
| Item 15. |
Exhibits and Financial Statement Schedules | 107 | ||||
| 108 | ||||||
Table of Contents
| ITEM 1. | BUSINESS |
Overview
Pike Corporation was founded by Floyd S. Pike in 1945 and later incorporated in North Carolina in 1968. We reincorporated in Delaware on July 1, 2005, in connection with our July 2005 initial public offering (“IPO”). On November 5, 2013, Pike Electric Corporation changed its state of incorporation from Delaware to North Carolina (the “Reincorporation”). The Reincorporation was effected by merging Pike Electric Corporation, a Delaware corporation, with and into Pike Corporation, a North Carolina corporation and its wholly-owned subsidiary. In connection with the Reincorporation, Pike Electric Corporation changed its name to “Pike Corporation.” The Reincorporation did not result in any change in the business, management, fiscal year, accounting, location of the principal executive offices or other facilities, capitalization, assets or liabilities of Pike Electric Corporation. We are headquartered in Mount Airy, North Carolina. Our common stock is traded on the New York Stock Exchange under the symbol “PIKE.”
We are one of the largest providers of construction and engineering services for investor-owned, municipal and co-operative electric utilities in the United States. Since our founding in 1945, we have evolved from a specialty non-unionized contractor for electric utilities focused on the distribution sector in the southeastern United States to one of the nation’s largest specialty construction and engineering firms servicing over 300 customers. Leveraging our core competencies as a company primarily focused on providing a broad range of electric infrastructure services principally for utility customers, we believe that our experienced management team has positioned us to benefit from the substantial long-term growth drivers in our industry.
Over the past few years, we have reshaped our business platform and service territory significantly from being a distribution construction company based primarily in the southeastern United States to a national energy and communication solutions provider. We have done this organically and through strategic acquisitions of companies with complementary service offerings and geographic footprints. Our acquisition of Shaw Energy Delivery Services, Inc. on September 1, 2008 expanded our operations into engineering, design, procurement and construction management services, including in the renewable energy arena, and significantly enhanced our substation and transmission construction capabilities. This acquisition also extended our geographic presence across the continental United States. Our acquisition of Facilities Planning & Siting, PLLC on June 30, 2009 enabled us to provide siting and planning services to our customers, which positions us to be involved at the conceptual stage of our customers’ projects. On June 30, 2010, we acquired Klondyke Construction LLC (“Klondyke”), based in Phoenix, Arizona, which complemented our existing engineering and design capabilities with construction services related to substation, transmission and renewable energy infrastructure. Our August 1, 2011 acquisition of Pine Valley Power, Inc. (“Pine Valley”), located near Salt Lake City, Utah, further strengthened our substation, transmission and distribution construction service capabilities in the western United States. We believe that our acquisitions of Klondyke and Pine Valley allow us to continue to expand our engineering and construction services in the western United States and better compete in markets with unionized workforces. Our July 2, 2012 acquisition of Synergetic Design Holdings, Inc. and its subsidiary, UC Synergetic, Inc. (together “UCS”), headquartered in Charlotte, North Carolina, significantly expanded our ability to provide outsourced engineering and design services for distribution powerline, transmission and substation projects and other technical services to our customers and is consistent with our long-term growth strategy. The UCS acquisition also added new engineering and design services for the communications industry as well as storm assessment and inspection services. UCS’s engineering capabilities complement our existing portfolio of companies, add scale and extend our footprint into the Northeast and Midwest.
Our comprehensive suite of energy and communication solutions includes facilities planning and siting, permitting, engineering, design, installation, maintenance and repair of power delivery systems, including renewables (primarily ground-based) and utility-grade solar construction projects, and storm-related services, all as further described in the following table:
1
Table of Contents
| Service |
Revenue Category |
Description | ||
| Planning & Siting | Engineering | Our planning and siting process leverages technology and the collection of environmental, regulatory, economic, cultural, land use and scientific data to facilitate successful right-of-way negotiations, licensing and permitting for powerlines, substations and traditional and renewable electrical generation facilities. We also provide North American Electric Reliability Corporation (“NERC”) reliability studies and renewable generation interconnection studies. | ||
| Engineering & Design | Engineering | We provide design, engineering, procurement and construction (“EPC”), owner engineer, project management, material procurement, multi-entity coordination, grid integration, balance-of-plant (“BOP”), training, consulting, Department of Transportation (“DOT”) projects and Thermal Rate solutions for individual or turnkey powerline, substation and renewable energy projects. We also provide engineering and design services for the communication industry for wireline and wireless communication infrastructure. | ||
| Transmission and Distribution Construction | Distribution and Transmission | We provide overhead and underground powerline construction, upgrade, inspection and extension services (predominately single-pole and H-frame wood, concrete or steel poles) for distribution networks and transmission lines with voltages up to 345 kV, and energized maintenance work for voltages up to 500 kV.
Overhead services consist of construction, repair and maintenance of wire and components in energized overhead electric distribution and transmission systems.
Underground services range from simple residential installations, directional boring, concrete encased duct and manhole installation, to the construction of complete underground distribution facilities. | ||
| Substation Construction | Substation | We provide substation construction and service for voltages up to 500 kV.
Substation services include: construction of new substations, existing substation upgrades, relay testing, transformer maintenance and hauling, foundations, commissioning, emergency outage response and Smart Grid component installation. We also specialize in relay metering and control solutions. | ||
| Utility-Grade Solar Construction | Distribution and Other | We provide complete direct-hire construction services of utility-scale photovoltaic (“PV”) solar generation facilities including all scopes necessary to deliver power to the grid. We also provide full EPC installations of high voltage (230kV) underground gathering systems in conjunction with concentrated solar power (“CSP”) facilities – “power towers” and full EPC installations for transmission lines and substations up to 500kV required for the interconnection of solar or wind generators to existing utility and transmission resources. | ||
| Storm Assessment, Inspection and Restoration Services | Storm-Related Services | Storm assessment, inspection and restoration services involve the assessment and repair or reconstruction of any part of a distribution or sub-500 kV transmission network, including substations, powerlines, utility poles or other components, damaged during snow, ice or wind storms, flash floods, hurricanes, tornadoes or other natural disasters. We are a recognized leader in storm-related services, due to our ability to rapidly mobilize thousands of existing employees and equipment within 24 hours, while maintaining a functional force for unaffected customers. | ||
2
Table of Contents
Segment Overview
As a result of the acquisition of UCS expanding the size and scope of our engineering business, we decided in the first quarter of fiscal 2013 to change our reportable segments. As a result of these changes, we operated our business as two reportable segments: Construction and All Other Operations. On January 1, 2014, as part of the integration of our engineering businesses, Synergetic Design Holdings, Inc. merged with and into Pike Enterprises, Inc., a wholly-owned subsidiary of the Company, and UC Synergetic, Inc. merged with and into Pike Energy Solutions, LLC, the surviving entity of which was named UC Synergetic, LLC. In order to properly align our segments with our current financial reporting structure, we changed the name of our All Other Operations segment to Engineering. These segments are organized principally by service category. Each segment has its own management that is responsible for the operations of the segment’s businesses. Prior fiscal year segment information has been revised to conform to the current-year presentation.
Construction includes installation, maintenance and repair of power delivery systems, including storm restoration services. Engineering includes siting, permitting, engineering and design of power and communication delivery systems, including storm assessment and inspection services.
| Fiscal Year Ended June 30, | ||||||||||||||||||||||||
| 2014 | 2013 | 2012 | ||||||||||||||||||||||
| (in millions) | ||||||||||||||||||||||||
| Reportable Segment |
||||||||||||||||||||||||
| Construction |
$ | 656.5 | 81.0 | % | $ | 762.9 | 83.0 | % | $ | 614.6 | 89.7 | % | ||||||||||||
| Engineering |
154.1 | 19.0 | % | 155.8 | 17.0 | % | 70.6 | 10.3 | % | |||||||||||||||
|
|
|
|
|
|
|
|
|
|
|
|
|
|||||||||||||
| Total |
$ | 810.6 | 100.0 | % | $ | 918.7 | 100.0 | % | $ | 685.2 | 100.0 | % | ||||||||||||
|
|
|
|
|
|
|
|
|
|
|
|
|
|||||||||||||
See “Item 7. Management’s Discussion and Analysis of Financial Condition and Results of Operations” and Note 19 of the Notes to Consolidated Financial Statements for further details pertaining to the Company’s reportable segments.
Industry Overview
The electrical industry is comprised of investor-owned, municipal and co-operative electric utilities, independent power producers and independent transmission companies, with three distinct functions: generation, transmission and distribution. The electric transmission and distribution infrastructure is the critical network that connects power generation to residential, commercial and industrial end users. Electric transmission refers to powerlines and substations through which electricity is transmitted over long distances at high voltages (over 69 kV) and lower voltage lines that connect high voltage transmission infrastructure to local distribution networks. Electric distribution refers to the local distribution network, including related substations that step down voltages to distribution levels, which provide electricity to end users over shorter distances.
We believe there are significant growth opportunities for our business and the services we provide due to the following factors:
Required Future Investment in Transmission and Distribution Infrastructure. Long-term increases in electricity demand, the increasing age of U.S. electricity infrastructure, the lack of appropriate redundancy and geographic shifts in population have stressed the current electricity infrastructure and increased the need for maintenance, upgrades and expansion. According to NERC, reliability is the primary driver for the addition of new transmission and upgrades of existing transmission infrastructure. Current federal legislation requires the power industry to meet federal reliability standards for its transmission and distribution systems. The issuance of FERC Order No. 1000 also provides potential benefits related to transmission planning and cost allocation for inter-regional projects.
3
Table of Contents
Expanded Development of Energy Sources. We expect to benefit from the development of new sources of electric power generation. Many states have adopted either mandatory Renewable Portfolio Standards (“RPS”) programs that require a certain percentage of electric power come from renewable sources, or have enacted non-binding RPS-like goals. Often these renewable source generation facilities require new substation and transmission infrastructure. The future development of renewable energy sources, as well as new traditional power generation facilities, will require incremental substation and transmission infrastructure to transport power to demand centers.
Increased Outsourcing of Utility Infrastructure Services. Due to cost control initiatives, the ability to improve service levels and aging workforce trends, utilities have increased the outsourcing of their electricity infrastructure maintenance and construction service needs. We believe that a majority of utility infrastructure services are still conducted in-house and that our customers, especially investor-owned electric utilities, will expand outsourcing of utility infrastructure services over time. Outsourced service providers are often able to provide the same services at a lower cost because of their specialization, larger scale and ability to better utilize their workforce and equipment across a larger geographic footprint.
Rebound in Residential Development. We believe residential development, which was negatively impacted during 2008 to 2011, is rebounding. We provide overhead and underground distribution services, including final electricity connections to single and multi-family developments. We also offer distribution services in a broad geographic territory, which due to our diversification strategy, enables us to grow distribution services in multiple regions in the United States.
Our Growth Strategy
Our growth strategy is to expand our broad platform of service offerings across existing and new customers both in the United States and internationally. The key elements of the strategy include:
Leveraging Existing Customer Relationships to Cross-Sell Our Services. As a leading energy solutions provider, we have turnkey capabilities ranging from planning and siting to engineering and design to construction and maintenance. We believe growth in our markets will be driven by bundling services and marketing these offerings to our large and extensive customer base and new customers. By offering these services on a turnkey basis, we believe we enable our customers to achieve economies and efficiencies over separate unbundled services. We believe this should ultimately lead to an expansion of our market share across our existing customer base and provide us the credibility to secure additional opportunities from new customers. Our storm-related service offering also aids in gaining new customers.
Capitalizing Upon the Substantial Expected Spend in Our Markets. We believe that the U.S. electric power system and network reliability will require significant future upkeep given the postponement of maintenance spending in recent years due to the difficult economic conditions, which we expect will drive demand for our services. We believe our leading position in the markets we service will enable us to capitalize on increases in demand for our services.
Possessing a Strong Platform to Participate in the Continued Consolidation of the Energy Solutions Market in the United States. The domestic competitive landscape in our industry includes only a few other large companies that offer a broad spectrum of energy solutions services while the vast majority of our competitors and other market participants are local and regional firms offering only a limited number of services. We believe our existing and potential customers desire a deeper range of service offerings on an ever-increasing scale. Consequently, we believe our broad platform of service offerings will enable us to acquire additional market share and further penetrate our existing markets.
In addition, we believe our broad platform of service offerings will be attractive to local and regional firms looking to consolidate with a larger company offering a more diversified and complete set of services. We have a successful history of identifying and integrating acquisitions. See “Overview” above for information about our recent acquisitions.
Competitive Strengths
We believe that we have a unique and strong competitive position in the markets in which we operate resulting from a number of factors, including:
Our Position as a Leading Provider of Energy and Communication Solutions. We believe that we are one of only a few companies offering a broad spectrum of energy and communication solutions that our current and prospective customers increasingly demand. We differentiate ourselves from many of our competitors based on the size and scale of our turnkey capabilities, from planning and siting to engineering and design, to construction and maintenance. With these capabilities, we can satisfy almost all customer project requirements from inception to commissioning. The ability to perform planning, siting, permitting, engineering, construction and commissioning with in-house resources provides us better control of schedule, cost and quality. In addition, most of our engineering and construction personnel have extensive electrical infrastructure design and operating experience.
Our Attractive, Contiguous Presence in Key Geographic Markets. We are capable of providing services in a contiguous geographic market covering 48 states for siting and engineering and 36 states for construction services. Over the long term, our markets have exhibited population growth and increases in electricity consumption, which have increased demand for our services. Moreover, the contiguous nature of our service territory provides us with significant operating
4
Table of Contents
efficiency and flexibility in responding to our customers’ needs across our full range of energy solutions. Our extensive network of offices enables us to deliver our services in most metropolitan markets of the United States and enhances our opportunity to expand our customer reach. In addition, we believe our customized, well-maintained and extensive fleet and experienced crews provide us with a competitive advantage in our ability to service our customers and respond rapidly to storm-related opportunities. These attributes enable us to effectively deploy our fleet resources of over 5,800 pieces of motorized equipment across our national footprint, unlike many of our competitors who lack such resources.
Our Long-Standing Relationships Across a High-Quality Customer Base. We have a diverse customer base with broad geographic presence throughout the United States that includes over 300 investor-owned, municipal and co-operative electric utilities, such as American Electric Power, Dominion Resources, Duke Energy, Duquesne Light, Florida Power & Light, PacifiCorp, South Carolina Electric & Gas Company (“SCE&G”) and The Southern Company. Many of our customer relationships span more than 25 years. We believe these important relationships provide us an advantage in competing for their business and developing new client relationships.
Our Outsourced Services-Based Business Model. We provide vital services to investor-owned, municipal and co-operative electric utilities, the vast majority of which are provided under long-term master services agreements (“MSAs”) with our customers. Over time, many of our customers have increased their reliance on outsourcing the maintenance and improvement of their transmission and distribution systems to third-party service providers in an effort to more efficiently and cost effectively manage their core business. We believe this outsourcing trend will continue to be a key growth driver for the leading participants in our industry as electric utilities continue to focus more on power generation.
Our Position as a Recognized Leader in Storm-Related Capabilities. Our construction and engineering footprint includes the areas of the U.S. power grid we believe are the most susceptible to damage caused by severe weather, such as hurricanes, tornadoes, tropical storms, ice storms and wind storms. Our contiguous geographic footprint enables us to work with our customers to secure the crews from non-affected areas and quickly relocate them to storm-affected areas. Storm-related services do not require dedicated storm teams to be “on call” or any additional storm-specific crew additions. Our flexible business strategy allows us to position crews where they are needed. We maintain a dedicated 24-hour Storm Center that serves as the single command hub. Our storm-related services often solidify existing customer relationships and create opportunities with new customers.
| Fiscal Year |
Storm- Related Revenues |
Total Revenues |
Storm-Related Revenues as a Percentage of Total Revenues |
|||||||||
| (In millions) | (In millions) | |||||||||||
| 2010 |
$ | 46.6 | $ | 504.1 | 9.3 | % | ||||||
| 2011 |
$ | 64.5 | $ | 593.8 | 10.9 | % | ||||||
| 2012 |
$ | 70.6 | $ | 685.2 | 10.3 | % | ||||||
| 2013 |
$ | 167.3 | $ | 918.7 | 18.2 | % | ||||||
| 2014 |
$ | 67.4 | $ | 810.6 | 8.3 | % | ||||||
5
Table of Contents
The following table sets forth certain information related to selected storm mobilizations in recent years:
| Selected Storm Mobilizations |
||||
| Storm (States Affected) |
Fiscal Year | |||
| Hurricanes / Tropical Storms / Other |
||||
| Sandy (CT, NY, OH, WV, VA, PA, NJ, MD) |
2013 | |||
| Isaac (FL, AL, MS, LA) |
2013 | |||
| July Derecho (VA, NC, WV, IN, OH, PA, MD) |
2013 | |||
| Irene (NC, VA, MD, DE, NJ, NY, RI, PA, CT, NH, MA) |
2012 | |||
| April Tornadoes (TX, OK, AR, LA, MS, AL, GA, TN, KY) |
2011 | |||
| Winter Storms |
||||
| February Winter Storm (AR, GA, KY, MD, SC, NC, PA) |
2014 | |||
| December Winter Storm (AR, OH, MI, TN, WV) |
2014 | |||
| February Northeast Snow Storm (CT, PA, NY, MA, RI) |
2013 | |||
| November Northeast Snow Storm (CT, PA, NY, NJ, NH) |
2012 | |||
| February Winter Storm (IN, OH, PA, VA, MD, Dist. of Columbia, LA, TX) |
2011 | |||
| January Winter Storm (VA, WV, Dist. of Columbia, MD) |
2011 | |||
| Winter Storm (TX, OK, GA, SC, NC, VA, WV, MD, OH, PA) |
2010 | |||
| Winter Storm (KY, NC, VA, TN, WV) |
2010 | |||
Our Experienced Operations Management Team with Extensive Relationships. Our operations management team has served in a variety of roles and senior positions with us, our customers and our competitors. We believe that our management team’s deep industry knowledge, field experience and relationships extend our operating capabilities, improve the quality of our services, facilitate access to clients and enhance our strong reputation in the industry. In addition, our management team has successfully integrated several acquisitions that have broadened our geographic footprint and expanded the portfolio of energy and communication solutions that we provide.
6
Table of Contents
Types of Service Arrangements
For the fiscal year ended June 30, 2014, approximately 85% of our services were provided under MSAs or similar arrangements that cover transmission and distribution maintenance, upgrade and extension services, as well as some new construction services, including engineering, siting and planning. Work under MSAs is typically billed based on either hourly usage of labor and equipment or unit of work. The unit-based arrangements involve billing for actual units (completed poles, cross arms, specific length of line, etc.) based on prices defined in customers’ MSAs. The remaining 15% of our services were generated under fixed-price agreements.
Initial arrangement awards are usually made on a competitive bid basis; however, extensions are often completed on a negotiated basis. As a result of our track record of quality work and services, a majority of our arrangements are renewed at or before the expiration of their terms.
The terms of our service arrangements are typically one to three years for co-operative and municipal utilities and three to five years for investor-owned utilities, with periodic pricing reviews. Due to the nature of our MSAs, in many instances our customers are not committed to minimum volumes of services, but rather we are committed to perform specific services covered by MSAs if and to the extent requested by the customer. The customer is obligated to obtain these services from us if they are not performed by their employees. Therefore, there can be no assurance as to the customer’s requirements during particular periods, nor are estimations predictive of future revenues. Most of our arrangements, including MSAs, may be terminated by our customers on short notice. Because the majority of our customers are well-capitalized, investment grade-rated electric utilities, we have historically experienced minimal bad debts.
Seasonality
Because our services are performed outdoors, operational results can be subject to seasonal weather variations. These seasonal variations affect both construction and storm-related services. Extended periods of rain can negatively affect deployment of construction crews, particularly with respect to underground work. During the winter months, demand for construction work is generally lower due to inclement weather. Demand for construction work generally increases during the spring and summer months due to improved weather conditions. Due to the unpredictable nature of storms, the level of storm-related revenues fluctuates from period to period.
Competition
We face significant competition. Our competitors vary in size, geographic scope and areas of expertise. We also face competition from in-house service organizations of our existing and prospective customers, which may employ personnel who perform some of the same types of services we provide.
We believe that the principal competitive factors in the end markets in which we operate are:
| • | diversified services, including the ability to offer turnkey EPC project services; |
| • | experienced management and employees; |
| • | customer relationships and industry reputation; |
| • | responsiveness in emergency restoration situations; |
| • | availability of fleet and specialty equipment; |
| • | adequate financial resources and bonding capacity; |
| • | geographic breadth and presence in customer markets; |
| • | pricing of services, particularly under MSA constraints; and |
| • | safety concerns of our crews, customers and the general public. |
We believe that we have a favorable competitive position in our markets due in large part to our ability to execute with respect to each of these factors. Our years of experience, broad spectrum of service offerings, customer service and safety contribute to our competitive advantages.
7
Table of Contents
Small third-party service providers pose a smaller threat to us than national competitors because they are frequently unable to compete for larger, blanket service agreements to provide system-wide coverage. However, some of our competitors are larger, have greater resources and are able to offer a broader range of services (such as higher voltage transmission construction, pipeline construction, and communication infrastructure construction) or offer services in a broader geographic territory. In addition, certain of our competitors may have lower overhead cost structures and may, therefore, be able to provide services at lower rates. Furthermore, if employees leave our employment to work with our competitors, we may lose existing customers who have formed relationships with those former employees. Competitive factors may require us to take future measures, such as price reductions, that could reduce profitability. There are few significant barriers to entry into our industry and, as a result, any organization with adequate financial resources and access to qualified staff may become a competitor.
Customers
We are proud of the relationships we have built with our customers, some of which date back over 69 years to when our company was formed. We remain focused on developing and maintaining strong, long-term relationships with investor-owned, municipal and co-operative electric utilities and all other customers. Our diverse customer base includes over 300 customers with broad geographic national presence. Our top 10 customers accounted for approximately 55%, 53% and 56% of our total revenues during fiscal 2014, 2013 and 2012, respectively. Duke Energy, which now includes legacy Progress Energy, was our only customer that represented greater than 10% of our total revenues during that time frame, with approximately 16%, 17% and 22% for fiscal 2014, 2013 and 2012 total revenues (adjusted to include those revenues attributable to Progress Energy), respectively. Subsequent to the merger of Duke Energy and Progress Energy, the new corporation requested bids for its distribution, transmission, substation and engineering MSA contracts. We successfully retained the majority of the MSA contracts we chose to bid and which represented our work in fiscal 2014. In the few areas we were unsuccessful in retaining the work, our crews have already been redeployed to growth on surrounding customers. Given the composition of the investor-owned, municipal and co-operative electric utilities in our geographic market, we expect that a substantial portion of our total revenues will continue to be derived from a limited group of customers. Furthermore, because the majority of our customers are well-capitalized, investment grade-rated electric utilities, we have historically experienced minimal bad debts.
Employees
At June 30, 2014, we employed approximately 5,800 full and part-time employees, of which approximately 5,000 were revenue producing and approximately 800 were non-revenue producing. Approximately 185 of our Klondyke and Pine Valley employees are represented by a union or subject to collective bargaining agreements, requiring us to pay specified wages and provide certain benefits to these employees. We believe that we have a good relationship with our employees.
Training, Quality Assurance and Safety
Performance of our services requires the use of heavy equipment and exposure to potentially dangerous conditions. We emphasize safety at every level of the Company, with safety leadership in senior management, an extensive and required ongoing safety and training program with physical training facilities and on-line courses, Occupational Safety and Health Administration (“OSHA”) courses, and lineman training through an accredited four-year program that has grown to be one of the largest powerline training programs in the United States.
As is common in our industry, we regularly have been, and will continue to be, subject to claims by employees, customers and third parties for property damage and personal injuries.
Equipment
As of June 30, 2014, our customized and extensive fleet consisted of over 5,800 pieces of motorized equipment with an average age of approximately seven years as compared to their range of useful lives which is three to 19 years. We own the majority of our fleet and, as a result, believe we have an advantage relative to our competitors in our ability to mobilize, outfit and manage the equipment necessary to perform our construction work.
Our equipment includes standardized trucks and trailers, support vehicles and specialty construction equipment, such as backhoes, excavators, generators, boring machines, cranes, wire pullers and tensioners. The standardization of our trucks and trailers allows us to minimize training, maintenance and parts costs. We service the majority of our fleet and are a final-stage manufacturer for several configurations of our specialty vehicles. We can build components on-site, which reduces reliance on equipment suppliers.
Our maintenance team has the capability to operate 24 hours a day, both at maintenance centers and in the field, and provides high-quality custom repair work and expedient service in maintaining a fleet poised for mobilization. We believe this gives us a competitive advantage, with stronger local presence, lower fuel costs and more efficient equipment maintenance.
8
Table of Contents
Proprietary Rights
We operate under a number of trade names, including Pike, Pike Electric, UC Synergetic, Pike Tanzania, Pine Valley and Klondyke. We have obtained U.S. federal trademark registration for “Pike” and “Pike Electric” and have other federal trademark registrations and pending trademark and patent applications. We also rely on state and common law protection. We have invested substantial time, effort and capital in establishing these names and believe that our trademarks are a valuable part of our business.
Risk Management and Insurance
We maintain insurance arrangements with coverage customary for companies of our type and size, including general liability, automotive and workers’ compensation. We are partially self-insured for our major risks, and our insurance does not cover all types or amounts of liabilities. Our workers’ compensation insurance policy is subject to a $1.0 million per accident/occurrence deductible and our automobile liability and general liability insurance policies are subject to a $1.0 million per occurrence self-insured retention. We also maintain insurance for health insurance claims exceeding $500,000 per person on an annual basis. Workers’ compensation losses are actuarially forecasted and paid to the insurance company over a twelve-month period, then retrospectively adjusted annually based on the difference between the forecasted losses and the actual incurred losses. General liability and automobile liability claims are handled by a third-party claims adjuster and reimbursed by us on a monthly basis. At any given time, we are subject to multiple workers’ compensation and personal injury claims. Losses are accrued based on estimates of the ultimate liability for claims reported and an estimate of claims incurred but not reported. We maintain accruals based on known facts and historical trends. Business insurance programs require collateral currently provided by $4.0 million in standby letters of credit and cash deposits of $0.6 million.
In the ordinary course of business, we are required by certain customers to post surety or performance bonds in connection with services that we provide to them. As of June 30, 2014, we had approximately $106.1 million in surety bonds outstanding. We have never had to reimburse any of our sureties for expenses or outlays incurred under a performance or payment bond.
Government Regulation
Our operations are subject to various federal, state and local laws and regulations, including licensing requirements, building and electrical codes, permitting and inspection requirements applicable to construction projects, regulations relating to worker safety and health, including those in respect of OSHA, and regulations relating to environmental protection.
We believe that we are in material compliance with applicable regulatory requirements and have all material licenses required to conduct our operations. Our failure to comply with applicable regulations could result in substantial fines and/or revocation of our operating licenses. Many state and local regulations governing electrical construction require permits and licenses to be held by individuals who typically have passed an examination or met other requirements. We have a regulatory compliance group that monitors our compliance with applicable regulations.
Environmental Matters
Our facilities and operations are subject to a variety of environmental laws and regulations which govern, among other things, the use, storage and disposal of solid and hazardous wastes, the discharge of pollutants into the air, land and water, and the cleanup of contamination. In connection with our truck fueling, maintenance, repair, washing and final-stage manufacturing operations, we use regulated substances such as gasoline, diesel and oil, and generate small quantities of regulated waste such as used oil, antifreeze, paint and car batteries. Some of our properties contain, or previously contained, aboveground or underground storage tanks, fuel dispensers, and/or solvent-containing parts washers. In the event we cause, or we or our predecessors have caused, a release of hazardous substances or other environmental damage, whether at our sites, sites where we perform our services, or other locations such as off-site disposal locations or adjacent properties, we could incur liabilities arising out of such releases or environmental damage. Although we have incurred in the past, and we anticipate we will incur in the future, costs to maintain environmental compliance and/or to address environmental issues, such costs have not had, and are not expected to have, a material adverse effect on our results of operations, cash flows or financial condition.
9
Table of Contents
Available Information
Our website address is www.pike.com. You may obtain free copies of our Annual Report on Form 10-K, our Quarterly Reports on Form 10-Q, our Current Reports on Form 8-K and our proxy statement, any amendments to such reports, and filings under Sections 13 and 16 of the Securities Exchange Act of 1934, as amended (the “Exchange Act”), through our website in the “Investor Center” section under the “Corporate Governance” caption. These reports are available on our website as soon as reasonably practicable after they are electronically filed with, or furnished to, the Securities and Exchange Commission (the “SEC”).
Our business is subject to a variety of risks, including the risks described below. If any of the following risks actually occur, our business, financial condition and results of operations could be materially and adversely affected and we may not be able to achieve our goals. This Annual Report on Form 10-K also includes statements reflecting assumptions, expectations, projections, intentions or beliefs about future events that are intended as “forward-looking statements” under the Private Securities Litigation Reform Act of 1995, Section 27A of the Securities Act of 1933, as amended (the “Securities Act”), and Section 21E of the Exchange Act and should be read in conjunction with the section entitled “Forward-Looking Statements.”
Risks related to the Merger
The proposed Merger may not be completed within the expected timeframe, or at all, and the failure to complete the Merger could adversely affect our business and the market price of our common stock. On August 4, 2014, we entered into the Agreement and Plan of Merger with Pioneer Parent, Inc. and Pioneer Merger Sub, Inc., both affiliates of Court Square Capital Partners. The Merger Agreement is an executory contract subject to closing conditions beyond our control, and there is no guarantee that these conditions will be satisfied in a timely manner or at all. Completion of the Merger is subject to various conditions, including the adoption of the Merger Agreement by the affirmative vote of the holders of a majority of all of the outstanding shares of our common stock entitled to vote and the receipt of regulatory approvals, among other things. If any of the conditions to the proposed Merger are not satisfied (or waived by the other party), the Merger may not be completed. In addition, the Merger Agreement may be terminated under certain specified circumstances, including a change in the recommendation of our board of directors or our termination of the Merger Agreement to enter into an agreement for a superior proposal, as defined in the Merger Agreement. Failure to complete the Merger could adversely affect our business and the market price of our common stock in a number of ways, including the following:
| • | If the Merger is not completed, and there are no other parties willing and able to acquire the Company at a price of $12.00 per share or higher, on terms acceptable to us, the share price of our common stock likely will decline as our stock has recently traded at prices based on the proposed per share consideration for the Merger. |
| • | We have incurred, and will continue to incur, significant costs, expenses and fees for professional services and other transaction costs in connection with the proposed Merger, for which we will have received little or no benefit if the Merger is not completed. Many of these fees and costs will be payable by us even if the Merger is not completed and may relate to activities that we would not have undertaken other than to complete the Merger. |
| • | A failed Merger may result in negative publicity and/or give a negative impression of us in the investment community or business community generally. |
| • | If the Merger Agreement is terminated under specified circumstances, the Company must pay a termination fee of $9,831,193 or $15,729,910, depending on the circumstances, as well as documented out-of-pocket expenses incurred by Pioneer Parent, Inc. and its affiliates of up to $2 million. |
The announcement and pendency of the proposed Merger could adversely affect our business, financial condition and results of operations. The announcement and pendency of the proposed Merger could cause disruptions in and create uncertainty surrounding our business, which could have an adverse effect on our business, financial condition and results of operations, regardless of whether the Merger is completed. These risks to our business include the following, all of which could be exacerbated by a delay in the completion of the Merger:
| • | the diversion of significant management time and resources towards the completion of the Merger; |
| • | the impairment of our ability to attract and retain key personnel; |
| • | difficulties maintaining relationships with employees, customers and other business partners; |
| • | restrictions on the conduct of the Company’s business prior to the completion of the Merger which prevent the taking of specified actions without the prior consent of Pioneer Parent, Inc., which actions the Company might otherwise take in the absence of the pending Merger; and |
| • | litigation relating to the Merger and the costs related thereto. |
Risks related to our business
We derive a significant portion of our revenues from a small group of customers. The loss of or a significant decrease in services to one or more of these customers could negatively impact our business, financial condition and results of operations. Our top 10 customers accounted for approximately 55%, 53% and 56% of our total revenues during fiscal 2014, 2013 and 2012, respectively. Duke Energy, which now includes legacy Progress Energy, was our only customer that represented greater than 10% of our total revenues during that time frame, with approximately 16%, 17% and 22% for fiscal 2014, 2013 and 2012 total revenues (adjusted to include those revenues attributable to Progress Energy), respectively. Subsequent to the merger of Duke Energy and Progress Energy, the new corporation requested bids for its distribution, transmission, substation and engineering MSA contracts. We successfully retained the majority of the MSA contracts we chose to bid and which represented our work in fiscal 2014. In the few areas we were unsuccessful in retaining the work, our crews have already been redeployed to growth on surrounding customers. Given the composition of the investor-owned, municipal and co-operative electric utilities in our geographic market, we expect a substantial portion of our revenues will continue to be derived from a limited group of customers. We may not be able to maintain our relationships with these customers, and the loss of, or substantial reduction of our sales to, any of our major customers could materially and adversely affect our business, financial condition and results of operations.
Our customers often have no obligation to assign work to us, and many of our arrangements may be terminated on short notice. As a result, we are at risk of losing significant business on short notice. Most of our customers assign work to us under MSAs. Under these arrangements, our customers generally have no obligation to assign work to us and do not guarantee service volumes. Most of our customer arrangements, including our MSAs, may be terminated by our customers on short notice. In addition, many of our customer arrangements, including our MSAs, are open to competitive bidding at the expiration of their terms. As a result, we may be displaced on these arrangements by competitors from time to time. Our business, financial condition and results of operations could be materially and adversely affected if our customers do not assign work to us or if they cancel a number of significant arrangements and we cannot replace them with similar work.
Our industry is highly competitive and we may be unable to compete effectively, retain our customers or win new customers, which could result in reduced profitability and loss of market share. We face intense competition from a variety of national and regional companies, and numerous small, owner-operated private companies. We also face competition from the in-house service organizations of our existing or prospective customers, some of which employ personnel who perform some of the same types of services we provide. We compete primarily on the basis of our reputation and relationships with customers, safety and execution record, geographic presence and our breadth of service offerings, pricing and availability of qualified personnel and required equipment. Certain of our competitors may have lower cost structures and may, therefore, be able to provide their services at lower rates than we can provide. Many of our current and potential competitors, especially our competitors with national scope, also may have significantly greater financial, technical and marketing resources than we do. In addition, our competitors may succeed in developing the expertise, experience and resources to compete successfully and in marketing and selling new services better than we can. Furthermore, our existing or prospective customers may not continue to outsource services in the future or we may not be able to retain our existing customers or win new customers. The loss of existing customers to our competitors or the failure to win new customers could materially and adversely affect our business, financial condition and results of operations.
Our storm-related services are highly volatile and unpredictable, which could result in substantial variations in, and uncertainties regarding, the levels of our financial results from period to period. Revenues derived from our storm-related services are highly volatile and uncertain due to the unpredictable nature of weather-related events. Our annual storm-related revenues have ranged from a low of $46.6 million to a high of $167.3 million during the five fiscal years ended June 30, 2014. During fiscal 2013, we had a large derecho storm impact the Northeast and two large hurricanes
10
Table of Contents
impact the Northeastern and Gulf coasts, which significantly contributed to the $167.3 million of storm-related services revenue. Our storm-related revenues for fiscal year 2013 are not indicative of the revenues that we typically generate in any period or can be expected to generate in any future period. Our historical results of operations have varied between periods due to the volatility of our storm-related revenues. The levels of our future revenues and net income or loss may be subject to significant variations and uncertainties from period to period due to the volatility of our storm-related revenues. In addition, our storm restoration revenues are offset in part by declines in our core services because we staff storm restoration mobilizations in large part by diverting resources from our core services.
We are subject to the risks associated with government construction projects. Our utility customers often engage us to provide services on government construction projects, and we also provide services directly on government construction projects, primarily for state and local governments. We are therefore exposed to the risks associated with government construction projects, including the risks that spending on construction may be reduced, pending projects may be terminated or curtailed and planned projects may not be pursued as expected or at all as a result of economic conditions or otherwise. In addition, government customers typically can terminate or modify any of their contracts at their convenience, and some of these government contracts are subject to renewal or extension annually. If a government customer terminates or modifies a contract, our backlog and revenue may be reduced or we may incur a loss, either of which could impair our financial condition and operating results. A termination due to our unsatisfactory performance could expose us to liability and adversely affect our ability to compete for future projects and orders. In cases where we are a subcontractor, the primary contract under which we subcontract could be terminated, regardless of the quality of our services as a subcontractor or our relationship with the relevant government customer.
The risks of government construction projects also include the increased risk of civil and criminal fines and penalties for violations of applicable regulations and statutes and the risk of public scrutiny of our performance on high profile sites. In addition, our failure to comply with the terms of one or more of our government contracts, other government agreements, or government regulations and statutes could result in our being suspended or barred from future government construction projects for a significant period of time. We could also be indirectly exposed to certain of these risks when we indemnify our customers performing work on government construction projects.
We may incur warranty costs that could adversely affect our profitability. Under almost all of our contracts, we warrant certain aspects of our engineering maintenance and construction services. To the extent we incur substantial warranty claims in any period, our reputation, our ability to obtain future business from our customers and our profitability could be adversely affected. We cannot provide assurance that significant warranty claims will not be made in the future.
We may incur liabilities or suffer negative financial or reputational impacts relating to occupational health and safety matters. Our operations are subject to extensive laws and regulations relating to the maintenance of safe conditions in the workplace. While we have invested, and will continue to invest, substantial resources in our occupational health and safety programs, our industry involves a high degree of operational risk and there can be no assurance that we will avoid significant liability exposure. Although we have taken what we believe are appropriate precautions, our employees have suffered fatalities in the past and may suffer additional fatalities in the future. Serious accidents, including fatalities, may subject us to substantial penalties, civil litigation or criminal prosecution. Claims for damages to persons, including claims for bodily injury or loss of life, could result in substantial costs and liabilities, which could materially and adversely affect our financial condition, results of operations or cash flows. In addition, if our safety record were to substantially deteriorate over time or we were to suffer substantial penalties or criminal prosecution for violation of health and safety regulations, our customers could cancel our contracts and not award us future business.
Our business is subject to numerous hazards that could subject us to substantial monetary and other liabilities. If accidents occur, they could materially and adversely affect our business and results of operations. Our business is subject to numerous hazards, including electrocutions, fires, natural gas explosions, mechanical failures, weather-related incidents, transportation accidents and damage to utilized equipment. These hazards could cause personal injury and loss of life, severe damage to or destruction of property and equipment and other consequential damages and could lead to suspension of operations, large damage claims and, in extreme cases, criminal liability. Our safety record is an important consideration for our customers. If serious accidents or fatalities occur, we may be ineligible to bid on certain work, and existing service arrangements could be terminated. In addition, if our safety record was to deteriorate, our ability to bid on certain work could be adversely impacted. Further, regulatory changes implemented by OSHA could impose additional costs on us. Adverse experience with hazards and claims could have a negative effect on our reputation with our existing or potential new customers and our prospects for future work.
Federal and state legislative and regulatory developments that we believe should encourage electric power transmission infrastructure spending may fail to result in increased demand for our services. In recent years, federal and state legislation has been passed and resulting regulations have been adopted that could significantly increase spending on electric power transmission infrastructure. However, much fiscal, regulatory and other uncertainty remains as to the impact this legislation and regulation will ultimately have on the demand for our services. The effect of these regulations is uncertain and may not result in increased spending on the electric power transmission infrastructure. Continued uncertainty regarding certain regulations may result in slower growth in demand for our services.
11
Table of Contents
Renewable energy initiatives may not lead to increased demand for our services. Investments for renewable energy and electric power transmission infrastructure may not occur, may be less than anticipated or may be delayed, may be concentrated in locations where we do not have significant capabilities, and any resulting contracts may not be awarded to us, any of which could negatively impact demand for our services.
Demand for some of our services is cyclical and vulnerable to industry and economic downturns, which could materially and adversely affect our business, financial condition and results of operations. The demand for infrastructure services has been, and will likely continue to be, cyclical in nature and vulnerable to general downturns in the U.S. economy. When the general level of economic activity deteriorates, our customers may delay or cancel expansions, upgrades, maintenance and repairs to their systems. A number of other factors, including the financial condition of the industry, could adversely affect our customers and their ability or willingness to fund capital expenditures in the future. We are also dependent on the amount of work that our customers outsource. During downturns in the economy, our customers may determine to outsource less work resulting in decreased demand for our services. Furthermore, the historical trend toward outsourcing of infrastructure services may not continue as we expect. In addition, consolidation, competition or capital constraints in the electric power industry may result in reduced spending by, or the loss of, one or more of our customers. These fluctuations in demand for our services could materially and adversely affect our business, financial condition and results of operations, particularly during economic downturns. Economic downturns may also adversely affect the pricing of our services.
To be successful, we need to attract and retain qualified personnel, and any inability to do so could have a material adverse effect on our business, financial condition and results of operations. Our ability to provide high-quality services on a timely basis requires an adequate supply of engineers, skilled linemen and project managers. Accordingly, our ability to increase our productivity and profitability will be limited by our ability to employ, train and retain skilled personnel necessary to meet our requirements. We may not be able to maintain an adequate skilled labor force necessary to operate efficiently. Our labor expenses may also increase as a result of a shortage in the supply of skilled personnel, or we may have to curtail our planned internal growth as a result of labor shortages. We may also spend considerable resources training employees who may then be hired by our competitors, forcing us to spend additional funds to attract personnel to fill those positions.
In addition, our employees might leave our company and join our competitors. If this happens, we may lose some of our existing clients that have formed relationships with these former employees. In addition, we may lose future clients to a former employee as a competitor. If we are unable to hire and retain qualified personnel in the future, there could be a material adverse effect on our business, financial condition and results of operations.
We are dependent on our senior management and other key personnel, the loss of which could have a material adverse effect on our business, financial condition and results of operations. Our operations, including our customer relationships, are dependent on the continued efforts of our senior management and other key personnel. Although we have entered into employment agreements with our key employees, we cannot be certain that any individual will continue in such capacity for any particular period of time. We do not maintain key person life insurance policies on any of our employees. The loss of any member of our senior management or other key personnel, or the inability to hire and retain qualified management and other key personnel, could have a material adverse effect on our business, financial condition and results of operations.
Our unionized workforce could adversely affect our operations and our ability to complete future acquisitions. In addition, we contribute to multi-employer plans that could result in liabilities to us if these plans are terminated or we withdraw. Our acquisitions of Klondyke and Pine Valley introduced a unionized workforce to our operations, as substantially all of their hourly employees are unionized. As of June 30, 2014, approximately 3% of our employees were covered by collective bargaining agreements. This percentage could grow if more of our employees unionize or we expand our services in states that have predominantly unionized workforces in our industry. Any strikes or work stoppages could adversely impact our relationships with our customers, hinder our ability to conduct business and increase costs. Our current workforce could experience an increase in union organizing activity, particularly if legislation that would facilitate such activity becomes law. Increased unionization could increase our costs, and we may not be able to recoup those cost increases by increasing prices for our services.
With the acquisition of Klondyke in June 2010 and Pine Valley in August 2011, we now contribute to several multi-employer pension plans for employees covered by collective bargaining agreements. These plans are not administered by us, and contributions are determined in accordance with provisions of negotiated labor contracts. The Employee Retirement Income Security Act of 1974, as amended by the Multi-Employer Pension Plan Amendments Act of 1980, imposes certain liabilities upon employers who are contributors to a multi-employer plan in the event of the employer’s withdrawal from, or upon termination of, such plan. We do not routinely review information on the net assets and actuarial present value of the multi-employer pension plans’ unfunded vested benefits allocable to us, if any, and we are not presently aware of any material amounts for which we may be contingently liable if we were to withdraw from any of these plans. In addition, if any of these multi-employer plans enters “critical status” under the Pension Protection Act of 2006, we could be required to make significant additional contributions to those plans.
12
Table of Contents
Our ability to complete future acquisitions could be adversely affected because of our union status for a variety of reasons. For example, our union agreements may be incompatible with the union agreements of a business we want to acquire, and some businesses may or may not want to become affiliated with a company that maintains a significant unionized workforce. Additionally, we may increase our exposure to withdrawal liabilities for underfunded multi-employer pension plans to which an acquired company contributes.
We require subcontractors to assist us in providing certain services and we may be unable to retain the necessary subcontractors to complete certain projects. We use subcontractors to perform portions of our contracts and to manage workflow. Although we are not dependent upon any single subcontractor, general market conditions may limit the availability of subcontractors on which we rely to perform portions of our contracts and this could have a material adverse effect on our business, financial condition and results of operations.
Our current insurance coverage may not be adequate, and we may not be able to obtain insurance at acceptable rates, or at all. We are partially self-insured for our major risks, and our insurance does not cover all types or amounts of liabilities. Our workers’ compensation insurance policy is subject to a $1.0 million per accident/occurrence deductible and our automobile liability and general liability insurance policies are subject to a $1.0 million per occurrence self-insured retention. Workers’ compensation losses are actuarially forecasted and paid to the insurance company over a twelve-month period, then retrospectively adjusted annually based on the difference between the forecasted losses and the actual incurred losses. General liability and automobile liability claims are handled by a third-party claims adjuster and reimbursed by us on a monthly basis. At any given time, we are subject to multiple workers’ compensation and personal injury claims. Our insurance policies may not be adequate to protect us from liabilities that we incur in our business. In addition, business insurance programs require collateral currently provided by $4.0 million in standby letters of credit and cash deposits of $0.6 million.
In addition, due to a variety of factors such as increases in claims and projected increases in medical costs and wages, insurance carriers may be unwilling to provide the current levels of coverage without a significant increase in collateral requirements to cover our deductible obligations. Furthermore, our insurance premiums may increase in the future and we may not be able to obtain similar levels of insurance on reasonable terms, or at all. Any such inadequacy of, or inability to obtain, insurance coverage at acceptable rates, or at all, could have a material adverse effect on our business, financial condition and results of operations.
Fuel costs could materially and adversely affect our operating results. We have a large fleet of vehicles and equipment that primarily use diesel fuel. Our fuel and oil expenses have ranged from approximately 3% to 5% of our total revenues over the last three fiscal years. Fuel costs have been very volatile over the last several years. Fuel prices and supplies are influenced by a variety of international, political and economic circumstances. In addition, weather and other unpredictable events may significantly affect fuel prices and supplies. These or other factors could result in higher fuel prices which, in turn, would increase our costs of doing business and lower our gross profit. We do not utilize hedge accounting treatment for financial reporting purposes and, as a result, we have experienced volatility in our mark-to-market adjustment on our diesel hedging program. Such adjustments caused a $0.4 million and $1.3 million decrease in our cost of operations during the fiscal years ended June 30, 2014 and 2013, respectively, and a $2.5 million increase in our cost of operations during the fiscal year ended June 30, 2012.
A portion of our business depends on our ability to provide surety bonds or letters of credit and we may be unable to compete for or work on certain projects if we are not able to obtain the necessary surety bonds or letters of credit. A portion of our contracts require and we expect that a portion of our future contracts will require that we provide our customers with security for the performance of their projects. This security may be in the form of a “performance bond” (a bond whereby a commercial surety provides for the benefit of the customer a bond insuring completion of the project) or a letter of credit. Further, under standard terms in the surety market, sureties issue or continue bonds on a project-by-project basis and can decline to issue bonds at any time or require the posting of additional collateral as a condition to issuing or renewing any bonds.
Current or future market conditions, including losses incurred in the construction industry, decreases in lending activity and increases in our debt, and ultimately our performance on contracts, may have a negative effect on surety providers. These market conditions, as well as changes in our surety providers’ assessment of our operating and financial risk, could also cause our surety providers to decline to issue or renew, or substantially reduce the amount of, bonds for our work and could increase our bonding costs. These actions could be taken on short notice. If our surety providers were to limit or eliminate our access to bonding, our alternatives would include seeking bonding capacity from other sureties, finding more business that does not require bonds and posting other forms of collateral for project performance, such as letters of credit or cash. We may be unable to secure these alternatives in a timely manner, on acceptable terms, or at all. Accordingly, if we were to experience an interruption or reduction in our availability of bonding capacity, we may be unable to compete for or work on certain projects and such interruption or reduction could have a material adverse effect on our business, financial condition and results of operations. If we are not able to obtain letters of credit, we may be unable to provide the requested terms or amounts to our customers based upon the terms of our revolving credit facility.
13
Table of Contents
We extend credit to customers for purchases of our services. In the past we have had, and in the future we may have, difficulty collecting receivables from customers that are subject to protection under bankruptcy or insolvency laws, are otherwise experiencing financial difficulties or dispute the amount owed to us. We grant credit, generally without collateral, to our customers located throughout the United States and abroad. Consequently, we are subject to potential credit risk related to changes in the electric power and gas utility industries and their performance. Please refer to Note 16 of the Notes to Consolidated Financial Statements in Item 8 of Part II of this Annual Report and “Item 7. Management’s Discussion and Analysis of Financial Condition and Results of Operations—Concentration of Credit Risk” for additional information regarding the concentration of our credit risk among our larger customers. If any of our large customers, some of which are highly leveraged, file for bankruptcy or experience financial difficulties, we could suffer reduced cash flows and losses in excess of current allowances provided. We could also experience adverse financial effects if our customers dispute or refuse to pay the amounts owed to us for various reasons, such as disagreement as to the terms of the governing contract, or dissatisfaction with the quality or timing of the work we performed. Our allowance for doubtful accounts was approximately 5% of accounts receivable at June 30, 2014. We cannot provide assurance that this estimate will be realized or that the allowance will be sufficient.
Weather conditions can adversely affect our operations and, consequently, revenues. The electric infrastructure servicing business is subject to seasonal variations, which may cause our operating results to vary significantly from period to period and could cause the market price of our stock to fall. Due to the fact that a significant portion of our business is performed outdoors, our results of operations are subject to seasonal variations. These seasonal variations affect our core activities of substation and renewable project work and maintaining, upgrading and extending electrical distribution and transmission powerlines and not only our storm-related services. Sustained periods of rain, especially when widespread throughout our service area, can negatively affect our results of operations for a particular period. In addition, during periods of El Niño conditions, typically more rainfall than average occurs over portions of the U.S. Gulf Coast and Florida, which includes a significant portion of our service territory. Generally, during the winter months, demand for new work and maintenance services may be lower due to reduced construction activity during inclement weather. As a result, operating results may vary significantly from period to period.
Our financial results are based upon estimates and assumptions that may differ from actual results. In preparing our consolidated financial statements in conformity with accounting principles generally accepted in the United States (“U.S. GAAP”), several estimates and assumptions are used by management in determining the reported amounts of assets and liabilities, revenues and expenses recognized during the periods presented and disclosures of contingent assets and liabilities known to exist as of the date of the financial statements. These estimates and assumptions must be made because certain information that is used in the preparation of our financial statements is dependent on future events, cannot be calculated with a high degree of precision from data available or is not capable of being readily calculated based on generally accepted methodologies. In some cases, these estimates are particularly difficult to determine and we must exercise significant judgment. Estimates are primarily used in our assessment of the allowance for doubtful accounts, valuation of inventory, useful lives and salvage values of property and equipment, fair value assumptions in analyzing goodwill and long-lived asset impairments, self-insured claims liabilities, forfeiture estimates relating to stock-based compensation, revenue recognition and provision for income taxes. Actual results for all estimates could differ materially from the estimates and assumptions that we use, which could have a material adverse effect on our business, financial condition and results of operations.
Failure to maintain effective internal control over financial reporting could have a material adverse effect on our business, operating results and stock price. According to requirements of Section 404 of the Sarbanes-Oxley Act of 2002 and the related rules of the SEC, we must assess our ability to maintain effective internal control over financial reporting. If we are unable to maintain adequate internal controls, our business and operating results could be harmed. If our management or our independent registered public accounting firm were to conclude in their reports that our internal control over financial reporting was not effective, investors could lose confidence in our reported financial information and the trading price of our stock could drop significantly.
We have incurred indebtedness under a revolving credit facility, which may restrict our business and operations, and restrict our future access to sufficient funding to finance desired growth. On August 24, 2011, we replaced our prior credit facility with a new $200.0 million revolving credit facility, which matures in August 2015. On June 27, 2012, we exercised the accordion loan feature of the new revolving credit facility and entered into a commitment increase agreement with our lenders thereby increasing the lenders’ commitments by $75.0 million, from $200.0 million to $275.0 million. The increased commitments have been and will be used to support our general corporate purposes, including funding the UCS acquisition. See Note 3, “Acquisitions,” of the Notes to Consolidated Financial Statements in Item 8 of Part II of this Annual Report for additional information regarding the UCS acquisition. As of June 30, 2014, we had $197.0 million of borrowings outstanding and $74.0 million of availability under the $275.0 million revolving credit facility (after giving effect to outstanding standby letters of credit of $4.0 million). Our borrowing availability is subject to, and potentially limited by, our compliance with the covenants of our revolving credit facility.
14
Table of Contents
We typically dedicate a portion of our cash flow to debt service. If we do not ultimately have sufficient earnings to service our debt, we would need to refinance all or part of our existing debt, sell assets, borrow more money or sell securities, which we may not be able to do on commercially reasonable terms or at all.
All of our outstanding indebtedness consists of borrowings under our revolving credit facility with a group of financial institutions, which are secured by substantially all of our assets. The terms of our revolving credit facility include customary events of default and covenants that limit us from taking certain actions without obtaining the consent of the lenders. In addition, our revolving credit facility requires us to maintain certain financial ratios and restricts our ability to incur additional indebtedness. The restrictions and covenants in our revolving credit facility may limit our ability to respond to changing business and economic conditions and may prevent us from engaging in transactions that might otherwise be considered beneficial to us.
A breach of our revolving credit facility, including any inability to comply with the required financial ratios, could result in a default. In the event of any default, the lenders thereunder would be entitled to accelerate the repayment of amounts outstanding, plus accrued and unpaid interest. Moreover, these lenders would have the option to terminate any obligation to make further extensions of credit under our revolving credit facility. In the event of a default under our revolving credit facility, the lenders thereunder could also proceed to foreclose against the assets securing such obligations. In the event of a foreclosure on all or substantially all of our assets, we may not be able to continue to operate as a going concern. Outstanding letters of credit issued under our revolving credit facility would need to be replaced with other forms of collateral. Cross defaults may also occur on other agreements including surety and lease agreements.
We may be unsuccessful at acquiring companies or at integrating companies that we acquire and, as a result, we may not achieve the expected benefits and our profitability could materially suffer. One of our growth strategies is to acquire companies that will allow us to continue to expand our energy and communication solutions platform and geographic footprint, when attractive opportunities arise. We expect to face competition for acquisition candidates, which may limit the number of acquisition opportunities and may lead to higher acquisition prices. We may not be able to identify, acquire or profitably manage additional businesses or to integrate successfully any acquired businesses without substantial costs, delays or other operational or financial problems. Further, acquisitions involve a number of special risks, including failure of the acquired business to achieve expected results, diversion of management’s attention, difficulties integrating the operations and personnel of acquired businesses, failure to retain key personnel of the acquired business, risks arising from the prior operations of acquired companies and risks associated with unanticipated events or liabilities, some or all of which could have a material adverse effect on our business, financial condition and results of operations and may disrupt the day to day operations during any implementation of various information systems. In addition, we may not be able to obtain the necessary acquisition financing or we may have to increase our indebtedness in order to finance an acquisition. If we finance acquisitions by issuing convertible debt or equity securities, our existing shareholders may be diluted, which could adversely affect the market price of our stock. Our future business, financial condition and results of operations could suffer if we fail to successfully implement our acquisition strategy.
Our use of percentage-of-completion accounting could result in a reduction or elimination of previously reported profits. As discussed in “Item 7. Management’s Discussion and Analysis of Financial Condition and Results of Operations — Critical Accounting Policies” and in the notes to our consolidated financial statements included in “Item 8. Financial Statements and Supplementary Data,” a significant portion of our revenues are recognized using the percentage-of-completion method of accounting, utilizing the cost-to-cost method. This method is used because management considers expended costs to be the best available measure of progress on these contracts. This accounting method is generally accepted for fixed-price contracts. The percentage-of-completion accounting practice we use results in our recognizing contract revenues and earnings ratably over the contract term in proportion to our incurrence of contract costs. The earnings or losses recognized on individual contracts are based on estimates of contract revenues, costs and profitability. Changes in job performance, job conditions, estimated profitability and final contract settlements may result in revisions to costs and income and their effects are recognized in the period in which the revisions are determined. Contract losses are recognized in full when determined to be probable and reasonably estimable, and contract profit estimates are adjusted based on ongoing reviews of contract profitability. Further, a substantial portion of our contracts contain various cost and performance incentives. Penalties are recorded when known or finalized, which generally occurs during the latter stages of the contract. In addition, we record cost recovery claims when we believe recovery is probable and the amounts can be reasonably estimated. Actual collection of claims could differ from estimated amounts and could result in a reduction or elimination of previously recognized earnings. In certain circumstances, it is possible that such adjustments could be significant.
Our inability to enforce non-competition agreements with former principals and key management of the businesses we acquire could materially and adversely affect our operating results, cash flows and liquidity. In connection with our acquisitions, we generally require that key management and the former principals of the businesses we acquire enter into non-competition agreements in our favor. The laws of each state differ concerning the enforceability of non-competition agreements. Generally, state courts will examine all of the facts and circumstances at the time a party seeks to enforce a non-competition agreement; consequently, we cannot predict with certainty whether, if challenged, a court will enforce any
15
Table of Contents
particular non-competition agreement. If one or more former principals or members of key management of the businesses we acquire violate or seek to violate these non-competition agreements, and the courts refuse to enforce the non-compete agreement entered into by such person or persons, we might be subject to increased competition, which could materially and adversely affect our operating results, cash flows and liquidity.
During the ordinary course of our business, we may become subject to lawsuits or indemnity claims, which could materially and adversely affect our reputation, business, financial condition and results of operations. We have in the past been, and may in the future be, named as a defendant in lawsuits, claims and other legal proceedings during the ordinary course of our business. These actions may seek, among other things, compensation for alleged personal injury, workers’ compensation, employment discrimination, breach of contract, property damage, punitive damages, civil penalties or other losses, consequential damages or injunctive or declaratory relief. In addition, pursuant to our service arrangements, we generally indemnify our customers for claims related to the services we provide thereunder. Furthermore, our services are integral to the operation and performance of the electric distribution and transmission infrastructure. As a result, we may become subject to lawsuits or claims for any failure of the systems that we work on, even if our services are not the cause for such failures. In addition, we may incur civil and criminal liabilities to the extent that our services contributed to any property damage. With respect to such lawsuits, claims, proceedings and indemnities, we have and will accrue reserves in accordance with U.S. GAAP. In the event that such actions or indemnities are ultimately resolved unfavorably at amounts exceeding our accrued reserves, or at material amounts, the outcome could materially and adversely affect our reputation, business, financial condition and results of operations. In addition, payments of significant amounts, even if reserved, could adversely affect our liquidity position.
Our participation in partnerships or alliances exposes us to liability and/or harm to our reputation for failures of our partners. As part of our business, we enter into partnership or alliance arrangements. The purpose of these agreements is typically to combine skills and resources to allow for the performance of particular projects. Success on these jointly performed projects depends in large part on whether our partners satisfy their contractual obligations. We and our partners generally will be jointly and severally liable for all liabilities and obligations. If a partner fails to perform or is financially unable to bear its portion of required capital contributions or other obligations, including liabilities stemming from claims or lawsuits, we could be required to make additional investments, provide additional services or pay more than our proportionate share of a liability to make up for our partner’s shortfall. Further, if we are unable to adequately address our partner’s performance issues, the customer may terminate the project, which could result in legal liability to us, harm our reputation and reduce our profit on a project.
Our failure to comply with, or the imposition of liability under, environmental laws and regulations could result in significant costs. Our facilities and operations, including fueling and truck maintenance, repair, washing and final-stage manufacturing, are subject to various environmental laws and regulations relating principally to the use, storage and disposal of solid and hazardous wastes and the discharge of pollutants into the air, water and land. Violations of these requirements, or of any permits required for our operations, could result in significant fines or penalties or other sanctions. We are also subject to laws and regulations that can impose liability, sometimes without regard to fault, for investigating or cleaning up contamination, as well as for damages to property or natural resources and for personal injury arising out of such contamination. Such liabilities may also be joint and several, meaning that we could be held responsible for more than our share of the liability involved, or even the entire amount. The presence of environmental contamination could also interfere with ongoing operations or adversely affect our ability to sell or lease our properties. In the event we fail to obtain or comply with any permits required for our activities, or our activities cause any environmental damage, we could incur significant liability. We have incurred costs in connection with environmental compliance, remediation and/or monitoring, and we anticipate that we will continue to do so. Discovery of additional contamination for which we are responsible, the enactment of new laws and regulations, which are becoming increasingly more stringent, or changes in how existing requirements are enforced, could require us to incur additional costs for compliance or subject us to unexpected liabilities.
Our results of operations could be adversely affected as a result of the impairment of goodwill or other intangibles. When we acquire a business, we record an asset called “goodwill” equal to the excess amount we pay for the business, including liabilities assumed, over the fair value of the tangible and identified intangible assets of the business we acquire. In accordance with U.S. GAAP, we must identify and value intangible assets that we acquire in business combinations, such as customer arrangements, customer relationships and non-compete agreements, that arise from contractual or other legal rights or that are capable of being separated or divided from the acquired entity and sold, transferred, licensed, rented or exchanged. The fair value of identified intangible assets is based upon an estimate of the future economic benefits expected to result from ownership, which represents the amount at which the assets could be bought or sold in a current transaction between willing parties, that is, other than in a forced or liquidation sale.
U.S. GAAP provides that goodwill and other intangible assets that have indefinite useful lives not be amortized, but instead must be tested at least annually for impairment, and intangible assets that have finite useful lives should be amortized over their useful lives. U.S. GAAP also provides specific guidance for testing goodwill and other non-amortized intangible assets for impairment. U.S. GAAP requires management to make certain estimates and assumptions to allocate goodwill to reporting units and to determine the fair value of reporting unit net assets and liabilities, including, among other
16
Table of Contents
things, an assessment of market conditions, projected cash flows, investment rates, cost of capital and growth rates, which could significantly impact the reported value of goodwill and other intangible assets. Fair value is determined using a combination of the discounted cash flow, market multiple and market capitalization valuation approaches. Absent any impairment indicators, we perform our impairment tests annually during the fourth quarter, or more frequently if impairment indicators are present.
We review our intangible assets with finite lives for impairment when events or changes in business conditions indicate the carrying value of the assets may not be recoverable, as required by U.S. GAAP. An impairment of intangible assets with finite lives exists if the sum of the undiscounted estimated future cash flows expected is less than the carrying value of the assets. If this measurement indicates a possible impairment, we compare the estimated fair value of the asset to the net book value to measure the impairment charge, if any.
We cannot predict the occurrence of certain future events that might adversely affect the reported value of goodwill and other intangible assets that totaled $221.1 million at June 30, 2014. Such events include strategic decisions made in response to economic and competitive conditions, the impact of the economic environment on our customer base, material negative changes in our relationships with material customers and other parties breaching their contractual obligations under non-compete agreements. Any material decline in our market capitalizations or material increase in discount rates could also result in an impairment of our goodwill. Future impairments, if any, will be recognized as operating expenses.
Risks associated with operating in international markets could restrict our ability to expand globally and harm our business and prospects, and we could be adversely affected by our failure to comply with the laws applicable to our foreign activities, including the U.S. Foreign Corrupt Practices Act and other similar worldwide anti-bribery laws. We continue to pursue international opportunities. We believe that there will be large and financially attractive projects to pursue in international markets over the next few years as developing regions install or develop their electric infrastructure. Economic conditions, including those resulting from wars, civil unrest, acts of terrorism and other conflicts or volatility in the global markets, may adversely affect our customers, their demand for our services and their ability to pay for our services. Furthermore, we anticipate our ability to provide construction services in these countries would be heavily reliant on local workforces to perform the non-management labor. These workforces will be susceptible to local labor issues, some of which we may be unaware. Consequently, we could have difficulty performing under our agreements in these countries if the local workforce is incapable, uncooperative or unwilling to contract with us. In addition, there are numerous risks inherent in conducting our business internationally, including, but not limited to, potential instability in international markets, changes in regulatory requirements applicable to international operations, currency fluctuations in foreign countries, political, economic and social conditions in foreign countries and complex U.S. and foreign laws and treaties, including tax laws and the U.S. Foreign Corrupt Practices Act of 1977, as amended (the “FCPA”). These risks could restrict our ability to provide services to international customers or to operate our international business profitably, and our overall business and results of operations could be negatively impacted by our foreign activities.
The FCPA and similar anti-bribery laws in other jurisdictions prohibit U.S.-based companies and their intermediaries from making improper payments to non-U.S. officials for the purpose of obtaining or retaining business. We have policies and procedures designed to ensure that we, our employees and our agents comply with the FCPA and other anti-bribery laws. However, there is no assurance that such policies or procedures will protect us against liability under the FCPA or other laws for actions taken by our agents, employees and intermediaries. If we are found to be liable for FCPA violations (either due to our own acts or our inadvertence, or due to acts or inadvertence of others), we could suffer from severe criminal or civil penalties or other sanctions, which could have a material adverse effect on our reputation, business, financial condition and results of operations. In addition, detecting, investigating, and resolving actual or alleged FCPA violations is expensive and can consume significant time and attention of our senior management.
We may incur additional healthcare costs arising from federal healthcare reform legislation. In March 2010, the Patient Protection and Affordable Care Act and the Health Care and Education Reconciliation Act of 2010 were signed into law in the United States. This legislation expands health care coverage to many uninsured individuals and expands coverage to those already insured. The changes required by this legislation could cause us to incur additional healthcare and other costs, although we do not expect any material short-term impact on our financial results as a result of the legislation. We are currently assessing the extent of any long-term impact from the legislation, including any potential changes to this legislation.
17
Table of Contents
Risks related to our common stock
The market price of our stock may be influenced by many factors, some of which are beyond our control. These factors include the various risks described in this section as well as the following:
| • | the failure of securities analysts to continue to cover our common stock or changes in financial estimates or recommendations by analysts; |
| • | announcements by us or our competitors of significant contracts, acquisitions or capital commitments; |
| • | changes in market valuation or earnings of our competitors; |
| • | variations in quarterly operating results; |
| • | availability of capital; |
| • | general economic conditions; |
| • | terrorist acts; |
| • | legislation; |
| • | future sales of our common stock; and |
| • | investor perception of us and the electric utility industry. |
Additional factors that do not specifically relate to our company or the electric utility industry may also materially reduce the market price of our common stock, regardless of our operating performance.
Shares eligible for future sale may cause the market price of our common stock to drop significantly, even if our business is doing well. The market price of our common stock could decline as a result of sales of a large number of shares of our common stock in the market or the perception that these sales could occur. These sales, or the possibility that these sales may occur, also might make it more difficult for us to sell equity securities in the future at a time and at a price that we deem appropriate. As of June 30, 2014, there were 31,938,800 shares of our common stock outstanding. Of this amount, 29,116,251 shares of common stock were freely tradeable without restriction or further registration under the Securities Act, by persons other than our affiliates within the meaning of Rule 144 under the Securities Act.
Anti-takeover provisions of our charter and bylaws may reduce the likelihood of any potential change of control or unsolicited acquisition proposal that shareholders might consider favorable. Provisions of our charter and bylaws could deter, delay or prevent a third-party from acquiring us, even if doing so would benefit our shareholders. These provisions include: the authority of the board to issue preferred stock with terms as the board may determine, the absence of cumulative voting in the election of directors, limitations on who may call special meetings of shareholders and advance notice requirements for shareholder proposals.
We do not intend to pay cash dividends in the foreseeable future. Since our IPO, we have not paid quarterly dividends on our common stock and have paid only one special cash dividend on our common stock, which we paid in December 2012 (see Note 7, “Shareholders’ Equity,” of the Notes to the Consolidated Financial Statements in Item 8 of Part II of this Annual Report for additional information regarding the special dividend). We currently intend to continue to retain any future earnings to finance the growth, development and expansion of our business and service debt. Accordingly, we do not intend to declare or pay any cash dividends on our common stock in the foreseeable future. The declaration, payment and amount of future cash dividends, if any, will be at the discretion of our board of directors after taking into account various factors, including our financial condition, results of operations, cash flows from operations, current and anticipated capital requirements and expansion plans, any contractual restrictions, the income tax laws then in effect and the requirements of North Carolina law. As a result, capital appreciation, if any, of our common stock will be your sole source of potential gain for the foreseeable future.
| ITEM 1B. | UNRESOLVED STAFF COMMENTS |
None.
| ITEM 2. | PROPERTIES |
Our headquarters and primary fleet facility are located in Mount Airy, North Carolina. As of June 30, 2014, we owned nine facilities and leased 87 properties throughout our service territory. Most of our properties are used as offices or for fleet operations and engineering services. We have pledged our owned properties as collateral under our revolving credit facility. We continuously review our property needs and, as a result, may consolidate or eliminate certain facilities in the future.
18
Table of Contents
However, no specific future eliminations or consolidations have been identified. We believe that our facilities are adequate for our current operations.
| ITEM 3. | LEGAL PROCEEDINGS |
We are from time to time a party to various lawsuits, claims and other legal proceedings that arise in the ordinary course of business. These actions typically seek, among other things, (i) compensation for alleged personal injury, workers’ compensation, employment discrimination, breach of contract, or property damages, (ii) punitive damages, civil penalties or other damages, or (iii) injunctive or declaratory relief. With respect to all such lawsuits, claims and proceedings, we record reserves when it is probable a liability has been incurred and the amount of loss can be reasonably estimated. We do not believe that any of these proceedings, individually or in the aggregate, would be expected to have a material adverse effect on our results of operations, financial position or cash flows.
| ITEM 4. | MINE SAFETY DISCLOSURES |
Not applicable.
19
Table of Contents
| ITEM 5. | MARKET FOR REGISTRANT’S COMMON EQUITY, RELATED STOCKHOLDER MATTERS AND ISSUER PURCHASES OF EQUITY SECURITIES |
Market Information
Our common stock began trading on the New York Stock Exchange (“NYSE”) on July 27, 2005 at the time of our IPO and can now be found under the symbol “PIKE.” The table below presents the high and low sales prices per share of our common stock as reported on the NYSE for the periods indicated:
| Fiscal 2014 | Fiscal 2013 | |||||||||||||||
| High | Low | High | Low | |||||||||||||
| First Quarter |
$ | 13.36 | $ | 10.25 | $ | 9.19 | $ | 7.72 | ||||||||
| Second Quarter |
11.38 | 8.72 | 10.98 | 7.75 | ||||||||||||
| Third Quarter |
11.46 | 9.72 | 15.18 | 9.40 | ||||||||||||
| Fourth Quarter |
11.00 | 8.52 | 15.93 | 11.52 | ||||||||||||
As of September 5, 2014, there were 38 shareholders of record of our common stock.
Dividend Policy
Since our IPO, we have not paid quarterly dividends on our common stock and have paid only one special cash dividend on our common stock, which we paid in December 2012 (see Note 7, “Shareholders’ Equity,” of the Notes to Consolidated Financial Statements in Item 8 of Part II of this Annual Report for additional information regarding the special dividend). We currently intend to continue to retain any future earnings to finance the growth, development and expansion of our business and service debt. Accordingly, we do not intend to declare or pay any cash dividends on our common stock in the foreseeable future. The declaration, payment and amount of future cash dividends, if any, will be at the discretion of our board of directors after taking into account various factors, including our financial condition, results of operations, cash flows from operations, current and anticipated capital requirements and expansion plans, any contractual restrictions, the income tax laws then in effect and the requirements of North Carolina law.
Performance Graph
The following Performance Graph and related information shall not be deemed to be “filed” with the SEC, nor shall such information be incorporated by reference into any future filing under the Securities Act or the Exchange Act, except to the extent that we specifically incorporate it by reference into such filing.
Presented below is a line graph comparing the total returns (assuming the reinvestment of dividends) of our common stock, the S&P 500 Index, the Russell 2000 Index, and the Peer Group. The “Peer Group” is comprised of Aegion Corporation; Comfort Systems USA, Inc.; Dycom Industries, Inc.; Integrated Electrical Services, Inc.; MasTec, Inc.; Matrix Service Company; Michael Baker Corporation; MYR Group Inc.; Quanta Services, Inc.; Sterling Construction Company, Inc.; Tetra Tech, Inc.; UniTek Global Services, Inc.; and Willbros Group, Inc.
The line graph assumes that $100 was invested in our common stock, each of the indices and the Peer Group on June 30, 2009. Returns for the companies included in the Peer Group have been weighted on the basis of the total market capitalization for each company. Returns include reinvestment of dividends.
20
Table of Contents
COMPARISON OF 5-YEAR CUMULATIVE TOTAL RETURN*
Among Pike Corporation, the S&P 500 Index, the Russell 2000 Index, and a Peer Group
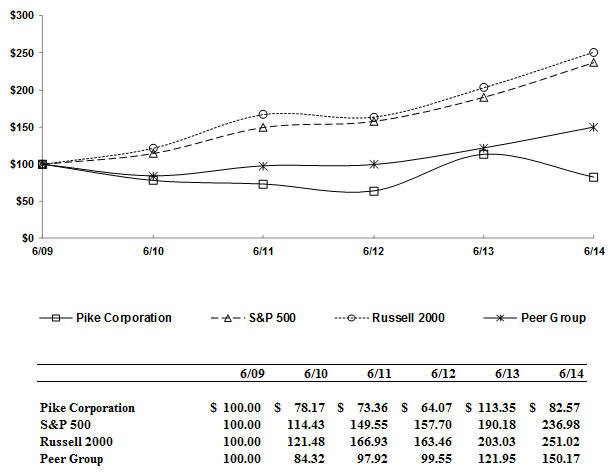
21
Table of Contents
| ITEM 6. | SELECTED FINANCIAL DATA |
The following tables set forth selected consolidated financial data of Pike Corporation for each of the fiscal years in the five-year period ended June 30, 2014. The selected consolidated financial data for each of the five fiscal years in the period ended June 30, 2014 and as of June 30, 2014, 2013, 2012, 2011 and 2010, was derived from the audited consolidated financial statements of Pike Corporation.
The consolidated financial data should be read in conjunction with “Item 7. Management’s Discussion and Analysis of Financial Condition and Results of Operations” and “Item 8. Financial Statements and Supplementary Data” included elsewhere herein.
| Fiscal Year Ended June 30, | ||||||||||||||||||||
| 2014 | 2013 | 2012 | 2011 | 2010 | ||||||||||||||||
| (in thousands, except per share amounts) | ||||||||||||||||||||
| Statement of Operations Data (1): |
||||||||||||||||||||
| Core revenues |
$ | 743,229 | $ | 751,364 | $ | 614,623 | $ | 529,335 | $ | 457,448 | ||||||||||
| Storm-related revenues |
67,431 | 167,327 | 70,546 | 64,523 | 46,636 | |||||||||||||||
|
|
|
|
|
|
|
|
|
|
|
|||||||||||
| Total revenues |
810,660 | 918,691 | 685,169 | 593,858 | 504,084 | |||||||||||||||
| Cost of operations (2) |
706,929 | 771,475 | 593,478 | 525,915 | 456,317 | |||||||||||||||
|
|
|
|
|
|
|
|
|
|
|
|||||||||||
| Gross profit |
103,731 | 147,216 | 91,691 | 67,943 | 47,767 | |||||||||||||||
| General and administrative expenses (3) |
74,894 | 75,579 | 66,219 | 57,675 | 51,994 | |||||||||||||||
| Secondary offering and other related costs (4) |
— | 4,138 | — | — | — | |||||||||||||||
| (Gain) loss on sale and impairment of property and equipment |
(1,968 | ) | (584 | ) | (626 | ) | 751 | 1,239 | ||||||||||||
| Restructuring expenses (5) |
— | — | — | — | 8,945 | |||||||||||||||
|
|
|
|
|
|
|
|
|
|
|
|||||||||||
| Income (loss) from operations |
30,805 | 68,083 | 26,098 | 9,517 | (14,411 | ) | ||||||||||||||
| Other expense (income): |
||||||||||||||||||||
| Interest expense |
8,187 | 7,384 | 7,304 | 6,608 | 7,908 | |||||||||||||||
| Other, net |
(349 | ) | (127 | ) | (63 | ) | (55 | ) | (298 | ) | ||||||||||
|
|
|
|
|
|
|
|
|
|
|
|||||||||||
| Total other expense |
7,838 | 7,257 | 7,241 | 6,553 | 7,610 | |||||||||||||||
|
|
|
|
|
|
|
|
|
|
|
|||||||||||
| Income (loss) before income taxes |
22,967 | 60,826 | 18,857 | 2,964 | (22,021 | ) | ||||||||||||||
| Income tax expense (benefit) |
9,304 | 24,633 | 7,974 | 1,563 | (8,562 | ) | ||||||||||||||
|
|
|
|
|
|
|
|
|
|
|
|||||||||||
| Net income (loss) |
$ | 13,663 | $ | 36,193 | $ | 10,883 | $ | 1,401 | $ | (13,459 | ) | |||||||||
|
|
|
|
|
|
|
|
|
|
|
|||||||||||
| Earnings (loss) per share: |
||||||||||||||||||||
| Basic |
$ | 0.43 | $ | 1.04 | $ | 0.31 | $ | 0.04 | $ | (0.41 | ) | |||||||||
|
|
|
|
|
|
|
|
|
|
|
|||||||||||
| Diluted |
$ | 0.42 | $ | 1.03 | $ | 0.31 | $ | 0.04 | $ | (0.41 | ) | |||||||||
|
|
|
|
|
|
|
|
|
|
|
|||||||||||
| Weighted average shares used in computing earnings (loss) per share: |
||||||||||||||||||||
| Basic |
31,830 | 34,777 | 34,678 | 33,399 | 33,132 | |||||||||||||||
|
|
|
|
|
|
|
|
|
|
|
|||||||||||
| Diluted |
32,191 | 35,057 | 35,111 | 33,996 | 33,132 | |||||||||||||||
|
|
|
|
|
|
|
|
|
|
|
|||||||||||
| Dividends per share: |
$ | — | $ | 1.00 | $ | — | $ | — | $ | — | ||||||||||
|
|
|
|
|
|
|
|
|
|
|
|||||||||||
| As of June 30, | ||||||||||||||||||||
| 2014 | 2013 | 2012 | 2011 | 2010 | ||||||||||||||||
| (in thousands) | ||||||||||||||||||||
| Balance Sheet Data: |
||||||||||||||||||||
| Cash and cash equivalents |
$ | 989 | $ | 2,578 | $ | 1,601 | $ | 311 | $ | 11,133 | ||||||||||
| Working capital |
124,802 | 123,209 | 113,842 | 84,342 | 73,530 | |||||||||||||||
| Property and equipment, net |
177,743 | 179,928 | 174,655 | 177,682 | 194,885 | |||||||||||||||
| Total assets |
616,152 | 623,774 | 538,148 | 493,609 | 505,378 | |||||||||||||||
| Total current liabilities |
88,306 | 88,232 | 79,303 | 78,488 | 78,532 | |||||||||||||||
| Total long-term liabilities |
269,152 | 293,707 | 181,920 | 160,732 | 177,378 | |||||||||||||||
| Total stockholders’ equity |
258,694 | 241,835 | 276,925 | 254,389 | 249,468 | |||||||||||||||
22
Table of Contents
| (1) | Statement of operations data includes the results of each acquired operation since the date of acquisition: Shaw Energy Delivery Services, Inc.—September 1, 2008; Facilities Planning & Siting, PLLC—June 30, 2009; Klondyke Construction LLC— June 30, 2010; Pine Valley Power, Inc.—August 1, 2011 and Synergetic Design Holdings, Inc. and its subsidiary, UC Synergetic, Inc.—July 2, 2012. |
| (2) | Cost of operations for fiscal 2010 includes $3.3 million of costs related to the cleanup of certain petroleum-related products on an owned property in Georgia. The remediation of the site is complete. |
| (3) | In fiscal 2014, we incurred approximately $1.0 million in fees and expenses in connection with an Agreement and Plan of Merger that we entered into on August 4, 2014. Approximately $0.7 million of these costs were non-deductible for income tax purposes. See Note 21, “Subsequent Event,” of the Notes to Consolidated Financial Statements in Item 8 of Part II of this Annual Report for further details. |
| (4) | In fiscal 2013, we incurred approximately $4.1 million in fees and expenses for a secondary equity offering and concurrent share repurchase, both of which closed on May 21, 2013. Approximately $2.5 million of these costs were non-deductible for income tax purposes. See Note 7, “Shareholders’ Equity,” of the Notes to Consolidated Financial Statements in Item 8 of Part II of this Annual Report for further details. |
| (5) | Restructuring expenses for fiscal 2010 of $8.9 million relate to the implementation of cost restructuring measures in distribution operations and support services. The pre-tax restructuring charge consisted of $1.0 million for severance and other termination benefits and $7.9 million for the non-cash writedown of fleet and other fixed assets to be disposed. |
| ITEM 7. | MANAGEMENT’S DISCUSSION AND ANALYSIS OF FINANCIAL CONDITION AND RESULTS OF OPERATIONS |
The following discussion and analysis of our financial condition and results of operations should be read in conjunction with our historical consolidated financial statements and related notes thereto in “Item 8. Financial Statements and Supplementary Data.” The discussion below contains forward-looking statements that are based upon our current expectations and are subject to uncertainty and changes in circumstances. Actual results may differ materially from these expectations due to inaccurate assumptions and known or unknown risks and uncertainties, including those identified in “Item 1A. Risk Factors.”
Overview
Pike Corporation was founded by Floyd S. Pike in 1945 and later incorporated in North Carolina in 1968. We reincorporated in Delaware on July 1, 2005, in connection with our July 2005 initial public offering. On November 5, 2013, Pike Electric Corporation changed its state of incorporation from Delaware to North Carolina. The Reincorporation was effected by merging Pike Electric Corporation, a Delaware corporation, with and into Pike Corporation, a North Carolina corporation and its wholly-owned subsidiary. In connection with the Reincorporation, Pike Electric Corporation changed its name to “Pike Corporation.” The Reincorporation did not result in any change in the business, management, fiscal year, accounting, location of the principal executive offices or other facilities, capitalization, assets or liabilities of Pike Electric Corporation. We are headquartered in Mount Airy, North Carolina. Our common stock is traded on the New York Stock Exchange under the symbol “PIKE.”
We are one of the largest providers of construction and engineering services for investor-owned, municipal and co-operative electric utilities in the United States. Since our founding in 1945, we have evolved from a specialty non-unionized contractor for electric utilities focused on the distribution sector in the southeastern United States to one of the nation’s largest specialty construction and engineering firms servicing over 300 customers. Leveraging our core competencies as a company primarily focused on providing a broad range of electric infrastructure services principally for utility customers, we believe that our experienced management team has positioned us to benefit from the substantial long-term growth drivers in our industry.
23
Table of Contents
Services
Over the past few years, we have reshaped our business platform and service territory significantly from being a distribution construction company based primarily in the southeastern United States to a national energy and communication solutions provider. We have done this organically and through strategic acquisitions of companies with complementary service offerings and geographic footprints. Our comprehensive suite of energy and communication solutions includes facilities planning and siting, permitting, engineering, design, installation, maintenance and repair of power delivery systems, including renewables (primarily ground-based) and utility-grade solar construction projects, and storm-related services. Our planning and siting process leverages technology and the collection of environmental, regulatory, economic, cultural, land use and scientific data to facilitate successful right-of-way negotiations, licensing and permitting for powerlines, substations and traditional and renewable electrical generation facilities. Our engineering and design capabilities include designing, providing EPC services, owner engineering, project management, material procurement, multi-entity coordination, grid integration, BOP, training, consulting, DOT projects, and Thermal Rate solutions for individual or turnkey powerline, substation and renewable energy projects. We also provide engineering and design services for the communication industry for wireline and wireless communication infrastructure. Our construction and maintenance capabilities include substation, distribution networks (underground and overhead) and transmission lines with voltages up to 345 kV. We are also a recognized leader in storm-related services due to our ability to rapidly mobilize thousands of existing employees and equipment within 24 hours, while maintaining a functional workforce for unaffected customers.
| Service |
Revenue Category |
Description | ||
| Planning & Siting | Engineering | Our planning and siting process leverages technology and the collection of environmental, regulatory, economic, cultural, land use and scientific data to facilitate successful right-of-way negotiations, licensing and permitting for powerlines, substations and traditional and renewable electrical generation facilities. We also provide NERC reliability studies and renewable generation interconnection studies. | ||
| Engineering & Design | Engineering | We provide design, EPC, owner engineer, project management, material procurement, multi-entity coordination, grid integration, BOP, training, consulting, DOT projects and Thermal Rate solutions for individual or turnkey powerline, substation and renewable energy projects. We also provide engineering and design services for the communication industry for wireline and wireless communication infrastructure. | ||
| Transmission and Distribution Construction |
Distribution and Transmission | We provide overhead and underground powerline construction, upgrade, inspection and extension services (predominately single-pole and H-frame wood, concrete or steel poles) for distribution networks and transmission lines with voltages up to 345 kV, and energized maintenance work for voltages up to 500 kV.
Overhead services consist of construction, repair and maintenance of wire and components in energized overhead electric distribution and transmission systems.
Underground services range from simple residential installations, directional boring, concrete encased duct and manhole installation, to the construction of complete underground distribution facilities. | ||
| Substation Construction | Substation | We provide substation construction and service for voltages up to 500 kV.
Substation services include: construction of new substations, existing substation upgrades, relay testing, transformer maintenance and hauling, foundations, commissioning, emergency outage response and Smart Grid component installation. We also specialize in relay metering and control solutions. | ||
| Utility-Grade Solar Construction |
Distribution and Other | We provide complete direct-hire construction services of utility-scale PV solar generation facilities including all scopes necessary to deliver power to the grid. We also provide full EPC installations of high voltage (230kV) underground gathering systems in | ||
24
Table of Contents
| conjunction with CSP facilities – “power towers” and full EPC installations for transmission lines and substations up to 500kV required for the interconnection of solar or wind generators to existing utility and transmission resources. | ||||
| Storm Assessment, Inspection and Restoration Services |
Storm-Related Services | Storm assessment, inspection and restoration services involve the assessment and repair or reconstruction of any part of a distribution or sub-500 kV transmission network, including substations, powerlines, utility poles or other components, damaged during snow, ice or wind storms, flash floods, hurricanes, tornadoes or other natural disasters. We are a recognized leader in storm-related services, due to our ability to rapidly mobilize thousands of existing employees and equipment within 24 hours, while maintaining a functional force for unaffected customers. | ||
While storm-related services can generate significant revenues, their unpredictability is demonstrated by comparing our revenues from those services in the last five fiscal years which have ranged from 8.3% to 18.2% of total revenues. During periods with significant storm restoration work, we generally see man-hours diverted from core work, which decreases core revenues. The table below sets forth our revenues by category of service for the fiscal years indicated:
| Fiscal Year |
Core Revenues |
Percentage of Total Revenues |
Storm-Related Revenues |
Percentage of Total Revenues |
Total Revenues |
|||||||||||||||
| (in millions) | (in millions) | (in millions) | ||||||||||||||||||
| 2010 |
$ | 457.5 | 90.7 | % | $ | 46.6 | 9.3 | % | $ | 504.1 | ||||||||||
| 2011 |
$ | 529.3 | 89.1 | % | $ | 64.5 | 10.9 | % | $ | 593.8 | ||||||||||
| 2012 |
$ | 614.6 | 89.7 | % | $ | 70.6 | 10.3 | % | $ | 685.2 | ||||||||||
| 2013 |
$ | 751.4 | 81.8 | % | $ | 167.3 | 18.2 | % | $ | 918.7 | ||||||||||
| 2014 |
$ | 743.2 | 91.7 | % | $ | 67.4 | 8.3 | % | $ | 810.6 | ||||||||||
Seasonality and Fluctuations of Results
Our services are performed outdoors and, as a result, our results of operations can be subject to seasonal variations due to weather conditions. These seasonal variations affect both our construction and engineering storm-related services. Extended periods of rain can negatively affect the deployment of our construction crews, particularly with respect to underground work. During the winter months, demand for construction work is generally lower due to inclement weather. Demand for construction work generally increases during the spring and summer months due to improved weather conditions. Due to the unpredictable nature of storms, the level of our storm-related revenues fluctuates from period to period.
Inflation
Due to relatively low levels of inflation experienced in recent years, inflation has not had a significant effect on our results. However, we have experienced fuel cost volatility during recent fiscal years.
Basis of Reporting
Revenues. We derive our revenues from two reportable segments, Construction and Engineering, through two service categories – core services and storm-related services. Our core services include facilities planning and siting, permitting, engineering, design, installation, maintenance and repair of power delivery systems, including renewables (primarily ground-based) and utility-grade solar construction projects. Our storm-related services involve the rapid deployment of our highly-trained crews and related equipment to restore power on transmission and distribution systems during crisis situations, such as hurricanes, tropical storms, ice storms or wind storms.
Cost of Operations. Our cost of operations consists primarily of compensation and benefits to employees, insurance, fuel, specialty equipment rental, operating and maintenance expenses relating to vehicles and equipment, materials and tools and supplies. Our cost of operations also includes depreciation, primarily relating to our vehicles and heavy equipment.
25
Table of Contents
General and Administrative Expenses. General and administrative expenses include costs not directly associated with performing work for our customers. These costs consist primarily of compensation and related benefits of management and administrative personnel, facilities expenses, professional fees and administrative overhead.
Interest Expense. In addition to cash interest expense, interest expense includes amortization of deferred loan costs, deferred compensation accretion and the write-off of unamortized deferred loan costs resulting from prepayments of debt.
Critical Accounting Policies
The discussion and analysis of our financial condition and results of operations are based on our consolidated financial statements, which have been prepared in accordance with U.S. GAAP. The preparation of these financial statements requires management to make certain estimates and assumptions for financial information that affect the amounts reported in the financial statements and accompanying notes. On an ongoing basis, we evaluate these estimates and assumptions, including those related to revenue recognition for work in progress, allowance for doubtful accounts, self-insured claims liability, valuation of goodwill and other intangible assets, asset lives and salvage values used in computing depreciation and amortization, including amortization of intangibles, accounting for income taxes, contingencies, litigation and stock-based compensation. Application of these estimates and assumptions requires the exercise of judgment as to future uncertainties and, as a result, actual results could differ from these estimates. We believe the following to be our most important accounting policies, including those that use significant judgments and estimates in the preparation of our consolidated financial statements.
Revenue Recognition. Revenues from service arrangements are recognized when services are performed. We recognize revenue from hourly services based on actual labor and equipment time completed and on materials when billable to our customers. We recognize revenue on unit-based services as the units are completed. We recognize the full amount of any estimated loss on site-specific unit projects if estimated costs to complete the remaining units for the project exceed the revenue to be received from such units.
Revenues for fixed-price contracts are recognized using the percentage-of-completion method, measured by the percentage of costs incurred to date to total estimated costs for each contract. Contract costs include all direct material, labor and subcontract costs, as well as indirect costs related to contract performance, such as indirect labor, tools, repairs and depreciation. The cost estimation process is based on the professional knowledge and experience of our engineers, project managers, field construction supervisors, operations management and financial professionals. Changes in job performance, job conditions, estimated profitability and final contract settlements may result in revisions to costs and income and their effects are recognized in the period in which the revisions are determined. At the time a loss on a contract becomes known, the entire amount of the estimated ultimate loss is accrued.
The current asset “Costs and estimated earnings in excess of billings on uncompleted contracts” represents revenues recognized in excess of amounts billed. The current liability “Billings in excess of costs and estimated earnings on uncompleted contracts” represents billings in excess of revenues recognized.
Allowance for Doubtful Accounts. We provide an allowance for doubtful accounts that represents an estimate of uncollectible accounts receivable. The determination of the allowance includes certain judgments and estimates including our customers’ willingness or ability to pay and our ongoing relationship with the customer. In certain instances, primarily relating to storm-related work and other high-volume billing situations, billed amounts may differ from ultimately collected amounts. We incorporate our historical experience with our customers into the estimation of the allowance for doubtful accounts. These amounts are continuously monitored as additional information is obtained. Accounts receivable are primarily due from customers located within the United States. Any material change in our customers’ business or cash flows could affect our ability to collect amounts due.
Property and Equipment. We capitalize property and equipment as permitted or required by applicable accounting standards, including replacements and improvements when costs incurred for those purposes extend the useful life of the asset. We charge maintenance and repairs to expense as incurred. Depreciation on capital assets is computed using the straight-line method based on the useful lives of the assets, which range from three to 39 years. Our management makes assumptions regarding future conditions in determining estimated useful lives and potential salvage values based on dealer black book valuations. These assumptions impact the amount of depreciation expense recognized in the period and any gain or loss once the asset is disposed.
We review our property and equipment for impairment when events or changes in business conditions indicate the carrying value of the assets may not be recoverable, as required by U.S. GAAP. An impairment of assets classified as “held and used” exists if the sum of the undiscounted estimated future cash flows expected is less than the carrying value of the assets. If this measurement indicates a possible impairment, we compare the estimated fair value of the asset to the net book value to measure the impairment charge, if any. If the criteria for classifying an asset as “held for sale” have been met, we record the asset at the lower of carrying value or fair value, less estimated selling costs. We continually evaluate the depreciable lives and salvage values of our equipment.
26
Table of Contents
Valuation of Goodwill and Other Intangible Assets. We test our goodwill for impairment annually or more frequently if events or circumstances indicate impairment may exist. Examples of such events or circumstances could include a significant change in business climate or a loss of significant customers. We complete our annual analysis of our reporting units as of the first day of our fourth fiscal quarter. For purposes of our fiscal 2014 analysis, we had four reporting units: non-union construction, union construction, energy delivery engineering and telecom engineering. In evaluating reporting units, we first consider our operating segments and related components in accordance with U.S. GAAP. We allocate goodwill to the reporting units that are expected to benefit from the synergies of the business combinations generating the goodwill. We apply a two-step fair value-based test to assess goodwill for impairment. The first step compares the fair values of the reporting units to their carrying amounts, including goodwill. If the carrying amount of any reporting unit exceeds its fair value, the second step is then performed. The second step compares the carrying amount of the reporting unit’s goodwill to the implied fair value of the goodwill. If the implied fair value of the goodwill is less than the carrying amount, an impairment loss would be recorded.
We determined the fair value of our reporting units based on the income approach, using a discounted cash flow model. The income approach was used because it has a more direct correlation to the specific economics of the reporting units than the market approach, which considers comparable companies and transactions that are comparable to the Company as a whole, but are not as comparable to the individual reporting units in terms of size, operational diversity, and geographic diversity. Under the income approach, the discounted cash flow model determines fair value based on the present value of projected cash flows over a specific projection period and a residual value related to future cash flows beyond the projection period. Both values are discounted using a rate which reflects our best estimate of the weighted-average cost of capital of a market participant, and is adjusted for appropriate risk factors. We perform sensitivity tests with respect to growth rates and discount rates used in the income approach.
For our annual impairment analysis, we relied solely on the income approach. The income approach was used because it has a more direct correlation to the specific economics of the reporting units than the market approach which is based on multiples of companies that, although comparable to the Company as a whole, may not have the exact same risk factors as our reporting units and are not as comparable to the individual reporting units in terms of size, operational diversity and geographic diversity. The analysis indicated that, as of the first day of our fourth fiscal quarter, the fair values of each of our reporting units exceeded their respective carrying values in excess of 10%. For our analysis, we also considered various elements of an implied control premium in assessing the reasonableness of the reconciliation of the summation of the fair values of the invested capital of our four reporting units (with appropriate consideration of the interest bearing debt) to the Company’s overall market capitalization and our net book value. This analysis included (i) the current control premium being paid for companies with a similar market capitalization and within similar industries and (ii) certain synergies that a market participant buyer could realize, such as the elimination of potentially redundant costs. Based on this analysis, management determined that the resulting control premium implied in the annual impairment analysis was approximately 10%, which was within a reasonable range of current market conditions. Based on our annual impairment analysis, we concluded that goodwill was not impaired.
In addition to goodwill, we identify and value other intangible assets that we acquire in business combinations, such as customer arrangements, customer relationships, intellectual property and non-compete agreements, that arise from contractual or other legal rights or that are capable of being separated or divided from the acquired entity and sold, transferred, licensed, rented or exchanged. The fair value of identified intangible assets is based upon an estimate of the future economic benefits expected to result from ownership, which represents the amount at which the assets could be bought or sold in a current transaction between willing parties, that is, other than in a forced or liquidation sale. For customers with whom we have an existing relationship prior to the date of the transaction, we utilize assumptions that a marketplace participant would consider in estimating the fair value of customer relationships that an acquired entity had with our pre-existing customers in accordance with U.S. GAAP. The inputs into goodwill and intangible asset fair value calculations reflect our market assumptions and are not observable. Consequently, the inputs are considered to be Level 3 as specified in the fair value accounting guidance.
Intangible assets with definite lives are amortized over their estimated useful lives and are also reviewed for impairment if events or changes in circumstances indicate that their carrying amount may not be realizable. We have no intangibles with indefinite lives other than goodwill.
Inherent in valuation determinations related to goodwill and other intangible assets are significant judgments and estimates, including assumptions about our future revenue, profitability and cash flows, our operational plans, current economic indicators and market valuations. To the extent these assumptions are incorrect or there are declines in our business outlook, impairment charges may be recorded in future periods.
27
Table of Contents
Insurance and Claims Accruals. In the ordinary course of our business, we are subject to individual workers’ compensation, vehicle, general liability and health insurance claims for which we are partially self-insured. We maintain commercial insurance for individual workers’ compensation and vehicle and general liability claims exceeding $1.0 million. We also maintain commercial insurance for health insurance claims exceeding $500,000 per person on an annual basis. We determine the amount of our loss reserves and loss adjustment expenses for self-insured claims based on analyses prepared quarterly that use both company-specific and industry data, as well as general economic information. Our estimates for insurance loss exposures require us to monitor and evaluate our insurance claims throughout their life cycles. Using this data and our assumptions about the emerging trends, we estimate the size of ultimate claims. Our most significant assumptions in forming our estimates include the trend in loss costs, the expected consistency with prior fiscal year claims of the frequency and severity of claims incurred but not yet reported, changes in the timing of the reporting of losses from the loss date to the notification date and expected costs to settle unpaid claims. We also monitor the reasonableness of the judgments made in the prior fiscal year’s estimates and adjust current year assumptions based on that analysis.
While the final outcome of claims may vary from estimates due to the type and severity of the injury, costs of medical claims and uncertainties surrounding the litigation process, we believe that none of these items, when finally resolved, will have a material adverse effect on our financial condition or liquidity. However, should a number of these items occur in the same period, it could have a material adverse effect on the results of operations in a particular quarter or fiscal year.
Stock-Based Compensation. In accordance with U.S. GAAP, we recognize the cost of employee services received in exchange for an award of equity instruments in the financial statements over the period the employee is required to perform the services in exchange for the award (presumptively the vesting period). We measure the cost of employee services received in exchange for an award based on the grant-date fair value of the award.
The fair value of each option award is estimated on the date of grant using the Black-Scholes option pricing model. The risk-free interest rate is based on the U.S. Treasury rate for the expected term of the option at the time of grant. We use our historical volatility as a basis for our expected volatility. We are using the “simplified method” to calculate the expected terms of the options as allowed under U.S. GAAP, which represents the period of time that options granted are expected to be outstanding. Forfeitures are estimated based on certain historical data. We will continue to use this method until we have sufficient historical exercise experience to give us confidence that our calculations based on such experience will be reliable. It is our current intent not to issue dividends and none are contemplated when estimating fair value for our option awards.
Results of Operations
The following table sets forth selected statement of operations data as percentages of revenues for the fiscal years indicated (dollars in millions):
| Fiscal Year Ended June 30, | ||||||||||||||||||||||||
| 2014 | 2013 | 2012 | ||||||||||||||||||||||
| Revenues: |
||||||||||||||||||||||||
| Core revenues |
$ | 743.2 | 91.7 | % | $ | 751.4 | 81.8 | % | $ | 614.6 | 89.7 | % | ||||||||||||
| Storm-related revenues |
67.4 | 8.3 | % | 167.3 | 18.2 | % | 70.6 | 10.3 | % | |||||||||||||||
|
|
|
|
|
|
|
|
|
|
|
|
|
|||||||||||||
| Total revenues |
810.6 | 100.0 | % | 918.7 | 100.0 | % | 685.2 | 100.0 | % | |||||||||||||||
| Cost of operations |
706.9 | 87.2 | % | 771.5 | 84.0 | % | 593.5 | 86.6 | % | |||||||||||||||
|
|
|
|
|
|
|
|
|
|
|
|
|
|||||||||||||
| Gross profit |
103.7 | 12.8 | % | 147.2 | 16.0 | % | 91.7 | 13.4 | % | |||||||||||||||
| General and administrative expenses |
74.9 | 9.2 | % | 75.6 | 8.2 | % | 66.2 | 9.7 | % | |||||||||||||||
| Secondary offering and other related costs |
— | — | 4.1 | 0.5 | % | — | — | |||||||||||||||||
| Gain on sale and impairment of property and equipment |
(2.0 | ) | -0.2 | % | (0.6 | ) | -0.1 | % | (0.6 | ) | -0.1 | % | ||||||||||||
|
|
|
|
|
|
|
|
|
|
|
|
|
|||||||||||||
| Income from operations |
30.8 | 3.8 | % | 68.1 | 7.4 | % | 26.1 | 3.8 | % | |||||||||||||||
| Interest expense and other, net |
7.8 | 1.0 | % | 7.3 | 0.8 | % | 7.2 | 1.0 | % | |||||||||||||||
|
|
|
|
|
|
|
|
|
|
|
|
|
|||||||||||||
| Income before income tax |
23.0 | 2.8 | % | 60.8 | 6.6 | % | 18.9 | 2.8 | % | |||||||||||||||
| Income tax expense |
9.3 | 1.1 | % | 24.6 | 2.7 | % | 8.0 | 1.2 | % | |||||||||||||||
|
|
|
|
|
|
|
|
|
|
|
|
|
|||||||||||||
| Net income |
$ | 13.7 | 1.7 | % | $ | 36.2 | 3.9 | % | $ | 10.9 | 1.6 | % | ||||||||||||
|
|
|
|
|
|
|
|
|
|
|
|
|
|||||||||||||
28
Table of Contents
Fiscal Year Ended June 30, 2014 Compared to Fiscal Year Ended June 30, 2013
Revenues. Revenues decreased 12%, or $108.1 million, to $810.6 million for the fiscal year ended June 30, 2014 from $918.7 million for the fiscal year ended June 30, 2013. The decrease was attributable to a $99.9 million decrease in storm-related revenues and an $8.2 million decrease in core revenues.
Our storm-related revenues are highly volatile and unpredictable. For the fiscal year ended June 30, 2014, storm-related revenues totaled $67.4 million. For the fiscal year ended June 30, 2013, storm-related revenues totaled $167.3 million, which was primarily attributable to a large derecho storm in the Northeast, Hurricane Isaac and Hurricane Sandy.
In addition, our core revenues declined approximately $8.2 million in fiscal 2014 compared to fiscal 2013 due to the completion of our distribution project in Tanzania during fiscal 2013 and a reduction in utility-grade solar projects primarily in California.
Gross Profit. Gross profit decreased 30%, or $43.5 million, to $103.7 million for the fiscal year ended June 30, 2014 from $147.2 million for the fiscal year ended June 30, 2013. Gross profit as a percentage of revenues decreased to 12.8% for the fiscal year ended June 30, 2014 from 16.0% for the fiscal year ended June 30, 2013. Our gross profit was negatively impacted by a significantly lower mix of storm revenue. Our storm restoration services typically generate a higher profit margin than core services. During a storm response, our storm-assigned crews and equipment are fully utilized. In addition, the overtime typically worked on storm events lowers the ratio of fixed costs to revenue. Storm gross profit margins can vary greatly depending on the geographic area, customer mix and amount of overtime worked. In addition, we experienced losses on five specific jobs in California for two customers at our western subsidiary companies for the three months ended September 30, 2013, which had a negative impact on our gross profit during the fiscal year ended June 30, 2014.
General and Administrative Expenses. General and administrative expenses decreased 1% to $74.9 million for the fiscal year ended June 30, 2014 from $75.6 million for the fiscal year ended June 30, 2013. As a percentage of revenues, general and administrative expenses increased to 9.2% for the fiscal year ended June 30, 2014 from 8.2% for the prior fiscal year. The decrease in general and administrative expenses was primarily due to significantly less incentive bonuses accrued for the fiscal year ended June 30, 2014 compared to the fiscal year ended June 30, 2013. This decrease was partially offset by costs to expand our engineering and western operations totaling approximately $1.8 million. In addition, for the fiscal year ended June 30, 2014, we incurred approximately $1.0 million in fees and expenses in connection with an Agreement and Plan of Merger that we entered into on August 4, 2014. See Note 21, “Subsequent Event,” of the Notes to Consolidated Financial Statements in Item 8 of Part II of this Annual Report for further details.
Costs of Secondary Offering and Concurrent Share Repurchase. In fiscal 2013, we incurred approximately $4.1 million in fees and expenses for a secondary equity offering and concurrent share repurchase, both of which closed on May 21, 2013, and included fees and expenses associated with a special committee of our board of directors. Offering costs totaling approximately $2.5 million are non-deductible for income tax purposes. See Note 7, “Shareholders’ Equity,” of the Notes to Consolidated Financial Statements in Item 8 of Part II of this Annual Report for further details. These costs were not allocated to our Construction or Engineering segments for the fiscal year ended June 30, 2013.
Interest Expense and Other, Net. Interest expense and other, net increased 7% to $7.8 million for the fiscal year ended June 30, 2014 from $7.3 million for the fiscal year ended June 30, 2013. The increase was primarily attributable to maintaining a higher outstanding revolving line credit balance during most of the fiscal year ended June 30, 2014.
Income Tax Expense. Income tax expense was $9.3 million and $24.6 million for the fiscal years ended June 30, 2014 and 2013, respectively. Effective income tax rate of 40.5% for the fiscal years ended June 30, 2014 and 2013 varied from the statutory federal income tax rate of 35% due to several factors, including state income and gross margin taxes, changes in permanent differences primarily related to non-deductibility of certain secondary offering costs for fiscal 2013, the Internal Revenue Code Section 199 deduction, non-deductibility of certain merger costs for fiscal 2014, and Internal Revenue Code Section 162(m) deduction limitations for compensation, meals and entertainment, and the relative size of our consolidated income before income taxes. In addition, North Carolina enacted new legislation on July 23, 2013, which lowered its corporate tax rate in 2014 and will lower it again in 2015.
29
Table of Contents
Operating Results by Segment – Fiscal Year Ended June 30, 2014 Compared to Fiscal Year Ended June 30, 2013
| Fiscal Year Ended June 30, | ||||||||||||||||
| 2014 | 2013 | |||||||||||||||
| Revenues: |
||||||||||||||||
| Construction core services |
$ | 592.1 | 73.0 | % | $ | 605.6 | 66.0 | % | ||||||||
| Intersegment eliminations |
(0.4 | ) | 0.0 | % | (0.6 | ) | -0.1 | % | ||||||||
|
|
|
|
|
|
|
|
|
|||||||||
| Total Construction core services, net |
591.7 | 73.0 | % | 605.0 | 65.9 | % | ||||||||||
|
|
|
|
|
|
|
|
|
|||||||||
| Engineering core services |
184.1 | 22.7 | % | 183.8 | 20.0 | % | ||||||||||
| Intersegment eliminations |
(32.6 | ) | -4.0 | % | (37.4 | ) | -4.1 | % | ||||||||
|
|
|
|
|
|
|
|
|
|||||||||
| Total Engineering core services, net |
151.5 | 18.7 | % | 146.4 | 15.9 | % | ||||||||||
| Total core services, net |
743.2 | 91.7 | % | 751.4 | 81.8 | % | ||||||||||
|
|
|
|
|
|
|
|
|
|||||||||
| Construction storm restoration |
64.8 | 8.0 | % | 157.9 | 17.2 | % | ||||||||||
| Engineering storm assessment and inspection |
2.6 | 0.3 | % | 9.4 | 1.0 | % | ||||||||||
|
|
|
|
|
|
|
|
|
|||||||||
| Total storm-related revenue |
67.4 | 8.3 | % | 167.3 | 18.2 | % | ||||||||||
|
|
|
|
|
|
|
|
|
|||||||||
| Total revenue |
$ | 810.6 | 100.0 | % | $ | 918.7 | 100.0 | % | ||||||||
|
|
|
|
|
|
|
|
|
|||||||||
| Operating Income (Loss): |
||||||||||||||||
| Construction |
$ | 27.5 | 89.3 | % | $ | 69.1 | 101.5 | % | ||||||||
| Engineering |
3.8 | 12.3 | % | 5.1 | 7.5 | % | ||||||||||
|
|
|
|
|
|
|
|
|
|||||||||
| Total |
31.3 | 101.6 | % | 74.2 | 109.0 | % | ||||||||||
| Other |
(0.5 | ) | -1.6 | % | (6.1 | ) | -9.0 | % | ||||||||
|
|
|
|
|
|
|
|
|
|||||||||
| Total operating income |
$ | 30.8 | 100.0 | % | $ | 68.1 | 100.0 | % | ||||||||
|
|
|
|
|
|
|
|
|
|||||||||
Construction
| Fiscal Year Ended June 30, |
||||||||||||
| 2014 | 2013 | % Change | ||||||||||
| Construction revenue |
$ | 656.9 | $ | 763.5 | ||||||||
| Intersegment eliminations |
(0.4 | ) | (0.6 | ) | ||||||||
| Total revenues, net |
$ | 656.5 | $ | 762.9 | -13.9 | % | ||||||
| Segment income from operations |
$ | 27.5 | $ | 69.1 | -60.2 | % | ||||||
Revenues. Construction revenues decreased 13.9%, or $106.4 million, to $656.5 million for the fiscal year ended June 30, 2014 from $762.9 million for the fiscal year ended June 30, 2013.
The following table contains supplemental information on construction revenue and percentage changes by category for the fiscal years indicated:
| Fiscal Year Ended June 30, |
||||||||||||
| Category of Revenue |
2014 | 2013 | % Change | |||||||||
| Distribution and other |
$ | 434.5 | $ | 449.2 | -3.3 | % | ||||||
| Transmission and substation |
157.2 | 155.8 | 0.9 | % | ||||||||
|
|
|
|
|
|
|
|||||||
| Total core revenue |
$ | 591.7 | $ | 605.0 | -2.2 | % | ||||||
| Storm restoration services |
64.8 | 157.9 | -59.0 | % | ||||||||
|
|
|
|
|
|
|
|||||||
| Total |
$ | 656.5 | $ | 762.9 | -13.9 | % | ||||||
|
|
|
|
|
|
|
|||||||
| • | Distribution and Other Revenues. Our combined revenues for overhead and underground distribution services and other revenue decreased 3.3% for the fiscal year ended June 30, 2014 from the prior fiscal year. Our distribution services experienced an increase in the current year due to significantly less storm restoration revenues compared to the prior fiscal year, as storm restoration work generally diverts man-hours from core work. This increase was more than offset by lower volume large solar construction projects in California during the fiscal year ended June 30, 2014 as compared to the prior fiscal year. In addition, there were no Tanzania project revenues for the fiscal year ended June 30, 2014 compared to $6.6 million for the fiscal year ended June 30, 2013 due to substantial completion of this project at December 31, 2012. |
30
Table of Contents
Subsequent to the merger of Duke Energy and Progress Energy, the new corporation requested bids for its distribution, transmission, substation and engineering MSA contracts. We successfully retained the majority of the MSA contracts we chose to bid and which represented our work in fiscal 2014. In the few areas we were unsuccessful in retaining the work, our crews have already been redeployed to growth on surrounding customers.
The majority of our distribution services are provided to investor-owned, municipal and co-operative utilities under MSAs. Services provided under these MSAs include both overhead and underground powerline distribution services. Our MSAs do not guarantee a minimum volume of work. The MSAs provide a framework for core and storm restoration pricing and provide an outline of the service territory in which we will work or the percentage of overall outsourced distribution work we will provide for the customer. Our MSAs also provide a platform for multi-year relationships with our customers. We can easily increase or decrease staffing for a customer without exhaustive contract negotiations.
Other revenues in this category include primarily solar construction projects primarily in California.
| • | Transmission and Substation Revenues. Transmission and substation revenues increased 0.9% for the fiscal year ended June 30, 2014 from the prior fiscal year. A significant amount of our transmission and substation projects are fixed price, site specific projects and revenues can vary based on start dates of the projects and mobilization time. The substation construction market remains very competitive especially in the southeastern United States. |
Segment Income from Operations. Segment income from operations decreased 60.2% to $27.5 million for the fiscal year ended June 30, 2014 from $69.1 million for the fiscal year ended June 30, 2013. Segment income from operations as a percentage of revenues decreased to 4.2% for the fiscal year ended June 30, 2014 from 9.1% for the prior fiscal year. Segment income from operations was negatively impacted from the factors discussed above under “Gross Profit” with respect to the fiscal year ended June 30, 2014. We benefited from a mark-to-market adjustment on our diesel hedging program that provided a $0.4 million and $1.3 million decrease in our cost of operations during the fiscal years ended June 30, 2014 and 2013, respectively.
Engineering
| Fiscal Year Ended June 30, |
||||||||||||
| 2014 | 2013 | % Change | ||||||||||
| Engineering core revenue |
$ | 184.1 | $ | 183.8 | ||||||||
| Intersegment eliminations |
(32.6 | ) | (37.4 | ) | ||||||||
|
|
|
|
|
|||||||||
| Total core revenue, net |
$ | 151.5 | $ | 146.4 | 3.5 | % | ||||||
| Storm assessment and inspection revenue |
2.6 | 9.4 | ||||||||||
|
|
|
|
|
|||||||||
| Total revenues, net |
$ | 154.1 | $ | 155.8 | -1.1 | % | ||||||
| Segment income from operations |
$ | 3.8 | $ | 5.1 | -25.5 | % | ||||||
Revenues. Engineering revenues decreased 1.1%, or $1.7 million, to $154.1 million for the fiscal year ended June 30, 2014 from $155.8 million for the fiscal year ended June 30, 2013. Engineering revenues were negatively impacted by less storm assessment and inspection revenues compared to the prior fiscal year. In addition, engineering revenues may fluctuate due to the timing of material procurement revenues. Material procurement services, if they are provided, are typically on our EPC projects that are administered by Engineering. As a result, our revenue will fluctuate due to the level of material procurement associated with our EPC projects.
Segment Income from Operations. Segment income from operations decreased 25.5% to $3.8 million for the fiscal year ended June 30, 2014 from $5.1 million for the fiscal year ended June 30, 2013. Segment income from operations as a percentage of revenues decreased to 2.5% for the fiscal year ended June 30, 2014 from 3.3% for the prior fiscal year. Segment income from operations was negatively impacted by a significantly lower mix of storm assessment and inspection revenue compared to the prior fiscal year and specific project-related receivable reserves totaling approximately $1.4 million adjusted for one customer as part of our on-going collection efforts.
31
Table of Contents
Other
Other represents certain corporate general and administrative costs not allocated to the segments. Other loss from operations decreased 91.8% to $0.5 million for the fiscal year ended June 30, 2014 from $6.1 million for the fiscal year ended June 30, 2013. The decrease in loss from the prior fiscal year was primarily attributable to the $4.1 million in fees and expenses in connection with the secondary equity offering and concurrent share repurchase not being allocated to the segments for the fiscal year ended June 30, 2013. See Note 7, “Shareholders’ Equity,” of the Notes to Consolidated Financial Statements in Item 8 of Part II of this Annual Report for further details.
Fiscal Year Ended June 30, 2013 Compared to Fiscal Year Ended June 30, 2012
Revenues. Revenues increased 34%, or $233.5 million, to $918.7 million for the fiscal year ended June 30, 2013 from $685.2 million for the fiscal year ended June 30, 2012. The increase was attributable to a $136.8 million increase in core revenues and a $96.7 million increase in storm-related revenues. Our acquisition of UCS on July 2, 2012 accounted for $77.3 million in revenues ($67.9 million core services and $9.4 million storm assessment and inspection services) for the fiscal year ended June 30, 2013.
Our storm-related revenues are highly volatile and unpredictable. For the fiscal year ended June 30, 2013, storm-related revenues totaled $167.3 million, which was primarily attributable to a large derecho storm in the Northeast, Hurricane Isaac and Hurricane Sandy. For the fiscal year ended June 30, 2012, storm-related revenues totaled $70.6 million, which was primarily attributable to Hurricane Irene and a large snow storm that occurred in the Northeast during November 2011.
Gross Profit. Gross profit increased 61%, or $55.5 million, to $147.2 million for the fiscal year ended June 30, 2013 from $91.7 million for the fiscal year ended June 30, 2012. Gross profit as a percentage of revenues increased to 16.0% for the fiscal year ended June 30, 2013 from 13.4% for the prior fiscal year. Our gross profit was positively impacted by our higher storm-related revenues and improving margins in construction and engineering services and the UCS acquisition.
General and Administrative Expenses. General and administrative expenses increased 14% to $75.6 million for the fiscal year ended June 30, 2013 from $66.2 million for the fiscal year ended June 30, 2012. As a percentage of revenues, general and administrative expenses decreased to 8.2% for the fiscal year ended June 30, 2013 from 9.7% for the prior fiscal year. The increase in general and administrative expenses was primarily due to approximately $3.6 million of overhead costs related to UCS, $3.5 million in compensation, benefits, recruiting and travel to support geographic expansion and revenue growth, $1.2 million for additional incentive expense, and $0.6 million in severance.
Costs of Secondary Offering and Concurrent Share Repurchase. In fiscal 2013, we incurred approximately $4.1 million in fees and expenses for a secondary equity offering and concurrent share repurchase, both of which closed on May 21, 2013, and included fees and expenses associated with a special committee of our board of directors. Offering costs totaling approximately $2.5 million are non-deductible for income tax purposes. See Note 7, “Shareholders’ Equity,” of the Notes to Consolidated Financial Statements in Item 8 of Part II of this Annual Report for further details. These costs were not allocated to our Construction or Engineering segments for the fiscal year ended June 30, 2013.
Interest Expense and Other, Net. Interest expense and other, net increased 1% to $7.3 million for the fiscal year ended June 30, 2013 from $7.2 million for the fiscal year ended June 30, 2012. Fiscal 2012 includes the write-off of approximately $1.7 million of unamortized deferred loan costs as additional interest expense related to our prior credit facility in August 2011. In fiscal 2013, our interest expense increased due to additional borrowings for the UCS acquisition and the fourth quarter stock repurchase. See Note 6, “Debt,” of the Notes to Consolidated Financial Statements in Item 8 of Part II of this Annual Report for further details on our revolving credit facility.
Income Tax Expense. Income tax expense was $24.6 million and $8.0 million for the fiscal years ended June 30, 2013 and 2012, respectively. Effective income tax rates of 40.5% and 42.3% for the fiscal years ended June 30, 2013 and 2012, respectively, varied from the statutory federal income tax rate of 35% due to several factors, including state income and gross margin taxes, changes in permanent differences primarily related to non-deductibility of certain secondary offering costs and deductibility of certain costs related to the UCS acquisition, Internal Revenue Code Section 199 deduction for production activities, Internal Revenue Code Section 162(m) deduction limitations for compensation, meals and entertainment, and the relative size of our consolidated income before income taxes.
32
Table of Contents
Operating Results by Segment – Fiscal Year Ended June 30, 2013 Compared to Fiscal Year Ended June 30, 2012
| Fiscal Year Ended June 30, | ||||||||||||||||
| 2013 | 2012 | |||||||||||||||
| Revenues: |
||||||||||||||||
| Construction core services |
$ | 605.6 | 66.0 | % | $ | 552.0 | 80.6 | % | ||||||||
| Intersegment eliminations |
(0.6 | ) | -0.1 | % | (8.0 | ) | -1.2 | % | ||||||||
|
|
|
|
|
|
|
|
|
|||||||||
| Total Construction core services, net |
605.0 | 65.9 | % | 544.0 | 79.4 | % | ||||||||||
|
|
|
|
|
|
|
|
|
|||||||||
| Engineering core services |
183.8 | 20.0 | % | 78.6 | 11.5 | % | ||||||||||
| Intersegment eliminations |
(37.4 | ) | -4.1 | % | (8.0 | ) | -1.2 | % | ||||||||
|
|
|
|
|
|
|
|
|
|||||||||
| Total Engineering core services, net |
146.4 | 15.9 | % | 70.6 | 10.3 | % | ||||||||||
| Total core services, net |
751.4 | 81.8 | % | 614.6 | 89.7 | % | ||||||||||
|
|
|
|
|
|
|
|
|
|||||||||
| Construction storm restoration |
157.9 | 17.2 | % | 70.6 | 10.3 | % | ||||||||||
| Engineering storm assessment and inspection |
9.4 | 1.0 | % | — | — | |||||||||||
|
|
|
|
|
|
|
|
|
|||||||||
| Total storm-related revenue |
167.3 | 18.2 | % | 70.6 | 10.3 | % | ||||||||||
|
|
|
|
|
|
|
|
|
|||||||||
| Total revenue |
$ | 918.7 | 100.0 | % | $ | 685.2 | 100.0 | % | ||||||||
|
|
|
|
|
|
|
|
|
|||||||||
| Operating Income (Loss): |
||||||||||||||||
| Construction |
$ | 69.1 | 101.5 | % | $ | 25.9 | 99.3 | % | ||||||||
| Engineering |
5.1 | 7.5 | % | 2.2 | 8.4 | % | ||||||||||
|
|
|
|
|
|
|
|
|
|||||||||
| Total |
74.2 | 109.0 | % | 28.1 | 107.7 | % | ||||||||||
| Other |
(6.1 | ) | -9.0 | % | (2.0 | ) | -7.7 | % | ||||||||
|
|
|
|
|
|
|
|
|
|||||||||
| Total operating income |
$ | 68.1 | 100.0 | % | $ | 26.1 | 100.0 | % | ||||||||
|
|
|
|
|
|
|
|
|
|||||||||
Construction
| Fiscal Year Ended June 30, |
||||||||||||
| 2013 | 2012 | % Change | ||||||||||
| Construction revenue |
$ | 763.5 | $ | 622.7 | ||||||||
| Intersegment eliminations |
(0.6 | ) | (8.1 | ) | ||||||||
|
|
|
|
|
|||||||||
| Total revenues, net |
$ | 762.9 | $ | 614.6 | 24.1 | % | ||||||
| Segment income from operations |
$ | 69.1 | $ | 25.9 | 166.8 | % | ||||||
Revenues. Construction revenues increased 24.1%, or $148.3 million, to $762.9 million for the fiscal year ended June 30, 2013 from $614.6 million for the fiscal year ended June 30, 2012.
The following table contains supplemental information on construction revenue and percentage changes by category for the fiscal years indicated:
| Fiscal Year Ended June 30, |
||||||||||||
| Category of Revenue |
2013 | 2012 | % Change | |||||||||
| Distribution and other |
$ | 449.2 | $ | 418.8 | 7.3 | % | ||||||
| Transmission and substation |
155.8 | 125.2 | 24.4 | % | ||||||||
|
|
|
|
|
|
|
|||||||
| Total core revenue |
$ | 605.0 | $ | 544.0 | 11.2 | % | ||||||
| Storm restoration services |
157.9 | 70.6 | 123.7 | % | ||||||||
|
|
|
|
|
|
|
|||||||
| Total |
$ | 762.9 | $ | 614.6 | 24.1 | % | ||||||
|
|
|
|
|
|
|
|||||||
| • | Distribution and Other Revenues. Our revenues for distribution services and other revenue increased 7.3% for the fiscal year ended June 30, 2013 from the prior fiscal year, due to a general increase in demand for distribution |
33
Table of Contents
| maintenance services for the fiscal year ended June 30, 2013. We experienced some additional displacement in distribution revenue during the fiscal year ended June 30, 2013 due to the increased diversion of work crews to perform incremental storm services compared to the fiscal year ended June 30, 2012. |
The majority of our distribution services are provided to investor-owned, municipal and co-operative utilities under MSAs. Services provided under these MSAs include both overhead and underground powerline distribution services. Our MSAs do not guarantee a minimum volume of work. The MSAs provide a framework for core and storm restoration pricing and provide an outline of the service territory in which we will work or the percentage of overall outsourced distribution work we will provide for the customer. Our MSAs also provide a platform for multi-year relationships with our customers. We can easily increase or decrease staffing for a customer without exhaustive contract negotiations.
Other revenues in this category include primarily solar construction projects in California.
| • | Transmission and Substation Revenues. Transmission and substation revenues increased 24.4% for the fiscal year ended June 30, 2013 from the prior fiscal year. A significant amount of our transmission projects are fixed price, site specific projects and revenues can vary based on start dates of the projects and mobilization time. Transmission revenues were positively impacted by new projects in California and timing of the SCE&G EPC project which commenced construction in January 2012. A significant amount of our substation projects are fixed price, site specific projects and revenues can vary based on start dates of the projects and mobilization time. The substation construction market remains very competitive especially in the southeastern United States. |
Segment Income from Operations. Segment income from operations increased 166.8% to $69.1 million for the fiscal year ended June 30, 2013 from $25.9 million for the fiscal year ended June 30, 2012. Segment income from operations as a percentage of revenues increased to 9.1% for the fiscal year ended June 30, 2013 from 4.2% for the prior fiscal year. Our segment income from operations was positively impacted by our higher storm restoration revenues and improving margins in core construction services. We also benefited from a mark-to-market adjustment on our diesel hedging program that provided a $1.3 million decrease in our cost of operations during the fiscal year ended June 30, 2013. We were negatively impacted by the mark-to-market adjustment during the fiscal year ended June 30, 2012 that caused a $2.5 million increase in our cost of operations for that fiscal year.
Engineering
| Fiscal Year Ended June 30, |
||||||||||||
| 2013 | 2012 | % Change | ||||||||||
| Engineering revenue |
$ | 183.8 | $ | 78.6 | ||||||||
| Intersegment eliminations |
(37.4 | ) | (8.0 | ) | ||||||||
|
|
|
|
|
|||||||||
| Total revenues, net |
$ | 146.4 | $ | 70.6 | 107.4 | % | ||||||
| Storm assessment and inspection revenue |
9.4 | — | ||||||||||
|
|
|
|
|
|||||||||
| Total revenues, net |
$ | 155.8 | $ | 70.6 | 120.7 | % | ||||||
| Segment income from operations |
$ | 5.1 | $ | 2.2 | 131.8 | % | ||||||
Revenues. Engineering revenues increased 120.7%, or $85.2 million, to $155.8 million for the fiscal year ended June 30, 2013 from $70.6 million for the fiscal year ended June 30, 2012. The acquisition of UCS on July 2, 2012 contributed $77.3 million of revenue (including $9.4 million in storm assessment and inspection services) during the fiscal year ended June 30, 2013. Engineering revenues were also positively impacted by increased activity on the SCE&G EPC project which commenced construction around January 2012. Engineering revenues may fluctuate, especially on a quarterly basis, due to the timing of material procurement revenues. Material procurement services, if they are provided, are typically on our EPC projects that are administered by engineering. As a result, our revenue will fluctuate due to material procurement associated with our EPC projects.
Segment Income from Operations. Segment income from operations increased 131.8% to $5.1 million for the fiscal year ended June 30, 2013 from $2.2 million for the fiscal year ended June 30, 2012. Segment income from operations as a percentage of revenues increased to 3.3% for the fiscal year ended June 30, 2013 from 3.1% for the prior fiscal year. Our segment income from operations was positively impacted by the acquisition of UCS, which benefits from higher margin engineering services, including storm assessment and inspection services. UCS does not provide material procurement services that lower overall margin percentages. In addition, engineering services were positively impacted by increased activity on the SCE&G EPC project which commenced construction in January 2012. Our segment income from operations was negatively impacted from severance costs totaling $1.1 million and non-productive start-up paid time incurred on a new large telecom project with an existing customer during the fiscal year ended June 30, 2013.
34
Table of Contents
Other
Other represents certain corporate general and administrative costs not allocated to the segments. Other loss from operations increased 205% to $6.1 million for the fiscal year ended June 30, 2013 from $2.0 million for the fiscal year ended June 30, 2012. The increase in loss from the prior fiscal year was primarily attributable to the $4.1 million in fees and expenses in connection with the secondary equity offering and concurrent share repurchase not being allocated to the segments for the fiscal year ended June 30, 2013. See Note 7, “Shareholders’ Equity,” of the Notes to Consolidated Financial Statements in Item 8 of Part II of this Annual Report for further details.
Liquidity and Capital Resources
Our primary cash needs have been working capital, capital expenditures, payments under our revolving credit facility and acquisitions. In fiscal 2013, our cash needs also included a special dividend and a repurchase of common stock totaling $75.0 million. Our primary source of cash for fiscal 2014 and fiscal 2013 was cash from operations and borrowings under our revolving credit facility. Our primary source of cash for fiscal 2012 was cash provided by operations. We had $4.7 million and $8.1 million in accounts receivable and costs and estimated earnings in excess of billings on uncompleted contracts from storm-related jobs at June 30, 2014 and 2013, respectively.
We need working capital to support seasonal variations in our business, primarily due to the impact of weather conditions on the electric infrastructure and the corresponding spending by our customers on electric service and repairs. The increased service activity during storm-related events temporarily causes an excess of customer billings over customer collections, leading to increased accounts receivable during those periods. In the past, we have utilized borrowings under the revolving portion of our credit facility and cash on hand to satisfy normal cash needs during these periods.
On August 24, 2011, we entered into a $200.0 million revolving credit facility that replaced our prior credit facility. Our revolving credit facility matures in August 2015. We repaid outstanding term loans and borrowings on the revolver of our prior credit facility upon entering into our revolving credit facility. The obligations under our revolving credit facility are unconditionally guaranteed by us and each of our existing and subsequently acquired or organized domestic and first-tier foreign subsidiaries and secured on a first-priority basis by security interests (subject to permitted liens) in substantially all assets owned by us and each of our subsidiaries, subject to limited exceptions. On June 27, 2012, we exercised the accordion feature of the revolving credit facility and entered into a commitment increase agreement with our lenders thereby increasing the lenders’ commitments by $75.0 million, from $200.0 million to $275.0 million.
As of June 30, 2014, we had $197.0 million in borrowings and our availability under our revolving credit facility was $74.0 million (after giving effect to $4.0 million of outstanding standby letters of credit). This borrowing availability is subject to, and potentially limited by, our compliance with the covenants of our revolving credit facility, which are discussed below.
We believe that our cash flows from operations, available cash and cash equivalents, and borrowings available under our revolving credit facility will be adequate to meet our liquidity needs in the ordinary course of business for the foreseeable future. However, our ability to satisfy our obligations or to fund planned capital expenditures will depend on our future performance, which to a certain extent is subject to general economic, financial, competitive, legislative, regulatory and other factors beyond our control. In addition, if we fail to comply with the covenants contained in our revolving credit facility, we may be unable to access our revolving credit facility upon which we depend for letters of credit and other short-term borrowings. This would have a negative impact on our liquidity and require us to obtain alternative short-term financing.
35
Table of Contents
Changes in Cash Flows: Fiscal 2014 Compared to Fiscal 2013
| Fiscal Year Ended June 30, |
||||||||
| 2014 | 2013 | |||||||
| (in millions) | ||||||||
| Net cash provided by operating activities |
$ | 48.9 | $ | 82.8 | ||||
| Net cash used in investing activities |
$ | (26.5 | ) | $ | (105.9 | ) | ||
| Net cash (used in) provided by financing activities |
$ | (24.0 | ) | $ | 24.1 | |||
Net cash provided by operating activities decreased to $48.9 million for the fiscal year ended June 30, 2014 from $82.8 million for the fiscal year ended June 30, 2013. The decrease in operating cash flows was primarily due to timing of working capital requirements and the significant decrease in income related to lower storm activity during the fiscal year ended June 30, 2014 compared to the fiscal year ended June 30, 2013.
We received a refund and made a payment to the commercial insurance carrier that administers our partially self-insured individual workers’ compensation, vehicle and general liability insurance programs for retrospective premium payment adjustments of $9.2 million in refunds in June 2014 and $1.6 million in payments in July 2013, which are included in net cash provided by operating activities for the fiscal year ended June 30, 2014. These refunds and payments are included in changes in insurance and claims accruals. Retrospective adjustments have historically been prepared annually on a “paid-loss” basis by our commercial insurance carrier. The last retrospective premium adjustment for the fiscal year ended June 30, 2013 from our commercial insurance carrier resulted in a refund totaling $5.5 million that was received in December 2012.
Net cash used in investing activities decreased to $26.5 million for the fiscal year ended June 30, 2014 from $105.9 million for the fiscal year June 30, 2013. This decrease was primarily due to cash used for the acquisition of UCS in July 2012 totaling $69.7 million (net of cash acquired totaling $0.7 million) and decreased capital expenditures during the fiscal year ended June 30, 2014. Capital expenditures for both periods consisted primarily of purchases of vehicles and equipment used to service our customers.
Net cash used in financing activities was $24.0 million for the fiscal year ended June 30, 2014 compared to $24.1 million of net cash provided by financing activities for the fiscal year ended June 30, 2013. We borrowed $70.0 million to finance the UCS acquisition during the fiscal year ended June 30, 2013. On December 4, 2012, we announced that our board of directors declared a special cash dividend of $1.00 per share on our common stock totaling approximately $35.2 million. The dividend was payable to shareholders of record as of December 14, 2012 and was paid on December 21, 2012. The funds for the dividend were initially borrowed from our revolving credit facility but were repaid before December 31, 2012 from cash received from customers related to storm activity. In May 2013, we repurchased 3,661,327 shares of our common stock at a price of $10.925 per share, or $40 million, from LGB Pike II LLC. We funded the share repurchase with available cash and borrowings under our revolving credit facility, and the shares were repurchased and cancelled on May 21, 2013. See Note 7, “Shareholders’ Equity,” of the Notes to Consolidated Financial Statements in Item 8 of Part II of this Annual Report for further details.
Changes in Cash Flows: Fiscal 2013 Compared to Fiscal 2012
| Fiscal Year Ended June 30, |
||||||||
| 2013 | 2012 | |||||||
| (in millions) | ||||||||
| Net cash provided by operating activities |
$ | 82.8 | $ | 25.7 | ||||
| Net cash used in investing activities |
$ | (105.9 | ) | $ | (45.5 | ) | ||
| Net cash provided by financing activities |
$ | 24.1 | $ | 21.1 | ||||
Net cash provided by operating activities increased to $82.8 million for the fiscal year ended June 30, 2013 from $25.7 million for the fiscal year ended June 30, 2012. The increase in operating cash flows was primarily due to improvement of net income by $25.3 million and our ability to decrease the rate of our working capital growth as the business grew in 2013.
We received a refund from the commercial insurance carrier that administers our partially self-insured individual workers’ compensation, vehicle and general liability insurance programs for retrospective premium payment adjustments of $5.5 million in December 2012, which is included in net cash provided by operating activities for the fiscal year ended June 30, 2013. These refunds are included in changes in insurance and claims accruals. Retrospective adjustments have historically been prepared annually on a “paid-loss” basis by our commercial insurance carrier. The prior fiscal year retrospective premium payment adjustment from our commercial insurance carrier resulted in a refund totaling $3.5 million that was received in August 2011.
36
Table of Contents
Net cash used in investing activities increased to $105.9 million for the fiscal year ended June 30, 2013 from $45.5 million for the fiscal year ended June 30, 2012. This increase was primarily due to cash used for the acquisition of UCS in July 2012 totaling $69.7 million (net of cash acquired totaling $0.7 million), and increased capital expenditures. Capital expenditures for both years consisted primarily of purchases of vehicles and equipment used to service our customers.
Net cash provided by financing activities increased to $24.1 million for the fiscal year ended June 30, 2013 compared to $21.1 million for the fiscal year ended June 30, 2012. On August 24, 2011, we entered into a $200.0 million revolving credit facility that replaced our prior credit facility of which $113.0 million was outstanding under our prior credit facility and accrued interest totaling $0.3 million was paid off at that time. Total costs associated with the existing revolving credit facility were approximately $1.8 million which are being capitalized and amortized over the term of the agreement using the effective interest method. On June 27, 2012, we exercised the accordion feature of the revolving credit facility and entered into a commitment increase agreement with our lenders thereby increasing the lenders’ commitments by $75.0 million, from $200.0 million to $275.0 million. We borrowed $70.0 million to finance the UCS acquisition during the fiscal year ended June 30, 2013. On December 4, 2012, we announced that our board of directors had declared a special cash dividend of $1.00 per share on our common stock totaling $35.2 million. The dividend was payable to shareholders of record as of December 14, 2012 and was paid on December 21, 2012. In May 2013, we repurchased 3,661,327 shares of our common stock at a price of $10.925 per share, or $40 million, from LGB Pike II LLC. We funded the share repurchase with available cash and borrowings under our revolving credit facility, and the shares were repurchased and cancelled on May 21, 2013. See Note 7, “Shareholders’ Equity,” of the Notes to Consolidated Financial Statements in Item 8 of Part II of this Annual Report for further details.
Capital Expenditures
We routinely invest in vehicles, equipment and technology. The timing and volume of such capital expenditures in the future will be affected by the addition of new customers or expansion of existing customer relationships. Capital expenditures were $32.4 million, $40.3 million and $33.9 million for fiscal 2014, 2013 and 2012, respectively. Capital expenditures for all periods consisted primarily of purchases of vehicles and equipment used to service our customers. As of June 30, 2014, we had no material outstanding commitments for capital expenditures.
EBITDA U.S. GAAP Reconciliation
EBITDA is a non-U.S. GAAP financial measure that represents the sum of net income, income tax expense, interest expense, depreciation and amortization. EBITDA is used internally when evaluating our operating performance and management believes that EBITDA allows investors to make a more meaningful comparison between our core business operating results on a consistent basis over different periods of time, as well as with those of other similar companies. Management believes that EBITDA, when viewed with our results under U.S. GAAP and the accompanying reconciliation, provides additional information that is useful for evaluating the operating performance of our business without regard to potential distortions. Additionally, management believes that EBITDA permits investors to gain an understanding of the factors and trends affecting our ongoing cash earnings, from which capital investments are made and debt is serviced. This non-U.S. GAAP measure excludes certain cash expenses that we are obligated to make. In addition, other companies in our industry may calculate this non-U.S. GAAP measure differently than we do or may not calculate it at all, limiting its usefulness as a comparative measure. The table below provides a reconciliation between net income and EBITDA.
| Fiscal Year Ended June 30, |
||||||||
| 2014 | 2013 | |||||||
| (in millions) | ||||||||
| Net income |
$ | 13.7 | $ | 36.2 | ||||
| Adjustments: |
||||||||
| Interest expense |
8.2 | 7.4 | ||||||
| Income tax expense |
9.3 | 24.6 | ||||||
| Depreciation and amortization |
39.5 | 41.4 | ||||||
|
|
|
|
|
|||||
| EBITDA |
$ | 70.7 | $ | 109.6 | ||||
|
|
|
|
|
|||||
EBITDA decreased 35.5% to $70.7 million for the fiscal year ended June 30, 2014 from $109.6 million for the fiscal year ended June 30, 2013. The decreased EBITDA was primarily due to a significantly lower level of storm activity compared to the prior fiscal year.
37
Table of Contents
Credit Facility
On August 24, 2011, we entered into a new $200.0 million revolving credit facility that replaced our prior credit facility. Our revolving credit facility matures in August 2015. On June 27, 2012, we exercised the accordion feature of the revolving credit facility and entered into a commitment increase agreement with our lenders thereby increasing the lenders’ commitments by $75.0 million, from $200.0 million to $275.0 million.
We repaid outstanding term loans and borrowings on the revolver of our prior credit facility upon entering into our existing revolving credit facility. As of August 24, 2011, we had $115.0 million in borrowings and our availability under our revolving credit facility was $61.9 million (after giving effect to $23.1 million of outstanding standby letters of credit). The obligations under our revolving credit facility are unconditionally guaranteed by us and each of our existing and subsequently acquired or organized domestic and first-tier foreign subsidiaries and secured on a first-priority basis by security interests (subject to permitted liens) in substantially all assets owned by us and each of our subsidiaries, subject to limited exceptions.
Our revolving credit facility contains a number of other affirmative and restrictive covenants, including limitations on dissolutions, sales of assets, investments, and indebtedness and liens. On December 17, 2013, we entered into an amendment to our revolving credit facility to restate the leverage covenant ratio. Total costs associated with this amendment were approximately $419,000, which are capitalized and being amortized over the term of the debt using the effective interest method. Our revolving credit facility includes a requirement that we maintain (i) a leverage ratio, which is the ratio of total debt to adjusted EBITDA (as defined in our revolving credit facility; measured on a trailing four-quarter basis), of no more than 4.00 to 1.00 as of the last day of each fiscal quarter, declining to 3.75 on June 30, 2014 and declining to 3.50 on September 30, 2014 and thereafter, and (ii) a consolidated fixed charge coverage ratio (as defined in our revolving credit facility) of at least 1.25 to 1.00. At June 30, 2014, we were in compliance with such covenants with a leverage ratio and a fixed charge coverage ratio of 2.69 and 1.90, respectively.
Contractual Obligations and Other Commitments
As of June 30, 2014, our contractual obligations and other commitments were as follows:
| Payment Obligations by Fiscal Year Ended June 30, | ||||||||||||||||||||||||||||
| Total | 2015 | 2016 | 2017 | 2018 | 2019 | Thereafter | ||||||||||||||||||||||
| (in millions) | ||||||||||||||||||||||||||||
| Long-term debt obligations (1) |
$ | 197.0 | $ | — | $ | 197.0 | $ | — | $ | — | $ | — | $ | — | ||||||||||||||
| Interest payment obligations (2) |
8.1 | 7.0 | 1.1 | — | — | — | — | |||||||||||||||||||||
| Operating lease obligations |
81.5 | 18.9 | 17.5 | 14.9 | 13.0 | 8.9 | 8.3 | |||||||||||||||||||||
| Purchase obligations (3) |
30.3 | 30.3 | — | — | — | — | — | |||||||||||||||||||||
| Deferred compensation (4) |
6.6 | — | — | 2.1 | — | — | 4.5 | |||||||||||||||||||||
|
|
|
|
|
|
|
|
|
|
|
|
|
|
|
|||||||||||||||
| Total |
$ | 323.5 | $ | 56.2 | $ | 215.6 | $ | 17.0 | $ | 13.0 | $ | 8.9 | $ | 12.8 | ||||||||||||||
|
|
|
|
|
|
|
|
|
|
|
|
|
|
|
|||||||||||||||
| (1) | Includes only obligations to pay principal, not interest expense. |
| (2) | Represents estimated interest payments to be made on our variable rate debt. All interest payments assume that principal payments are made as originally scheduled. Interest rates utilized to determine interest payments for variable rate debt are based upon our current interest rate and include the impact of our interest rate swaps. For more information, see Note 6, “Debt,” of the Notes to Consolidated Financial Statements in Item 8 of Part II of this Annual Report for further details. |
| (3) | Represents purchase obligations related to materials and subcontractor services for customer contracts. |
| (4) | For a description of the deferred compensation obligation, see Note 15, “Deferred Compensation,” of the Notes to Consolidated Financial Statements in Item 8 of Part II of this Annual Report for further details |
Off-Balance Sheet Arrangements
As is common in our industry, we have entered into certain off-balance sheet arrangements in the ordinary course of business that result in risks not directly reflected in our balance sheets. Our significant off-balance sheet transactions include liabilities associated with non-cancelable operating leases, including sale-leaseback arrangements, letter of credit obligations and surety guarantees entered into in the normal course of business. We have not engaged in any off-balance sheet financing arrangements through special purpose entities.
38
Table of Contents
Leases
In the ordinary course of business, we enter into non-cancelable operating leases for certain of our facility, vehicle and equipment needs. These leases allow us to conserve cash by paying a monthly lease rental fee for use of the related facilities, vehicles and equipment rather than purchasing them. The terms of these agreements vary from lease to lease, including with renewal options and escalation clauses. We may decide to cancel or terminate a lease before the end of its term, in which case we are typically liable to the lessor for the remaining lease payments under the term of the lease.
Letters of Credit
Certain of our vendors require letters of credit to ensure reimbursement for amounts they are disbursing on our behalf. In addition, from time to time some customers require us to post letters of credit to ensure payment to our subcontractors and vendors under those contracts and to guarantee performance under our contracts. Such letters of credit are generally issued by a bank or similar financial institution. The letter of credit commits the issuer to pay specified amounts to the holder of the letter of credit if the holder claims that we have failed to perform specified actions. If this were to occur, we would be required to reimburse the issuer of the letter of credit. Depending on the circumstances of such a reimbursement, we may also have to record a charge to earnings for the reimbursement. We do not believe that it is likely that any material claims will be made under a letter of credit in the foreseeable future. We use our revolving credit facility to issue letters of credit. As of June 30, 2014, we had $4.0 million of standby letters of credit issued under our revolving credit facility primarily for insurance and bonding purposes. Our ability to obtain letters of credit under the revolving portion of our revolving credit facility is conditioned on our continued compliance with the affirmative and negative covenants of our revolving credit facility.
Performance Bonds and Parent Guarantees
In the ordinary course of business, we are required by certain customers to post surety or performance bonds in connection with services that we provide to them. These bonds provide a guarantee to the customer that we will perform under the terms of a contract and that we will pay subcontractors and vendors. If we fail to perform under a contract or to pay subcontractors and vendors, the customer may demand that the surety make payments or provide services under the bond. We must reimburse the surety for any expenses or outlays it incurs. As of June 30, 2014, we had $106.1 million in surety bonds outstanding. To date, we have not been required to make any reimbursements to our sureties for bond-related costs. We believe that it is unlikely that we will have to fund significant claims under our surety arrangements in the foreseeable future.
Pike Corporation, from time to time, guarantees the obligations of its wholly-owned subsidiaries, including obligations under certain contracts with customers.
Recent Accounting Pronouncements
Revenue Recognition
In May 2014, the Financial Accounting Standards Board (“FASB”) issued an accounting standards update (“ASU”) related to revenue from contracts with customers which requires an entity to recognize the amount of revenue to which it expects to be entitled for the transfer of promised goods or services to customers. The ASU will replace most existing revenue recognition guidance when it becomes effective. The new standard is effective for the Company on January 1, 2017. Early application is not permitted. The standard permits the use of either the retrospective or cumulative effect transition method. The Company is evaluating the effect the ASU will have on its consolidated financial statements and related disclosures. The Company has not yet selected a transition method nor has it determined the effect of the standard on its ongoing financial reporting.
Presentation of Comprehensive Income
In February 2013, the FASB issued final guidance related to the reporting of amounts reclassified out of accumulated other comprehensive income that requires entities to report, either on their income statement or in a footnote to their financial statements, the effects on earnings from items that are reclassified out of accumulated other comprehensive income. The guidance was effective prospectively for our interim period ended September 30, 2013. The adoption of this guidance only affected presentation and did not have an impact on our financial position, results of operations or cash flows.
Disclosures about Offsetting Assets and Liabilities
In December 2011, the FASB issued an accounting standards update regarding disclosures about offsetting assets and liabilities, which requires entities to disclose information about offsetting and related arrangements of financial instruments and derivative instruments. The amendment was effective retrospectively for our interim period ended September 30, 2013. The adoption of this guidance only affected presentation and did not have an impact on our financial position, results of operations or cash flows.
39
Table of Contents
FORWARD-LOOKING STATEMENTS
This Annual Report on Form 10-K contains statements that are intended to be “forward-looking statements” under the Private Securities Litigation Reform Act of 1995, Section 27A of the Securities Act and Section 21E of the Exchange Act. These forward-looking statements are based on current expectations, estimates, forecasts and projections about us and the industry in which we operate and management’s beliefs and assumptions. Such statements include, in particular, statements about our plans, strategies and prospects under the headings “Business—Overview,” “- Industry Overview,” “- Our Growth Strategy,” “- Competitive Strengths,” “-Competition,” “- Customers,” “- Employees,” “- Equipment,” “- Proprietary Rights,” “- Government Regulation,” “- Environmental Matters,” and “Management’s Discussion and Analysis of Financial Condition and Results of Operations.”
Words such as “may,” “should,” “expect,” “anticipate,” “intend,” “plan,” “predict,” “potential,” “continue,” “believe,” “seek,” “estimate,” variations of such words and similar expressions are intended to identify such forward-looking statements. These statements are not guarantees of future performance and involve risks, uncertainties and assumptions which are difficult to predict. Such risks include, without limitation, those identified under the heading “Risk Factors.” Therefore, actual outcomes and results may differ materially from what is expressed or forecasted in such forward-looking statements. These forward-looking statements include, but are not limited to, statements relating to:
| • | our belief that our experienced management team has positioned us to benefit from the substantial long-term growth drivers in our industry by leveraging our core competencies as a company primarily focused on providing a broad range of electric infrastructure services principally for utility customers; |
| • | our belief that our acquisitions of Klondyke and Pine Valley allow us to continue to expand our engineering and construction services in the western United States and better compete in markets with unionized workforces; |
| • | our belief that there are significant growth opportunities for our business and the services we provide due to the required future investment in transmission and distribution infrastructure, the expanded development of energy sources, the increased outsourcing of utility infrastructure services and the rebound in residential development; |
| • | our expectation that we will benefit from the development of new sources of electric power generation; |
| • | our belief that a majority of utility infrastructure services are still conducted in-house and that our customers, especially investor-owned electric utilities, will expand outsourcing of utility infrastructure services over time; |
| • | our belief that residential development, which was negatively impacted during 2008 to 2011, is rebounding; |
| • | our belief that growth in our markets will be driven by bundling services and marketing these offerings to our large and extensive customer base and new customers and that by offering these services on a turnkey basis, we enable our customers to achieve economies and efficiencies over separate unbundled services, which should ultimately lead to an expansion of our market share across our existing customer base and provide us the credibility to secure additional opportunities from new customers; |
| • | our belief that the U.S. electric power system and network reliability will require significant future upkeep given the postponement of maintenance spending in recent years due to the difficult economic conditions, that such upkeep will drive demand for our services and that our leading position in the markets we service will enable us to capitalize on increases in demand for our services; |
| • | our belief that our existing and potential customers desire a deeper range of service offerings on an ever-increasing scale and that our broad platform of service offerings will enable us to acquire additional market share and further penetrate our existing markets; |
| • | our belief that our broad platform of service offerings will be attractive to local and regional firms looking to consolidate with a larger company offering a more diversified and complete set of services; |
| • | our belief that there will be large and financially attractive projects to pursue in international markets over the next few years as developing regions install or develop their electric infrastructure; |
| • | our belief that we have a unique and strong competitive position in the markets in which we operate resulting from a number of factors, including: (i) our position as a leading provider of energy and communication solutions; (ii) our attractive, contiguous presence in key geographic markets; (iii) our long-standing relationships across a high-quality customer base; (iv) our outsourced services-based business model; (v) our position as a recognized leader in storm-related capabilities; and (vi) our experienced operations management team with extensive relationships; |
40
Table of Contents
| • | our belief that we are one of only a few companies offering a broad spectrum of energy and communication solutions that our current and prospective customers increasingly demand; |
| • | our belief that our customized, well-maintained and extensive fleet and experienced crews provide us with a competitive advantage in our ability to service our customers and respond rapidly to storm-related opportunities; |
| • | our belief that our important customer relationships provide us an advantage in competing for their business and developing new client relationships; |
| • | our belief that the trend of many of our customers increasing their reliance on outsourcing the maintenance and improvement of their transmission and distribution systems to third-party service providers will continue to be a key growth driver for the leading participants in our industry as electric utilities continue to focus more on power generation; |
| • | our belief that our construction and engineering footprint includes the areas of the U.S. power grid that are the most susceptible to damage caused by severe weather, such as hurricanes, tornadoes, tropical storms, ice storms and wind storms; |
| • | our belief that our management team’s deep industry knowledge, field experience and relationships extend our operating capabilities, improve the quality of our services, facilitate access to clients and enhance our strong reputation in the industry; |
| • | our belief that we have a favorable competitive position in our markets due in large part to our ability to execute with respect to each of the following factors, which are the principal competitive factors in the end markets in which we operate: (i) diversified services, including the ability to offer turnkey EPC project services; (ii) experienced management and employees; (iii) customer relationships and industry reputation; (iv) responsiveness in emergency restoration situations; (v) availability of fleet and specialty equipment; (vi) adequate financial resources and bonding capacity; (vii) geographic breadth and presence in customer markets; (viii) pricing of services, particularly under MSA constraints; and (ix) safety concerns of our crews, customers and the general public; |
| • | our expectation that a substantial portion of our total revenues will continue to be derived from a limited group of customers given the composition of the investor-owned, municipal and co-operative electric utilities in our geographic market; |
| • | our belief that we have a good relationship with our employees; |
| • | our belief that we have an advantage relative to our competitors in our ability to mobilize, outfit and manage the equipment necessary to perform our construction work, given that we own the majority of our fleet; |
| • | our belief that the capability of our maintenance team to operate 24 hours a day, both at maintenance centers and in the field, and provide high-quality custom repair work and expedient service in maintaining a fleet poised for mobilization gives us a competitive advantage, with stronger local presence, lower fuel costs and more efficient equipment maintenance; |
| • | our belief that our trademarks are a valuable part of our business; |
| • | our belief that we are in material compliance with applicable regulatory requirements and have all material licenses required to conduct our operations; |
| • | our expectation that costs to maintain environmental compliance and/or to address environmental issues will not have a material adverse effect on our results of operations, cash flows or financial condition; |
| • | our intention to continue to retain any future earnings in the foreseeable future to finance the growth, development and expansion of our business and service debt, rather than declaring or paying cash dividends on our common stock; |
| • | our belief that our facilities are adequate for our current operations; |
41
Table of Contents
| • | our belief that the lawsuits, claims and other legal proceedings that arise in the ordinary course of business will not be expected to have, individually or in the aggregate, a material adverse effect on our results of operations, financial position or cash flows; |
| • | our belief that variances in the final outcome of self-insured claims from estimates due to the type and severity of the injury, costs of medical claims and uncertainties surrounding the litigation process will not have a material adverse effect on our financial condition or liquidity; |
| • | our belief that our cash flow from operations, available cash and cash equivalents, and borrowings available under our revolving credit facility will be adequate to meet our liquidity needs in the ordinary course of business for the foreseeable future; |
| • | our expectation that our ability to satisfy our obligations or to fund planned capital expenditures will depend on our future performance, and our belief that this is subject to a certain extent to general economic, financial, competitive, legislative, regulatory and other factors beyond our control; |
| • | the possibility that if we fail to comply with the covenants contained in our revolving credit facility, we may be unable to access our revolving credit facility upon which we depend for letters of credit and other short-term borrowings, and that this would have a negative impact on our liquidity and require us to obtain alternative short-term financing; |
| • | our belief that it is unlikely that any material claims will be made under a letter of credit in the foreseeable future; |
| • | our belief that it is unlikely that we will have to fund significant claims under our surety arrangements in the foreseeable future; |
| • | our expectation that, if diesel prices rise, our gross profit and operating income could be negatively affected due to additional costs that may not be fully recovered through increases in prices to customers; |
| • | our belief that the financial institutions with whom we maintain substantially all of our cash investments are high credit quality financial institutions; |
| • | our expectation that the net amount of the existing losses in OCI at June 30, 2014 reclassified into net income over the next twelve months will be approximately $119,000; and |
| • | our belief that any future indemnity claims against us would not have a material adverse effect on our results of operations, financial position or cash flows. |
Except as required under the federal securities laws and the rules and regulations of the SEC, we do not have any intention or obligation to update publicly any forward-looking statements after we file this Annual Report on Form 10-K, whether as a result of new information, future events or otherwise.
42
Table of Contents
| ITEM 7A. | QUANTITATIVE AND QUALITATIVE DISCLOSURES ABOUT MARKET RISK |
Interest Rate Risk
We are exposed to market risk related to changes in interest rates on borrowings under our revolving credit facility, which bears interest based on the London Interbank Offered Rate (“LIBOR”), plus an applicable margin dependent upon our total leverage ratio. We use derivative financial instruments to manage exposure to fluctuations in interest rates on our revolving credit facility. These derivative financial instruments, which are currently all swap agreements, are not entered into for trading or speculative purposes. A swap agreement is a contract to exchange a floating rate for a fixed rate without the exchange of the underlying notional amount.
We periodically enter into interest rate swaps to decrease our exposure to interest rate volatility. We currently have five active interest rate swaps with notional amounts totaling $95 million each ranging from $10 million to $25 million. Fixed rates range from 0.40% to 0.45%. Based on our leverage ratio and the one-month LIBOR rate at June 30, 2014, these swap agreements effectively fix the interest rate at 3.46% for $95 million of our revolving credit facility. The fair value of the interest rate swaps at June 30, 2014 was reflected on the balance sheet in accrued expenses and other for $0.2 million.
Diesel Fuel Risk
We have a large fleet of vehicles and equipment that primarily use diesel fuel. As a result, we have market risk for changes in diesel fuel prices. If diesel prices rise, our gross profit and operating income could be negatively affected due to additional costs that may not be fully recovered through increases in prices to customers.
We periodically enter into diesel fuel swaps and fixed-price forward contracts to decrease our price volatility. As of June 30, 2014, approximately 56% of our diesel fuel usage was hedged primarily over the next twelve months with prices ranging from $3.86 to $3.99 per gallon at a weighted-average price of $3.90 per gallon. Our goal is to maintain our hedged positions at 40% to 60% of our annual volumes on a rolling basis. The fair value of the diesel fuel swaps at June 30, 2014 was reflected on the balance sheet in prepaid expenses and other for $0.1 million.
Based on our projected fuel usage for fiscal 2015 and after including the impact of our active diesel fuel swaps, a $0.50 change in the price per gallon of diesel fuel would change our annual cost of operations by approximately $1.5 million. Actual changes in costs of operations may differ materially from the hypothetical assumptions used in computing this exposure.
Concentration of Credit Risk
We are subject to concentrations of credit risk related primarily to our cash and cash equivalents and accounts receivable. We maintain substantially all of our cash equivalents with what we believe to be high credit quality financial institutions. We grant credit under normal payment terms, generally without collateral, to our customers, which include electric power companies, governmental entities, general contractors and builders, and owners and managers of commercial and industrial properties located in the United States. Consequently, we are subject to potential credit risk related to changes in business and economic factors throughout the United States. However, we generally have certain statutory lien rights with respect to services provided.
43
Table of Contents
| ITEM 8. | FINANCIAL STATEMENTS AND SUPPLEMENTARY DATA |
INDEX TO CONSOLIDATED FINANCIAL STATEMENTS
| Page | ||||
| Management’s Report on Internal Control over Financial Reporting |
45 | |||
| Reports of Independent Registered Public Accounting Firm on: |
||||
| 46 | ||||
| 48 | ||||
| 49 | ||||
| 50 | ||||
| 51 | ||||
| 52 | ||||
| 53 | ||||
| 54 | ||||
44
Table of Contents
Management’s Report on Internal Control over Financial Reporting
Our management is responsible for establishing and maintaining adequate internal control over financial reporting. Our internal control over financial reporting is a process designed to provide reasonable assurance regarding the reliability of financial reporting and the preparation of financial statements for external purposes in accordance with generally accepted accounting principles.
Our internal control over financial reporting includes policies and procedures that (1) pertain to the maintenance of records that, in reasonable detail, accurately and fairly reflect transactions and dispositions of assets; (2) provide reasonable assurances that transactions are recorded as necessary to permit preparation of financial statements in accordance with generally accepted accounting principles, and that receipts and expenditures are being made only in accordance with authorizations of management and the board of directors of Pike; and (3) provide reasonable assurance regarding prevention or timely detection of unauthorized acquisition, use or disposition of our assets that could have a material effect on our financial statements.
Because of its inherent limitations, internal control over financial reporting may not prevent or detect misstatements. Also, projections of any evaluation of effectiveness to future periods are subject to the risk that controls may become inadequate because of changes in conditions, or that the degree of compliance with the policies or procedures may deteriorate.
Management assessed the effectiveness of our internal control over financial reporting as of June 30, 2014. In making this assessment, management used the criteria set forth by the Committee of Sponsoring Organizations of the Treadway Commission (1992 framework) (COSO) in Internal Control—Integrated Framework. Based on our assessment and those criteria, management has concluded that we maintained effective internal control over financial reporting as of June 30, 2014.
Our independent registered public accounting firm, KPMG LLP, audited the effectiveness of our internal control over financial reporting. KPMG LLP has issued their report on the effectiveness of internal control over financial reporting, which is included in this Annual Report on Form 10-K.
45
Table of Contents
Report of Independent Registered Public Accounting Firm
The Board of Directors and Shareholders of Pike Corporation
We have audited the accompanying consolidated balance sheet of Pike Corporation as of June 30, 2013, and the related consolidated statements of income, comprehensive income, shareholders’ equity, and cash flows for each of the two years in the period ended June 30, 2013. Our audits also included the financial statement schedule for each of the two years in the period ended June 30, 2013 listed in the Index at Item 15(a)(2). These financial statements and schedule are the responsibility of the Company’s management. Our responsibility is to express an opinion on these financial statements and schedule based on our audits.
We conducted our audits in accordance with the standards of the Public Company Accounting Oversight Board (United States). Those standards require that we plan and perform the audit to obtain reasonable assurance about whether the financial statements are free of material misstatement. An audit includes examining, on a test basis, evidence supporting the amounts and disclosures in the financial statements. An audit also includes assessing the accounting principles used and significant estimates made by management, as well as evaluating the overall financial statement presentation. We believe that our audits provide a reasonable basis for our opinion.
In our opinion, the financial statements referred to above present fairly, in all material respects, the consolidated financial position of Pike Corporation at June 30, 2013, and the consolidated results of its operations and its cash flows for each of the two years in the period ended June 30, 2013, in conformity with U.S. generally accepted accounting principles. Also, in our opinion, the related financial statement schedule, when considered in relation to the basic financial statements taken as a whole, presents fairly in all material respects the information for each of the two years ended June 30, 2013 set forth therein.
/s/ Ernst & Young LLP
Charlotte, North Carolina
September 4, 2013,
except for Note 19, as to which the date is
September 12, 2014
46
Table of Contents
Report of Independent Registered Public Accounting Firm
The Board of Directors and Shareholders
Pike Corporation:
We have audited the accompanying consolidated balance sheet of Pike Corporation and subsidiaries as of June 30, 2014, and the related consolidated statements of income, comprehensive income, shareholders’ equity, and cash flows for the year ended June 30, 2014. In connection with our audit of the consolidated financial statements, we also have audited financial statement schedule “Valuation and Qualifying Accounts”. These consolidated financial statements and financial statement schedule are the responsibility of the Company’s management. Our responsibility is to express an opinion on these consolidated financial statements and financial statement schedule based on our audit.
We conducted our audit in accordance with the standards of the Public Company Accounting Oversight Board (United States). Those standards require that we plan and perform the audit to obtain reasonable assurance about whether the financial statements are free of material misstatement. An audit includes examining, on a test basis, evidence supporting the amounts and disclosures in the financial statements. An audit also includes assessing the accounting principles used and significant estimates made by management, as well as evaluating the overall financial statement presentation. We believe that our audit provides a reasonable basis for our opinion.
In our opinion, the consolidated financial statements referred to above present fairly, in all material respects, the financial position of Pike Corporation and subsidiaries as of June 30, 2014, and the results of their operations and their cash flows for the year ended June 30, 2014, in conformity with U.S. generally accepted accounting principles. Also in our opinion, the related financial statement schedules, when considered in relation to the basic consolidated financial statements taken as a whole, present fairly, in all material respects, the information set forth therein.
We also have audited, in accordance with the standards of the Public Company Accounting Oversight Board (United States), Pike Corporation’s internal control over financial reporting as of June 30, 2014, based on criteria established in Internal Control – Integrated Framework issued by the Committee of Sponsoring Organizations of the Treadway Commission (COSO), and our report dated September 12, 2014, expressed an unqualified opinion on the effectiveness of the Company’s internal control over financial reporting.
/s/ KPMG LLP
Greensboro, North Carolina
September 12, 2014
47
Table of Contents
Report of Independent Registered Public Accounting Firm
The Board of Directors and Shareholders
Pike Corporation:
We have audited Pike Corporation’s internal control over financial reporting as of June 30, 2014, based on criteria established in Internal Control – Integrated Framework (1992) issued by the Committee of Sponsoring Organizations of the Treadway Commission (COSO). Pike Corporation’s management is responsible for maintaining effective internal control over financial reporting and for its assessment of the effectiveness of internal control over financial reporting, included in the accompanying Management’s Report on Internal Control over Financial Reporting. Our responsibility is to express an opinion on the Company’s internal control over financial reporting based on our audit.
We conducted our audit in accordance with the standards of the Public Company Accounting Oversight Board (United States). Those standards require that we plan and perform the audit to obtain reasonable assurance about whether effective internal control over financial reporting was maintained in all material respects. Our audit included obtaining an understanding of internal control over financial reporting, assessing the risk that a material weakness exists, and testing and evaluating the design and operating effectiveness of internal control based on the assessed risk. Our audit also included performing such other procedures as we considered necessary in the circumstances. We believe that our audit provides a reasonable basis for our opinion.
A company’s internal control over financial reporting is a process designed to provide reasonable assurance regarding the reliability of financial reporting and the preparation of financial statements for external purposes in accordance with generally accepted accounting principles. A company’s internal control over financial reporting includes those policies and procedures that (1) pertain to the maintenance of records that, in reasonable detail, accurately and fairly reflect the transactions and dispositions of the assets of the company; (2) provide reasonable assurance that transactions are recorded as necessary to permit preparation of financial statements in accordance with generally accepted accounting principles, and that receipts and expenditures of the company are being made only in accordance with authorizations of management and directors of the company; and (3) provide reasonable assurance regarding prevention or timely detection of unauthorized acquisition, use, or disposition of the company’s assets that could have a material effect on the financial statements.
Because of its inherent limitations, internal control over financial reporting may not prevent or detect misstatements. Also, projections of any evaluation of effectiveness to future periods are subject to the risk that controls may become inadequate because of changes in conditions, or that the degree of compliance with the policies or procedures may deteriorate.
In our opinion, Pike Corporation maintained, in all material respects, effective internal control over financial reporting as of June 30, 2014, based on criteria established in Internal Control – Integrated Framework (1992) issued by the Committee of Sponsoring Organizations of the Treadway Commission (COSO).
We also have audited, in accordance with the standards of the Public Company Accounting Oversight Board (United States), the consolidated balance sheet of Pike Corporation and subsidiaries as of June 30, 2014, and the related consolidated statements of income, comprehensive income, shareholders’ equity, and cash flows for the year ended June 30, 2014, and our report dated September 12, 2014 expressed an unqualified opinion on those consolidated financial statements.
/s/ KPMG LLP
Greensboro, North Carolina
September 12, 2014
48
Table of Contents
PIKE CORPORATION
(in thousands, except par value amounts)
| June 30, | ||||||||
| 2014 | 2013 | |||||||
| ASSETS | ||||||||
| Current assets: |
||||||||
| Cash and cash equivalents |
$ | 989 | $ | 2,578 | ||||
| Accounts receivable from customers, net |
96,850 | 104,585 | ||||||
| Costs and estimated earnings in excess of billings on uncompleted contracts |
85,563 | 71,248 | ||||||
| Inventories |
12,373 | 14,396 | ||||||
| Prepaid expenses and other |
7,029 | 9,914 | ||||||
| Deferred income taxes |
10,304 | 8,720 | ||||||
|
|
|
|
|
|||||
| Total current assets |
213,108 | 211,441 | ||||||
| Property and equipment, net |
177,743 | 179,928 | ||||||
| Goodwill |
153,668 | 153,668 | ||||||
| Other intangibles, net |
67,463 | 74,841 | ||||||
| Deferred loan costs, net |
1,111 | 1,561 | ||||||
| Other assets |
3,059 | 2,335 | ||||||
|
|
|
|
|
|||||
| Total assets |
$ | 616,152 | $ | 623,774 | ||||
|
|
|
|
|
|||||
| LIABILITIES AND SHAREHOLDERS’ EQUITY | ||||||||
| Current liabilities: |
||||||||
| Accounts payable |
$ | 34,961 | $ | 33,500 | ||||
| Accrued compensation |
26,697 | 30,468 | ||||||
| Billings in excess of costs and estimated earnings on uncompleted contracts |
6,007 | 6,235 | ||||||
| Accrued expenses and other |
10,269 | 5,908 | ||||||
| Current portion of insurance and claim accruals |
10,372 | 12,121 | ||||||
|
|
|
|
|
|||||
| Total current liabilities |
88,306 | 88,232 | ||||||
| Revolving credit facility |
197,000 | 221,000 | ||||||
| Insurance and claim accruals, net of current portion |
4,720 | 4,958 | ||||||
| Deferred compensation, net of current portion |
7,415 | 6,431 | ||||||
| Deferred income taxes |
56,392 | 58,402 | ||||||
| Other liabilities |
3,625 | 2,916 | ||||||
| Commitments and contingencies |
||||||||
| Shareholders’ equity: |
||||||||
| Preferred stock, par value $0.001 per share; 100,000 authorized shares; no shares issued and outstanding |
— | — | ||||||
| Common stock, par value $0.001 per share; 100,000 authorized shares; 31,939 and 31,719 shares issued and outstanding at June 30, 2014 and June 30, 2013, respectively |
6,425 | 6,424 | ||||||
| Additional paid-in capital |
180,255 | 176,988 | ||||||
| Accumulated other comprehensive loss, net of taxes |
(119 | ) | (47 | ) | ||||
| Retained earnings |
72,133 | 58,470 | ||||||
|
|
|
|
|
|||||
| Total shareholders’ equity |
258,694 | 241,835 | ||||||
|
|
|
|
|
|||||
| Total liabilities and shareholders’ equity |
$ | 616,152 | $ | 623,774 | ||||
|
|
|
|
|
|||||
The accompanying notes are an integral part of these consolidated financial statements.
49
Table of Contents
PIKE CORPORATION
CONSOLIDATED STATEMENTS OF INCOME
(in thousands, except per share amounts)
| Fiscal Year Ended June 30, | ||||||||||||
| 2014 | 2013 | 2012 | ||||||||||
| Revenues |
$ | 810,660 | $ | 918,691 | $ | 685,169 | ||||||
| Cost of operations |
706,929 | 771,475 | 593,478 | |||||||||
|
|
|
|
|
|
|
|||||||
| Gross profit |
103,731 | 147,216 | 91,691 | |||||||||
| General and administrative expenses |
74,894 | 75,579 | 66,219 | |||||||||
| Secondary offering and other related costs |
— | 4,138 | — | |||||||||
| Gain on sale of property and equipment |
(1,968 | ) | (584 | ) | (626 | ) | ||||||
|
|
|
|
|
|
|
|||||||
| Income from operations |
30,805 | 68,083 | 26,098 | |||||||||
| Other expense (income): |
||||||||||||
| Interest expense |
8,187 | 7,384 | 7,304 | |||||||||
| Other, net |
(349 | ) | (127 | ) | (63 | ) | ||||||
|
|
|
|
|
|
|
|||||||
| Total other expense |
7,838 | 7,257 | 7,241 | |||||||||
|
|
|
|
|
|
|
|||||||
| Income before income taxes |
22,967 | 60,826 | 18,857 | |||||||||
| Income tax expense |
9,304 | 24,633 | 7,974 | |||||||||
|
|
|
|
|
|
|
|||||||
| Net income |
$ | 13,663 | $ | 36,193 | $ | 10,883 | ||||||
|
|
|
|
|
|
|
|||||||
| Earnings per share: |
||||||||||||
| Basic |
$ | 0.43 | $ | 1.04 | $ | 0.31 | ||||||
|
|
|
|
|
|
|
|||||||
| Diluted |
$ | 0.42 | $ | 1.03 | $ | 0.31 | ||||||
|
|
|
|
|
|
|
|||||||
| Weighted average shares used in computing earnings per share: |
||||||||||||
| Basic |
31,830 | 34,777 | 34,678 | |||||||||
|
|
|
|
|
|
|
|||||||
| Diluted |
32,191 | 35,057 | 35,111 | |||||||||
|
|
|
|
|
|
|
|||||||
| Dividends per share: |
$ | — | $ | 1.00 | $ | — | ||||||
|
|
|
|
|
|
|
|||||||
The accompanying notes are an integral part of these consolidated financial statements.
50
Table of Contents
PIKE CORPORATION
CONSOLIDATED STATEMENTS OF COMPREHENSIVE INCOME
(in thousands)
| Fiscal Year Ended June 30, | ||||||||||||
| 2014 | 2013 | 2012 | ||||||||||
| Net income |
$ | 13,663 | $ | 36,193 | $ | 10,883 | ||||||
| Other comprehensive (loss) income: |
||||||||||||
| Interest rate cash flow hedges: |
||||||||||||
| Change in fair value arising during the year, net of income taxes of ($131), ($82) and ($11), respectively |
(205 | ) | (129 | ) | (17 | ) | ||||||
| Reclassification adjustments included in net income, net of income taxes of $85, $52 and $125, respectively |
133 | 82 | 195 | |||||||||
|
|
|
|
|
|
|
|||||||
| Total other comprehensive (loss) income |
(72 | ) | (47 | ) | 178 | |||||||
|
|
|
|
|
|
|
|||||||
| Comprehensive income |
$ | 13,591 | $ | 36,146 | $ | 11,061 | ||||||
|
|
|
|
|
|
|
|||||||
The accompanying notes are an integral part of these consolidated financial statements.
51
Table of Contents
PIKE CORPORATION
CONSOLIDATED STATEMENTS OF SHAREHOLDERS’ EQUITY
(in thousands)
| Common Stock Shares |
Common Stock |
Additional Paid-In Capital |
Other Comprehensive Income (Loss) |
Retained Earnings |
Total Shareholders’ Equity |
|||||||||||||||||||
| Balance, June 30, 2011 |
33,666 | $ | 6,427 | $ | 161,586 | $ | (178 | ) | $ | 86,554 | $ | 254,389 | ||||||||||||
| Employee stock compensation plans, net |
403 | — | 3,212 | — | — | 3,212 | ||||||||||||||||||
| Issuance of common stock in connection with Pine Valley Power, Inc. acquisition |
983 | 1 | 8,262 | — | — | 8,263 | ||||||||||||||||||
| Comprehensive income: |
||||||||||||||||||||||||
| Net income |
— | — | — | — | 10,883 | 10,883 | ||||||||||||||||||
| Gain on derivative instruments, net of income taxes of $114 |
— | — | — | 178 | — | 178 | ||||||||||||||||||
|
|
|
|||||||||||||||||||||||
| Total comprehensive income |
— | — | — | 178 | 10,883 | 11,061 | ||||||||||||||||||
|
|
|
|
|
|
|
|
|
|
|
|
|
|||||||||||||
| Balance, June 30, 2012 |
35,052 | $ | 6,428 | $ | 173,060 | $ | — | $ | 97,437 | $ | 276,925 | |||||||||||||
| Employee stock compensation plans, net |
328 | — | 3,928 | — | — | 3,928 | ||||||||||||||||||
| Special cash dividend declared and paid |
— | — | — | — | (35,164 | ) | (35,164 | ) | ||||||||||||||||
| Repurchase and retirement of common stock |
(3,661 | ) | (4 | ) | — | — | (39,996 | ) | (40,000 | ) | ||||||||||||||
| Comprehensive income: |
||||||||||||||||||||||||
| Net income |
— | — | — | — | 36,193 | 36,193 | ||||||||||||||||||
| Loss on derivative instruments, net of income taxes of ($30) |
— | — | — | (47 | ) | — | (47 | ) | ||||||||||||||||
|
|
|
|||||||||||||||||||||||
| Total comprehensive income |
— | — | — | (47 | ) | 36,193 | 36,146 | |||||||||||||||||
|
|
|
|
|
|
|
|
|
|
|
|
|
|||||||||||||
| Balance, June 30, 2013 |
31,719 | $ | 6,424 | $ | 176,988 | $ | (47 | ) | $ | 58,470 | $ | 241,835 | ||||||||||||
| Employee stock compensation plans, net |
220 | 1 | 3,267 | — | — | 3,268 | ||||||||||||||||||
| Comprehensive income: |
||||||||||||||||||||||||
| Net income |
— | — | — | — | 13,663 | 13,663 | ||||||||||||||||||
| Loss on derivative instruments, net of income taxes of ($46) |
— | — | — | (72 | ) | — | (72 | ) | ||||||||||||||||
|
|
|
|||||||||||||||||||||||
| Total comprehensive income |
— | — | — | (72 | ) | 13,663 | 13,591 | |||||||||||||||||
|
|
|
|
|
|
|
|
|
|
|
|
|
|||||||||||||
| Balance, June 30, 2014 |
31,939 | $ | 6,425 | $ | 180,255 | $ | (119 | ) | $ | 72,133 | $ | 258,694 | ||||||||||||
|
|
|
|
|
|
|
|
|
|
|
|
|
|||||||||||||
The accompanying notes are an integral part of these consolidated financial statements.
52
Table of Contents
PIKE CORPORATION
CONSOLIDATED STATEMENTS OF CASH FLOWS
(in thousands)
| Fiscal Year Ended June 30, | ||||||||||||
| 2014 | 2013 | 2012 | ||||||||||
| Cash flows from operating activities: |
||||||||||||
| Net income |
$ | 13,663 | $ | 36,193 | $ | 10,883 | ||||||
| Adjustments to reconcile net income to net cash provided by operating activities: |
||||||||||||
| Depreciation and amortization |
39,503 | 41,431 | 38,254 | |||||||||
| Non-cash interest expense |
1,123 | 994 | 2,698 | |||||||||
| Deferred income taxes |
(3,470 | ) | (1,150 | ) | (952 | ) | ||||||
| Gain on sale of property and equipment |
(1,968 | ) | (584 | ) | (626 | ) | ||||||
| Equity compensation expense |
3,481 | 3,684 | 3,925 | |||||||||
| Excess tax benefit from stock-based compensation |
(123 | ) | (117 | ) | (696 | ) | ||||||
| Changes in operating assets and liabilities: |
||||||||||||
| Accounts receivable and costs and estimated earnings in excess of billings on uncompleted contracts |
(6,580 | ) | (5,083 | ) | (24,047 | ) | ||||||
| Inventories, prepaid expenses and other |
3,626 | 264 | 388 | |||||||||
| Insurance and claim accruals |
(1,987 | ) | 1,598 | (3,666 | ) | |||||||
| Accounts payable and other |
1,618 | 5,555 | 1,197 | |||||||||
| Deferred compensation |
— | — | (1,659 | ) | ||||||||
|
|
|
|
|
|
|
|||||||
| Net cash provided by operating activities |
48,886 | 82,785 | 25,699 | |||||||||
| Cash flows from investing activities: |
||||||||||||
| Purchases of property and equipment |
(32,224 | ) | (40,355 | ) | (33,852 | ) | ||||||
| Business acquisitions, net of cash acquired |
— | (69,654 | ) | (16,806 | ) | |||||||
| Net proceeds from sale of property and equipment |
5,704 | 4,088 | 5,110 | |||||||||
|
|
|
|
|
|
|
|||||||
| Net cash used in investing activities |
(26,520 | ) | (105,921 | ) | (45,548 | ) | ||||||
| Cash flows from financing activities: |
||||||||||||
| Principal payments on long-term debt |
— | — | (99,000 | ) | ||||||||
| Borrowings under prior revolving credit facility |
— | — | 37,700 | |||||||||
| Repayments under prior revolving credit facility |
— | — | (37,700 | ) | ||||||||
| Borrowings under existing revolving credit facility |
149,500 | 370,000 | 217,420 | |||||||||
| Repayments under existing revolving credit facility |
(173,500 | ) | (272,000 | ) | (94,420 | ) | ||||||
| Special cash dividend declared and paid |
— | (35,164 | ) | — | ||||||||
| Repurchase of common stock |
— | (40,000 | ) | — | ||||||||
| Stock option and employee stock purchase activity, net |
341 | 1,297 | (1,001 | ) | ||||||||
| Excess tax benefit from stock-based compensation |
123 | 117 | 696 | |||||||||
| Deferred loan costs |
(419 | ) | (137 | ) | (2,556 | ) | ||||||
|
|
|
|
|
|
|
|||||||
| Net cash (used in) provided by financing activities |
(23,955 | ) | 24,113 | 21,139 | ||||||||
|
|
|
|
|
|
|
|||||||
| Net (decrease) increase in cash and cash equivalents |
(1,589 | ) | 977 | 1,290 | ||||||||
| Cash and cash equivalents beginning of year |
2,578 | 1,601 | 311 | |||||||||
|
|
|
|
|
|
|
|||||||
| Cash and cash equivalents end of year |
$ | 989 | $ | 2,578 | $ | 1,601 | ||||||
|
|
|
|
|
|
|
|||||||
The accompanying notes are an integral part of these consolidated financial statements.
53
Table of Contents
PIKE CORPORATION
NOTES TO CONSOLIDATED FINANCIAL STATEMENTS
For the fiscal years ended June 30, 2014, 2013 and 2012
(in thousands, except per share amounts)
| 1. | Organization and Business |
On November 5, 2013, Pike Electric Corporation changed its state of incorporation from Delaware to North Carolina (the “Reincorporation”). The Reincorporation was effected by merging Pike Electric Corporation, a Delaware corporation, with and into Pike Corporation, a North Carolina corporation and its wholly-owned subsidiary. In connection with the Reincorporation, Pike Electric Corporation changed its name to “Pike Corporation.” The Reincorporation did not result in any change in the business, management, fiscal year, accounting, location of the principal executive offices or other facilities, capitalization, assets or liabilities of Pike Electric Corporation.
As used in this section, unless the context requires otherwise, the terms “Pike,” the “Company,” “we,” “us” and “our” refer to Pike Corporation and its subsidiaries and all predecessors of Pike Corporation and its subsidiaries.
We are one of the largest providers of construction and engineering services for investor-owned, municipal and co-operative electric utilities in the United States. Since our founding in 1945, we have evolved from a specialty non-unionized contractor for electric utilities focused on the distribution sector in the southeastern United States to one of the nation’s largest specialty construction and engineering firms servicing over 300 customers. Our comprehensive suite of energy and communication solutions includes facilities planning and siting, permitting, engineering, design, installation, maintenance and repair of power delivery systems, including renewables (primarily ground-based) and utility-grade solar construction projects, and storm-related services. As a result of the acquisition of Synergetic Design Holdings, Inc. and its subsidiary UC Synergetic, Inc. (together “UCS”) expanding the size and scope of our engineering business, we decided in the first quarter of fiscal 2013 to change our reportable segments. As a result of these changes, we operated our business as two reportable segments: Construction and All Other Operations. On January 1, 2014, as part of the integration of our engineering businesses, Synergetic Design Holdings, Inc. merged with and into Pike Enterprises, Inc., a wholly-owned subsidiary of the Company, and UC Synergetic, Inc. merged with and into Pike Energy Solutions, LLC, the surviving entity of which was named UC Synergetic, LLC. In order to properly align our segments with our current financial reporting structure, we changed the name of our All Other Operations segment to Engineering. Prior fiscal year segment information has been revised to conform to the current-year presentation. See Note 19 for further information on our segments.
We monitor revenue by two categories of services: core and storm-related. We use this breakdown because core services represent ongoing service revenues, most of which are generated by our customers’ recurring maintenance needs, and storm-related revenues represent additional revenue opportunities that depend on weather conditions.
The following table sets forth our revenue by type of service for the fiscal years indicated:
| Fiscal Year Ended June 30, | ||||||||||||||||||||||||
| 2014 | 2013 | 2012 | ||||||||||||||||||||||
| Core services |
$ | 743,229 | 91.7 | % | $ | 751,364 | 81.8 | % | $ | 614,623 | 89.7 | % | ||||||||||||
| Storm-related services |
67,431 | 8.3 | % | 167,327 | 18.2 | % | 70,546 | 10.3 | % | |||||||||||||||
|
|
|
|
|
|
|
|
|
|
|
|
|
|||||||||||||
| Total |
$ | 810,660 | 100.0 | % | $ | 918,691 | 100.0 | % | $ | 685,169 | 100.0 | % | ||||||||||||
|
|
|
|
|
|
|
|
|
|
|
|
|
|||||||||||||
54
Table of Contents
| 2. | Summary of Significant Accounting Policies |
Principles of Consolidation
The consolidated financial statements include the accounts of Pike Corporation and its wholly-owned subsidiaries. All intercompany amounts and transactions have been eliminated in consolidation.
Reclassifications
Certain reclassifications have been made to the amounts reported in these notes to consolidated financial statements for the prior years to conform to the current year presentation.
Use of Estimates
The preparation of financial statements in conformity with accounting principles generally accepted in the United States (“U.S. GAAP”) requires management to make estimates and assumptions that affect the reported amounts of assets and liabilities and disclosure of contingent assets and liabilities at the date of the financial statements and the reported amounts of revenues and expenses during the reporting period. Significant items subject to such estimates and assumptions include the allowance for doubtful accounts; recognition of revenue for costs and estimated earnings in excess of billings on uncompleted contracts; future cash flows associated with long-lived assets; useful lives and salvage values of fixed assets for depreciation purposes; workers’ compensation and employee benefit liabilities; purchase price allocations; fair value assumptions in analyzing goodwill; income taxes; and fair values of financial instruments. Due to the subjective nature of these estimates, actual results could differ from those estimates.
Cash and Cash Equivalents
We consider all highly-liquid investments with an original maturity of three months or less at the date of purchase to be cash equivalents.
Revenue Recognition
Revenues from service arrangements are recognized when services are performed. We recognize revenue from hourly services based on actual labor and equipment time completed and on materials when billable to our customers. We recognize revenue on unit-based services as the units are completed. We recognize the full amount of any estimated loss on site-specific unit projects if estimated costs to complete the remaining units for the project exceed the revenue to be received from such units.
Revenues for fixed-price contracts are recognized using the percentage-of-completion method, measured by the percentage of costs incurred to date to total estimated costs for each contract. Contract costs include all direct material, labor and subcontract costs, as well as indirect costs related to contract performance, such as indirect labor, tools, repairs and depreciation. The cost estimation process is based on the professional knowledge and experience of our engineers, project managers, field construction supervisors, operations management and financial professionals. Changes in job performance, job conditions, estimated profitability and final contract settlements may result in revisions to costs and income and their effects are recognized in the period in which the revisions are determined. At the time a loss on a contract becomes known, the entire amount of the estimated ultimate loss is accrued.
The current asset “Costs and estimated earnings in excess of billings on uncompleted contracts” represents revenues recognized in excess of amounts billed. The current liability “Billings in excess of costs and estimated earnings on uncompleted contracts” represents billings in excess of revenues recognized.
Allowance for Doubtful Accounts
We provide an allowance for doubtful accounts that represents an estimate of uncollectible accounts receivable. The determination of the allowance includes certain judgments and estimates including our customers’ willingness or ability to pay and our ongoing relationship with the customer. In certain instances, primarily relating to storm-related work and other high-volume billing situations, billed amounts may differ from ultimately collected amounts. We incorporate our historical experience with our customers into the estimation of the allowance for doubtful accounts. These amounts are continuously monitored as additional information is obtained. Accounts receivable are primarily due from customers located within the United States and include balances billed to customers pursuant to retainage provisions in certain contracts that are due upon completion of the contracts and acceptance by the
55
Table of Contents
customer. These amounts are generally collected within one year. Any material change in our customers’ business or cash flows could affect our ability to collect amounts due. Receivable amounts pertaining to retainage provisions with customers totaled $2,458 and $7,527 at June 30, 2014 and 2013, respectively.
Accounts receivable from customers, net and costs and estimated earnings in excess of billings on uncompleted contracts included allowances for doubtful accounts of $5,531 and $1,894 at June 30, 2014 and 2013, respectively. We recorded bad debt expense (recovery) of $1,251, ($54) and 43 for fiscal 2014, 2013 and 2012, respectively.
Inventories
Inventories consist of equipment in process to be sold under sale-leaseback arrangements, unbilled materials purchased for engineering, procurement and construction (“EPC”) projects, machine parts, supplies, small tools and other materials used in the ordinary course of business and are stated at the lower of average cost or market.
Property and Equipment
Property and equipment is carried at cost. Replacements and improvements are capitalized when costs incurred for those purposes extend the useful life of the asset. Maintenance and repairs are expensed as incurred. Depreciation on capital assets is computed using the straight-line method. Internal and external costs incurred to acquire and create internal use software are capitalized and amortized over the useful life of the software. Capitalized software is included in property and equipment on the consolidated balance sheets. Our management makes assumptions regarding future conditions in determining estimated useful lives and potential salvage values, and reviews these assumptions at least annually. These assumptions impact the amount of depreciation expense recognized in the period and any gain or loss recognized once the asset is disposed of or classified as “held for sale.”
We review our property and equipment for impairment when events or changes in business conditions indicate the carrying value of the assets may not be recoverable. An impairment of assets classified as “held and used” exists if the sum of the undiscounted estimated future cash flows expected is less than the carrying value of the assets. If this measurement indicates a possible impairment, we compare the estimated fair value of the asset to the net book value to measure the impairment charge, if any. If the criteria for classifying an asset as “held for sale” have been met, we record the asset at the lower of carrying value or fair value, less estimated selling costs.
Goodwill and Other Intangible Assets
We test our goodwill for impairment annually or more frequently if events or circumstances indicate impairment may exist. Examples of such events or circumstances could include a significant change in business climate or a loss of significant customers. We complete our annual analysis of our reporting units as of the first day of our fourth fiscal quarter. For purposes of our fiscal 2014 analysis, we had four reporting units: non-union construction, union construction, energy delivery engineering and telecom engineering. In evaluating reporting units, we first consider our operating segments and related components in accordance with U.S. GAAP. We allocate goodwill to the reporting units that are expected to benefit from the synergies of the business combinations generating the goodwill. We apply a two-step fair value-based test to assess goodwill for impairment. The first step compares the fair values of the reporting units to their carrying amounts, including goodwill. If the carrying amount of any reporting unit exceeds its fair value, the second step is then performed. The second step compares the carrying amount of the reporting unit’s goodwill to the implied fair value of the goodwill. If the implied fair value of the goodwill is less than the carrying amount, an impairment loss would be recorded.
We determined the fair value of our reporting units based on the income approach, using a discounted cash flow model. The income approach was used because it has a more direct correlation to the specific economics of the reporting units than the market approach, which considers comparable companies and transactions that are comparable to the Company as a whole, but are not as comparable to the individual reporting units in terms of size, operational diversity, and geographic diversity. Under the income approach, the discounted cash flow model determines fair value based on the present value of projected cash flows over a specific projection period and a residual value related to future cash flows beyond the projection period. Both values are discounted using a rate which reflects our best estimate of the weighted-average cost of capital of a market participant, and is adjusted for appropriate risk factors. We perform sensitivity tests with respect to growth rates and discount rates used in the income approach.
56
Table of Contents
For our annual impairment analysis, we relied solely on the income approach. The income approach was used because it has a more direct correlation to the specific economics of the reporting units than the market approach which is based on multiples of companies that, although comparable to the Company as a whole, may not have the exact same risk factors as our reporting units and are not as comparable to the individual reporting units in terms of size, operational diversity and geographic diversity. The analysis indicated that, as of the first day of our fourth fiscal quarter, the fair values of each of our reporting units exceeded their respective carrying values in excess of 10%. For our analysis, we also considered various elements of an implied control premium in assessing the reasonableness of the reconciliation of the summation of the fair values of the invested capital of our four reporting units (with appropriate consideration of the interest bearing debt) to the Company’s overall market capitalization and our net book value. This analysis included (i) the current control premium being paid for companies with a similar market capitalization and within similar industries and (ii) certain synergies that a market participant buyer could realize, such as the elimination of potentially redundant costs. Based on this analysis, management determined that the resulting control premium implied in the annual impairment analysis was approximately 10%, which was within a reasonable range of current market conditions. Based on our annual impairment analysis, we concluded that goodwill was not impaired.
In addition to goodwill, we identify and value other intangible assets that we acquire in business combinations, such as customer arrangements, customer relationships, intellectual property and non-compete agreements, that arise from contractual or other legal rights or that are capable of being separated or divided from the acquired entity and sold, transferred, licensed, rented or exchanged. The fair value of identified intangible assets is based upon an estimate of the future economic benefits expected to result from ownership, which represents the amount at which the assets could be bought or sold in a current transaction between willing parties, that is, other than in a forced or liquidation sale. For customers with whom we have an existing relationship prior to the date of the transaction, we utilize assumptions that a marketplace participant would consider in estimating the fair value of customer relationships that an acquired entity had with our pre-existing customers in accordance with U.S. GAAP. The inputs into goodwill and intangible asset fair value calculations reflect our market assumptions and are not observable. Consequently, the inputs are considered to be Level 3 as specified in the fair value accounting guidance.
Intangible assets with definite lives are amortized over their estimated useful lives and are also reviewed for impairment if events or changes in circumstances indicate that their carrying amount may not be realizable. We have no intangibles with indefinite lives other than goodwill.
Inherent in valuation determinations related to goodwill and other intangible assets are significant judgments and estimates, including assumptions about our future revenue, profitability and cash flows, our operational plans, current economic indicators and market valuations. To the extent these assumptions are incorrect or there are declines in our business outlook, impairment charges may be recorded in future periods.
Insurance and Claim Accruals
The insurance and claim accruals are based on known facts, actuarial estimates and historical trends. We are partially self-insured for individual workers’ compensation, vehicle and general liability, and health insurance claims. To mitigate a portion of these risks, we maintain commercial insurance for individual workers’ compensation and vehicle and general liability claims exceeding $1,000. We also maintain commercial insurance for health insurance claims exceeding $500 per person on an annual basis. We determine the amount of our loss reserves and loss adjustment expenses for self-insured claims based on analyses prepared quarterly that use both company-specific and industry data, as well as general economic information. Our estimates for insurance loss exposures require us to monitor and evaluate our insurance claims throughout their life cycles. Using this data and our assumptions about the emerging trends, we estimate the size of ultimate claims. Our most significant assumptions in forming our estimates include the trend in loss costs, the expected consistency with prior fiscal year claims of the frequency and severity of claims incurred but not yet reported, changes in the timing of the reporting of losses from the loss date to the notification date, and expected costs to settle unpaid claims. We also monitor the reasonableness of the judgments made in the prior fiscal year’s estimates and adjust current year assumptions based on that analysis.
For the fiscal years ended June 30, 2014, 2013 and 2012, respectively, health care and casualty insurance and claims expense was $31,839, $33,313 and $32,545, respectively, and was included in cost of operations and general and administrative expenses in the consolidated statements of income.
57
Table of Contents
Collective Bargaining Agreements
Several of our subsidiaries are party to collective bargaining agreements with unions representing craftworkers performing field construction operations. The collective bargaining agreements expire at various times and have typically been renegotiated and renewed on terms similar to the ones contained in the expiring agreements. The agreements require those subsidiaries to pay specified wages, provide certain benefits to their respective union employees and contribute certain amounts to multi-employer pension plans and employee benefit trusts. These subsidiaries’ multi-employer pension plan contribution rates generally are specified in the collective bargaining agreements (usually on an annual basis), and contributions are made to the plans on a “pay-as-you-go” basis based on its union employee payrolls, which cannot be determined for future periods because the location and number of union employees that any such subsidiary employs at any given time and the plans in which they may participate vary depending on the projects we have ongoing at any time and the need for union resources in connection with those projects. If any of these subsidiaries withdrew from, or otherwise terminated its participation in, one or more multi-employer pension plans or if the plans were to otherwise become underfunded, we could be assessed liabilities for additional contributions related to the underfunding of these plans. We are not aware of any material amounts of withdrawal liability that have been incurred as a result of a withdrawal by any of our subsidiaries from any multi-employer defined benefit pension plans.
Stock-Based Compensation
Share-based payments are recognized in the consolidated financial statements based on their grant date fair values. Share-based compensation expense is recognized over the period the recipient is required to perform the services in exchange for the award (presumptively the vesting period). We value awards with graded vesting as single awards and recognize the related compensation expense using a straight-line attribution method. U.S. GAAP requires that excess tax benefits be reported as financing cash inflows, rather than as a reduction of taxes paid, which is included within operating cash flows.
Advertising and Promotion Costs
We expense advertising and promotion costs as incurred and these costs are included as a component of general and administrative expenses. Advertising and promotion costs for the fiscal years ended June 30, 2014, 2013 and 2012 were $505, $659 and $813, respectively.
Earnings Per Share
Basic earnings per share is computed by dividing net income or loss by the weighted-average number of common shares outstanding during the period. Diluted earnings per share is computed by dividing net income or loss by the weighted-average number of common shares outstanding during the period and potentially dilutive common stock equivalents. Potential common stock equivalents that have been issued by us relate to both outstanding stock options and restricted stock awards and are determined using the treasury stock method.
Deferred Loan Costs
Deferred loan costs are being amortized over the term of the related debt using the effective-interest method. Accumulated amortization was $2,002 and $1,133 at June 30, 2014 and 2013, respectively. Amortization expense was $869, $751 and $2,386 for the fiscal years ended June 30, 2014, 2013 and 2012, respectively. We also wrote-off approximately $1,700 of unamortized deferred loan costs as additional interest expense related to the prior credit facility in August 2011. Total deferred loan costs associated with entering into our existing revolving credit facility were approximately $1,800. We also capitalized deferred loan costs totaling approximately $138 and $823 for the fiscal years ended June 30, 2013 and 2012, respectively, relating to our accordion loan feature of our existing revolving credit facility exercised on June 27, 2012 and amounts borrowed to fund the UCS acquisition on July 2, 2012. On December 17, 2013, we entered into an amendment to our revolving credit facility to restate the leverage covenant ratio. Total costs associated with this amendment were approximately $419 for the fiscal year ended June 30, 2014.
58
Table of Contents
Derivative Instruments
We use certain derivative instruments to manage risk relating to diesel fuel and interest rate exposure. Our use of derivative instruments is currently limited to interest rate swaps and diesel fuel swaps. These instruments are generally structured as hedges of forecasted transactions or the variability of cash flows to be paid related to a recognized asset or liability (cash flow hedges). We do not enter into derivative instruments for trading or speculative purposes. However, we have entered into diesel fuel swaps to economically hedge future purchases of diesel fuel, for which we have not applied hedge accounting. All derivatives are recognized on the balance sheet at fair value. For those derivative instruments for which we intend to elect hedge accounting, on the date the derivative contract is entered into, we document all relationships between hedging instruments and hedged items, as well as our risk-management objective and strategy for undertaking the various hedge transactions. This process includes linking all derivatives designated as cash flow hedges to specific assets and liabilities on the consolidated balance sheet or to specific forecasted transactions. We also formally assess, both at the hedge’s inception and on an ongoing basis, whether the derivatives used in hedging transactions are highly effective in offsetting changes in cash flows of hedged items.
Changes in the fair value of derivatives that are highly effective, and are designated and qualify as cash flow hedges are recorded in other comprehensive income (loss) until earnings are affected by the variability in cash flows of the designated hedged item. Any changes in the fair value of a derivative where hedge accounting has not been elected or where there is ineffectiveness are recognized immediately in earnings. Cash flows related to derivatives are included in operating activities. See Note 8 for additional information.
Income Taxes
The liability method is used in accounting for income taxes. Under this method, deferred tax assets and liabilities are recognized for the future tax consequences attributable to the differences between the financial statement carrying amounts of existing assets and liabilities and their respective tax bases. Deferred tax assets and liabilities are measured using enacted tax rates expected to apply to taxable income in the years in which those temporary differences are expected to be recovered or settled. The effect on deferred tax assets and liabilities of a change in tax rates is recognized in the results of operations in the period that includes the enactment date.
Recent Accounting Pronouncements
Revenue Recognition
In May 2014, the Financial Accounting Standards Board (“FASB”) issued an accounting standards update (“ASU”) related to revenue from contracts with customers which requires an entity to recognize the amount of revenue to which it expects to be entitled for the transfer of promised goods or services to customers. The ASU will replace most existing revenue recognition guidance when it becomes effective. The new standard is effective for the Company on January 1, 2017. Early application is not permitted. The standard permits the use of either the retrospective or cumulative effect transition method. The Company is evaluating the effect the ASU will have on its consolidated financial statements and related disclosures. The Company has not yet selected a transition method nor has it determined the effect of the standard on its ongoing financial reporting.
Presentation of Comprehensive Income
In February 2013, the FASB issued final guidance related to the reporting of amounts reclassified out of accumulated other comprehensive income that requires entities to report, either on their income statement or in a footnote to their financial statements, the effects on earnings from items that are reclassified out of accumulated other comprehensive income. The guidance was effective prospectively for our interim period ended September 30, 2013. The adoption of this guidance only affected presentation and did not have an impact on our financial position, results of operations or cash flows.
Disclosures about Offsetting Assets and Liabilities
In December 2011, the FASB issued an accounting standards update regarding disclosures about offsetting assets and liabilities, which requires entities to disclose information about offsetting and related arrangements of financial instruments and derivative instruments. The amendment was effective retrospectively for our interim period ended September 30, 2013. The adoption of this guidance only affected presentation and did not have an impact on our financial position, results of operations or cash flows.
59
Table of Contents
| 3. | Acquisitions |
UC Synergetic
On July 2, 2012, we completed the acquisition of UCS, a privately-held company headquartered in Charlotte, North Carolina, for $69,654, net of cash acquired of $666. The funding for the acquisition consisted of cash borrowed from the $75,000 accordion loan feature of our existing revolving credit facility that was finalized on June 27, 2012. UCS provides engineering and consulting services focusing on (i) energy distribution, transmission and substation infrastructure, including storm assessment and inspection, and (ii) wireline and wireless communications. This acquisition extended our footprint in the Northeast and Midwest and resulted in our being one of the largest utility infrastructure engineering and design firms in the United States.
We completed our analysis of the valuation of the acquired assets and liabilities assumed of UCS during the fiscal year ended June 30, 2013. In June 2013, we recorded additional adjustments increasing goodwill and deferred income taxes totaling $11 to accurately reflect the amounts recognized as of the acquisition date. The purchase price of $69,654 has been allocated to the assets acquired and liabilities assumed at the effective date of the acquisition based on estimated fair values as summarized in the following table:
| Current assets |
$ | 13,632 | ||
| Property and equipment |
1,760 | |||
| Intangible assets |
39,800 | |||
| Goodwill |
30,736 | |||
| Other |
100 | |||
|
|
|
|||
| Total assets acquired |
86,028 | |||
| Current liabilities |
(3,009 | ) | ||
| Deferred income taxes |
(13,365 | ) | ||
|
|
|
|||
| Total liabilities assumed |
(16,374 | ) | ||
|
|
|
|||
| Net assets |
$ | 69,654 | ||
|
|
|
The intangible assets recognized are attributable to customer relationships totaling $34,000, non-compete agreements with the seller totaling $1,800 and a trademark totaling $4,000, and are being amortized over twelve, three and twenty years, respectively. The allocation of the purchase price, which primarily used a discounted cash flow approach with respect to identified intangible assets, was based upon Level 3 fair value inputs and a discount rate consistent with the inherent risk of each of the acquired assets. The goodwill recognized is attributable primarily to expected synergies and $5,357 is amortizable for tax purposes.
The financial results of the operations of UCS have been included in our consolidated financial statements since the date of the acquisition and represent revenue of $77,253 and net income of $3,469 for the fiscal year ended June 30, 2013. The following unaudited pro forma condensed statement of income data gives effect to the acquisition of UCS as if it had occurred on July 1, 2011. The pro forma results are not necessarily indicative of what actually would have occurred had the acquisition been in effect for the fiscal years presented. Pro forma results for the fiscal year ended June 30, 2012 excludes non-recurring charges primarily related to seller transaction expenses prior to the acquisition totaling approximately $2,900.
60
Table of Contents
| Fiscal Year
Ended June 30, |
||||||||
| 2013 | 2012 | |||||||
| Revenues |
$ | 918,691 | $ | 757,855 | ||||
|
|
|
|
|
|||||
| Net income |
$ | 36,193 | $ | 13,761 | ||||
|
|
|
|
|
|||||
| Basic earnings per common share |
$ | 1.04 | $ | 0.40 | ||||
|
|
|
|
|
|||||
| Diluted earnings per common share |
$ | 1.03 | $ | 0.39 | ||||
|
|
|
|
|
|||||
Pine Valley
On August 1, 2011, we acquired Pine Valley, a privately-held company located near Salt Lake City, Utah, for $25,068, net of cash acquired of $465. The funding for the purchase consisted of cash from operations and cash borrowed under our revolving credit facility totaling $7,271 and $10,000, respectively, and the issuance of approximately 983 shares of our common stock having an estimated fair value of $8,262 on the issuance date. Pine Valley provides construction and maintenance services to the transmission and distribution, renewable energy, industrial water and mining industries.
We completed our analysis of the valuation of the acquired assets and liabilities of Pine Valley during the quarter ended December 31, 2011. The purchase price of $25,068 has been allocated to the assets acquired and liabilities assumed at the effective date of the acquisition based on estimated fair values as summarized in the following table:
| Current assets |
$ | 3,278 | ||
| Property and equipment |
1,251 | |||
| Intangible assets |
10,072 | |||
| Goodwill |
12,039 | |||
|
|
|
|||
| Total assets acquired |
26,640 | |||
| Current liabilities |
(1,572 | ) | ||
|
|
|
|||
| Total liabilities assumed |
(1,572 | ) | ||
|
|
|
|||
| Net assets |
$ | 25,068 | ||
|
|
|
The intangible assets recognized are attributable to customer relationships totaling $8,005, non-compete agreements with the seller totaling $1,829 and a trademark totaling $238, and are being amortized over fifteen, five and five years, respectively. All changes in goodwill for the fiscal year ended June 30, 2013 are related to purchase price allocation adjustments for Pine Valley. The goodwill recognized is attributable primarily to expected synergies and is amortizable for tax purposes over a period of 15 years.
The financial results of the operations of Pine Valley have been included in our consolidated financial statements since the date of the acquisition and represent revenue of $18,851 and net loss of $3 for the fiscal year ended June 30, 2012. The following unaudited pro forma condensed statement of income data gives effect to the acquisition of Pine Valley as if it had occurred on July 1, 2010. The pro forma results are not necessarily indicative of what actually would have occurred had the acquisition been in effect for the fiscal years presented.
61
Table of Contents
| Fiscal Year Ended June 30, |
||||||||
| 2012 | 2011 | |||||||
| Revenues |
$ | 686,980 | $ | 618,980 | ||||
|
|
|
|
|
|||||
| Net income |
$ | 10,994 | $ | 6,251 | ||||
|
|
|
|
|
|||||
| Basic earnings per common share |
$ | 0.32 | $ | 0.19 | ||||
|
|
|
|
|
|||||
| Diluted earnings per common share |
$ | 0.31 | $ | 0.18 | ||||
|
|
|
|
|
|||||
| 4. | Property and Equipment |
Property and equipment is comprised of the following:
| Estimated Useful Lives in Years |
June 30, | |||||||||
| 2014 | 2013 | |||||||||
| Land |
— | $ | 2,705 | $ | 2,964 | |||||
| Buildings |
15-39 | 27,269 | 27,415 | |||||||
| Vehicles |
5-12 | 244,029 | 237,127 | |||||||
| Machinery and equipment |
3-19 | 72,895 | 79,055 | |||||||
| Office equipment, furniture and software |
3-7 | 39,665 | 30,540 | |||||||
|
|
|
|
|
|||||||
| Total |
386,563 | 377,101 | ||||||||
| Accumulated depreciation |
(208,820 | ) | (197,173 | ) | ||||||
|
|
|
|
|
|||||||
| Property and equipment, net |
$ | 177,743 | $ | 179,928 | ||||||
|
|
|
|
|
|||||||
Depreciation expense for the fiscal years ended June 30, 2014, 2013 and 2012 was $32,125, $32,855 and $33,445, respectively.
Expenses for maintenance and repairs of property and equipment were $36,990, $36,302 and $34,510 for the fiscal years ended June 30, 2014, 2013 and 2012, respectively.
Amounts reported as gain on sale and impairment of property and equipment relate primarily to the sale of aging, damaged or excess fleet equipment. Assets held for sale are recorded at the lower of carrying value or fair value, less selling costs. Fair value for this purpose is generally determined based on prices in the used equipment market. The carrying value of assets held for sale was $72 and $175 at June 30, 2014 and 2013, respectively, and is included in prepaid expenses and other in the consolidated balance sheets. All of the assets held for sale are expected to be sold within twelve months.
| 5. | Goodwill and Other Intangible Assets |
The changes in the carrying amount of goodwill for fiscal year 2014 and 2013 are as follows:
| Construction | Engineering | Total Goodwill |
||||||||||
| Goodwill at June 30, 2012 |
$ | 113,110 | $ | 9,822 | $ | 122,932 | ||||||
|
|
|
|
|
|
|
|||||||
| Acquisition of UCS |
— | 30,736 | 30,736 | |||||||||
|
|
|
|
|
|
|
|||||||
| Goodwill at June 30, 2013 |
$ | 113,110 | $ | 40,558 | $ | 153,668 | ||||||
|
|
|
|
|
|
|
|||||||
| — | — | — | ||||||||||
|
|
|
|
|
|
|
|||||||
| Goodwill at June 30, 2014 |
$ | 113,110 | $ | 40,558 | $ | 153,668 | ||||||
|
|
|
|
|
|
|
|||||||
See Note 19 for details pertaining to the Company’s reportable segments.
62
Table of Contents
We have recorded no impairment losses related to goodwill and have no intangible assets with indefinite lives other than goodwill.
Other amortizable intangible assets are comprised of:
| Customer Relationships |
Non-Compete Agreements |
Trademarks | Total | |||||||||||||||||||||||||||||
| June 30, | June 30, | June 30, | June 30, | |||||||||||||||||||||||||||||
| 2014 | 2013 | 2014 | 2013 | 2014 | 2013 | 2014 | 2013 | |||||||||||||||||||||||||
| Gross carrying value |
$ | 92,711 | $ | 92,711 | $ | 3,629 | $ | 11,719 | $ | 4,838 | $ | 4,838 | $ | 101,178 | $ | 109,268 | ||||||||||||||||
| Accumulated amortization |
(30,427 | ) | (24,382 | ) | (2,269 | ) | (9,393 | ) | (1,019 | ) | (652 | ) | (33,715 | ) | (34,427 | ) | ||||||||||||||||
|
|
|
|
|
|
|
|
|
|
|
|
|
|
|
|
|
|||||||||||||||||
| Net intangible assets |
$ | 62,284 | $ | 68,329 | $ | 1,360 | $ | 2,326 | $ | 3,819 | $ | 4,186 | $ | 67,463 | $ | 74,841 | ||||||||||||||||
|
|
|
|
|
|
|
|
|
|
|
|
|
|
|
|
|
|||||||||||||||||
| Weighted-average useful life (years) |
20.6 | 20.6 | 4.0 | 6.1 | 17.4 | 17.4 | 19.9 | 18.9 | ||||||||||||||||||||||||
|
|
|
|
|
|
|
|
|
|
|
|
|
|
|
|
|
|||||||||||||||||
Amortization expense related to intangible assets for the fiscal years ended June 30, 2014, 2013 and 2012 was $7,378, $8,576 and $4,809, respectively.
Estimated future amortization expense related to intangible assets is as follows:
| Fiscal Year Ended June 30, |
Amount | |||
| 2015 |
$ | 7,268 | ||
| 2016 |
6,415 | |||
| 2017 |
5,705 | |||
| 2018 |
5,482 | |||
| 2019 |
5,383 | |||
| Thereafter |
37,210 | |||
|
|
|
|||
| Total |
$ | 67,463 | ||
|
|
|
|||
| 6. | Debt |
On August 24, 2011, we entered into a $200,000 revolving credit facility that replaced our prior credit facility. Our revolving credit facility matures in August 2015. We repaid outstanding term loans and borrowings on the revolver of our prior credit facility upon entering into our revolving credit facility. The obligations under our revolving credit facility are unconditionally guaranteed by us and each of our existing and subsequently acquired or organized domestic and first-tier foreign subsidiaries and secured on a first-priority basis by security interests (subject to permitted liens) in substantially all assets owned by us and each of our subsidiaries, subject to limited exceptions. Total costs associated with entering into our revolving credit facility were approximately $1,800, including the commitment fee, which are capitalized and being amortized over the term of the debt using the effective interest method.
Borrowings under our revolving credit facility bear interest at a variable rate at our option of either (i) the Base Rate, defined as the greater of the Prime Rate (as defined in our revolving credit facility), the Federal Funds Effective Rate (as defined in our revolving credit facility) plus 0.50% or LIBOR plus 1.00%, plus a margin ranging from 0.50% to 1.50% or (ii) LIBOR plus a margin ranging from 2.00% to 3.00%. The margins are applied based on our leverage ratio, which is computed quarterly. The margins are applied based on our leverage ratio, which is computed quarterly. At June 30, 2014 and 2013, the Base Rate margin was 1.50% and 0.75% and the LIBOR margin was 3.00% and 2.25%, respectively. At June 30, 2014 and 2013, our Base Rate was 4.75% and 4.00% and the adjusted LIBOR rate was 3.19% and 2.5%, respectively.
63
Table of Contents
We are subject to a commitment fee ranging from 0.375% to 0.625% and letter of credit fees between 2.00% and 3.00% based on our leverage ratio. We are also subject to letter of credit fronting fees of 0.125% per annum for amounts available to be withdrawn.
Our revolving credit facility contains a number of other affirmative and restrictive covenants, including limitations on dissolutions, sales of assets, investments, and indebtedness and liens. On December 17, 2013, we entered into an amendment to our revolving credit facility to restate the leverage covenant ratio. Our revolving credit facility includes a requirement that we maintain (i) a leverage ratio, which is the ratio of total debt to adjusted EBITDA (as defined in our revolving credit facility; measured on a trailing four-quarter basis), of no more than 4.00 to 1.00 as of the last day of each fiscal quarter, declining to 3.75 on June 30, 2014 and declining to 3.50 on September 30, 2014 and thereafter, and (ii) a consolidated fixed charge coverage ratio (as defined in our revolving credit facility) of at least 1.25 to 1.00.
On June 27, 2012, we exercised the accordion feature of our revolving credit facility and entered into a commitment increase agreement with our lenders thereby increasing the lenders’ commitments by $75,000, from $200,000 to $275,000. Total costs associated with the new accordion commitment were approximately $800, which are capitalized and being amortized over the term of the debt using the effective interest method.
As of June 30, 2014, we had $197,000 in borrowings and our availability under our revolving credit facility was $74,000 (after giving effect to $4,000 of outstanding standby letters of credit).
Cash paid for interest expense totaled $6,763, $6,389 and $4,285 for the fiscal years ended June 30, 2014, 2013 and 2012, respectively. Interest costs capitalized for the fiscal years ended June 30, 2014, 2013 and 2012 were $12, $12 and $47, respectively.
| 7. | Shareholders’ Equity |
Special Dividend
On December 4, 2012, we announced that our board of directors declared a special cash dividend of $1.00 per share on our common stock totaling $35,164. The dividend was payable to shareholders of record as of December 14, 2012 and was paid on December 21, 2012.
Secondary Offering and Concurrent Share Repurchase
On May 13, 2013, we entered into a share repurchase agreement with LGB Pike II LLC (the “Selling Shareholder”), pursuant to which we agreed to purchase $40,000 of our common stock from the Selling Shareholder concurrently with the closing of an underwritten public offering by the Selling Shareholder of 8,000 shares of our common stock at the price at which the shares of common stock were sold to the public in the offering, less the underwriting discount, or $10.925 per share (the “Repurchase Agreement”). We funded the share repurchase with available cash and borrowings under our revolving credit facility, and the shares were repurchased and cancelled on May 21, 2013. The excess of the repurchase price over our common stock par value was charged against retained earnings. We did not receive any proceeds from the sale of shares in the secondary offering and were obligated to conduct such offering and pay the expenses related thereto pursuant to that certain Stockholders Agreement, dated April 18, 2002, as amended, among the Company and certain shareholders. We incurred fees and expenses totaling $4,138 in connection with the secondary equity offering, the concurrent share repurchase and a special committee of our board of directors. This amount is shown as a separate operating expense in the consolidated statements of income for the fiscal year ended June 30, 2013; $2,464 of the offering expenses are non-deductible for income tax purposes.
| 8. | Derivative Instruments and Hedging Activities |
All derivative instruments are recorded on the consolidated balance sheets at their respective fair values. Changes in fair value are recognized either in income or other comprehensive income (loss) (“OCI”), depending on
64
Table of Contents
whether the transaction qualifies for hedge accounting and, if so, the nature of the underlying exposure being hedged and how effective the derivatives are at offsetting price movements in the underlying exposure. The effective portions recorded in OCI are recognized in the statement of operations when the hedged item affects earnings.
We have used certain derivative instruments to manage risk relating to diesel fuel and interest rate exposure. Derivative instruments are not entered into for trading or speculative purposes. We document all relationships between derivative instruments and related items, as well as our risk-management objectives and strategies for undertaking various derivative transactions.
Interest Rate Risk
We are exposed to market risk related to changes in interest rates on borrowings under our revolving credit facility, which bears interest based on LIBOR, plus an applicable margin dependent upon our total leverage ratio. We use derivative financial instruments to manage exposure to fluctuations in interest rates on our revolving credit facility.
Effective January 2013, we entered into an interest rate swap agreement (the “January 2013 Swap”), with a notional amount of $10,000, to help manage a portion of our interest risk related to our floating-rate debt. Under the January 2013 Swap, we pay a fixed rate of 0.42% and receive a rate equivalent to the 30-day LIBOR, adjusted monthly. The January 2013 Swap qualified for hedge accounting and is designated as a cash flow hedge. There was no hedge ineffectiveness for the January 2013 Swap for the fiscal years ended June 30, 2014 and 2013. The swap will expire in June 2015.
Effective December 2012, we entered into two interest rate swap agreements (the “December 2012 Swaps”), with notional amounts of $10,000 and $25,000, respectively, to help manage a portion of our interest risk related to our floating-rate debt. Under the December 2012 Swaps, we pay fixed rates of 0.42% and 0.45%, respectively, and receive a rate equivalent to the 30-day LIBOR, adjusted monthly. The December 2012 Swaps qualified for hedge accounting and are designated as cash flow hedges. There was no hedge ineffectiveness for the December 2012 Swaps for the fiscal years ended June 30, 2014 and 2013. These swaps will expire in June 2015.
Effective September 2012, we entered into two interest rate swap agreements (the “September 2012 Swaps”), each with notional amounts of $25,000, to help manage a portion of our interest risk related to our floating-rate debt. Under the September 2012 Swaps, we pay fixed rates of 0.40% and 0.42%, respectively, and receive a rate equivalent to the 30-day LIBOR, adjusted monthly. The September 2012 Swaps qualified for hedge accounting and are designated as cash flow hedges. There was no hedge ineffectiveness for the September 2012 Swaps for the fiscal years ended June 30, 2014 and 2013. These swaps will expire in February and March 2015, respectively.
Effective May 2010, we entered into an interest rate swap agreement (the “May 2010 Swap”), with a notional amount of $20,000, to help manage a portion of our interest risk related to our floating-rate debt. The May 2010 Swap expired in May 2012. Under the May 2010 Swap, we paid a fixed rate of 1.1375% and received a rate equivalent to the 30-day LIBOR, adjusted monthly. The May 2010 Swap qualified for hedge accounting and was designated as a cash flow hedge. There was no hedge ineffectiveness for the May 2010 Swap for the fiscal year ended June 30, 2012.
Effective June 2010, we entered into an interest rate swap agreement (the “June 2010 Swap”), with a notional amount of $20,000, to help manage a portion of our interest risk related to our floating-rate debt. The June 2010 Swap expired in June 2012. Under the June 2010 Swap, we paid a fixed rate of 1.0525% and received a rate equivalent to the 30-day LIBOR, adjusted monthly. The June 2010 Swap qualified for hedge accounting and was designated as a cash flow hedge. There was no hedge ineffectiveness for the June 2010 Swap for the fiscal year ended June 30, 2012.
The net derivative income (loss) recorded in OCI will be reclassified into earnings over the term of the underlying cash flow hedge. The amount that will be reclassified into earnings will vary depending upon the movement of the underlying interest rates. As interest rates decrease, the charge to earnings will increase. Conversely, as interest rates increase, the charge to earnings will decrease.
65
Table of Contents
Diesel Fuel Risk
We have a large fleet of vehicles and equipment that primarily uses diesel fuel. As a result, we have market risk for changes in diesel fuel prices. If diesel prices rise, our gross profit and operating income could be negatively affected due to additional costs that may not be fully recovered through increases in prices to customers.
We periodically enter into diesel fuel swaps and fixed-price forward contracts to decrease our price volatility. We currently hedge approximately 56% of our diesel fuel usage primarily over the next twelve months with prices ranging from $3.86 to $3.99 per gallon at a weighted-average price of $3.90 per gallon. We are not currently utilizing hedge accounting for any active diesel fuel derivatives.
Balance Sheet and Statement of Operations Information
The fair value of derivatives at June 30, 2014 and 2013 is summarized in the following table:
| Asset Derivatives at June 30, 2014 | Liability Derivatives at June 30, 2014 | |||||||||||||||||||||||||
| Balance Sheet Location | Gross Fair Value of Recognized Assets |
Gross Fair Value Offset |
Net Fair Value |
Gross Fair Value of Recognized Liabilities |
Gross Fair Value Offset |
Net Fair Value |
||||||||||||||||||||
| Derivatives designated as hedging instruments: |
||||||||||||||||||||||||||
| Interest rate swaps |
Accrued expenses and other | $ | — | $ | — | $ | — | $ | (195 | ) | $ | — | $ | (195 | ) | |||||||||||
|
|
|
|
|
|
|
|
|
|
|
|
|
|||||||||||||||
| Total derivatives designated as hedging instruments |
$ | — | $ | — | $ | — | $ | (195 | ) | $ | — | $ | (195 | ) | ||||||||||||
|
|
|
|
|
|
|
|
|
|
|
|
|
|||||||||||||||
| Derivatives not designated as hedging instruments: |
||||||||||||||||||||||||||
| Diesel fuel swaps |
Prepaid expenses and other | $ | 167 | $ | (21 | ) | $ | 146 | $ | (21 | ) | 21 | $ | — | ||||||||||||
|
|
|
|
|
|
|
|
|
|
|
|
|
|||||||||||||||
| Total derivatives not designated as hedging instruments |
$ | 167 | $ | (21 | ) | $ | 146 | $ | (21 | ) | 21 | $ | — | |||||||||||||
|
|
|
|
|
|
|
|
|
|
|
|
|
|||||||||||||||
| Total derivatives |
$ | 167 | $ | (21 | ) | $ | 146 | $ | (216 | ) | 21 | $ | (195 | ) | ||||||||||||
|
|
|
|
|
|
|
|
|
|
|
|
|
|||||||||||||||
| Asset Derivatives at June 30, 2013 | Liability Derivatives at June 30, 2013 | |||||||||||||||||||||||||
| Balance Sheet Location | Gross Fair Value of Recognized Assets |
Gross Fair Value Offset |
Net Fair Value |
Gross Fair Value of Recognized Liabilities |
Gross Fair Value Offset |
Net Fair Value |
||||||||||||||||||||
| Derivatives designated as hedging instruments: |
||||||||||||||||||||||||||
| Interest rate swaps |
Accrued expenses and other | $ | — | $ | — | $ | — | $ | (77 | ) | $ | — | $ | (77 | ) | |||||||||||
|
|
|
|
|
|
|
|
|
|
|
|
|
|||||||||||||||
| Total derivatives designated as hedging instruments |
$ | — | $ | — | $ | — | $ | (77 | ) | $ | — | $ | (77 | ) | ||||||||||||
|
|
|
|
|
|
|
|
|
|
|
|
|
|||||||||||||||
| Derivatives not designated as hedging instruments: |
||||||||||||||||||||||||||
| Diesel fuel swaps |
Accrued expenses and other | $ | 22 | $ | (22 | ) | $ | — | $ | (316 | ) | $ | 22 | $ | (294 | ) | ||||||||||
|
|
|
|
|
|
|
|
|
|
|
|
|
|||||||||||||||
| Total derivatives not designated as hedging instruments |
$ | 22 | $ | (22 | ) | $ | — | $ | (316 | ) | $ | 22 | $ | (294 | ) | |||||||||||
|
|
|
|
|
|
|
|
|
|
|
|
|
|||||||||||||||
| Total derivatives |
$ | 22 | $ | (22 | ) | $ | — | $ | (393 | ) | $ | 22 | $ | (371 | ) | |||||||||||
|
|
|
|
|
|
|
|
|
|
|
|
|
|||||||||||||||
66
Table of Contents
The effects of derivative instruments, net of tax, on the consolidated statements of income for the fiscal years ended June 30, 2014 and 2013 are summarized in the following tables:
Derivatives designated as cash flow hedging instruments:
| Amount of Loss Recognized in OCI (Effective Portion) |
Location of Loss Reclassified from Accumulated OCI into Earnings |
Amount of
Loss Reclassified from Accumulated OCI into Earnings |
||||||||||||||||
| Fiscal Year Ended June 30, | 2014 | 2013 | 2014 | 2013 | ||||||||||||||
| Interest rate swaps |
$ | (72 | ) | $ | (47 | ) | Interest expense | $ | (133 | ) | $ | (82 | ) | |||||
|
|
|
|
|
|
|
|
|
|||||||||||
| Total |
$ | (72 | ) | $ | (47 | ) | $ | (133 | ) | $ | (82 | ) | ||||||
|
|
|
|
|
|
|
|
|
|||||||||||
Derivatives not designated as cash flow hedging instruments:
| Location of Gain (Loss) Recognized in Earnings |
Amount of Gain
(Loss) Recognized in Earnings |
|||||||||
| Fiscal Year Ended June 30, | 2014 | 2013 | ||||||||
| Diesel fuel swaps |
Cost of operations | $ | 440 | $ | 1,294 | |||||
|
|
|
|
|
|||||||
| Total |
$ | 440 | $ | 1,294 | ||||||
|
|
|
|
|
|||||||
For the fiscal years ended June 30, 2014, 2013 and 2012, there were no reclassifications to earnings due to hedged firm commitments no longer deemed probable or due to hedged forecasted transactions that had not occurred by the end of the originally specified time period.
Accumulated OCI
For the interest rate swaps, the following table summarizes the net derivative gains or losses, net of taxes, deferred into accumulated OCI and reclassified to income (loss) for the fiscal years indicated below.
| Fiscal Year Ended June 30, |
||||||||
| 2014 | 2013 | |||||||
| Net accumulated derivative loss deferred at beginning of period |
$ | (47 | ) | $ | — | |||
| Change in fair value |
(205 | ) | (129 | ) | ||||
| Reclassification to net income |
133 | 82 | ||||||
|
|
|
|
|
|||||
| Net accumulated derivative loss deferred at end of period |
$ | (119 | ) | $ | (47 | ) | ||
|
|
|
|
|
|||||
The estimated net amount of the existing losses in OCI at June 30, 2014 expected to be reclassified into net income over the next twelve months is approximately $119. This amount was computed using the fair value of the cash flow hedges at June 30, 2014 and will differ from actual reclassifications from OCI to net income during the next twelve months.
67
Table of Contents
| 9. | Fair Value Measurements |
Fair value rules currently apply to all financial assets and liabilities and for certain nonfinancial assets and liabilities that are required to be recognized or disclosed at fair value. For this purpose, fair value is defined as the price that would be received to sell an asset or paid to transfer a liability in an orderly transaction between market participants at the measurement date. Valuation techniques used to measure fair value must maximize the use of observable inputs and minimize the use of unobservable inputs.
U.S. GAAP establishes a three-tier fair value hierarchy, which prioritizes the inputs used in measuring fair value. These tiers include:
| • | Level 1 - Valuations based on quoted prices in active markets for identical instruments that we are able to access. Since valuations are based on quoted prices that are readily and regularly available in an active market, valuation of these products does not entail a significant degree of judgment. |
| • | Level 2 - Valuations based on quoted prices in active markets for instruments that are similar, or quoted prices in markets that are not active for identical or similar instruments, and model-derived valuations in which all significant inputs and significant value drivers are observable in active markets. |
| • | Level 3 - Valuations based on inputs that are unobservable and significant to the overall fair value measurement. |
As of June 30, 2014 and 2013, we held certain items that are required to be measured at fair value on a recurring basis. These included interest rate derivative instruments and diesel fuel derivative instruments. Derivative instruments are used to hedge our exposure to interest rate fluctuations and a portion of our diesel fuel costs. These derivative instruments currently consist of swaps only. See Note 8 for further information on our derivative instruments and hedging activities.
Our interest rate derivative instruments and diesel fuel derivative instruments consist of over-the-counter contracts, which are not traded on a public exchange. The fair values for our interest rate swaps and diesel fuel swaps are based on current settlement values and represent the estimated amount we would have received or paid upon termination of these agreements. The fair values are derived using pricing models that rely on market observable inputs such as yield curves and commodity forward prices, and therefore are classified as Level 2. We also consider counterparty credit risk in our determination of all estimated fair values. We have consistently applied these valuation techniques in all periods presented.
At June 30, 2014 and 2013, the carrying amounts and fair values for our interest rate swaps and diesel fuel swaps were as follows:
| Description |
June 30, 2014 | Level 1 | Level 2 | Level 3 | ||||||||||||
| Asset: |
||||||||||||||||
| Diesel fuel swap agreements |
$ | 146 | $ | — | $ | 146 | $ | — | ||||||||
| Liability: |
||||||||||||||||
| Interest rate swap agreements |
(195 | ) | — | (195 | ) | — | ||||||||||
|
|
|
|
|
|
|
|
|
|||||||||
| Total |
$ | (49 | ) | $ | — | $ | (49 | ) | $ | — | ||||||
|
|
|
|
|
|
|
|
|
|||||||||
| Description |
June 30, 2013 | Level 1 | Level 2 | Level 3 | ||||||||||||
| Liability: |
||||||||||||||||
| Diesel fuel swap agreements |
$ | (294 | ) | $ | — | $ | (294 | ) | $ | — | ||||||
| Interest rate swap agreements |
(77 | ) | — | (77 | ) | — | ||||||||||
|
|
|
|
|
|
|
|
|
|||||||||
| Total |
$ | (371 | ) | $ | — | $ | (371 | ) | $ | — | ||||||
|
|
|
|
|
|
|
|
|
|||||||||
68
Table of Contents
The carrying amounts of cash and cash equivalents, accounts receivable and accounts payable approximate fair values due to the short-term nature of these instruments. The carrying value of our debt approximates fair value based on the market-determined, variable interest rates.
Assets and liabilities that are measured at fair value on a nonrecurring basis include assets held for sale. Assets held for sale are valued using Level 2 inputs, primarily observed prices for similar assets in the used equipment market.
| 10. | Income Taxes |
Income tax expense consisted of the following:
| Fiscal Year Ended June 30, | ||||||||||||
| 2014 | 2013 | 2012 | ||||||||||
| Current |
$ | 12,774 | $ | 25,783 | $ | 8,926 | ||||||
| Deferred |
(3,470 | ) | (1,150 | ) | (952 | ) | ||||||
|
|
|
|
|
|
|
|||||||
| Total |
$ | 9,304 | $ | 24,633 | $ | 7,974 | ||||||
|
|
|
|
|
|
|
|||||||
In assessing the value of deferred tax assets, the Company considers whether it is more likely than not that some or all of the deferred tax assets will not be realized. The ultimate realization of deferred tax assets is dependent upon the generation of future taxable income during the periods in which those temporary differences become deductible. The Company considers the availability of taxable income in carryback periods, the scheduled reversal of deferred tax liabilities, projected future taxable income and tax planning strategies in making this assessment. Based upon these considerations, the Company provides a valuation allowance to reduce the carrying value of certain of its deferred tax assets to their net expected realizable value, if applicable. The Company has concluded that no valuation allowance is required for deferred tax assets at June 30, 2014 and 2013, respectively. Significant components of our deferred tax liabilities and assets are as follows:
| June 30, | ||||||||
| 2014 | 2013 | |||||||
| Deferred tax liabilities: |
||||||||
| Tax over book depreciation |
$ | (44,166 | ) | $ | (46,927 | ) | ||
| Tax over book amortization |
(18,999 | ) | (19,465 | ) | ||||
| Other |
(4,503 | ) | (2,634 | ) | ||||
|
|
|
|
|
|||||
| Total deferred tax liabilities |
(67,668 | ) | (69,026 | ) | ||||
|
|
|
|
|
|||||
| Deferred tax assets: |
||||||||
| Deferred compensation |
2,885 | 2,510 | ||||||
| Self-insurance accruals |
5,863 | 3,701 | ||||||
| Accrued expenses |
3,453 | 5,529 | ||||||
| Stock compensation |
5,418 | 5,210 | ||||||
| Other |
3,961 | 2,394 | ||||||
|
|
|
|
|
|||||
| Total deferred tax assets |
21,580 | 19,344 | ||||||
|
|
|
|
|
|||||
| Net deferred tax liabilities |
$ | (46,088 | ) | $ | (49,682 | ) | ||
|
|
|
|
|
|||||
The differences between the income tax expense and the amounts computed by applying the statutory federal income tax rate to earnings before income taxes are as follows:
69
Table of Contents
| Fiscal Year Ended June 30, | ||||||||||||||||||||||||
| 2014 | 2013 | 2012 | ||||||||||||||||||||||
| Computed tax at federal statutory rate |
$ | 8,039 | 35.0 | % | $ | 21,289 | 35.0 | % | $ | 6,600 | 35.0 | % | ||||||||||||
| State income taxes, net of federal expense |
593 | 2.6 | % | 2,920 | 4.8 | % | 972 | 5.2 | % | |||||||||||||||
| Internal Revenue Code Section 199 deduction |
(680 | ) | -3.0 | % | (1,441 | ) | -2.4 | % | (393 | ) | -2.1 | % | ||||||||||||
| Meals and entertainment |
362 | 1.6 | % | 418 | 0.7 | % | 286 | 1.5 | % | |||||||||||||||
| Non-deductible reorganization costs |
278 | 1.2 | % | 862 | 1.4 | % | — | 0.0 | % | |||||||||||||||
| Other |
712 | 3.1 | % | 585 | 1.0 | % | 509 | 2.7 | % | |||||||||||||||
|
|
|
|
|
|
|
|
|
|
|
|
|
|||||||||||||
| Net income tax expense |
$ | 9,304 | 40.5 | % | $ | 24,633 | 40.5 | % | $ | 7,974 | 42.3 | % | ||||||||||||
|
|
|
|
|
|
|
|
|
|
|
|
|
|||||||||||||
Cash paid for income taxes, net of refunds received, totaled $7,706, $26,624 and $3,244 for the fiscal years ended June 30, 2014, 2013 and 2012, respectively.
We have recorded a liability for unrecognized tax benefits related to tax positions taken on various income tax returns. If recognized, the entire amount of unrecognized benefits would impact our effective tax rate.
A reconciliation of the beginning and ending amounts of unrecognized tax benefits is as follows:
| Fiscal Year Ended June 30, | ||||||||||||
| 2014 | 2013 | 2012 | ||||||||||
| Beginning of year |
$ | 355 | $ | 100 | $ | 146 | ||||||
| Increases related to tax positions taken in a current year |
— | 155 | 100 | |||||||||
| Increases related to tax positions taken in a prior year |
— | 100 | — | |||||||||
| Reduction for tax positions of prior years |
— | — | (146 | ) | ||||||||
| Settlements |
(300 | ) | — | — | ||||||||
|
|
|
|
|
|
|
|||||||
| End of year |
$ | 55 | $ | 355 | $ | 100 | ||||||
|
|
|
|
|
|
|
|||||||
The open tax years remaining subject to audit by the Internal Revenue Service are fiscal years ended June 30, 2012 and forward. With few exceptions, our state income tax returns are subject to examination for the fiscal year ended June 30, 2010 and forward.
We have elected not to recognize interest and penalties related to income tax matters in the income tax provision. Interest and penalties were minor for all periods presented and, as of June 30, 2014 and 2013, there were no significant amounts accrued for interest or penalties related to uncertain tax positions.
The Company does not anticipate a change in the balance of unrecognized tax benefits during the next 12 months.
| 11. | Employee Benefit Plans and Other Postretirement Benefits |
We sponsor a defined contribution plan that covers all full-time employees who have completed a minimum of two months of employment. Contributions relating to the defined contribution plan will be made based upon the plan’s provisions. Additional amounts may be contributed at the option of our board of directors. Our contributions were $2,208, $2,466 and $1,812 for the fiscal years ended June 30, 2014, 2013 and 2012, respectively.
We also maintain a postretirement plan that provides health benefits and certain other benefits for certain retired officers who retire on or after age 55 with at least 10 years of continuous service. We intend to maintain the insurance for all of the officers during their eligible retirement years. We retain the right to modify or eliminate these benefits. The liability for these benefits totaled $2,086 and $2,084 as of June 30, 2014 and 2013, respectively, and is reflected on the balance sheet in accrued expenses and other and other liabilities.
70
Table of Contents
| 12. | Stock-Based Compensation |
Overview
In connection with our initial public offering, we adopted the 2005 Omnibus Compensation Plan (the “2005 Plan”) in July 2005. We adopted the 2008 Omnibus Compensation Plan (as amended and restated, the “2008 Plan” and, together with the 2005 Plan, the “Omnibus Plans”) in fiscal year 2008 in anticipation of future compensation-related equity awards. The Omnibus Plans authorize our board of directors to grant various types of awards to directors, officers, employees and consultants, including stock options intended to qualify as incentive stock options under Section 422 of the Internal Revenue Code of 1986, as amended, nonqualified stock options, stock appreciation rights, restricted stock awards, restricted stock units, performance units, cash incentive awards, deferred share units and other equity-based or equity-related awards. To date, all equity awards under the Omnibus Plans have consisted of nonqualified stock options, restricted stock and restricted stock units. In November 2011, we increased the number of shares of common stock that may be issued under the 2008 Plan from 2,500 to 5,000 shares.
Subject to adjustment, as provided below, the aggregate number of shares of common stock that may be issued pursuant to awards granted under the 2005 Plan is 1,750, of which the maximum number of shares that may be delivered pursuant to incentive stock options granted and restricted stock awards is 500 and 450, respectively. Subject to adjustment, as provided below, the aggregate number of shares of common stock that may be issued pursuant to awards granted under the 2008 Plan is 5,000, of which the maximum number of shares that may be delivered pursuant to incentive stock options granted and restricted stock awards is 500 and 500, respectively. We have a policy of issuing new shares to satisfy option exercises.
Under both Omnibus Plans, the maximum number of shares of common stock with respect to which awards may be granted to any eligible individual in any fiscal year is 600. If an award granted under either Omnibus Plan is forfeited, or otherwise expires, terminates or is canceled without the delivery of shares, then the shares covered by the forfeited, expired, terminated or canceled award will again be available to be delivered pursuant to awards under the applicable Omnibus Plan.
We also maintain two stock option plans that were adopted in 2002 (the “2002 Plans”), under which stock options were granted to key employees, officers and directors. Option grants under the 2002 Plans were at a price of no less than the fair market value of the underlying stock at the date of grant, generally vest over a four-year period, and have a term of ten years. We do not intend to make additional grants under the 2002 Plans.
We recorded non-cash expense related to our stock-based compensation plans of $3,481, $3,684 and $3,925 for the fiscal years ended June 30, 2014, 2013 and 2012, respectively, all of which is included in general and administrative expenses in the consolidated statements of income. The total income tax benefit associated with non-cash stock compensation expense was $1,360, $1,439 and $1,533 for the fiscal years ended June 30, 2014, 2013 and 2012, respectively. As of June 30, 2014, there were 3,061 shares available for future issuance under our stock-based compensation plans.
Stock Options
For purposes of determining compensation expense for stock option awards, the fair value of each option award is estimated on the date of grant using the Black-Scholes option pricing model. The key assumptions used in the Black-Scholes model for options granted during fiscal 2012 were as follows:
| Fiscal Year Ended June 30, 2012 | ||
| Dividend yield |
— | |
| Risk-free interest rate |
1.12% - 2.18% | |
| Expected volatility |
0.43 | |
| Expected life |
6.0 - 6.5 years |
71
Table of Contents
There were no stock options granted in fiscal 2014 and 2013. The dividend yield assumption is based on our current intent not to issue dividends. The risk-free interest rate is based on the U.S. Treasury rate for the expected life at the time of grant. As of July 1, 2010, we began to use our historical volatility as a basis for our expected volatility. Prior to that, we had limited trading history beginning July 27, 2005 and had based our expected volatility on the average long-term historical volatilities of peer companies. We are using the “simplified method” to calculate expected holding periods, which represents the period of time that options granted are expected to be outstanding. We will continue to use this method until we have sufficient historical exercise experience to give us confidence that our calculations based on such experience will be reliable.
A summary of stock option activity for the fiscal year ended June 30, 2014, is presented as follows:
| Options | Weighted- Average Exercise Price |
Weighted- Average Remaining Life (years) |
Aggregate Intrinsic Value |
|||||||||||||
| Options outstanding, June 30, 2013 |
2,937 | $ | 11.42 | |||||||||||||
| Exercised |
(51 | ) | $ | 7.22 | ||||||||||||
| Forfeited |
(1 | ) | $ | 9.03 | ||||||||||||
|
|
|
|
|
|||||||||||||
| Options outstanding, June 30, 2014 |
2,885 | $ | 11.50 | 3.5 | $ | 1,167 | ||||||||||
|
|
|
|
|
|
|
|
|
|||||||||
| Options vested or expected to vest, June 30, 2014 |
2,885 | $ | 11.50 | 3.5 | $ | 1,167 | ||||||||||
|
|
|
|
|
|
|
|
|
|||||||||
| Options exercisable, June 30, 2014 |
2,699 | $ | 11.66 | 3.3 | $ | 1,145 | ||||||||||
|
|
|
|
|
|
|
|
|
|||||||||
The weighted-average grant-date fair value of options granted during fiscal 2012 was $3.92. The total intrinsic value of options exercised during fiscal 2014, 2013 and 2012 was $253, $521 and $3,263, respectively. The total fair value of options vested during fiscal 2014, 2013 and 2012 was $1,141, $1,990 and $2,102, respectively.
As of June 30, 2014, there was $361 of unrecognized compensation expense related to outstanding stock options which is expected to be recognized over a weighted-average period of 0.8 years.
Cash received from option exercises for the fiscal years ended June 30, 2014, 2013 and 2012 was $368, $1,974 and $332, respectively. The actual tax benefit realized from option exercises totaled $99, $203 and $1,276 for the fiscal years ended June 30, 2014, 2013 and 2012, respectively.
Other Stock-Based Compensation
A summary of restricted stock activity, including cash settled restricted stock awards, for the fiscal year ended June 30, 2014 is presented below:
| Shares | Weighted- Average Grant Date Fair Value |
|||||||
| Non-vested shares, June 30, 2013 |
637 | $ | 9.73 | |||||
| Granted |
32 | $ | 10.94 | |||||
| Vested |
(288 | ) | $ | 9.90 | ||||
| Forfeited |
(20 | ) | $ | 10.21 | ||||
|
|
|
|
|
|||||
| Non-vested shares, June 30, 2014 |
361 | $ | 9.68 | |||||
|
|
|
|
|
|||||
The fair value of restricted stock awards is estimated based on the average of our high and low stock price on the date of grant, and, for the purposes of expense recognition, the total new number of shares expected to vest is
72
Table of Contents
adjusted for estimated forfeitures. As of June 30, 2014, there was $2,407 of unrecognized compensation expense related to non-vested restricted stock, which is expected to be recognized over a weighted-average period of 1.4 years. The total fair value of shares vested during the fiscal years ended June 30, 2014, 2013 and 2012 was $2,810, $2,295 and $2,538, respectively. Vested and deferred restricted stock awards totaled 36 and 19 as of June 30, 2014 and 2013, respectively.
Employee Stock Purchase Plan
In September 2005, we adopted an Employee Stock Purchase Plan (the “ESPP”) that was approved by shareholders in December 2005. Under the ESPP, shares of our common stock are purchased during offerings commencing on January 1 of each year. The first offering period under the ESPP commenced on January 1, 2006. Shares are purchased at three-month intervals at 95% of the fair market value on the last trading day of each three-month purchase period. Employees may purchase shares having a value not exceeding 20% of their annual compensation, or $25, whichever is less. During the fiscal year ended June 30, 2014, employees purchased 55 shares at an average price of $9.82 per share. During the fiscal year ended June 30, 2013, employees purchased 52 shares at an average price of $10.14 per share. During the fiscal year ended June 30, 2012, employees purchased 63 shares at an average price of $7.05 per share At June 30, 2014, there were 68 shares of common stock reserved for future issuance under the ESPP.
13. Earnings Per Share
The following table sets forth the calculations of basic and diluted earnings per share:
| Fiscal Year Ended June 30, | ||||||||||||
| 2014 | 2013 | 2012 | ||||||||||
| Basic: |
||||||||||||
| Net income |
$ | 13,663 | $ | 36,193 | $ | 10,883 | ||||||
|
|
|
|
|
|
|
|||||||
| Weighted-average common shares |
31,830 | 34,777 | 34,678 | |||||||||
|
|
|
|
|
|
|
|||||||
| Basic earnings per share |
$ | 0.43 | $ | 1.04 | $ | 0.31 | ||||||
|
|
|
|
|
|
|
|||||||
| Diluted: |
||||||||||||
| Net income |
$ | 13,663 | $ | 36,193 | $ | 10,883 | ||||||
|
|
|
|
|
|
|
|||||||
| Weighted-average common shares |
31,830 | 34,777 | 34,678 | |||||||||
| Potential common stock arising from stock options and restricted stock |
361 | 280 | 433 | |||||||||
|
|
|
|
|
|
|
|||||||
| Weighted-average common shares – diluted |
32,191 | 35,057 | 35,111 | |||||||||
|
|
|
|
|
|
|
|||||||
| Diluted earnings per share |
$ | 0.42 | $ | 1.03 | $ | 0.31 | ||||||
|
|
|
|
|
|
|
|||||||
Outstanding options and restricted stock awards equivalent to 1,557, 2,149 and 2,563 shares of common stock were excluded from the calculation of diluted earnings per share for the fiscal years ended June 30, 2014, 2013 and 2012, respectively, because their effect would have been anti-dilutive.
14. Leases
We lease various technology hardware; real estate used as engineering offices, satellite offices or storage facilities; various vehicles and equipment; and two airplanes under operating leases with terms ranging from one to ten years. We also rent various vehicles and equipment on short-term, month-to-month lease agreements. Many of these leases have automatic renewal features and we have no material escalation clauses. At June 30, 2014, the future minimum lease payments under the operating leases in each of the next five fiscal years ending June 30 and thereafter are as follows:
73
Table of Contents
| 2015 |
$ | 18,912 | ||
| 2016 |
17,452 | |||
| 2017 |
14,939 | |||
| 2018 |
13,016 | |||
| 2019 |
8,880 | |||
| Thereafter |
8,282 | |||
|
|
|
|||
| $ | 81,481 | |||
|
|
|
Rent expense related to operating leases was approximately $19,031, $15,576 and $11,061 for the fiscal years ended June 30, 2014, 2013 and 2012, respectively. We do not have any leases that are classified as capital leases for any of the periods presented in these financial statements.
During fiscal 2014, 2013 and 2012, we entered into various sales leaseback agreements with third parties whereby vehicles were sold and are being leased by us over periods ranging between five to seven years. The transactions were recorded as operating leases and are included in the table above. Gains on the sales of the vehicles have been deferred and are being amortized over the term of the lease agreements.
| 15. | Deferred Compensation |
In March 2011, we established a new deferred compensation plan for the purpose of providing certain employees with the opportunity to defer certain payments of base salary and annual bonuses, and receive employer contributions, in accordance with the terms and provisions of the plan agreement. Amounts deferred under this plan by an employee will not be taxable to the employee for income tax purposes until the time actually received by the employee. Deferred compensation plan assets and related liabilities for these benefits totaled $2,148 and $1,396 as of June 30, 2014 and 2013, respectively, and are included in other long-term assets and other long-term liabilities on the consolidated balance sheets.
In connection with the acquisition of Red Simpson, Inc. on July 1, 2004, we agreed to pay, as part of the purchase price, $26,000 in deferred compensation over a two-year period. We also agreed to pay an additional $29,100 in deferred compensation over four years if the employees continued their employment.
In May 2005, the deferred compensation plan was amended to eliminate the future service requirement and fully vest the benefits under the plan. The amendment provides that, if an employee continues to be employed, dies, becomes disabled, retires, or is terminated for other than “cause” as defined in the amendment, the amounts under the deferred compensation plan will be paid out in accordance with the original four-year payment term. Generally under the amendment, if an employee voluntarily terminates or is terminated for cause, then any remaining unpaid amounts under the deferred compensation plan are paid out on the fifteenth anniversary (2019) of the initial payment date plus interest. The interest rate is to be determined by us based upon a risk-free interest rate plus a margin reflecting an appropriate risk premium. Generally under the amendment, if an employee is terminated for “specified cause,” as defined in the amendment, then all unpaid amounts under the deferred compensation plan are forfeited.
Accretion of interest on deferred compensation liabilities was $255, $243 and $312 for the fiscal years ended June 30, 2014, 2013 and 2012, respectively, and is included in interest expense on the consolidated statements of income.
74
Table of Contents
The following table sets forth the approximate amounts of deferred compensation related to the acquisition of Red Simpson remaining to be paid in each of the next five fiscal years ending June 30 and thereafter:
| 2015 |
$ | — | ||
| 2016 |
— | |||
| 2017 |
2,087 | |||
| 2018 |
— | |||
| 2019 |
— | |||
| Thereafter |
4,515 | |||
|
|
|
|||
| Total |
6,602 | |||
| Less amount representing interest |
(1,311 | ) | ||
|
|
|
|||
| Present value of expected payments |
5,291 | |||
| Less current portion |
— | |||
|
|
|
|||
| Deferred compensation, net of current portion |
$ | 5,291 | ||
|
|
|
| 16. | Financial Instruments |
Concentrations of Credit Risk
Financial instruments, which potentially subject us to concentrations of credit risk, consist primarily of accounts receivable and costs and estimated earnings in excess of billings on uncompleted contracts. Due to the high-credit quality of our customers, credit risk relating to accounts receivable is limited and credit losses have generally been within management’s estimates. We perform periodic credit evaluations of our customers’ financial condition, but generally do not require collateral. Duke Energy, which now includes legacy Progress Energy, was our only customer that represented greater than 10% of our total revenues during that time frame, with approximately 16%, 17% and 22% for fiscal 2014, 2013 and 2012 total revenues primarily generated from our Construction segment (adjusted to include those revenues attributable to Progress Energy), respectively. We had accounts receivable greater than 10% of our consolidated balance from two customers of $21,350 at June 30, 2014. We had accounts receivable greater than 10% of our consolidated balance from one customer of $13,843 at June 30, 2013.
At June 30, 2014 and 2013, we had cash in excess of federally insured limits on deposit with financial institutions of approximately $285 and $1,372, respectively.
Off-Balance Sheet Risk
For June 30, 2014 and 2013, we had letters of credit outstanding totaling $4,000 and $4,069, respectively, as required by our workers’ compensation, general liability and vehicle liability insurance providers and to the surety bond holder.
| 17. | Related Party Transactions and Agreements |
Stockholders Agreement
We and certain of our shareholders, including certain of our executive officers, are parties to a Stockholders Agreement dated April 18, 2002, as amended, which provides such shareholders registration rights for the shares of our common stock they hold. Specifically, each of the shareholders party to the Stockholders Agreement has “piggyback” registration rights where, if we propose to register any of our securities for sale for our own account, other than a registration in connection with an employee benefit or similar plan or an acquisition or an exchange offer, we will be required to provide them the opportunity to participate in such registration.
Company Share Repurchase
As previously discussed in Note 7, we entered into the Repurchase Agreement pursuant to which we agreed to purchase $40,000 of our common stock from the Selling Shareholder concurrently with the closing of an underwritten secondary offering by the Selling Shareholder. At the time of such offering and the negotiation of the
75
Table of Contents
Repurchase Agreement, two affiliates of the Selling Shareholder, Robert D. Lindsay and J. Russell Triedman, were members of our board of directors. Consequently, the Repurchase Agreement was negotiated, reviewed and recommended by a special committee of our board of directors, composed entirely of independent directors, who were advised by independent financial advisors and independent legal counsel.
| 18. | Commitments and Contingencies |
Legal Proceedings
We are from time to time a party to various lawsuits, claims and other legal proceedings that arise in the ordinary course of business. These actions typically seek, among other things: (i) compensation for alleged personal injury, workers’ compensation, employment discrimination, breach of contract, property damage, (ii) punitive damages, civil penalties or other damages, or (iii) injunctive or declaratory relief. With respect to all such lawsuits, claims and proceedings, we accrue reserves when it is probable that a liability has been incurred and the amount of loss can be reasonably estimated. We do not believe that any of these proceedings, individually or in the aggregate, would be expected to have a material adverse effect on our results of operations, financial position or cash flows.
Purchase Obligations
As of June 30, 2014, we had $30,287 in purchase obligations related to materials and subcontractor services for customer contracts, all of which are expected to be completed within twelve months.
Performance Bonds and Parent Guarantees
In the ordinary course of business, we are required by certain customers to post surety or performance bonds in connection with services that we provide to them. These bonds provide a guarantee to the customer that we will perform under the terms of a contract and that we will pay subcontractors and vendors. If we fail to perform under a contract or to pay subcontractors and vendors, the customer may demand that the surety make payments or provide services under the bond. We must reimburse the surety for any expenses or outlays it incurs. As of June 30, 2014, we had $106,072 in surety bonds outstanding. To date, we have not been required to make any reimbursements to our sureties for bond-related costs. We believe that it is unlikely that we will have to fund significant claims under our surety arrangements in the foreseeable future. Pike Corporation, from time to time, guarantees the obligations of its wholly-owned subsidiaries, including obligations under certain contracts with customers.
Collective Bargaining Agreements
Several of our subsidiaries are party to collective bargaining agreements with unions representing craftworkers performing field construction operations. The collective bargaining agreements expire at various times and have typically been renegotiated and renewed on terms similar to the ones contained in the expiring agreements. The agreements require those subsidiaries to pay specified wages, provide certain benefits to their respective union employees and contribute certain amounts to multi-employer pension plans and employee benefit trusts. These subsidiaries’ multi-employer pension plan contribution rates generally are specified in the collective bargaining agreements (usually on an annual basis), and contributions are made to the plans on a “pay-as-you-go” basis based on its union employee payrolls, which cannot be determined for future periods because the location and number of union employees that any such subsidiary employs at any given time and the plans in which they may participate vary depending on the projects we have ongoing at any time and the need for union resources in connection with those projects. If any of these subsidiaries withdrew from, or otherwise terminated its participation in, one or more multi-employer pension plans or if the plans were to otherwise become underfunded, it could be assessed liabilities for additional contributions related to the underfunding of these plans. We are not aware of any material amounts of withdrawal liability that have been incurred as a result of a withdrawal by any of our subsidiaries from any multi-employer defined benefit pension plans.
76
Table of Contents
Indemnities
We generally indemnify our customers for the services we provide under our contracts, as well as other specified liabilities, which may subject us to indemnity claims and liabilities and related litigation. As of June 30, 2014, we do not believe that any future indemnity claims against us would have a material adverse effect on our results of operations, financial position or cash flows.
| 19. | Business Segment Information |
As a result of the acquisition of UCS expanding the size and scope of our engineering business, we decided in the first quarter of fiscal 2013 to change our reportable segments. Prior to December 31, 2013, our operations were managed in four business units, which were shown as two reportable segments for financial reporting purposes: Construction and All Other Operations. These segments were organized principally by service category. Each segment had its own management that was responsible for the operations of the segment’s businesses. On January 1, 2014, as a result of the merger of UC Synergetic, Inc. into Pike Energy Solutions, LLC discussed in Note 2, changes in management reflecting sole leadership over the combined engineering entity, and in order to properly align our segments with our current financial reporting structure, we changed the name of our All Other Operations segment to Engineering and will manage our operations as two business units. Prior fiscal year segment information has been revised to conform to the current-year presentation.
The types of services from which each reportable segment derives its revenues are as follows:
| • | Construction includes installation, maintenance and repair of power delivery systems, including storm restoration services. The Construction segment accounted for 81%, 83% and 90% of consolidated revenues for the fiscal years ended June 30, 2014, 2013 and 2012. |
| • | Engineering includes siting, permitting, engineering and design of power and communication delivery systems, including storm assessment and inspection services. |
We evaluate the operating performance of our segments based upon segment income from operations. The Other column below represents certain corporate general and administrative costs not allocated to the segments. We review total assets at the consolidated level and, accordingly, those amounts have not been disclosed for each reportable segment. The accounting policies of the segments are consistent with those described in Note 2.
77
Table of Contents
| Fiscal Year Ended June 30, 2014 | ||||||||||||||||
| Construction | Engineering | Other | Total | |||||||||||||
| Core services |
$ | 592,095 | $ | 184,136 | $ | — | $ | 776,231 | ||||||||
| Less: Intersegment revenues |
(345 | ) | (32,657 | ) | — | (33,002 | ) | |||||||||
|
|
|
|
|
|
|
|
|
|||||||||
| Core services, net |
591,750 | 151,479 | — | 743,229 | ||||||||||||
| Storm-related services |
64,810 | 2,621 | — | 67,431 | ||||||||||||
|
|
|
|
|
|
|
|
|
|||||||||
| Revenues, net |
$ | 656,560 | $ | 154,100 | $ | — | $ | 810,660 | ||||||||
| Income (loss) from operations |
$ | 27,460 | $ | 3,849 | $ | (504 | ) | $ | 30,805 | |||||||
| Depreciation and amortization |
$ | 34,390 | $ | 5,113 | $ | — | $ | 39,503 | ||||||||
| Purchases of property and equipment |
$ | 30,756 | $ | 1,468 | $ | — | $ | 32,224 | ||||||||
| Fiscal Year Ended June 30, 2013 | ||||||||||||||||
| Construction | Engineering | Other | Total | |||||||||||||
| Core services |
$ | 605,666 | $ | 183,775 | $ | — | $ | 789,441 | ||||||||
| Less: Intersegment revenues |
(657 | ) | (37,420 | ) | — | (38,077 | ) | |||||||||
|
|
|
|
|
|
|
|
|
|||||||||
| Core services, net |
605,009 | 146,355 | — | 751,364 | ||||||||||||
| Storm-related services |
157,865 | 9,462 | — | 167,327 | ||||||||||||
|
|
|
|
|
|
|
|
|
|||||||||
| Revenues, net |
$ | 762,874 | $ | 155,817 | $ | — | $ | 918,691 | ||||||||
| Income (loss) from operations |
$ | 69,148 | $ | 5,053 | $ | (6,118 | ) | $ | 68,083 | |||||||
| Depreciation and amortization |
$ | 36,162 | $ | 5,269 | $ | — | $ | 41,431 | ||||||||
| Purchases of property and equipment |
$ | 39,505 | $ | 850 | $ | — | $ | 40,355 | ||||||||
| Fiscal Year Ended June 30, 2012 | ||||||||||||||||
| Construction | Engineering | Other | Total | |||||||||||||
| Core services |
$ | 552,048 | $ | 78,602 | $ | — | $ | 630,650 | ||||||||
| Less: Intersegment revenues |
(8,066 | ) | (7,961 | ) | — | (16,027 | ) | |||||||||
|
|
|
|
|
|
|
|
|
|||||||||
| Core services, net |
543,982 | 70,641 | — | 614,623 | ||||||||||||
| Storm-related services |
70,546 | — | — | 70,546 | ||||||||||||
|
|
|
|
|
|
|
|
|
|||||||||
| Revenues, net |
$ | 614,528 | $ | 70,641 | $ | — | $ | 685,169 | ||||||||
| Income (loss) from operations |
$ | 25,885 | $ | 2,177 | $ | (1,964 | ) | $ | 26,098 | |||||||
| Depreciation and amortization |
$ | 37,463 | $ | 791 | $ | — | $ | 38,254 | ||||||||
| Purchases of property and equipment |
$ | 33,852 | $ | — | $ | — | $ | 33,852 | ||||||||
78
Table of Contents
| 20. | Quarterly Data - Unaudited |
The following table presents the quarterly operating results for the fiscal years ended June 30, 2014 and 2013:
| Quarter Ended | ||||||||||||||||
| September 30, | December 31, | March 31, | June 30, | |||||||||||||
| Fiscal 2014: |
||||||||||||||||
| Revenues |
$ | 193,307 | $ | 210,859 | $ | 207,583 | $ | 198,911 | ||||||||
| Gross profit |
19,896 | 30,912 | 26,246 | 26,677 | ||||||||||||
| Net income (1) |
959 | 5,660 | 2,828 | 4,216 | ||||||||||||
| Basic income per share |
$ | 0.03 | $ | 0.18 | $ | 0.09 | $ | 0.13 | ||||||||
| Diluted income per share |
$ | 0.03 | $ | 0.18 | $ | 0.09 | $ | 0.13 | ||||||||
| Fiscal 2013: |
||||||||||||||||
| Revenues |
$ | 244,613 | $ | 273,668 | $ | 200,222 | $ | 200,188 | ||||||||
| Gross profit |
36,922 | 59,234 | 25,045 | 26,015 | ||||||||||||
| Net income (2) |
9,282 | 23,602 | 2,693 | 616 | ||||||||||||
| Basic income per share |
$ | 0.26 | $ | 0.67 | $ | 0.08 | $ | 0.02 | ||||||||
| Diluted income per share |
$ | 0.26 | $ | 0.67 | $ | 0.08 | $ | 0.02 | ||||||||
| (1) | In fiscal 2014, we incurred approximately $1,000 in fees and expenses in connection with an Agreement and Plan of Merger that we entered into on August 4, 2014 all of which were incurred in the quarter ended June 30, 2014. See Note 21 for additional information. |
| (2) | In fiscal 2013, we incurred fees and expenses totaling $4,138 in connection with the secondary equity offering and concurrent share repurchase, both of which closed on May 21, 2013. Approximately $2,900 of these costs were incurred in the quarter ended June 30, 2013. See Note 7 for additional information. |
Earnings per share amounts for each quarter are required to be computed independently. As a result, their sum may not equal the total year basic and diluted earnings per share.
| 21. | Subsequent Event |
Agreement and Plan of Merger
On August 4, 2014, the Company entered into an Agreement and Plan of Merger with Pioneer Parent, Inc., a Delaware corporation (“Parent”), and Pioneer Merger Sub, Inc., a North Carolina corporation and a direct, wholly-owned subsidiary of Parent (“Merger Sub”), providing for the merger of Merger Sub with and into the Company (the “Merger”), with the Company surviving the Merger as a wholly-owned subsidiary of Parent. Parent is owned by an investment fund affiliated with Court Square Capital Partners. J. Eric Pike, Chairman and Chief Executive Officer of the Company, will be a director, officer and shareholder of Parent after completion of the Merger. The Merger has a total transaction value of approximately $595,000, consisting of an equity value of approximately $395,000 and net debt of approximately $200,000. Each of the Company’s shareholders (other than certain excluded shares and dissenting shares) will receive $12.00 in cash, without interest and less any applicable withholding taxes, for each share of the Company’s common stock they hold. We incurred approximately $1,000 in fees and expenses in connection with the Agreement and Plan of Merger. Approximately $700 of these costs were non-deductible for income tax purposes
The board of directors of the Company, acting on the unanimous recommendation of a special committee comprised entirely of independent and disinterested directors, adopted the merger agreement and resolved to submit it to the Company’s shareholders for their approval. The transaction is expected to be completed in the second quarter of the Company’s 2015 fiscal year, subject to receipt of approval from the Company’s shareholders and regulatory approvals, and satisfaction of other customary closing conditions.
79
Table of Contents
| ITEM 9. | CHANGES IN AND DISAGREEMENTS WITH ACCOUNTANTS ON ACCOUNTING AND FINANCIAL DISCLOSURE |
There are no changes in accountants or disagreements with accountants on accounting principles and financial disclosures required to be disclosed in this Item 9.
| ITEM 9A. | CONTROLS AND PROCEDURES |
Evaluation of Disclosure Controls and Procedures
Our management has established and maintains a system of disclosure controls and procedures that are designed to provide reasonable assurance that information required to be disclosed by us in the reports that we file or submit under the Exchange Act, such as this report, is recorded, processed, summarized and reported within the time periods specified in the SEC’s rules and forms. The disclosure controls and procedures are also designed to provide reasonable assurance that such information is accumulated and communicated to our management, including our Chief Executive Officer and Chief Financial Officer, as appropriate to allow timely decisions regarding required disclosure.
As of the end of the period covered by this report, we evaluated the effectiveness of the design and operation of our “disclosure controls and procedures” (as defined in Rule 13a-15(e) of the Exchange Act) pursuant to Rule 13a-15(b) of the Exchange Act. This evaluation was carried out under the supervision and with the participation of our management, including our Chief Executive Officer and Chief Financial Officer. Based on this evaluation, these officers have concluded that, as of June 30, 2014, our disclosure controls and procedures were effective to provide reasonable assurance of achieving their objectives.
Internal Control over Financial Reporting
There has been no change in our internal control over financial reporting during the quarter ended June 30, 2014 that has materially affected, or is reasonably likely to materially affect, our internal control over financial reporting.
Design and Operation of Control Systems
Our management, including our Chief Executive Officer and Chief Financial Officer, does not expect that our disclosure controls and procedures or our internal control over financial reporting will prevent or detect all errors and all fraud. A control system, no matter how well designed and operated, can provide only reasonable, not absolute, assurance that the control system’s objectives will be met. The design of a control system must reflect the fact that there are resource constraints, and the benefits of controls must be considered relative to their costs. Further, because of the inherent limitations in all control systems, no evaluation of controls can provide absolute assurance that misstatements due to error or fraud will not occur or that all control issues and instances of fraud, if any, within our company have been detected. These inherent limitations include the realities that judgments in decision-making can be faulty and breakdowns can occur because of simple errors or mistakes. Controls can be circumvented by the individual acts of some persons, by collusion of two or more people, or by management override of the controls. The design of any system of controls is based in part on certain assumptions about the likelihood of future events, and there can be no assurance that any design will succeed in achieving its stated goals under all potential future conditions. Over time, controls may become inadequate because of changes in conditions or deterioration in the degree of compliance with policies or procedures.
| ITEM 9B. | OTHER INFORMATION |
Not applicable.
80
Table of Contents
| ITEM 10. | DIRECTORS, EXECUTIVE OFFICERS AND CORPORATE GOVERNANCE |
Board of Directors
Listed below are the six members of our board of directors (the “Board”). The following paragraphs include information about each director’s business background, as furnished to the Company by the director, and additional experience, qualifications, attributes or skills that led the Board to conclude that the director should serve on the Board. All of the directors were elected to the Board at the Company’s 2013 Annual Meeting of Shareholders to hold office until the Company’s 2014 Annual Meeting of Shareholders and the election of their successors.
| Name |
Age | Principal Occupation |
Director Since |
|||||||
| J. Eric Pike |
46 | Chairman of the Board and Chief Executive Officer of Pike Corporation | 1994 | |||||||
| Charles E. Bayless |
71 | President and Provost, West Virginia University Institute of Technology (Retired) | 2006 | |||||||
| James R. Helvey III |
55 | Managing Partner, Cassia Capital Partners, LLC | 2005 | |||||||
| Peter Pace |
68 | General, United States Marine Corps (Retired) | 2010 | |||||||
| Daniel J. Sullivan III |
68 | President, Flyway, LLC | 2007 | |||||||
| James L. Turner |
55 | Consulting Executive Mentor, Merryck & Co. Limited | 2012 | |||||||
J. Eric Pike
Mr. Pike is Chairman of the Board and Chief Executive Officer of the Company. Mr. Pike has been President of the Company since 1998, Chief Executive Officer since 2002 and Chairman since 2005. He is the grandson of founder Floyd Pike and joined the Company in 1990 as an A-class lineman on an overhead construction crew, advancing through various office positions, and served as Vice President of the Central Region from 1993 to 1998, where he was responsible for the powerline operations in North Carolina and South Carolina. Mr. Pike graduated from Emory University with a B.A. in History.
Mr. Pike brings extensive business, managerial and leadership experience to the Board. With over 20 years of experience with the Company, Mr. Pike provides the Board with a vital understanding and appreciation of the Company’s business and the industry. His strong leadership skills have been demonstrated through his service as the Company’s Chief Executive Officer since 2002 and as Chairman of the Board since 2005. He is also a large shareholder of the Company and, as a member of the Company’s founding family, maintains a unique position within the corporate organization.
Charles E. Bayless
Mr. Bayless is the retired President and Provost of the West Virginia University Institute of Technology, where he served in such capacities from 2005 until 2008. Mr. Bayless served as Chairman, President and Chief Executive Officer of Illinova Corporation, an electric utility company, from 1998 to 1999. From 1992 to 1998, he served as Chief Executive Officer of UniSource Energy Corp., an electric utility company. Mr. Bayless holds a B.S.E.E. from the West Virginia University Institute of Technology, an M.S.E.E. in Power Engineering and a J.D. from West Virginia University and an M.B.A. from the Graduate School of Business Administration at the University of Michigan.
Mr. Bayless’ significant business experience, including executive, operational and legal roles in the energy industry as well as in the higher education arena, qualifies him for service as a member of the Board.
81
Table of Contents
James R. Helvey III
Mr. Helvey co-founded Cassia Capital Partners, LLC, a registered investment advisor, in 2011 and has served as a managing partner since its formation. From 2005 to 2011, Mr. Helvey was a partner and the Risk Management Officer for CMT Asset Management Limited, a private investment firm. From 2003 to 2004, Mr. Helvey was a candidate for the United States Congress in the 5th District of North Carolina. Mr. Helvey served as Chairman and Chief Executive Officer of Cygnifi Derivatives Services, LLC, an online derivatives services provider, from 2000 to 2002. From 1985 to 2000, Mr. Helvey was employed by J.P. Morgan & Co., serving in a variety of capacities, including as Vice Chairman of J.P. Morgan’s Risk Management Committee, Global Head of Derivative Counterparty Risk Management, head of the swap derivative trading business in Asia and head of short-term interest rate derivatives and foreign exchange forward trading in Europe. Mr. Helvey graduated magna cum laude with honors in 1981 from Wake Forest University. In 1982, Mr. Helvey was a Fulbright Scholar at the University of Cologne in Germany, and, in 1984, Mr. Helvey received a Master’s degree in international finance and banking from Columbia University, School of International and Public Affairs, where he was an International Fellow. Mr. Helvey is a director of Piedmont Federal Savings Bank and Verger Capital Management, LLC, and he has served as a member of the Wake Forest University Board of Trustees since 1998.
Mr. Helvey’s experience in international business and finance, executive management, and as a director of other organizations brings a valuable and necessary perspective to the Board, and qualifies him to serve on the Board.
Peter Pace
General Pace was the sixteenth Chairman of the Joint Chiefs of Staff from 2005 to 2007, where he served as the principal military advisor to the President, the Secretary of Defense, the National Security Council and the Homeland Security Council. He is the first Marine to have held this position. General Pace held command at virtually every level in the United States Marine Corps. He is a graduate of the United States Naval Academy, holds an M.B.A. from George Washington University and attended Harvard University for the Senior Executives in National and International Security program. General Pace currently serves as a director of AAR Corp., Qualys, Inc. and Textura Corporation. He was a director of LaserLock Technologies, Inc. until February 2014.
General Pace brings to the Board a unique and valuable perspective from his years of proven leadership, beginning in the United States Marine Corps and culminating as the Chairman of the Joint Chiefs of Staff. General Pace’s extensive leadership and board experience qualifies him for service on the Board.
Daniel J. Sullivan III
Mr. Sullivan is President of Flyway, LLC, a private investment company, a position he has held since 2008. He was the President and Chief Executive Officer of FedEx Ground Package System, Inc., a wholly-owned subsidiary of FedEx Corporation, from 1998 until his retirement in 2006. From 1996 to 1998, Mr. Sullivan was the Chairman, President and Chief Executive Officer of Caliber System, Inc. In 1995, he was the Chairman, President and Chief Executive Officer of Roadway Services, Inc. Mr. Sullivan is a graduate of Amherst College. He also serves as a director of Computer Task Group, Inc., Schneider National, Inc. and the Medical University of South Carolina Foundation.
Mr. Sullivan’s operational experience, particularly with companies having large employee workforces across numerous geographical markets, as well as his executive, managerial and other board experience, make him qualified to serve on the Board.
James L. Turner
Mr. Turner currently serves as a consulting executive mentor with Merryck & Co. Limited, a leading global business leader mentoring firm, a position he has held since January 2012. Mr. Turner also serves as President of JLT Consulting, Inc., an Indiana subchapter S corporation engaged in energy and leadership related consulting and advice, a position he has held since September 2013. Previously, he served as Group Executive of Duke Energy Corporation, an energy company, and President and Chief Operating Officer of Duke Energy’s U.S. Franchised Electric and Gas business from May 2007 until December 2010. From October 2006 to April 2007, Mr. Turner served as Group Executive and President, U.S. Franchised Electric and Gas, of Duke Energy. From April 2006, upon the merger of Duke Energy and Cinergy Corp., to September 2006, he served as Group Executive and Chief Commercial Officer, U.S. Franchised Electric and Gas, of Duke Energy. From August 2005 until the merger of Duke Energy and Cinergy
82
Table of Contents
Corp., Mr. Turner served as President of Cinergy Corp., an energy company; from September 2004 to August 2005 as Executive Vice President and Chief Financial Officer of Cinergy; and from December 2001 to September 2004 as Executive Vice President and Chief Executive Officer, Regulated Business Unit of Cinergy. Mr. Turner holds a B.S. in Political Science from Ball State University and a J.D. from Indiana University School of Law. Mr. Turner was a director of EnerNOC, Inc. until 2010.
Mr. Turner’s extensive executive management experience at energy and utility companies, legal experience and background, and substantial expertise in the energy industry qualify him for service as a member of the Board.
Executive Officers
Set forth below is a list of the names and ages of the Company’s executive officers indicating all positions and offices held by each such person and each person’s principal occupations or employment during the past five years. Each officer is elected annually by the Board.
J. Eric Pike. Mr. Pike, age 46, is Chairman of the Board and Chief Executive Officer of the Company. Mr. Pike has been President of the Company since 1998, Chief Executive Officer since 2002 and Chairman since 2005. Additional information about Mr. Pike can be found above under “Board of Directors.”
Anthony K. Slater. Mr. Slater, age 44, has been Chief Financial Officer since August 2006 and Executive Vice President since May 2009. Mr. Slater is responsible for financial reporting and the supervision of all finance and accounting functions, corporate planning, and mergers and acquisitions. Prior to assuming this position, Mr. Slater served as the Vice President of Finance beginning in February 2006. Mr. Slater served as the Chief Financial Officer of Universal Solutions International, Inc., a provider of supply chain analysis and reverse logistic services, from January 2005 to December 2005 and as Vice President of Finance and Accounting as well as Secretary from July 2003 until December 2004. Prior to joining Universal Solutions, he served as Vice President of Accounting and Financial Reporting for Konover Property Trust Inc., a self-administered REIT, from 1999 to 2002. Mr. Slater graduated magna cum laude from North Carolina State University with a B.A. in Accounting and also is a certified public accountant.
Audie G. Simmons. Mr. Simmons, age 58, has been Executive Vice President of Operations since November 2008 and serves as the principal operating officer. Mr. Simmons has over 35 years of operational experience with the Company, including serving as the Senior Vice President of Operations from November 2006 until November 2008 and as Vice President of Fleet and Operations immediately prior to becoming Senior Vice President of Operations.
James T. Benfield. Mr. Benfield, age 52, has been President of Pike Electric, LLC since October 2010 and previously was the Senior Vice President of Operations from November 2008 until October 2010. He is responsible for managing and supervising Pike Electric, LLC, whose operational focus is on construction and maintenance of substation, distribution (underground and overhead) and transmission with voltages up to 345 kV with a non-unionized workforce throughout the South, Southeast and Midatlantic United States. He joined the Company in 1985 as a project manager. Previously, he has served as a regional vice president of operations in several operating regions. Mr. Benfield received a B.S. in Electrical Engineering from North Carolina State University.
Timothy G. Harshbarger. Mr. Harshbarger, age 54, has been Senior Vice President of Human Resources since August 2007 and is responsible for managing and supervising the Company’s human resources and risk management. Prior to assuming this position, Mr. Harshbarger spent 21 years at American Electric Power where he held a number of positions including Executive Assistant to the Chairman/CEO, Vice President of HR Services & Operations and Director Business Development. He received his B.S. from Purdue University and his M.B.A. from The Ohio State University’s Fisher College of Business.
Section 16(a) Beneficial Ownership Reporting Compliance
Section 16(a) of the Exchange Act requires the Company’s directors, executive officers and certain persons who beneficially own more than 10% of our common stock to file with the SEC initial reports of ownership and reports of changes in ownership of our common stock and other equity securities. Based solely on a review of reports filed with the SEC and written representations that no other reports were required, the Company believes that its directors, executive officers and greater than 10% shareholders complied with all applicable filing requirements on a timely basis during fiscal year 2014.
83
Table of Contents
Corporate Governance Matters
Code of Business Conduct and Ethics
We have adopted a written code of conduct, known as the Code of Business Conduct and Ethics, which is intended to qualify as a “code of ethics” within the meaning of Item 406 of Regulation S-K of the Exchange Act (the “Code”). The Code applies to our directors and employees, including our principal executive officer, principal financial officer, principal accounting officer and persons performing similar functions, and includes guidelines relating to the ethical handling of actual or apparent conflicts of interest, compliance with laws, accurate financial reporting and procedures for promoting compliance with, and reporting violations of, the Code. The Code is available on our website, www.pike.com, in the “Investor Center” section under the “Corporate Governance” caption. A copy of the Code is also available in print free of charge to any person, upon request, by contacting the Company at: Pike Corporation, 100 Pike Way, PO Box 868, Mount Airy, North Carolina 27030, Attn.: Investor Relations, or by telephone at (336) 719-4622.
We will disclose information pertaining to any amendment to, or waiver from, the provisions of the Code that apply to our principal executive officer, principal financial officer, principal accounting officer or persons performing similar functions and that relate to the elements of the Code enumerated in the SEC rules and regulations (the “SEC rules”) by posting this information on our website, www.pike.com, promptly following the date of such amendment or waiver. The information on our website is not a part of this Form 10-K and is not incorporated by reference in this report or any of our other filings with the SEC.
Corporate Governance Guidelines and Committee Charters
In furtherance of its longstanding goal of providing effective governance of the Company’s business and affairs for the benefit of shareholders, the Board has adopted written corporate governance policies, principles and guidelines, known as the Corporate Governance Guidelines (the “Guidelines”), which contain general principles regarding the functions of the Board. The Guidelines, as well as the charters for the Company’s audit committee, compensation committee and nominating and governance committee, are available on the Company’s website, www.pike.com, in the “Investor Center” section under the “Corporate Governance” caption. These materials are also available in print free of charge to any person upon request by contacting the Company at: Pike Corporation, 100 Pike Way, PO Box 868, Mount Airy, North Carolina 27030, Attn.: Investor Relations, or by telephone at (336) 719-4622.
Audit Committee
The Board has a standing audit committee, which was established in accordance with Section 3(a)(58)(A) of the Exchange Act. The audit committee assists the Board in fulfilling its oversight responsibility for: (i) the accounting, reporting and financial practices of the Company, including the integrity of the Company’s financial statements; (ii) the effectiveness of the Company’s internal controls over financial reporting; (iii) the qualifications, performance and independence of the Company’s registered public accounting firm; (iv) performance of the Company’s internal audit function; (v) the Company’s compliance with legal and regulatory requirements; and (vi) management of key risks associated with the Company’s financial and accounting practices. The audit committee, among other things, is responsible for the appointment, compensation and oversight of the independent registered public accounting firm and reviews the financial statements, audit reports, internal controls and internal audit procedures. Charles E. Bayless (Chair), James R. Helvey III, Peter Pace, Daniel J. Sullivan III and James L. Turner serve on the audit committee. Each member of the audit committee has been determined to be an independent director under the Director Independence Standards (as hereinafter defined), the New York Stock Exchange rules and regulations (the “NYSE rules”) and the SEC rules.
84
Table of Contents
Audit Committee Financial Expert
The Board has determined that Messrs. Bayless and Helvey are “audit committee financial experts” within the meaning of the SEC rules and that Messrs. Bayless and Helvey are “independent” as that term is defined under Rule 10A-3(b)(1)(ii) of the Exchange Act, the Director Independence Standards and the NYSE rules.
| ITEM 11. | EXECUTIVE COMPENSATION |
Compensation Discussion and Analysis
This section explains the Company’s executive compensation program as it relates to the following “named executive officers” of the Company:
| J. Eric Pike | Chairman of the Board and Chief Executive Officer | |
| Anthony K. Slater | Executive Vice President and Chief Financial Officer | |
| Audie G. Simmons | Executive Vice President of Operations | |
| James T. Benfield | President, Pike Electric, LLC | |
| Timothy G. Harshbarger | Senior Vice President of Human Resources |
This discussion includes statements regarding financial and operating performance targets in the limited context of the executive compensation program. Investors should not evaluate these statements in any other context. These are not statements of management’s expectations of future results or guidance.
This discussion is divided into four parts:
| I. | Executive Compensation Program Objectives |
| II. | Determining Executive Compensation for Fiscal 2014 |
| III. | Other Benefits and Executive Compensation Policies |
| IV. | 2011 Say-on-Pay Advisory Vote |
| I. | Executive Compensation Program Objectives |
The executive compensation program is designed to further the goals of continued long-term success and creation of shareholder value. The primary objectives of the compensation program are to:
| • | attract and retain executive officers of outstanding quality by offering competitive annual base salaries; |
| • | reward the achievement of annual financial performance and strategic goals that the Board and management believe will lead to long-term growth in shareholder value; and |
| • | align executive officers’ interests with those of shareholders through equity awards. |
To accomplish these objectives, the compensation philosophy is as follows:
| • | position base salaries at or above the 50th percentile of executive compensation market surveys approved by the compensation committee of the Board (the “Committee”); |
| • | position target awards for annual and long-term performance at or above the 50th percentile of the approved compensation market surveys and of companies identified and approved by the Committee as representing a peer group for the Company; |
| • | position total cash compensation and total direct compensation at or above the 50th percentile of the approved compensation market surveys and the approved peer group; |
| • | obtain updated market information at least every two years from the Committee’s consultant for both executive compensation market surveys and peer group companies approved by the Committee; and |
85
Table of Contents
| • | establish performance metrics and targets for annual incentives that will result in total cash compensation above the targeted range when the Company performs well and below the targeted range when the Company does not. |
The Committee oversees the compensation program for the executive officers with the assistance of senior management. The Committee reviews, approves and determines all elements of compensation for each named executive officer.
| II. | Determining Executive Compensation for Fiscal 2014 |
Elements of Compensation
The compensation program had two principal elements for fiscal 2014:
| Element |
Description |
Purpose | ||
| Base Salary | Fixed cash compensation based on position, responsibility, individual performance, tenure and potential. | Provide a competitive, fixed, baseline level of cash compensation. | ||
| Management Incentive Plan | Cash payment tied to performance during the fiscal year. | Motivate officers to achieve annual strategic and financial goals. | ||
The Committee believes these elements provide an appropriate balance between competitive base and incentive compensation.
In prior years, the compensation program included equity-based awards tied to the long-term growth in value of Company common stock. The Committee previously decided to include performance-based equity awards in the long-term equity incentive compensation awards for 2014. The Committee began the process of designing the terms of the performance-based awards, appropriate award levels and transition awards and targeted late August 2014 for the date of the awards. Due to the pending Merger transaction pursuant to which Court Square Capital Partners in partnership with Mr. Pike will acquire the Company, the Committee did not make any equity-based awards for fiscal 2014.
Base Salaries
Base salaries are the foundation of the compensation program. They provide a fixed, baseline level of cash compensation based on each executive officer’s position, responsibilities, individual performance, tenure and potential. Base salary levels also impact amounts paid under other elements of the executive compensation program, including annual incentives and long-term incentive awards. The base salaries of executive officers are set at levels intended to be competitive with other companies engaged in similar activities and with other businesses of comparable size and scope that compete with the Company for executive talent. To attract and retain the level of talent necessary for the Company to succeed, the Committee expects that the base salaries generally will be at or above the 50th percentile of the range of base salaries for comparable positions when compared to the executive compensation market surveys and the Company’s peer group.
86
Table of Contents
In fiscal 2014, the Committee approved base salary increases of 3% for the named executive officers based on general market trends. The following table reflects the base salaries following such increases:
| Name |
FY 2014 Base Salary |
|||
| J. Eric Pike |
$ | 725,749 | ||
| Anthony K. Slater |
$ | 425,162 | ||
| Audie G. Simmons |
$ | 448,012 | ||
| James T. Benfield |
$ | 375,487 | ||
| Timothy G. Harshbarger |
$ | 323,895 | ||
Management Incentive Plan
The executive officers participated in an annual Management Incentive Plan in fiscal 2014, which provided each executive officer the opportunity to receive an annual cash award based on the achievement of corporate performance goals and individual performance. The criteria adopted for payment of the executive officers’ awards is as follows:
| Criteria |
Rationale | |
| Earnings Per Share (“EPS”) | Focuses executives on improving financial performance on an annual basis. | |
| Company-wide safety measured by the OSHA recordable incident rate for the fiscal year (“Safety Goal”) | Workforce safety is a very high priority for the Company and impacts not only the health and welfare of employees but is continuously monitored and evaluated by customers. | |
| Individual achievement of three specified personal goals (“Personal Goals”) | Provides financial reward for achievement of strategic initiatives and high priority projects assigned to specific individuals. | |
The Committee established EPS as the primary goal in the weighting of these factors. In fact, no awards could be earned for fiscal 2014 regardless of the achievement of the Safety Goal or Personal Goals unless the threshold level of EPS was achieved, as the Committee believes being a profitable enterprise is a condition precedent to an incentive award being paid. Mr. Benfield, as President of Pike Electric, LLC, participated in that entity’s Management Incentive Plan, which required that a threshold level of operating income be achieved before any payout would be earned for fiscal 2014 regardless of the achievement of the Safety Goal or Personal Goals. The Committee believes this balanced mix of performance measures is an effective motivator because these metrics correlate directly with the historical success factors of the Company and the executives’ ability to impact these performance results is clear.
Each executive officer was assigned a target award based on a percentage of base salary, a threshold level below which no amounts would be payable, and a maximum award representing 150% of such executive’s target award. Payouts were determined on a linear basis for achievement between threshold and target and between target and maximum award levels. The Committee believes the incentive targets and criteria were established at levels that are achievable but require a sustained level of high performance in areas important to continued success and growth. The Committee approved incentive targets as a percentage of base salary paid based on the Committee’s views of the scope of the job and market data. The approved target awards for fiscal 2014 for the named executive officers as a percentage of base salary are: Mr. Pike – 75%; Mr. Slater – 55%; Mr. Simmons – 60%; Mr. Benfield – 50%; and Mr. Harshbarger – 50%.
87
Table of Contents
The following chart shows the 2014 Management Incentive Plan performance goals and their respective weightings:
| Payout Level |
EPS (60% weighting) |
Safety
Goal (10% weighting) |
Personal
Goals (# attained) (30% weighting) |
|||||||||
| Threshold (50% Payout) |
$ | 0.52 | 3.30 | 1 | ||||||||
| Target (100% Payout) |
$ | 0.80 | 2.80 | 2 | ||||||||
| Maximum (150% Payout) |
$ | 0.87 | 2.30 | 3 | ||||||||
For fiscal 2014, actual EPS was $0.42, below the threshold EPS required for the payment of any incentive awards. Pike Electric, LLC achieved its operating income threshold.
Role of Compensation Consultant
The Committee retained Hay Group as its compensation consultant for fiscal 2014 executive officer and director compensation. At the Committee’s request, Hay Group reviewed the compensation program and amounts paid to executive officers for fiscal 2013 and the proposed amounts for fiscal 2014. Hay Group confirmed to the Committee that these amounts were consistent with the compensation philosophy. Hay Group also assisted the Committee with the design of the performance-based equity awards the Committee intended to make for fiscal 2014. As described earlier, the awards were not made due to the pending Merger of the Company.
Compensation Benchmarking
In making its compensation decisions, the Committee relies upon comparisons of the Company’s compensation program and compensation opportunities relative to the compensation paid to similarly-situated executives at peer group companies. This approach ensures that the compensation program and cost structure allow the Company to remain competitive in its markets. The Committee engages its compensation consultant to perform a compensation benchmarking analysis every other year.
In April 2014, at the Committee’s request, Hay Group reviewed the compensation program and performed a competitive analysis of the program, including each of the various components of the compensation program, against competitive benchmarking studies. Hay Group’s analysis used the following peer group companies: Aegion Corporation; Comfort Systems USA, Inc.; Dycom Industries, Inc.; Integrated Electrical Services, Inc.; MasTec, Inc.; Matrix Service Company; MYR Group Inc.; Quanta Services, Inc.; Sterling Construction Company, Inc.; Tetra Tech, Inc.; UniTek Global Services, Inc.; and Willbros Group, Inc. Michael Baker Corporation was removed from the peer group after its merger in 2013 with Integrated Mission Solutions. Hay Group’s analysis concluded that the Company’s target total direct compensation is at or slightly below the 50th percentile of the peer group companies. Hay Group’s analysis included the target value of equity-based awards historically made to the named executives. The named executives did not receive any equity-based awards for fiscal 2014. Therefore, their target total direct compensation was significantly below the 50th percentile.
| III. | Other Benefits and Executive Compensation Policies |
401(k) Savings Plan and Deferred Compensation Plan
The Company maintains a tax qualified defined contribution plan under Section 401(k) of the Internal Revenue Code of 1986, as amended (the “Tax Code”), for substantially all employees who are not subject to collective bargaining agreements, including the named executive officers. Employee elective deferral contributions to the 401(k) plan are made on a pre-tax basis. Contributions by the named executive officers are limited by the Tax Code.
88
Table of Contents
The Company also maintains the Pike Compensation Deferral Plan in order to provide the named executive officers and other eligible employees a means to save for retirement on a tax-deferred basis beyond the Tax Code limits. Participants may also receive limited employer matching contributions to make up for certain matching contributions that could not be made to the 401(k) plan due to the Tax Code limits. The plan is an unfunded, unsecured arrangement offering participants several deemed investment alternatives that operate similarly to the investment alternatives available under the 401(k) plan. The Company maintains a rabbi trust to informally fund the plan. The assets in the trust remain general assets of the Company, and do not offer protection for plan participants in the event of corporate insolvency.
Medical Benefits and Insurance
Officers, including the executive officers, are eligible to participate in a group medical benefits insurance program, which includes group health, dental and vision, on the same basis as other employees.
Life and Disability Insurance
The Company provided its officers, including executive officers, (i) basic life insurance with a death benefit of two times current base salary capped at $750,000 and supplemental life insurance with a death benefit of one times current base salary capped at $750,000, both rounded to the next highest thousand dollar increment; (ii) accidental death and dismemberment insurance with a death benefit of two times current base salary capped at $750,000; (iii) basic short-term and long-term group disability benefits, plus an individual supplemental long-term disability policy, that together provide 100% of salary for the first six months and 65% of salary for the remainder of the disability coverage period (generally ending no later than age 65 or a later date specified in the policy for disability that commences after age 60); and (iv) supplemental accidental death and dismemberment coverage with a death benefit of $250,000.
Retirement
The Company has a retirement policy that, upon the retirement of certain executive officers who are at least 55 years of age and have been an employee for 10 years or more, entitles such officers to receive the following: (i) the Company vehicle used by the officer at the time of retirement or the cash value of such vehicle; (ii) continued medical, dental and vision coverage; and (iii) continued life insurance coverage in the amount equal to two times current base salary capped at $750,000. Continuation of medical, dental, vision and life insurance for the officer will continue until the earlier of the date that officer attains age 65 or becomes eligible for Medicare. Coverage will also end if the officer becomes eligible for coverage under another program. Spouses and other dependents of that officer also receive post-retirement group medical, dental and vision coverage through age 65 for spouses and generally through age 26 for other dependents.
Other Benefits
Company officers, including the executive officers, are each provided a Company vehicle and fuel. The Company also provides income tax gross-up payments to executives in order to compensate them for taxes which may be imposed based upon their personal use of a Company vehicle and fuel. The Committee believes providing a Company vehicle and fuel is appropriate given the Company’s geographic location and the officers’ required travel and customer interaction. The tax gross-up is provided to make the cost of the vehicle and fuel neutral to the officers. In accordance with Mr. Pike’s employment agreement, he is eligible for up to 50 hours of personal use of Company aircraft per year so long as this use does not interfere with the normal business use of the aircraft.
Policy Regarding Timing of Equity Grants
Executives derive value from their options based on the appreciation in the value of the underlying shares of Company common stock. The exercise or base price is the average of the intraday high and low prices of Company common stock on the NYSE on the date the awards are granted. In addition, the Company has a policy of granting options on the first trading day of the month immediately following the date of award approval. The Company does not coordinate the timing of awards with the release of material non-public information.
89
Table of Contents
Stock Ownership Policy
The Committee believes the Company’s executive officers should achieve and maintain a material level of personal ownership of Company common stock to align the financial interests of the executive officers with those of the Company’s shareholders. Therefore, the Committee has adopted a stock ownership policy for the Company’s executive officers, including the named executives. Each executive who is subject to the policy must own shares of Company common stock having a fair market value equal to a multiple of his or her base salary determined in accordance with the following schedule:
| Title |
Multiple of Base Salary | |||
| Chairman, President and Chief Executive Officer |
4x | |||
| Chief Financial Officer |
3x | |||
| Executive Vice President of Operations |
3x | |||
| President, Pike Electric, LLC |
2x | |||
| Senior Vice President of Human Resources |
2x | |||
Ownership for purposes of the policy includes Company common stock owned directly, indirectly (e.g., by a spouse or a trust), invested in an employee stock purchase plan, time-vested restricted stock and restricted stock units and the in-the-money value of vested, but unexercised stock options. Ownership does not include any performance-vested equity awards. As of June 30, 2014, all of the named executives were in compliance with the policy’s ownership requirements.
Short-Selling Prohibition
The Company does not allow its executives to speculate in the Company’s stock, which includes, but is not limited to, short selling (profiting if the market price of the securities decreases) and/or buying or selling publicly traded options, including writing covered calls.
Agreements with Executives
The Company has entered into employment agreements and long-term equity agreements with each executive officer. The employment agreements provide each executive officer with an annual base salary, the opportunity for annual incentive compensation, and certain other benefits and employment terms.
The Company does not have any change in control agreements with its executive officers. However, the employment agreements of each executive officer provide for severance payments and benefit continuation in the event of termination of employment under certain circumstances. The intent of the program is to attract key executives to the Company as well as to assure the services of key executives and the continuity of operations during periods of uncertainty associated with potential changes in control. When approving such agreements, the Committee determined that the severance periods and amounts contained in the employment agreements for executive officers were consistent with those offered to similarly situated executives and necessary to achieve the Company’s overall compensation objectives.
Mr. Pike’s employment agreement provides that, if his employment is terminated by the Company without Cause or by him for Good Reason (as such terms are defined in his employment agreement), Mr. Pike will be entitled to receive two years of his then current annual base salary and the continuation for two years of health and welfare benefits that he was receiving as of the last day of his employment. In addition, all unvested stock options and restricted stock then held by Mr. Pike will automatically become vested and exercisable if his employment is terminated by the Company without Cause, by him for Good Reason or due to his death, Disability (as defined in his employment agreement) or legal incapacity. The foregoing severance benefits are subject to Mr. Pike abiding by the confidentiality, non-disclosure, non-solicitation and non-competition provisions of his employment agreement.
90
Table of Contents
Under the terms of the employment agreements with executive officers other than Mr. Pike, if any such executive is terminated for any reason other than death, Disability or Cause or if such executive resigns for Good Reason (as each such term is defined in the relevant employment agreement), he will be entitled to (i) cash severance payments equal to 12 months of his annual base salary at the time of termination, payable in equal monthly installments, or, at the discretion of the Board in a lump sum and (ii) continuation of his health and welfare benefits for a period equal to the lesser of (a) 12 months or (b) the period ending on the date he first becomes entitled to health insurance benefits under any plan maintained by any person for whom he provides services as an employee or otherwise. The foregoing severance benefits are subject to such executive entering into and not revoking a release of claims in favor of the Company and abiding by the non-competition provisions of the agreement. In addition, the agreements provide the Company the ability to extend the term of the executive’s restrictive covenant obligations for a subsequent 12-month period, as long as the Company continues to provide the executive with the foregoing severance benefits for the subsequent 12-month period.
The 2005 Plan and the 2008 Plan contain provisions that trigger upon a “change in control” as defined in such plans. Under the Omnibus Plans, unless awards are assumed or replaced in connection with the transaction, all outstanding awards will automatically be deemed exercisable and vested without restriction immediately prior to such change in control, and all performance units and cash incentive awards will be paid out as if the date of the change in control were the last day of the applicable performance period and the greater of actual or “target” performance levels had been obtained.
Tax and Accounting Considerations
Section 162(m) of the Tax Code generally disallows a tax deduction to public companies for certain compensation in excess of $1 million paid to certain covered executive officers. Certain compensation, including qualified performance-based compensation, will not be subject to the deduction limit if specified requirements are met. The Committee carefully considers the impact of Section 162(m) in designing compensation programs for, and in making compensation decisions affecting, Section 162(m) covered executives. In order to maintain flexibility in compensating executive officers, the Committee has not adopted a policy that all compensation must be deductible for federal income tax purposes.
| IV. | 2011 Say-on-Pay Advisory Vote |
At the 2011 Annual Meeting of Shareholders, the Company’s executive compensation program was approved by 72.5% of the votes cast on the “say-on-pay” advisory vote. The Committee believes the results of the 2011 advisory vote affirmed Company shareholder support of the Company’s executive compensation program, including the program’s goals of long-term Company success and creation of shareholder value. Therefore, the Committee did not change the compensation philosophy, the objectives of the program or the overall approach for determining fiscal 2014 named executive officer compensation. The Committee will continue to consider the results of future advisory say-on-pay votes when making future compensation decisions.
Executive Compensation Tables
The following tables and related narratives present the compensation information for the fiscal years ended June 30, 2014, 2013 and 2012, concerning the named executive officers for fiscal 2014, in the format specified by the SEC.
91
Table of Contents
| I. | 2014 Summary Compensation Table |
| Name and Principal Position (a) |
Fiscal Year (b) |
Salary ($) (c) |
Bonus ($) (d) |
Stock Awards ($) (e) |
Option Awards ($) (f) |
Non-Equity Incentive Plan Compensation ($) (g) |
All Other Compensation ($) (h) |
Total ($) (i) |
||||||||||||||||||||||||
| J. Eric Pike (1) |
2014 | 725,749 | — | — | — | — | 91,526 | 817,275 | ||||||||||||||||||||||||
| Chairman and |
2013 | 704,611 | — | 1,056,919 | — | 792,687 | 80,635 | 2,634,852 | ||||||||||||||||||||||||
| Chief Executive Officer |
2012 | 676,260 | 30,000 | 507,191 | 507,197 | 638,448 | 106,915 | 2,466,011 | ||||||||||||||||||||||||
| Anthony K. Slater |
2014 | 425,162 | — | — | — | — | 26,823 | 451,985 | ||||||||||||||||||||||||
| Executive Vice President and |
2013 | 412,779 | — | 342,607 | — | 340,542 | 26,480 | 1,122.408 | ||||||||||||||||||||||||
| Chief Financial Officer |
2012 | 390,150 | 30,000 | 161,916 | 161,911 | 270,113 | 28,059 | 1,042,149 | ||||||||||||||||||||||||
| Audie G. Simmons |
2014 | 448,012 | — | — | — | — | 27,834 | 475,846 | ||||||||||||||||||||||||
| Executive Vice President |
2013 | 434,963 | — | 391,472 | — | 391,467 | 29,582 | 1,247,484 | ||||||||||||||||||||||||
| of Operations |
2012 | 411,900 | 30,000 | 185,354 | 185,355 | 311,095 | 27,163 | 1,150,867 | ||||||||||||||||||||||||
| James T. Benfield |
2014 | 375,487 | — | — | — | 122,514 | 9,371 | 507,372 | ||||||||||||||||||||||||
| President, Pike Electric, LLC |
2013 | 364,551 | — | 218,729 | — | 273,413 | 24,323 | 881,016 | ||||||||||||||||||||||||
| 2012 | 342,867 | — | 102,859 | 102,860 | 212,369 | 33,362 | 794,317 | |||||||||||||||||||||||||
| Timothy G. Harshbarger |
2014 | 323,895 | — | — | — | — | 22,729 | 346,624 | ||||||||||||||||||||||||
| Senior Vice President |
2013 | 314,461 | — | 188,681 | — | 235,846 | 20,915 | 759,903 | ||||||||||||||||||||||||
| of Human Resources |
2012 | 293,760 | 30,000 | 88,131 | 88,128 | 184,890 | 27,542 | 712,451 | ||||||||||||||||||||||||
| (1) | Mr. Pike does not receive any compensation for his service on the Board. |
Bonus (Column (d))
The amount shown in the “Bonus” column represents discretionary bonus awards for the successful completion of the Pine Valley Power and UC Synergetic acquisitions and related integration projects, with respect to fiscal 2012.
Stock Awards (Column (e))
The amount shown in the “Stock Awards” column represents the grant date fair value of stock awards granted in the subject year computed in accordance with FASB ASC Topic 718. Generally, the grant date fair value is the amount that the Company would expense in its financial statements over the award’s vesting schedule. For additional information regarding the assumptions made in calculating these amounts, see the notes to the audited, consolidated financial statements included in the Annual Report on Form 10-K. These amounts reflect the accounting expense for these awards and do not correspond to the actual value that will be recognized by the named executive officers.
Option Awards (Column (f))
The amount shown in the “Option Awards” column represents the grant date fair value of option awards granted in the subject year computed in accordance with FASB ASC Topic 718. Generally, the grant date fair value is the amount that the Company would expense in its financial statements over the award’s vesting schedule. For additional information regarding the assumptions made in calculating these amounts, see the Notes to Consolidated Financial Statements in Item 8 of Part II of this Annual Report. These amounts reflect the accounting expense for these awards and do not correspond to the actual value that will be recognized by the named executive officers.
Non-Equity Incentive Plan Compensation (Column (g))
For fiscal 2014, the Company’s EPS was below the threshold EPS required for the payment of any incentive awards. However, as President of Pike Electric, LLC, Mr. Benfield participated in that entity’s Management Incentive Plan and earned a payout because the threshold level for operating income was achieved.
92
Table of Contents
All Other Compensation (Column (h))
The following table describes each component of the “All Other Compensation” column for fiscal 2014. The amounts shown reflect the incremental cost to the Company for each of the benefits.
| Name |
Personal Use of Company Aircraft ($) |
Personal Use of Company Vehicle ($) |
Tax Reimbursement Payments ($) |
Health Insurance ($) |
Matching Employer Contributions to Retirement Plans ($) |
Unused Vacation ($) |
Total ($) |
|||||||||||||||||||||
| Mr. Pike |
74,078 | 7,432 | 4,916 | — | 5,100 | — | 91,526 | |||||||||||||||||||||
| Mr. Slater |
— | 13,075 | 8,648 | — | 5,100 | — | 26,823 | |||||||||||||||||||||
| Mr. Simmons |
— | 3,312 | 2,191 | — | 5,100 | 17,231 | 27,834 | |||||||||||||||||||||
| Mr. Benfield |
— | 2,571 | 1,700 | — | 5,100 | — | 9,371 | |||||||||||||||||||||
| Mr. Harshbarger |
— | 10,611 | 7,018 | — | 5,100 | — | 22,729 | |||||||||||||||||||||
For fiscal 2014, personal use of Company aircraft was calculated based on aggregate incremental cost to the Company for each hour of personal aircraft usage. The incremental costs include fuel, repair costs, parking and runway fees and other similar variable costs. Personal use of Company vehicle represents the approximate cost to the Company of ownership, maintenance, insurance and fuel for the executive’s vehicle. Tax reimbursement payments represent the approximate cost to the Company for tax gross-up payments to the executives in connection with their personal use of Company vehicles. Health insurance represents the premium payable by the Company for such executive’s participation in a medical expense reimbursement plan. Matching employer contributions to retirement plans represents the cash matching contributions the Company made to the executive’s account under the 401(k) plan. With respect to unused vacation, up to 40 hours of such unused vacation may be rolled into the next year with any remaining balance converted to cash compensation in an amount equal to the number of unused vacation hours multiplied times the employee’s current rate of pay. The amount shown above represents the unused vacation converted to cash compensation in fiscal 2014.
| II. | 2014 Grants of Plan-Based Awards |
The following table shows grants of plan-based awards approved for the named executive officers during the fiscal year ended June 30, 2014.
| Estimated Future Payouts Under Non-Equity Incentive Plan Awards (1) |
||||||||||||
| Name |
Threshold ($) |
Target ($) |
Maximum ($) |
|||||||||
| Mr. Pike |
272,156 | 544,312 | 816,468 | |||||||||
| Mr. Slater |
116,920 | 233,839 | 350,759 | |||||||||
| Mr. Simmons |
134,404 | 268,807 | 403,211 | |||||||||
| Mr. Benfield |
94,622 | 189,244 | 283,866 | |||||||||
| Mr. Harshbarger |
80,974 | 161,948 | 242,922 | |||||||||
| (1) | The executives were eligible to earn annual incentive compensation under the Company’s Management Incentive Plan for fiscal year 2014 based on the achievement of performance metrics established at the beginning of the fiscal year by the Committee. The performance levels for the three performance metrics are shown on pages 87 and 88. For fiscal 2014, the Company’s EPS was below the threshold EPS required for the payment of any incentive awards. However, as President of Pike Electric, LLC, Mr. Benfield participated in that entity’s Management Incentive Plan and earned a payout because the threshold level for operating income was achieved. |
| III. | Outstanding Equity Awards at Fiscal Year-End 2014 |
The following table shows the outstanding equity awards held by the named executive officers at June 30, 2014.
93
Table of Contents
| Name |
Option Awards | Stock Awards | ||||||||||||||||||||||
| Number of Securities Underlying Unexercised Options (#) Exercisable |
Number of Securities Underlying Unexercised Options (#) Unexercisable |
Option Exercise Price ($) |
Option Expiration Date |
Number of Shares or Units of Stock That Have Not Vested (#) |
Market Value of Shares or Units of Stock That Have Not Vested ($) (1) |
|||||||||||||||||||
| Mr. Pike |
343,746 | — | 6.51 | 10/21/2014 | — | — | ||||||||||||||||||
| 428,571 | — | 14.00 | 7/27/2015 | — | — | |||||||||||||||||||
| 27,159 | — | 18.41 | 11/1/2016 | — | — | |||||||||||||||||||
| 98,475 | — | 14.25 | 10/1/2018 | — | — | |||||||||||||||||||
| 112,917 | — | 11.33 | 9/1/2019 | — | — | |||||||||||||||||||
| 116,603 | — | 9.61 | 3/1/2021 | — | — | |||||||||||||||||||
| 86,738 | 43,370 | (2) | 9.22 | 3/1/2022 | — | — | ||||||||||||||||||
| — | — | — | — | 69,012 | (3) | 618,348 | ||||||||||||||||||
| — | — | — | — | 20,847 | (4) | 186,789 | ||||||||||||||||||
| Mr. Slater |
30,000 | — | 18.18 | 8/1/2016 | — | — | ||||||||||||||||||
| 30,000 | — | 18.41 | 11/1/2016 | — | — | |||||||||||||||||||
| 10,000 | — | 18.41 | 11/1/2016 | — | — | |||||||||||||||||||
| 20,000 | — | 16.16 | 5/1/2018 | — | — | |||||||||||||||||||
| 25,031 | — | 14.25 | 10/1/2018 | — | — | |||||||||||||||||||
| 34,044 | — | 11.33 | 9/1/2019 | — | — | |||||||||||||||||||
| 12,500 | — | 7.27 | 10/1/2020 | — | — | |||||||||||||||||||
| 37,225 | — | 9.61 | 3/1/2021 | — | — | |||||||||||||||||||
| 27,869 | 13,845 | (2) | 9.22 | 3/1/2022 | — | — | ||||||||||||||||||
| — | — | — | — | 22,371 | (3) | 200,444 | ||||||||||||||||||
| — | — | — | — | 6,655 | (4) | 59,629 | ||||||||||||||||||
| Mr. Simmons |
61,904 | — | 6.51 | 10/21/2014 | — | — | ||||||||||||||||||
| 38,690 | — | 14.00 | 7/27/2015 | — | — | |||||||||||||||||||
| 10,000 | — | 18.41 | 11/1/2016 | — | — | |||||||||||||||||||
| 30,000 | — | 15.70 | 12/1/2016 | — | — | |||||||||||||||||||
| 33,658 | — | 14.25 | 10/1/2018 | — | — | |||||||||||||||||||
| 38,973 | — | 11.33 | 9/1/2019 | — | — | |||||||||||||||||||
| 42,614 | — | 9.61 | 3/1/2021 | — | — | |||||||||||||||||||
| 31,698 | 15,850 | (2) | 9.22 | 3/1/2022 | — | — | ||||||||||||||||||
| — | — | — | — | 25,562 | (3) | 229,036 | ||||||||||||||||||
| — | — | — | — | 7,619 | (4) | 68,266 | ||||||||||||||||||
| Mr. Benfield |
61,904 | — | 6.51 | 10/21/2014 | — | — | ||||||||||||||||||
| 38,690 | — | 14.00 | 7/27/2015 | — | — | |||||||||||||||||||
| 10,000 | — | 18.41 | 11/01/2016 | — | — | |||||||||||||||||||
| 30,076 | — | 8.81 | 11/03/2018 | — | — | |||||||||||||||||||
| 21,628 | — | 11.33 | 9/1/2019 | — | — | |||||||||||||||||||
| 23,648 | — | 9.61 | 3/1/2021 | — | — | |||||||||||||||||||
| 17,590 | 8,796 | (2) | 9.22 | 3/1/2022 | — | — | ||||||||||||||||||
| — | — | — | — | 14,282 | (3) | 127,967 | ||||||||||||||||||
| — | — | — | — | 4,228 | (4) | 37,883 | ||||||||||||||||||
| Mr. Harshbarger |
30,000 | — | 15.48 | 12/1/2017 | — | — | ||||||||||||||||||
| 26,275 | — | 8.81 | 11/03/2018 | — | — | |||||||||||||||||||
| 18,530 | — | 11.33 | 9/1/2019 | — | — | |||||||||||||||||||
| 20,261 | — | 9.61 | 3/1/2021 | — | — | |||||||||||||||||||
| 15,071 | 7,536 | (2) | 9.22 | 3/1/2022 | — | — | ||||||||||||||||||
| — | — | — | — | 12,320 | (3) | 110,387 | ||||||||||||||||||
| — | — | — | — | 3,623 | (4) | 32,462 | ||||||||||||||||||
| (1) | The amounts set forth in this column were calculated by multiplying the closing market price of the Company’s common stock on June 30, 2014 ($8.96) by the number of shares, units or other rights held on such date. |
| (2) | These options vest on March 1, 2015. |
| (3) | These restricted stock units vest in equal annual installments on January 30 of each of 2015 and 2016. |
| (4) | These restricted stock units vest on February 1, 2015. |
94
Table of Contents
| IV. | 2014 Option Exercises and Stock Vested |
The following table shows the number of shares acquired and the value realized during the fiscal year ended June 30, 2014 upon vesting of restricted stock or units previously granted to each of the named executive officers. None of the named executive officers exercised options to purchase shares of Company common stock during fiscal 2014.
| Stock Awards | ||||||||
| Name |
Number of shares or
units acquired on vesting (#) |
Value realized on vesting ($)(1) |
||||||
| Mr. Pike |
74,897 | 787,799 | ||||||
| Mr. Slater |
24,080 | 253,287 | ||||||
| Mr. Simmons |
27,541 | 289,692 | ||||||
| Mr. Benfield |
15,333 | 161,282 | ||||||
| Mr. Harshbarger |
13,178 | 138,615 | ||||||
| (1) | Values were determined by multiplying the number of shares or units, as applicable, that vested by the per share fair market value of Company common stock on the vesting date. |
| V. | 2014 Non-Qualified Deferred Compensation |
We maintain the Pike Compensation Deferral Plan (the “Deferral Plan”), which is a non-qualified deferred compensation plan, for certain of our key executive officers. Messrs. Pike, Slater, Simmons, Benfield and Harshbarger participated in the Deferral Plan during fiscal year 2014. The following table sets forth information regarding the named executive officers’ accounts and benefits under the Deferral Plan for fiscal year 2014.
| Name |
Executive Contributions in Last FY ($) (1) |
Registrant Contributions in Last FY ($) |
Aggregate Earnings in Last FY ($) (2) |
Aggregate Withdrawals / Distributions ($) |
Aggregate Balance at Last FYE ($) |
|||||||||||||||
| Mr. Pike |
2,870 | — | — | — | 11,566 | |||||||||||||||
| Mr. Slater |
124 | — | 4,845 | — | 11,094 | |||||||||||||||
| Mr. Simmons |
10,756 | — | (1,015 | ) | — | 41,751 | ||||||||||||||
| Mr. Benfield |
25,115 | — | 2,337 | — | 59,170 | |||||||||||||||
| Mr. Harshbarger |
26,851 | — | — | — | 82,430 | |||||||||||||||
| (1) | Amounts reflected in this column are also reported in the “Salary” column of the Summary Compensation Table for 2014. |
| (2) | Amounts reported in this column are not reported in the Summary Compensation Table because no earnings under the Deferral Plan are deemed to be above-market or preferential earnings. |
| VI. | 2014 Potential Payments Upon Termination or Change of Control |
The following is a summary of certain compensation agreements that the Company has with, and certain plans that the Company maintains for, its executive officers, including the named executive officers, and other material information necessary to an understanding of the Summary Compensation Table and Grants of Plan-Based Awards table above. The following tables show the estimated benefits payable to each named executive officer in the event of the executive officer’s termination of employment under various scenarios or a change of control of the Company. The amounts shown assume termination of employment or a change of control on June 30, 2014. The amounts do not include payments or benefits provided under insurance or other plans that are generally available to all salaried employees.
95
Table of Contents
Arrangements with J. Eric Pike
Mr. Pike entered into an amended and restated employment agreement on September 24, 2008, that was amended on May 1, 2009. The employment agreement provides for an initial one-year employment term commencing July 1, 2008, after which the agreement automatically extends for additional one-year periods, subject to both Mr. Pike’s and the Company’s right to terminate the agreement upon at least 60 days’ written notice prior to the expiration of each such term.
The employment agreement provides a base annual salary of $780,000, which may be adjusted up but not down by the Committee. However, for the fiscal year ended June 30, 2014, Mr. Pike voluntarily adjusted his base salary downward to $725,749. In addition to his base salary, Mr. Pike is eligible to receive an annual incentive opportunity and to participate in the long-term incentive plan on such terms and conditions and in such amounts as adopted and approved by the Committee. The employment agreement also provides Mr. Pike the ability to use the Company aircraft for up to 50 flight hours per year for personal use.
Under the terms of the employment agreement, if Mr. Pike’s employment is terminated by the Company without Cause or by Mr. Pike for Good Reason (as such terms are defined below), Mr. Pike will be entitled to receive two years of his then current annual base salary and the continuation for two years of the health, life, disability and other benefits that he was receiving as of the last day of his employment. If Mr. Pike’s employment is terminated by the Company without Cause or due to his death, Disability (as defined in the employment agreement) or legal incapacity or by him for Good Reason, all unvested equity compensation awards then held by Mr. Pike or his estate will automatically become vested and exercisable. If Mr. Pike’s employment is terminated for any other reason, Mr. Pike will be entitled to receive only earned but unpaid benefits.
As defined in Mr. Pike’s employment agreement, “Cause” means Mr. Pike is either (i) convicted of a felony involving moral turpitude or (ii) guilty of gross neglect or willful misconduct in carrying out his duties, resulting in material harm to the Company, unless he believed in good faith he acted in the Company’s best interests; provided, that, with respect to (ii) above, Mr. Pike will have a 30-day cure period to eliminate the circumstances that are claimed to constitute Cause unless such circumstances are not capable of being cured. Mr. Pike may terminate his employment for “Good Reason” if (i) he is assigned duties or responsibilities that are inconsistent with his position as President and Chief Executive Officer, (ii) he suffers a reduction in, or material, adverse interference with, the authorities and duties associated with his position, (iii) the duties of his position change in a materially adverse manner from those at the date his employment agreement was executed or (iv) he is required to relocate to an employment location that is more than 50 miles from his employment location on the execution date of his employment agreement; provided, that the Company will have a 30-day cure period to eliminate the circumstances that are claimed to constitute Good Reason unless such circumstances are not capable of being cured.
If Mr. Pike becomes subject to excise taxes under Section 4999 of the Tax Code, the Company will make a tax gross-up payment to him in an amount sufficient to cover such excise taxes and any interest or penalties thereon. However, if such excise taxes would not be applicable if the value of his payments and benefits were reduced by 5%, Mr. Pike will forfeit the amount of such payments and benefits necessary to avoid incurring such excise taxes and the Company will not have an obligation to provide a tax gross-up payment in connection therewith. If required to forfeit a portion of the payments and benefits, Mr. Pike would choose the particular payments and benefits to be reduced.
The Company may terminate Mr. Pike’s employment due to Disability or legal incapacity if, based upon independent medical advice, the Board determines that due to physical or mental illness Mr. Pike is unable to perform his customary duties for (i) 120 consecutive business days, if he fails to return to his duties within five days of written notice of the end of that 120-day period, or (ii) 130 business days in any 12-month period. In any such event, Mr. Pike is entitled to a continuation of his base salary and other benefits during the 120-day or 130-day period, in addition to the acceleration of any unvested equity compensation awards at such time, as noted above.
Mr. Pike is subject to a non-solicitation provision for 24 months after termination of his employment, as well as a confidentiality provision. In addition, Mr. Pike has agreed to refrain from engaging in certain activities that are competitive with the Company and its business for a period of five years after the termination of his employment. Mr. Pike is entitled to indemnification in his position to the fullest extent permitted by the laws of Delaware.
96
Table of Contents
The Company provides life insurance with a death benefit equal to two times annual base salary capped at $750,000. Additionally, the Company provides supplemental term life insurance with a death benefit equal to one times annual base salary capped at $750,000, basic accidental death coverage with a death benefit equal to two times annual base salary capped at $750,000 and supplemental accidental death and dismemberment coverage with a death benefit of $250,000. In the event Mr. Pike becomes disabled, basic short-term and long-term group disability plans, coupled with an individual supplemental long-term disability policy, provide 100% of salary for the first six months and 65% of salary for the remainder of the disability coverage period (generally ending no later than age 65 or a later date specified in the policy for disability that commences after age 60).
The following table sets forth the amounts payable to Mr. Pike upon termination of his employment or a “change in control” (as defined below in the 2005 Plan or the 2008 Plan) on June 30, 2014.
| Benefits and Payments Upon Termination |
Termination for Cause or without Good Reason |
Termination without Cause or for Good Reason |
Termination without Cause or for Good Reason following a Change in Control |
Termination due to Disability or Incapacity (1) |
Termination due to Death (1) |
Change in Control (No Termination) |
||||||||||||||||||
| Base Salary (2) |
$ | — | $ | 1,451,498 | $ | 1,451,498 | $ | — | $ | — | $ | — | ||||||||||||
| Unvested Stock Options |
— | — | — | — | — | — | ||||||||||||||||||
| Restricted Stock (3) |
— | — | — | — | — | — | ||||||||||||||||||
| Restricted Stock Units (4) |
— | 805,137 | 805,137 | 805,137 | 805,137 | 805,137 | ||||||||||||||||||
| Health Insurance (5) |
— | 28,398 | 28,398 | — | — | — | ||||||||||||||||||
| Life Insurance (6) |
— | — | — | — | 1,476,000 | — | ||||||||||||||||||
| Accidental Death and Dismemberment (7) |
— | — | — | 1,000,000 | 1,000,000 | — | ||||||||||||||||||
| Short-Term Disability Coverage |
— | — | — | 362,875 | — | — | ||||||||||||||||||
| Long-Term Disability Coverage (8) |
— | — | — | 8,688,359 | — | — | ||||||||||||||||||
|
|
|
|
|
|
|
|
|
|
|
|
|
|||||||||||||
| Total: |
$ | — | $ | 2,285,033 | $ | 2,285,033 | $ | 10,856,371 | $ | 3,281,137 | $ | 805,137 | ||||||||||||
|
|
|
|
|
|
|
|
|
|
|
|
|
|||||||||||||
| (1) | Pursuant to the terms of Mr. Pike’s employment agreement, all unvested stock options and restricted stock will vest upon his death, Disability (as defined in the employment agreement) or legal incapacity. |
| (2) | Represents 24 months salary continuation. |
| (3) | Represents the value of restricted shares of common stock held at June 30, 2014, based upon the closing market price on June 30, 2014 ($8.96) of the shares of common stock. These restricted shares would vest in full both upon a “change in control” under the terms of, and as defined in, the 2005 Plan and the 2008 Omnibus Plan (each discussed below), assuming the awards are not assumed or replaced in the transaction, and also under the terms of Mr. Pike’s employment agreement upon termination of his employment due to his resignation for Good Reason or termination without Cause (each as defined above). |
| (4) | Represents the value of restricted stock units held at June 30, 2014, based upon the closing market price on June 30, 2014 ($8.96) of shares of Company common stock. These restricted stock units would vest in full both upon a “change in control” under the terms of, and as defined in, the 2005 Plan and the 2008 Plan (each discussed below), assuming the awards are not assumed or replaced in the transaction, and also under the terms of Mr. Pike’s employment agreement upon termination of his employment due to his resignation for Good Reason or termination without Cause (each as defined above). |
| (5) | Represents the estimated incremental cost to the Company of medical, dental and vision plan continuation coverage for 24 months. |
| (6) | Represents proceeds from Company paid basic term life insurance policy with the benefit equal to two times annual base salary capped at $750,000 plus the proceeds from Company paid supplemental term life insurance policy with the benefit equal to one times annual base salary capped at $750,000. |
| (7) | Represents proceeds from Company provided basic accidental death and dismemberment policy with the benefit equal to two times annual base salary capped at $750,000 and a $250,000 death benefit from Company provided supplemental accidental death and dismemberment policy. |
| (8) | Represents aggregate payments to the executive on a non-discounted basis, assuming full Disability through age 65. In the event the Company would be required to fund the full amount of the long-term disability payments for all named executive officers as of June 30, 2014, the entire amount of the Company’s commitment for such payments is insured. |
97
Table of Contents
Arrangements with Other Named Executive Officers
Messrs. Slater, Simmons, Benfield and Harshbarger entered into amended and restated employment agreements in June 2009, the terms of which are substantially similar, although Mr. Benfield’s employer is a subsidiary, Pike Electric, LLC. Under the employment agreements, the executive is paid a base annual salary, which is reviewed annually by the Committee, and is entitled to participate in the other benefit plans and programs available to officers.
The employment agreements also provide that if the executive is terminated for any reason other than death, Disability or Cause or if the executive resigns for Good Reason (each as defined below), the executive will be entitled to (a) cash severance payments equal to 12 months of the executive’s annual base salary at the time of termination, payable in equal monthly installments and (b) continuation of the executive’s medical and health insurance benefits for a period equal to the lesser of (i) 12 months or (ii) the period ending on the date the executive first becomes eligible to receive health insurance benefits under any plan maintained by any person for whom the executive provides services as an employee or otherwise. If the executive’s employment is terminated for Cause, then the executive will be paid all accrued and unpaid base salary through the date of termination. Similarly, in the event that the executive resigns without Good Reason, the executive will be paid all accrued and unpaid base salary and any accrued and unpaid benefits through the date of termination, after which the Company will have no further obligations under the executive’s employment agreement. Finally, in the event of an executive’s termination of employment due to the executive’s death or Disability, the executive or the executive’s estate will receive all accrued and unpaid base salary and any accrued and unpaid benefits through the date of termination, after which the Company will have no further obligations under the executive’s employment agreement.
The Company provides life insurance with a death benefit equal to two times annual base salary capped at $750,000. Additionally, the Company provides supplemental term life insurance with a death benefit equal to one times annual base salary capped at $750,000, basic accidental death coverage with a death benefit equal to two times annual base salary capped at $750,000 and supplemental accidental death and dismemberment coverage with a death benefit of $250,000. In the event an executive becomes disabled, basic short-term and long-term group disability plans, coupled with an individual supplemental long-term disability policy, provide 100% of salary for the first six months and 65% of salary for the remainder of the disability coverage period (generally ending no later than age 65 or a later date specified in the policy for disability that commences after age 60).
Under the employment agreements, the term “Cause” is defined as the executive’s (i) continued willful failure to substantially perform his duties, (ii) willful engagement in gross misconduct materially and demonstrably injurious to the Company, or (iii) material breach of certain provisions of his employment agreement, such as non-competition and non-solicitation provisions, and his failure to cure such breach upon written notice by the Company, if any. “Good Reason” is defined as (i) a material reduction in an executive’s title or responsibilities, (ii) the requirement that the executive relocate to an employment location that is more than 50 miles from his employment location on the effective date of his employment agreement, or (iii) the Company’s failure to cure its material breach of certain provisions of the employment agreements, such as employment duties and compensation provisions, upon written notice to the Company. Finally, “Disability” is defined as having the same meaning set forth in any long-term disability plan in which the executive participates, and in the absence of such a plan means that, due to physical or mental illness, the executive failed to perform his duties on a full-time basis for 180 consecutive days and did not return on a full-time basis before the end of such period.
The employment agreements also contain confidentiality provisions and non-competition and non-solicitation covenants. Each executive has agreed to neither compete with the Company nor solicit its customers, suppliers or employees for the 12 months following termination of his employment. The foregoing severance benefits are subject to the executive entering into and not revoking a release of claims in favor of the Company and abiding by the restrictive covenant provisions in his agreement.
The following table sets forth the amounts payable to Messrs. Slater, Simmons, Benfield and Harshbarger upon termination of his employment or a “change in control” (as defined below in the 2005 Plan or the 2008 Plan) on June 30, 2014.
98
Table of Contents
| Benefits and Payments Upon Termination |
Termination for Cause or without Good Reason |
Termination without Cause or for Good Reason |
Termination without Cause or for Good Reason following a Change in Control |
Termination due to Disability or Incapacity |
Termination due to Death |
Change in Control (No Termination) |
||||||||||||||||||
| Anthony K. Slater |
||||||||||||||||||||||||
| Base Salary (1) |
$ | — | $ | 425,162 | $ | 425,162 | $ | — | $ | — | $ | — | ||||||||||||
| Unvested Stock Options (2) |
— | — | — | — | — | — | ||||||||||||||||||
| Restricted Stock (3) |
— | — | — | — | — | — | ||||||||||||||||||
| Restricted Stock Units (4) |
— | — | 260,073 | 260,073 | 260,073 | 260,073 | ||||||||||||||||||
| Health Insurance (5) |
— | 14,199 | 14,199 | — | — | — | ||||||||||||||||||
| Life Insurance (6) |
— | — | — | — | 1,176,000 | — | ||||||||||||||||||
| Accidental Death and Dismemberment (7) |
— | — | — | 1,000,000 | 1,000,000 | — | ||||||||||||||||||
| Short-Term Disability Coverage |
— | — | — | 212,581 | — | — | ||||||||||||||||||
| Long-Term Disability Coverage (8) |
— | — | — | 5,591,084 | — | — | ||||||||||||||||||
|
|
|
|
|
|
|
|
|
|
|
|
|
|||||||||||||
| Total: |
$ | — | $ | 439,361 | $ | 699,434 | $ | 7,063,738 | $ | 2,436,073 | $ | 260,073 | ||||||||||||
|
|
|
|
|
|
|
|
|
|
|
|
|
|||||||||||||
| Audie G. Simmons |
||||||||||||||||||||||||
| Base Salary (1) |
$ | — | $ | 448,012 | $ | 448,012 | $ | — | $ | — | $ | — | ||||||||||||
| Unvested Stock Options (2) |
— | — | — | — | — | — | ||||||||||||||||||
| Restricted Stock (3) |
— | — | — | — | — | — | ||||||||||||||||||
| Restricted Stock Units (4) |
— | — | 297,302 | 297,302 | 297,302 | 297,302 | ||||||||||||||||||
| Health Insurance (5) |
— | 14,199 | 14,199 | — | — | — | ||||||||||||||||||
| Life Insurance (6) |
— | — | — | — | 1,199,000 | — | ||||||||||||||||||
| Accidental Death and Dismemberment (7) |
— | — | — | 1,000,000 | 1,000,000 | — | ||||||||||||||||||
| Short-Term Disability Coverage |
— | — | — | 224,006 | — | — | ||||||||||||||||||
| Long-Term Disability Coverage (8) |
— | — | — | 1,707,754 | — | — | ||||||||||||||||||
|
|
|
|
|
|
|
|
|
|
|
|
|
|||||||||||||
| Total: |
$ | — | $ | 462,211 | $ | 759,513 | $ | 3,229,062 | $ | 2,496,302 | $ | 297,302 | ||||||||||||
|
|
|
|
|
|
|
|
|
|
|
|
|
|||||||||||||
| James T. Benfield |
||||||||||||||||||||||||
| Base Salary (1) |
$ | — | $ | 375,487 | $ | 375,487 | $ | — | $ | — | $ | — | ||||||||||||
| Unvested Stock Options (2) |
— | — | — | — | — | — | ||||||||||||||||||
| Restricted Stock (3) |
— | — | — | — | — | — | ||||||||||||||||||
| Restricted Stock Units (4) |
— | — | 165,850 | 165,850 | 165,850 | 165,850 | ||||||||||||||||||
| Health Insurance (5) |
— | 14,199 | 14,199 | — | — | — | ||||||||||||||||||
| Life Insurance (6) |
— | — | — | — | 1,126,000 | — | ||||||||||||||||||
| Accidental Death and Dismemberment (7) |
— | — | — | 1,000,000 | 1,000,000 | — | ||||||||||||||||||
| Short-Term Disability Coverage |
— | — | — | 187,744 | — | — | ||||||||||||||||||
| Long-Term Disability Coverage (8) |
— | — | — | 2,927,796 | — | — | ||||||||||||||||||
|
|
|
|
|
|
|
|
|
|
|
|
|
|||||||||||||
| Total: |
$ | — | $ | 389,686 | $ | 555,536 | $ | 4,281,390 | $ | 2,291,850 | $ | 165,850 | ||||||||||||
|
|
|
|
|
|
|
|
|
|
|
|
|
|||||||||||||
| Timothy G. Harshbarger |
||||||||||||||||||||||||
| Base Salary (1) |
$ | — | $ | 323,895 | $ | 323,895 | $ | — | $ | — | $ | — | ||||||||||||
| Unvested Stock Options (2) |
— | — | — | — | — | — | ||||||||||||||||||
| Restricted Stock (3) |
— | — | — | — | — | — | ||||||||||||||||||
| Restricted Stock Units (4) |
— | — | 142,849 | 142,849 | 142,849 | 142,849 | ||||||||||||||||||
| Health Insurance (5) |
— | 14,199 | 14,199 | — | — | — | ||||||||||||||||||
| Life Insurance (6) |
— | — | — | — | 972,000 | — | ||||||||||||||||||
| Accidental Death and Dismemberment (7) |
— | — | — | 898,000 | 898,000 | — | ||||||||||||||||||
| Short-Term Disability Coverage |
— | — | — | 161,948 | — | — | ||||||||||||||||||
| Long-Term Disability Coverage (8) |
— | — | — | 2,087,148 | — | — | ||||||||||||||||||
|
|
|
|
|
|
|
|
|
|
|
|
|
|||||||||||||
| Total: |
$ | — | $ | 338,094 | $ | 480,943 | $ | 3,289,945 | $ | 2,012,849 | $ | 142,849 | ||||||||||||
|
|
|
|
|
|
|
|
|
|
|
|
|
|||||||||||||
| (1) | Represents 12 months salary continuation. |
99
Table of Contents
| (2) | Represents the value of unvested stock options held at June 30, 2014, based upon the amount by which the closing market price on June 30, 2014 ($8.96) of the shares of common stock underlying those options exceeded the exercise price of such options. These stock options would vest in full upon a “change in control” under the terms of, and as defined in, the 2005 Plan and the 2008 Plan (each discussed below), assuming the awards are not assumed or replaced in the transaction. All stock options awarded under either the 2002 Stock Option Plan A or 2002 Stock Option Plan B are vested. Certain award agreements entered into in September 2008 and thereafter provide that any unvested stock options will vest upon the executive’s death or Disability. |
| (3) | Represents the value of restricted shares of common stock held at June 30, 2014, based upon the closing market price on June 30, 2014 ($8.96) of the shares of common stock. These restricted shares would vest in full upon a “change in control” under the terms of, and as defined in, the 2005 Plan and the 2008 Plan (each discussed below), assuming the awards are not assumed or replaced in the transaction. Certain award agreements entered into in September 2008 and thereafter provide that any restricted shares will vest upon the executive’s death or Disability. |
| (4) | Represents the value of restricted stock units held at June 30, 2014, based upon the closing market price on June 30, 2014 ($8.96) of the shares of common stock. These restricted stock units would vest in full upon a “change in control” under the terms of, and as defined in, the 2005 Plan and the 2008 Plan (each discussed below), assuming the awards are not assumed or replaced in the transaction. Certain award agreements entered into in August 2009 and thereafter provide that any restricted stock units will vest upon the executive’s death or Disability. |
| (5) | Represents the estimated incremental cost to the Company of health and dental plan continuation coverage for 12 months. |
| (6) | Represents proceeds from Company paid basic term life insurance policy with the benefit equal to two times annual base salary capped at $750,000 plus the proceeds from Company paid supplemental term life insurance policy with the benefit equal to one times annual base salary capped at $750,000. |
| (7) | Represents proceeds from Company provided basic accidental death and dismemberment policy with a benefit equal to two times annual base salary capped at $750,000 and a $250,000 death benefit from Company provided supplemental accidental death and dismemberment policy. |
| (8) | Represents aggregate payments to the executive on a non-discounted basis, assuming full Disability through age 65. In the event the Company would be required to fund the full amount of the long-term disability payments for all named executive officers as of June 30, 2014, the entire amount of the Company’s commitment for such payments is insured. |
Compensation Committee Interlocks and Insider Participation
Charles E. Bayless, James R. Helvey III, Peter Pace, Daniel J. Sullivan III and James L. Turner served on the compensation committee in fiscal year 2014. None of the directors who served on the compensation committee in fiscal year 2014 has ever served as one of the Company’s officers or employees or is or was a participant in fiscal year 2014 in a related person transaction with the Company. During fiscal year 2014, none of the Company’s executive officers served as a director or member of the compensation committee (or other committee performing similar functions) of any other entity of which an executive officer served on the Board or its compensation committee.
Compensation Committee Report
The compensation committee has reviewed and discussed the Compensation Discussion and Analysis with management and, based on such review and discussions, recommended to the Board that the Compensation Discussion and Analysis be included in this Annual Report on Form 10-K for the fiscal year ended June 30, 2014.
Submitted by the compensation committee of the Board.
James R. Helvey III, Chair
Charles E. Bayless
Peter Pace
Daniel J. Sullivan III
James L. Turner
Director Compensation
The Company’s director compensation policy provides that each director who is considered “independent” within the meaning of Section 303A.02 of the NYSE Listed Company Manual will receive compensation for service on the Board. Non-independent directors (currently Mr. Pike) receive no compensation for their service as directors.
100
Table of Contents
The following table shows the compensation paid to each independent director who served on the Board in fiscal year 2014:
2014 Director Compensation Table
| Name |
Fees Earned or Paid in Cash ($) (1) |
Stock Awards ($) (2) |
Total ($) |
|||||||||
| Charles E. Bayless |
87,107 | 69,994 | 157,101 | |||||||||
| James R. Helvey III |
82,107 | 69,994 | 152,101 | |||||||||
| Peter Pace |
80,107 | 69,994 | 150,101 | |||||||||
| Daniel J. Sullivan III |
75,357 | 69,994 | 145,351 | |||||||||
| James L. Turner |
99,765 | 69,994 | 169,759 | |||||||||
| (1) | The amounts shown in this column represent the aggregate amounts of all fees earned or paid in cash for services as a director in fiscal year 2014. The Board formed a special committee in February 2014, composed entirely of all of the Company’s independent directors, pursuant to which the Company has paid the chair of the committee (Mr. Turner) $10,000 per month and each other member $5,000 per month since such date of formation. These fees are included in this column. |
| (2) | Represents the full grant date fair value of stock awards computed in accordance with Financial Accounting Standards Board Accounting Standards Codification Topic 718 (“FASB ASC Topic 718”). Generally, the full grant date fair value is the amount that the Company would expense in the financial statements over the award’s vesting schedule. See Note [2] of the Notes to Consolidated Financial Statements for additional information regarding the assumptions made in calculating these amounts. These amounts reflect the accounting expense and do not correspond to the actual value that will be recognized by the directors. |
The following table shows the number of restricted stock units and deferred stock units held by each independent director as of June 30, 2014:
| Name |
Restricted Stock
Units Outstanding (#) |
Deferred Stock
Units Outstanding (#) |
||||||
| Charles E. Bayless |
6,398 | — | ||||||
| James R. Helvey III |
6,398 | 18,041 | ||||||
| Peter Pace |
6,398 | — | ||||||
| Daniel J. Sullivan III |
6,398 | 18,041 | ||||||
| James L. Turner |
6,398 | — | ||||||
The compensation committee reviews and approves compensation of the members of the Board. In approving director compensation, the compensation committee considers recommendations of its outside compensation consultant and makes such modifications as it deems appropriate. The Board approved the director compensation policy on November 3, 2011, following consultation with its then outside compensation consultant, Compensation Advisory Partners, LLC. Compensation for the Company’s independent directors is as follows:
| • | an annual grant of $70,000 in shares of restricted stock units one day following election to the Board at the annual meeting of shareholders, vesting in full on the earlier of the first anniversary of the grant date or immediately before the next annual meeting of shareholders; |
| • | an annual fee of $45,000 in cash payable in quarterly installments; |
| • | $1,000 in cash for each Board meeting attended; |
| • | $500 in cash for each committee meeting attended; |
| • | $15,000 annual retainer for the lead independent director and the chair of the audit committee; |
| • | $10,000 annual retainer for the chairs of the compensation committee and the nominating and governance committee; and |
| • | reimbursement of reasonable expenses incurred for attending Board and committee meetings. |
101
Table of Contents
In 2011, the Board adopted stock ownership guidelines for independent directors. The guidelines require each independent director to own shares or share equivalent units having a market value equal to $180,000 within four years of his or her becoming a director. Once the required market value ownership level is achieved, no further purchases are required in the event the value of the shares and share equivalent units held by a director fall below $180,000 due solely to a decrease in the market value of our common stock.
| ITEM 12. | SECURITY OWNERSHIP OF CERTAIN BENEFICIAL OWNERS AND MANAGEMENT AND RELATED STOCKHOLDER MATTERS |
Principal Shareholders
The following table provides information about the beneficial ownership of our common stock as of September 5, 2014 (unless otherwise indicated) by each person that owned more than 5% of outstanding shares of our common stock as of such date as well as each director, named executive officer and all directors and executive officers as a group. In computing the number of shares beneficially owned by a person and the percentage ownership of that person, (i) shares of common stock subject to options held by that person that are currently exercisable or exercisable within 60 days of September 5, 2014 and (ii) restricted stock units and deferred stock units which vest within 60 days of September 5, 2014 are deemed outstanding. These shares or units, however, are not deemed outstanding for the purposes of computing the percentage ownership of any other person. The percentage ownership is based on 31,940,619 shares of common stock outstanding as of September 5, 2014. Unless otherwise indicated in the footnotes below, (i) each of the persons listed below holds sole investment and voting power over the shares shown and (ii) the address for each of the persons listed below is c/o Pike Corporation, 100 Pike Way, PO Box 868, Mount Airy, North Carolina 27030.
| Name of Beneficial Owner |
Number of Shares
and Nature of Beneficial Ownership |
Ownership Percentage |
||||||
| Wells Fargo & Company |
5,464,611 | (1) | 17.1 | % | ||||
| T. Rowe Price Associates, Inc. and T. Rowe Price Small-Cap Value Fund, Inc. |
2,794,540 | (2) | 8.7 | % | ||||
| Invesco Ltd. |
2,205,167 | (3) | 6.9 | % | ||||
| Wellington Management Company, LLP |
2,114,194 | (4) | 6.6 | % | ||||
| Dimensional Fund Advisors LP |
1,827,285 | (5) | 5.7 | % | ||||
| Victory Capital Management Inc. |
1,678,793 | (6) | 5.3 | % | ||||
| J. Eric Pike |
3,268,188 | (7) | 9.9 | % | ||||
| Charles E. Bayless |
81,888 | (8) | * | |||||
| James R. Helvey III |
63,158 | (9) | * | |||||
| Peter Pace |
33,160 | (10) | * | |||||
| Daniel J. Sullivan III |
54,147 | (11) | * | |||||
| James L. Turner |
15,171 | (12) | * | |||||
| James T. Benfield |
273,883 | (13) | * | |||||
| Timothy G. Harshbarger |
141,386 | (14) | * | |||||
| Audie G. Simmons |
488,538 | (15) | 1.5 | % | ||||
| Anthony K. Slater |
290,506 | (16) | * | |||||
| Directors and executive officers as a group (10 persons) |
4,710,025 | 13.9 | % | |||||
| * | Less than 1%. |
| (1) | The information shown is based on a Schedule 13G/A filed with the SEC on January 10, 2014 by Wells Fargo & Company, on behalf of itself and certain of its subsidiaries, including Metropolitan West Capital Management, LLC, an investment adviser (which owns 4,365,247 shares of our common stock, representing 13.7% of our common stock outstanding), reporting shares held on December 31, 2013. The Schedule 13G/A reports that Wells Fargo & Company has sole power to vote no shares, shared power to vote 4,760,971 shares and shared power to dispose of all of such shares, and Metropolitan West Capital Management, LLC has sole power to vote no shares, shared power to vote 3,362,622 shares, sole power to dispose of no shares, and shared power to dispose of 4,365,247 shares. The address for Wells Fargo & Company is 420 Montgomery Street, San Francisco, California 94104, and the address for Metropolitan West Capital Management, LLC is 610 Newport Center Drive, #1000, Newport Beach, California 92660. |
102
Table of Contents
| (2) | The information shown is based on a Schedule 13G filed with the SEC on February 10, 2014 by T. Rowe Price Associates, Inc. and T. Rowe Price Small-Cap Value Fund, Inc. (which owns 2,060,320 shares of our common stock, representing 6.5% of our common stock outstanding) reporting shares held on December 31, 2013. The Schedule 13G reports that T. Rowe Price Associates, Inc. has sole power to vote 729,500 shares, shared power to vote no shares and sole power to dispose of all of such shares, and T. Rowe Price Small-Cap Value Fund, Inc. has sole power to vote 2,060,320 shares, shared power to vote no shares, sole power to dispose of no shares and shared power to dispose of no shares. The address for T. Rowe Price Associates, Inc. and T. Rowe Price Small-Cap Value Fund, Inc. is 100 E. Pratt Street, Baltimore, Maryland 21202. |
| (3) | The information shown is based on a Schedule 13G filed with the SEC on February 11, 2014 by Invesco Ltd., on behalf of itself and certain of its investment advisory subsidiaries, reporting shares held on December 31, 2013. The Schedule 13G reports that Invesco Ltd. has sole power to vote and to dispose of all of such shares. The address for Invesco Ltd. is 1555 Peachtree Street NE, Atlanta, Georgia 30309. |
| (4) | The information shown is based on a Schedule 13G filed with the SEC on February 14, 2014 by Wellington Management Company, LLP reporting shares held on December 31, 2013. The Schedule 13G reports that Wellington Management Company, LLP, in its capacity as investment adviser, may be deemed to beneficially own all of such shares which are held of record by its clients. The Schedule 13G reports that Wellington Management Company, LLP has sole power to vote no shares, shared power to vote 1,126,769 shares and shared power to dispose of all of such shares. The address for Wellington Management Company, LLP is 280 Congress Street, Boston, Massachusetts 02210. |
| (5) | The information shown is based on a Schedule 13G filed with the SEC on February 10, 2014 by Dimensional Fund Advisors LP, an investment adviser to four registered investment companies and investment manager to certain other commingled group trusts and separate accounts, reporting shares held on December 31, 2013. The Schedule 13G reports that Dimensional Fund Advisors LP has sole power to vote 1,740,319 shares, shared power to vote no shares and sole power to dispose of all of such shares, and that it disclaims beneficial ownership of all of such shares, all of which were reported as owned by the foregoing investment companies, group trusts and separate accounts. The address for Dimensional Fund Advisors LP is Palisades West, Building One, 6300 Bee Cave Road, Austin, Texas 78746. |
| (6) | The information shown is based on a Schedule 13G filed with the SEC on February 12, 2014 by Victory Capital Management Inc. reporting shares held on December 31, 2013. The Schedule 13G reports that Victory Capital Management Inc. has sole power to vote 1,574,293 shares, shared power to vote no shares and sole power to dispose of all of such shares. The address for Victory Capital Management Inc. is 4900 Tiedman Road, 4th Floor, Brooklyn, Ohio 44144. |
| (7) | Consists of (i) 1,549,253 shares of common stock held by Takuan, LLC, an entity controlled by Mr. Pike, (ii) 437,259 shares of common stock owned directly, (iii) 67,467 shares of common stock held by the Joe B. / Anne A. Pike Generation Skipping Trust, of which Mr. Pike is a trustee, and (iv) 1,214,209 shares subject to stock options. |
| (8) | Consists of (i) 6,398 restricted stock units owned directly, which vest on the earlier of (a) November 1, 2014 or (b) the date of the Company’s 2014 Annual Meeting of Shareholders, and (ii) 75,490 shares of common stock owned by the Bayless Family Trust, of which Mr. Bayless and his spouse are the co-trustees. Mr. Bayless may be deemed to have voting and dispositive power over such common stock. Mr. Bayless expressly disclaims beneficial ownership of such common stock, except to the extent of his pecuniary interest therein. |
| (9) | Consists of (i) 38,719 shares of common stock owned directly, (ii) 6,398 restricted stock units owned directly, which vest on the earlier of (a) November 1, 2014 or (b) the date of the Company’s 2014 Annual Meeting of Shareholders, and (iii) 18,041 deferred stock units, which will be released following Mr. Helvey’s termination of service as a director of the Company. |
| (10) | Consists of (i) 26,762 shares of common stock owned directly and (ii) 6,398 restricted stock units owned directly, which vest on the earlier of (a) November 1, 2014 or (b) the date of the Company’s 2014 Annual Meeting of Shareholders. |
| (11) | Consists of (i) 29,708 shares of common stock owned directly, (ii) 6,398 restricted stock units owned directly, which vest on the earlier of (a) November 1, 2014 or (b) the date of the Company’s 2014 Annual Meeting of Shareholders, and (iii) 18,041 deferred stock units, which will be released following Mr. Sullivan’s termination of service as a director of the Company. |
| (12) | Consists of (i) 8,773 shares of common stock owned directly and (ii) 6,398 restricted stock units owned directly, which vest on the earlier of (a) November 1, 2014 or (b) the date of the Company’s 2014 Annual Meeting of Shareholders. |
| (13) | Consists of 70,347 shares of common stock and options to purchase 203,536 shares of common stock, all of which are owned directly. |
103
Table of Contents
| (14) | Consists of 31,249 shares of common stock and options to purchase 110,137 shares of common stock, all of which are owned directly. |
| (15) | Consists of 201,001 shares of common stock and options to purchase 287,537 shares of common stock, all of which are owned directly. |
| (16) | Consists of 64,017 shares of common stock and options to purchase 226,489 shares of common stock, all of which are owned directly. |
As discussed under Note 21 of the Notes to Consolidated Financial Statements in Item 8 of Part II of this Annual Report, on August 4, 2014, the Company entered into the Merger Agreement under which an investment fund affiliated with Court Square Capital Partners and Mr. Pike would, if all conditions to closing are satisfied, acquire all of our outstanding common stock for $12.00 per share in cash. If the Transaction is completed, there will be a change of control of the Company.
Equity Compensation Plans
The executives are eligible for awards of stock options, stock appreciation rights, restricted stock, cash incentive awards and other equity-based awards under both the 2005 Plan and the 2008 Plan. In the event of a “change of control” of the Company, if the awards are not assumed or replaced in connection with the transaction, any outstanding awards granted (e.g., options, restricted stock, restricted stock units) then held by participants will automatically be deemed exercisable and vested without restriction immediately prior to such change of control, and all performance units and cash incentive awards will be paid out as if the date of the change of control were the last day of the applicable performance period and “target” performance levels had been obtained.
For the purposes of the 2005 Plan and the 2008 Plan, a “change of control” occurs in the following circumstances: (i) when, during any 24-consecutive month period, individuals who were directors at the beginning of such period cease at any time during such period to constitute a majority of the Board; (ii) with respect to the 2008 Plan only, when a person or group (other than private equity firm Lindsay Goldberg, the Company, its affiliates or any employee benefit plan sponsored or maintained by the Company or its affiliates) becomes the beneficial owner of Company voting securities representing 35% or more of the combined voting power of the Company’s then outstanding voting securities; (iii) with respect to the 2005 Plan only, when a person or group (other than Lindsay Goldberg, the Company, its affiliates or any employee benefit plan sponsored or maintained by the Company or its affiliates) becomes the beneficial owner of Company voting securities representing 20% or more of the combined voting power of the Company’s then outstanding voting securities and such percentage exceeds the voting power of Company securities beneficially owned by Lindsay Goldberg and its affiliates; (iv) upon the sale of all or substantially all assets to a person that is not an affiliate of the Company; (v) when the Company’s shareholders approve a plan of complete liquidation of the Company; or (vi) upon a merger, consolidation or similar corporate transaction involving the Company or, if voting securities are issued in connection with any such transaction, its subsidiaries.
The following table sets forth information regarding shares of Company common stock that may be issued under the 2005 Plan and the 2008 Plan as of June 30, 2014.
| Plan Category |
Number of securities to be issued upon exercise of outstanding options, warrants and rights (a) |
Weighted-average exercise price of outstanding options, warrants and rights (b) |
Number of securities
remaining available for future issuance under equity compensation plans (excluding securities reflected in column (a)) (c) |
|||||||||
| Equity compensation plans approved by security holders |
3,153,249 | (1) | $ | 11.50 | (2) | 3,061,313 | ||||||
| Equity compensation plans not approved by security holders |
0 | 0 | 0 | |||||||||
|
|
|
|
|
|
|
|||||||
| Total |
3,153,249 | (1) | $ | 11.50 | (2) | 3,061,313 | ||||||
| (1) | Includes outstanding, unvested restricted stock units. |
| (2) | Does not reflect outstanding, unvested restricted stock units included in column (a), which do not have an exercise price. |
104
Table of Contents
| ITEM 13. | CERTAIN RELATIONSHIPS AND RELATED TRANSACTIONS, AND DIRECTOR INDEPENDENCE |
Policy for Review of Related Person Transactions
The Company reviews relationships and transactions in which the Company and its directors and executive officers or their immediate family members and other related persons are participants to determine whether such related persons have a direct or indirect material interest. The Company’s executive management is primarily responsible for the development and implementation of processes and controls to obtain information from the directors and executive officers with respect to related person transactions and for then determining, based on the facts and circumstances, whether a related person has a direct or indirect material interest in the transaction. In addition, the nominating and governance committee reviews and approves or ratifies any related person transaction that is required to be disclosed.
As set forth in the nominating and governance committee’s charter, which is available on the Company’s website, www.pike.com, in the course of its review and approval or ratification of a disclosable related person transaction, the nominating and governance committee considers: (i) the nature of the related person’s interest in the transaction, including the actual or apparent conflict of interest of the related person; (ii) the material terms of the transaction and their commercial reasonableness; (iii) the significance of the transaction to the related person; (iv) the significance of the transaction to the Company and the benefits and perceived benefits, or lack thereof, to the Company; (v) opportunity costs of alternate transactions; (vi) whether the transaction would impair the judgment of a director or executive officer to act in the best interest of the Company; and (vii) any other matters the committee deems appropriate.
Related Person Transactions
On August 3, 2014, our board of directors, on the unanimous recommendation of a special committee, comprised entirely of independent and disinterested directors, adopted an Agreement and Plan of Merger, effective August 4, 2014 (the “Merger Agreement”), under which an investment fund affiliated with Court Square Capital Partners, would, if all conditions to closing in the Merger Agreement are satisfied, acquire all of our outstanding common stock for $12.00 per share in cash (the “Transaction”).
In connection with the Transaction, J. Eric Pike, our Chairman and Chief Executive Officer, together with the Joe B. / Anne A. Pike Generation Skipping Trust (the “Trust”) and Takuan, LLC (together with Mr. Pike and the Trust, the “JEP Investors”), have entered into a rollover equity financing commitment letter, dated as of August 4, 2014, pursuant to which the JEP Investors have committed to contribute to the sole shareholder of the surviving corporation in the Transaction (“Parent”) approximately 1,644,275 shares of our common stock and $1,078,308 received by Mr. Pike attributable to awards of restricted stock units with respect to shares of our common stock and options to purchase shares of our common stock pursuant to the Merger Agreement, in exchange for equity interests in Parent.
Director Independence
Our board of directors believes that a majority of its members are independent under both the NYSE rules and the SEC rules. The NYSE rules provide that a director does not qualify as “independent” unless the board of directors affirmatively determines that the director has no material relationship with the company (either directly or as a partner, shareholder or officer of an organization that has a relationship with the company). The NYSE rules require a board of directors to consider all of the relevant facts and circumstances in determining the materiality of a director’s relationship with a company and permit the board to adopt and disclose standards to assist the board in making determinations of independence. Accordingly, our board of directors has adopted Director Independence Standards, which incorporate the independence standards of the NYSE rules, to assist the Board in determining whether a director has a material relationship with the Company (the “Director Independence Standards”). The Director Independence Standards are available on the Company’s website, www.pike.com, as an attachment to the Corporate Governance Guidelines.
105
Table of Contents
In August 2014, our board of directors, with the assistance of the nominating and governance committee, conducted an evaluation of director independence based on the Director Independence Standards. In connection with this review, our board of directors evaluated banking, commercial, charitable, consulting, family and other relationships with each director and immediate family members of each director and their related interests in the Company and its subsidiaries. As a result of this evaluation, our board of directors affirmatively determined that none of Messrs. Bayless, Helvey, Pace, Sullivan and Turner had a relationship with the Company other than in their capacity as directors and that each of them is an independent director under the Director Independence Standards, the NYSE rules and the SEC rules. The board of directors also determined that each member of the audit, compensation and nominating and governance committees is independent. At such time, our board of directors also determined that Mr. Pike is not independent due to his employment with the Company.
| ITEM 14. | PRINCIPAL ACCOUNTANT FEES AND SERVICES |
Change in Independent Registered Public Accounting Firm
On November 20, 2013, the audit committee approved the engagement of KPMG LLP (“KPMG”) as the Company’s independent registered public accounting firm for the fiscal year ended June 30, 3014, and thereby dismissed Ernst & Young LLP (“E&Y”) from that role. E&Y served as the Company’s independent registered public accounting firm for the fiscal year ended June 30, 2013.
Audit Fees
The following table presents fees for professional audit services rendered by KPMG and E&Y for the audit of Pike’s consolidated financial statements for the fiscal years ended June 30, 2014 and June 30, 2013, respectively, and fees billed for other services rendered by KPMG and E&Y during those periods.
| FY 2014 (KPMG) |
FY 2013 (E&Y) |
|||||||
| Audit Fees (1) |
$ | 1,675,477 | $ | 1,705,500 | ||||
| Audit-Related Fees |
— | — | ||||||
| Tax Fees (2) |
— | 483,520 | ||||||
| All Other Fees |
— | — | ||||||
|
|
|
|
|
|||||
| Total |
$ | 1,675,477 | $ | 2,189,020 | ||||
| (1) | Audit fees consist of fees for the audit of annual financial statements and quarterly reviews. These fees also include fees billed for professional services rendered for the audit of management’s assessment of the effectiveness of internal control over financial reporting. |
| (2) | Tax fees principally consist of fees for tax compliance and tax advice, planning and consultations. |
Audit Committee Pre-Approval of Audit and Non-Audit Services
The audit committee’s policy is to pre-approve all audit and permissible non-audit services to be performed by the independent registered public accounting firm. These services may include audit services, audit-related services, tax services and other services. All such services provided in fiscal year 2014 were approved by the audit committee. Pre-approval is generally provided for up to one year and any pre-approval is detailed as to the particular service or category of services and is generally subject to a specific budget. The independent registered public accounting firm and management are required to periodically report to the full audit committee regarding the extent of services provided by the independent registered public accounting firm in accordance with this pre-approval, and the fees for the services performed to date. The audit committee may also pre-approve particular services on a case-by-case basis.
The audit committee has delegated pre-approval authority to its chairperson when necessary due to timing considerations. Any services approved by such chairperson must be reported to the full audit committee at its next scheduled meeting.
106
Table of Contents
| ITEM 15. | EXHIBITS AND FINANCIAL STATEMENT SCHEDULES |
| (a) | Financial Information |
| (1) | Financial Statements: See “Index to Consolidated Financial Statements” in Part II, Item 8 of this Form 10-K. |
| (2) | Financial Statement Schedule: See “Schedule II – Valuation and Qualifying Accounts” of this Form 10-K. |
| (3) | Exhibits |
See (b) below.
| (b) | Exhibits |
See Exhibit Index beginning on page 110.
| (c) | Financial Statement Schedules |
See (a) (2) above.
107
Table of Contents
Pursuant to the requirements of Section 13 or 15(d) of the Securities Exchange Act of 1934, the registrant has duly caused this report to be signed on its behalf by the undersigned, thereunto duly authorized.
| PIKE CORPORATION | ||||||
| (Registrant) | ||||||
| Date: September 12, 2014 | By: | /s/ J. Eric Pike | ||||
| J. Eric Pike | ||||||
| Chairman, Chief Executive Officer and President | ||||||
Pursuant to the requirements of the Securities Exchange Act of 1934, this report has been signed below by the following persons on behalf of the registrant and in the capacities and on the dates indicated.
| Signature |
Title |
Date | ||
| /s/ J. Eric Pike |
Chairman, Chief Executive Officer and President (Principal Executive Officer) |
September 12, 2014 | ||
| J. Eric Pike | ||||
| /s/ Anthony K. Slater |
Executive Vice President and Chief Financial Officer (Principal Financial Officer) |
September 12, 2014 | ||
| Anthony K. Slater | ||||
| /s/ Jeffrey S. Calhoun |
Chief Accounting Officer (Principal Accounting Officer) |
September 12, 2014 | ||
| Jeffrey S. Calhoun | ||||
| /s/ Charles E. Bayless |
Director | September 12, 2014 | ||
| Charles E. Bayless | ||||
| /s/ James R. Helvey III |
Director | September 12, 2014 | ||
| James R. Helvey III | ||||
| /s/ Peter Pace |
Director | September 12, 2014 | ||
| Peter Pace | ||||
| /s/ Daniel J. Sullivan III |
Director | September 12, 2014 | ||
| Daniel J. Sullivan III | ||||
| /s/ James L. Turner |
Director | September 12, 2014 | ||
| James L. Turner | ||||
108
Table of Contents
SCHEDULE II
PIKE CORPORATION
VALUATION AND QUALIFYING ACCOUNTS
FISCAL YEARS ENDED JUNE 30, 2014, 2013 AND 2012
| Description |
Balance at Beginning of Period |
Charged to Revenue or Expense |
Deductions | Balance at End of Period |
||||||||||||
| (in thousands) | ||||||||||||||||
| Fiscal year ended June 30, 2014: |
||||||||||||||||
| Allowance for doubtful accounts (1) |
$ | 1,894 | $ | 4,960 | $ | (1,323 | ) (3) | $ | 5,531 | |||||||
| Insurance claim accruals (2) |
18,304 | 29,392 | (29,742 | ) (4) | 17,954 | |||||||||||
| Fiscal year ended June 30, 2013: |
||||||||||||||||
| Allowance for doubtful accounts (1) |
$ | 863 | $ | 1,525 | $ | (494 | ) (3) | $ | 1,894 | |||||||
| Insurance claim accruals (2) |
17,187 | 30,816 | (29,699 | ) (4) | 18,304 | |||||||||||
| Fiscal year ended June 30, 2012: |
||||||||||||||||
| Allowance for doubtful accounts (1) |
$ | 537 | $ | 653 | $ | (327 | ) (3) | $ | 863 | |||||||
| Insurance claim accruals (2) |
20,710 | 30,815 | (34,338 | ) (4) | 17,187 | |||||||||||
| (1) | Allowance for doubtful accounts includes reserves for accounts receivable and costs and estimated earnings in excess of billings on uncompleted contracts. |
| (2) | Insurance claim accruals includes group insurance claim accruals totaling $2,862, $1,225 and $1,706 at June 30, 2014, 2013 and 2012 and are included in accrual expenses and other on the consolidated balance sheets. |
| (3) | Represents uncollectible accounts written off, net of recoveries. |
| (4) | Represents claim payments for self-insured claims. |
109
Table of Contents
EXHIBIT INDEX
| EXHIBIT NO. |
DESCRIPTION | |
| 2.1 | Stock Purchase Agreement, dated June 22, 2012, by and among Pike Enterprises, Inc., Synergetic Design Holdings, Inc., UC Synergetic, Inc., and the shareholders party thereto (Incorporated by reference to Exhibit 2.1 on our Form 8-K filed July 2, 2012) | |
| 2.2 | Agreement and Plan of Merger, dated September 16, 2013, between Pike Electric Corporation and Pike Corporation (Incorporated by reference to Exhibit 2.1 on our Form 8-K filed November 6, 2013) | |
| 2.3 | Agreement and Plan of Merger, dated as of August 4, 2014, by and among Pike Corporation, Pioneer Parent, Inc. and Pioneer Merger Sub, Inc. (Incorporated by reference to Exhibit 2.1 on our Form 8-K filed August 4, 2014) | |
| 3.1 | Amended and Restated Articles of Incorporation of Pike Corporation (Incorporated by reference to Exhibit 3.1 on our Form 8-K filed November 6, 2013) | |
| 3.2 | Amended and Restated Bylaws of Pike Corporation (filed herewith) | |
| 4.1 | Specimen Common Stock Certificate (Incorporated by reference to Exhibit 4.1 on our Form 8-K filed November 6, 2013) | |
| 4.2 | Senior Indenture (Incorporated by reference to Exhibit 4.6 on our Registration Statement on Form S-3 filed November 7, 2013) | |
| 4.3 | Subordinated Indenture (Incorporated by reference to Exhibit 4.7 on our Registration Statement on Form S-3 filed November 7, 2013) | |
| 10.1 | Credit Agreement, dated August 24, 2011, among Pike Electric Corporation, its subsidiaries party thereto, Regions Bank, as administrative agent, and the lenders party thereto (Incorporated by reference to Exhibit 10.1 on our Form 8-K filed August 30, 2011) | |
| 10.2 | Commitment Increase Agreement, dated June 27, 2012, among Pike Electric Corporation, its subsidiaries party thereto, and Regions Bank, as lender under the Credit Agreement and as administrative agent (Incorporated by reference to Exhibit 10.1 on our Form 8-K filed June 27, 2012) | |
| 10.3 | First Amendment to Credit Agreement and Limited Consent, dated November 4, 2013, among Pike Electric Corporation, Pike Corporation, the guarantors party thereto, Regions Bank, as administrative agent, and the lenders party thereto (Incorporated by reference to Exhibit 10.1 on our Form 8-K filed November 6, 2013) | |
| 10.4 | Second Amendment to Credit Agreement, dated as of December 17, 2013, among Pike Corporation, the guarantors party thereto, Regions Bank, as administrative agent, and the lenders party thereto (Incorporated by reference to Exhibit 10.1 on our Form 8-K filed December 20, 2013) | |
| 10.5 | Security Agreement, dated August 24, 2011, among Pike Electric Corporation, the grantors party thereto, and Regions Bank, as collateral agent (Incorporated by reference to Exhibit 10.2 on our Form 8-K filed August 30, 2011) | |
| 10.6 | Pledge Agreement, dated August 24, 2011, among Pike Electric Corporation, the pledgors party thereto, and Regions Bank, as collateral agent (Incorporated by reference to Exhibit 10.3 on our Form 8-K filed August 30, 2011) | |
| 10.7 | Joinder Agreement, dated November 4, 2013, among Pike Corporation and Regions Bank, as administrative agent and collateral agent (Incorporated by reference to Exhibit 10.2 on our Form 8-K filed November 6, 2013) | |
| 10.8 | Stockholders Agreement, dated April 18, 2002, among Pike Holdings, Inc., LGB Pike LLC, certain rollover holders and certain management shareholders (Incorporated by reference to Exhibit 10.6 on our Registration Statement on Form S-1/A filed June 3, 2005) | |
| 10.9 | Addendum, dated June 13, 2005, to the Stockholders Agreement, dated April 18, 2002, among Pike Holdings, Inc., LGB Pike LLC, certain rollover holders and certain management shareholders (Incorporated by reference to Exhibit 10.13 on our Registration Statement on Form S-1/A filed July 12, 2005) | |
110
Table of Contents
| 10.10 | Amendment, dated July 21, 2005, to the Stockholders Agreement, dated April 18, 2002, among Pike Electric Corporation as successor to Pike Holdings, Inc., LGB Pike II LLC as successor to LGB Pike LLC, certain rollover holders and certain management shareholders (Incorporated by reference to Exhibit 10.16 on our Registration Statement on Form S-1/A filed July 22, 2005) | |
| 10.11 | Share Repurchase Agreement, dated May 13, 2013, between Pike Electric Corporation and LGB Pike II LLC (Incorporated by reference to Exhibit 10.1 on our Form 8-K filed May 17, 2013) | |
| 10.12* | Employee Stock Purchase Plan (Incorporated by reference to Appendix A of our Proxy Statement on Schedule 14A filed October 28, 2005) | |
| 10.13* | 2002 Stock Option Plan A (Incorporated by reference to Exhibit 10.2 on our Registration Statement on Form S-1/A filed June 3, 2005) | |
| 10.14* | 2002 Stock Option Plan B (Incorporated by reference to Exhibit 10.3 on our Registration Statement on Form S-1/A filed June 3, 2005) | |
| 10.15* | 2005 Omnibus Incentive Compensation Plan (Incorporated by reference to Exhibit 10.15 on our Registration Statement on Form S-1/A filed July 22, 2005) | |
| 10.16* | 2008 Omnibus Incentive Compensation Plan, as Amended and Restated Effective November 3, 2011 (Incorporated by reference to Exhibit 10.1 on our Form 8-K filed November 4, 2011) | |
| 10.17* | Form of Stock Option Award Agreement (Incorporated by reference to Exhibit 10.11 on our Form 10-K filed September 1, 2009) | |
| 10.18* | Form of Restricted Share Award Agreement (Incorporated by reference to Exhibit 10.12 on our Form 10-K filed September 1, 2009) | |
| 10.19* | Form of Restricted Stock Unit Award Agreement (Incorporated by reference to Exhibit 10.13 on our Form 10-K filed September 1, 2009) | |
| 10.20* | Form of Director Restricted Stock Unit Award Agreement (Incorporated by reference to Exhibit 10.1 on our Form 10-Q filed November 9, 2011) | |
| 10.21* | Management Incentive Plan (Incorporated by reference to Exhibit 10.15 on our Form 10-K filed September 1, 2009) | |
| 10.22* | Compensation Deferral Plan (Incorporated by reference to Exhibit 10.1 on our Form S-8 filed February 25, 2011) | |
| 10.23* | Global Amendment to Pike Corporation Equity Compensation Plans dated November 5, 2013 (Incorporated by reference to Exhibit 10.1 on our Form 10-Q filed February 5, 2014) | |
| 10.24* | Director Compensation Policy (Incorporated by reference to Exhibit 10.2 on our Form 10-Q filed November 9, 2011) | |
| 10.25* | Compensatory arrangement with certain directors (Incorporated by reference to Exhibit 10.2 on our Form 8-K filed August 4, 2014) | |
| 10.26* | Amended and Restated Employment Agreement between Pike Electric Corporation and J. Eric Pike, dated as of September 24, 2008 (Incorporated by reference to Exhibit 10.1 on our Form 8-K filed September 29, 2008) | |
| 10.27* | Amendment, dated May 1, 2009, to Amended and Restated Employment Agreement, dated as of September 24, 2008, by and between Pike Electric Corporation and J. Eric Pike (Incorporated by reference to Exhibit 10.2 on our Form 8-K filed May 5, 2009) | |
| 10.28* | Form of Employment Agreement between Pike Electric Corporation and its executive officers (Incorporated by reference to Exhibit 10.1 on our Form 8-K filed June 12, 2009) | |
| 10.29* | Form of Amendment to Employment Agreement between Pike Corporation and its executive officers (Incorporated by reference to Exhibit 10.2 on our Form 8-K filed January 31, 2014) | |
| 10.30* | Form of Indemnification Agreement between Pike Corporation and its directors (Incorporated by reference to Exhibit 10.1 on our Form 8-K filed January 31, 2014) | |
111
Table of Contents
| 21.1 | List of subsidiaries of Pike Corporation (filed herewith) | |
| 23.1 | Consent of Ernst & Young LLP (filed herewith) | |
| 23.2 | Consent of KPMG LLP (filed herewith) | |
| 31.1 | Certification of Periodic Report by Chief Executive Officer pursuant to Rule 13a-14(a)/15d-14a and pursuant to Section 302 of the Sarbanes-Oxley Act of 2002 (filed herewith) | |
| 31.2 | Certification of Periodic Report by Chief Financial Officer pursuant to Rule 13a-14(a)/15d-14a and pursuant to Section 302 of the Sarbanes-Oxley Act of 2002 (filed herewith) | |
| 32.1 | Certification of Periodic Report by Chief Executive Officer and Chief Financial Officer pursuant to U.S.C. Section 1350, as adopted pursuant to Section 906 of the Sarbanes-Oxley Act of 2002 (filed herewith) | |
| 101 | Financial statements from the Annual Report on Form 10-K of Pike Corporation for the fiscal year ended June 30, 2014, filed on September 12, 2014, formatted in XBRL: (i) the Consolidated Balance Sheets, (ii) the Consolidated Statements of Income, (iii) the Consolidated Statements of Comprehensive Income, (iv) the Consolidated Statements of Shareholders’ Equity, (v) the Consolidated Statements of Cash Flows and (vi) the Notes to Consolidated Financial Statements | |
| * | Indicates a management contract or compensatory plan or arrangement. |
112