Attached files
| file | filename |
|---|---|
| 8-K - 8-K - Intrawest Resorts Holdings, Inc. | s000610x1_8k.htm |
| EX-99.1 - EXHIBIT 99.1 - Intrawest Resorts Holdings, Inc. | s000610x1_ex99-1.htm |
| EX-2.1 - EXHIBIT 2.1 - Intrawest Resorts Holdings, Inc. | s000610x1_ex2-01.htm |
| EX-99.2 - EXHIBIT 99.2 - Intrawest Resorts Holdings, Inc. | s000610x1_ex99-2.htm |

Full Year Fiscal 2014 Earnings Presentation September 12, 2014

Important Information 1 The following slides are part of a presentation by Intrawest Resorts Holdings, Inc . (“Company ”) in connection with reporting annual financial results and are intended to be viewed as part of that presentation . No representation is made that the information in these slides is complete . For additional financial, statistical and business related information, as well as information regarding business and segment trends, see the earnings release and financial supplement furnished as exhibits to the Company's Current Report on Form 8 - K, furnished today with the Securities and Exchange Commission (“SEC”) and available on the Company’s website (www . intrawest . com) and the SEC’s website (www . sec . gov) . This document contains forward - looking statements . These forward - looking statements are based on current expectations, estimates and projections about the industry and markets in which Intrawest operates as well as the Company’s beliefs and assumptions regarding our operations and financial performance, all of which are subject to known and unknown risks, uncertainties and others factors that may cause our actual results, performance or achievements, industry results or market trends to differ materially from those expressed or implied by such forward - looking statements . Therefore any statements contained herein that are not statements of historical fact may be forward - looking statements and should be evaluated as such . Without limiting the foregoing, words such as “Expects”, “Anticipates”, “Should”, “Intends”, “Plans”, “Believes”, “Seeks”, “Estimates”, “Projects”, and variations of such words and similar expressions are intended to identify such forward - looking statements . These statements are not guarantees of future performance and involve certain risks, uncertainties and assumptions which are difficult to predict, including those described in Part II - Item 1 , ‘‘Risk Factors’’ in our Quarterly Report on Form 10 - Q for the period ended December 31 , 2013 filed with the SEC, as may be revised in subsequent SEC filings . Therefore , actual outcomes and results may differ materially from what is expressed or forecasted in such forward - looking statements . The actual performance of Intrawest may differ from the budget, projections and returns set forth herein and may differ materially . Certain information contained herein has been obtained from published and non - published sources . Such information has not been independently verified by Intrawest . Except where otherwise indicated, the information provided herein is based on matters as they exist as of the date of preparation and not as of any future date, and will not be updated or otherwise revised to reflect information that subsequently becomes available, or circumstances existing or changes occurring after the date hereof . This presentation includes certain non - GAAP financial measures, including Adjusted EBITDA (“Adj . EBITDA ”) . Non - GAAP financial measures such as Adj . EBITDA should be considered only as supplemental to, and not as superior to, financial measures prepared in accordance with GAAP . Please refer to our Current Report on Form 8 - K furnished today with the Securities and Exchange Commission for a reconciliation of the non - GAAP financial measures included in this presentation to the most directly comparable financial measures prepared in accordance with GAAP . We use Adj . EBITDA as a measure of our operating performance . Adj . EBITDA is a supplemental non - GAAP financial measure . Our board of directors and management team focus on Adj . EBITDA as a key performance and compensation measure . Adj . EBITDA assists us in comparing our performance over various reporting periods because it removes from our operating results the impact of items that our management believes do not reflect our core operating performance . The compensation committee of our board of directors will determine the annual variable compensation for certain members of our management team, based in part, on Adj . EBITDA . Adj . EBITDA is not a substitute for net income (loss), income (loss) from continuing operations, cash flows from operating activities or any other measure prescribed by GAAP . There are limitations to using non - GAAP measures such as Adj . EBITDA . Although we believe that Adj . EBITDA can make an evaluation of our operating performance more consistent because it removes items that do not reflect our core operations, other companies in our industry may define Adj . EBITDA differently than we do . As a result, it may be difficult to use Adj . EBITDA to compare the performance of those companies to our performance . Adj . EBITDA should not be considered as a measure of the income generated by our business or discretionary cash available to us to invest in the growth of our business . Our management compensates for these limitations by reference to our GAAP results and using Adj . EBITDA as a supplemental measure .


Full Year Fiscal 2014 Highlights 5 Significant Mountain Growth ▪ Mountain Segment Revenue growth of 5 . 4 % in constant currency ▪ Mountain Adjusted EBITDA growth of 8 . 1 % in constant currency ▪ Skier Visits grew 7 . 9 % over Fiscal Year 2013 vs . 0 . 7 % decline U . S . industry wide ▪ Season Pass and Frequency product sales grew over 18 % vs . prior year ▪ CMH Revenue up 4 . 5 % in constant currency primarily due to increased pricing and product mix ▪ Market demand for premium private lodge and small group trip options Continued CMH Success Shift in Ancillary Aviation ▪ Several medium - term U . S . Forest Service firefighting contracts expired ▪ Higher proportion of “as needed” or spec contracts with revenue based on flight hours ▪ Deferred business in maintenance and repair operations

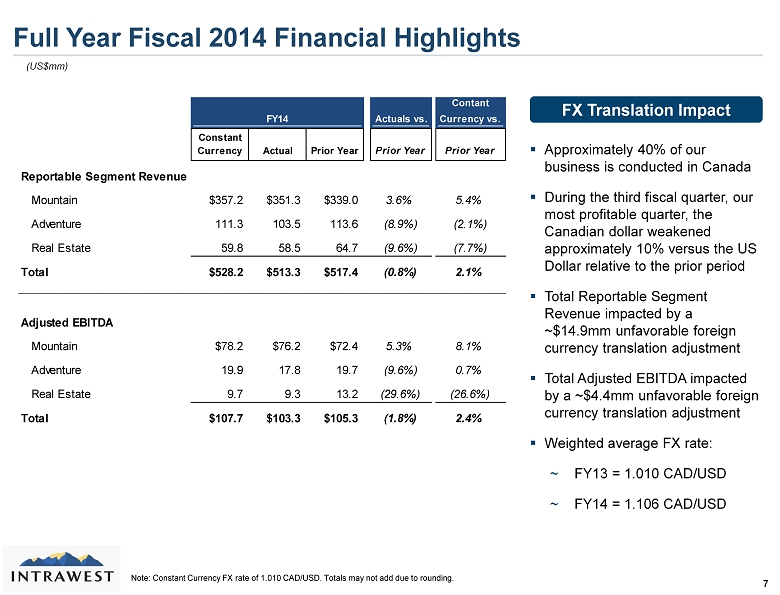
Note: Constant Currency FX rate of 1.010 CAD/USD. Totals may not add due to rounding. Full Year Fiscal 2014 Financial Highlights 7 (US$mm) ▪ Approximately 40% of our business is conducted in Canada ▪ During the third fiscal quarter, our most profitable quarter, the Canadian dollar weakened approximately 10% versus the US Dollar relative to the prior period ▪ Total Reportable Segment Revenue impacted by a ~$14.9mm unfavorable foreign currency translation adjustment ▪ Total Adjusted EBITDA impacted by a ~$4.4mm unfavorable foreign currency translation adjustment ▪ Weighted average FX rate: ~ FY13 = 1.010 CAD/USD ~ FY14 = 1.106 CAD/USD FX Translation Impact FY14 x Actuals vs. Contant Currency vs. Constant Currency Actual Prior Year Prior Year Prior Year Reportable Segment Revenue Mountain $357.2 $351.3 $339.0 3.6% 5.4% Adventure 111.3 103.5 113.6 (8.9%) (2.1%) Real Estate 59.8 58.5 64.7 (9.6%) (7.7%) Total $528.2 $513.3 $517.4 (0.8%) 2.1% Adjusted EBITDA Mountain $78.2 $76.2 $72.4 5.3% 8.1% Adventure 19.9 17.8 19.7 (9.6%) 0.7% Real Estate 9.7 9.3 13.2 (29.6%) (26.6%) Total $107.7 $103.3 $105.3 (1.8%) 2.4%


Full Year Fiscal 2014 Results 10 Enhanced Capital Structure Successfully Executed Volume Growth Strategy and Grew Market Share Strong Growth in Season Pass & Frequency Product Sales Capital Projects Generating Solid Returns

Q & A