Attached files
| file | filename |
|---|---|
| EX-32.2 - EX-32.2 - General Finance CORP | d728068dex322.htm |
| EX-32.1 - EX-32.1 - General Finance CORP | d728068dex321.htm |
| EX-23.1 - EX-23.1 - General Finance CORP | d728068dex231.htm |
| EX-31.2 - EX-31.2 - General Finance CORP | d728068dex312.htm |
| EX-31.1 - EX-31.1 - General Finance CORP | d728068dex311.htm |
| EX-21.1 - EX-21.1 - General Finance CORP | d728068dex211.htm |
| EXCEL - IDEA: XBRL DOCUMENT - General Finance CORP | Financial_Report.xls |
Table of Contents
UNITED STATES
SECURITIES AND EXCHANGE COMMISSION
Washington, D.C. 20549
FORM 10-K
| x | ANNUAL REPORT PURSUANT TO SECTION 13 OR 15(d) OF THE SECURITIES EXCHANGE ACT OF 1934 |
For the Fiscal Year Ended June 30, 2014
OR
| ¨ | TRANSITION REPORT PURSUANT TO SECTION 13 OR 15(d) OF THE SECURITIES EXCHANGE ACT OF 1934 |
Commission file number 001-32845

(Exact name of registrant as specified in its charter)
| Delaware | 32-0163571 | |
| (State or other Jurisdiction of Incorporation or Organization) | (I.R.S. Employer Identification No.) | |
| 39 East Union Street Pasadena, California 91103 |
(626) 584-9722 | |
| (Address of Principal Executive Offices) | (Registrant’s telephone number, including area code) | |
Securities registered pursuant to Section 12(b) of the Act:
| Title of Each Class |
Name of Each Exchange On Which Registered | |
| Common Stock, $0.0001 par value | NASDAQ Global Market | |
| 9.00% Series C Cumulative Redeemable Perpetual Preferred Stock (Liquidation Preference $100 per share) | NASDAQ Global Market | |
| 8.125% Senior Notes due 2021 | NASDAQ Global Market |
Securities registered pursuant to Section 12(g) of the Act:
None
Indicate by check mark if the registrant is a well-known seasoned issuer, as defined in Rule 405 the Securities Act. Yes ¨ No x
Indicate by check mark if the registrant is not required to file reports pursuant to Section 13 or Section 15(d) of the Act. Yes ¨ No x
Indicate by check mark whether the registrant: (1) has filed all reports required to be filed by Section 13 or 15(d) of the Securities Exchange Act of 1934 during the preceding 12 months (or for such shorter period that the registrant was required to file such reports) and (2) has been subject to such filing requirements for the last 90 days. Yes x No ¨
Indicate by check mark whether the registrant has submitted electronically and posted on its corporate Web site, if any, every Interactive Data File required to be submitted and posted pursuant to Rule 405 of Regulation S-T (§232.405 of this chapter) during the preceding 12 months (or for such shorter period that the registrant was required to submit and post such files). Yes x No ¨
Indicate by check mark if disclosure of delinquent filers pursuant to Item 405 of Regulation S-K is not contained herein, and will not be contained, to the best of registrant’s knowledge, in definitive proxy or information statements incorporated by reference in Part III of this Form 10-K or any amendment to this Form 10-K. x
Indicate by check mark whether the registrant is a large accelerated filer, an accelerated filer, a non-accelerated filer, or a smaller reporting company. See definition of “large accelerated filer,” “accelerated filer” and “smaller reporting company” in Rule 12b-2 of the Exchange Act.
| Large accelerated filer | ¨ | Accelerated filer | ¨ | |||
| Non-accelerated filer | ¨ (Do not check if a smaller reporting company) | Smaller reporting company | x | |||
Indicate by check mark whether the registrant is a shell company (as defined in Rule 12b-2 of the Exchange Act). Yes ¨ No x
The aggregate market value of Common Stock held by non-affiliates of the Registrant on December 31, 2013 was approximately $59,036,000 based on a closing price of $6.03 for the Common Stock on such date. For purposes of this computation, all executive officers and directors have been deemed to be affiliates. Such determination should not be deemed to be an admission that such executive officers and directors are, in fact, affiliates of the Registrant.
There were 25,673,259 shares of the Registrant’s Common Stock outstanding as of September 8, 2014.
DOCUMENTS INCORPORATED BY REFERENCE
Portions of the Registrant’s Proxy Statement for its 2014 Annual Meeting of Stockholders are incorporated by reference into Part III of this Annual Report on Form 10-K. In addition, certain exhibits are incorporated into Part IV, Item 15. of this Annual Report on Form 10-K by reference to other reports and registration statements of the Registrant, which have been filed with the Securities and Exchange Commission.
Table of Contents
GENERAL FINANCE CORPORATION
2014 ANNUAL REPORT ON FORM 10-K
| Page | ||
| ii | ||
| I-1 | ||
| I-20 | ||
| I-35 | ||
| I-36 | ||
| I-38 | ||
| I-38 | ||
| II-1 | ||
| II-2 | ||
| Item 7. Management’s Discussion and Analysis of Financial Condition and Results of Operations |
II-4 | |
| Item 7A. Quantitative and Qualitative Disclosures About Market Risk |
II-15 | |
| II-15 | ||
| Item 9. Changes in and Disagreements with Accountants on Accounting and Financial Disclosure |
II-16 | |
| II-16 | ||
| II-16 | ||
| Item 10. Directors, Executive Officers and Corporate Governance |
III-1 | |
| III-1 | ||
| III-1 | ||
| Item 13. Certain Relationships and Related Transactions, and Director Independence |
III-1 | |
| III-1 | ||
| IV-1 | ||
| SIG | ||
i
Table of Contents
This Annual Report on Form 10-K, including the documents incorporated by reference into this Annual Report on Form 10-K, contains forward-looking statements within the meaning of Section 27A of the Securities Act of 1933, as amended, referred to in this Annual Report on Form 10-K as the Securities Act, and Section 21E of the Securities Exchange Act of 1934, as amended, referred to in this Annual Report on Form 10-K as the Exchange Act. Forward-looking statements involve risks and uncertainties that could cause results or outcomes to differ materially from those expressed in the forward-looking statements. Forward-looking statements may include, without limitation, statements relating to our plans, strategies, objectives, expectations and intentions and are intended to be made pursuant to the safe harbor provisions of the Private Securities Litigation Reform Act of 1995. Some of the forward-looking statements can be identified by the use of forward-looking terms such as “believes,” “expects,” “may,” “will,” “should,” “could,” “seek,” “intends,” “plans,” “estimates,” “anticipates” or other comparable terms. A number of important factors could cause actual results to differ materially from those in the forward-looking statements. The risks and uncertainties discussed in “Risk Factors” should be considered in evaluating our forward-looking statements. You should not place undue reliance on our forward-looking statements. Further, any forward-looking statement speaks only as of the date on which it is made, and we undertake no obligation to update or revise any forward-looking statements.
ii
Table of Contents
References to “we,” “us,” “our” or the “Company” refer to General Finance Corporation, a Delaware corporation (“GFN”), and its consolidated subsidiaries. These subsidiaries include GFN U.S. Australasia Holdings, Inc., a Delaware corporation (“GFN U.S.”); GFN North America Leasing Corporation , a Delaware corporation (“GFNNA Leasing”); GFN North America Corp., a Delaware corporation (“GFNNA”); GFN Manufacturing Corporation, a Delaware corporation (“GFNMC”) and its subsidiary, Southern Frac, LLC, a Texas limited liability company (collectively “Southern Frac”); Royal Wolf Holdings Limited, an Australian corporation publicly traded on the Australian Securities Exchange (“RWH”); and its Australian and New Zealand subsidiaries (collectively, “Royal Wolf”); Pac-Van, Inc., an Indiana corporation , and its Canadian subsidiary, PV Acquisition Corp., an Alberta corporation (collectively “Pac-Van”); and Lone Star Tank Rental Inc., a Delaware corporation (“Lone Star”).
Background and Overview
We incorporated in Delaware on October 14, 2005 and completed our initial public offering (“IPO”) in April 2006. Our primary long-term strategy and business plan are to acquire and operate rental services and specialty finance businesses in North and South America, Europe and the Asia-Pacific (or Pan-Pacific) area.
On April 7, 2014, we, through Lone Star (our indirect wholly-owned subsidiary), closed our acquisition of substantially all of the assets and the assumption of certain of the liabilities of the affiliated companies, Lone Star Tank Rental, LP, based in Kermit, Texas, and KHM Rentals, LLC, based in Kenedy, Texas. As part of our North American leasing operations, Lone Star leases portable liquid storage tank containers and containment products, as well as provides certain fluid management services, to the oil and gas industry in the Permian and Eagle Ford basins of Texas. Reference is made to Note 4 of Notes to Consolidated Financial Statements for more information regarding this significant acquisition.
We have two geographic areas that include four operating segments; the Asia-Pacific (or Pan-Pacific) area, consisting of Royal Wolf (which leases and sells storage containers, portable container buildings and freight containers in Australia and New Zealand) and North America, consisting of Pac-Van (which leases and sells storage, office and portable liquid storage tank containers, modular buildings and mobile offices), and Lone Star (see above) , which are combined to form our “North American Leasing” operations, and Southern Frac (which manufactures portable liquid storage tank containers).
We do business in three distinct, but related industries, mobile storage, modular space and liquid containment; which we collectively refer to as the “portable services industry.” Our two geographic leasing operations lease and sell their products through twenty customer service centers (“CSCs”) in Australia, eight CSCs in New Zealand, thirty-one branch locations in the United States and two branch locations in Canada. As of June 30, 2014, we had 275 and 627 employees and 40,378 and 21,219 lease fleet units in the Asia-Pacific area and North America, respectively.
Our products primarily consist of the following:
Containers
Storage Containers. Storage containers consist of new and used shipping containers that provide a flexible, low cost alternative to warehousing, while offering greater security, convenience and immediate accessibility. Our storage products include general purpose dry storage containers, refrigerated containers and specialty containers in a range of standard and modified sizes, designs and storage capacities. Specialty containers include blast-resistant units, hoarding units and hazardous-waste units. We also offer storage vans, also known as storage trailers or dock-height trailers.
Freight Containers. Freight containers are specifically designed for transport of products by road and rail. Our freight container products include curtain-side, refrigerated and bulk cargo containers, together with a range of standard and industry-specific dry freight containers. Freight containers are only offered in the Asia-Pacific area and we consider them part of the mobile storage industry on a consolidated basis.
Portable Container Buildings and Office Containers. Portable container buildings and office containers are either modified or specifically-manufactured containers that provide self-contained office space with maximum design flexibility. Office containers in the U.S. are oftentimes referred to as ground level offices (“GLOs”).
Portable Liquid Storage Tank Containers. Portable liquid storage tank containers are often referred to as “frac tanks” or “frac tank containers” and are manufactured steel containers with fixed steel axles for transport and use in a variety of industries; including oil and gas exploration and field services, refinery, chemical and industrial plant maintenance, environmental remediation and field services, infrastructure building construction, marine services,
I-1
Table of Contents
pipeline construction and maintenance, tank terminals services, wastewater treatment and waste management and landfill services. While there are a number of different sizes of tanks currently used in the market place, we are currently focusing on the more common 500-barrel capacity containers. Our products typically include features such as guardrails, safety stairways, multiple entry ways and a sloped bottom for easy cleaning, an epoxy lining, and various feed and drain lines.
Other
Modular Buildings. Also known as manufactured buildings, modular buildings provide customers with additional space and are often modified to customer specifications. Modular buildings range in size from 1,000 to more than 30,000 square feet and may be highly customized.
Mobile Offices. Also known as trailers or construction trailers, mobile offices are re-locatable units with aluminum or wood exteriors on wood (or steel) frames on a steel carriage fitted with axles, allowing for an assortment of “add-ons” to provide comfortable and convenient temporary space solutions.
ASIA-PACIFIC AREA
We believe Royal Wolf is the leading provider in Australia and New Zealand of portable storage containers, portable container buildings and freight containers, which we refer to collectively as “storage container products.” Royal Wolf leases and sells storage container products through its Customer Service Centers (“CSCs”) located in every state in Australia and in the North and South Islands of New Zealand. and, as such, is the only storage container products company in Australia and New Zealand with a national infrastructure and work force. Royal Wolf has an experienced senior management team. Robert Allan, the chief executive officer of Royal Wolf, has over 33 years of experience in the equipment leasing industry. The nine members of the senior management team of Royal Wolf have an average of over 16 years of experience in the equipment leasing industry. We believe the experience of this management team will be critical to growing Royal Wolf’s business.
Royal Wolf’s storage container products are used by a broad range of industries. Our storage container products provide secure, accessible temporary storage for a diverse client base of over 21,000 large and small customers who conduct business in industries that include mining, road and rail, construction, moving and storage, manufacturing, transportation, defense and in the support of small and medium-size entities (“SMEs”). Our customers use our products for a wide variety of storage applications, including retail and manufacturing inventory, construction materials and equipment, documents and records and household goods.
We are pursuing a long-term strategy focused on growing our leasing operations, generating strong internal growth and leveraging our infrastructure through acquisitions, as follows:
Focus on Mobile Storage Leasing Business. We focus on growing our core leasing business because it provides predictable, recurring revenue and high margins. We believe that we can generate substantial demand for our storage container products as the container storage and portable container building industry is still relatively underdeveloped in Australia and New Zealand. Although mobile storage, domestic freight movement and portable building applications are increasing, we believe many more uses for our storage container products are still to be developed. Royal Wolf’s market opportunity is to fully develop and service these applications.
Generate Strong Internal Growth. We define internal growth as an increase in lease revenues on a year-over-year basis at our CSCs in operation for at least one year, without inclusion of leasing revenue attributed to same-market acquisitions. We continue to focus on increasing the number of storage containers we lease from our existing branches to both new and repeat customers. Historically, we have been able to generate strong internal growth within our existing markets through sales and marketing programs designed to increase brand recognition, expand market awareness of the uses of mobile storage and differentiate our products from our competitors.
Leverage our Infrastructure through Acquisitions. Our branch network infrastructure covers a broad geographic area and is capable of serving additional volume at minimal levels of additional fixed costs. Our objective is to add volume by organically growing the lease fleet in these locations and through acquisitions. Asset purchases of “tuck in” competitors to existing or acquired CSCs or adding new fleet allows us to more effectively leverage our infrastructure. In addition, the corporate infrastructure of Royal Wolf is capable of managing existing fleets and locations in geographies outside of Australia and New Zealand, but within the Asia-Pacific area. From September 2007 through June 2014, Royal Wolf completed twelve acquisitions and, as a result of these acquisitions and organic growth, Royal Wolf’s lease fleet grew from approximately 17,000 units at September 30, 2007 to over 40,000 units as of June 30, 2014.
I-2
Table of Contents
Industry Overview
The storage industry includes two principal markets, fixed self-storage and mobile storage. The fixed self-storage market consists of permanent structures located away from customer locations used primarily by consumers to temporarily store excess household goods. Although we have containers that are used for self-storage on our sites and have sites that are focused on self-storage such as Auckland and Christchurch in New Zealand, we do not participate in the fixed self-storage market with permanent structures.
The portable storage market, in which we operate, differs from the fixed self-storage market in that it brings the storage solution to the customer’s location and addresses the need for secure, temporary storage with immediate access to the storage unit. The advantages of portable storage include convenience, immediate accessibility, better security and lower costs. In contrast to fixed self-storage, the portable storage market is primarily used by businesses.
Mobile Storage Container Market
Since the mid-1990s, the storage container industry in Australia and New Zealand has developed into a stable market, analogous to the marine container business of 30 or so years ago. Marine containerization displaced less efficient and more expensive specialized equipment. We believe mobile storage containers are achieving increased market share compared to the other options because of an increasing awareness that containers provide ground level access, durable protection against damage caused by wind or water and custom modifications tailored to customers’ specific uses.
We are not aware of any published third-party analysis of the Australia and New Zealand mobile storage container markets. Based upon internal analysis, Royal Wolf’s management team estimates that the mobile storage market in Australia and New Zealand currently generates annual revenues of approximately $293 million (AUS$310 million), with an estimated 30% derived from sales of mobile storage containers. Royal Wolf’s management team also anticipates that, as the market matures, leasing revenues will account for an increasing proportion of the total revenue.
The mobile storage market has experienced steady growth since the mid-1990s. Although there is no official forecast of industry growth rates or the future potential size market for mobile storage in Australia and New Zealand, we believe that a number of factors suggest that the market will continue to grow:
| • | The level of knowledge among potential customers regarding the availability and benefits of containerized storage in key Australia and New Zealand markets, such as the construction and mining industries, is still relatively low; |
| • | Suppliers and customers continue to develop further uses for mobile storage containers, thereby broadening the market for mobile storage containers; and |
| • | As the market leader in Australia and New Zealand, Royal Wolf has consistently achieved organic growth based, in part, on growth in the market as a whole. |
The mobile storage markets in Australia and New Zealand are highly fragmented. In most locations in Australia, Royal Wolf competes with several national and regional competitors, including Cronos, and CGM-CMA, as well as smaller, full and part-time operators. Local competitors are regionally focused, and are usually more capital-constrained. Therefore, in general, most are heavily reliant on monthly sales performance, have slowly growing rental fleets and have limited ability to transact larger deals. The New Zealand market is even more fragmented.
Portable Container Buildings Market
The portable container buildings market in Australia was estimated to have generated revenue totaling $2,549 million (AUS$2,700 million), of which approximately $1,657 million (AUS$1,755 million) relates to the markets in which Royal Wolf offers a competing product, according to reports from IBIS World Industry Report published in January 2014. The portable buildings market consists of the following:
| • | Engineering construction and resources — approximately 50%. |
| • | Households — approximately 20% |
| • | Non-residential building and property — approximately 15%. |
| • | Recreation and tourism — approximately 5%. |
| • | Agriculture — approximately 10% |
I-3
Table of Contents
Within the engineering construction and resources market, portable container buildings are used for site offices, toilet and shower facilities, and worker housing and temporary accommodation blocks. This market is influenced by trends in public and private sector spending on infrastructure, generally, and, particularly, mine development and road and pipeline construction.
Demand from the non-residential buildings market principally stems from the demand for work sheds, site offices, industrial garages and temporary warehousing.
We believe the recreation and holiday market is increasingly becoming an important source of demand, particularly for the supply of fitted out cabins to be used as rental accommodations and second homes on purchased blocks of land. Growth in demand has been driven by growth in disposable income and increased leisure time associated with an aging population.
We believe that the portable container buildings market will grow over the long-term term, driven in part by a cyclical expansion in the mining and construction markets. We believe that the advantages of containerized portable buildings over traditional portable buildings of transportability, security and flexibility are highly valued in the mining and construction markets. We believe these markets represent a significant growth opportunity for Royal Wolf.
In the portable container buildings markets, Royal Wolf competes with four large participants who manufacture their own units and most of whom offer units for both lease and sale to customers. These competitors include Coates, Atco, Ausco and Nomad. At present, Royal Wolf has a small presence in this market. The major barrier to entry for new participants is the degree of market penetration necessary to create a wide profile with contractors and clients. Penetrating and competing with the range of products and number of depots and agencies offered by incumbent operators tends to inhibit new entrants. As Royal Wolf already has a national sale and distribution network, established supply channels and a strong profile in its target markets, many of the barriers to entry applicable to other new entrants are not applicable to it.
Freight Container Market
Based upon internal analysis, Royal Wolf’s management team estimates that the freight container market in Australia generated approximately $67 million (AUS $71 million) in aggregate annual lease and sales revenues in the fiscal year ended June 30, 2014 (“FY 2014”). The rate of growth in this industry has been slow compared with the portable container storage and portable container buildings market. Although there is potential for growth in the freight container market as more road and rail carriers recognize the efficiencies of containerization, Royal Wolf’s present strategy is to maintain rather than grow its container fleet in this sector. Competitors include Cronos and the SCF Group (Simply Containers).
Products and Services
Royal Wolf is the only storage container product company in Australia and New Zealand with both the national presence and product range capable of servicing all sectors of the domestic rental and sales market. Key products include:
| Mobile storage containers: | 10-foot, 20-foot and 40-foot general purpose units | |
| Double pallet-wide high cube units | ||
| Hazardous goods containers | ||
| Refrigerated containers | ||
| Portable building containers: | Site offices and cabins | |
| Workforce accommodation units | ||
| Luxury accommodation units | ||
| Restroom blocks | ||
| Blast-resistant units | ||
| Specialized office and infrastructure suites | ||
| Freight containers: | Curtain-side containers | |
| 20-foot and 40-foot Hi-cube containers | ||
| 20-foot and 40-foot two pallet-wide containers | ||
| Side-opening door containers | ||
| 20-foot bulk containers | ||
I-4
Table of Contents
Mobile Storage Containers. Royal Wolf leases and sells mobile storage containers, some of which are customized for specific customers, for on-site storage by customers. These customers include retail outlets and manufacturers, government departments, farming and agricultural concerns, building and construction companies, clubs and sporting associations, mine operators and the general public. Royal Wolf’s products include general purpose dry storage containers, refrigerated containers and hazardous goods containers in a range of standard and modified sizes, designs and storage capacities. There were 26,594 mobile storage containers in the lease fleet at June 30, 2014. The amount and percentage of Royal Wolf’s total sales and leasing revenues of mobile storage containers for FY 2014 were as follows ($ in millions):
| Dollars | Percentage | |||||||
| Sales |
$ | 52.1 | 59.4 | % | ||||
| Leasing |
44.3 | 59.9 | % | |||||
|
|
|
|
|
|||||
Total revenues from mobile storage containers were 59.6% of Royal Wolf’s total revenues in FY 2014.
Portable Container Buildings. Royal Wolf also leases and sells portable container buildings as site offices and for temporary accommodations. Royal Wolf customizes mobile storage container buildings for some customers. Royal Wolf entered the portable building market in August 2005 with 20-foot and 40-foot portable buildings manufactured from steel container platforms which it markets to a subset of its mobile storage container customer base. There were 4,388 portable container buildings in the lease fleet at June 30, 2014. The amount and percentage of Royal Wolf’s total sales and leasing of portable container building revenues for FY 2014 were as follows ($ in millions):
| Dollars | Percentage | |||||||
| Sales |
$ | 17.7 | 20.2 | % | ||||
| Leasing |
19.0 | 25.7 | % | |||||
|
|
|
|
|
|||||
Total revenues from portable container buildings were 22.7% of Royal Wolf’s total revenues in FY 2014.
Freight Containers. Royal Wolf leases and sells freight containers specifically designed for transport of products by road and rail. Customers include national moving and storage companies, distribution and logistics companies, freight forwarders, transport companies, rail freight operators and the Australian military. Royal Wolf’s freight container products include curtain-side, refrigerated and bulk cargo containers, together with a range of standard and industry-specific dry freight containers. There were 9,396 freight containers in the lease fleet at June 30, 2014. The amount and percentage of Royal Wolf’s total sales and leasing of freight container revenues for FY 2014 were as follows ($ in millions):
| Dollars | Percentage | |||||||
| Sales |
$ | 17.9 | 20.4 | % | ||||
| Leasing |
10.7 | 14.4 | % | |||||
|
|
|
|
|
|||||
Total revenues from freight containers were 17.7% of Royal Wolf’s total revenues in FY 2014.
Most of our fleet is comprised of new and refurbished and customized storage containers, manufactured steel containers and record storage units, along with our freight and accommodation units. These products are designed for long useful lives. A portion of our fleet consists of used storage containers of eight to thirteen years in age, a time at which their useful life as ocean-going shipping containers is over according to the standards promulgated by the International Organization for Standardization, which we refer to as “ISO.” Because we do not have the same stacking and strength requirements that apply in the ocean-going shipping industry, we have no need for these containers to meet ISO standards. We purchase these containers in large quantities, refurbish them by removing any rust and paint them with a rust inhibiting paint, and further customize them, and add our decals and branding.
We maintain our steel containers on a regular basis by painting them on average once every three to five years, removing rust, and occasionally replacing the wooden floor or other parts. This periodic maintenance keeps the container in good condition and is designed to maintain the unit’s value and rental rates comparable to new units.
Product Procurement
Royal Wolf purchases marine cargo containers from a wide variety of international shipping lines and container leasing companies and new container products directly from storage container manufacturers in China. We believe Royal Wolf is the largest buyer of both new and used storage container products for the Australia and New Zealand markets. The majority of used storage containers purchased is standard 20-foot and 40-foot units which Royal Wolf converts, refurbishes or customizes. Royal Wolf purchases new storage containers directly from container manufacturers.
I-5
Table of Contents
Each of the following container suppliers was the source of two percent or more of Royal Wolf’s container purchases during FY 2014:
| Suppliers |
Type of Product Purchased | Percentage of Container Purchases | ||
| Nantong CIMC |
New | 9% | ||
| Eastern Container Alliance |
New | 6 | ||
| Qingdao CIMC |
New | 4 | ||
| Jiangsu Tercel Logistics |
New | 3 | ||
|
|
Royal Wolf purchases new storage container products under purchase orders issued to container manufacturers, which the manufacturers may or may not accept or be able to fill. There are several alternative sources of supply for storage containers. Though Royal Wolf is not dependent upon any one manufacturer in purchasing storage container products, the failure of one or more of its suppliers to timely deliver containers to Royal Wolf could adversely affect its operations. If these suppliers do not timely fill Royal Wolf’s purchase orders or do not properly manufacture the ordered products, Royal Wolf’s reputation and financial condition also could be harmed.
CSC Network
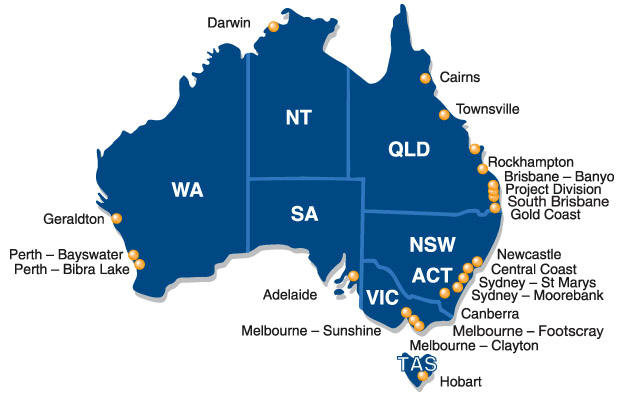
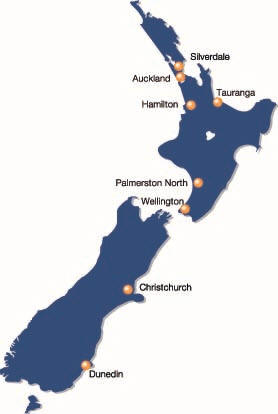
Royal Wolf leases and sells its storage container products from an Australia and New Zealand network of CSCs which we believe is the largest branch network of any storage container company in Australia and New Zealand. Royal Wolf is represented in all major metropolitan areas, and Royal Wolf is the only container leasing and sales company with a nationally integrated infrastructure and work force. A typical Royal Wolf CSC consists of a leased site of approximately two to five acres with a sales office, forklifts and all-weather container repair workshop. CSC office staffing ranges from two to 15 people and include a branch manager supported by the appropriate level of sales, operations and administrative personnel. Yard and workshop staffing usually ranges between one and 12 people and can consist of welders, spray painters, boilermakers, forklift drivers and production supervisors. CSC inventory holding usually ranges between 150 and 700 storage containers at any one time, depending on market size and throughput demand. The following map shows Royal Wolf’s existing CSC locations at June 30, 2014.
I-6
Table of Contents
Each CSC has a branch manager who has overall supervisory responsibility for all activities of the CSC. Branch managers report to one of our seven State Managers for Australia and Sales Managers, Island (North and South Islands) for New Zealand who in turn report to an Executive General Manager who reports to the CEO. Performance-based incentive bonuses are a portion of the compensation for the CSC, State, Island and branch managers.
Each branch has its own sales force, and we are introducing a transportation department that will deliver and pick up mobile storage units from customers in certain hub areas. Each branch has forklifts to load, transport and unload units and a storage yard staff responsible for unloading and stacking units. Steel units can be stored by stacking them three-high to maximize usable ground area. Our larger branches also have a fleet maintenance department to make modifications to the containers and maintain the branch’s forklifts and other equipment. Our smaller branches perform preventative maintenance tasks and outsource major repairs.
Except for the Auckland, New Zealand self-storage, we lease all of our branch locations and Royal Wolf’s corporate and administrative offices in Hornsby, New South Wales. All of our major leased properties have remaining lease terms of up to 14 years and we believe that satisfactory alternative properties can be found in all of our markets, if we do not renew these existing leased properties. Reference is made to “Item 2. Properties” for a more detailed description of our leased facilities.
Customers
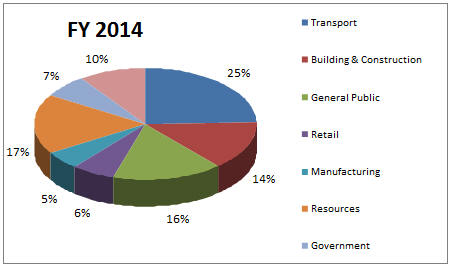
Royal Wolf has a broad base of over 21,000 active customers, with only three customers constituting more than 3% of our annual revenue for FY 2014. Our customer base includes the retail and manufacturing sectors, councils and government departments, the farming and agricultural community, the building and construction industry, clubs and sporting associations, the mining sector and the general public. We believe the disparity of Royal Wolf’s customer base reduces the business exposure to a significant downturn in any particular industry.
Royal Wolf provides its customers a solutions-oriented approach, with high reliability in equipment quality and supply, with prompt and efficient delivery and pick-up, and with superior service and product knowledge. This is supported by a highly responsive national marketing team, in-house finance, and control and engineering expertise and nationally linked fleet management and accounting systems. Royal Wolf is the largest and only truly national supplier of container products in Australia and New Zealand, and the only container company with the scale and capacity to service a full range of customers; from small local accounts right through to the largest national businesses. Royal Wolf’s diverse customer base is depicted in the following chart:
I-7
Table of Contents
Royal Wolf customers use its storage containers for a wide variety of purposes, which include:
| • | Temporary storage of excess inventory for the retail and wholesale industries; |
| • | Offices, workshops or storerooms; |
| • | Portable work camps for the resources industry, including accommodations, ablution and kitchen containers; |
| • | Blast resistant containers for refineries; |
| • | Rapid deployment storage for the military, emergency services and disaster relief; |
| • | Low-cost accommodations for remote communities and caravan parks; and |
| • | Farm storage for cattle feed, farm equipment, fertilizers and other items. |
Sales and Marketing
Royal Wolf’s sales and marketing strategy is designed to reach thousands of potential customers. Communication with potential customers is predominantly generated through a combination of Yellow Pages, internal advertising and SEO (search engine optimization), print media advertising, telemarketing, web-site, customer referrals, signage and decal awareness, direct mail, television and radio. The customer hiring or buying process is being driven by customer awareness of the products combined with price shopping. We believe that while a typical customer may shop a limited number of suppliers, the customer does not spend much time doing so because the potential cost savings is relatively low compared to the value of their time. Our goal is for Royal Wolf to be one of the suppliers that potential customers call and to make the experience as easy as possible for that customer.
Fleet Management
Royal Wolf regularly re-locates containers between its CSCs to meet peaks in regional demand and optimize inventory levels. Royal Wolf has close relationships with the national road and rail hauling companies that enable it to transport the majority of containers interstate at attractive rates.
Royal Wolf’s management information systems are instrumental to its fleet management and targeted marketing efforts. Fleet information is updated daily at the CSC level which provides management with on-line access to utilization, leasing and sale fleet unit levels and revenues by branch or geographic region.
Management Information Systems
Our management information systems, including the RMI and Navision software programs, are scalable and provide us with critical information to manage our business. Utilizing our systems, we track a number of key operating and financial metrics including utilization, lease rates, customer trends and fleet data. All our branches use RMI/Navision and our support office provides financial, inventory and customer reports for branch managers.
I-8
Table of Contents
Employees
As of June 30, 2014, Royal Wolf employed 275 full-time employees in the following major categories:
| Senior and CSC management |
18 | |||
| Corporate staff |
25 | |||
| Sales and marketing |
73 | |||
| CSC operations and administration |
159 | |||
|
|
|
None of our employees is covered by a collective bargaining agreement. We believe our relationship with our employees is good. We have never experienced any material labor disruption, and we are not aware of any efforts or plans to unionize our employees.
NORTH AMERICA
LEASING
Our North American Leasing operations consist of Pac-Van and Lone Star.
Pac-Van leases and sells storage containers, office containers, portable liquid storage tank containers, mobile offices, and modular buildings. Pac-Van started operations in 1993 with two locations and a small fleet of mobile offices and storage trailers serving primarily the construction industry. It now competes in the mobile storage, modular space, and liquid containment industries and provides products and services to a diversified customer base in North America through its network of 31 branch offices in both the United States and Canada. The senior management team has extensive experience in the industry and with Pac-Van.
Mobile storage generally includes providing customers with secure, temporary storage at their site locations. Modular space includes mobile offices and modular buildings and involves the rental and sales of prefabricated, code compliant structures and the delivery and installation of the equipment at customer properties. Liquid containment generally includes providing storage containers to store various liquids in a number of environmental and industrial applications. All of Pac-Van’s products service a broad range of industries, including construction, services, retail, manufacturing, transportation, mining and energy and government.
Lone Star began operations in 2000 in Kermit, Texas. Lone Star leases portable liquid storage tank containers and provides transportation and related site services, including containment products, to its customers in the Permian and Eagle Ford basins of Texas.
Lone Star benefits from favorable industry dynamics including macroeconomic trends that are expected to continue to drive strong demand and future growth for liquid containment equipment rentals in the oil field services industry with a small amount of rental in other sectors. To date, Lone Star has focused on providing tank rental and services to a small group of customers in Texas and has made significant investments in new equipment and support infrastructure to meet the growing needs of its customer base.
Our North American Leasing operations are pursuing a business strategy focused on investing in the container product fleet, growing leasing revenues, completing accretive acquisitions and managing indebtedness, as follows:
Investing in the Container Lease Fleet. Our North American Leasing operations are focusing on expanding the fleet of higher return products, particularly storage, office, portable liquid and specialty containers. Pac-Van specifically expects to drive a portion of its growth from opportunities beyond its traditional products and markets and Lone Star is pursuing growth opportunities in the key energy producing regions across Texas. In addition, as exploration and production companies experience a dramatic increase in the need for fluid management equipment and services, Lone Star also will look to grow its business by using its existing strategic relationships to help expand into other United States oil and gas plays as well as expanded sectors.
Growing Leasing Revenues. Our North American Leasing operations are emphasizing programs and initiatives to grow leasing revenues, not only from container products, but also from its mobile office and modular building fleet. This should generate higher margins as there are limited incremental costs related to leasing our existing product lines with our existing branch offices.
Accretive Acquisitions. As part of our growth strategy, we pursue acquisitions that are accretive and have strong growth potential. These acquisitions, especially “tuck in” acquisitions, potentially allow us to leverage the fixed costs of our branch offices with additional lease fleet that deliver greater scale with better margins.
I-9
Table of Contents
Managing Indebtedness. We expect to continue to focus on monitoring the debt level of our North American Leasing operations while also investing in growing product lines and markets. We believe this emphasis on the capital structure provides flexibility and positions us to capture future growth opportunities. In recovering economic cycles, like the current United States business cycle, we focus on optimizing lease fleet investment, utilization and cash management to achieve this objective.
Industry Overview
We compete in three different, but related, sectors of the portable services industry: mobile storage, modular space and liquid containment.
Mobile Storage Container Market
Mobile Storage is used primarily by businesses for secure, temporary storage at the customer’s location and offers a flexible, secure, cost-effective and convenient alternative to constructing permanent warehouse space or storing items at an off-site facility. A broad range of industries, including construction, industrial, commercial, services, retail and government utilize mobile storage equipment to meet both their short-term and permanent storage needs. Although we are not aware of any published estimates, we believe the mobile storage industry is growing due to an increasing awareness of its convenience and cost benefits. The mobile storage industry is highly fragmented, with numerous participants in local markets leasing and selling storage containers, storage trailers and other storage structures.
We believe that participants in this industry compete on the basis of customer relationships, price, service, and breadth and quality of equipment offered. In every market served, we compete with multiple local, regional and national portable storage providers. Some of our competitors may have greater market share, less indebtedness, greater pricing flexibility or superior marketing and financial resources. Our largest competitors in the storage container and storage trailer markets in the U.S. are Mobile Mini, Williams -Scotsman, McGrath RentCorp, Haulaway, Allied Leasing, Eagle Leasing and National Trailer Storage.
Modular Space Market
Modular Space is used primarily by businesses to address either temporary or permanent space needs. We believe modular space delivers four core benefits compared to permanent buildings or structures: reusability, timely solutions, lower costs, and flexibility. Modular buildings may offer customers significant cost savings over permanent construction and can generally be installed quicker because site work and fabrication can take place concurrently. In addition, modular solutions are not site specific and can be configured in a number of ways to meet multiple needs. Finally, modular buildings are reusable and will generally serve a wide variety of users during their life span. We believe this characteristic can be a key competitive advantage with the emphasis on green building. The Modular Building Institute, in its 2013 Relocatable Buildings Annual Report, estimated that U.S. modular space industry dealers earned in excess of $2.5 billion in leasing and sales revenues in calendar year 2012. The industry has experienced a significant growth trend over the last thirty plus years as the number of applications for modular space has increased and recognition of the product’s positive attributes has grown, although the growth is not always consistent and there have been periods of decline within that period. We believe that we are well-positioned to benefit from any continued long-term growth in the modular space industry.
The modular space industry is highly competitive. We compete on the basis of service, quality, customer relationships and price. We believe that our reputation for customer service and a wide selection of units allow us to compete effectively. However, our largest North American competitors, ModSpace, Williams-Scottsman, Mobile Modular (McGrath RentCorp) and Mobile Mini have greater market share or product availability in some markets, as well as greater financial resources and pricing flexibility. Other regional competitors include M Space, Acton Mobile, Vanguard Modular, Design Space, and Satellite Shelters.
Liquid Containment Market
Customers use portable liquid storage tank containers or “frac tanks” in environmental and industrial applications for storage of hazardous and non-hazardous liquids and semi-solids. The tanks are used by customers mainly in oil and gas exploration and field services as well as a wide variety of other businesses including, refinery, chemical and industrial plant maintenance, environmental remediation and field services, infrastructure building construction, marine services, pipeline construction and maintenance, tank terminal services, wastewater treatment and waste management and landfill services. We believe that the rental industry in the United States for liquid containment equipment generates approximately $1.4 billion of annual rental revenues. While this is a relatively new product line for our North American Leasing operations, we believe we can leverage our branch network, existing relationships and operating philosophies to successfully compete in this industry. Our research indicates that many of the companies currently using containment solutions also use our portable storage and mobile offices products.
I-10
Table of Contents
The liquid containment industry is highly competitive. We compete in this industry based upon product availability, product quality, price, service and reliability. As with the other industries we serve, the competition consists of national, regional and local companies. Some of the non-oilfield services national competitors, notably BakerCorp, Rain For Rent, and Adler Tanks (McGrath RentCorp), have significantly larger tank lease fleet and may have greater financial and marketing resources, more established relationships and greater name recognition in the market than we do. As a result, the competitors with these advantages may be better able to attract customers and provide their products and services at lower rental rates.
In addition, through Lone Star, which offers more robust services than Pac-Van during a hydraulic fracturing process, we compete directly with oilfield services and other companies. Some of the larger competitors, notably Key, Basic, Select, Fodale and Stallion, may have greater financial and marketing resources, more established relationships and greater name recognition in the market than we do. Other regional competitors include Light Tower Rental, TFH, Catalyst, SRS and Roywell. With the tremendous amount of liquids involved in the hydraulic fracturing process, or fracking, there is high demand for portable liquid storage tanks in and around shale plays. Containment is also growing with higher demands for safety and spill prevention. Hydraulic fracturing is the process of using high pressure fluid and materials to create fractures in a shale formation, thereby stimulating oil or natural gas production from both new and existing wells. As many as 200 frac tanks may be needed at each drilling rig site, as large volumes of fluid are used in the various stages of the fracking process. While fracking was first introduced over 60 years ago, new technology and equipment have made this process significantly more economical, fueling a large demand for liquid storage tanks across all shale plays. Oil and gas drilling in North America has experienced significant growth over the past five years.
Business Attributes
Pac-Van
Pac-Van is a recognized provider of modular buildings, mobile offices and container products on a national, regional and local basis in the United States, and believes it possesses the following strengths:
Extensive Geographic Coverage. Pac-Van is a national participant in the mobile storage, modular space and liquid containment sectors. Pac-Van’s branch offices serve 29 of the top 50 largest Metropolitan Statistical Areas, or MSAs, in the United States. With the recent expansion into Alberta, Canada, it is now able to serve the western provinces in Canada. This footprint limits the impact of any negative change in a region or specific market.
Broad Customer Base. Pac-Van has established strong relationships with a diversified customer base in North America ranging from large companies with a national presence to small local businesses. During FY 2014, Pac-Van leased or sold its equipment to approximately 11,300 customers. In FY 2014, Pac-Van’s largest customer accounted for less than 4% of its total revenues and Pac-Van’s top ten customers accounted for approximately 14% of its total revenues. Pac-Van believes that the breadth of its business limits the impact to changes within any given customer or industry.
Sales and Marketing Excellence. Pac-Van has implemented a centralized customer relationship management system that allows it to coordinate its sales and marketing efforts. Through its branch network, Pac-Van develops local market knowledge and strong customer relationships while the corporate based marketing group manages its brand image, web presence and lead generation programs. Pac-Van provides ongoing training to it sales team, monitors call quality and surveys its customers to ensure that customer interactions meet its quality and service standards. All of Pac-Van’s lease fleet carries signage reflecting its brand, which is important to the ongoing name recognition.
Customer Service Focus. Pac-Van’s operating infrastructure is designed to ensure that it consistently meets or exceeds customer expectations. On the national and regional level, Pac-Van’s administrative support services and scalable management information systems enhance its service by enabling Pac-Van to access real-time information on product availability, customer reservations, customer usage history and rates. Pac-Van believes this focus on customer service attracts new and retains existing customers. Based on its FY 2014 customer survey, more than 97% of Pac-Van’s customers would both do business with Pac-Van again and would recommend Pac-Van to others.
High Quality Fleet. Pac-Van’s branch offices maintain their lease fleet to consistent quality standards. Maintenance is expensed as incurred and branch managers and operations staff are responsible for managing a maintenance program aimed at providing equipment to customers that meets or exceed customer expectations and industry standards.
Significant Operating Cash Flows. Pac-Van has consistently generated significant cash flow from operations by maintaining high utilization rates and leasing margins.
I-11
Table of Contents
Discretionary Capital Expenditures. A significant portion of Pac-Van’s capital expenditures are discretionary in nature, thus providing Pac-Van with the flexibility to readily adjust the amount that it spends based on its business needs and prevailing economic conditions.
Experienced Management Team. Pac-Van has an experienced and proven senior management team. Pac-Van’s President, Theodore M. Mourouzis, joined Pac-Van in 1997 and the consistency of the senior management, corporate and branch management teams has been integral in developing and maintaining its high level of customer service, deploying technology to improve operational efficiencies and integrating acquisitions.
Lone Star
Lone Star is a market leader in frac tank rental and related services that operates in the Permian basin of West Texas and the Eagle Ford basin in South Texas and credits its growth to its following strengths:
Commitment to Customer Service. Lone Star’s two branches, sales team expertise, and in-house team of drivers and technicians allows it to be one of the most responsive frac tank rental providers in the industry today. Unlike many competitors that focus primarily on equipment rental, Lone Star is primarily a service provider, bundling its tank rentals with transportation, on-site set-up, and the servicing of equipment 24 hours a day, 7 days a week.
Local Relationships and Long Standing Customer Base. With approximately 30 current customers, Lone Star is a major player in the Texas oil and gas frac tank rental industry. Its customers range from small private independents to global public oil & gas producing companies, all of which are operating within the Permian and Eagle Ford regions. The Lone Star sales team maintains close and long-lasting working relationships with its customers.
Strategically Located Facilities and Optimized Equipment Inventory. The two main Lone Star branches, or facilities, are strategically positioned to be able to respond quickly and to maximize service opportunities to local exploration and production customers.
Experienced Management Team and Highly Trained Employees. Lone Star’s management team has extensive experience in the oil and gas industry and emphasizes safety training and monitoring for all employees.
Products and Services
Our North American Leasing operations provide a broad range of products to meet the needs of its customer base. These products include storage containers, container offices, mobile offices, modular buildings, and portable liquid storage tanks. The following provides a description of our main products:
Storage Containers. Storage containers are steel structures, which are generally eight feet wide and eight and one-half feet high; and are built to ISO standards for carrying ocean cargo. They typically vary in size from 10 feet to 48 feet in length, with 20-foot and 40-foot length containers being the most common. This product line also includes domestic storage containers and storage trailers. Domestic storage containers are generally eight feet wide, nine feet high and come in lengths ranging from 40 to 53 feet. Storage trailers, which vary in size from 28 to 53 feet in length, have wheels and hitches and provide dock height storage.
Office Containers. Office containers, also known as ground level offices, are storage containers that have been modified to include office space. Floor plans can be either all office space or a combination of office and storage space. The office space includes features similar to those found in mobile offices. Like storage storages, container offices typically come in lengths of 20 feet and 40 feet. Due to their construction, they provide greater security than traditional field offices, and since they sit at ground level they don’t require stairs for entry and exit.
Portable Liquid Storage Tank Containers. Portable liquid storage tank containers or “frac tanks” are manufactured steel containers with fixed steel axles and rear wheels for transport designed to hold liquids and semi-solids and can be customized for the many uses in the drilling, fracking and extraction process. While there are a number of different sizes of frac tanks currently used in the marketplace, we are currently focusing on the more common 500-barrel capacity frac tanks. Our products typically include features such as guardrails, safety stairways, multiple entryways and a sloped bottom for easy cleaning, an epoxy lining, and various feed and drain lines. Our frac tanks can be used to hold water or drilling mud. Mud tanks hold both fluids and aggregate, which need to be constantly circulated so that the aggregate does not settle. Acid tanks hold liquids used during the acid stage and have a special internal lining to protect the tank from corrosion. Gas buster tanks are designed with baffles to help safely dissipate any high-pressure gases released through the well during the drilling process. Oil test tanks hold the initial flow from a well to allow for product quality testing. We procure our frac tanks from primarily Southern Frac, but also have an established network of manufacturing partners located throughout the United States.
I-12
Table of Contents
Mobile Offices. Sales and construction offices, also known as field offices and office trailers, are factory built, single-unit structures that are relocatable and used primarily for temporary office space. These units are generally built on frames that are connected to axles and wheels and have either a fixed or removable hitch for easy transportation. Standard field offices come in 8, 10, 12, and 14 foot widths and range in size from approximately 160 to 840 square feet. They include HVAC systems, lighting, electrical wiring, phone jacks, desk tops, shelving and other features normally associated with basic office space. Sales offices typically come in 12 foot widths and provide 350 to 720 square feet. In addition to the basic amenities included in a field office, sales offices generally have wood siding, carpeting, high ceilings, custom windows and glass storefront doors, which provide a professional, customer-friendly building in which to conduct business. All of our mobile offices are built by an established network of manufacturing partners to standard specifications, which may vary depending on regional preferences. In addition, we build these units to meet state building code requirements and generally obtain multi-state codes enabling the company to move equipment among its branch network to meet changing demand and supply conditions.
Modular Buildings. Modular buildings are factory-built portable structures generally consisting of two or more units (or floors) and are used in a wide variety of applications, ranging from schools to restaurants to medical offices. Ranging in size from 1,000 to over 30,000 square feet, modular buildings are constructed in many sizes and are usually designed to satisfy unique customer requirements. Typically we have the individual floors manufactured in such way to allow a number of floors to be connected to one another in a number of different configurations. This provides flexibility beyond the initial application and allows floors to be utilized in a number of different ways. Like mobile offices, we procure modular buildings from an established network of manufacturing partners to meet state building requirements and generally obtain multiple state codes for each unit.
Delivery and Installation, Return and Dismantle, and Other Site Services. Our North American Leasing operations deliver and where necessary install all five product lines directly on customers’ premises.
Ancillary Products and Services. We also provide ancillary products such as steps, ramps, furniture, portable toilets, security systems, shelving, mud pumps, hoses, splitter valves, tee connectors and other items to its customers for their use in connection with its equipment. In addition, a variety of spill prevention and secondary containment products are available to our oil and gas customers to ensure compliance with the EPA’s Spill Prevention, Control and Countermeasure (SPCC) rule/regulations. Containment systems are designed to protect the soil and water sources in and around a drilling site by covering the land with an impermeable plastic that has barrier walls. In the case of a spill, the liquid is then captured within the containment system, thereby preventing danger to the environment.
The following table provides a summary of our North American lease fleet at June 30, 2014 ($ in thousands):
| Number of Units | Gross Costs | |||||||||||||||||||||||||||||||
| Pac-Van | Lone Star | North America | % | Pac-Van | Lone Star | North America | % | |||||||||||||||||||||||||
| Portable Storage |
10,531 | — | 10,531 | 50 | % | $ | 30,673 | $ | — | $ | 30,673 | 13 | % | |||||||||||||||||||
| Container Offices |
1,858 | — | 1,858 | 9 | % | 20,025 | — | 20,025 | 8 | % | ||||||||||||||||||||||
| Mobile Offices |
4,591 | — | 4,591 | 21 | % | 51,809 | — | 51,809 | 22 | % | ||||||||||||||||||||||
| Modular Buildings |
1,005 | — | 1,005 | 5 | % | 40,363 | — | 40,363 | 17 | % | ||||||||||||||||||||||
| Portable Liquid Storage Tanks |
1,453 | 1,781 | 3,234 | 15 | % | 47,956 | 46,199 | 94,155 | 40 | % | ||||||||||||||||||||||
|
|
|
|
|
|
|
|
|
|
|
|
|
|
|
|
|
|||||||||||||||||
| 19,438 | 1,781 | 21,219 | $ | 190,826 | $ | 46,199 | $ | 237,025 | ||||||||||||||||||||||||
|
|
|
|
|
|
|
|
|
|
|
|
|
|||||||||||||||||||||
I-13
Table of Contents
Branch Network
The following map shows our existing North American Leasing branch office network as of June 30, 2014:
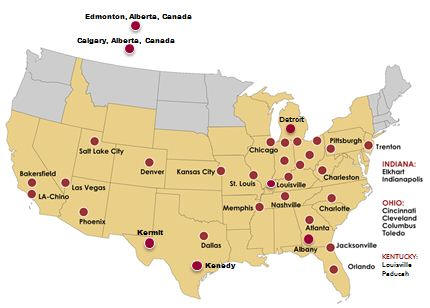
Our North American Leasing operations have 33 locations across the United States and Canada.
Pac-Van’s network of 31 branch offices enables it to maintain product availability and provide customer service within regional and local markets. Customers benefit because they are provided with improved service availability, reduced time to occupancy, better access to sales representatives, the ability to inspect units prior to rental, and lower freight costs. Pac-Van benefits because it is able to spread regional overhead and marketing costs over a larger lease base, redeploy units within its branch network to optimize utilization, discourage potential competitors by providing ample local supply and service local customers in a more cost efficient manner. Branch offices are generally headed by a branch manager with profit responsibility and are organized into four regions, which are managed by four regional vice presidents each with more than 15 years of experience in the portable services industry.
Lone Star operates two branch offices, one in South Texas and one in West Texas as well as a regional administrative office outside of Dallas. These locations allow Lone Star to be near its customers’ drilling sites. Customers benefit from Lone Star’s greater product availability, timely service and lower transportation costs. Locations are managed by a general manager working closely with the organization’s Department of Transportation (DOT) compliance and safety officer. Each location also has a superintendent that oversees the operations and yard foremen, who are responsible for the drivers and mechanics.
Customers
Pac-Van has established strong relationships with a diverse set of customers, ranging from large national retailers and manufacturers to local sole proprietorships. Its diverse product line allows Pac-Van to meet a variety of space needs. Typically, customers use portable storage to store a wide range of materials including construction materials and supplies for customers in the construction sector, inventory for retail customers, and raw materials for industrial companies. Customers in all sectors use Pac-Van’s office and building products in a variety of applications including construction offices, sales offices, work site offices, administrative offices, changing rooms, training facilities, cafeterias, etc. While the mining and energy sector is a heavy user of portable liquid storage tanks, customers in the construction, industrial and commercial sectors use this product line to store groundwater, industrial chemicals and other fluids. During FY 2014, Pac-Van provided its portable storage, container office, mobile office, modular building, and portable liquid storage tank products to a diversified set of approximately 11,300 customers.
Lone Star leases liquid storage tanks primarily to organizations in the oil and gas industry. With approximately 30 current customers, Lone Star is a significant player in the Texas oil and gas frac tank rental industry. Its customers range from small private independents to global public oil and gas producing companies, all of which are operating within the Permian and Eagle Ford regions. Its top ten customers generate over 90% of Lone Star’s annual revenue. These long-standing relationships are typically supported by master service agreements. The Lone Star sales team maintains close and long-lasting working relationships with its customers.
I-14
Table of Contents
North American Leasing’s diverse customer base is depicted in the following chart, which breaks down FY 2014 revenue by industry:
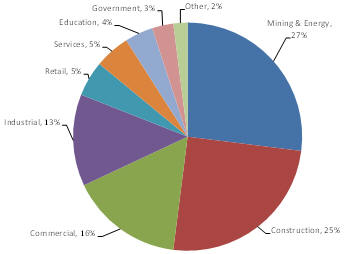
The following table provides an overview of the industries served by our North American Leasing operations:
| Construction | General contractors, residential homebuilders, and subcontractors | |
| Industrial | Industrial and manufacturing customers including a broad array of manufacturers, telecom distribution, refuse, recycling, and bottling companies | |
| Commercial | Business that provide service to both commercial businesses and individual consumers | |
| Mining & Energy | Customers in the extractive industries, including oil and gas exploration and alternative energy companies. | |
| Government | Federal agencies, state and local governments, fire departments, correctional institutions, and the U.S. military | |
| Retail | Large national chains, small local stores, shopping centers, and restaurants | |
| Education | Public schools, private schools, and day care facilities | |
| Services | Health care facilities, veterinary offices, entertainment companies, and religious institutions | |
| Other | All other customers | |
Sales and Marketing
As of June 30, 2014, Pac-Van’s sales and marketing team consisted of 42 employees. The branch managers of its branch offices also play a critical role in Pac-Van’s sales and marketing programs. Members of Pac-Van’s sales group act as its primary customer service representatives and are responsible for fielding calls, obtaining credit applications, quoting prices, following up on quotes and handling orders. The sales team is responsible for developing and managing local relationships, as well as making both inbound and outbound calls. The sales team assists customers define and understand their space needs, assess potential opportunities, quotes deals, close transactions and obtain the necessary documentation. Upon completing a lease or a sale the sales team works closely with the local branch operations team to ensure that Pac-Van is able to meet or exceed customer expectations, relative to equipment quality and delivery timing. Pac-Van’s centralized support services group handles all billing, collections and other support functions, allowing its sales and marketing team to focus on addressing the needs of its customers.
I-15
Table of Contents
Pac-Van’s marketing group is primarily responsible for coordinating direct mail, internet marketing and other advertising campaigns, producing company literature, creating promotional sales tools and oversight of Pac-Van’s customer relationship management system. Pac-Van’s centralized support services group handles all billing, collections and other support functions, allowing its sales and marketing team to focus on addressing the needs of its customers. Pac-Van’s marketing programs emphasize product quality, service capabilities, and the cost-savings and convenience of using its products versus constructing temporary or permanent offices or storage facilities. Pac-Van markets its services through a number of promotional vehicles, including the Internet, Yellow Pages, signage on its equipment, telemarketing, targeted mailings, trade shows and limited advertising in publications.
Pac-Van’s marketing programs are developed by branch managers, regional vice presidents and senior management, all of whom participate in devising branch-by-branch marketing strategies based on fleet availability and forecasted demand. Pac-Van’s branch managers, working with its corporate marketing team, determine the timing, content and target audience of direct mailings, specials and promotional offers, while the corporate office manages the marketing process to ensure the consistency of its message, achieve economies of scale and relieve its local branches of the administrative responsibility of running its marketing programs. Pac-Van believes that its approach to marketing is consistent with the local nature of its business and allows each branch to employ a customized marketing plan that fosters growth within its particular market.
As of June 30, 2014, Lone Star’s sales and marketing team consisted of seven employees. Lone Star’s business is built and maintained primarily through long-term relationships and referrals. As part of its rebranding initiative in April 2014, Lone Star launched a new website. Lone Star employs a signage program on its tanks and trucks to drive brand awareness and to provide contact information for clients or interested prospects.
Revenue Stream
In FY 2014, our North American Leasing operations generated 73% of its revenues from leasing and 27% of its revenues from sales. We prefer to lease our equipment because leasing provides a higher margin and a more predictable and repeatable revenue stream. In FY 2014, more than 80% of Pac-Van’s lease revenues were generated from repeat customers.
Leasing. Leasing revenue is a function of average monthly rental rate, fleet size and utilization. We monitor fleet utilization at each branch and by product line. For FY 2014, average utilization of the Pac-Van lease fleet was approximately 77% on both a gross dollar basis and unit basis and Lone Star’s average utilization for FY 2014 was 87% on a unit basis. While we adjust pricing to respond to local market conditions, management believes that we generally achieve a rental rate equal to or above that of competitors because of the quality of our products and high level of customer service. Pac-Van’s largest leasing customer accounted for approximately 3% of its total leasing revenues and its top ten customers accounted for approximately 14% of its total leasing revenues. Lone Star’s largest leasing customer accounted for approximately 21% of its total leasing revenues and its top ten customers accounted for over 90% of its total leasing revenues.
Leasing Services. Our North American Leasing operations provide a full set of services from inception through return. These generally include delivery and installation, ancillary products, and tear down and return freight. Revenue associated with these leasing services is recognized when incurred. Delivery and installation and other services provided at lease inception (generally referred to as “front-end” services) are recognized at the beginning of the lease. Tear down and dismantle and other service necessary to bring the units back to a branch (generally referred to as “back end” services) are recognized upon termination of the lease. Ancillary products such as steps, ramps, furniture, portable toilets, shelving, hoses, pumps, splitter valves and tees, etc are generally recognized throughout the life of the lease as part of the recurring billing cycle.
Sales. We complement our core leasing business by selling either existing rental fleet assets or assets purchased specifically for resale. In FY 2014, management estimates that nearly 30% of Pac-Van’s sales came from existing fleet units. The sale of lease fleet units has historically been a cost-effective method of replenishing and upgrading the lease fleet. As with the leasing business, we provide additional services when selling units. These services range from delivery to full scale turnkey solutions. In a turnkey solution, we provide not only the underlying equipment but also a full range of project related services, which may include foundation, specialty interior finishes, and landscaping, necessary to make the equipment fully operational for the customer.
I-16
Table of Contents
Product Procurement and Capital Expenditures
Our North American Leasing operations closely monitor fleet capital expenditures, which include fleet purchases and any capitalized improvements to existing units. We purchase our lease fleet from a network of third-party suppliers. Pac-Van’s top three suppliers of units for FY 2014 represented approximately 42% of all fleet purchases and the top ten suppliers represented approximately 70% of all fleet purchases. Lone Star has purchased its tank fleet from several manufacturers but expects Southern Frac to be its primary supplier of frac tanks going forward. Lone Star purchases its other containment solutions, pumps and hoses from a network of other manufacturing providers.
Capital investments are adjusted to match business needs and to respond to changing economic conditions. We do not generally enter into long-term purchase contracts with manufacturers and so we can modify our capital investment activities to corresponding market conditions. Our North American Leasing operations supplement fleet spending with acquisitions. Although the timing and amount of acquisitions are difficult to predict, management considers its acquisition strategy to be opportunistic and attempts to adjust its fleet spending patterns as favorable acquisition opportunities become available.
Fleet Maintenance
Ongoing maintenance to our North American Leasing fleet is performed on an as-needed basis and is intended to maintain the value and rental-ready condition of our units. We use both in-house fleet technicians and third-party vendors to perform maintenance, depending on the branch and complexity of the work. Maintenance requirements on containers are generally minor and include removing rust and dents, patching small holes, repairing floors, painting and replacing seals around the doors. Maintenance requirements for container offices, mobile offices, and modular buildings tend to be more significant than for storage equipment and may involve repairs of floors, doors, air conditioning units, windows, roofs, and electric wiring. Portable liquid storage tanks require simple maintenance, including cleaning the unit to eliminate any residual material and inspecting the lining. Whether performed by us or a third party, the cost of maintenance and repair of our lease fleet is included as direct costs of leasing operations and is expensed as incurred. We believe our maintenance program ensures a high quality fleet that supports both leasing and sales operations.
Management Information Systems
Our North American Leasing management information systems are instrumental in its lease fleet management and targeted marketing efforts, which allow management to monitor operations at branches on a daily, weekly, monthly, and ad hoc basis. Lease fleet information is updated daily at the branch level and verified through routine physical inventories by branch personnel, providing management with online access to utilization, lease fleet unit detail and rental revenues by branch and geographic region. In addition, an electronic file for each unit showing its lease history and current location and status is maintained in the information system. Branch salespeople utilize the system to obtain information regarding unit condition and availability. The database tracks individual units by serial number and provides comprehensive information including cost, condition and other financial and unit specific information.
Employees
As of June 30, 2014, our North American Leasing operations had 400 employees. None of our employees are covered by a collective bargaining agreement and management believes its relationship with employees is good. We have never experienced any material labor disruption and are unaware of any efforts or plan to organize our employees. The employee groups are as follows:
| North American Leasing Employees | ||||||||||||
| Pac-Van | Lone Star | Total | ||||||||||
| Senior and branch management |
32 | 12 | 44 | |||||||||
| Corporate staff |
29 | 2 | 31 | |||||||||
| Sales and marketing |
42 | 7 | 49 | |||||||||
| Branch operations and administration |
142 | 134 | 276 | |||||||||
|
|
|
|
|
|
|
|||||||
| 245 | 155 | 400 | ||||||||||
|
|
|
|
|
|
|
|||||||
MANUFACTURING
We, through GFNMC, acquired 90% of the membership interests of Southern Frac on October 1, 2012. Southern Frac manufactures portable liquid storage containers in Waxahachie, Texas for primarily oil and gas exploration, but it can also manufacture for, among others, the chemical and industrial, environmental remediation, waste water treatment and waste management sectors. In FY 2014, Southern Frac had total revenues from third parties of $19.6 million representing 568 units.
I-17
Table of Contents
Also in FY 2014, Southern Frac sold 830 units ($28.6 million of intercompany revenues) to our North American Leasing operations and we believe that it will continue to manufacture a steady supply of portable liquid storage containers for, as well as generate leasing referrals to, our North American Leasing operations.
Management Information Systems
We commenced implementation of Southern Frac’s manufacturing enterprise resource planning (ERP) business system, SyteLine, during FY 2013 and full implementation was completed in FY 2014. SyteLine provides comprehensive functionality to manage our business processes, including order processing; inventory, purchasing; planning and scheduling, production, cost management, project tracking, accounting; and customer service. We believe the SyteLine ERP system was operating satisfactorily during its implementation to enable Southern Frac to manage its business in both FY 2013 and FY 2014.
Employees
As of June 30, 2014, Southern Frac had 222 employees (consisting of 13 supervisory and administrative and 209 manufacturing, or shop, personnel). None of our employees are covered by a collective bargaining agreement and management believes its relationship with employees is good. We have not experienced any material labor disruption and are unaware of any efforts or plan to organize our employees.
In addition, at June 30, 2014, GFN corporate had five full-time employees.
Total employees in North America totaled 627 at June 30, 2014.
Trademarks
General Finance Corporation entered into a licensing agreement with Triton Corporation in May 2008 for the use of the “Royal Wolf” name and trademark in connection with its retail sales and leasing of intermodal cargo containers and other container applications in the domestic storage market within Australia and New Zealand and surrounding islands in the Pacific Islands region. We paid Triton Corporation $740,000 to license the trademark. The license will continue in perpetuity as long as Royal Wolf continues to use the “Royal Wolf” name and trademark as the exclusive name for its business and mark for its products, subject to the termination provisions of the license. The license may be terminated by the licensor upon 30 days notice in the event Royal Wolf breaches its obligations under the license and will terminate automatically if Royal Wolf becomes insolvent or ceases to sell products under the trademark for a continuous period of 30 months. GFN sold the “Royal Wolf” name and trademark to Royal Wolf in May 2011 in connection with the Australian IPO of RWH. There are no claims pending against Royal Wolf challenging its right to use the “Royal Wolf” name and trade mark within Royal Wolf’s region of business.
Our North American Leasing operations own a number of trademarks important to its business, including Pac-Van® and “We’ve Put Thousands of U.S. Businesses In Space.” We have also applied for and are awaiting final confirmation on “Expect More. We’ll Deliver” and “Container King”. Material trademarks are registered in the U.S. Patent and Trademark Office. Registrations for such trademarks in the United States will last indefinitely as long as we continue to use and maintain the trademarks and renew filings with the applicable governmental offices.
Available information
Our Internet website address is www.generalfinance.com. This reference to our Internet website does not incorporate by reference the information contained on or hyperlinked from our Internet website into this Annual Report on Form 10-K. Such information should not be considered part of this Annual Report on Form 10-K. The Internet websites for Royal Wolf, Pac-Van, Lone Star and Southern Frac are www.royalwolf.com.au, www.PacVan.com, www.lonestartank.com and www.southernfrac.com, respectively. The noncontrolling interest of the capital stock of Royal Wolf that we do not own is traded on the Australian Securities Exchange (“ASX”) under the symbol “RWH.”
We are required to file Annual Reports on Form 10-K and Quarterly Reports on Form 10-Q with the Securities and Exchange Commission (“SEC”) on a regular basis, and are required to disclose certain material events in a current report on Form 8-K. The public may read and obtain a copy of any materials we file with the SEC through our Internet website noted above, which is hyperlinked to the SEC’s Internet website that contains reports, proxy and information statements and other information regarding issuers that file electronically with the SEC. The SEC’s Internet website is located at http://www.sec.gov.
I-18
Table of Contents
Executive Officers of the Registrant
The following information is provided as of June 30, 2014 regarding our executive officers who are not a continuing director or a director nominee. Information concerning our chief executive officer, who is a continuing director or a director nominee, is set forth in “PART III—Item 10. Directors, Executive Officers and Corporate Governance” of this Annual Report on Form 10-K, which incorporates by reference to our definitive Proxy Statement for the 2014 Annual Meeting of Stockholders, to be filed with the Securities and Exchange Commission pursuant to Regulation 14A of the Securities Exchange Act of 1934.
No family relationship exists between any executive officer.
| Name | Age | Position | ||||
| Charles E. Barrantes |
62 | Executive Vice President and Chief Financial Officer | ||||
| Christopher A. Wilson |
47 | General Counsel, Vice President and Secretary | ||||
| Jeffrey A. Kluckman |
53 | Executive Vice President, Business Development | ||||
| Robert Allan |
58 | Chief Executive Officer of Royal Wolf | ||||
| Theodore Mourouzis |
51 | President and Chief Operating Officer of Pac-Van, Inc. | ||||
Charles E. Barrantes has served as our Executive Vice President and Chief Financial Officer since September 2006. Prior to joining us, Mr. Barrantes was Vice President and Chief Financial Officer for Royce Medical Company from early 2005 to its sale in late 2005. From 1999 to early 2005, he was Chief Financial Officer of Earl Scheib, Inc., a public company that operated over 100 retail paint and body shops. Mr. Barrantes has over 35 years of experience in accounting and finance, starting with more than a decade with Arthur Andersen & Co.
Christopher A. Wilson has served as our General Counsel, Vice President and Secretary since December 2007. Prior to joining us, Mr. Wilson was the general counsel and assistant secretary of Mobile Services Group, Inc. from February 2002 to December 2007. Mr. Wilson practiced corporate law as an associate at Paul, Hastings, Janofsky & Walker LLP from 1998 to February 2002. Mr. Wilson graduated with a B.A. from Duke University in 1989 and a J.D. from Loyola Law School of Los Angeles in 1993.
Jeffrey A. Kluckman became our Executive Vice President, Business Development in September 2011. Prior to joining us, among other things, he held the role of vice president of mergers and acquisitions for portable storage solutions provider Mobile Mini, Inc. (NASDAQ: MINI) and, earlier, similar positions with Mobile Storage Group, Inc., which was acquired by Mobile Mini in 2008, and RSC Equipment Rental, Inc. (NYSE: RRR). In his over 15-year background in the rental services sector, including the mobile storage, modular space and equipment rental industries, Mr. Kluckman successfully completed more than 110 transactions. Mr. Kluckman received an accounting degree from Northern Illinois University.
Robert Allan has served as the Chief Executive Officer of Royal Wolf since February 2006. Mr. Allan joined Royal Wolf in April 2004 as its Executive General Manager. From 2000 until joining Royal Wolf, he served as Group General Manager of IPS Logistics Pty Ltd, a shipping and logistics company. From 1997 until 2000, Mr. Allan was employed as a Regional Director of Triton Container International, the world’s largest lessor of marine cargo containers to the international shipping industry. Mr. Allan has more than 33 years of experience in the container leasing and logistics industries.
Theodore Mourouzis has served as the President of Pac-Van, Inc. since August 2006. He previously served as its Chief Operating Officer since 1999 and as its Vice President of Finance from 1997 until 1999. Prior to his employment with Pac-Van, Mr. Mourouzis, among other things, was a controller for a 3M joint venture, served four years in management consulting with Deloitte & Touche (focusing in operations and business process consulting), and was president of a picture framing distributor and the chief financial officer of its holding company. He received his undergraduate degree from Stanford University (in 1985) and a Masters of Business Administration from The Wharton School of the University of Pennsylvania (in 1991).
I-19
Table of Contents
In addition to the other information in our Annual Report on Form 10-K, you should consider the risks described below that we believe may be material to investors in evaluating us. This section contains forward-looking statements, and in considering these statements, you should refer to the qualifications and limitations on our forward-looking statements that are described in SAFE HARBOR STATEMENT before the beginning of Item 1.
Global economic conditions and market disruptions may adversely affect our business, financial condition and results of operations.
There continues to be global economic uncertainty. These uncertain economic conditions in the markets where we operate, and other events or factors that adversely affect demand in the portable services industry, could adversely affect our business. Worsening conditions could adversely affect, among other things, the collection of our trade receivables on a timely basis, resulting in additional reserves for uncollectible accounts; and, in the event of continued contraction in container and modular unit sales and leasing, could lead to a build-up of inventory and lease fleet levels. These factors would have a further adverse impact on operating results and cash flows.
We operate with a significant amount of indebtedness, which is secured by all or substantially all of our assets, subject to variable interest rates and contains restrictive covenants.
Our substantial indebtedness could have adverse consequences, such as:
| • | require us to dedicate a substantial portion of our cash flow from operations to payments on our indebtedness, which could reduce the availability of our cash flow to fund future operating capital, capital expenditures, acquisitions and other general corporate purposes; |
| • | expose us to the risk of increased interest rates, as our borrowings on our secured senior credit facilities are at variable rates of interest; |
| • | require us to sell assets to reduce indebtedness or influence our decisions about whether to do so; |
| • | increase our vulnerability to general adverse economic and industry conditions; |
| • | limit our flexibility in planning for, or reacting to, changes in our business and our industry; |
| • | restrict us from making strategic acquisitions or pursuing business opportunities; |
| • | limit, along with the financial and other restrictive covenants in our indebtedness, among other things, our ability to borrow additional funds; and |
| • | violating covenants in these agreements could have a material adverse effect on our business, financial condition and results of operations; including substantially increasing our cost of borrowing and restricting our future operations, if not cured or waived. In addition, the lenders may be able to terminate any commitments they had made to supply us with further funds. Accordingly, we may not be able to fully repay our debt obligations, if some or all of our debt obligations are accelerated upon an event of default. |
Our senior credit agreements also contain various restrictive covenants that limit the operations of our business. In particular, these agreements include covenants and restrictions relating to:
| • | payments and distributions to GFN; |
| • | liens and sale-leaseback transactions; |
| • | loans and investments; |
| • | debt and hedging arrangements; |
| • | mergers, acquisitions and asset sales; |
| • | transactions with affiliates; and |
| • | changes in business activities. |
In addition, we may incur substantial debt to complete business combinations. The incurrence of debt could result in:
| • | default and foreclosure on our assets if our operating revenues after a business combination are insufficient to repay our debt obligations; |
| • | our immediate payment of all principal and accrued interest, if any, if the debt security is payable on demand; and |
| • | our inability to obtain necessary additional financing if the debt security instrument covenants restricting our ability to obtain such financing while the debt instrument is outstanding. |
I-20
Table of Contents
While we believe we will remain in compliance with covenants in the foreseeable future and that our relationships with our senior lenders are good, there is no assurance our lenders would consent to an amendment or waiver in the event of noncompliance; or that such consent would not be conditioned upon the receipt of a cash payment, revised principal payout terms, increased interest rates or restrictions in the expansion of the credit facilities for the foreseeable future; or that our senior lenders would not exercise rights that would be available to them, including, among other things, demanding payment of outstanding borrowings. In addition, our ability to obtain additional capital or alternative borrowing arrangements at reasonable rates may be adversely affected. All or any of these adverse events would further limit our flexibility in planning for or reacting to downturns in our business.
See also significant risks related primarily to our 9.00% Series C Cumulative Redeemable Perpetual Preferred Stock (the “Series C Preferred Shares” or “Series C Preferred Stock”) and our 8.125% Senior Notes Due 2021 (the “Senior Notes”). In addition, reference is made to Note 5 of Notes to Consolidated Financial Statements for more information regarding our indebtedness.
We may need additional capital which we may be unable to obtain.
Our business is capital intensive and any inability to obtain capital in the amounts and at the times when needed, may have a material adverse affect on our business, financial condition and results of operations, including substantially increasing our cost of borrowing and restricting our future operations and impairing our ability to grow, improve and maintain our leased assets. We have a significant amount of our outstanding senior indebtedness maturing in the foreseeable future. We may not have sufficient cash flow from our operations to repay amounts coming due. If we are unable to refinance this indebtedness, it could have a material adverse effect on our business.
We are subject to fluctuations in the rates of exchanges in the translation of our foreign operations into the U.S dollar for financial reporting purposes.
Fluctuations in the rates of exchange for the U.S. dollar against the Australian, New Zealand and Canadian dollars could significantly affect our results of operations through lower than anticipated reported revenues and profitability as a result of the translation of our foreign operations’ financial results into U.S. dollars.
A write-off of all or a part of our goodwill and intangibles would hurt our operating results and reduce our stockholders’ equity.
As a result of our acquisitions, we have recorded significant amounts of goodwill and intangible assets. Goodwill represents the excess of the total purchase price of these acquisitions over the fair value of the net assets acquired. We are not permitted to amortize goodwill under U.S. accounting standards and instead we review goodwill, as well as intangible assets, for impairment. Impairment may result from, among other things, deterioration in the performance of acquired businesses, adverse market conditions and adverse changes in applicable laws or regulations, including changes that restrict the activities of the acquired business. In the event impairment is identified, a charge to earnings would be recorded. Although it does not affect our cash flow, a write-off of all or a part of our goodwill or intangibles would adversely affect our operating results and stockholders’ equity.
Reference is made to Note 2 of Notes to Consolidated Financial Statements for more information regarding goodwill and intangible assets.
Future acquisitions of businesses could subject us to additional business, operating and industry risks, the impact of which cannot presently be evaluated, and could adversely impact our capital structure.
We intend to pursue acquisition opportunities in an effort to diversify our investments and grow our business. Any business we acquire may cause us to be affected by numerous risks inherent in the acquired business’ operations. If we acquire a business in an industry characterized by a high level of risk, we may be affected by the currently unascertainable risks of that industry. Although we will endeavor to evaluate the risks inherent in a particular industry or target business, we cannot assure that we will be able to properly ascertain or assess all of the significant risk factors.
In addition, the financing of any acquisition we complete could adversely impact our capital structure as any such financing would likely include the issuance of additional equity securities and/or the borrowing of additional funds. The issuance of additional equity securities may significantly reduce the equity interest of our stockholders and/or adversely affect prevailing market prices for our common stock. Increasing our indebtedness could increase the risk of a default that would entitle the holder to declare all of such indebtedness due and payable and/or to seize any collateral securing the indebtedness. In addition, default under one debt instrument could in turn permit lenders under other debt instruments to declare borrowings outstanding under those other instruments to be due and payable pursuant to cross default clauses. Accordingly, the financing of future acquisitions could adversely impact our capital structure.
I-21
Table of Contents
In addition, integrating acquired businesses and assets into our business can be difficult and risky, especially if the acquired business or assets involve an industry segment with which our management has limited experience or where there are limited synergies with our current businesses. Our integration of acquired businesses and realization of all synergies or efficiencies that we believe may result from such acquisitions may not come into fruition, which could negatively impact our business.
Reference is made to Note 4 of Notes to Consolidated Financial Statements for more information regarding acquisitions.
While part of our long-term business strategy is to acquire additional businesses, there is no assurance that we will be able to identify businesses that we can acquire upon terms we believe acceptable, or if such acquisitions require additional financing, that we could obtain such additional financing.
We cannot ascertain the availability of businesses to acquire, nor the capital requirements for future transactions. We cannot assure that, if required, additional financing will be available on acceptable terms, if at all. To the extent that additional financing proves to be unavailable when needed to consummate a particular acquisition, we would be compelled to either restructure the transaction or abandon that particular acquisition. In addition, if we consummate a future acquisition, we may require additional financing to fund the operations or growth of the target business. The failure to secure additional financing may impact the continued development or growth of the target business.
Our long-term growth plan includes the expansion of operations into markets outside of North America and the Asia-Pacific area. Such international expansion may not prove successful, and may divert significant capital, resources and management’s time and attention and adversely affect our on-going operations.
To date, we have conducted all of our business within North America and the Asia-Pacific area. However, we have intentions in the future to enter international markets, including possibly South America and the European markets, which will require substantial amounts of management time and attention. Our products and overall marketing approach may not be accepted in other markets to the extent needed to make our international expansion profitable. In addition, the additional demands on management from these activities may detract from our efforts in our current markets and adversely affect our operating results therein. Any international expansion will expose us to the risks normally associated with conducting international business operations, including unexpected changes in regulatory requirements, changes in foreign legislation, possible foreign currency controls, currency exchange rate fluctuations or devaluations, tariffs, difficulties in staffing and managing foreign operations, difficulties in obtaining and managing vendors and distributors, potential negative tax consequences and difficulties collecting accounts receivable.
Our long-term growth could strain our management resources.
Our future performance will depend in large part on our ability to manage our long-term planned growth that could strain our existing management, human and other resources. To successfully manage this growth, we must continue to add managers and employees and improve our operating, financial and other internal procedures and controls. We also must effectively motivate, train and manage employees. If we do not manage our growth effectively, it would adversely affect our future operating results.
Failure to retain key executives could adversely affect our operations and could impede our ability to execute our business plan and growth strategy.
Our growth strategies, operational guidance, capital allocation and capital markets support are managed largely by four existing officers, including our President, Chief Executive Officer and Chairman of the Board, Ronald F. Valenta. The continued success of our businesses will depend largely on the efforts and abilities of Mr. Valenta and these corporate executives. These officers, particularly Mr. Valenta, have an understanding of our businesses that cannot be readily duplicated. The loss of any member of our corporate senior management team, especially Mr. Valenta, could impair our ability to execute our business plan and growth strategy and could have a material adverse affect on our operating results.
We may issue shares of our capital stock that would reduce the equity interest of our stockholders and could cause a change in control of our ownership.
We may seek to finance future transactions, including business combinations, or improve our financial position by issuing additional shares of our common stock and/or preferred stock. The issuance of any number of shares of our common stock or of our preferred stock:
| • | may significantly reduce the equity interest of investors; |
| • | may subordinate the rights of holders of common stock if preferred stock is issued with rights senior to those afforded to our common stock; |
I-22
Table of Contents
| • | may cause a change in control if a substantial number of our shares of common stock are issued, which may affect, among other things, our ability to use our net operating loss carry forwards, if any, and could result in the resignation or removal of our present officers and directors; and |
| • | may adversely affect prevailing market prices for our common stock. |
We are subject to laws and governmental regulations and actions that affect our operating results and financial condition.
Our business is subject to regulation and taxation under a wide variety of foreign and U.S. federal, state and local laws, regulations and policies including those imposed by the Securities and Exchange Commission, the Internal Revenue Service, the Sarbanes-Oxley Act of 2002, the Dodd-Frank Wall Street Reform and NASDAQ, as well as applicable labor laws. Although we have policies and procedures designed to comply with applicable laws and regulations, failure to comply with the various laws and regulations may result in civil and criminal liability, fines and penalties, increased costs of compliance, additional taxation and restatement of our financial statements.
There can also be no assurance that, in response to current economic conditions or the current political environment or otherwise, laws and regulations will not be implemented or changed in ways that adversely affect our operating results and financial condition, such as recently adopted legislation that expands health care coverage costs, or facilitates union activity or federal legislative proposals to otherwise increase taxation and operating costs.
We are exposed to various possible claims relating to our business and our insurance may not fully protect us.
We are exposed to various possible claims relating to our business. These possible claims include those relating to: (i) personal injury or death caused by container products, mobile offices or modular units leased or sold by us; (ii) accidents involving our vehicles and our employees; (iii) employment-related claims; (iv) property damage; (v) commercial claims and (vi) environmental contamination. We believe that we have adequate insurance coverage for the protection of our assets and operations. However, our insurance may not fully protect us for certain types of claims, such as claims for punitive damages or for damages arising from intentional misconduct, which are often alleged in third party lawsuits.
In addition, we may be exposed to uninsured liability at levels in excess of our policy limits. If we are found liable for any significant claims that are not covered by insurance, our liquidity and operating results could be materially adversely affected. It is possible that our insurance carrier may disclaim coverage for any class action and derivative lawsuits against us. It is also possible that some or all of the insurance that is currently available to us will not be available in the future on economically reasonable terms or not available at all. In addition, whether we are covered by insurance or not, certain claims may have the potential for negative publicity surrounding such claims, which may adversely impact our operating results, value of our public securities, or give rise to additional similar claims being filed.
Disruptions in our information technology systems could limit our ability to effectively monitor and control our operations and adversely affect our operations.
Our information technology systems facilitate our ability to monitor and control our operations and adjust to changing market conditions. Any disruption in our information technology systems or the failure of these systems to operate as expected could, depending on the magnitude of the problem, adversely affect our operating results by limiting our capacity to effectively transact business, monitor and control our operations and adjust to changing market conditions in a timely manner.
The delay or failure to implement information system upgrades and new systems effectively could disrupt our business, distract management’s focus and attention from our business operations and growth initiatives, and increase our implementation and operating costs, any of which could negatively impact our operations and operating results.
The price of our common stock may fluctuate significantly, which may make it difficult for stockholders to resell common stock when they want or at a price they find attractive.
We expect that the market price of our common stock will fluctuate. Our common stock price can fluctuate as a result of a variety of factors, many of which are beyond our control. These factors include:
| • | actual or anticipated variations in our quarterly operating results; |
| • | changes in interest rates and other general economic conditions; |
| • | significant acquisitions or business combinations, strategic partnerships, joint ventures or capital commitments by or involving us or our competitors; |
| • | operating and stock price performance of other companies that investors deem comparable to us; |
| • | news reports relating to trends, concerns, litigation, regulatory changes and other issues in our industry; |
I-23
Table of Contents
| • | geopolitical conditions such as acts or threats of terrorism or military conflicts; |
| • | relatively low trading volume; and |
| • | significant concentration of ownership in our common stock. |
If equity research analysts do not publish research or reports about our business or if they issue unfavorable commentary or downgrade our common stock, the price of our common stock could decline.
The trading market for our common stock will rely in part on the research and reports that equity research analysts publish about us and our business. We do not control these analysts. The price of our stock could decline if one or more equity analysts downgrade our stock or if those analysts issue other unfavorable commentary or cease publishing reports about us or our business.
We do not currently intend to pay dividends on our common stock, which may limit the return on your investment in us.
Except for payment of dividends on our preferred stock and on the capital stock of Royal Wolf, we intend to retain all available funds and any future earnings for use in the operation and expansion of our business and do not anticipate paying any cash dividends on our common stock in the foreseeable future.
Unionization by some or all of our employees could cause increases in operating costs.
Our employees are not presently covered by collective bargaining agreements. Unions may attempt to organize our employees in the future. We are unable to predict the outcome of any continuing or future efforts to organize our employees, the terms of any future labor agreements, or the effect, if any, those agreements might have on our operations or financial performance.
Significant Risks Related Primarily to Our Operations in the Asia-Pacific Area at Royal Wolf
The future performance of Royal Wolf depends on customer demand for portable container solutions as well as the expansion of the portable container solutions products market in Australia.
Any reduction in customer demand, failure of customer demand to grow, or failure of Royal Wolf to meet changes in customer demand or preferences may adversely affect Royal Wolf’s businesses, operational performance, growth prospects and financial position. For example, if expected growth in the portable container buildings market fails to come to fruition, or if businesses and individuals no longer demand portable container buildings at current levels, Royal Wolf’s return on its portable container building investments could be negatively impacted. The demand for Royal Wolf’s assets is dependent on the key industry segments into which Royal Wolf sells and lease assets, such as resources, construction, manufacturing and retail. A significant reduction in the business climate in these industry segments, could negatively impact Royal Wolf’s results of operations.
The success and ability to drive future growth is dependent to a large extent on brand reputation.
Royal Wolf believes its brand reputation is a key driver in its success and its ability to drive future growth. Any adverse change to the reputation of Royal Wolf may adversely affect the Company’s businesses, operational performance and financial condition. Royal Wolf owns the trademark and license for the name “Royal Wolf” in Australia, New Zealand and surrounding islands in the Asia-Pacific region. There is a risk that use of the “Royal Wolf” brand by third parties in jurisdictions in which Royal Wolf does not own the trademark may adversely impact the Royal Wolf brand and consequently its business.
Royal Wolf’s ability to achieve its long-term business strategy is dependent to a certain extent on its supply chain and purchasing.
Royal Wolf’s long-term business strategy assumes a certain level of growth in Australian and New Zealand demand for container based solutions. Royal Wolf’s ability to meet this demand is dependent, to a certain extent, on the ability of Royal Wolf to purchase storage containers economically and on an on-time basis. Historically, Royal Wolf has successfully worked with shipping lines and international container leasing companies to purchase used containers, and with manufacturers and brokers, including in China, to purchase new containers, but there can be no guarantee of this in the future. Changes to shipping line practices with respect to used containers, and adverse changes in trade practices, regulations and relations between Australia and its trading partners, including China, could adversely impact Royal Wolf’s ability to purchase containers or impact the price at which Royal Wolf is able to purchase containers.
I-24
Table of Contents
Historically, Royal Wolf has relied on internal supply chain and sourcing arrangements, international suppliers and the logistics industry to relocate containers. Changes to these arrangements, constraints on the supply chain, failure of suppliers to deliver or deliver in a timely manner, or material increases in the price of new or used containers could have an adverse impact on Royal Wolf’s business, operational performance, profit margins and financial results. Royal Wolf purchases new storage container products under purchase orders issued to container manufacturers, which the manufacturers may or may not accept or be able to fill. There are several alternative sources of supply for storage containers. Though Royal Wolf is not dependent upon any one manufacturer in purchasing storage container products, the failure of one or more of its suppliers to timely deliver containers to Royal Wolf could adversely affect its operations. If these suppliers do not timely fill Royal Wolf’s purchase orders or do not properly manufacture the ordered products, Royal Wolf’s reputation and financial condition also could be harmed.
Royal Wolf’s expansion plans involve an element of risk and could strain management resources.
Royal Wolf intends to pursue a growth strategy involving organic and non-organic growth. There is a no guarantee that such growth will occur or be successful. Royal Wolf may incur significant capital expenditure in connection with expansion plans that may not be realized or may not deliver the earnings that are expected. In addition, Royal Wolf’s expansion plans may, in the future, give rise to risks or problems, including the diversion of management’s attention and resources, which may have a materially adverse impact on the performance of Royal Wolf. Limitations on Royal Wolf’s growth and expansion, or materially adverse changes arising from expansion plans, may affect the operating and financial performance of Royal Wolf.
Failure to retain key personnel could adversely affect Royal Wolf’s operations and could impede our ability to execute our business plan and growth strategy.
Royal Wolf is managed largely by its existing officers, including Robert Allan, its Chief Executive Officer. The continued success of Royal Wolf will depend largely on the efforts and abilities of these executive officers and certain other key employees. The members of the senior management team of Royal Wolf have substantial experience in the equipment leasing industry. These key employees have knowledge and an understanding of Royal Wolf and its industry that cannot be readily duplicated. Mr. Allan has an employment agreement which is terminable under certain circumstances upon notice to or by him. However, we do not have key-man insurance on any of these key personnel. The loss of Mr. Allan or any member of Royal Wolf’s senior management team could impair our ability to execute our business plan and growth strategy, cause a loss of customers, reduce revenues and adversely affect employee morale.
Royal Wolf conducts its business in a highly competitive sector.
Royal Wolf’s faces competition in the portable buildings, freight and portable storage markets. Royal Wolf also faces potentially significant competition from modular industry companies who have non-container portable building offerings, especially from several national competitors in Australia who have greater financial resources and pricing flexibility than Royal Wolf. As a result, Royal Wolf is subject to potential competition from new domestic and foreign competitors and the provision of new products or services, aggressive pricing and lease rates offered by existing competitors. Competition varies by region and Royal Wolf may not always be able to match its competitors in service levels, functionality and price in each or all regions. The emergence of a new competitor with international reach, or increased focus on the rental model by existing competitors, particularly with an extensive distribution network, could have an adverse effect on Royal Wolf’s business, financial condition, results of operations and growth prospects. Also, continued service improvement by competitors may result in Royal Wolf’s customers using substitutes in place of some of Royal Wolf’s products. Royal Wolf may not always be able to match its competitors in both functionality and price, which could negatively impact Royal Wolf’s revenues. In addition, some of Royal Wolf’s unique products are the subject of patent applications only and there is no guarantee that those applications will become effective. If the patent applications do not become effective, there is a risk that Royal Wolf’s competitors could produce similar rival products, which may have an adverse effect on Royal Wolf.
Royal Wolf is subject to foreign exchange rate fluctuations.
Royal Wolf is subject to exchange rate fluctuations, particularly as it sources a substantial portion of its portable container solutions fleet from China in purchases, which are U.S. dollar-denominated. While Royal Wolf has a hedging policy to mitigate this risk, unhedged exchange rate fluctuations in the Australian dollar relative to the U.S. dollar and, to a lesser extent, the New Zealand dollar, may adversely affect the financial performance of Royal Wolf, including its financial position, cash flows, distributions, growth prospects, and share price.
I-25
Table of Contents
Royal Wolf is subject to Australian and New Zealand taxation and tariff regulation.
Significant recent reforms and current proposals for further reforms to tax laws in the jurisdictions within which Royal Wolf operates may give rise to uncertainty. The precise scope and impact of future changes to tax laws may not be known. Royal Wolf is also subject to import tariffs with respect to the portable container products it sources from overseas. Any changes to such tax or tariff laws (including the imposition of, or increases to, such taxes or tariffs), their interpretation or the manner in which they are administered by the relevant government agency or the current rate of company income tax or import tariff may impact the operational or financial performance of Royal Wolf (or customers in its key end markets).
Royal Wolf may face a tightening labor force and is subject to Workplace Health and Safety regulations.
Royal Wolf’s ability to remain productive, profitable and competitive and to effect its planned growth initiatives depends on its ability to attract and retain workers. Tightening of the labor market in key regions due to a shortage of suitably skilled workers may inhibit Royal Wolf’s ability to hire and retain employees. Additionally, rising wages paid to employees may pose a risk to Royal Wolf’s margins if it is unable to pass on such higher costs through price increases.
Royal Wolf is also subject to Workplace Health and Safety regulations. If Royal Wolf is not able to maintain its working conditions to meet Workplace Health and Safety regulations it may impact Royal Wolf’s operations and ability to attract and retain workers and also result in contravention of those regulations, which may give rise to potential criminal and civil liability and also damage Royal Wolf’s brand and reputation.
Significant Risks Related Primarily to Our Leasing Operations in North America
General or localized economic downturns or weakness may adversely affect our customers, in particular those in the construction industry, which may reduce demand for our products and services and negatively impact our future revenues and results of operations.
A significant portion of our revenues in our North American Leasing operations is derived from customers who are in industries and businesses that are cyclical in nature and subject to changes in general economic conditions, including the oil and gas and the construction industries. Although the variety of our products, the breadth of our customer base and the number of markets we serve throughout North America limit our exposure to economic downturns, general economic downturns or localized downturns in markets where we operate could reduce demand for our products, especially in the construction industry, and negatively impact our future revenues and results of operations. For example a significant downturn in the construction industry during the 2008 to 2011 period significantly reduced the utilization rate of our leased assets, and negatively impacted margins, cash flow, revenues and the overall results of operations.
Our North America Leasing operations significantly depend on spending by the oil and natural gas industry in the United States, and this spending and our business has been, and may continue to be, adversely affected by industry and financial market conditions that are beyond our control.
Our North America Leasing operations significantly depend on the willingness of the oil and gas industry to make operating and capital expenditures to explore, develop and produce oil and natural gas in the United States. Declines in these expenditures, due to the low natural gas price environment or other factors, could result in project modification, delays or cancellations, general business disruptions, and delays in, or nonpayment of, amounts owed to us by customers. Expectations for lower market prices for oil and natural gas, as well as the availability of capital for operating and capital expenditures, may also cause the curtailment of spending, thereby reducing demand for our liquid storage tank containers and our fluid management services. Industry conditions are influenced by numerous factors and events over which we have no control and any of these factors or events that would result in the reduction of drilling activity could adversely affect our operating results and cash flows.
Because we have depended to a large extent on the success of our leasing operations, the failure to effectively and quickly remarket lease units that are returned could materially and adversely affect our results of operations.
Historically, our average monthly lease fleet utilization has averaged between 70% and 85%; with the typical lease term being for an average period of over twelve months. The high utilization rate and the length of the average lease have provided us with a predictable revenue stream. However, if utilization rates decline or should a significant number of our lease units be returned during any short period of time, we would have to re-lease a large supply of units at similar rates to maintain historic revenues from these operations. Our failure to effectively maintain historical utilization rates or remarket a large influx of units returning from leases could have a material adverse effect on our results of operations.
I-26
Table of Contents
Sales of modular buildings, mobile offices and container product units constitute a significant portion of our revenues and the failure to continue to sell units at historic rates could adversely affect our ability to grow our lease fleet.
Revenues from sales of modular buildings, mobile offices and container products have been used to fund increases in the size of our lease fleet. As a result, the failure to continue to sell a significant number of units may adversely affect our ability to increase the size of our lease fleet or to otherwise take advantage of business and growth opportunities available to us.
We may be brought into tort or environmental litigation or held responsible for cleanup of spills if the customer fails to perform, or an accident occurs in the use of our tank container products, which could materially adversely affect our business, future operating results or financial position.
Our portable liquid tank containers and containment products are used by customers to store non-hazardous and certain hazardous liquids on the customers’ site. Customers are responsible for proper operation of our fleet equipment while on lease and returning a cleaned and undamaged container upon completion of use, but we cannot always assure that these responsibilities are fully met in all cases. Our operations are subject to operational hazards, including accidents or equipment issues that can cause pollution and other damage to the environment. Hazards inherent in the oil and natural gas industry, such as, but not limited to, accidents, blowouts, explosions, pollution and other damage to the environment, fires and hydrocarbon spills, may delay or halt operations at extraction sites which we service. These conditions can cause:
| • | personal injury or loss of life; |
| • | liabilities from accidents by our fleet of trucks and other equipment; |
| • | damage to or destruction of property, equipment and the environment; and |
| • | the suspension of operations. |
In the event of a spill or accident, we may be brought into a lawsuit or enforcement action by either our customer or a third party on numerous potential grounds, including that an inherent flaw in a container tank contributed to the accident or that the container tank had suffered some undiscovered harm from a previous customer’s prior use. In the event of a spill caused by our customers, we may be held responsible for cleanup under environmental laws and regulations concerning obligations of suppliers of rental products to effect remediation. In addition, applicable environmental laws and regulations may impose liability on us for conduct of third parties, or for actions that complied with applicable regulations when taken, regardless of negligence or fault. Substantial damage awards have also been made in certain jurisdictions against lessors of industrial equipment based upon claims of personal injury, property damage, and resource damage caused by the use of various products. While we try to take reasonable precautions that our lease equipment is in good and safe condition prior to lease and carry insurance to protect against certain risks of loss or accidents, liability could adversely impact our profitability.
We maintain insurance coverage that we believe to be customary in the industry against these hazards. We may not be able to maintain adequate insurance in the future at rates we consider reasonable. In addition, insurance may not be available to cover any or all of the risks to which we are subject, or, even if available, the coverage provided by such insurance may be inadequate, or insurance premiums or other costs could make such insurance prohibitively expensive. It is likely that, in our insurance renewals, our premiums and deductibles will be higher, and certain insurance coverage either will be unavailable or considerably more expensive than it has been in the recent past. In addition, our insurance is subject to coverage limits, and some policies exclude coverage for damages resulting from environmental contamination.
We face significant competition in the modular buildings and portable storage industries. We also face potentially significant competition from modular buildings companies who have portable storage product offerings, especially from several national competitors in the United States who have greater financial resources and pricing flexibility than we do. If we are unable to compete successfully, we could lose customers and our future revenues could decline.
Although our competition varies significantly by market, the modular buildings markets in which we compete are dominated by primarily two large participants and are highly competitive. In addition, we compete with a number of large to mid-sized regional competitors, as well as many smaller, full and part-time operators in many local regions. The modular building industry is highly competitive, subject to stiff pricing competition and almost all of the competitors have portable storage product offerings. The primary modular national competitors with portable storage product offerings have greater financial resources and pricing flexibility. If they focus on portable storage and are unable to compete successfully, we could lose customers and our future revenues and results of operations could decline.
I-27
Table of Contents
The portable liquid containment rental industry is highly competitive, and competitive pressures could impair or ability to increase market share and to rent, or sell, equipment at favorable prices.
The portable liquid containment industry is highly competitive. We compete against national, regional and local companies, some of which are significantly larger than we are and both of which have greater financial and marketing resources than we have. Some of our competitors also have longer operating histories, lower cost basis of rental equipment, lower cost structures and more established relationships with equipment manufacturers than we have. In addition, certain of our competitors are more geographically diverse than we are and have greater name recognition among customers than we do. As a result, our competitors that have these advantages may be better able to attract customers.
We believe that local relationships, equipment quality, service levels and fleet size are key competitive factors in the portable liquid containment industry. From time to time, we or our competitors may attempt to compete aggressively by lowering rental rates or prices. Competitive pressures could adversely affect our future revenues and operating results by depressing the rental rates. To the extent we lower lease rates or increase our fleet in order to retain or increase market share, our operating margins would be adversely impacted. In addition, we may not be able to match a larger competitor’s price reductions or fleet investment because of its greater financial resources, all of which could adversely impact our future operating results.
Changes in regulatory, or governmental, oversight of hydraulic fracturing could materially adversely affect the demand for our portable liquid containment products.
We believe that in recent years growing demand related to hydraulic fracturing has increased and we have made a conscientious decision to enter into this market. However, oil and gas exploration and extraction (including use of tanks for hydraulic fracturing of gas and oil shale) are subject to numerous local, state and federal regulations. The hydraulic fracturing method of extraction has come under scrutiny in several states and by the Federal government due to the potential adverse effects that hydraulic fracturing, and the liquids and chemicals used, may have on water quality and public health. In addition, the disposal of wastewater from the hydraulic fracturing process into injection wells may increase the rate of seismic activity near drill sites and could result in regulatory changes, delays or interruption of future activity. Changes in these regulations could limit, interrupt, or stop exploration and extraction activities, which would negatively impact the demand for our portable liquid containment products.
Seasonality of the portable liquid containment industry may impact future quarterly results.
Activity may decline in our second quarter months of November and December and our third quarter months of January and February. These months may have lower rental activity in parts of the country where inclement weather may delay, or suspend, customer projects. The impact of these delays may be to decrease the number of frac tank containers on lease until companies are able to resume their projects when weather improves. These seasonal factors may impact our future quarterly results in each year’s second and third quarters.
Significant increases in raw material costs could increase our operating costs significantly and harm our future results of operations.
We purchase raw materials, including metals, lumber, siding and roofing and other products, to construct and modify modular buildings and to modify containers to its customers’ requirements. We also maintain a truck fleet to deliver units to and return units from customers. During periods of rising prices for raw materials, especially oil and fuel for delivery vehicles, and in particular when the prices increase rapidly or to levels significantly higher than normal, we may incur significant increases in operating costs and may not be able to pass price increases through to customers in a timely manner, which could harm our future results of operations.
Failure to retain key personnel could adversely affect our operations and could impede our ability to execute our business plan and growth strategy.
Our North American Leasing operations are managed largely by primarily eight existing officers, including Pac-Van’s President, Theodore M. Mourouzis. The continued success of our North American Leasing operations will depend largely on the efforts and abilities of Mr. Mourouzis and these senior managers. These officers and employees have an understanding of the industry that cannot be readily duplicated. Mr. Mourouzis has an employment agreement which is terminable under certain circumstances upon notice to or by him. The loss of any member of our North American Leasing senior management team could impair our ability to execute our business plan and growth strategy, cause a loss of customers, reduce revenues and adversely affect employee morale.
I-28
Table of Contents
A key for success in the oil and gas industry in North America is our ability to continue to employ and retain skilled and unskilled personnel. Any difficulty we experience replacing or adding personnel could adversely affect our business.
We may not be able to find enough skilled and unskilled labor to meet our needs, which could limit our growth. The oil and gas business activity historically decreases or increases with the prices of oil and natural gas. We may have problems retaining and finding enough laborers in the future, particularly if the demand for our portable liquid containment products and fluid management services increases. Other factors may also inhibit our ability to find enough workers to meet our employment needs.
We believe that a key to our success in the oil and gas industry in North America is dependent upon our ability to continue to employ and retain skilled and unskilled personnel. Our inability to employ or retain personnel generally could have a significant adverse effect on our operations.
A substantial potion of the revenues of Lone Star are earned from less than 20 major customers and the loss of any one or more of these customers could adversely affect our results of operations.
Lone Star earns a substantial portion of its revenue from less than 20 major customers. One or more of these customers could cancel their leases and cease doing business with Lone Star for a variety of reasons beyond our control. The loss of one or more of these major customers could adversely affect our results of operations.
Failure by our manufacturers to sell and deliver products in a timely fashion may harm our reputation and financial condition.
We currently purchase new modular buildings and components, mobile offices and container products directly from manufacturers. Although we are not dependent on any one manufacturer and able to purchase products from a variety of suppliers, the failure of one or more of our suppliers to timely manufacture and deliver storage containers to us could adversely affect our operations. We purchase new modular buildings and components, mobile offices and storage containers under purchase orders issued to various manufacturers, which the manufacturers may or may not accept or be able to fill. We have no contracts with any supplier. If these suppliers do not timely fill our purchase orders, or do not properly manufacture the ordered products, our reputation and financial condition could be harmed.
Some zoning laws restrict the use of our storage units and therefore limit our ability to offer products in all markets.
Many of our customers use our storage units to store goods on their own properties. Local zoning laws in some of our markets prohibit customers from maintaining mobile offices or storage containers on their properties or require that mobile offices or storage containers be located out of sight from the street. If local zoning laws in one or more of our geographic markets were to ban or restrict our products from being stored on customers’ sites, our business in that market could suffer.
Significant Risks Related Primarily to Our Manufacturing Operations in North America at Southern Frac
Significant competition in the industry in which Southern Frac operates may result in its competitors offering new or better products and services or lower prices, which could result in a loss of customers and a decrease in revenues.
The portable liquid storage tank container manufacturing industry is highly competitive. Southern Frac competes with other manufacturers of varying sizes, some of which have substantial financial resources. Manufacturers compete primarily on the quality of their products, customer relationships, service availability and cost. Barriers to entry are low. As a result, it is possible that additional competitors could enter the market at any time. If Southern Frac is unable to successfully compete with other portable liquid storage tank container manufacturers it could lose customers and our revenues may decline.
Southern Frac’s business significantly depends on spending by the oil and natural gas industry in the United States, and this spending and our business has been, and may continue to be, adversely affected by industry and financial market conditions that are beyond our control.
Southern Frac significantly depends on the willingness of the oil and gas industry to make operating and capital expenditures to explore, develop and produce oil and natural gas in the United States. Declines in these expenditures, due to the low natural gas price environment or other factors, could result in project modification, delays or cancellations, general business disruptions, and delays in, or nonpayment of, amounts owed to us by customers. Expectations for lower market prices for oil and natural gas, as well as the availability of capital for operating and capital expenditures, may also cause the curtailment of spending, thereby reducing demand for our liquid storage tank containers. Industry conditions are influenced by numerous factors and events to which we have no control and any of these factors or events that would result in the reduction of drilling activity could adversely affect our operating results and cash flows.
I-29
Table of Contents
Changes in regulatory, or governmental, oversight of hydraulic fracturing could materially adversely affect the demand for Southern Frac’s portable liquid containment products.
Oil and gas exploration and extraction (including use of tanks for hydraulic fracturing of gas and oil shale) are subject to numerous local, state and federal regulations. The hydraulic fracturing method of extraction has come under scrutiny in several states and by the Federal government due to the potential adverse effects that hydraulic fracturing, and the liquids and chemicals used, may have on water quality and public health. In addition, the disposal of wastewater from the hydraulic fracturing process into injection wells may increase the rate of seismic activity near drill sites and could result in regulatory changes, delays or interruption of future activity. Changes in these regulations could limit, interrupt, or stop exploration and extraction activities, which would negatively impact the demand for Southern Frac’s portable liquid containment products.
Seasonality of the portable liquid containment industry may impact future quarterly results.
Activity may decline in our second quarter months of November and December and our third quarter months of January and February. These months may have lower rental activity in parts of the country where inclement weather may delay, or suspend, customer projects. The impact of these delays may be to decrease the number of frac tank containers sold until companies are able to resume their projects when weather improves. These seasonal factors may impact Southern Frac’s future operating results in each fiscal year’s second and third quarters.
Difficulties Associated with Fixed Capacity Levels
Southern Frac’s ability to increase manufacturing capacity may require significant investments in equipment and personnel. To the extent that we make investments to increase manufacturing capacity and demand for our products is not sustained, our results of operations and financial condition may be adversely affected. Conversely, if we choose not to make investments to increase manufacturing capacity, our ability to meet customer demand for our products and increase revenues may be adversely affected. Additionally, operating our facilities at near full capacity levels may cause us to incur labor costs at premium rates in order to meet customer requirements, experience increased maintenance expenses or require us to replace our machinery and equipment on an accelerated basis, each of which could cause our results of operations and financial condition to be adversely affected.
Implementation of Operational Improvements
As part of our ongoing focus on being a low-cost provider of high quality products, we continually analyze our business to further improve our operations. Our continued analysis may include identifying and implementing opportunities for: (i) further rationalization of manufacturing capacity; (ii) streamlining of selling, general and administrative overhead; or (iii) efficient investment in new equipment and the upgrading of existing equipment. We may be unable to successfully identify or implement plans targeting these initiatives, or fail to realize the benefits of the plans we have already implemented, as a result of operational difficulties, a weakening of the economy or other factors. Cost reductions may not fully offset decreases in the prices of our products due to the time required to develop and implement cost reduction initiatives. Additional factors such as inconsistent customer ordering patterns, increasing product complexity and heightened quality standards also may make it more difficult to reduce our costs. It is also possible that as we incur costs to implement improvement strategies, the initial impact on our financial position, results of operations and cash flow may be adverse and we may not be able to successfully realize sufficient cost savings to mitigate this adverse impact.
Southern Frac’s business could be harmed if we fail to maintain proper inventory levels.
Southern Frac is required to maintain sufficient inventories to accommodate the needs of its customers including, in many cases, short lead times on delivery requirements. We purchase raw materials on a regular basis in an effort to maintain our inventory at levels that we believe are sufficient to satisfy the anticipated needs of our customers based upon orders, customer volume expectations, historic buying practices and market conditions. Inventory levels in excess of customer demand may result in the use of higher-priced inventory to fill orders reflecting lower selling prices, if steel prices have significantly decreased. These events could adversely affect our financial results. Conversely, if we underestimate demand for our products or if our suppliers fail to supply quality products in a timely manner, we may experience inventory shortages. Inventory shortages could result in unfilled orders, negatively impacting our customer relationships and resulting in lost revenues, which could harm our business and adversely affect our financial results.
I-30
Table of Contents
Southern Frac’s future operating results may be affected by fluctuations in raw material prices, and it may be unable to pass on any increases in raw material costs to its customers.
Southern Frac’s principal raw material is steel. The steel industry as a whole has been cyclical, and at times availability and pricing can be volatile due to a number of factors beyond our control. These factors include general economic conditions, domestic and worldwide demand, the influence of hedge funds and other investment funds participating in commodity markets, curtailed production from major suppliers due to factors such as the closing or idling of facilities, accidents or equipment breakdowns, repairs or catastrophic events, labor costs or problems, competition, new laws and regulations, import duties, tariffs, energy costs, availability and cost of steel inputs (e.g., ore, scrap, coke and energy), currency exchange rates and other factors. This volatility, as well as any increases in raw material costs, could significantly affect our steel costs and adversely impact our financial results. If our suppliers increase the prices of our critical raw materials, we may not have alternative sources of supply. In addition, in an environment of increasing prices for steel and other raw materials, competitive conditions may impact how much of the price increases we can pass on to our customers. To the extent we are unable to pass on future price increases in our raw materials to customers, our financial results could be adversely affected. Also, if steel prices decrease, competitive conditions may impact how quickly we must reduce our prices to our customers, and we could be forced to use higher-priced raw materials to complete orders for which the selling prices have decreased. Decreasing steel prices could also require us to write-down the value of our inventory to reflect current market pricing.
The loss of key supplier relationships could adversely affect Southern Frac.
Southern Frac has developed relationships with certain steel and other suppliers which have been beneficial to us by providing more assured delivery and a more favorable all-in cost, which includes price and shipping costs. If any of those relationships were disrupted, it could have an adverse effect on delivery times and the overall cost and quality of our raw materials, which could have a negative impact on our business. In addition, we do not have long-term contracts with any of our suppliers. If, in the future, we are unable to obtain sufficient amounts of steel and other products at competitive prices and on a timely basis from our traditional suppliers, we may be unable to obtain these products from alternative sources at competitive prices to meet our delivery schedule, which could have a material adverse affect on our results of operations.
The costs of manufacturing Southern Frac’s products and its ability to supply customers could be negatively impacted if we experience interruptions in deliveries of needed raw materials or supplies.
If, for any reason, Southern Frac’s supply of steel is curtailed or it otherwise is unable to obtain the quantities it needs at competitive prices, our business could suffer and our financial results could be adversely affected. Such interruptions could result from a number of factors, including a shortage of capacity in the supplier base of raw materials, energy or the inputs needed to make steel or other supplies, a failure of suppliers to fulfill their supply or delivery obligations, financial difficulties of suppliers resulting in the closing or idling of supplier facilities, other significant events affecting supplier facilities, significant weather events and other factors, all of which are beyond our control.
The loss of significant volume from key customers could adversely affect Southern Frac.
A significant loss of, or decrease in, business from any of its key customers could have an adverse effect on Southern Frac’s sales and financial results if it cannot obtain replacement business. In addition, certain of its top customers may be able to exert pricing and other influences on Southern Frac, requiring it to market, deliver and promote its products in a manner that may be more costly. Moreover, Southern Frac generally does not have long-term contracts with its customers. As a result, although its customers periodically provide indications of their product needs and purchases, they generally purchase Southern Frac’s products on an order-by-order basis, and the relationship, as well as particular orders, can be terminated at any time.
Significant Risks Related Primarily to Our Series C Preferred Shares
We cannot assure that quarterly dividends on, or any other payments in respect of, the Series C Preferred Shares will be made timely or at all.
We cannot assure that we will be able to pay quarterly dividends on the Series C Preferred Shares or to redeem the Series C Preferred Shares, if we wanted to do so. Quarterly dividends on our Series C Preferred Shares will be paid from funds legally available for such purpose when, as and if declared by our board of directors. Certain factors may influence our decision, or adversely affect our ability, to pay dividends on, or make other payments in respect of, our Series C Preferred Shares, including, among other things:
| • | the amount of our available cash or other liquid assets, including the impact of any liquidity shortfalls caused by the below-described restrictions on the ability of our subsidiaries to generate and transfer cash to us; |
| • | our ability to service and refinance our current and future indebtedness; |
I-31
Table of Contents
| • | changes in our cash requirements to fund capital expenditures, acquisitions or other operational or strategic initiatives; |
| • | our ability to borrow or raise additional capital to satisfy our capital needs; |
| • | restrictions imposed by our existing, or any future, credit facilities, debt securities or leases, including restricted payment and leverage covenants that could limit our ability to make payments to holders of the Series C Preferred Shares; |
| • | limitations on the ability of Southern Frac or Royal Wolf to distribute cash to us due to third parties holding equity interests in those subsidiaries; and |
| • | limitations on cash payments to shareholders under Delaware law, including limitations that require dividend payments be made out of surplus or, subject to certain limitations, out of net profits for the then-current or preceding year in the event there is no surplus. |
Based on its evaluation of these and other relevant factors, our board of directors may, in its sole discretion, decide not to declare a dividend on the Series C Preferred Shares for any quarterly period for any reason, regardless of whether we have funds legally available for such purpose. In such event, a holder’s sole recourse will be its rights as a holder of Series C Preferred Shares, which includes the right to cumulative dividends and, under certain specified circumstances, to additional interest and limited conditional voting rights.
GFN’s ability, as a holding company, to make payments in respect of the Series C Preferred Shares depends on the ability of our subsidiaries to transfer funds to us.
GFN is a holding company and, accordingly, substantially all of our operations are conducted through our subsidiaries. As a result, GFN’s cash flow and ability to make dividend payments to our stockholders depend on the earnings of our subsidiaries, the distribution from our subsidiaries and compliance with the covenants governing the indebtedness of our subsidiaries, including, without limitation, covenants of the senior credit facilities of our subsidiaries that permit dividends and other payments from such subsidiaries to GFN. Payments by our subsidiaries to GFN are also contingent upon those subsidiaries’ earnings and business considerations. Furthermore, GFN’s right to receive any assets of any of our subsidiaries upon their liquidation, reorganization or otherwise, and thus the ability of a holder of Series C Preferred Stock to benefit indirectly from such distribution, will be subject to the prior claims of the subsidiaries’ creditors.
The terms of the revolving senior credit facility with a syndicate led by Wells Fargo Bank, National Association (“Wells Fargo”) limit the ability of our North American Leasing operations to upstream dividends to GFN that would be used to pay dividends on the Series C Preferred Stock. If the amount of the dividends payable on the Series C Preferred Stock exceeds the amount of the dividends our North American Leasing operations are permitted to pay GFN and GFN is unable to generate sufficient cash from its other subsidiaries for a dividend payment, GFN may not be able to make the required dividend payment on the Series C Preferred Stock. Our ability to pay dividends or make other payments to the holders of our Series C Preferred Shares will be adversely affected if the senior credit facility prohibits the payment of dividends to GFN.
The Series C Preferred Shares represent perpetual equity interests.
The Series C Preferred Shares represent perpetual equity interests in us and, unlike our indebtedness, will not entitle the holders thereof to receive payment of a principal amount at a particular date. As a result, holders of the Series C Preferred Shares may be required to bear the financial risks of an investment in the Series C Preferred Shares for an indefinite period of time. In addition, the Series C Preferred Shares will rank junior to all our indebtedness and other liabilities, and to any other senior securities we may issue in the future with respect to assets available to satisfy claims against us. In addition, the lack of a fixed mandatory redemption date for the Series C Preferred Shares will increase your reliance on the secondary market for liquidity purposes.
Investors should not expect us to redeem the Series C Preferred Shares on the date the Series C Preferred Shares becomes redeemable by the Company or on any particular date afterwards.
The shares of Series C Preferred Shares have no maturity or mandatory redemption date and are not redeemable at the option of investors under any circumstances. By their terms, the Series C Preferred Shares may be redeemed by us at our option either in whole or in part at any time on or after May 17, 2018 or, under certain circumstances, may be redeemed by us at our option, in whole, sooner than that date. Any decision we may make at any time regarding whether to redeem the Series C Preferred Shares will depend upon a wide variety of factors, including our evaluation of our capital position, our capital requirements and general market conditions at that time. However, investors should not assume that we will redeem the Series C Preferred Shares at any particular time, or at all.
I-32
Table of Contents
Increases in market interest rates may adversely affect the trading price of our Series C Preferred Shares.
One of the factors that will influence the trading price of our Series C Preferred Shares will be the dividend yield on the Series C Preferred Shares relative to market interest rates. An increase in market interest rates, which are currently at low levels relative to historical rates, may reduce demand for our Series C Preferred Shares and would likely increase our borrowing costs and potentially decrease funds available for distribution. Accordingly, higher market interest rates could cause the market price of our Series C Preferred Shares to decrease.
The Series C Preferred Shares have not been rated and the lack of a rating may adversely affect the trading price of the Series C Preferred Shares.
We have not sought to obtain a rating for the Series C Preferred Shares, and the shares may never be rated. It is possible, however, that one or more rating agencies might independently determine to assign a rating to the Series C Preferred Shares or that we may elect to obtain a rating of our Series C Preferred Shares in the future. In addition, we may elect to issue other securities for which we may seek to obtain a rating. The market value of the Series C Preferred Shares could be adversely affected if:
| • | any ratings assigned to the Series C Preferred Shares in the future or to other securities we issue in the future are lower than market expectations or are subsequently lowered or withdrawn; |
| • | or ratings for such other securities would imply a lower relative value for the Series C Preferred Shares. |
The interests of holders in the Series C Preferred Shares could be diluted by our issuance of additional shares of preferred stock, including additional Series C Preferred Shares, and by other transactions.
Our charter currently authorizes the issuance of up to one million shares of preferred stock in one or more classes or series, and we will be permitted, without notice to or consent of the holders of Series C Preferred Shares, to issue additional Series C Preferred Shares or other securities that have rights junior to such shares, up to the maximum aggregate number of authorized shares of our preferred stock. The issuance of additional preferred stock on a parity with or senior to our Series C Preferred Shares would dilute the interests of the holders of our Series C Preferred Shares, and any issuance of preferred stock senior to or on a parity with our Series C Preferred Shares or of additional indebtedness could adversely affect our ability to pay dividends on, redeem or pay the liquidation preference on our Series C Preferred Shares. We cannot assure that quarterly dividends on, or any other payments in respect of, the Series C Preferred Shares will be made timely or at all and there are effectively no provisions relating to our Series C Preferred Shares that protect the holders of our Series C Preferred Shares in the event of a highly leveraged or other transaction, including a merger or the sale, lease or conveyance of all or substantially all our assets or business; any of which might adversely affect the holders of our Series C Preferred Shares.
A holder of Series C Preferred Shares has extremely limited voting rights.
Voting rights as a holder of Series C Preferred Shares will be extremely limited. However, in the event that six quarterly dividends, whether consecutive or not, payable on Series C Preferred Shares are in arrears or a listing failure has occurred and is continuing, the holders of Series C Preferred Shares will have the right, voting together as a class with all other classes or series of parity securities upon which like voting rights have been conferred and are exercisable, to elect two additional directors to serve on our board of directors.
The Series C Preferred Shares are not convertible and purchasers may not realize a corresponding benefit if the trading price of our common stock rises.
The Series C Preferred Shares are not convertible into our common shares and do not have exchange rights or entitled or subject to any preemptive or similar rights. Accordingly, the market value of the Series C Preferred Shares may depend to some degree on, among other things, dividend and interest rates for other securities and other investment alternatives and our actual and perceived ability to make dividend or other payments in respect of our Series C Preferred Shares rather than the trading price of our common stock. In addition, our right to redeem the Series C Preferred Shares on or after May 17, 2018 or in the event of a change in control could impose a ceiling on their value.
I-33
Table of Contents
Significant Risks Related Primarily to Our Senior Notes
The Senior Notes are not rated and the issuance of a credit rating could adversely affect the market price of the Senior Notes.
At their issuance, the Senior Notes were be rated by any credit rating agency. However, the Senior Notes may subsequently be rated by one or more of the credit rating agencies. If the Senior Notes are rated, the rating could be lower than expected, and such a rating could have an adverse effect on the market price of the Senior Notes. Furthermore, credit rating agencies revise their ratings from time to time and could lower or withdraw any rating issued with respect to the Senior Notes. Any real or anticipated downgrade or withdrawal of any ratings of the Senior Notes could have an adverse effect on the market price or liquidity of the Senior Notes.
Ratings reflect only the views of the issuing credit rating agency or agencies and are not recommendations to purchase, sell or hold any particular security, including the Senior Notes. In addition, ratings do not reflect market prices or suitability of a security for a particular investor, and any future rating of the Senior Notes may not reflect all risks related to us and our business or the structure or market value of the Senior Notes.
We are the sole obligor of the Senior Notes and our direct and indirect subsidiaries do not guarantee our obligations under the Senior Notes and do not have any obligation with respect to the Senior Notes. Furthermore, your right to receive payment on the Senior Notes will be structurally subordinated to the liabilities of our subsidiaries.
We are a holding company with no business operations or assets other than the capital stock of our direct and indirect subsidiaries. Consequently, we will be dependent on loans, dividends and other payments from these subsidiaries to make payments of principal and interest on the Senior Notes. However, our subsidiaries are separate and distinct legal entities, and they will have no obligation, contingent or otherwise, to pay the amounts due under the Senior Notes or to make any funds available to pay those amounts, whether by dividend, distribution, loan or other payments. Holders of the Senior Notes will not have any direct claim on the cash flows or assets of our direct and indirect subsidiaries.
The ability of our subsidiaries to pay dividends and make other payments to us will depend on their cash flows and earnings, which, in turn, will be affected by all of the factors discussed in our Annual Report on Form 10-K. The ability of our direct and indirect subsidiaries to pay dividends and make distributions to us may be restricted by, among other things, applicable laws and regulations and by the terms of the agreements into which they enter. If we are unable to obtain funds from our direct and indirect subsidiaries as a result of restrictions under their debt or other agreements, applicable laws and regulations or otherwise, we may not be able to pay cash interest or principal on the Senior Notes when due.
The Senior Notes are structurally subordinated to all indebtedness of our subsidiaries. While the indenture governing the Senior Notes will limit the indebtedness and activities of these subsidiaries, holders of indebtedness of, and trade creditors of, our subsidiaries, are entitled to payments of their claims from the assets of such subsidiaries before those assets are made available for distribution to us, as direct or indirect shareholder. Accordingly, in the event that any of our subsidiaries becomes insolvent, liquidates or otherwise reorganizes:
| • | the creditors of such subsidiary (including the holders of the Senior Notes) will have no right to proceed against such subsidiary’s assets; and |
| • | the creditors of such subsidiary, including trade creditors, will generally be entitled to payment in full from the sale or other disposal of assets of such subsidiary before we, as direct or indirect stockholder, will be entitled to receive any distributions from such subsidiary. |
We may be unable to repurchase the Senior Notes upon a change of control.
In the event of a “change of control,” as defined in the indenture governing our Senior Notes, we must offer to purchase the Senior Notes at a purchase price equal to 101% of the principal amount, plus accrued and unpaid interest to the date of repurchase. In the event that we are required to make such offer with respect to the Senior Notes, there can be no assurance that we would have sufficient funds available to purchase any Senior Notes, and we may be required to refinance the Senior Notes. There can be no assurance that we would be able to accomplish a refinancing or, if a refinancing were to occur, that it would be accomplished on commercially reasonable terms.
The revolving credit facilities of our subsidiaries prohibit us from repurchasing any of the Senior Notes, except under limited circumstances. The revolving credit facilities of our subsidiaries also provide that certain change of control events would constitute a default. In the event a change of control occurs at a time when we are prohibited from purchasing the Senior Notes, we could seek the consent of the lenders under the revolving credit facilities of our U.S. subsidiaries to purchase the Senior Notes. If we did not obtain such consent, we would remain prohibited from purchasing the Senior Notes. In this case, our failure to purchase would constitute an event of default under the indenture governing the Senior Notes.
I-34
Table of Contents
We may not be able to generate sufficient cash to service all of our debt, and may be forced to take other actions to satisfy our obligations under such indebtedness, which may not be successful.
Our ability to make scheduled payments on, or to refinance our obligations under, our debt will depend on our financial and operating performance and that of our subsidiaries, which, in turn, will be subject to prevailing economic and competitive conditions and to financial and business factors, many of which may be beyond our control.
We may not maintain a level of cash flow from operating activities sufficient to permit us to pay the principal, premium, if any, and interest on our indebtedness. If our cash flow and capital resources are insufficient to fund our debt service obligations, we may be forced to reduce or delay capital expenditures, sell assets, seek to obtain additional equity capital or restructure our debt. In the future, our cash flow and capital resources may not be sufficient for payments of interest on, and principal of, our debt, and such alternative measures may not be successful and may not permit us to meet our scheduled debt service obligations. We may not be able to refinance any of our indebtedness or obtain additional financing, particularly because of our anticipated high levels of debt and the debt incurrence restrictions imposed by the agreements governing our debt, as well as prevailing market conditions. In the absence of such operating results and resources, we could face substantial liquidity problems and might be required to dispose of material assets or operations to meet our debt service and other obligations. The instruments governing our indebtedness restrict our ability to dispose of assets and use the proceeds from any such dispositions. We may not be able to consummate those sales, or if we do, at an opportune time, the proceeds that we realize may not be adequate to meet debt service obligations when due.
Changes in the credit markets could adversely affect the market price of the Senior Notes.
The market price for the Senior Notes will be based on a number of factors, including:
| • | the prevailing interest rates being paid by other companies similar to us; |
| • | and the overall condition of the financial markets. |
The condition of the credit markets and prevailing interest rates have fluctuated in the past and can be expected to fluctuate in the future. Fluctuations in these factors could have an adverse effect on the price and liquidity of the Senior Notes.
An increase in market interest rates could result in a decrease in the relative value of the Senior Notes.
In general, as market interest rates rise, Senior Notes bearing interest at a fixed rate generally decline in value. Consequently, if you purchase these Senior Notes and market interest rates increase, the market values of your Senior Notes may decline. We cannot predict the future level of market interest rates.
We could enter into various transactions that could increase the amount of our outstanding debt, or adversely affect our capital structure or credit rating, or otherwise adversely affect holders of the Senior Notes.
Subject to certain exceptions relating to incurring certain liens or entering into certain sale and leaseback transactions, the terms of the Senior Notes do not prevent us from entering into a variety of acquisition, divestiture, refinancing, recapitalization or other highly leveraged transactions. As a result, we could enter into any such transaction even though the transaction could increase the total amount of our outstanding indebtedness, adversely affect our capital structure or credit rating or otherwise adversely affect the holders of the Senior Notes.
Redemption may adversely affect your return on the Senior Notes.
We have the right to redeem some or all of the Senior Notes prior to maturity. We may redeem the Senior Notes at times when prevailing interest rates may be relatively low compared to rates at the time of issuance of the Senior Notes. Accordingly, you may not be able to reinvest the redemption proceeds in a comparable security at an effective interest rate as high as that of the Senior Notes.
Item 1B. Unresolved Staff Comments
None.
I-35
Table of Contents
We locate our Asia-Pacific CSCs (or branches) in markets with attractive demographics and strong growth prospects. Within each market, we have located our CSCs in areas that allow for easy delivery of mobile storage units to our customers over a wide geographic area. In addition, when cost effective, we seek high visibility locations. Our CSCs maintain an inventory of mobile storage units available for lease, and most of our CSCs also provide storage of units under lease at the site (“on-site storage”). Several CSCs have multiple leases of adjoining or contiguous properties and, except for the Auckland, New Zealand self-storage and regional head office site, the CSCs are all leased.
The following table shows information about our CSCs and other properties by country (Australia and New Zealand) at June 30, 2014 and we believe these properties are suitable and adequate:
| Location |
Functions/Uses |
Year Established |
||||
| Australia: |
||||||
| Adelaide |
Leasing, on-site storage and sales | 2006 | ||||
| Brisbane – Weyba Street Banyo |
Leasing, on-site storage and sales | 2005 | ||||
| Brisbane – Armada Place Banyo (special projects and modifications) |
Leasing and sales (not a CSC) | 2008 | ||||
| South Brisbane – Musgrave Road Cooper Plains |
Leasing, on-site storage and sales | 2013 | ||||
| Cairns |
Leasing, on-site storage and sales | 2004 | ||||
| Canberra |
Leasing, on-site storage and sales | 2007 | ||||
| Melbourne East – Clayton |
Leasing, on-site storage and sales | 1997 | ||||
| Melbourne West – Sunshine |
Leasing, on-site storage and sales | 2005 | ||||
| Darwin |
Leasing, on-site storage and sales | 2010 | ||||
| Footscray |
Leasing, and sales | 2013 | ||||
| Geraldton |
Leasing, on-site storage and sales | 2007 | ||||
| Gold Coast |
Leasing, on-site storage and sales | 2005 | ||||
| Gosford – Central Coast |
Leasing, on-site storage and sales | 2009 | ||||
| Hobart |
Leasing, on-site storage and sales | 2008 | ||||
| Hornsby |
Head office | 1995 | ||||
| Sydney – Moorebank |
Leasing, on-site storage and sales | 2009 | ||||
| Sydney – St Marys |
Leasing, on-site storage and sales | 2011 | ||||
| Newcastle |
Leasing, on-site storage and sales | 2001 | ||||
| Perth North – Bayswater |
Leasing, on-site storage and sales | 2004 | ||||
| Perth South – Bibra Lake |
Leasing, on-site storage and sales | 2006 | ||||
| Perth – Bassendean |
Fleet storage and overflow (not a CSC) | 2013 | ||||
| Rockhampton |
Leasing, on-site storage and sales | 2013 | ||||
| Townsville |
Leasing, on-site storage and sales | 2005 | ||||
| New Zealand: |
||||||
| Auckland-Ormiston Rd (owned) |
Regional head office and on-site storage (not a CSC) | 2000 | ||||
| Auckland – Jarvis Way |
Leasing, on-site storage and sales | 2013 | ||||
| Christchurch |
Leasing, on-site storage and sales | 2002 | ||||
| Dunedin |
Leasing, on-site storage and sales | 2013 | ||||
| Hamilton |
Leasing, on-site storage and sales | 2010 | ||||
| Palmerston North |
Leasing, on-site storage and sales | 2012 | ||||
| Silverdale/Albany |
Leasing, on-site storage and sales | 2008 | ||||
| Tauranga/Bay of Plenty |
Leasing, on-site storage and sales | 2009 | ||||
| Wellington |
Leasing, on-site storage and sales | 2007 | ||||
I-36
Table of Contents
We lease all of the locations in our North American Leasing operations, except for Pac-Van’s corporate regional office (which is owned). Most of the major leased properties have remaining lease terms of at least one year and we believe that satisfactory alternative properties could be found in all of our North American markets, if necessary. The following table shows information about our branches and other properties in North America as of June 30, 2014:
| Location |
Function/Uses |
Year Established |
||||
| United States: |
||||||
| Albany, GA |
Leasing and sales | 2012 | ||||
| Atlanta, GA |
Leasing and sales | 2008 | ||||
| Bakersfield, CA |
Leasing and sales | 2008 | ||||
| Charleston, WV |
Leasing and sales | 1998 | ||||
| Charlotte, NC |
Leasing and sales | 1999 | ||||
| Chicago, IL |
Leasing and sales | 1998 | ||||
| Cincinnati, OH |
Leasing and sales | 1997 | ||||
| Cleveland, OH |
Leasing and sales | 1995 | ||||
| Columbus, OH |
Leasing and sales | 1993 | ||||
| Dallas, TX |
Leasing and sales | 2008 | ||||
| Denver, CO |
Leasing and sales | 1999 | ||||
| Detroit, MI |
Leasing and sales | 2013 | ||||
| Elkhart, IN |
Leasing and sales | 2000 | ||||
| Elko, NV |
Fleet storage | 2012 | ||||
| Chino, CA |
Leasing and sales | 2008 | ||||
| Indianapolis, IN |
Leasing and sales | 1993 | ||||
| Indianapolis, IN (owned) |
Corporate office | 2011 | ||||
| Jacksonville, FL |
Leasing and sales | 2007 | ||||
| Kansas City, MO |
Leasing and sales | 2000 | ||||
| Kenedy, TX (a) |
Leasing and sales | 2014 | ||||
| Kermit, TX (b) |
Leasing and sales | 2014 | ||||
| Las Vegas, NV |
Leasing and sales | 1997 | ||||
| Louisville, KY |
Leasing and sales | 1994 | ||||
| Memphis, TN |
Leasing and sales | 1997 | ||||
| Nashville, TN |
Leasing and sales | 1996 | ||||
| New Brunswick, NJ (c) |
Leasing and sales | 2008 | ||||
| Orlando, FL |
Leasing and sales | 1997 | ||||
| Paducah, KY |
Leasing and sales | 2013 | ||||
| Phoenix, AZ (d) |
Leasing and sales | 1998 | ||||
| Pittsburgh, PA |
Leasing and sales | 1998 | ||||
| Salt Lake City, UT |
Leasing and sales | 2008 | ||||
| St. Louis, MO |
Leasing and sales | 1996 | ||||
| Toledo, OH |
Leasing and sales | 1996 | ||||
| Waterford City, ND |
Fleet storage | 2008 | ||||
| Canada: |
||||||
| Edmonton, AB (e) |
Leasing and sales | 2012 | ||||
| Calgary, AB |
Leasing and sales | 2013 | ||||
| (a) | There is another associated location in Karnes, TX, but it does not conduct leasing and sales. |
| (b) | There is another associated location in Goldsmith, TX, but it does not conduct leasing and sales. |
| (c) | Branch moved from Trenton, NJ to New Brunswick, NJ in 2013 while servicing the same market. |
| (d) | There is also a fleet maintenance and modification facility in the Phoenix, AZ area. |
| (e) | There is also a fleet maintenance and modification facility in this market. |
Southern Frac’s 40,000 square foot manufacturing facility located in Waxahachie, Texas is on a 7.4 acre property, which we purchased in December 2012. In addition, Southern Frac has two contiguous leased properties that include administrative offices and warehouse space, as well as additional parking, with lease terms through February 2016 and March 2016; with two three-year renewal options on each lease.
We lease our GFN corporate headquarters in Pasadena, California, effective January 31, 2008, from an affiliate of our chief executive officer, who is also a member of the board of directors. The term of the lease is five years, with two five-year renewal options, and the rent is adjusted yearly based on the consumer price index. On October 11, 2012, we exercised our option to renew the lease for an additional five-year term commencing February 1, 2013.
We also lease a small office in Northbrook, Illinois. The term of the lease is through October 31, 2014.
I-37
Table of Contents
We are not involved in any material lawsuits or claims arising out of the normal course of our business. We have insurance policies to cover general liability and workers compensation related claims. In our opinion, the ultimate amount of liability not covered by insurance under pending litigation and claims, if any, will not have a material adverse effect on our financial position, operating results or cash flows.
Reference is made to Note 10 of our consolidated financial statements for further discussion of commitments and contingencies, including any legal proceedings.
Item 4. Mine Safety Disclosures
Not applicable.
I-38
Table of Contents
Item 5. Market for Registrant’s Common Equity, Related Stockholder Matters and Issuer Purchases of Equity Securities
Our common stock is listed on The NASDAQ Global Market (NASDAQ) under the symbol “GFN.” The following tables set forth, for the periods indicated, the range of high and low closing sales prices for our common stock.
| Common Stock | ||||||||
| High | Low | |||||||
| Year Ended June 30, 2014: |
||||||||
| Fourth Quarter |
$ | 9.76 | $ | 7.76 | ||||
| Third Quarter |
8.44 | 6.06 | ||||||
| Second Quarter |
6.53 | 5.43 | ||||||
| First Quarter |
5.80 | 4.70 | ||||||
|
|
|
|
|
|||||
| Year Ended June 30, 2013: |
||||||||
| Fourth Quarter |
$ | 4.69 | $ | 4.10 | ||||
| Third Quarter |
5.14 | 4.35 | ||||||
| Second Quarter |
4.95 | 3.95 | ||||||
| First Quarter |
4.30 | 3.22 | ||||||
|
|
|
|
|
|||||
Record Holders
As of July 31, 2014, there were 107 holders of record of our common stock; however, we believe that there are thousands of beneficial owners.
Dividend Policy
We have not paid any dividends on our common stock to date. The payment of dividends in the future will be contingent upon our revenues and earnings, if any, capital requirements and general financial condition. The payment of any dividends will be within the discretion of our board of directors. It is the present intention of our board of directors to retain all earnings, if any, for use in our business operations and, accordingly, our board does not anticipate declaring any dividends in the foreseeable future.
Sales of Unregistered Securities
Information required has been previously included in either a Quarterly Report on Form 10-Q or in a Current Report on Form 8-K.
II-1
Table of Contents
Equity Compensation Plan
The following table sets forth information concerning our equity compensation plans, the 2006 Stock Option Plan and the 2009 Stock Incentive Plan, as of June 30, 2014:
| Plan category |
(a) Number of securities to be issued upon exercise of outstanding options, warrants and rights |
(b) Weighted-average exercise price of outstanding options, warrants and rights |
(c) Number of securities remaining available for future issuance under equity compensation plans (excluding securities reflected in column (a)) |
|||||||||
| Equity compensation plans approved by security holders |
2,152,820 | $ | 5.03 | 121,860 | (a) | |||||||
| Equity compensation plans not approved by security holders |
— | — | — | |||||||||
|
|
|
|
|
|
|
|||||||
| Total |
2,152,820 | $ | 5.03 | 121,860 | (a) | |||||||
|
|
|
|
|
|
|
|||||||
| (a) | Reduced by the issuance of 205,320 restricted (non-vested equity) shares. |
Item 6. Selected Financial Data
The following tables summarize our selected financial data for each of the five years ended June 30, 2014 and should be read in conjunction with the audited consolidated financial statements included in “Item 8 Financial Statements and Supplementary Data” and “Item 7. Management’s Discussion and Analysis of Financial Condition and Results of Operations.”
Consolidated Statement of Operations Information:
| Year Ended June 30, | ||||||||||||||||||||
| 2010 | 2011 | 2012 | 2013 | 2014 | ||||||||||||||||
| Sales: |
||||||||||||||||||||
| Lease inventories and fleet |
$ | 79,207 | $ | 92,687 | $ | 108,341 | $ | 103,003 | $ | 116,448 | ||||||||||
| Manufactured units |
— | — | — | 19,140 | 19,647 | |||||||||||||||
|
|
|
|
|
|
|
|
|
|
|
|||||||||||
| 79,207 | 92,687 | 108,341 | 122,143 | 136,095 | ||||||||||||||||
| Leasing |
77,102 | 89,577 | 103,898 | 123,400 | 151,010 | |||||||||||||||
|
|
|
|
|
|
|
|
|
|
|
|||||||||||
| 156,309 | 182,264 | 212,239 | 245,543 | 287,105 | ||||||||||||||||
|
|
|
|
|
|
|
|
|
|
|
|||||||||||
| Operating income |
3,575 | 9,781 | 26,245 | 29,491 | 40,041 | |||||||||||||||
| Other expense, net |
(13,792 | ) | (15,681 | ) | (12,143 | ) | (9,883 | ) | (13,272 | ) | ||||||||||
| Income (loss) before provision for income taxes |
(10,217 | ) | (5,900 | ) | 14,102 | 19,608 | 26,769 | |||||||||||||
| Net income (loss) |
(8,956 | ) | (8,858 | ) | 8,742 | 11,413 | 15,149 | |||||||||||||
|
|
|
|
|
|
|
|
|
|
|
|||||||||||
| Net income (loss) per common share: |
||||||||||||||||||||
| Basic |
$ | (0.64 | ) | $ | (0.72 | ) | $ | 0.11 | $ | 0.16 | $ | 0.16 | ||||||||
| Diluted |
(0.64 | ) | (0.72 | ) | 0.11 | 0.16 | 0.15 | |||||||||||||
|
|
|
|
|
|
|
|
|
|
|
|||||||||||
II-2
Table of Contents
Consolidated Balance Sheet Information:
| June 30, | ||||||||||||||||||||
| 2010 | 2011 | 2012 | 2013 | 2014 | ||||||||||||||||
| Trade and other receivables, net |
$ | 27,449 | $ | 30,498 | $ | 35,443 | $ | 34,360 | $ | 61,474 | ||||||||||
| Inventories |
19,063 | 20,942 | 31,206 | 31,858 | 27,402 | |||||||||||||||
| Lease fleet, net |
188,410 | 220,095 | 259,458 | 290,165 | 396,552 | |||||||||||||||
| Total assets |
346,880 | 387,570 | 437,560 | 473,166 | 668,489 | |||||||||||||||
| Trade payables and accrued liabilities |
25,246 | 32,522 | 35,964 | 32,238 | 53,838 | |||||||||||||||
| Senior and other debt |
186,183 | 136,589 | 174,092 | 162,951 | 302,877 | |||||||||||||||
| Total equity |
101,734 | 191,892 | 193,997 | 234,141 | 257,885 | |||||||||||||||
|
|
|
|
|
|
|
|
|
|
|
|||||||||||
Selected Unaudited Quarterly Financial Data
The following table sets forth unaudited operating data for each quarter of the years ended June 30, 2014 and June 30, 2013. This quarterly information has been prepared on the same basis as the annual consolidated financial statements and, in the opinion of management, contains all significant adjustments necessary to state fairly the information set forth herein. These quarterly results are not necessarily indicative of future results, growth rates or quarter-to-quarter comparisons.
| First Quarter |
Second Quarter |
Third Quarter |
Fourth Quarter |
|||||||||||||
| (in thousands, except per share data) | ||||||||||||||||
| For the Fiscal Year Ended June 30, 2014 (a): |
||||||||||||||||
| Revenues |
$ | 65,746 | $ | 65,629 | $ | 65,673 | $ | 90,057 | ||||||||
| Gross profit |
7,278 | 7,551 | 8,204 | 10,059 | ||||||||||||
| Operating income |
6,768 | 10,140 | 9,563 | 13,570 | ||||||||||||
| Net income |
2,202 | 4,582 | 3,826 | 4,539 | ||||||||||||
|
|
|
|
|
|
|
|
|
|||||||||
| Net income per common share: |
||||||||||||||||
| Basic |
$ | 0.02 | $ | 0.07 | $ | 0.04 | $ | 0.03 | ||||||||
| Diluted |
0.02 | 0.07 | 0.04 | 0.03 | ||||||||||||
|
|
|
|
|
|
|
|
|
|||||||||
| For the Fiscal Year Ended June 30, 2013: |
||||||||||||||||
| Revenues |
$ | 53,389 | $ | 63,352 | $ | 63,835 | $ | 64,967 | ||||||||
| Gross profit |
6,410 | 7,367 | 6,949 | 8,349 | ||||||||||||
| Operating income |
6,860 | 8,686 | 7,144 | 6,801 | ||||||||||||
| Net income |
2,492 | 3,831 | 2,798 | 2,292 | ||||||||||||
|
|
|
|
|
|
|
|
|
|||||||||
| Net income per common share: |
||||||||||||||||
| Basic |
$ | 0.04 | $ | 0.08 | $ | 0.03 | $ | 0.01 | ||||||||
| Diluted |
0.04 | 0.08 | 0.03 | 0.01 | ||||||||||||
|
|
|
|
|
|
|
|
|
|||||||||
(a) During the fourth quarter of the year ended June 30, 2014, we acquired substantially all of the assets and assumed certain of the liabilities of the affiliated companies, Lone Star Tank Rental, LP and KHM Rentals, LLC. Reference is made to “Item 7. Management’s Discussion and Analysis of Financial Condition and Results of Operations” and Note 4 of Notes to Consolidated Financial Statements for further discussion of this significant acquisition.
II-3
Table of Contents
Item 7. Management’s Discussion and Analysis of Financial Condition and Results of Operations
The following discussion of our financial condition and results of operations should be read together with the consolidated financial statements and the accompanying notes thereto included elsewhere in this Annual Report on Form 10-K. This discussion includes forward-looking statements that involve risks and uncertainties. Our actual results may differ significantly from those anticipated or discussed in those forward-looking statements as a result of various factors; including, but not limited to, those described in Item 1A. “Risk Factors.”
References to “we,” “us,” “our” or the “Company” refer to General Finance Corporation, a Delaware corporation (“GFN”), and its consolidated subsidiaries. These subsidiaries include GFN U.S. Australasia Holdings, Inc., a Delaware corporation (“GFN U.S.”); GFN North America Leasing Corporation , a Delaware corporation (“GFNNA Leasing”); GFN North America Corp., a Delaware corporation (“GFNNA”); GFN Manufacturing Corporation, a Delaware corporation (“GFNMC”) and its subsidiary, Southern Frac, LLC, a Texas limited liability company (collectively “Southern Frac”); Royal Wolf Holdings Limited, an Australian corporation publicly traded on the Australian Securities Exchange (“RWH”); and its Australian and New Zealand subsidiaries (collectively, “Royal Wolf”); Pac-Van, Inc., an Indiana corporation , and its Canadian subsidiary, PV Acquisition Corp., an Alberta corporation (collectively “Pac-Van”); and Lone Star Tank Rental Inc., a Delaware corporation (“Lone Star”).
Background and Overview
We incorporated in Delaware on October 14, 2005 and completed our initial public offering (“IPO”) in April 2006. Our primary long-term strategy and business plan are to acquire and operate rental services and specialty finance businesses in North and South America, Europe and the Asia-Pacific (or Pan-Pacific) area.
On April 7, 2014, we, through Lone Star (our indirect wholly-owned subsidiary), closed our acquisition of substantially all of the assets and the assumption of certain of the liabilities of the affiliated companies, Lone Star Tank Rental, LP, based in Kermit, Texas, and KHM Rentals, LLC, based in Kenedy, Texas. As part of our North American leasing operations, Lone Star leases portable liquid storage tank containers and containment products, as well as provides certain fluid management services, to the oil and gas industry in the Permian and Eagle Ford basins of Texas. Reference is made to Note 4 of Notes to Consolidated Financial Statements for more information regarding this significant acquisition.
We have two geographic areas that include four operating segments; the Asia-Pacific (or Pan-Pacific) area, consisting of Royal Wolf (which leases and sells storage containers, portable container buildings and freight containers in Australia and New Zealand) and North America, consisting of Pac-Van (which leases and sells storage, office and portable liquid storage tank containers, modular buildings and mobile offices), and Lone Star (see above) , which are combined to form our “North American Leasing” operations, and Southern Frac (which manufactures portable liquid storage tank containers).
We do business in three distinct, but related industries, mobile storage, modular space and liquid containment; which we collectively refer to as the “portable services industry.” Our two geographic leasing operations lease and sell their products through twenty customer service centers (“CSCs”) in Australia, eight CSCs in New Zealand, thirty-one branch locations in the United States and two branch locations in Canada. As of June 30, 2014, we had 275 and 627 employees and 40,378 and 21,219 lease fleet units in the Asia-Pacific area and North America, respectively.
Our products primarily consist of the following:
Containers
Storage Containers. Storage containers consist of new and used shipping containers that provide a flexible, low cost alternative to warehousing, while offering greater security, convenience and immediate accessibility. Our storage products include general purpose dry storage containers, refrigerated containers and specialty containers in a range of standard and modified sizes, designs and storage capacities. Specialty containers include blast-resistant units, hoarding units and hazardous-waste units. We also offer storage vans, also known as storage trailers or dock-height trailers.
Freight Containers. Freight containers are specifically designed for transport of products by road and rail. Our freight container products include curtain-side, refrigerated and bulk cargo containers, together with a range of standard and industry-specific dry freight containers. Freight containers are only offered in the Asia-Pacific area and we consider them part of the mobile storage industry on a consolidated basis.
Portable Container Buildings and Office Containers. Portable container buildings and office containers are either modified or specifically-manufactured containers that provide self-contained office space with maximum design flexibility. Office containers in the U.S. are oftentimes referred to as ground level offices (“GLOs”).
II-4
Table of Contents
Portable Liquid Storage Tank Containers. Portable liquid storage tank containers are often referred to as “frac tanks” or “frac tank containers” and are manufactured steel containers with fixed steel axles for transport and use in a variety of industries; including oil and gas exploration and field services, refinery, chemical and industrial plant maintenance, environmental remediation and field services, infrastructure building construction, marine services, pipeline construction and maintenance, tank terminals services, wastewater treatment and waste management and landfill services. While there are a number of different sizes of tanks currently used in the market place, we are currently focusing on the more common 500-barrel capacity containers. Our products typically include features such as guardrails, safety stairways, multiple entry ways and a sloped bottom for easy cleaning, an epoxy lining, and various feed and drain lines.
Other
Modular Buildings. Also known as manufactured buildings, modular buildings provide customers with additional space and are often modified to customer specifications. Modular buildings range in size from 1,000 to more than 30,000 square feet and may be highly customized.
Mobile Offices. Also known as trailers or construction trailers, mobile offices are re-locatable units with aluminum or wood exteriors on wood (or steel) frames on a steel carriage fitted with axles, allowing for an assortment of “add-ons” to provide comfortable and convenient temporary space solutions.
Results of Operations
Year Ended June 30, 2014 (“FY 2014”) Compared to Year Ended June 30, 2013 (“FY 2013”)
The following compares our FY 2014 results of operations with our FY 2013 results of operations.
Revenues. Revenues increased $41.6 million, or 17%, to $287.1 million in FY 2014 from $245.5 million in FY 2013. This consisted of an increase of $8.4 million, or 5%, in revenues at Royal Wolf, an $18.0 million increase, or 25%, in revenues at Pac-Van, $14.7 million of additional revenues generated by Lone Star, which we acquired on April 7, 2014; and an increase of $0.5 million, or 3%, in manufacturing revenues from Southern Frac. The translation effect of the average currency exchange rate, driven by the weakening in the Australian dollar relative to the U.S. dollar in FY 2014 versus FY 2013, significantly impacted the translation in FY 2014 of the total revenues at Royal Wolf when compared to FY 2013. In Australian dollars, total revenues at Royal Wolf increased by 18% in FY 2014 from FY 2013. The average currency exchange rate of one Australian dollar during FY 2014 was $0.91832 U.S. dollar compared to $1.02725 U.S. dollar during FY 2013.
The revenue increase at Royal Wolf was primarily in the transport, government and defense sectors, where revenues increased by $20.8 million in FY 2014 from FY 2013, but were offset somewhat by decreases totaling $10.3 million in the manufacturing, removals (moving) and storage, consumer, construction and retailer sectors. At Pac-Van, the revenue increase in FY 2014 from FY 2013 was due primarily to increases in the commercial, mining and energy, industrial, retail, construction and education sectors where revenues increased between the periods by an aggregate of $20.4 million, offset somewhat by the government, services and other sectors where revenues decreased by $2.4 million. Lone Star’s revenues of $14.7 million were entirely in the mining and energy sector.
Sales and leasing revenues represented 44% and 56% of total non-manufacturing revenues, respectively, in FY 2014 and 45% and 55% of total non-manufacturing revenues, respectively, in FY 2013.
Sales during FY 2014 amounted to $136.1 million, as compared to $122.1 million during FY 2013, representing an increase of $14.0 million, or 11%. This consisted of an $8.6 million increase, or 11%, in sales at Royal Wolf, an increase in manufacturing sales of $0.5 million, or 3%, at Southern Frac and an increase of $4.9 million, or 21%, at Pac-Van. Overall, non-manufacturing sales increased by $13.5 million, or 13%, in FY 2014 from FY 2013. The increase at Royal Wolf was comprised of an increase of $15.2 million ($4.8 million increase due to higher unit sales, $13.8 million increase due to average price increases and a $3.4 million decrease due to foreign exchange movements) in the national accounts group and a decrease of $6.6 million ($6.4 million decrease due to foreign exchange movements, $2.3 million decrease due to average price decreases and a $2.1 million increase due to higher unit sales) in the CSC operations. Sales in the national accounts group during FY 2014 included over $11.0 million (over AUS$12.0 million) to one customer, a freight logistics company that operates a national rail network. The operating margin of the over AUS$12.0 million sales contract with this customer was below 10%. At Pac-Van, the higher sales in FY 2014 versus FY 2013 were primarily due to increases in the commercial, industrial, mining and energy and education sectors, which increased by an aggregate of $6.2 million, and were offset somewhat by decreases in the services, construction and government sectors totaling $1.6 million. At Southern Frac, portable liquid storage tank container sales in FY 2014 consisted of 568 units sold at an average sales price of approximately $34,600 per unit versus 577 units sold at an average sales price of approximately $33,200 per unit during FY 2013. Stronger drilling activity in Texas, offset substantially by a greater proportion of intercompany sales to Pac-Van and Lone Star, in FY 2014 when compared to FY 2013, were the primary reasons for the increase in manufacturing revenues.
II-5
Table of Contents
Leasing revenues during FY 2014 totaled $151.0 million, as compared to $123.4 million during FY 2013, representing an increase of $27.6 million, or 22%. Leasing revenues increased by $27.8 million, or 57%, in our North American Leasing operations; consisting of an increase at Pac-Van of $13.1 million, or 27%, and Lone Star generated $14.7 million of leasing revenues during the fourth quarter of FY 2014. In the Asia-Pacific area, Royal Wolf’s leasing revenues decreased slightly by $0.2 million. In Australian dollars, however, FY 2014 leasing revenues at Royal Wolf actually increased by 12% from FY 2013.
At Royal Wolf, average utilization in the retail and the national accounts group operations were 85% and 75%, respectively, during FY 2014, an increase from 84% and 74% in FY 2013, respectively. The overall average utilization increased slightly in FY 2014 to 82.4% from 81.8% in FY 2013; and the average monthly lease rate of containers was AUS$177 in FY 2014 versus AUS$164 in FY 2013. Leasing revenues in FY 2014 increased over FY 2013 in local currency due primarily to the combination of higher monthly lease rates and the average monthly number of units on lease being more than 1,875 higher in FY 2014 as compared to FY 2013. We believe the primary reasons we are generally able to maintain high average utilization rates and increase our average units on lease and monthly rate between periods at Royal Wolf is the generally stable economy in the Asia-Pacific area and our position as the only company with a national footprint in the mobile storage industry in Australia and New Zealand. We regularly review each local market in which we do business to determine if local factors justify increases or decreases in lease rates and the effect these changes would have on utilization and revenues.
At Pac-Van, average utilization rates were 79%, 83%, 85%, 69% and 73% and average monthly lease rates were $111, $275, $872, $243 and $824 for storage containers, office containers, frac tank containers, mobile offices and modular units, respectively, during FY 2014; as compared to 82%, 82%, 87%, 67% and 75% and $105, $262, $965, $236 and $843 for storage containers, office containers, frac tank containers, mobile offices and modular units in FY 2013, respectively. The average composite utilization rate increased to 77% in FY 2014 from 76% in FY 2013, and the composite average monthly number of units on lease was nearly 3,200 higher in FY 2014 as compared to FY 2013. The strong utilization, higher average monthly number of units on lease and generally higher monthly lease rates resulted primarily from improved demand across most sectors, particularly in the mining and energy, commercial, construction, industrial and retail sectors, which increased by an aggregate of $14.2 million.
During the fourth quarter of FY 2014, Lone Star’s average utilization rate was 87% and its average monthly lease rate was over $1,900.
Cost of Sales. Cost of sales from our lease inventories and fleet (which is the cost related to our sales revenues only and exclusive of the line items discussed below) increased by $13.0 million from $75.1 million during FY 2013 to $88.1 million during FY 2014, as a result of the higher sales from our lease inventories and fleet discussed above. Our gross profit percentage from these non-manufacturing sales decreased to 24% in FY 2014 from 27% in FY 2013 due primarily to the lower margin on the sales to a Royal Wolf freight logistics customer, as discussed above. Cost of sales from our manufactured portable liquid storage tank containers totaled $14.9 million, or approximately $26,200 per unit, versus $17.9 million in FY 2013, or approximately $31,100 per unit. FY 2013 included additional costs of $145,000 due to the purchase price allocation effect at Southern Frac of carrying the opening inventory on October 1, 2012 at fair value. Overall, efficiencies gained from improved systems and processes, including lower material costs, substantially reduced our average cost per unit during FY 2014 from FY 2013.
Direct Costs of Leasing Operations and Selling and General Expenses. As a result of our enhanced business activity, direct costs of leasing operations and selling and general expenses increased in absolute dollars by $16.5 million ($7.7 million of which was incurred at Lone Star during the fourth quarter of FY 2014), from $101.2 million during FY 2013 to $117.7 million during FY 2014, but remained at 41% as a percentage of revenues.
Depreciation and Amortization. Depreciation and amortization increased by $4.6 million to $26.4 million in FY 2014 from $21.8 million in FY 2013, primarily as a result of our increasing investment in the lease fleet and business acquisitions.
Interest Expense. Interest expense of $12.0 million in FY 2014 was $1.0 million higher than the $11.0 million in FY 2013. This was primarily in North America where higher average borrowings in FY 2014 as compared to FY 2013 more than offset the lower weighted-average interest rate (which does not include the effect of the accretion of interest and amortization of deferred financing costs) of 4.1% in FY 2014 versus 4.8% in FY 2013. The weighted-average interest rate (which does not include the effect of translation, interest rate swap contracts and options and the amortization of deferred financing costs) in the Asia-Pacific area of 5.7% in FY 2014 decreased from 6.1% in FY 2013 and this, along with the weakening Australian dollar to the U.S. dollar in FY 2014 versus FY 2013, effectively offset the comparatively higher average borrowings between periods.
II-6
Table of Contents
Foreign Currency Exchange and Other. The currency exchange rate of one Australian dollar to one U.S. dollar was $1.0161 at June 30, 2012, $0.9146 at June 30, 2013 and $0.9439 at June 30, 2014. In FY 2013 and FY 2014, net unrealized and realized foreign exchange gains (losses) totaled $(272,000) and $229,000 and $217,000 and $(628,000), respectively.
Income Taxes. Our effective income tax rate was 43.4% in FY 2014 and 41.8% in FY 2013. The effective rate is greater than the U.S. federal rate primarily because of state income taxes from the filing of tax returns in multiple U.S. states and the effect of doing business and filing income tax returns in foreign jurisdictions. The increase in the effective income tax rate in FY 2014 when compared to FY 2013 was due primarily to the effect of the increase to the federal statutory rate used from 34% to 35% as a result of our increased domestic taxable income.
Preferred Stock Dividends. In FY 2014, we paid $3.5 million on our 9.00% Series C Cumulative Redeemable Perpetual Preferred Stock (the “Series C Preferred Stock”) issued in May 2013 (see Note 3 of Notes to Consolidated Financial Statements).
Noncontrolling Interests. Noncontrolling interests in the Royal Wolf and Southern Frac results of operations were approximately $7.8 million and $7.7 million in FY 2014 and FY 2013, respectively. The greater profitability at Royal Wolf in FY 2014 as compared to FY 2013 was substantially offset by the translation effect of the weaker Australian dollar to the U.S. dollar in FY 2014 versus FY 2013.
Net Income Attributable to Common Stockholders. Net income attributable to common stockholders of $3.9 million in FY 2014 was $0.4 million more than the $3.5 million in FY 2013 primarily as a result of greater operating profit in both North America and the Asia-Pacific area, offset somewhat by overall higher interest expense, a higher effective income tax rate and increased preferred stock dividend payments.
II-7
Table of Contents
Measures not in Accordance with Generally Accepted Accounting Principles in the United States (“U.S. GAAP”)
Earnings before interest, income taxes, impairment, depreciation and amortization and other non-operating costs and income (“EBITDA”) and adjusted EBITDA are supplemental measures of our performance that are not required by, or presented in accordance with, U.S. GAAP. These measures are not measurements of our financial performance under U.S. GAAP and should not be considered as alternatives to net income, income from operations or any other performance measures derived in accordance with U.S. GAAP or as an alternative to cash flow from operating, investing or financing activities as a measure of liquidity.
Adjusted EBITDA is a non-U.S. GAAP measure. We calculate adjusted EBITDA to eliminate the impact of certain items we do not consider to be indicative of the performance of our ongoing operations. You are encouraged to evaluate each adjustment and whether you consider each to be appropriate. In addition, in evaluating adjusted EBITDA, you should be aware that in the future, we may incur expenses similar to the expenses excluded from our presentation of adjusted EBITDA. Our presentation of adjusted EBITDA should not be construed as an inference that our future results will be unaffected by unusual or non-recurring items. We present adjusted EBITDA because we consider it to be an important supplemental measure of our performance and because we believe it is frequently used by securities analysts, investors and other interested parties in the evaluation of companies in our industry, many of which present EBITDA and a form of adjusted EBITDA when reporting their results. Adjusted EBITDA has limitations as an analytical tool, and should not be considered in isolation, or as a substitute for analysis of our results as reported under U.S. GAAP. Because of these limitations, adjusted EBITDA should not be considered as a measure of discretionary cash available to us to invest in the growth of our business or to reduce our indebtedness. We compensate for these limitations by relying primarily on our U.S. GAAP results and using adjusted EBITDA only supplementally. The following table shows our adjusted EBITDA and the reconciliation from net income (in thousands):
| Year Ended June 30, | ||||||||||||||||||||
| 2010 | 2011 | 2012 | 2013 | 2014 | ||||||||||||||||
| Net income (loss) |
$ | (8,956 | ) | $ | (8,858 | ) | $ | 8,742 | $ | 11,413 | $ | 15,149 | ||||||||
| Add — |
||||||||||||||||||||
| Provision (benefit) for income taxes |
(1,261 | ) | 2,958 | 5,360 | 8,195 | 11,620 | ||||||||||||||
| Foreign currency exchange loss (gain) and other |
(1,948 | ) | (4,125 | ) | (443 | ) | (1,028 | ) | 1,372 | |||||||||||
| Interest expense |
15,974 | 20,293 | 12,743 | 10,969 | 11,952 | |||||||||||||||
| Interest income |
(234 | ) | (487 | ) | (157 | ) | (58 | ) | (52 | ) | ||||||||||
| Depreciation and amortization |
19,619 | 19,165 | 18,924 | 22,241 | 27,127 | |||||||||||||||
| Impairment of goodwill |
7,633 | 5,858 | — | — | — | |||||||||||||||
| Share-based compensation expense |
629 | 693 | 901 | 1,316 | 1,938 | |||||||||||||||
| Shares of RWH capital stock issued at IPO to Royal Wolf board of directors and executive management |
— | 369 | — | — | — | |||||||||||||||
| Provision for shares of RWH capital stock to be purchased and awarded to Royal Wolf senior management team |
— | 802 | — | — | — | |||||||||||||||
| Loyalty, past performance and successful IPO bonus to Royal Wolf executive and senior management team |
— | 1,311 | — | — | — | |||||||||||||||
|
|
|
|
|
|
|
|
|
|
|
|||||||||||
| Adjusted EBITDA |
$ | 31,456 | $ | 37,979 | $ | 46,070 | $ | 53,048 | $ | 69,106 | ||||||||||
|
|
|
|
|
|
|
|
|
|
|
|||||||||||
Our business is capital intensive, so from an operating level we focus primarily on EBITDA and adjusted EBITDA to measure our results. These measures provide us with a means to track internally generated cash from which we can fund our interest expense and fleet growth objectives. In managing our business, we regularly compare our adjusted EBITDA margins on a monthly basis. As capital is invested in our established branch (or CSC) locations, we achieve higher adjusted EBITDA margins on that capital than we achieve on capital invested to establish a new branch, because our fixed costs are already in place in connection with the established branches. The fixed costs are those associated with yard and delivery equipment, as well as advertising, sales, marketing and office expenses. With a new market or branch, we must first fund and absorb the start-up costs for setting up the new branch facility, hiring and developing the management and sales team and developing our marketing and advertising programs. A new branch will have low adjusted EBITDA margins in its early years until the number of units on rent increases. Because of our higher operating margins on incremental lease revenue, which we realize on a branch-by-branch basis, when the branch achieves leasing revenues sufficient to cover the branch’s fixed costs, leasing revenues in excess of the break-even amount produce large increases in profitability and adjusted EBITDA margins. Conversely, absent significant growth in leasing revenues, the adjusted EBITDA margin at a branch will remain relatively flat on a period by period comparative basis.
II-8
Table of Contents
Liquidity and Financial Condition
Though we have raised capital at the corporate level to primarily assist in the funding of acquisitions and lease fleet expenditures, as well as for general purposes, our operating units substantially fund their operations through secured bank credit facilities that require compliance with various covenants. These covenants require our operating units to, among other things, maintain certain levels of interest or fixed charge coverage, EBITDA (as defined), utilization rate and overall leverage.
Leasing Operations
Prior to May 8, 2014, Royal Wolf had an approximately $121,000,000 (AUS$101,000,000 and NZ$29,200,000) senior credit facility with Australia and New Zealand Banking Group Limited (“ANZ”), which was secured by substantially all of the assets of our Australian and New Zealand subsidiaries (the “ANZ Credit Facility”). Effective May 8, 2014, Royal Wolf refinanced the ANZ Credit Facility to, among other things, increase the maximum borrowing capacity to $165,183,000 (AUS$175,000,000), add Commonwealth Bank of Australia (“CBA”) through a common terms deed arrangement with ANZ and generally improve the financial covenants (the “ANZ/CBA Credit Facility”). Under the common deed arrangement of the ANZ/CBA Credit Facility, ANZ’s proportionate share is $99,110,000 (AUS$105,000,000) and CBA’s proportionate share is $66,073,000 (AUS$70,000,000). The ANZ/CBA Credit Facility has $117,988,000 (AUS$125,000,000) maturing on July 31, 2017 (Facility A), and $47,195,000 (AUS$50,000,000) maturing on July 31, 2019 (Facility B).
Pac-Van had an $85,000,000 senior secured revolving credit facility with a syndicate led by PNC Bank, National Association (“PNC”) that included Wells Fargo and Union Bank, N.A. (the “PNC Credit Facility”). The PNC Credit Facility was scheduled to mature on January 16, 2013, but on September 7, 2012 Pac-Van entered into a new $120,000,000, five-year senior secured revolving credit facility with a syndicate led by Wells Fargo, that also included HSBC Bank USA, NA (“HSBC”), and the Private Bank and Trust Company (the “Wells Fargo Credit Facility”). On February 7, 2014, Pac-Van amended the Wells Fargo Credit Facility to, among other things, increase the maximum borrowing capacity from $120,000,000 to $200,000,000 and add two new lenders (OneWest Bank and Capital One) to the syndicate. Further, on April 7, 2014, in conjunction with the acquisition of Lone Star, and on May 23, 2014, the Wells Fargo Credit Facility was amended and restated to, among other things, include Lone Star as a co-borrower.
The Wells Fargo Credit Facility effectively not only finances our North American leasing operations, but also the funding requirements for the Series C Preferred Stock, the term loan with Credit Suisse AG, Singapore Branch and the public offering of unsecured senior notes (see below). The maximum amount of intercompany dividends that Pac-Van and Lone Star are allowed to pay in each fiscal year to GFN for the funding requirements of GFN’s senior and other debt and the Series C Preferred Stock are (a) the lesser of $5,000,000 for the Series C Preferred Stock or the amount equal to the dividend rate of the Series C Preferred Stock and its aggregate liquidation preference and the actual amount of dividends required to be paid to the Series C Preferred Stock; (b) the lesser of $3,125,000 for the term loan with Credit Suisse AG, Singapore Branch or the actual annual interest to be paid; and (c) $6,120,000 for the public offering of unsecured senior notes or the actual amount of annual interest required to be paid; provided that (i) the payment of such dividends does not cause a default or event of default; (ii) each of Pac-Van and Lone Star is solvent; (iii) excess availability, as defined, is $5,000,000 or more under the Wells Fargo Credit Facility; and (iv) the fixed charge coverage ratio, as defined, will be greater than 1.25 to 1.00 and the dividends are paid no earlier than ten business days prior to the date they are due.
Manufacturing Operations
Southern Frac has a senior secured credit facility with Wells Fargo (the “Wells Fargo SF Credit Facility”). The Wells Fargo SF Credit Facility, as amended, provides for (i) a senior secured revolving line of credit under which Southern Frac may borrow, subject to the terms of a borrowing base, as defined, up to $12,000,000 with a three-year maturity; (ii) a combined $860,000 equipment and capital expenditure term loan (the “Restated Equipment Term Loan”), which fully amortizes over 48 months commencing July 1, 2013; and (iii) a $1,500,000 term loan (the “Term Loan B”), which fully amortizes over 18 months, commencing May 1, 2013.
Corporate
On March 31, 2014, we entered into a $25,000,000 facility agreement with Credit Suisse AG, Singapore Branch (“Credit Suisse Term Loan”) as part of the financing for the acquisition of Lone Star and, on April 3, 2014, we borrowed the $25,000,000 available to it. The Credit Suisse Term Loan provides that the amount borrowed will bear interest at LIBOR plus 7.50% per year, will be payable quarterly, and that all principal and interest will mature two years from the date that we borrowed the $25,000,000. In addition, the Credit Suisse Term Loan is secured by a first ranking pledge over all shares of RWH owned by GFN U.S., requires a certain coverage maintenance ratio in U.S. dollars based on the value of the RWH shares and, among other things, that an amount equal to six-months interest be deposited in an interest reserve account pledged to secure repayment of all amounts borrowed.
II-9
Table of Contents
On June 18, 2014, we completed the sale of unsecured senior notes (the “Senior Notes”) in a public offering for an aggregate principal amount of $72,000,000, which represented 100% of the principal amount and included the underwriters’ full exercise of their over-allotment option of $9,000,000. Net proceeds were $69,069,000, after deducting underwriting discounts and offering costs of approximately $2,931,000. The Senior Notes were issued in minimum denominations of $25 and integral multiples of $25 in excess thereof and pursuant to the First Supplemental Indenture (the “First Supplemental Indenture”) dated as of June 18, 2014 by and between us and Wells Fargo, as trustee (the “Trustee”). The First Supplemental Indenture supplements the Indenture entered into by and between us and the Trustee dated as of June 18, 2014 (the “Base Indenture” and, together with the First Supplemental Indenture, the “Indenture”). The Senior Notes bear interest at the rate of 8.125% per annum, mature on July 31, 2021 and are not subject to any sinking fund. Interest on the Senior Notes is payable quarterly in arrears on January 31, April 30, July 31 and October 31, commencing on July 31, 2014. We used $68,600,000 of the net proceeds (plus an additional $4,000,000 of GFN corporate cash on hand) to reduce indebtedness at Pac-Van and Lone Star under the Wells Fargo Credit Facility, pursuant to the requirement that at least 80% of the gross proceeds, or $57,600,000, be used for that purpose in order to permit the payment of intercompany dividends by Pac-Van and Lone Star to GFN to fund the interest requirements of the Senior Notes.
The Senior Notes rank equally in right of payment with all of our existing and future unsecured senior debt and senior in right of payment to all of its existing and future subordinated debt. The Senior Notes are effectively subordinated to any of our existing and future secured debt, to the extent of the value of the assets securing such debt. The Senior Notes are structurally subordinated to all existing and future liabilities of our subsidiaries and are not guaranteed by any of our subsidiaries. We may, at our option, prior to July 31, 2017, redeem the Senior Notes in whole or in part upon the payment of 100% of the principal amount of the Senior Notes being redeemed plus any additional amount required by the Indenture. In addition, we may from time to time redeem up to 35% of the aggregate outstanding principal amount of the Senior Notes before July 31, 2017 with the net cash proceeds from certain equity offerings at a redemption price of 108.125% of the principal amount plus accrued and unpaid interest. If we sell certain of our assets or experience specific kinds of changes in control, as defined, we must offer to purchase the Senior Notes.
We may, at our option, at any time and from time to time, on or after July 31, 2017, redeem the Senior Notes in whole or in part. The Senior Notes will be redeemable at a redemption price initially equal to 106.094% of the principal amount of the Senior Notes (and which declines on each year on July 31) plus accrued and unpaid interest to the date of redemption. On and after any redemption date, interest will cease to accrue on the redeemed Senior Notes.
As of June 30, 2014, our required principal and other obligations payments for the years ending June 30, 2015 and the subsequent three fiscal years are as follows (in thousands):
| Year Ending June 30, | ||||||||||||||||
| 2015 | 2016 | 2017 | 2018 | |||||||||||||
| ANZ/CBA Credit Facility |
$ | — | $ | — | $ | — | $ | 111,270 | ||||||||
| Wells Fargo Credit Facility |
— | — | — | 81,483 | ||||||||||||
| Wells Fargo SF Credit Facility |
495 | 215 | 215 | — | ||||||||||||
| Credit Suisse Term Loan |
— | 25,000 | — | — | ||||||||||||
| Senior Notes |
— | — | — | — | ||||||||||||
| Other |
3,873 | 3,580 | 1,165 | 1,262 | ||||||||||||
|
|
|
|
|
|
|
|
|
|||||||||
| $ | 4,368 | $ | 28,795 | $ | 1,380 | $ | 194,015 | |||||||||
|
|
|
|
|
|
|
|
|
|||||||||
Reference is made to Note 5 of Notes to Consolidated Financial Statements for further discussion of our senior and other debt.
On May 17, 2013, we completed a public offering of 350,000 shares of the Series C Preferred Stock and on May 24, 2013, the underwriters exercised their overallotment option to purchase an additional 50,000 shares. Proceeds from the offering totaled $37,500, 000, after deducting the underwriting discount of $2,000,000 and offering costs of $500,000. Among other things, we used $36,000,000 of the net proceeds to reduce indebtedness at Pac-Van under the Wells Fargo Credit Facility (pursuant to the requirement that at least 80% of the gross proceeds, or $32,000,000, be used for that purpose) and $1,295,000 to redeem our Series A 12.5% Cumulative Preferred Stock (“Series A Preferred Stock”). With the satisfaction of the 80% gross proceeds requirement, Pac-Van is permitted to pay intercompany dividends to GFN to fund the dividend requirements of the Series C Preferred Stock (see above).
As of June 25, 2013, the expiration date of warrants issued by us in a rights offering on June 25, 2010, we received total net proceeds during FY 2013 of $8,154,000, of which $8,000,000 was used to reduce indebtedness at Pac-Van under the Wells Fargo Credit Facility.
II-10
Table of Contents
Reference is made to Note 3 of Notes to Consolidated Financial Statements for further discussion of our Series C Preferred Stock and other equity transactions.
We intend to continue utilizing our operating cash flow and net borrowing capacity primarily to expanding our container sale inventory and lease fleet through both capital expenditures and accretive acquisitions; as well as paying dividends on the Series C Preferred Stock, if and when declared by our Board of Directors.
We currently do not pay a dividend on our common stock and do not intend on doing so in the foreseeable future.
Cash Flow for FY 2014 Compared to FY 2013
Our business is capital intensive, and we acquire leasing assets before they generate revenues, cash flow and earnings. These leasing assets have long useful lives and require relatively minimal maintenance expenditures. Most of the capital we deploy into our leasing business historically has been used to expand our operations geographically, to increase the number of units available for lease at our branch and CSC locations and to add to the breadth of our product mix. Our operations have generally generated annual cash flow which would include, even in profitable periods, the deferral of income taxes caused by accelerated depreciation that is used for tax accounting.
As we discussed above, our principal source of capital for operations consists of funds available from the senior secured credit facilities at our operating units. We also finance a smaller portion of capital requirements through finance leases and lease-purchase contracts. Supplemental information pertaining to our consolidated sources and uses of cash is presented in the table below (in thousands):
| Year Ended June 30, | ||||||||
| 2013 | 2014 | |||||||
| Net cash provided by operating activities |
$ | 34,892 | $ | 51,548 | ||||
|
|
|
|
|
|||||
| Net cash used in investing activities |
$ | (69,710 | ) | $ | (163,585 | ) | ||
|
|
|
|
|
|||||
| Net cash provided by financing activities |
$ | 35,218 | $ | 112,909 | ||||
|
|
|
|
|
|||||
Operating activities. Our operations provided net cash flow of $51.5 million during FY 2014, an increase of $16.6 million from the $34.9 million of operating cash flow provided during FY 2013. Net income of $15.1 million in FY 2014 was $3.7 million higher than the net income of $11.4 million in FY 2013 and our operating cash flows increased by $3.4 million in FY 2014 from the management of operating assets and liabilities when compared to FY 2013. Operating cash flows in FY 2014 increased by $5.6 million over FY 2013 as a result of larger non-cash adjustments of depreciation and amortization (including amortization of deferred financing costs and accretion of interest). Depreciation, amortization and accretion of interest totaled $28.4 million in FY 2014 versus $22.8 million in FY 2013. In addition, net unrealized losses (gains) from foreign exchange and derivative instruments (see Note 6 of Notes to Consolidated Financial Statements), which affect operating results, but are non-cash add-backs for cash flow purposes, were $0.9 million in FY 2014 versus $(0.7) million in FY 2013; an increase of $1.6 million. In both periods, operating cash flows benefitted from the deferral of income taxes, which totaled $9.8 million in FY 2014 and $7.1 million in FY 2013. Historically, operating cash flows are typically enhanced by the deferral of most income taxes due to the rapid tax depreciation rate of our fixed assets and available net operating loss carryforwards. Additionally, in both FY 2014 and FY 2013, operating cash flows were reduced by gains on the sales of lease fleet of $7.2 million and $6.0 million, and enhanced by non-cash share-based compensation charges of $1.9 million and $1.3 million, respectively.
Investing Activities. Net cash used by investing activities was $163.6 million during FY 2014, as compared to $69.7 million during FY 2013, an increase use of cash of $93.9 million. Purchases of property, plant and equipment, or rolling stock, were $7.2 million in FY 2014, a decrease of $1.3 million from the $8.5 million in FY 2013; but net capital expenditures of lease fleet (purchases, net of proceeds from sales of lease fleet) were approximately $65.8 million in FY 2014 as compared to $47.6 million in FY 2013, an increase of $18.2 million. The increase in FY 2014 net capital expenditures from FY 2013 was due to primarily container lease fleet purchases of $44.3 million in FY 2014 in North America as compared to $24.6 million in FY 2013, an increase of $19.7 million; whereas net capital expenditures in the Pan Pacific totaled $21.5 million in FY 2014 versus $23.0 million in FY 2013, a decrease of $1.5 million. The amount of cash that we use during any period in investing activities is almost entirely within management’s discretion and we have no significant long-term contracts or other arrangements pursuant to which we may be required to purchase at a certain price or a minimum amount of goods or services. In FY 2014, we made seven business acquisitions (two in the Pan Pacific and five in North America) for cash totaling $90.7 million (see Note 4 of Notes to Consolidated Financial Statements), as compared to eight acquisitions (three in the Pan Pacific and five in North America) in FY 2013 for cash of $14.6 million.
II-11
Table of Contents
Financing Activities. Net cash provided by financing activities was $112.9 million during FY 2014, as compared to $35.2 million provided during FY 2013, an increase of $77.7 million. In FY 2014, in the Asia-Pacific area, we completely repaid the ANZ Credit Facility for $113.6 million and entered into the new ANZ/CBA Credit Facility; as compared to FY 2013 where, in North America, we fully repaid the PNC Credit Facility for $79.2 million (see “Liquidity and Financial Condition” above). In FY 2014, cash provided from financing activities included borrowings of $25.0 million from the Credit Suisse Term Loan, $72.0 million from the Senior Notes and $143.0 million on the existing credit facilities to primarily fund our increasing investment in the container lease fleet and business acquisitions. In FY 2013, cash provided from financing activities included net proceeds of $37.5 million from the successful public offering of our Series C Preferred Stock and $8.2 million from issuances of our common stock (as a result of exercises of warrants and options), of which $44.0 million of these proceeds were used to reduce indebtedness at Pac-Van and $1.3 million used to redeem our Series A Preferred Stock. We also incurred deferred financing costs of $4.3 million in FY 2014 and $1.5 million in FY 2013 in connection with the senior and other debt transactions discussed above. In FY 2014 we paid preferred stock dividends of $3.5 million, versus only $0.2 million if FY 2013, an increase of $3.3 million, due primarily to the issuance of our Series C Preferred Stock in May 2013; and in both FY 2014 and FY 2013, Royal Wolf paid capital stock dividends of $4.7 million to noncontrolling interests (see Note 3 of Notes to Consolidated Financial Statements).
Asset Management
Receivables and inventories were $61.5 million and $27.4 million at June 30, 2014 and $34.4 million and $31.9 million at June 30, 2013, respectively. At June 30, 2014, days sales outstanding (“DSO”) in trade receivables were 43 days and 67 days in the Asia-Pacific area and in our North American leasing operations, as compared to 44 days and 50 days at June 30, 2013, respectively. The higher DSO at June 30, 2014 from June 30, 2013 in our North American leasing operations was primarily due to the longer payment lag by our oil and gas customers, which is customary in the industry. Effective asset management is always a significant focus as we strive to apply appropriate credit and collection controls and maintain proper inventory levels to enhance cash flow and profitability.
The net book value of our total lease fleet increased to $396.6 million at June 30, 2014 from $290.2 million at June 30, 2013. At June 30, 2014, we had 61,597 units (20,056 units in retail operations in Australia, 10,610 units in national account group operations in Australia, 9,712 units in New Zealand, which are considered retail; and 21,219 units in North America) in our lease fleet, as compared 54,259 units (19,685 units in retail operations in Australia, 10,455 units in national account group operations in Australia, 9,043 units in New Zealand, which are considered retail; and 15,076 units in North America) at June 30, 2013. At those dates, 50,050 units (16,624 units in retail operations in Australia, 7,704 units in national account group operations in Australia, 8,892 units in New Zealand, which are considered retail; and 16,830 units in North America); and 42,262 units (16,054 units in retail operations in Australia, 6,756 units in national account group operations in Australia, 8,052 units in New Zealand, which are considered retail; and 11,400 units in North America) were on lease, respectively.
In the Asia-Pacific area, the lease fleet was comprised of 35,990 storage and freight containers and 4,388 portable building containers at June 30, 2014; and 35,284 storage and freight containers and 3,899 portable building containers at June 30, 2013. At those dates, units on lease were comprised of 29,800 storage and freight containers and 3,420 portable building containers; and 28,192 storage and freight containers and 2,670 portable building containers, respectively.
In North America, the lease fleet was comprised of 10,531 storage containers, 1,858 office containers (GLOs), 3,234 portable liquid storage tank containers, 4,591 mobile offices and 1,005 modular units at June 30, 2014; and 7,273 storage containers, 1,530 office containers (GLOs), 586 portable liquid storage tank containers, 4,703 mobile offices and 984 modular units at June 30, 2013. At those dates, units on lease were comprised of 8,150 storage containers, 1,572 office containers, 2,868 portable liquid storage tank containers, 3,462 mobile offices and 778 modular units; and 5,711 storage containers, 1,216 office containers, 524 portable liquid storage tank containers, 3,235 mobile offices and 714 modular units, respectively.
Off-Balance Sheet Arrangements
We do not maintain any off-balance sheet transactions, arrangements, obligations or other relationships with unconsolidated entities or others that are reasonably likely to have a material current or future effect on our financial condition, changes in financial condition, revenues or expenses, results of operations, liquidity, capital expenditures or capital resources.
Seasonality
Although demand from certain customer segments can be seasonal, our operations as a whole are not seasonal to any significant extent. We experience a reduction in sales volumes at Royal Wolf during Australia’s summer holiday break from mid-December to the end of January, followed by February being a short working day month. However, this
II-12
Table of Contents
reduction in sales typically is counterbalanced by the increased lease revenues derived from the removals or moving and storage industry, which experiences its seasonal peak of personnel relocations during this same summer holiday break. Demand from some of Pac-Van’s customers can be seasonal, such as in the construction industry, which tends to increase leasing activity in the first and fourth quarters; while customers in the retail industry tend to lease more units in the second quarter. Our business at Lone Star and Southern Frac, which is significantly derived from the oil and gas industry, may decline in our second quarter months of November and December and our third quarter months of January and February. These months may have lower activity in parts of the country where inclement weather may delay, or suspend, customer projects. The impact of these delays may be to decrease the number of frac tank containers on lease until companies are able to resume their projects when weather improves.
Impact of Inflation
We believe that inflation has not had a material effect on our business. However, during periods of rising prices and, in particular when the prices increase rapidly or to levels significantly higher than normal, we may incur significant increases in our operating costs and may not be able to pass price increases through to our customers in a timely manner, which could harm our future results of operations.
Critical Accounting Estimates
Our discussion and analysis of our financial condition and results of operations are based upon our consolidated financial statements, which have been prepared in accordance with U.S. GAAP. The preparation of these financial statements requires us to make estimates and judgments that affect the reported amounts of assets, liabilities, revenues and expenses. On an ongoing basis, we re-evaluate all of our estimates. We base our estimates on historical experience and on various other assumptions that are believed to be reasonable under the circumstances, the results of which form the basis for making judgments about the carrying values of assets and liabilities that are not readily apparent from other sources. Actual results may materially differ from these estimates under different assumptions or conditions as additional information becomes available in future periods. We believe the following are the more significant judgments and estimates used in the preparation of our consolidated financial statements.
We are required to estimate the collectability of our trade receivables. Accordingly, we maintain allowances for doubtful accounts for estimated losses that may result from the inability of our customers to make required payments. On a recurring basis, we evaluate a variety of factors in assessing the ultimate realization of these receivables, including the current credit-worthiness of our customers, days sales outstanding trends, a review of historical collection results and a review of specific past due receivables. If the financial condition of our customers were to deteriorate, resulting in an impairment of their ability to make payments, additional allowances may be required, resulting in decreased net income. To date, uncollectible accounts have been within the range of our expectations.
We lease and sell storage, building, office and portable liquid storage tank containers, modular buildings and mobile offices to our customers. Leases to customers generally qualify as operating leases unless there is a bargain purchase option at the end of the lease term. Revenue is recognized as earned in accordance with the lease terms established by the lease agreements and when collectability is reasonably assured. Revenue from sales of equipment is recognized upon delivery and when collectability is reasonably assured, while revenue from the sales of manufactured units are recognized when title and risk of loss transfers to the purchaser, generally upon shipment. Certain arrangements to sell units under long-term construction-type sales contracts are accounted for under the percentage of completion method. Under this method, income is recognized in proportion to the incurred costs to date under the contract to estimated total costs.
We have a fleet of storage, portable building, office and portable liquid storage tank containers, mobile offices, modular buildings and steps that we lease to customers under operating lease agreements with varying terms. The lease fleet (or lease or rental equipment) is recorded at cost and depreciated on the straight-line basis over the estimated useful life (5 — 20 years), after the date the units are put in service, down to their estimated residual values (up to 70% of cost). In our opinion, estimated residual values are at or below net realizable values. We periodically review these depreciation policies in light of various factors, including the practices of the larger competitors in the industry, and our own historical experience.
For the issuances of stock options, we follow the fair value provisions of Financial Accounting Standards Board (“FASB”) Accounting Standards Codification (“ASC”) Topic 718, Compensation — Stock Compensation. FASB ASC Topic 718 requires recognition of employee share-based compensation expense in the statements of income over the vesting period based on the fair value of the stock option at the grant date. The pricing model we use for determining fair values of the purchase option is the Black-Scholes Pricing Model. Valuations derived from this model are subject to ongoing internal and external verification and review. The model uses market-sourced inputs such as interest rates, market prices and volatilities. Selection of these inputs involves management’s judgment and may impact net income. In particular, prior to July 1, 2009, we used volatility rates based upon a sample of comparable companies in our industry
II-13
Table of Contents
and we now use a volatility rate based on the performance of our common stock, which yields a higher rate. In addition we use a risk-free interest rate, which is the rate on U.S. Treasury instruments, for a security with a maturity that approximates the estimated remaining expected term of the stock option.
We account for goodwill in accordance with FASB ASC Topic 350, Intangibles — Goodwill and Other. FASB ASC Topic 350 prohibits the amortization of goodwill and intangible assets with indefinite lives and requires these assets be reviewed for impairment when events or circumstances indicate these assets might be impaired. We operate two reportable segments that include four operating units (Royal Wolf, Pac-Van, Lone Star and Southern Frac) and our goodwill was allocated between these four reporting units. We performed an annual impairment test on goodwill at year end using the quantitative two-step process under FASB ASC Topic 350. The first step is a screen for potential impairment, while the second step measures the amount of the impairment, if any. Effective July 1, 2012, we adopted the new qualitative assessment now allowable under ASC Topic 350. It will no longer be required for us to calculate the fair value of a reporting unit unless a determination is made based on a qualitative assessment that it is more likely than not (i.e., greater than 50%) that the fair value of the reporting unit is less than its carrying amount. However, if we do determine that fair value is less than the carrying amount, the existing quantitative calculations in steps one and two under ASC Topic 350 continue to apply. Some factors we consider important in making this determination include (1) significant underperformance relative to historical, expected or projected future operating results; (2) significant changes in the manner of our use of the acquired assets or the strategy for our overall business; (3) significant changes during the period in our market capitalization relative to net book value; and (4) significant negative industry or general economic trends. If we did determine that fair value is likely less than the carrying amount, the quantitative two-step impairment test process discussed above would be applied. As of June 30, 2013 and 2014, we determined that it was not likely that the fair values of the goodwill of our operating units were less than their respective carrying amounts.
Intangible assets include those with indefinite (trademark and trade name) and finite (primarily customer base and lists, non-compete agreements and deferred financing costs) useful lives. Customer base and lists and non-compete agreements are amortized on the straight-line basis over the expected period of benefit which range from one to ten years. Costs to obtaining long-term financing are deferred and amortized over the term of the related debt using the straight-line method. Amortizing the deferred financing costs using the straight-line method does not produce significantly different results than that of the effective interest method. Prior to July 1, 2012, we reviewed intangibles (those assets resulting from acquisitions) annually for impairment using historical cash flows and other relevant facts and circumstances as the primary basis for its estimates of future cash flows. This process required the use of estimates and assumptions, which are subject to a high degree of judgment. Effective July 1, 2012, we adopted the new qualitative factors now allowable under ASC Topic 350. If we determine, based on a qualitative assessment, that it is more likely than not (i.e., greater than 50%) that fair value is not impaired, then no further testing is necessary. However, if we determine that fair value is less than the carrying amount, then the existing quantitative calculations under ASC Topic 350 continue to apply. As of June 30, 2013 and 2014, we determined that it was not likely that the fair values of intangible assets were less than their carrying amounts.
In preparing our consolidated financial statements, we recognize income taxes in each of the jurisdictions in which we operate. For each jurisdiction, we estimate the actual amount of taxes currently payable or receivable as well as deferred tax assets and liabilities attributable to temporary differences between the financial statement carrying amounts of existing assets and liabilities and their respective tax bases. Deferred income tax assets and liabilities are measured using enacted tax rates expected to apply to taxable income in the years in which these temporary differences are expected to be recovered or settled. The effect on deferred tax assets and liabilities of a change in tax rates is recognized in income in the period that includes the enactment date. A valuation allowance would be provided for those deferred tax assets for which it is more likely than not that the related benefits will not be realized. In determining the amount of the valuation allowance, we consider estimated future taxable income as well as feasible tax planning strategies in each jurisdiction. If we determine that we will not realize all or a portion of our deferred tax assets, we would increase our valuation allowance with a charge to income tax expense or offset goodwill if the deferred tax asset was acquired in a business combination. Conversely, if we determine that we will ultimately be able to realize all or a portion of the related benefits for which a valuation allowance has been provided, all or a portion of the related valuation allowance would be reduced with a credit to income tax expense except if the valuation allowance was created in conjunction with a tax asset in a business combination.
Reference is made to Note 2 of Notes to Consolidated Financial Statements for a further discussion of our significant accounting policies.
Impact of Recently Issued Accounting Pronouncements
Reference is made to Note 2 of Notes to Consolidated Financial Statements for a discussion of recently issued accounting pronouncements that could potentially impact us.
II-14
Table of Contents
Item 7A. Quantitative and Qualitative Disclosures about Market Risk
Market risk is the sensitivity of income to changes in interest rates, foreign exchanges and other market-driven rates or prices. Exposure to interest rates and currency risks arises in the normal course of our business and we may use derivative financial instruments to hedge exposure to fluctuations in foreign exchange rates and interest rates. We believe we have no material market risks to our operations, financial position or liquidity as a result of derivative activities, including forward-exchange contracts.
Reference is made to Note 6 of Notes to Consolidated Financial Statements for a discussion of financial instruments.
Item 8. Financial Statements and Supplementary Data
II-15
Table of Contents
Item 9. Changes in and Disagreements with Accountants on Accounting and Financial Disclosure
None.
Item 9A. Controls and Procedures
Conclusion Regarding the Effectiveness of Disclosure Controls and Procedures
We maintain disclosure controls and procedures that are designed to ensure that information required to be disclosed in reports we file and submit under the Securities Exchange Act of 1934, as amended (“Exchange Act”), is recorded, processed, summarized and reported within the time periods specified in accordance with SEC guidelines and that such information is communicated to management, including our Chief Executive Officer and Chief Financial Officer, to allow timely decisions regarding required disclosure based on the definition of “disclosure controls and procedures” in Rules 13a-15(e) and 15d-15(e) of the Exchange Act. In designing and evaluating our disclosure controls and procedures, we recognized that any controls and procedures, no matter how well designed and operated, can provide only reasonable assurance of achieving the desired control objectives and that our management necessarily was required to apply its judgment in evaluating the cost-benefit relationship of possible controls and procedures in reaching that level of reasonable assurance. Under the supervision and with the participation of our management, including our Chief Executive Officer and Chief Financial Officer, we evaluated the effectiveness of our disclosure controls and procedures, as required by Exchange Act Rule 13a-15(b), as of the end of the period covered by this report. Based on that evaluation, our Chief Executive Officer and Chief Financial Officer concluded that our disclosure controls and procedures were effective at the reasonable assurance level.
Management’s Report on Internal Control over Financial Reporting
Management is responsible for establishing and maintaining adequate internal control over financial reporting, as such term is defined in Exchange Act Rules 13a-15(f) and 15d-15(f). Internal control over financial reporting is a process designed to provide reasonable assurance regarding the reliability of financial reporting and the preparation of financial statements for external purposes in accordance with generally accepted accounting principles. Internal control over financial reporting includes those policies and procedures that (1) pertain to the maintenance of records that, in reasonable detail, accurately and fairly reflect the transactions and dispositions of assets; (2) provide reasonable assurance that transactions are recorded as necessary to permit preparation of financial statements in conformity with U.S. generally accepted accounting principles, and that receipts and expenditures are being made only in accordance with authorizations of management and directors; and (3) provide reasonable assurance regarding prevention or timely detection of unauthorized acquisition, use, or disposition of assets that could have a material effect on the financial statements.
A control system, no matter how well conceived and operated, can provide only reasonable, not absolute, assurance that the objectives of the controls system are met. Because of the inherent limitations in all controls systems, no evaluation of controls can provide absolute assurance that all control issues and instances of fraud, if any, have been detected. Under the supervision and with the participation of management, we assessed the effectiveness of our internal control over financial reporting based on the criteria in Internal Control — Integrated Framework issued by the Committee of Sponsoring Organizations of the Treadway Commission. Based on our evaluation under the criteria in Internal Control — Integrated Framework (1992), we concluded that our internal control over financial reporting was effective as of June 30, 2014. We excluded from our design and assessment of internal control over financial reporting Lone Star, which we acquired on April 7, 2014 (effective April 1, 2014), and whose total assets, net assets, total revenues and pretax income constituted approximately 18%, 31%, 5% and 13%, respectively, of our consolidated financial statement amounts as of and for the year ended June 30, 2014.
This Annual Report of Form 10-K does not include an attestation report of our independent registered public accounting firm regarding internal control over financial reporting. Management’s report was not subject to attestation by our independent registered public accounting firm pursuant to regulatory provisions that permit us to provide only management’s report in this Annual Report on Form 10-K.
Changes in Internal Control over Financial Reporting
There has not been any change in our internal control over financial reporting in connection with the evaluation required by Rule 13a-15(d) under the Exchange Act that occurred during the quarter ended June 30, 2014 that has materially affected, or is reasonably likely to materially affect, our internal control over financial reporting.
None.
II-16
Table of Contents
Certain information required by Part III is omitted from this Annual Report on Form 10-K because we will file a definitive Proxy Statement for the 2014 Annual Meeting of Stockholders, pursuant to Regulation 14A of the Securities Exchange Act of 1934 (the “Proxy Statement”), not later than 120 days after the end of the fiscal year covered by this Annual Report on Form 10-K and the applicable information included in the Proxy Statement is incorporated herein by reference.
Item 10. Directors, Executive Officers and Corporate Governance
Information concerning our executive officers is set forth in Item 1. of this Annual Report on Form 10-K under the caption “Executive Officers of the Registrant.”
We have adopted a code of ethics that applies to our directors, officers (including our principal executive and principal financial and accounting officers) and employees. A copy of these code of ethics is available free of charge on the “Corporate Governance” section of our website at www.generalfinance.com or by a written request addressed to the Corporate Secretary, General Finance Corporation, 39 East Union Street, Pasadena, California 91103. We intend to satisfy any disclosure requirement under Item 5.05 of Form 8-K regarding an amendment to, or waiver from, a provision of the code of ethics by posting such information on our web site at the address and location specified above.
Other information required by this Item is incorporated herein by reference to information included in the Proxy Statement.
Item 11. Executive Compensation
Information required by this Item is incorporated herein by reference to information included in the Proxy Statement.
Item 12. Security Ownership of Certain Beneficial Owners and Management and Related Stockholder Matters
Information required by this Item is incorporated herein by reference to information included in the Proxy Statement
Item 13. Certain Relationships and Related Transactions, and Director Independence
Information required by this Item is incorporated herein by reference to information included in the Proxy Statement
Item 14. Principal Accountant Fees and Services
Information required by this Item is incorporated herein by reference to information included in the Proxy Statement.
III-1
Table of Contents
Item 15. Exhibits and Financial Statement Schedules
(a) Financial Statements
(1) The financial statements required in this Annual Report on Form 10-K are included in Item 8. Financial Statements and Supplementary Data.
(2) Financial statement schedule:
Schedule I — Condensed Financial Information of Registrant (Parent Company Information)
All other supplemental schedules have been omitted since the required information is not present in amounts sufficient to require submission of the schedule, or because the required information is included in the consolidated financial statements or notes thereto.
(b) Exhibits
| Exhibit |
Exhibit Description | |
| 2.1 | Agreement and Plan of Merger dated July 28, 2008 among General Finance Corporation, GFN North America Corp., Mobile Office Acquisition Corp., Pac-Van, Inc., Ronald F. Valenta, Ronald L. Havner, Jr., D. E. Shaw Laminar Portfolios, L.L.C. and Kaiser Investments Limited (incorporated by reference to Exhibit 2.1 of Registrant’s Form 8-K filed July 28, 2008). | |
| 2.2 | Asset Purchase Agreement dated February 28, 2014 among KHM Rentals, LLC, Lone Star Tank Rental LP, certain other parties thereto and Lone Star Tank Rental Inc. (incorporated by reference to Registrant’s Form 8-K filed March 3, 2014). | |
| 3.1 | Amended and Restated Certificate of Incorporation filed April 4, 2006 (incorporated by reference to Exhibit 3.1 of Registrant’s Form S-1, File No. 333-129830). | |
| 3.2 | Amended and Restated Bylaws as of October 30, 2007 (incorporated by reference to Exhibit 3.2 of Registrant’s Form 10-Q for the quarter ended September 30, 2007). | |
| 3.3 | Certificate of Designation for the Series A Preferred Stock filed with the Delaware Secretary of State on December 3, 2008 (incorporated by reference to Registrant’s Form 8-K filed December 9, 2008). | |
| 3.4 | Certificate of Designation for the Series B Preferred Stock filed with the Delaware Secretary of State on December 3, 2008 (incorporated by reference to Registrant’s Form 8-K filed December 9, 2008). | |
| 3.5 | Corrected Amended and Restated Certificate of Designation for Series A 12.5% Cumulative Preferred Stock filed with the Delaware Secretary of State on May 10, 2013 (incorporated by reference to Registrant’s Form 8-K filed May 16, 2013). | |
| 3.6 | Certificate of Designation for the Series C Convertible Cumulative Preferred Stock filed with the Delaware Secretary of State on September 28, 2012 (incorporated by reference to Registrant’s Form 8-K filed October 4, 2012). | |
| 3.7 | Certificate of Elimination of Certificate of Designation, Preferences and Rights of Series C Convertible Cumulative Preferred Stock filed with the Delaware Secretary of State on April 2, 2013 (incorporated by reference to Registrant’s Form 8-K filed April 5, 2013). | |
| 3.8 | Certificate of Designations, Preferences and Rights of 9.00% Series C Cumulative Redeemable Perpetual Preferred Stock (incorporated by reference to Exhibit 3.7 of Registrant’s Form S-1, File No. 333-187687). | |
| 3.9 | Certificate of Elimination of Certificate of Designation, Preferences and Rights of Series A 12.5% Cumulative Preferred Stock (incorporated by reference to Registrant’s Form 8-K filed June 14, 2013). | |
| 4.1 | Form of Common Stock Certificate (incorporated by reference to Exhibit 4.2 of Registrant’s Form S-1, File No. 333-129830). | |
| 4.2 | Specimen 9.00% Series C Cumulative Redeemable Perpetual Preferred Stock Certificate (incorporated by reference to Exhibit 4.2 of Registrant’s Form S-1, File No. 333-187687). | |
| 4.3 | Senior Indenture dated as of June 18, 2014, between General Finance Corporation and Wells Fargo Bank, National Association, as trustee (incorporated by reference to Registrant’s Form 8-K filed June 18, 2014). | |
| 4.4 | First Supplemental Indenture dated as of June 18, 2014, between General Finance Corporation and Wells Fargo Bank, National Association, as trustee (incorporated by reference to Registrant’s Form 8-K filed June 18, 2014). | |
IV-1
Table of Contents
| Exhibit |
Exhibit Description | |
| 4.5 | Form of 8.125% Senior Note due 2021 (included as Exhibit A to Exhibit 4.2 above) (incorporated by reference to Registrant’s Form 8-K filed June 18, 2014). | |
| 10.1 | Employment Agreement dated February 11, 2009 between General Finance Corporation and Ronald F. Valenta 2006 (incorporated by reference to Exhibit 10.15 of Registrant’s Quarterly Report on Form 10-Q for the quarter ended December 31, 2008). | |
| 10.2 | 2009 Stock Incentive Plan (incorporated by reference to Appendix A of Registrant’s Definitive Proxy Statement filed October 19, 2009). | |
| 10.3 | Employment Agreement dated October 5, 2010 with Theodore M. Mourouzis (incorporated by reference to Registrant’s Form 8-K filed October 5, 2010). | |
| 10.4 | Underwriting Agreement dated May 13, 2011 (incorporated by reference to Registrant’s Form 8-K filed May 19, 2011). | |
| 10.5 | Voluntary Escrow Deed dated May 13, 2011 (incorporated by reference to Registrant’s Form 8-K filed May 19, 2011). | |
| 10.6 | Separation Agreement dated May 13, 2011 (incorporated by reference to Registrant’s Form 8-K filed May 19, 2011). | |
| 10.7 | Letter Agreement re Put Option dated May 13, 2011 (incorporated by reference to Registrant’s Form 8-K filed May 19, 2011). | |
| 10.8 | Payoff Letter dated May 13, 2011 (incorporated by reference to Registrant’s Form 8-K filed May 19, 2011). | |
| 10.9 | Credit and Security Agreement dated October 1, 2012 by and among Southern Frac, LLC, a Texas limited liability company (“Southern Frac”), GFN Manufacturing, GFN and Wells Fargo Bank, National Association (“Wells Fargo”) (incorporated by reference to Registrant’s Form 8-K filed October 4, 2012). | |
| 10.10 | Security Agreement dated October 1, 2012 by and between GFN Manufacturing and Wells Fargo”) (incorporated by reference to Registrant’s Form 8-K filed October 4, 2012). | |
| 10.11 | Continuing Guaranty dated October 1, 2012 by GFN Manufacturing in favor of Wells Fargo”) (incorporated by reference to Registrant’s Form 8-K filed October 4, 2012). | |
| 10.12 | Limited Continuing Guaranty dated October 1, 2012 by GFN in favor of Wells Fargo (incorporated by reference to Registrant’s Form 8-K filed October 4, 2012). | |
| 10.13 | Subordination Agreement dated October 1, 2012 by and between GFN Manufacturing and Wells Fargo (incorporated by reference to Registrant’s Form 8-K filed October 4, 2012). | |
| 10.14 | Subordination Agreement dated October 1, 2012 by and between GFN and Wells Fargo (incorporated by reference to Registrant’s Form 8-K filed October 4, 2012). | |
| 10.15 | First Amendment dated February 22, 2013 to Credit and Security Agreement by and among Southern Frac, LLC, GFN Manufacturing Corporation, General Finance Corporation and Wells Fargo Bank, National Association (incorporated by reference to Exhibit 10.1 of Registrant’s Quarterly Report on Form 10-Q for the quarter ended March 31, 2013). | |
| 10.16 | Amended and Restated Subordination Agreement dated February 22, 2013 by and between Shane Boston and Wells Fargo Bank, National Association (incorporated by reference to Exhibit 10.2 of Registrant’s Quarterly Report on Form 10-Q for the quarter ended March 31, 2013). | |
| 10.17 | Second Amendment dated June 26, 2013 among GFN, GFNMC, Southern Frac and Wells Fargo entered into that certain Credit and Security Agreement dated as of October 1, 2012 (incorporated by reference to Registrant’s Form 8-K filed June 28, 2013). | |
| 10.18 | Third Amendment dated September 5, 2013 among GFN, GFNMC, Southern Frac and Wells Fargo Bank, NA to that certain Credit and Security Agreement dated as of October 1, 2012 (incorporated by reference to Registrant’s Form 8-K filed September 10, 2013). | |
| 10.19 | Facility Agreement dated March 31, 2014 among General Finance Corporation, GFN U.S. Australasia Holdings, Inc. and Credit Suisse AG, Singapore Branch (incorporated by reference to Registrant’s Form 8-K filed April 4, 2014). | |
| 10.20 | Amended and Restated Asset Purchase Agreement dated as April 4, 2014 by and among KHM Rentals, LLC, Lone Star Tank Rental L.P., the Principals listed in Exhibit A attached hereto and Lone Star Tank Rental Inc. (incorporated by reference to Registrant’s Form 8-K filed April 8, 2014). | |
| 10.21 | Amended and Restated Credit Agreement dated April 7, 2014 by and among Wells Fargo Bank, National Association, HSBC Bank USA, N.A., certain other lenders parties thereto, Pac-Van, Inc., and Lone Star Tank Rental Inc. (incorporated by reference to Registrant’s Form 8-K filed April 8, 2014). | |
IV-2
Table of Contents
| Exhibit |
Exhibit Description | |
| 10.22 | Stockholders Agreement dated April 7, 2014 by and among General Finance Corporation and the stockholders of General Finance Corporation parties thereto (incorporated by reference to Registrant’s Form 8-K filed April 8, 2014). | |
| 10.23 | Pledge Agreement dated April 7, 2014 by and among Bobby Herricks, Justin Herricks, General Finance Corporation and Lone Star Tank Rental Inc. (incorporated by reference to Registrant’s Form 8-K filed April 8, 2014). | |
| 10.24 | Non-Negotiable Promissory Note dated April 7, 2014 in the original principal amount of $5,000,000 by Lone Star Inc. held by KHM Rentals, LLC and Lone Star Tank Rental, L.P. (incorporated by reference to Registrant’s Form 8-K filed April 8, 2014). | |
| 10.25 | Continuing Guaranty dated April 7, 2014 of GFN North America Corp. in favor of KHM Rentals, LLC and Lone Star Tank Rental, L.P. (incorporated by reference to Registrant’s Form 8-K filed April 8, 2014). | |
| 10.26 | ANZ Multicurrency Facility Agreement dated May 8, 2014 among Royal Wolf Trading Australia Pty Limited (“Royal Wolf Australia”), Royalwolf Trading New Zealand Limited (“Royal Wolf New Zealand”), Australia and New Zealand Banking Group Limited (“ANZ”) and ANZ Bank New Zealand Limited (“ANZ New Zealand”) (incorporated by reference to Registrant’s Form 8-K filed April 8, 2014) (incorporated by reference to Registrant’s Form 8-K filed May 12, 2014). | |
| 10.27 | CBA Multicurrency Facility Agreement dated May 8, 2014 among Royal Wolf Australia, Royal Wolf New Zealand and Commonwealth Bank of Australia (“CBA”) (incorporated by reference to Registrant’s Form 8-K filed May 12, 2014). | |
| 10.28 | Deed Poll dated May 7, 2014 entered into among ANZ, ANZ New Zealand, CBA, Royal Wolf Australia and Royal Wolf New Zealand (incorporated by reference to Registrant’s Form 8-K filed May 12, 2014). | |
| 10.29 | Amendment No. 1 among Pac-Van, Lone Star, Wells Fargo Bank, National Association, HSBC Bank USA, NA and Capital One Business Credit Corp. (incorporated by reference to Registrant’s Form 8-K filed May 29, 2014). | |
| 10.30 | Employment Agreement dated May 30, 2014 between Royal Wolf Trading Australia Pty Limited and Robert Allan (incorporated by reference to Registrant’s Form 8-K filed June 4, 2014) | |
| 10.31 | Fourth Amendment dated June 10, 2014 among GFN, GFNMC, Southern Frac and Wells Fargo entered into that certain Credit and Security Agreement dated as of October 1, 2012 (incorporated by reference to Registrant’s Form 8-K filed June 11, 2014). | |
| 10.32 | Limited Continuing Guaranty (incorporated by reference to Registrant’s Form 8-K filed June 11, 2014). | |
| 10.33 | Underwriting Agreement dated June 11, 2014 between Sterne, Agee & Leach, Inc., as representative of the several underwriters, and General Finance Corporation (incorporated by reference to Registrant’s Form 8-K filed June 16, 2014). | |
| 21.1 | Subsidiaries of General Finance Corporation (a) | |
| 23.1 | Consent of Independent Registered Public Accounting Firm (a) | |
| 31.1 | Certification of Chief Executive Officer Pursuant to SEC Rule 13a-14(a)/15d-14 (a) | |
| 31.2 | Certification of Chief Financial Officer Pursuant to SEC Rule 13a-14(a)/15d-14 (a) | |
| 32.1 | Certification of Chief Executive Officer Pursuant to 18 U.S.C. §1350 (a) | |
| 32.2 | Certification of Chief Financial Officer Pursuant to 18 U.S.C. §1350(a) | |
| 101 | The following materials from the Registrant’s Annual Report on Form 10-K for the year ended June 30, 2014, formatted in XBRL (eXtensible Business Reporting Language): (i) the Consolidated Balance Sheets, (ii) the Consolidated Statements of Operations, (iii) the Consolidated Statements of Comprehensive Income/Loss, (iv) the Consolidated Statements of Equity, (v) the Consolidated Statements of Cash Flows, (vi) Notes to Consolidated Financial Statements and (vii) Financial Statement Schedule I. | |
| (a) | Filed herewith. |
IV-3
Table of Contents
Pursuant to the requirements of Section 13 or 15(d) of the Securities Exchange Act of 1934, the registrant has duly caused this report to be signed on its behalf by the undersigned, thereunto duly authorized.
| General Finance Corporation | ||||
| By: | /s/ Ronald F. Valenta | September 12, 2014 | ||
| Name: Ronald F. Valenta | ||||
| Title: Chief Executive Officer | ||||
Pursuant to the requirements of the Securities Exchange Act of 1934, this report has been signed below by the following persons on behalf of the registrant and in the capacities and on the dates indicated:
| Signature |
Title |
Date | ||
| /s/ Ronald F. Valenta Ronald F. Valenta |
Chief Executive Officer and Chairman of the Board (Principal Executive Officer) | September 12, 2014 | ||
| /s/ Charles E. Barrantes Charles E. Barrantes |
Executive Vice President and Chief Financial Officer (Principal Accounting and Financial Officer) | September 12, 2014 | ||
| /s/ James B. Roszak James B. Roszak |
Lead Independent Director | September 12, 2014 | ||
| /s/ David M. Connell David M. Connell |
Director | September 12, 2014 | ||
| /s/ Manuel Marrero Manuel Marrero |
Director | September 12, 2014 | ||
| /s/ Susan L. Harris Susan L. Harris |
Director | September 12, 2014 | ||
| /s/ Larry D. Tashjian Larry D. Tashjian |
Director | September 12, 2014 | ||
SIG
Table of Contents
REPORT OF INDEPENDENT REGISTERED PUBLIC ACCOUNTING FIRM
To the Board of Directors and Stockholders
General Finance Corporation
We have audited the accompanying consolidated balance sheets of General Finance Corporation and Subsidiaries as of June 30, 2014 and 2013, and the related consolidated statements of operations, comprehensive income/loss, equity and cash flows for the years then ended. In connection with our audits of the consolidated financial statements, we have also audited the financial statement schedule listed in Item 15(a) of this Form 10-K. These consolidated financial statements and financial statement schedule are the responsibility of the Company’s management. Our responsibility is to express an opinion on these consolidated financial statements and financial statement schedule based on our audits.
We conducted our audits in accordance with the standards of the Public Company Accounting Oversight Board (United States). Those standards require that we plan and perform the audit to obtain reasonable assurance about whether the financial statements are free of material misstatement. The Company is not required to have, nor were we engaged to perform, an audit of its internal control over financial reporting. Our audit included consideration of internal control over financial reporting as a basis for designing audit procedures that are appropriate in the circumstances, but not for the purpose of expressing an opinion on the effectiveness of the Company’s internal control over financial reporting. Accordingly, we express no such opinion. An audit includes examining, on a test basis, evidence supporting the amounts and disclosures in the financial statements. An audit also includes assessing the accounting principles used and significant estimates made by management, as well as evaluating the overall financial statement presentation. We believe that our audits provide a reasonable basis for our opinion.
In our opinion, the consolidated financial statements referred to above present fairly, in all material respects, the consolidated financial position of the Company as of June 30, 2014 and 2013, and the consolidated results of their operations and their cash flows for the years then ended, in conformity with U.S. generally accepted accounting principles. Also, in our opinion, the related financial statement schedule, when considered in relation to the basic financial statements taken as a whole, presents fairly, in all material respects, the information set forth therein.
/s/ Crowe Horwath LLP
Sherman Oaks, California
September 12, 2014
F-1
Table of Contents
GENERAL FINANCE CORPORATION AND SUBSIDIARIES
CONSOLIDATED BALANCE SHEETS
(In thousands, except share and per share data)
| June 30, 2013 | June 30, 2014 | |||||||
| Assets |
||||||||
| Cash and cash equivalents |
$ | 6,278 | $ | 5,846 | ||||
| Trade and other receivables, net of allowance for doubtful accounts of $2,275 and $3,848 at June 30, 2013 and 2014, respectively |
34,360 | 61,474 | ||||||
| Inventories |
31,858 | 27,402 | ||||||
| Prepaid expenses and other |
5,571 | 9,919 | ||||||
| Property, plant and equipment, net |
19,840 | 30,614 | ||||||
| Lease fleet, net |
290,165 | 396,552 | ||||||
| Goodwill |
68,692 | 93,166 | ||||||
| Other intangible assets, net |
16,402 | 43,516 | ||||||
|
|
|
|
|
|||||
| Total assets |
$ | 473,166 | $ | 668,489 | ||||
|
|
|
|
|
|||||
| Liabilities |
||||||||
| Trade payables and accrued liabilities |
$ | 32,238 | $ | 53,838 | ||||
| Income taxes payable |
496 | 1,136 | ||||||
| Unearned revenue and advance payments |
15,764 | 14,480 | ||||||
| Senior and other debt |
162,951 | 302,877 | ||||||
| Deferred tax liabilities |
27,576 | 38,273 | ||||||
|
|
|
|
|
|||||
| Total liabilities |
239,025 | 410,604 | ||||||
|
|
|
|
|
|||||
| Commitments and contingencies (Note 10) |
— | — | ||||||
| Equity |
||||||||
| Cumulative preferred stock, $.0001 par value: 1,000,000 shares authorized; 400,100 shares issued and outstanding (in series) and liquidation value of $40,542 and $40,722 at June 30, 2013 and 2014, respectively |
40,100 | 40,100 | ||||||
| Common stock, $.0001 par value: 100,000,000 shares authorized; 24,330,257 and 25,657,257 shares issued and outstanding at June 30, 2013 and 2014, respectively |
2 | 3 | ||||||
| Additional paid-in capital |
120,146 | 128,030 | ||||||
| Accumulated other comprehensive income (loss) |
(906 | ) | 1,915 | |||||
| Accumulated deficit |
(19,179 | ) | (11,786 | ) | ||||
|
|
|
|
|
|||||
| Total General Finance Corporation stockholders’ equity |
140,163 | 158,262 | ||||||
| Equity of noncontrolling interests |
93,978 | 99,623 | ||||||
|
|
|
|
|
|||||
| Total equity |
234,141 | 257,885 | ||||||
|
|
|
|
|
|||||
| Total liabilities and equity |
$ | 473,166 | $ | 668,489 | ||||
|
|
|
|
|
|||||
The accompanying notes are an integral part of these consolidated financial statements.
F-2
Table of Contents
GENERAL FINANCE CORPORATION AND SUBSIDIARIES
CONSOLIDATED STATEMENTS OF OPERATIONS
(In thousands, except share and per share data)
| Year Ended June 30, | ||||||||
| 2013 | 2014 | |||||||
| Revenues |
||||||||
| Sales: |
||||||||
| Lease inventories and fleet |
$ | 103,003 | $ | 116,448 | ||||
| Manufactured units |
19,140 | 19,647 | ||||||
|
|
|
|
|
|||||
| 122,143 | 136,095 | |||||||
| Leasing |
123,400 | 151,010 | ||||||
|
|
|
|
|
|||||
| 245,543 | 287,105 | |||||||
|
|
|
|
|
|||||
| Costs and expenses |
||||||||
| Cost of Sales: |
||||||||
| Lease inventories and fleet (exclusive of the items shown separately below) |
75,135 | 88,139 | ||||||
| Manufactured units |
17,933 | 14,864 | ||||||
| Direct costs of leasing operations |
46,755 | 55,078 | ||||||
| Selling and general expenses |
54,418 | 62,612 | ||||||
| Depreciation and amortization |
21,811 | 26,371 | ||||||
|
|
|
|
|
|||||
| Operating income |
29,491 | 40,041 | ||||||
| Interest income |
58 | 52 | ||||||
| Interest expense (includes ineffective portion of cash flow hedge reclassifications from AOCI of an unrealized gain (loss) of $229 and $(219) in 2013 and 2014, respectively) |
(10,969 | ) | (11,952 | ) | ||||
| Foreign currency exchange gain (loss) and other |
1,028 | (1,372 | ) | |||||
|
|
|
|
|
|||||
| (9,883 | ) | (13,272 | ) | |||||
|
|
|
|
|
|||||
| Income before provision for income taxes |
19,608 | 26,769 | ||||||
| Provision for income taxes (includes provision (benefit) from AOCI reclassifications of $96 and $(95) in 2013 and 2014, respectively) |
8,195 | 11,620 | ||||||
|
|
|
|
|
|||||
| Net income |
11,413 | 15,149 | ||||||
| Preferred stock dividends |
(153 | ) | (3,489 | ) | ||||
| Noncontrolling interest |
(7,715 | ) | (7,756 | ) | ||||
|
|
|
|
|
|||||
| Net income attributable to common stockholders |
$ | 3,545 | $ | 3,904 | ||||
|
|
|
|
|
|||||
| Net income per common share: |
||||||||
| Basic |
$ | 0.16 | $ | 0.16 | ||||
| Diluted |
0.16 | 0.15 | ||||||
|
|
|
|
|
|||||
| Weighted average shares outstanding: |
||||||||
| Basic |
22,160,101 | 24,631,284 | ||||||
| Diluted |
22,633,702 | 25,643,565 | ||||||
|
|
|
|
|
|||||
The accompanying notes are an integral part of these consolidated financial statements.
F-3
Table of Contents
GENERAL FINANCE CORPORATION AND SUBSIDIARIES
CONSOLIDATED STATEMENTS OF COMPREHENSIVE INCOME/LOSS
(In thousands, except share and per share data)
| Year Ended June 30, | ||||||||
| 2013 | 2014 | |||||||
| Net income |
$ | 11,413 | $ | 15,149 | ||||
| Other comprehensive income (loss): |
||||||||
| Fair value change in derivative, net of ineffective portion of cash flow hedge reclassifications to the statement of operations of an unrealized gain (loss) of $229 and $(219) in 2013 and 2014, respectively (which includes reclassifications to the statement of operations of the related income tax provision (benefit) of $96 and $(95) in 2013 and 2014, respectively); and net of income tax provision (benefit) of $13 and $(40) in 2013 and 2014, respectively |
31 | (1 | ) | |||||
| Cumulative translation adjustment |
(13,373 | ) | 5,908 | |||||
|
|
|
|
|
|||||
| Total comprehensive income (loss) |
(1,929 | ) | 21,056 | |||||
| Allocated to noncontrolling interests |
(1,088 | ) | (10,842 | ) | ||||
|
|
|
|
|
|||||
| Comprehensive income allocable to General Finance Corporation stockholders |
$ | (3,017 | ) | $ | 10,214 | |||
|
|
|
|
|
|||||
The accompanying notes are an integral part of these consolidated financial statements.
F-4
Table of Contents
GENERAL FINANCE CORPORATION AND SUBSIDIARIES
CONSOLIDATED STATEMENTS OF EQUITY
(In thousands, except share data)
| Cumulative Preferred Stock |
Common Stock |
Additional Paid-In Capital |
Accumulated Other Comprehensive Income (Loss) |
Retained Earnings (Accumulated Deficit) |
Total General Finance Corporation Stockholders’ Equity |
Equity of Noncontrolling Interests |
Total Equity |
|||||||||||||||||||||||||
| Balance at July 1, 2012 |
$ | 1,395 | $ | 2 | $ | 112,865 | $ | 5,809 | $ | (22,877 | ) | $ | 97,194 | $ | 96,803 | $ | 193,997 | |||||||||||||||
| Share-based compensation |
— | — | 1,022 | — | — | 1,022 | 294 | 1,316 | ||||||||||||||||||||||||
| Preferred stock dividends |
— | — | (153 | ) | — | — | (153 | ) | — | (153 | ) | |||||||||||||||||||||
| Dividends on capital stock by subsidiary |
— | — | — | — | — | — | (4,678 | ) | (4,678 | ) | ||||||||||||||||||||||
| Purchases of subsidiary capital stock |
— | — | — | — | — | — | (418 | ) | (418 | ) | ||||||||||||||||||||||
| Noncontrolling interest at acquisition of Southern Frac |
— | — | — | — | — | — | 889 | 889 | ||||||||||||||||||||||||
| Issuance of 2,045,292 shares of common stock on exercises of stock options and warrants |
— | — | 8,162 | — | — | 8,162 | — | 8,162 | ||||||||||||||||||||||||
| Issuance of 750 shares of cumulative preferred stock |
750 | — | — | — | — | 750 | — | 750 | ||||||||||||||||||||||||
| Conversion of 750 shares of cumulative preferred stock to 150,000 shares of common stock |
(750 | ) | — | 750 | — | — | — | — | — | |||||||||||||||||||||||
| Redemption of 25,900 shares of cumulative preferred stock |
(1,295 | ) | — | — | — | — | (1,295 | ) | — | (1,295 | ) | |||||||||||||||||||||
| Issuance of 400,000 shares of redeemable perpetual preferred stock, net of offering expenses |
40,000 | — | (2,500 | ) | — | — | 37,500 | — | 37,500 | |||||||||||||||||||||||
| Grant of 115,000 shares of restricted stock |
— | — | — | — | — | — | — | — | ||||||||||||||||||||||||
| Net income |
— | — | — | — | 3,698 | 3,698 | 7,715 | 11,413 | ||||||||||||||||||||||||
| Fair value change in derivative, net of related tax effect |
— | — | — | 16 | — | 16 | 15 | 31 | ||||||||||||||||||||||||
| Cumulative translation adjustment |
— | — | — | (6,731 | ) | — | (6,731 | ) | (6,642 | ) | (13,373 | ) | ||||||||||||||||||||
|
|
|
|
|
|
|
|||||||||||||||||||||||||||
| Total comprehensive income |
— | — | — | — | — | (3,017 | ) | 1,088 | (1,929 | ) | ||||||||||||||||||||||
|
|
|
|
|
|
|
|
|
|
|
|
|
|
|
|
|
|||||||||||||||||
| Balance at June 30, 2013 |
40,100 | 2 | 120,146 | (906 | ) | (19,179 | ) | 140,163 | 93,978 | 234,141 | ||||||||||||||||||||||
| Share-based compensation |
— | — | 1,501 | — | — | 1,501 | 437 | 1,938 | ||||||||||||||||||||||||
| Preferred stock dividends |
— | — | (3,489 | ) | — | — | (3,489 | ) | — | (3,489 | ) | |||||||||||||||||||||
| Dividends on capital stock by subsidiary |
— | — | — | — | — | — | (4,660 | ) | (4,660 | ) | ||||||||||||||||||||||
| Purchases of subsidiary capital stock |
— | — | — | — | — | — | (974 | ) | (974 | ) | ||||||||||||||||||||||
| Issuance of 1,230,012 shares of common stock at acquisition of Lone Star |
— | 1 | 9,864 | — | — | 9,865 | — | 9,865 | ||||||||||||||||||||||||
| Issuance of 6,668 shares of common stock |
— | — | 8 | — | — | 8 | — | 8 | ||||||||||||||||||||||||
| Grant of 90,320 shares of restricted stock |
— | — | — | — | — | — | — | — | ||||||||||||||||||||||||
| Net income |
— | — | — | — | 7,393 | 7,393 | 7,756 | 15,149 | ||||||||||||||||||||||||
| Fair value change in derivative, net of related tax effect |
— | — | — | (1 | ) | — | (1 | ) | — | (1 | ) | |||||||||||||||||||||
| Cumulative translation adjustment |
— | — | — | 2,822 | — | 2,822 | 3,086 | 5,908 | ||||||||||||||||||||||||
|
|
|
|
|
|
|
|||||||||||||||||||||||||||
| Total comprehensive income |
— | — | — | — | — | 10,214 | 10,842 | 21,056 | ||||||||||||||||||||||||
|
|
|
|
|
|
|
|
|
|
|
|
|
|
|
|
|
|||||||||||||||||
| Balance at June 30, 2014 |
$ | 40,100 | $ | 3 | $ | 128,030 | $ | 1,915 | $ | (11,786 | ) | $ | 158,262 | $ | 99,623 | $ | 257,885 | |||||||||||||||
|
|
|
|
|
|
|
|
|
|
|
|
|
|
|
|
|
|||||||||||||||||
The accompanying notes are an integral part of these consolidated financial statements.
F-5
Table of Contents
GENERAL FINANCE CORPORATION AND SUBSIDIARIES
CONSOLIDATED STATEMENTS OF CASH FLOWS
(In thousands)
| Year Ended June 30, |
||||||||
| 2013 | 2014 | |||||||
| Cash flows from operating activities: |
||||||||
| Net income |
$ | 11,413 | $ | 15,149 | ||||
| Adjustments to reconcile net income to cash flows from operating activities: |
||||||||
| Gain on sales and disposals of property, plant and equipment |
(115 | ) | (45 | ) | ||||
| Gain on sales of lease fleet |
(5,991 | ) | (7,200 | ) | ||||
| Gain on bargain purchase of businesses |
(160 | ) | — | |||||
| Unrealized foreign exchange loss (gain) |
272 | (217 | ) | |||||
| Unrealized loss (gain) on forward exchange contracts |
(820 | ) | 939 | |||||
| Unrealized loss (gain) on interest rate swaps and options |
(149 | ) | 219 | |||||
| Depreciation and amortization |
22,241 | 27,127 | ||||||
| Amortization of deferred financing costs |
751 | 544 | ||||||
| Accretion of interest |
(176 | ) | 721 | |||||
| Share-based compensation expense |
1,316 | 1,938 | ||||||
| Deferred income taxes |
7,086 | 9,772 | ||||||
| Changes in operating assets and liabilities: |
||||||||
| Trade and other receivables, net |
3,100 | (16,807 | ) | |||||
| Inventories |
1,889 | 14,228 | ||||||
| Prepaid expenses and other |
(2,490 | ) | (2,923 | ) | ||||
| Trade payables, accrued liabilities and unearned revenues |
(3,329 | ) | 7,491 | |||||
| Income taxes |
54 | 612 | ||||||
|
|
|
|
|
|||||
| Net cash provided by operating activities |
34,892 | 51,548 | ||||||
|
|
|
|
|
|||||
| Cash flows from investing activities: |
||||||||
| Business acquisitions, net of cash acquired |
(14,649 | ) | (90,695 | ) | ||||
| Release of restrictions on cash |
1,000 | — | ||||||
| Proceeds from sales of property, plant and equipment |
242 | 247 | ||||||
| Purchases of property, plant and equipment |
(8,523 | ) | (7,154 | ) | ||||
| Proceeds from sales of lease fleet |
28,030 | 28,616 | ||||||
| Purchases of lease fleet |
(75,591 | ) | (94,356 | ) | ||||
| Other intangible assets |
(219 | ) | (243 | ) | ||||
|
|
|
|
|
|||||
| Net cash used in investing activities |
(69,710 | ) | (163,585 | ) | ||||
|
|
|
|
|
|||||
| Cash flows from financing activities: |
||||||||
| Repayments of equipment financing activities |
(290 | ) | (74 | ) | ||||
| Repayment of senior credit facility and subordinated note |
(79,175 | ) | (113,633 | ) | ||||
| Proceeds from senior and other debt borrowings, net |
77,095 | 143,015 | ||||||
| Proceeds from issuances of 8.125% senior notes |
— | 72,000 | ||||||
| Proceeds from term loan borrowings |
— | 25,000 | ||||||
| Deferred financing costs |
(1,530 | ) | (4,284 | ) | ||||
| Proceeds from issuances of common stock |
8,162 | 8 | ||||||
| Purchases of subsidiary capital stock by subsidiary |
(418 | ) | (974 | ) | ||||
| Dividends on capital stock by subsidiary |
(4,678 | ) | (4,660 | ) | ||||
| Redemption of cumulative preferred stock |
(1,295 | ) | — | |||||
| Proceeds from issuance of redeemable perpetual preferred stock, net of offering expenses |
37,500 | — | ||||||
| Preferred stock dividends |
(153 | ) | (3,489 | ) | ||||
|
|
|
|
|
|||||
| Net cash provided by financing activities |
35,218 | 112,909 | ||||||
|
|
|
|
|
|||||
| Net increase in cash |
400 | 872 | ||||||
| Cash and equivalents at beginning of period |
7,085 | 6,278 | ||||||
| The effect of foreign currency translation on cash |
(1,207 | ) | (1,304 | ) | ||||
|
|
|
|
|
|||||
| Cash and equivalents at end of period |
$ | 6,278 | $ | 5,846 | ||||
|
|
|
|
|
|||||
| Supplemental disclosure of cash flow information: |
||||||||
| Cash paid during the period: |
||||||||
| Interest |
$ | 10,657 | $ | 10,284 | ||||
| Income taxes |
1,130 | 1,491 | ||||||
|
|
|
|
|
|||||
Non-cash investing and financing activities (see Note 4):
On October 1, 2012, the Company issued convertible cumulative preferred stock of $750 and a noninterest-bearing seller holdback note discounted to $1,502 as part of the consideration for a business acquisition.
On April 7, 2014, the Company issued common stock of $9,865 and noninterest-bearing seller holdback notes discounted to $7,937 as part of the consideration for a business acquisition. In addition, discounted working capital and other adjustments totaled $9,616.
The Company included holdback amounts (not including the seller holdback notes discussed above) totaling $936 and $1,126 as part of the consideration for business acquisitions during the year ended June 30, 2013 and 2014, respectively.
The accompanying notes are an integral part of these consolidated financial statements.
F-6
Table of Contents
GENERAL FINANCE CORPORATION AND SUBSIDIARIES
NOTES TO CONSOLIDATED FINANCIAL STATEMENTS
Note 1. Organization and Business Operations
General Finance Corporation (“GFN”) was incorporated in Delaware in October 2005. References to the “Company” in these Notes are to GFN and its consolidated subsidiaries. These subsidiaries include GFN U.S. Australasia Holdings, Inc., a Delaware corporation (“GFN U.S.”); GFN North America Leasing Corporation , a Delaware corporation (“GFNNA Leasing”); GFN North America Corp., a Delaware corporation (“GFNNA”); GFN Manufacturing Corporation, a Delaware corporation (“GFNMC”), and its subsidiary, Southern Frac, LLC, a Texas limited liability company (collectively “Southern Frac”); Royal Wolf Holdings Limited, an Australian corporation publicly traded on the Australian Securities Exchange (“RWH”), and its Australian and New Zealand subsidiaries (collectively, “Royal Wolf”); Pac-Van, Inc., an Indiana corporation, and its Canadian subsidiary, PV Acquisition Corp., an Alberta corporation (collectively “Pac-Van”); and Lone Star Tank Rental Inc., a Delaware corporation (“Lone Star”).
The Company does business in three distinct, but related industries, mobile storage, modular space and liquid containment (which is collectively referred to as the “portable services industry”), in two geographic areas; the Asia-Pacific (or Pan-Pacific) area, consisting of Royal Wolf (which leases and sells storage containers, portable container buildings and freight containers in Australia and New Zealand) and North America, consisting of Pac-Van (which leases and sells storage, office and portable liquid storage tank containers, modular buildings and mobile offices) and Lone Star (which leases portable liquid storage tank containers and containment products, as well as provides certain fluid management services, to the oil and gas industry in the Permian and Eagle Ford basins of Texas), which are combined to form our North American leasing operations, and Southern Frac (which manufactures portable liquid storage tank containers).
On May 31, 2011, the Company completed an initial public offering (“IPO”) in Australia of a noncontrolling interest in RWH. A total of 50,000,000 shares of capital stock were issued to the Australian market and an additional 188,526 shares were issued to the non-employee members of the RWH Board of Directors, the RWH chief executive officer and the RWH chief financial officer. At the IPO date and through June 30, 2014, GFN U.S. owned a direct (and the Company an indirect) majority interest of over 50% of Royal Wolf.
Note 2. Summary of Significant Accounting Policies
Basis of Presentation
The consolidated financial statements have been prepared on the accrual basis of accounting in accordance with accounting principles generally accepted in the United States.
Unless otherwise indicated, references to “FY 2013” and “FY 2014” are to the fiscal years ended June 30, 2013 and 2014, respectively.
Certain reclassifications have been made to the FY 2013 presentation, the most significant being a revised segment presentation in Note 12.
Principles of Consolidation
The consolidated financial statements include the accounts of the Company and its wholly-owned and majority-owned subsidiaries. All significant intercompany accounts and transactions have been eliminated.
Foreign Currency Translation
The Company’s functional currencies for its foreign operations are the respective local currencies, the Australian (“AUS”) and New Zealand (“NZ”) dollars in the Asia-Pacific area and the Canadian (“C”) dollar in North America. All adjustments resulting from the translation of the accompanying consolidated financial statements from the functional currency into reporting currency are recorded as a component of stockholders’ equity in accordance with Financial Accounting Standards Board (“FASB”) Accounting Standards Codification (“ASC”) Topic 830, Foreign Currency Matters. All assets and liabilities are translated at the rates in effect at the balance sheet dates; and revenues, expenses, gains and losses are translated using the average exchange rates during the periods. Transactions in foreign currencies are translated at the foreign exchange rate prevailing at the date of the transaction. Monetary assets and liabilities denominated in foreign currencies at the balance sheet date are translated to the functional currency at the foreign exchange rate prevailing at that date. Foreign exchange differences arising on translation are recognized in the statement of operations. Non-monetary assets and liabilities that are measured in terms of historical cost in a foreign currency are translated using the exchange rate at the date of the transaction. Non-monetary assets and liabilities denominated in foreign currencies that are stated at fair value are translated to the functional currency at foreign exchange rates prevailing at the dates the fair value was determined.
F-7
Table of Contents
GENERAL FINANCE CORPORATION AND SUBSIDIARIES
NOTES TO CONSOLIDATED FINANCIAL STATEMENTS
Segment Information
FASB ASC Topic 280, Segment Reporting, establishes standards for the way companies report information about operating segments in annual financial statements. It also establishes standards for related disclosures about products and services, geographic areas and major customers. Based on the provisions of FASB ASC Topic 280 and the manner in which the chief operating decision maker analyzes the business, the Company has determined it has two separately reportable geographic areas that include four operating segments, North America (leasing and manufacturing, including corporate headquarters) and the Asia-Pacific area (the leasing operations of Royal Wolf).
Use of Estimates
The preparation of consolidated financial statements in conformity with accounting principles generally accepted in the United States requires management to make estimates and assumptions that affect the reported amounts of assets and liabilities and disclosure of contingent assets and liabilities at the date of the consolidated financial statements, and the reported amounts of revenues and expenses during the reporting period. Actual results could differ from those estimates. Material estimates that are particularly susceptible to significant changes include assumptions used in assigning value to identifiable intangible assets at the acquisition date, the assessment for impairment of goodwill, the assessment for impairment of other intangible assets, the allowance for doubtful accounts, share-based compensation expense, residual value of the lease fleet and deferred tax assets and liabilities. Assumptions and factors used in the estimates are evaluated on an annual basis or whenever events or changes in circumstances indicate that the previous assumptions and factors have changed. The results of the analysis could result in adjustments to estimates.
Cash Equivalents
The Company considers highly liquid investments with maturities of three months or less, when purchased, to be cash equivalents. The Company maintains its cash in bank deposit accounts that, at times, may exceed federally insured limits. The Company has not experienced any losses in such accounts. The Company believes it is not exposed to any significant credit risk on its cash balances.
Inventories
Inventories are stated at the lower of cost or fair value (net realizable value) and consist of primarily finished goods for containers, modular buildings and mobile offices held for sale or lease; as well as raw materials, work in-process and finished goods of manufactured portable liquid storage tank containers. Costs for leasing operations are assigned to individual items on the basis of specific identification and include expenditures incurred in acquiring the inventories and bringing them to their existing condition and location; while costs for manufactured units are determined using the first-in, first-out method. Net realizable value is the estimated selling price in the ordinary course of business. Expenses of marketing, selling and distribution to customers, as well as costs of completion, are estimated and are deducted from the estimated selling price to establish net realizable value. Inventories are comprised of the following (in thousands):
| June 30, | ||||||||
| 2013 | 2014 | |||||||
| Finished goods |
$ | 27,357 | $ | 24,157 | ||||
| Work in-process |
1,680 | 2,011 | ||||||
| Raw materials |
2,821 | 1,234 | ||||||
|
|
|
|
|
|||||
| $ | 31,858 | $ | 27,402 | |||||
|
|
|
|
|
|||||
Derivative Financial Instruments
The Company may use derivative financial instruments to hedge its exposure to foreign currency and interest rate risks arising from operating, financing and investing activities. The Company does not hold or issue derivative financial instruments for trading purposes. However, derivatives that do not qualify for hedge accounting are accounted for as trading instruments. Derivative financial instruments are recognized initially at fair value. Subsequent to initial recognition, derivative financial instruments are stated at fair value. The gain or loss on the remeasurement to fair value on unhedged (or the ineffective portion of hedged) derivative financial instruments is recognized in the statement of operations.
F-8
Table of Contents
GENERAL FINANCE CORPORATION AND SUBSIDIARIES
NOTES TO CONSOLIDATED FINANCIAL STATEMENTS
Accounting for Stock Options
For the issuances of stock options, the Company follows the fair value provisions of FASB ASC Topic 718, Stock Compensation, which require recognition of employee share-based compensation expense in the statements of operations over the vesting period based on the fair value of the stock option at the grant date. For stock options granted to non-employee consultants, the Company recognizes compensation expense measured at their fair value at each reporting date. Therefore, the stock options issued to non-employee consultants are subject to periodic fair value adjustments recorded in share-based compensation over the vesting period.
Fair Value
Fair values of financial instruments are estimated using relevant market information and other assumptions, as more fully disclosed in Note 6. Fair value estimates would involve uncertainties and matters of significant judgment regarding interest rates, credit risk, prepayments and other factors, especially in the absence of broad markets for particular items. Changes in assumptions or in market conditions could significantly affect these estimates
Property, Plant and Equipment
Owned assets
Property, plant and equipment are stated at cost, less accumulated depreciation and impairment losses. The cost of self-constructed assets includes the cost of materials, direct labor, the initial estimate (where relevant) of the costs of dismantling and removing the items and restoring the site on which they are located; and an appropriate allocation of production overhead, where applicable. Depreciation for property, plant and equipment is recorded on the straight-line basis over the estimated useful lives of the related asset. The residual value, the useful life and the depreciation method applied to an asset are reassessed at least annually.
Property, plant and equipment consist of the following (in thousands):
| Estimated Useful Life |
June 30, | |||||||||||
| 2013 | 2014 | |||||||||||
| Land |
— | $ | 2,181 | $ | 2,423 | |||||||
| Building and improvements |
10 — 40 years | 3,943 | 4,608 | |||||||||
| Transportation and plant equipment (including capital lease assets) |
3 — 20 years | 22,605 | 34,934 | |||||||||
| Furniture, fixtures and office equipment |
3 — 10 years | 5,142 | 7,286 | |||||||||
| Construction in-process |
87 | 134 | ||||||||||
|
|
|
|
|
|||||||||
| 33,958 | 49,385 | |||||||||||
| Less accumulated depreciation and amortization |
(14,118 | ) | (18,771 | ) | ||||||||
|
|
|
|
|
|||||||||
| $ | 19,840 | $ | 30,614 | |||||||||
|
|
|
|
|
|||||||||
Capital leases
Leases under which substantially all the risks and benefits incidental to ownership of the leased assets are assumed by the Company are classified as capital leases. Other leases are classified as operating leases. A lease asset and a lease liability equal to the present value of the minimum lease payments, or the fair value of the leased item, whichever is the lower, are capitalized and recorded at the inception of the lease. Lease payments are apportioned between the finance charges and reduction of the lease liability so as to achieve a constant rate of interest on the remaining balance of the liability. Finance charges are charged directly to the statement of operations. Capitalized leased assets are depreciated over the shorter of the estimated useful life of the asset or the lease term.
Operating leases
Payments made under operating leases are expensed on the straight-line basis over the term of the lease, except where an alternative basis is more representative of the pattern of benefits to be derived from the leased property. Where leases have fixed rate increases, these increases are accrued and amortized over the entire lease period, yielding a constant periodic expense over the term of the lease.
F-9
Table of Contents
GENERAL FINANCE CORPORATION AND SUBSIDIARIES
NOTES TO CONSOLIDATED FINANCIAL STATEMENTS
Lease Fleet
The Company has a fleet of storage, portable building, office and portable liquid storage tank containers, mobile offices, modular buildings and steps that it primarily leases to customers under operating lease agreements with varying terms. The value of the lease fleet (or lease or rental equipment) is recorded at cost and depreciated on the straight-line basis over the estimated useful life (5 - 20 years), after the date the units are put in service, down to their estimated residual values (up to 70% of cost). In the opinion of management, estimated residual values are at or below net realizable values. The Company periodically reviews these depreciation policies in light of various factors, including the practices of the larger competitors in the industry, and its own historical experience. Costs incurred on lease fleet units subsequent to initial acquisition are capitalized when it is probable that future economic benefits in excess of the originally assessed performance will result; otherwise, they are expensed as incurred. At June 30, 2013 and 2014, the gross costs of the lease fleet were $332,435,000 and $453,362,000, respectively.
Units in the lease fleet are also available for sale. The cost of sales of a unit in the lease fleet is recognized at the carrying amount at the date of sale.
Impairment of Long-Lived Assets
The Company periodically reviews for the impairment of long-lived assets and assesses when an event or change in circumstances indicates the carrying value of an asset may not be recoverable. An impairment loss would be recognized when estimated future cash flows expected to result from the use of the asset and the eventual disposition is less than its carrying amount. The Company has determined that no impairment provision related to long-lived assets was required to be recorded as of June 30, 2013 and 2014.
Goodwill
The purchase consideration of acquired businesses have been allocated to the assets and liabilities acquired based on the estimated fair values on the respective acquisition dates (see Note 4). Based on these values, the excess purchase consideration over the fair value of the net assets acquired was allocated to goodwill. The Company accounts for goodwill in accordance with FASB ASC Topic 350, Intangibles — Goodwill and Other. FASB ASC Topic 350 prohibits the amortization of goodwill and intangible assets with indefinite lives and requires these assets be reviewed for impairment. Goodwill recorded from acquisitions of businesses under asset purchase agreements is deductible for income tax purposes over 15 years, even though goodwill is not amortized for financial reporting purposes. The Company operates two reportable geographic areas and the vast majority of goodwill recorded was in the acquisitions of Royal Wolf, Pac-Van, Southern Frac and Lone Star. The Company performed an annual impairment test on goodwill at year end using the two-step process required under FASB ASC Topic 350. The first step was a screen for potential impairment, while the second step measured the amount of the impairment, if any, by determining the implied fair value of a reporting unit’s goodwill and comparing it to the carrying value of the goodwill. This would involve allocating the fair value of the reporting unit to its respective assets and liabilities (as if it had been acquired in a separate and individual business combination and the fair value was the price paid to acquire it), with the excess of the fair value over the amounts assigned being the implied fair value of goodwill.
Effective July 1, 2012, the Company adopted the new qualitative assessment now allowable under ASC Topic 350. It will no longer be required for the Company to calculate the fair value of a reporting unit unless a determination is made based on a qualitative assessment that it is more likely than not (i.e., greater than 50%) that the fair value of the reporting unit is less than its carrying amount. Qualitative factors which could cause an impairment include (1) significant underperformance relative to historical, expected or projected future operating results; (2) significant changes in the manner of use of the acquired businesses or the strategy for our overall business; (3) significant changes during the period in the Company’s market capitalization relative to net book value; and (4) significant negative industry or general economic trends. If the Company did determine that fair value is likely less than the carrying amount, the quantitative two-step impairment test process discussed above would be applied. As of June 30, 2013 and 2014, the Company determined that it was not likely that the fair values of the goodwill of its operating units were less than their respective carrying amounts.
F-10
Table of Contents
GENERAL FINANCE CORPORATION AND SUBSIDIARIES
NOTES TO CONSOLIDATED FINANCIAL STATEMENTS
The change in the balance of goodwill was as follows (in thousands):
| June 30, | ||||||||
| 2013 | 2014 | |||||||
| Beginning of year |
$ | 68,449 | $ | 68,692 | ||||
| Additions to goodwill |
3,790 | 23,608 | ||||||
| Other adjustments, primarily foreign translation effect (a) |
(3,547 | ) | 866 | |||||
| Impairment of goodwill |
— | — | ||||||
|
|
|
|
|
|||||
| End of year |
$ | 68,692 | $ | 93,166 | ||||
|
|
|
|
|
|||||
| (a) | Includes a $70 adjustment in FY 2014 to reduce the goodwill recorded from the acquisition of Southern Frac in FY 2013 as a result of pre-acquisition claims subsequent to June 30, 2013 that reduced the seller’s holdback note. |
Intangible Assets
Intangible assets include those with indefinite (trademark and trade name) and finite (primarily customer base and lists, non-compete agreements and deferred financing costs) useful lives. Customer base and lists and non-compete agreements are amortized on the straight-line basis over the expected period of benefit which range from one to fourteen years. Costs to obtaining long-term financing are deferred and amortized over the term of the related debt using the straight-line method. Amortizing the deferred financing costs using the straight-line method does not produce significantly different results than that of the effective interest method.
Intangible assets consist of the following (in thousands):
| June 30, | ||||||||
| 2013 | 2014 | |||||||
| Trademark and trade name |
$ | 2,928 | $ | 5,427 | ||||
| Customer base and lists |
30,540 | 50,735 | ||||||
| Non-compete agreements |
7,523 | 13,611 | ||||||
| Deferred financing costs |
1,991 | 7,080 | ||||||
| Other |
1,605 | 1,951 | ||||||
|
|
|
|
|
|||||
| 44,587 | 78,804 | |||||||
| Less accumulated amortization |
(28,185 | ) | (35,288 | ) | ||||
|
|
|
|
|
|||||
| $ | 16,402 | $ | 43,516 | |||||
|
|
|
|
|
|||||
The Company reviews intangible assets (those assets resulting from acquisitions) for impairment if it determines, based on a qualitative assessment, that it is more likely than not (i.e., greater than 50%) that fair value might be less than the carrying amount. If the Company determines that fair value is more likely than not less than the carrying amount, then impairment would be quantitatively tested, using historical cash flows and other relevant facts and circumstances as the primary basis for estimates of future cash flows. If it determines that fair value is not likely to be less than the carrying amount, then no further testing would be required. As of June 30, 2013 and 2014, the Company determined that it was not likely that the fair values of intangible assets were less than the carrying amounts.
The estimated future amortization of intangible assets with finite useful lives as of June 30, 2014 is as follows (in thousands):
| Year Ending June 30, |
||||
| 2015 |
$ | 8,774 | ||
| 2016 |
8,850 | |||
| 2017 |
6,938 | |||
| 2018 |
3,626 | |||
| 2019 |
2,463 | |||
| Thereafter |
7,438 | |||
|
|
|
|||
| $ | 38,089 | |||
|
|
|
|||
F-11
Table of Contents
GENERAL FINANCE CORPORATION AND SUBSIDIARIES
NOTES TO CONSOLIDATED FINANCIAL STATEMENTS
Defined Contribution Benefit Plan
Obligations for contributions to defined contribution benefit plans are recognized as an expense in the statement of operations as incurred. Contributions to defined contribution benefit plans in FY 2013 and FY 2014 were $1,582,000 and $1,638,000, respectively.
Revenue Recognition
The Company leases and sells new and used storage, office, building and portable liquid storage tank containers, modular buildings and mobile offices to its customers, as well as providing other ancillary products and services. Leases to customers generally qualify as operating leases unless there is a bargain purchase option at the end of the lease term. Revenue is recognized as earned in accordance with the lease terms established by the lease agreements and when collectability is reasonably assured.
Revenue from sales of the lease fleet is generally recognized upon delivery and when collectability is reasonably assured and revenue from the sales of manufactured units are recognized when title and risk of loss transfers to the purchaser, generally upon shipment. Certain arrangements to sell units under long-term construction-type sales contracts are accounted for under the percentage of completion method. Under this method, income is recognized in proportion to the incurred costs to date under the contract to estimated total costs.
Unearned revenue includes end of lease services not yet performed by the Company (such as transport charges for the pick-up of a unit where the actual pick-up has not yet occurred as the unit is still leased), advance rentals and deposit payments.
Advertising
Advertising costs are generally expensed as incurred. Direct-response advertising costs, principally yellow page advertising, are monitored through call logs and advertising source codes, are capitalized when paid and amortized over the period in which the benefit is derived. However, the amortization period of the prepaid balance never exceeds 12 months. At June 30, 2014, prepaid advertising costs were approximately $35,000. There were no prepaid adverting costs at June 30, 2013. Advertising costs expensed were approximately $3,646,000 and $3,164,000 for FY 2013 and FY 2014, respectively.
Shipping and Handling Costs
The Company reports shipping and handling costs, primarily related to outbound freight in its North American manufacturing operations, as a component of selling and general expenses. Shipping and handling costs totaled $502,000 and $1,244,000 in FY 2013 and FY 2014, respectively.
Income Taxes
The Company uses the asset and liability method of accounting for income taxes. Under this method, deferred tax assets and liabilities are recorded for temporary differences between the financial reporting basis and income tax basis of assets and liabilities at the balance sheet date multiplied by the applicable tax rates. Valuation allowances are established when necessary to reduce deferred tax assets to the amount expected to be realized. Income tax expense is recorded for the amount of income tax payable or refundable for the period increased or decreased by the change in deferred tax assets and liabilities during the period. The Company files U.S. Federal tax returns, multiple U.S. state (and state franchise) tax returns and Australian, New Zealand and Canadian tax returns. For U.S. Federal tax purposes, all periods subsequent to June 30, 2008 are subject to examination by the U.S. Internal Revenue Service (“IRS”) and, for U.S. state tax purposes, with few exceptions, all periods subsequent to June 30, 2007 are subject to examination by the respective state’s taxation authorities. Generally, periods subsequent to June 30, 2008 are subject to examination by the respective taxation authorities in Australia, New Zealand and Canada. The Company believes that its income tax filing positions and deductions would be sustained on audit and does not anticipate any adjustments that would result in a material change. Therefore, no reserves for uncertain income tax positions have been recorded. In addition, the Company does not anticipate that the total amount of unrecognized tax benefit related to any particular tax position will change significantly within the next 12 months.
The Company’s policy for recording interest and penalties, if any, will be to record such items as a component of income taxes.
F-12
Table of Contents
GENERAL FINANCE CORPORATION AND SUBSIDIARIES
NOTES TO CONSOLIDATED FINANCIAL STATEMENTS
Net Income per Common Share
Basic net income per common share is computed by dividing net income attributable to common stockholders by the weighted-average number of shares of common stock outstanding during the periods. Diluted net income per common share reflects the potential dilution that could occur if securities or other contracts to issue common stock were exercised or converted into common stock or resulted in the issuance of common stock that then shared in the earnings of the Company. The potential dilutive securities (common stock equivalents) the Company had outstanding were warrants and stock options. The following is a reconciliation of weighted average shares outstanding used in calculating earnings per common share:
| Year Ended June 30, | ||||||||
| 2013 | 2014 | |||||||
| Basic |
22,160,101 | 24,631,284 | ||||||
| Assumed exercise of stock options |
473,601 | 1,012,281 | ||||||
|
|
|
|
|
|||||
| Diluted |
22,633,702 | 25,643,565 | ||||||
|
|
|
|
|
|||||
Potential common stock equivalents totaling 1,696,997 and 1,140,539 for FY 2013 and FY 2014, respectively, have been excluded from the computation of diluted earnings per share because the effect is anti-dilutive.
Recently Issued Accounting Pronouncements
Previously, in August 2010, the FASB, as result of a joint project with the International Accounting Standards Board (“IASB”) to simplify lease accounting and improve the quality of and comparability of financial information for users, published proposed standards that would change the accounting and financial reporting for both lessee and lessor under ASC Topic 840, Leases. Since then, the FASB and IASB have been deliberating submitted comments about their 2010 proposals and other feedback from constituents. On May 16, 2013, both the FASB and the IASB issued nearly identical exposure drafts that retained the most significant change to lease accounting rules from the 2010 proposed standards, the elimination of the concept of off-balance sheet treatment for “operating leases” for lessees for the vast majority of lease contracts. However, the 2013 exposure drafts include significant modifications, among them the establishment of two types of lease contracts for both lessees and lessors. Instead of capital and operating leases, the proposed rules create two types of leases (both similar to capital leases for lessees), which the FASB and IASB refer to as “Type A” and “Type B.” In addition, the revised exposure drafts seek to correct issues, noted by many commenters, related to the pattern and classification of expense recognition as well as the definition of “lease term” and the treatment of variable lease payments under the 2010 proposed standards. The Company believes that the final standards, if issued in substantially the same form as the revised exposure drafts, would have a material effect in the presentation of its consolidated financial position and results of operations.
In May 2014, the FASB issued Accounting Standards Update (“ASU”) 2014-09, Revenue from Contracts with Customers: Topic 606. ASU 2014-09 completes the joint effort by the FASB and IASB to improve financial reporting by creating common revenue recognition guidance for U.S. GAAP and International Financial Reporting Standards (“IFRS”). ASU 2014-09 applies to all companies that enter into contracts with customers to transfer goods or services. ASU 2014-09 is effective for public entities for interim and annual reporting periods beginning after December 15, 2016. Early application is not permitted and entities have the choice to apply ASU 2014-09 either retrospectively to each reporting period presented or by recognizing the cumulative effect of applying ASU 2014-09 at the date of initial application and not adjusting comparative information. The Company is currently evaluating the requirements of ASU 2014-09 and has not yet determined its impact on its consolidated financial statements.
In June 2014, the FASB issued ASU No. 2014-12, Compensation – Stock Compensation (Topic 718) –Accounting for Share-Based Payments When the Terms of an Award Provide That a Performance Target Could Be Achieved after the Requisite Services Period (ASU 2014-12). The amendments in ASU 2014-12 provide guidance for determining compensation cost under specific circumstances when an employee is eligible to vest in an award regardless of whether the employee is rendering service on the date the performance target is achieved. ASU 2014-12 becomes effective for annual and interim periods beginning after December 15, 2015 with early adoption permitted. The Company is currently evaluating the effects of ASU 2014-12 on its financial statements and disclosures, if any.
F-13
Table of Contents
GENERAL FINANCE CORPORATION AND SUBSIDIARIES
NOTES TO CONSOLIDATED FINANCIAL STATEMENTS
Note 3. Equity Transactions
Rights Offering
On June 25, 2010, the Company completed a rights offering to stockholders of record as of May 14, 2010. The offering entitled holders of the rights to purchase units at $1.50 per unit, with each unit consisting of one share of GFN common stock and a three-year warrant to purchase 0.5 additional shares of GFN common stock at an exercise price of $4.00 per share. By the expiration date of June 25, 2013, the Company had received total net proceeds of $8,154,000 during the fiscal year ended June 30, 2013 from exercises of these warrants that resulted in the issuance of 2,038,626 shares of GFN common stock. Of these net proceeds, $8,000,000 was used to reduce indebtedness at Pac-Van under its senior credit facility (see Note 5).
Preferred Stock
Upon issuance of shares of preferred stock, the Company records the liquidation value as the preferred equity in the consolidated balance sheet, with any underwriting discount and issuance or offering costs recorded as a reduction in additional paid-in capital.
Series A and B Preferred Stock
The Company conducted private placements of Series A 12.5% Cumulative Preferred Stock, par value $0.0001 per share and liquidation preference of $50 per share (“Series A Preferred Stock”); and Series B 8% Cumulative Preferred Stock, par value of $0.0001 per share and liquidation value of $1,000 per share (“Series B Preferred Stock”). The Series B Preferred Stock is offered primarily in connection with business combinations. In connection with a public offering of a new series of preferred stock, the Company redeemed the Series A Preferred Stock (see below) and, at June 30, 2013 and June 30, 2014, the Company had outstanding 100 shares of Series B Preferred Stock in Equity totaling $100,000.
The Series B Preferred Stock is not convertible into GFN common stock, has no voting rights, except as required by Delaware law, and is redeemable after February 1, 2014; at which time it may be redeemed at any time, in whole or in part, at the Company’s option. Holders of the Series B Preferred Stock are entitled to receive, when declared by the Company’s Board of Directors, annual dividends payable quarterly in arrears on the 31st day of January, July and October and on the 30th day of April of each year. In the event of any liquidation or winding up of the Company, the holders of the Series B Preferred Stock will have preference to holders of common stock.
In connection with an acquisition during the year ended June 30, 2011, the Company issued 110 shares of Series B Preferred Stock with a liquidation value of $110,000 that is redeemable in three annual installments from the dates of issuance. As a result, the value of these shares, which totaled $37,000 at June 30, 2013 and were fully redeemed in FY 2014, were classified as a liability in the consolidated balance sheet under the caption “Senior and other debt.”
Series C Convertible Preferred Stock
In connection with the Southern Frac acquisition on October 1, 2012, the Company issued 750 shares of a Series C Convertible Cumulative Preferred Stock, par value $0.0001 per share and liquidation preference of $1,000 per share (“Series C Convertible Preferred Stock”). The Series C Convertible Preferred Stock accrued no dividends, unless declared by the Board of Directors of the Company, and was automatically convertible into 150,000 shares of GFN common stock at the date that the shares of GFN common stock had a closing price equal to or in excess of $5.00 per share on the NASDAQ Stock Market (“NASDAQ”). On February 12, 2013, the closing price of the Company’s common stock was $5.06 per share, and the Series C Convertible Preferred Stock automatically converted to 150,000 shares of Company common stock. Subsequently, the shares of the Series C Convertible Preferred Stock were cancelled.
Series C Preferred Stock
On May 17, 2013, the Company completed a public offering of 350,000 shares of 9.00% Series C Cumulative Redeemable Perpetual Preferred Stock (the “Series C Preferred Stock”), liquidation preference $100.00 per share, and on May 24, 2013, the underwriters exercised their overallotment option to purchase an additional 50,000 shares. Proceeds from the offering totaled $37,500,000, after deducting the underwriting discount of $2,000,000 and offering costs of $500,000. The Company used $36,000,000 of the net proceeds to reduce indebtedness at Pac-Van under its senior credit facility, pursuant to the requirement that at least 80% of the gross proceeds, or $32,000,000, be used for that purpose in order to permit the payment of intercompany dividends to GFN to fund any dividends declared on the Series C Preferred Stock (see Note 5) and also used $1,295,000, plus accrued dividends, of the net proceeds to redeem the 25,900 shares of the Series A Preferred Stock. Subsequently, the shares of the Series A Preferred Stock were cancelled.
F-14
Table of Contents
GENERAL FINANCE CORPORATION AND SUBSIDIARIES
NOTES TO CONSOLIDATED FINANCIAL STATEMENTS
Dividends on the Series C Preferred Stock are cumulative from the date of original issue and will be payable on the 31st day of each January, July and October and on the 30th day of April commencing July 31, 2013 when, as and if declared by the Company’s Board of Directors. Commencing on May 17, 2018, the Company may redeem, at its option, the Series C Preferred Shares, in whole or in part, at a cash redemption price of $100.00 per share, plus any accrued and unpaid dividends to, but not including, the redemption date. Among other things, the Series C Preferred Shares have no stated maturity, are not subject to any sinking fund or other mandatory redemption, and are not convertible into or exchangeable for any of the Company’s other securities. Holders of the Series C Preferred Shares generally will have no voting rights, except for limited voting rights if dividends payable on the outstanding Series C Preferred Shares are in arrears for six or more consecutive or non-consecutive quarters, and under certain other circumstances. If the Company fails to maintain the listing of the Series C Preferred Stock on the NASDAQ for 30 days or more, the per annum dividend rate will increase by an additional 2.00% per $100.00 stated liquidation value ($2.00 per annum per share) so long as the listing failure continues. In addition, in the event of any liquidation or winding up of the Company, the holders of the Series C Preferred Stock will have preference to holders of common stock and are pair passu with the Series B Preferred Stock.
The Series C Preferred Stock is listed on the NASDAQ Stock Market under the symbol “GFNCP.”
Dividends
As of June 30, 2014, since issuance, dividends paid or payable totaled $61,000 for the Series B Preferred Stock.
As of June 30, 2014, since issuance, dividends paid totaled $3,480,000 for the Series C Preferred Stock.
The characterization of dividends to the recipients for Federal income tax purposes is made based upon the earnings and profits of the Company, as defined by the Internal Revenue Code.
Royal Wolf Dividends
On August 14, 2012, the Board of Directors of Royal Wolf declared a dividend of AUS$0.045 per RWH share payable on October 2, 2012 to shareholders of record on September 20, 2012; and on February 5, 2013, the Board of Directors of Royal Wolf declared a dividend of AUS$0.045 per RWH share payable on April 3, 2012 to shareholders of record on March 19, 2013.
On August 13, 2013, the Board of Directors of Royal Wolf declared a dividend of AUS$0.05 per RWH share payable on October 3, 2013 to shareholders of record on September 24, 2013; and on February 5, 2014, the Board of Directors of Royal Wolf declared a dividend of AUS$0.05 per RWH share payable on April 3, 2014 to shareholders of record on March 19, 2014.
The consolidated financial statements reflect the amount of the dividends pertaining to the noncontrolling interest.
Note 4. Acquisitions
The Company can enhance its business and market share by entering into new markets in various ways, including starting up a new location or acquiring a business consisting of container, modular unit or mobile office assets of another entity. An acquisition generally provides the Company with operations that enables it to at least cover existing overhead costs and is preferable to a start-up or greenfield location. The businesses discussed below were acquired primarily to expand the Company’s container lease fleet. The accompanying consolidated financial statements include the operations of the acquired businesses from the dates of acquisition.
F-15
Table of Contents
GENERAL FINANCE CORPORATION AND SUBSIDIARIES
NOTES TO CONSOLIDATED FINANCIAL STATEMENTS
FY 2013 Acquisitions
On August 1, 2012, the Company, through Royal Wolf, purchased the business of Tassay Pty Ltd., d.b.a. “Rockhampton Container Sales,” for approximately $656,000 (AUS$624,000), which included a holdback amount of $32,000 (AUS$31,000). Rockhampton Container Sales leases and sells containers and is based in Rockhampton, Queensland.
On August 17, 2012, the Company, through Pac-Van, purchased the business of Camelback Container Services, LLC (“Camelback”) for $178,000, which included a holdback amount of $16,000. Camelback performs, among other things, custom modifications of ground level offices and storage containers in Phoenix, Arizona.
On September 17, 2012, the Company, through Pac-Van, purchased the business of Container Connection, LLC (“Container Connection”) for $1,499,000, which included a holdback note of $172,000. Container Connection leases and sells containers in Albany, Georgia and Orlando, Florida.
On October 1, 2012, the Company, through GFNMC, acquired 90% of the membership interests of Southern Frac for $6,899,000; which included a noninterest-bearing holdback note of $2,000,000 payable over three years (discounted to $1,502,000 at the date of acquisition). Funding for this acquisition included $2,000,000 from borrowings under a new $15,000,000 senior credit facility with Wells Fargo Bank, National Association (“Wells Fargo” – see Note 5) and $750,000 from the issuance of 750 shares of Series C Convertible Preferred Stock (see Note 3). In conjunction with the acquisition of Southern Frac, GFNMC entered into an agreement with the 10% noncontrolling interest holder for a call option that provides that for the period commencing on April 1, 2013 through October 1, 2017, GFNMC may purchase the noncontrolling interest for an initial price of $1,500,000, with incremental increases of $250,000 for each of the subsequent seven six-month periods. Southern Frac manufactures portable liquid storage containers in Waxahachie, Texas.
On November 5, 2012, the Company, through Royal Wolf, purchased the businesses of Australian Container & Engineering Services Pty Limited, Container Engineering North Queensland Pty Limited and Australian Container Traders Pty Limited, collectively “Coral Seas Containers,” for approximately $5,618,000 (AUS$5,434,000), which included a holdback amount of $289,000 (AUS$280,000). Coral Seas Containers, among other things, leases and sells containers and is based in Queensland.
On November 22, 2012, the Company, through Royal Wolf, purchased the business of Cairns Containers Pty Limited (“Cairns Containers”) for approximately $845,000 (AUS$814,000), which included a holdback amount of $44,000 (AUS$43,000). Cairns Container leases and sells containers and is based in Cairns, Queensland.
On February 22, 2013, the Company, through Pac-Van, purchased the business of AMEXX Leasing, LLC (“AMEXX”) for $354,000, which included a holdback amount of $31,000. AMEXX leases and sells containers in Michigan and Illinois.
On March 1, 2013, the Company, through Pac-Van, purchased the business of Alberta Container Services, Inc. (“ACS”) for $1,788,000 (C$1,836,000), which included a holdback amount of $352,000 (C$364,000). ACS leases and sells containers in Alberta, Canada.
F-16
Table of Contents
GENERAL FINANCE CORPORATION AND SUBSIDIARIES
NOTES TO CONSOLIDATED FINANCIAL STATEMENTS
The allocations for the acquisitions in FY 2013 to tangible and intangible assets acquired and liabilities assumed based on their estimated fair market values were as follows (in thousands):
| Southern Frac October 1, 2012 |
Coral Seas Containers November 5, 2012 |
Other Acquisitions | Total | |||||||||||||
| Fair value of the net tangible assets acquired and liabilities assumed: |
||||||||||||||||
| Restricted cash |
$ | 1,000 | $ | — | $ | — | $ | 1,000 | ||||||||
| Trade and other receivables |
3,085 | 14 | 210 | 3,309 | ||||||||||||
| Inventories |
2,296 | 528 | 1,538 | 4,362 | ||||||||||||
| Prepaid expenses and other |
342 | — | 16 | 358 | ||||||||||||
| Property, plant and equipment |
2,998 | 107 | 332 | 3,437 | ||||||||||||
| Lease fleet |
— | 3,649 | 2,305 | 5,954 | ||||||||||||
| Accounts payables and accrued liabilities |
(6,211 | ) | (177 | ) | (121 | ) | (6,509 | ) | ||||||||
| Unearned revenue and advance payments |
— | (8 | ) | (111 | ) | (119 | ) | |||||||||
| Senior and other debt |
(47 | ) | — | — | (47 | ) | ||||||||||
| Noncontrolling interest |
(889 | ) | — | — | (889 | ) | ||||||||||
|
|
|
|
|
|
|
|
|
|||||||||
| Total net tangible assets acquired, liabilities assumed and noncontrolling interest |
2,574 | 4,113 | 4,169 | 10,856 | ||||||||||||
| Fair value of intangible assets acquired: |
||||||||||||||||
| Non-compete agreement |
71 | 580 | 281 | 932 | ||||||||||||
| Customer lists |
1,112 | 295 | 621 | 2,028 | ||||||||||||
| Trade name |
387 | — | — | 387 | ||||||||||||
| Backlog |
74 | — | — | 74 | ||||||||||||
| Goodwill |
2,681 | 630 | 409 | 3,720 | ||||||||||||
|
|
|
|
|
|
|
|
|
|||||||||
| Total intangible assets acquired |
4,325 | 1,505 | 1,311 | 7,141 | ||||||||||||
|
|
|
|
|
|
|
|
|
|||||||||
| Total purchase consideration |
$ | 6,899 | $ | 5,618 | $ | 5,480 | $ | 17,997 | ||||||||
|
|
|
|
|
|
|
|
|
|||||||||
The estimated fair value of the tangible and intangible assets acquired and liabilities assumed exceeded the purchase prices of Rockhampton Container Sales and Container Connection resulting in estimated bargain purchase gains of $55,000 and $105,000, respectively. These gains have been recorded as non-operating income in the accompanying consolidated statements of operations.
FY 2014 Acquisitions
On August 1, 2013, the Company, through Pac-Van, purchased the business of Harper’s Hot Shot Service, Inc. (“Harper’s Hot Shot”) for $3,267,000, which included a holdback amount of $148,000. Harper Hot Shot leases and sells containers and is located in Paducah, Kentucky.
On September 6, 2013, the Company, through Pac-Van, purchased the business of Canadian Storage Containers Inc. (“Canadian Storage”) for $1,527,000 (C$1,602,000), which included a holdback amount of $258,000 (C$271,000). Canadian Storage leases and sells containers and is located in Calgary, Alberta, Canada.
On September 10, 2013, the Company, through Royal Wolf, purchased the businesses of Intermodal Solutions Pty Ltd, Kookaburra Containers Pty Ltd, Kookaburra Containers WA Pty Ltd, Kookaburra Containers Victoria Pty Ltd, Pack and Secure Pty Ltd and Intermodal Solutions Holdings Pty Ltd, (collectively “Intermodal Kookaburra”) for $5,231,000 (AUS$5,680,000), which included a holdback amount of $368,000 (AUS$400,000). Intermodal Kookaburra, among other things, leases and sells freight and storage containers in the Asia-Pacific area.
On October 31, 2013, the Company, through Royal Wolf, purchased the business of DBCS Containers Limited (“DBCS”) for $333,000 (AUS$351,000), which included a holdback amount of $33,000 (AUS$35,000). DBCS leases and sells containers and is located in Auckland, New Zealand.
On November 7, 2013, the Company, through Pac-Van, purchased the business of Pinnacle Rental & Supply, LLC (“Pinnacle Rental”) for $6,179,000, which included a holdback amount of $293,000. Pinnacle Rental leases portable liquid storage tank containers from Boaz, Alabama.
On December 20, 2013, the Company, through Pac-Van, purchased the business of Mark Rumpke Mobile Storage, Inc. (“Rumpke”) for $284,000, which included a holdback amount of $26,000. Rumpke leases and sells containers and is located in Cincinnati, Ohio.
F-17
Table of Contents
GENERAL FINANCE CORPORATION AND SUBSIDIARIES
NOTES TO CONSOLIDATED FINANCIAL STATEMENTS
On April 7, 2014, effective April 1, 2014, the Company, through GFNNA, acquired substantially all the assets and assumed certain liabilities of the affiliated companies, Lone Star Tank Rental LP, based in Kermit, Texas, and KHM Rentals, LLC, based in Kenedy, Texas, for a total purchase consideration of $102,418,000. At the date of acquisition, the affiliated entities were merged into the Company’s indirect wholly-owned subsidiary, Lone Star. Also on April 7, 2014, the Company, primarily through Pac-Van and Lone Star, amended and restated the senior credit facility with a syndicate led by Wells Fargo Bank, National Association (“Wells Fargo”) (see Note 5) as part of the financing for the acquisition. The purchase consideration consisted of (i) $75,000,000 in cash, (ii) $9,865,000 for 1,230,012 shares of GFN common stock (the number of shares was agreed to based on a value of $8.13 per share, which was the average of the closing market price during the 15-day trading period ending April 2, 2014), (iii) $5,000,000 (discounted to $3,694,000 at the date of acquisition) payable over five years for a non-compete agreement, (iv) $5,000,000 (discounted to $4,243,000 at the date of acquisition) payable over two years for a general indemnity holdback and (v) $10,481,000 (discounted to $9,616,000 at the date of acquisition) payable during the fiscal year ending June 30, 2015 for working capital and other adjustments. The Company funded the cash portion of the consideration using $50,000,000 of availability under the senior credit facility with a syndicate led by Wells Fargo, as amended, and $25,000,000 from a term loan with Credit Suisse AG, Singapore Branch (see Note 5).
The allocations for the acquisitions in FY 2014 to tangible and intangible assets acquired and liabilities assumed based on their estimated fair market values were as follows (in thousands):
| Intermodal Kookaburra September 10, 2013 |
Pinnacle Rental November 7, 2013 |
Lone Star April 7, 2014 |
Other Acquisitions |
Total | ||||||||||||||||
| Fair value of the net tangible assets acquired and liabilities assumed: |
||||||||||||||||||||
| Trade and other receivables |
$ | — | $ | — | $ | 14,968 | $ | 164 | $ | 15,132 | ||||||||||
| Inventories |
496 | 50 | 6,035 | 1,046 | 7,627 | |||||||||||||||
| Prepaid expenses and other |
— | — | 122 | 6 | 128 | |||||||||||||||
| Property, plant and equipment |
50 | — | 7,291 | 390 | 7,731 | |||||||||||||||
| Lease fleet |
3,479 | 5,271 | 33,338 | 2,213 | 44,301 | |||||||||||||||
| Accounts payables and accrued liabilities |
(76 | ) | — | (3,609 | ) | (41 | ) | (3,726 | ) | |||||||||||
| Unearned revenue and advance payments |
(35 | ) | (99 | ) | — | (133 | ) | (267 | ) | |||||||||||
| Senior and other debt |
— | — | (1,238 | ) | — | (1,238 | ) | |||||||||||||
| Deferred income taxes |
— | — | — | (974 | ) | (974 | ) | |||||||||||||
|
|
|
|
|
|
|
|
|
|
|
|||||||||||
| Total net tangible assets acquired and liabilities assumed |
3,914 | 5,222 | 56,907 | 2,671 | 68,714 | |||||||||||||||
| Fair value of intangible assets acquired: |
||||||||||||||||||||
| Non-compete agreement |
385 | 231 | 5,000 | 207 | 5,823 | |||||||||||||||
| Customer lists/relationships |
83 | 184 | 17,900 | 427 | 18,594 | |||||||||||||||
| Trade name |
— | — | 2,500 | — | 2,500 | |||||||||||||||
| Goodwill |
849 | 542 | 20,111 | 2,106 | 23,608 | |||||||||||||||
|
|
|
|
|
|
|
|
|
|
|
|||||||||||
| Total intangible assets acquired |
1,317 | 957 | 45,511 | 2,740 | 50,525 | |||||||||||||||
|
|
|
|
|
|
|
|
|
|
|
|||||||||||
| Total purchase consideration |
$ | 5,231 | $ | 6,179 | $ | 102,418 | $ | 5,411 | $ | 119,239 | ||||||||||
|
|
|
|
|
|
|
|
|
|
|
|||||||||||
Goodwill recognized is attributable primarily to expected corporate synergies, the assembled workforce and other factors. The goodwill recognized in the Southern Frac acquisition in FY 2013 is deductible for U.S. income tax purposes, but all other goodwill recognized during FY 2013 is not as it relates to non-domestic acquisitions. In FY 2014, the goodwill recognized in the Harper’s Hot Shot, Canadian Storage, Intermodal Kookaburra and DBCS acquisitions is not deductible for U.S. income tax purposes, but all other goodwill recognized during FY 2014 is deductible.
The Company incurred approximately $1,024,000 during FY 2013 and $1,175,000 during FY 2014 of incremental transaction costs associated with acquisition-related activity that were expensed as incurred and are included in selling and general expenses in the accompanying consolidated statements of operations.
F-18
Table of Contents
GENERAL FINANCE CORPORATION AND SUBSIDIARIES
NOTES TO CONSOLIDATED FINANCIAL STATEMENTS
The accompanying consolidated statements of operations reflect the operating results of the Company following the date of acquisition of Lone Star and do not reflect the operating results of Lone Star prior to the acquisition date. The following unaudited pro forma information for FY 2014 and FY 2013 assumes the acquisition of Lone Star occurred at the beginning of the periods presented (in thousands, except per share data):
| Year Ended June 30, | ||||||||
| 2013 | 2014 | |||||||
| (Unaudited) | ||||||||
| Revenues |
$ | 279,580 | $ | 325,821 | ||||
| Net income |
15,959 | 19,494 | ||||||
| Net income attributable to common stockholders |
8,091 | 8,249 | ||||||
|
|
|
|
|
|||||
| Pro forma net income per common share: |
||||||||
| Basic |
$ | 0.35 | $ | 0.32 | ||||
| Diluted |
0.34 | 0.31 | ||||||
|
|
|
|
|
|||||
The pro forma results are not necessarily indicative of the results that may have actually occurred had the acquisition taken place on the dates noted, or the future financial position or operating results of the Company. In addition, they do not consider any potential impacts of current market conditions on revenues, any staff or related expense increases or efficiencies or asset dispositions. The pro forma adjustments are based upon available information and assumptions that the Company believes are reasonable as a result of the application of the purchase method of accounting and consist primarily of adjustments to depreciation and amortization of the fixed assets and identifiable intangible assets acquired, as well as to the interest expense on senior and other debt borrowings, along with the related income tax effect. Revenues and net income for Lone Star since the date of acquisition in FY 2014 totaled $14,658,000 and $1,990,000, respectively. The FY 2013 and FY 2014 operating results of all other acquisitions prior to their respective dates of acquisition were not included in the pro forma results as they were not considered significant.
Note 5. Senior and Other Debt
Royal Wolf Senior Credit Facility
Prior to May 8, 2014, Royal Wolf had an approximately $121,000,000 (AUS$101,000,000 and NZ$29,200,000) senior credit facility with Australia and New Zealand Banking Group Limited (“ANZ”), which was secured by substantially all of the assets of the Company’s Australian and New Zealand subsidiaries (the “ANZ Credit Facility”). Effective May 8, 2014, Royal Wolf refinanced the ANZ Credit Facility to, among other things, increase the maximum borrowing capacity to $165,183,000 (AUS$175,000,000), add Commonwealth Bank of Australia (“CBA”) through a common terms deed arrangement with ANZ and generally improve the financial covenants (the “ANZ/CBA Credit Facility”). Under the common deed arrangement of the ANZ/CBA Credit Facility, ANZ’s proportionate share is $99,110,000 (AUS$105,000,000) and CBA’s proportionate share is $66,073,000 (AUS$70,000,000). The ANZ/CBA Credit Facility has $117,988,000 (AUS$125,000,000) maturing on July 31, 2017 (Facility A), and $47,195,000 (AUS$50,000,000) maturing on July 31, 2019 (Facility B).
Borrowings under the ANZ/CBA Credit Facility bear interest at the bank bill swap interest rate in Australia (BBSY) or New Zealand (BKBM), plus a margin of 1.10% - 1.85% per annum on the Facility A and 1.35% - 2.15% on the Facility B, depending on the net debt leverage ratio (“NDLR”), as defined. The CBA proportionate share has a minimum margin that is 0.10% higher than the ANZ proportionate share. At June 30, 2014, the 30-day and 90-day BBSY and BKBM was 2.7233% and 2.7550% and 3.48% and 3.69%, respectively.
The ANZ/CBA Credit Facility also includes a $2,832,000 (AUS$3,000,000) sub-facility to, among other things, facilitate direct and global payments using electronic banking services. The ANZ/CBA Credit Facility, as amended, is subject to certain financial and other customary covenants, including, among other things, compliance with specified interest coverage and net debt ratios based on earnings before interest, income taxes, impairment, depreciation and amortization and other non-operating costs and income (“EBITDA”) on a semi-annual basis and that borrowings may not exceed a multiple of three times EBITDA, as defined.
As of June 30, 2014, total borrowings (all under Facility A) and availability under the ANZ/CBA Credit Facility totaled $111,270,000 (AUS$117,883,000) and $23,345,000 (AUS$24,732,000), respectively.
F-19
Table of Contents
GENERAL FINANCE CORPORATION AND SUBSIDIARIES
NOTES TO CONSOLIDATED FINANCIAL STATEMENTS
The above amounts were translated based upon the exchange rate of one Australian dollar to $0.9439 U.S. dollar and one New Zealand dollar to $0.9327 Australian dollar at June 30, 2014.
North American Leasing Senior Credit Facility
Pac-Van had an $85,000,000 senior secured revolving credit facility with a syndicate led by PNC Bank, National Association (“PNC”) that included Wells Fargo and Union Bank, N.A. (the “PNC Credit Facility”). The PNC Credit Facility was scheduled to mature on January 16, 2013, but on September 7, 2012 Pac-Van entered into a new $120,000,000, five-year senior secured revolving credit facility with a syndicate led by Wells Fargo, that also included HSBC Bank USA, NA (“HSBC”), and the Private Bank and Trust Company (the “Wells Fargo Credit Facility”).
On February 7, 2014, Pac-Van amended the Wells Fargo Credit Facility to, among other things, increase the maximum borrowing capacity from $120,000,000 to $200,000,000 and add two new lenders (OneWest Bank and Capital One) to the syndicate. Further, on April 7, 2014, in conjunction with the acquisition of Lone Star (see Note 4), and on May 23, 2014, the Wells Fargo Credit Facility was amended and restated to, among other things, include Lone Star as a co-borrower and to allow for the funding of the interest requirements of the public offering of unsecured senior notes (see below). The Wells Fargo Credit Facility effectively not only finances the Company’s North American leasing operations, but also the funding requirements for the Series C Preferred Stock (see Note 3), the term loan with Credit Suisse AG, Singapore Branch (see below) and the public offering of unsecured senior notes.
The maximum amount of intercompany dividends that Pac-Van and Lone Star are allowed to pay in each fiscal year to GFN for the funding requirements of GFN’s senior and other debt and the Series C Preferred Stock are (a) the lesser of $5,000,000 for the Series C Preferred Stock or the amount equal to the dividend rate of the Series C Preferred Stock and its aggregate liquidation preference and the actual amount of dividends required to be paid to the Series C Preferred Stock; (b) the lesser of $3,125,000 for the term loan with Credit Suisse AG, Singapore Branch or the actual annual interest to be paid; and (c) $6,120,000 for the public offering of unsecured senior notes or the actual amount of annual interest required to be paid; provided that (i) the payment of such dividends does not cause a default or event of default; (ii) each of Pac-Van and Lone Star is solvent; (iii) excess availability, as defined, is $5,000,000 or more under the Wells Fargo Credit Facility; and (iv) the fixed charge coverage ratio, as defined, will be greater than 1.25 to 1.00 and the dividends are paid no earlier than ten business days prior to the date they are due.
Borrowings under the Wells Fargo Credit Facility accrue interest, at the Company’s option, either at the base rate, plus 0.5% and a range of 1.00% to 1.50%, or the LIBOR rate, plus 1.0% and a range of 2.50% to 3.00%; and, subject to certain conditions, the amount that may be borrowed may increase by $20,000,000 to a maximum of $220,000,000. The Wells Fargo Credit Facility contains, among other things, certain financial covenants, including fixed charge coverage ratios, and other covenants, representations, warranties, indemnification provisions, and events of default that are customary for senior secured credit facilities, including the cessation of involvement of Ronald F. Valenta, the Company’s chairman of the board and chief executive officer, in the operations and management of GFN, Pac-Van or Lone Star as a director or officer.
At June 30, 2014, borrowings and availability under the Wells Fargo Credit Facility totaled $81,483,000 and $77,814,000, respectively.
Southern Frac Senior Credit Facility
Southern Frac has a senior credit facility with Wells Fargo, as amended, (“Wells Fargo SF Credit Facility”) that provides with (i) a senior secured revolving line of credit under which Southern Frac may borrow, subject to the terms of a borrowing base, as defined, up to $12,000,000 with a three-year maturity; (ii) a combined $860,000 equipment and capital expenditure term loan (the “Restated Equipment Term Loan”), which fully amortizes over 48 months commencing July 1, 2013; and (iii) a $1,500,000 term loan (the “Term Loan B”), which fully amortizes over 18 months, commencing May 1, 2013. The Wells Fargo SF Credit Facility contains, among other things, certain financial covenants, including fixed charge coverage ratios, and other covenants, representations, warranties, indemnification provisions, and events of default that are customary for senior secured credit facilities; including events of default relating to a change of control of GFN, GFNMC and Southern Frac. Borrowings under the Wells Fargo SF Credit Facility will accrue interest based on the three-month LIBOR, plus a margin equal to 3.5% for the revolving line of credit, 4.0% for the Restated Equipment Term Loan and 7.0% for the Term Loan B.
At June 30, 2014, borrowings outstanding and availability under the Wells Fargo SF Credit Facility totaled $925,000 and $6,523,000, respectively.
F-20
Table of Contents
GENERAL FINANCE CORPORATION AND SUBSIDIARIES
NOTES TO CONSOLIDATED FINANCIAL STATEMENTS
Credit Suisse Term Loan
On March 31, 2014, the Company, at the corporate level, entered into a $25,000,000 facility agreement with Credit Suisse AG, Singapore Branch (“Credit Suisse Term Loan”) as part of the financing for the acquisition of Lone Star (see Note 4) and, on April 3, 2014, the Company borrowed the $25,000,000 available to it. The Credit Suisse Term Loan provides that the amount borrowed will bear interest at LIBOR plus 7.50% per year, will be payable quarterly, and that all principal and interest will mature two years from the date that the Company borrowed the $25,000,000. In addition, the Credit Suisse Term Loan is secured by a first ranking pledge over all shares of RWH owned by GFN U.S., requires a certain coverage maintenance ratio in U.S. dollars based on the value of the RWH shares and, among other things, that an amount equal to six-months interest be deposited in an interest reserve account pledged to secure repayment of all amounts borrowed.
8.125% Senior Notes
On June 18, 2014, the Company completed the sale of unsecured senior notes (the “Senior Notes”) in a public offering for an aggregate principal amount of $72,000,000, which represented 100% of the principal amount and included the underwriters’ full exercise of their over-allotment option of $9,000,000. Net proceeds were $69,069,000, after deducting underwriting discounts and offering costs of approximately $2,931,000. The Senior Notes were issued in minimum denominations of $25 and integral multiples of $25 in excess thereof and pursuant to the First Supplemental Indenture (the “First Supplemental Indenture”) dated as of June 18, 2014 by and between the Company and Wells Fargo, as trustee (the “Trustee”). The First Supplemental Indenture supplements the Indenture entered into by and between the Company and the Trustee dated as of June 18, 2014 (the “Base Indenture” and, together with the First Supplemental Indenture, the “Indenture”). The Senior Notes bear interest at the rate of 8.125% per annum, mature on July 31, 2021 and are not subject to any sinking fund. Interest on the Senior Notes is payable quarterly in arrears on January 31, April 30, July 31 and October 31, commencing on July 31, 2014. The Company used $68,600,000 of the net proceeds (plus an additional $4,000,000 of GFN corporate cash on hand) to reduce indebtedness at Pac-Van and Lone Star under the Wells Fargo Credit Facility, pursuant to the requirement that at least 80% of the gross proceeds, or $57,600,000, be used for that purpose in order to permit the payment of intercompany dividends by Pac-Van and Lone Star to GFN to fund the interest requirements of the Senior Notes.
The Senior Notes rank equally in right of payment with all of the Company’s existing and future unsecured senior debt and senior in right of payment to all of its existing and future subordinated debt. The Senior Notes are effectively subordinated to any of the Company’s existing and future secured debt, to the extent of the value of the assets securing such debt. The Senior Notes are structurally subordinated to all existing and future liabilities of the Company’s subsidiaries and are not guaranteed by any of the Company’s subsidiaries.
The Company may, at its option, prior to July 31, 2017, redeem the Senior Notes in whole or in part upon the payment of 100% of the principal amount of the Senior Notes being redeemed plus any additional amount required by the Indenture. In addition, the Company may from time to time redeem up to 35% of the aggregate outstanding principal amount of the Senior Notes before July 31, 2017 with the net cash proceeds from certain equity offerings at a redemption price of 108.125% of the principal amount plus accrued and unpaid interest. If the Company sells certain of its assets or experience specific kinds of changes in control, as defined, it must offer to purchase the Senior Notes.
The Company may, at its option, at any time and from time to time, on or after July 31, 2017, redeem the Senior Notes in whole or in part. The Senior Notes will be redeemable at a redemption price initially equal to 106.094% of the principal amount of the Senior Notes (and which declines on each year on July 31) plus accrued and unpaid interest to the date of redemption. On and after any redemption date, interest will cease to accrue on the redeemed Senior Notes.
The Indenture contains covenants which, among other things, limit the Company’s ability to make certain payments, to pay dividends and to incur additional indebtedness if the incurrence of such indebtedness would cause the company’s consolidated fixed charge coverage ratio, as defined in the Indenture, to be below 2.0 to 1.0.
The Senior Notes are listed on the NASDAQ Stock Market under the symbol “GFNSL.”
Other
Other debt totaled $12,199,000 at June 30, 2014.
At June 30, 2014, the Company was in compliance with the financial covenants under its senior credit facilities.
F-21
Table of Contents
GENERAL FINANCE CORPORATION AND SUBSIDIARIES
NOTES TO CONSOLIDATED FINANCIAL STATEMENTS
The weighted-average interest rate in the Asia-Pacific area was 6.1% and 5.7% in FY 2013 and FY 2014, respectively; which does not include the effect of translation, interest rate swap contracts and options and the amortization of deferred financing costs. The weighted-average interest rate in North America was 4.8% and 4.1% in FY 2013 and FY 2014, respectively, which does not include the effect of the amortization of deferred financing costs and accretion of interest.
Senior and other debt consisted of the following at June 30, 2013 and 2014 (in thousands):
| June 30, | ||||||||
| 2013 | 2014 | |||||||
| ANZ Credit Facility |
$ | 91,503 | $ | — | ||||
| ANZ/CBA Credit Facility |
— | 111,270 | ||||||
| Wells Fargo Credit Facility |
64,036 | 81,483 | ||||||
| Wells Fargo SF Credit Facility |
3,800 | 925 | ||||||
| Credit Suisse Term Loan |
— | 25,000 | ||||||
| Senior Notes |
— | 72,000 | ||||||
| Other |
3,612 | 12,199 | ||||||
|
|
|
|
|
|||||
| $ | 162,951 | $ | 302,877 | |||||
|
|
|
|
|
|||||
Scheduled Maturities on Senior and Other Debt
The scheduled maturities for the senior credit facilities senior subordinated notes and other debt at June 30, 2014 were as follows (in thousands):
| Year Ending June 30, |
||||
| 2015 |
$ | 4,368 | ||
| 2016 |
28,795 | |||
| 2017 |
1,380 | |||
| 2018 |
194,015 | |||
| 2019 |
1,347 | |||
| Thereafter |
72,972 | |||
|
|
|
|||
| $ | 302,877 | |||
|
|
|
|||
Note 6. Financial Instruments
Fair Value Measurements
FASB ASC Topic 820, Fair Value Measurements and Disclosures, defines fair value as the price that would be received from selling an asset or paid to transfer a liability in an orderly transaction between market participants. As such, fair value is a market-based measurement that should be determined based on assumptions that market participants would use in pricing an asset or liability. As a basis for considering such assumptions, FASB ASC Topic 820 establishes a three-tier fair value hierarchy, which prioritizes the inputs used in measuring fair value, as follows:
Level 1 - Observable inputs such as quoted prices in active markets for identical assets or liabilities;
Level 2 - Observable inputs, other than Level 1 inputs in active markets, that are observable either directly or indirectly; and
Level 3 - Unobservable inputs in which there is little or no market data, which require the reporting entity to develop its own assumptions.
The Company’s derivative instruments are not traded on a market exchange; therefore, the fair values are determined using valuation models that include assumptions about yield curve at the reporting dates as well as counter-party credit risk. The assumptions are generally derived from market-observable data. The Company has consistently applied these calculation techniques to all periods presented, which are considered Level 2.
F-22
Table of Contents
GENERAL FINANCE CORPORATION AND SUBSIDIARIES
NOTES TO CONSOLIDATED FINANCIAL STATEMENTS
Derivative instruments measured at fair value and their classification in the consolidated balances sheets and statements of operations are as follows (in thousands):
| Type of Derivative Contract |
Balance Sheet Classification |
Derivative - Fair Value (Level 2) |
||||||||
| June 30, 2013 | June 30, 2014 | |||||||||
| Swap Contracts and Options (Caps and Collars) |
Trade payables and accrued liabilities | $ | 1,210 | $ | 1,535 | |||||
| Forward-Exchange Contracts |
Trade payables and accrued liabilities | — | 230 | |||||||
| Forward-Exchange Contracts |
Trade and other receivables | 713 | — | |||||||
|
|
|
|
|
|||||||
| Type of Derivative Contract |
Statement of Operations Classification |
Year Ended June 30, 2013 |
Year Ended June 30, 2014 |
|||||||
| Swap Contracts and Options (Caps and Collars) |
Unrealized gain (loss) included in interest expense | $ | 149 | $ | (219 | ) | ||||
| Forward-Exchange Contracts |
Unrealized foreign currency exchange gain (loss) and other | 820 | (939 | ) | ||||||
|
|
|
|
|
|||||||
Interest Rate Swap Contracts
The Company’s exposure to market risk for changes in interest rates relates primarily to its senior and other debt obligations. The Company’s policy is to manage its interest expense by using a mix of fixed and variable rate debt.
To manage its exposure to variable interest rates in a cost-efficient manner, the Company enters into interest rate swaps and interest rate options, in which the Company agrees to exchange, at specified intervals, the difference between fixed and variable interest amounts calculated by reference to an agreed-upon notional principal amount. These swaps and options are designated to hedge changes in the interest rate of a portion of the outstanding borrowings in the Asia-Pacific area. The Company believes that financial instruments designated as interest rate hedges were highly effective; however, prior to August 2012, documentation of such, as required by FASB ASC Topic 815, Derivatives and Hedging, did not exist. Therefore, all movements in the fair values of these hedges prior to August 2012 were reported in the consolidated statements of operations in the periods in which fair values change. In August 2012, the Company entered into an interest swap contract that met documentation requirements and, as such, it was designated as a cash flow hedge. This cash flow hedge was determined to be highly effective in FY 2013 and FY 2014 and, therefore, changes in the fair value of the effective portion were recorded in accumulated other comprehensive income. The Company expects this derivative to remain effective during the remaining term of the swap; however, any changes in the portion of the hedge considered ineffective would be recorded in interest expense in the consolidated statement of operations. In FY 2013 and FY 2014, the ineffective portion of this cash flow hedge recorded in interest expense was an unrealized gain (loss) of $229,000 and $(219,000), respectively.
The Company’s interest rate derivative instruments are not traded on a market exchange; therefore, the fair values are determined using valuation models which include assumptions about the interest rate yield curve at the reporting dates (Level 2 fair value measurement). As of June 30, 2013 and June 30, 2014, there was one open interest rate swap contract that was designated as a cash flow hedge and matures in June 2017, as follows (dollars in thousands):
| June 30, 2013 | June 30, 2014 | |||||||||||||||
| Swap | Option (Cap) | Swap | Option | |||||||||||||
| Notional amounts |
$ | 45,730 | $ | — | $ | 47,195 | $ | — | ||||||||
| Fixed/Strike Rates |
3.98 | % | — | 3.98 | % | — | ||||||||||
| Floating Rates |
2.87 | % | — | 2.72 | % | — | ||||||||||
| Fair Value of Combined Contracts |
$ | (1,210 | ) | $ | — | $ | (1,535 | ) | $ | — | ||||||
|
|
|
|
|
|
|
|
|
|||||||||
F-23
Table of Contents
GENERAL FINANCE CORPORATION AND SUBSIDIARIES
NOTES TO CONSOLIDATED FINANCIAL STATEMENTS
Foreign Currency Risk
The Company has transactional currency exposures. Such exposure arises from sales or purchases in currencies other than the functional currency. The currency giving rise to this risk is primarily U.S. dollars. Royal Wolf has a bank account denominated in U.S. dollars into which a small number of customers pay their debts. This is a natural hedge against fluctuations in the exchange rate. The funds are then used to pay suppliers, avoiding the need to convert to Australian dollars. Royal Wolf uses forward currency and participating forward contracts to eliminate the currency exposures on the majority of its transactions denominated in foreign currencies, either by transaction if the amount is significant, or on a general cash flow hedge basis. The forward currency and participating forward contracts are always in the same currency as the hedged item. The Company believes that financial instruments designated as foreign currency hedges are highly effective. However documentation of such as required by ASC Topic 815 does not exist. Therefore, all movements in the fair values of these hedges are reported in the statement of operations in the period in which fair values change. As of June 30, 2013, there were 43 open forward exchange and two participating forward contracts that mature between July 2013 and November 2013; and as of June 30, 2014, there were 58 open forward exchange contracts that mature between July 2014 and April 2015, as follows (dollars in thousands):
| June 30, 2013 | June 30, 2014 | |||||||||||||||
| Forward Exchange | Participating Forward |
Forward Exchange | Participating Forward |
|||||||||||||
| Notional amounts |
$ | 17,003 | $ | 3,000 | $ | 14,405 | $ | — | ||||||||
| Exchange/Strike Rates (AUD to USD) |
0.9077 – 1.0234 | 0.9262 | 0.8774 – 0.93357 | — | ||||||||||||
| Fair Value of Combined Contracts |
$ | 692 | $ | 21 | $ | (230 | ) | $ | — | |||||||
|
|
|
|
|
|
|
|
|
|||||||||
In FY 2013 and FY 2014, net unrealized and realized foreign exchange gains (losses) totaled $(272,000) and $229,000, and $217,000 and $(628,000) respectively.
Fair Value of Other Financial Instruments
The fair value of the Company’s borrowings under the Senior Notes at June 30, 2014 was determined based on a Level 1 input and for its senior credit facilities at June 30, 2013 and 2014, determined based on Level 3 inputs, including a search for debt issuances with maturities comparable to the Company’s debt (“Debt Issuances with Upcoming Call Dates”), a comparison to a group of comparable industry debt issuances (“Industry Comparable Debt Issuances”) and a study of credit (“Credit Spread Analysis”). Under the Debt Issuances with Upcoming Call Dates, the Company performed a Yield-to-Worse analysis on debt issuances with call dates that were comparable to the maturity dates of the Company’s borrowings. Under the Industry Comparable Debt Issuance method, the Company compared the debt facilities to several industry comparable debt issuances. This method consisted of an analysis of the offering yields compared to the current yields on publicly traded debt securities. Under the Credit Spread Analysis, the Company first examined the implied credit spreads of the United States Federal Reserve. Based on this analysis the Company was able to assess the credit market. The fair value of the Company’s senior credit facilities as of June 30, 2013 and 2014 was determined to be approximately $156,098,000 and 291,781,000, respectively. The Company also determined that the fair value of its other debt of $3,612,000 and $12,199,000 at June 30, 2013 and 2014, respectively, approximated or would not vary significantly from their carrying values.
Under the provisions of FASB ASC Topic 825, Financial Instruments, the carrying value of the Company’s other financial instruments (consisting primarily of cash and cash equivalents, net receivables, trade payables and accrued liabilities) approximate fair value.
Credit Risk and Allowance for Doubtful Accounts
Financial instruments potentially exposing the Company to concentrations of credit risk consist primarily of receivables. Concentrations of credit risk with respect to receivables are limited due to the large number of customers spread over a large geographic area in many industry sectors and no single customer accounted for more than 10% our consolidated revenues or trade receivables during and at the periods presented. However, in North America a significant portion of the Company’s business activity is with companies in the construction and oil and gas industries. Revenues and receivables from the construction industry totaled $24,953,000 and $4,177,000 during FY 2013 and at June 30, 2013, respectively; and $26,915,000 and $5,229,000 during FY 2014 and at June 30, 2014, respectively. In our North American leasing operations, revenues of $28,423,000 and receivables of $23,276,000 during FY 2014 and at June 30, 2014 were from the oil and gas industry. In addition, substantially all of the Company’s North American manufacturing business at Southern Frac during FY 2013 and FY 2014 were from the oil and gas industry.
F-24
Table of Contents
GENERAL FINANCE CORPORATION AND SUBSIDIARIES
NOTES TO CONSOLIDATED FINANCIAL STATEMENTS
The Company’s receivables related to sales of lease inventories and fleet are generally secured by the equipment sold to the customer. The Company’s receivables related to its leasing operations are primarily amounts generated from both off-site and on-site customers. The Company has the right to repossess lease equipment for nonpayment. It is the Company’s policy that all customers who wish to purchase or lease containers on credit terms are subject to credit verification procedures and the Company will agree to terms with customers believed to be creditworthy. In addition, receivable balances are monitored on an ongoing basis with the result that the Company’s exposure to bad debts is not significant. Net allowance for doubtful accounts provided and uncollectible accounts written off, net of recoveries and other, was $945,000 and $1,090,000 and $2,994,000 and $1,464,000 for FY 2013 and FY 2014, respectively. The translation gain (loss) to the allowance for doubtful accounts for FY 2013 and FY 2014 was $(118,000) and $43,000, respectively.
With respect to credit risk arising from the other significant financial assets of the Company, which comprise cash and cash equivalents, available-for-sale financial assets and certain derivative instruments, the Company’s exposure to credit risk arises from default of the counter party, with a maximum exposure equal to the carrying amount of these instruments. As the counter party for derivative instruments is nearly always a bank, the Company has assessed this as a low risk.
Note 7. Income Taxes
Income (loss) before provision for income taxes consisted of the following (in thousands):
| Year Ended June 30, | ||||||||
| 2013 | 2014 | |||||||
| North America |
$ | (2,270 | ) | $ | 6,609 | |||
| Asia-Pacific |
21,878 | 20,160 | ||||||
|
|
|
|
|
|||||
| $ | 19,608 | $ | 26,769 | |||||
|
|
|
|
|
|||||
The provision for income taxes consisted of the following (in thousands):
| Year Ended June 30, | ||||||||
| 2013 | 2014 | |||||||
| Current: |
||||||||
| U.S. Federal |
$ | — | $ | — | ||||
| State |
— | — | ||||||
| Foreign |
496 | 1,427 | ||||||
|
|
|
|
|
|||||
| 496 | 1,427 | |||||||
|
|
|
|
|
|||||
| Deferred: |
||||||||
| U.S. Federal |
3,322 | 4,431 | ||||||
| State |
391 | 506 | ||||||
| Foreign |
3,986 | 5,256 | ||||||
|
|
|
|
|
|||||
| 7,699 | 10,193 | |||||||
|
|
|
|
|
|||||
| $ | 8,195 | $ | 11,620 | |||||
|
|
|
|
|
|||||
The components of the net deferred tax liability are as follows (in thousands):
| June 30, | ||||||||
| 2013 | 2014 | |||||||
| Deferred tax assets: |
||||||||
| Net operating loss and tax credit carryforwards |
$ | 11,212 | $ | 7,292 | ||||
| Accrued compensation and other benefits |
1,505 | 2,151 | ||||||
| Allowance for doubtful accounts |
405 | 1,038 | ||||||
|
|
|
|
|
|||||
| Total deferred tax assets |
13,122 | 10,481 | ||||||
| Valuation allowance |
— | — | ||||||
|
|
|
|
|
|||||
| Net deferred tax assets |
13,122 | 10,481 | ||||||
|
|
|
|
|
|||||
| Deferred tax liabilities: |
||||||||
| Accelerated tax depreciation and amortization |
(38,631 | ) | (44,894 | ) | ||||
| Deferred revenue and expenses |
(2,067 | ) | (3,860 | ) | ||||
|
|
|
|
|
|||||
| Total deferred tax liabilities |
(40,698 | ) | (48,754 | ) | ||||
|
|
|
|
|
|||||
| Net deferred tax liabilities |
$ | (27,576 | ) | $ | (38,273 | ) | ||
|
|
|
|
|
|||||
F-25
Table of Contents
GENERAL FINANCE CORPORATION AND SUBSIDIARIES
NOTES TO CONSOLIDATED FINANCIAL STATEMENTS
At June 30, 2014, the Company had a U.S. federal net operating loss carryforward of $33,114,000, which expires if unused during fiscal years 2021 – 2032, and state net operating loss carryforwards of $19,497,000, which will begin expiring in fiscal year 2019. As a result of the stock ownership change in the Pac-Van acquisition in October 2008, the available deduction of the net operating loss carryforward of $10,300,000 is generally limited to approximately $2,500,000 on a yearly basis.
Management evaluates the ability to realize its deferred tax assets on a quarterly basis and adjusts the amount of its valuation allowance if necessary. No valuation allowance has been determined to be required as of June 30, 2013 and 2014.
A reconciliation of the U.S. federal statutory rate to the Company’s effective tax rate is as follows:
| Year Ended June 30, | ||||||||
| 2013 | 2014 | |||||||
| Federal statutory rate |
34.0 | % | 35.0 | % | ||||
| Adjustments to federal statutory rate in current year (a) |
— | 2.2 | ||||||
| State and Asia-Pacific taxes, net of U.S. federal benefit and credit |
7.8 | 6.2 | ||||||
|
|
|
|
|
|||||
| Effective tax rate |
41.8 | % | 43.4 | % | ||||
|
|
|
|
|
|||||
| (a) | Represents an adjustment of $594,000 in FY 2014 to deferred taxes prior to July 1, 2014. |
Note 8. Related-Party Transactions
Effective January 31, 2008, the Company entered into a lease with an affiliate of Ronald F. Valenta for its corporate headquarters in Pasadena, California. The rent is $7,393 per month, effective March 1, 2009, plus allocated charges for common area maintenance, real property taxes and insurance, for approximately 3,000 square feet of office space. The term of the lease is five years, with two five-year renewal options, and the rent is adjusted yearly based on the consumer price index. On October 11, 2012, the Company exercised its option to renew the lease for an additional five-year term commencing February 1, 2013. Rental payments were $110,000 in both FY 2013 and FY 2014.
Effective October 1, 2008, the Company entered into a services agreement with an affiliate of Mr. Valenta for certain accounting, administrative and secretarial services to be provided at the corporate offices and for certain operational, technical, sales and marketing services to be provided directly to the Company’s operating subsidiaries. Charges for services rendered at the corporate offices will be, until further notice, at $7,000 per month and charges for services rendered to the Company’s subsidiaries will vary depending on the scope of services provided. The services agreement provides for, among other things, mutual modifications to the scope of services and rates charged and automatically renews for successive one-year terms, unless terminated in writing by either party prior to the fiscal year end. Total charges to the Company at the corporate office for services rendered under this agreement totaled $84,000 in both FY 2013 and FY 2014. The services agreement was terminated by the Company effective June 30, 2014.
Revenues at Pac-Van from affiliates of Mr. Valenta totaled $64,000 and $33,000 during FY 2013 and FY 2014, respectively; and equipment and other services purchased by Pac-Van from these affiliated entities totaled $3,000 in FY 2013. There were no such purchases in FY 2014.
The premises of Pac-Van’s Las Vegas branch is owned by and currently leased from the acting branch manager through December 31, 2014, with the right for an additional two-year extension through December 31, 2016. Rental payments on this lease totaled $116,000 and $118,000 during FY 2013 and FY 2014, respectively.
Note 9. Equity Plans
On August 29, 2006, the Board of Directors of the Company adopted the General Finance Corporation 2006 Stock Option Plan (“2006 Plan”), which was approved and amended by stockholders on June 14, 2007 and December 11, 2008, respectively. Options granted and outstanding under the 2006 Plan are either incentive stock options under Section 422 of the Internal Revenue Code of 1986, as amended, or so-called non-qualified options that are not intended to meet incentive stock option requirements. All options granted do not have a term in excess of ten years, and the exercise price of any option is not less than the fair market value of the Company’s common stock on the date of grant. After the adoption by the Board of Directors and upon the approval of the 2009 Stock Incentive Plan (“2009 Plan”) by the stockholders (see below), the Company suspended any further grants under the 2006 Plan.
F-26
Table of Contents
GENERAL FINANCE CORPORATION AND SUBSIDIARIES
NOTES TO CONSOLIDATED FINANCIAL STATEMENTS
On September 21, 2009, the Board of Directors of the Company adopted the 2009 Plan, which was approved by the stockholders at the Company’s annual meeting on December 10, 2009. The 2009 Plan is an “omnibus” incentive plan permitting a variety of equity programs designed to provide flexibility in implementing equity and cash awards, including incentive stock options, nonqualified stock options, restricted stock grants (“non-vested equity shares”), restricted stock units, stock appreciation rights, performance stock, performance units and other stock-based awards. Participants in the 2009 Plan may be granted any one of the equity awards or any combination of them, as determined by the Board of Directors or the Compensation Committee. Upon the approval of the 2009 Plan by the stockholders, the Company suspended further grants under the 2006 Plan (see above). Any stock options which are forfeited under the 2006 Plan will become available for grant under the 2009 Plan, but the total number of shares available under the 2006 Plan and the 2009 Plan will not exceed the 2,500,000 shares reserved for grant under the 2006 Plan. Unless terminated earlier at the discretion of the Board of Directors, the 2009 Plan will terminate December 10, 2019.
The 2006 Plan and the 2009 Plan are referred to collectively as the “Stock Incentive Plan.”
There have been no grants or awards of restricted stock units, stock appreciation rights, performance stock or performance units under the Stock Incentive Plan. All grants to-date consist of incentive and non-qualified stock options that vest over a period of up to five years (“time-based”), non-qualified stock options that vest over varying periods that are dependent on the attainment of certain defined EBITDA and other targets (“performance-based”) and non-vested equity shares. At June 30, 2014, 121,860 shares remain available for grant.
On January 31, 2013 (“January 2013 Grant”), the Company granted options to three key employees of Southern Frac to purchase a total of 70,000 shares of common stock at an exercise price equal to the closing market price of the Company’s common stock as of that date, or $4.95 per share. The January 2013 Grant consists of 40,000 performance-based options that vest over 43.5 months, subject to performance conditions based on achieving cumulative EBITDA and indebtedness targets for the fiscal years ending June 30, 2013 - 2015, and 30,000 time-based options that vest over five years.
On June 7, 2013 and June 13, 2013 (collectively, the “June 2013 Grants”), the Company granted time-based options to 32 officers and key employees of GFN, Pac-Van and Southern Frac and one non-employee consultants to purchase 158,500 and 120,000 shares of common stock, respectively, at an exercise price equal to the closing market price of the Company’s common stock as of those dates, or $4.43 and $4.50 per share, respectively. The options under the June 2013 Grants vest over three years from the respective date of grant.
In FY 2013, the weighted-average fair value of the stock options granted to officers and key employees was $3.23, determined using the Black-Scholes option-pricing model using the following assumptions: a risk-free interest rate of 1.45% - 1.65%, an expected life of 7.5 years, an expected volatility of 73.1% - 77.5% and no expected dividend.
On June 19, 2014 (the “June 2014 Grant”), the Company granted time-based options to 13 key employees of Pac-Van to purchase 45,000 shares of common stock at an exercise price equal to the closing market price of the Company’s common stock as of that date, or $9.25 per share. The options under the June 2014 Grant vest over 39 months from the date of grant. The weighted-average fair value of the stock options in the June 2014 Grant was $6.35, determined using the Black-Scholes option-pricing model using the following assumptions: a risk-free interest rate of 2.18%, an expected life of 7.5 years, an expected volatility of 69.6% and no expected dividend.
Since inception, the range of the fair value of the stock options granted (other than to non-employee consultants) and the assumptions used are as follows:
| Fair value of stock options |
$0.81 - $6.35 | |
|
| ||
| Assumptions used: |
||
| Risk-free interest rate |
1.19% - 4.8% | |
| Expected life (in years) |
7.5 | |
| Expected volatility |
26.5% - 84.6% | |
| Expected dividends |
— | |
|
| ||
At June 30, 2014, the weighted-average fair value of the stock options granted to non-employee consultants was $5.11, determined using the Black-Scholes option-pricing model using the following assumptions: a risk-free interest rate of 2.17% - 2.35%, an expected life of 7.9 - 9.0 years, an expected volatility of 69.6% and no expected dividend.
F-27
Table of Contents
GENERAL FINANCE CORPORATION AND SUBSIDIARIES
NOTES TO CONSOLIDATED FINANCIAL STATEMENTS
A summary of the Company’s stock option activity and related information for FY 2013 and FY 2014 follows:
| Number of Options (Shares) |
Weighted- Average Exercise Price |
Weighted- Average Remaining Contractual Term (Years) |
||||||||||
| Outstanding at June 30, 2012 |
1,843,664 | $ | 4.96 | |||||||||
| Granted |
348,500 | 4.56 | ||||||||||
| Exercised |
(6,666 | ) | 1.22 | |||||||||
| Forfeited or expired |
(14,900 | ) | 1.06 | |||||||||
|
|
|
|
|
|||||||||
| Outstanding at June 30, 2013 |
2,170,598 | $ | 4.93 | 6.8 | ||||||||
|
|
|
|
|
|
|
|||||||
| Vested and expected to vest at June 30, 2013 |
2,170,598 | $ | 4.93 | 6.8 | ||||||||
|
|
|
|
|
|
|
|||||||
| Exercisable at June 30, 2013 |
916,924 | $ | 7.18 | 4.6 | ||||||||
|
|
|
|
|
|
|
|||||||
| Number of Options (Shares) |
Weighted- Average Exercise Price |
Weighted- Average Remaining Contractual Term (Years) |
||||||||||
| Outstanding at June 30, 2013 |
2,170,598 | $ | 4.93 | |||||||||
| Granted |
45,000 | 9.25 | ||||||||||
| Exercised |
(6,668 | ) | 1.22 | |||||||||
| Forfeited or expired |
(56,110 | ) | 5.10 | |||||||||
|
|
|
|
|
|||||||||
| Outstanding at June 30, 2014 |
2,152,820 | $ | 5.03 | 5.6 | ||||||||
|
|
|
|
|
|
|
|||||||
| Vested and expected to vest at June 30, 2014 |
2,152,820 | $ | 5.03 | 5.6 | ||||||||
|
|
|
|
|
|
|
|||||||
| Exercisable at June 30, 2014 |
1,091,694 | $ | 6.76 | 4.2 | ||||||||
|
|
|
|
|
|
|
|||||||
At June 30, 2014, outstanding time-based options and performance-based options totaled 1,208,950 and 943,870, respectively. Also at that date, the Company’s market price for its common stock was $9.50 per share, which was above the exercise prices of all of the outstanding stock options. As a result, the intrinsic value of the outstanding stock options at that date was $8,390,000. Share-based compensation of $5,277,000 related to stock options has been recognized in the consolidated statements of operations, with a corresponding benefit to equity, from inception through June 30, 2014. At that date, there remains $1,347,000 of unrecognized compensation expense to be recorded on a straight-line basis over the remaining weighted-average vesting period of 1.2 years.
A deduction is not allowed for U.S. income tax purposes with respect to non-qualified options granted in the United States until the stock options are exercised or, with respect to incentive stock options issued in the United States, unless the optionee makes a disqualifying disposition of the underlying shares. The amount of any deduction will be the difference between the fair value of the Company’s common stock and the exercise price at the date of exercise. Accordingly, there is a deferred tax asset recorded for the U.S. tax effect of the financial statement expense recorded related to stock option grants in the United States. The tax effect of the U.S. income tax deduction in excess of the financial statement expense, if any, will be recorded as an increase to additional paid-in capital.
On June 7, 2013, the Company granted a total of 115,000 non-vested equity shares to seven officers and key employees of GFN, Pac-Van and Southern Frac at a value equal to the closing market price of the Company’s common stock as of that date, or $4.43 per share. The non-vested equity shares are subject to performance conditions based on achieving adjusted EBITDA and return of capital targets for the fiscal years ending June 30, 2014 and 2015 and would be expected to vest 39 months from the date of grant.
On December 5, 2013, the Company granted a total of 18,295 non-vested equity shares to the five non-employee members of the Company’s Board of Directors at a value equal to the closing market price of the Company’s common stock as of that date, or $6.15 per share, which vest one year from the date of grant.
F-28
Table of Contents
GENERAL FINANCE CORPORATION AND SUBSIDIARIES
NOTES TO CONSOLIDATED FINANCIAL STATEMENTS
On February 11, 2014, the Company granted a total of 3,424 non-vested equity shares to a non-employee member of the Company’s Board of Directors at a value equal to the closing market price of the Company’s common stock as of that date, or $6.571 per share, which vest one year from the date of grant.
On June 19, 2014, the Company granted a total of 68,601 non-vested equity shares to 17 officers and key employees of GFN, Southern Frac and Lone Star at a value equal to the closing market price of the Company’s common stock as of that date, or $9.25 per share. The non-vested equity shares are subject to performance conditions based on achieving adjusted EBITDA and return of capital targets for the fiscal years ending June 30, 2015 and 2016 and would be expected to vest 30 months from the date of grant.
Share-based compensation of $248,000 related to non-vested equity shares and has been recognized in the consolidated statements of operations, with a corresponding benefit to equity, from inception through June 30, 2014. At that date, there remains $1,032,000 of unrecognized compensation expense to be recorded on a straight-line basis over the remaining vesting period of over approximately 2.25 years, 0.49 years, 0.66 years and 2.5 years for the June 7, 2013, December 5, 2013, February 11, 2014 and June 19, 2014 non-vested equity grants, respectively.
Royal Wolf Long Term Incentive Plan
In conjunction with the RWH IPO (see Note 1), Royal Wolf established the Royal Wolf Long Term Incentive Plan (the “LTI Plan”). Under the LTI Plan, the RWH Board of Directors may grant, at its discretion, options, performance rights and/or restricted shares of RWH capital stock to Royal Wolf employees and executive directors. Vesting terms and conditions may be up to four years and, generally, will be subject to performance criteria based primarily on enhancing shareholder returns using a number of key financial benchmarks, including EBITDA. In addition, unless the RWH Board determines otherwise, if an option, performance right or restricted share has not lapsed or been forfeited earlier, it will terminate at the seventh anniversary from the date of grant.
It is intended that up to one percent of RWH’s outstanding capital stock will be reserved for grant under the LTI Plan and a trust will be established to hold RWH shares for this purpose. However, so long as the Company holds more than 50% of the outstanding shares of RWH capital stock, RWH shares reserved for grant under the LTI Plan are required to be purchased in the open market unless the Company agrees otherwise. The LTI Plan, among other provisions, does not permit the transfer, sale, mortgage or encumbering of options, performance rights and restricted shares without the prior approval of the RWH Board. In the event of a change of control, the RWH Board, at its discretion, will determine whether, and how many, unvested options, performance rights and restricted shares will vest. In addition, if, in the RWH Board’s opinion, a participant acts fraudulently or dishonestly or is in breach of his obligations to Royal Wolf, the RWH Board may deem any options, performance rights and restricted shares held by or reserved for the participant to have lapsed or been forfeited.
As of June 30, 2014, the Royal Wolf Board of Directors has granted 1,359,000 performance rights to key management personnel under the LTI Plan. In FY 2013 and FY 2014, share-based compensation of $488,000 and $840,000, respectively, related to the LTI Plan has been recognized in the consolidated statements of operations, with a corresponding benefit to equity.
Note 10. Commitments and Contingencies
Operating Lease Rentals
The Company leases office equipment and other facilities under operating leases. The leases have terms of between one and nine years, some with an option to renew the lease after that period. None of the leases includes contingent rentals. There are no restrictions placed upon the lessee by entering into these leases.
F-29
Table of Contents
GENERAL FINANCE CORPORATION AND SUBSIDIARIES
NOTES TO CONSOLIDATED FINANCIAL STATEMENTS
Non-cancellable operating lease rentals at June 30, 2014 are payable as follows (in thousands):
| Year Ending June 30, |
||||
| 2015 |
$ | 7,845 | ||
| 2016 |
5,335 | |||
| 2017 |
3,961 | |||
| 2018 |
3,199 | |||
| 2019 |
2,269 | |||
| Thereafter |
4,637 | |||
|
|
|
|||
| $ | 27,246 | |||
|
|
|
|||
Rental expense on non-cancellable operating leases was $8,802,000 and $9,989,000 in FY 2013 and FY 2014, respectively.
Sales-Type and Operating Fleet Leases
Future minimum receipts under sales-type and operating fleet leases at June 30, 2014 are as follows (in thousands):
| Year Ending June 30, |
||||
| 2015 |
$ | 13,334 | ||
| 2016 |
3,640 | |||
| 2017 |
1,596 | |||
| 2018 |
925 | |||
| 2019 |
758 | |||
| Thereafter |
675 | |||
|
|
|
|||
| $ | 20,928 | |||
|
|
|
|||
Other Matters
The Company is not involved in any material lawsuits or claims arising out of the normal course of business. The nature of its business is such that disputes can occasionally arise with employees, vendors (including suppliers and subcontractors) and customers over warranties, contract specifications and contract interpretations among other things. The Company assesses these matters on a case-by-case basis as they arise. Reserves are established, as required, based on its assessment of its exposure. The Company has insurance policies to cover general liability and workers compensation related claims. In the opinion of management, the ultimate amount of liability not covered by insurance under pending litigation and claims, if any, will not have a material adverse effect on our financial position, operating results or cash flows.
Note 11. Detail of Certain Accounts
Trade payables and accrued liabilities consist of the following (in thousands):
| June 30, | ||||||||
| 2013 | 2014 | |||||||
| Trade payables |
$ | 18,439 | $ | 23,344 | ||||
| Checks written in excess of bank balance |
253 | 1,548 | ||||||
| Payroll and related |
6,693 | 9,670 | ||||||
| Taxes, other than income |
1,130 | 1,772 | ||||||
| Fair value of interest swap and option and forward currency exchange contacts |
1,210 | 1,003 | ||||||
| Accrued interest |
236 | 1,765 | ||||||
| Deferred consideration |
628 | 11,303 | ||||||
| Other accruals |
3,649 | 3,433 | ||||||
|
|
|
|
|
|||||
| $ | 32,238 | $ | 53,838 | |||||
|
|
|
|
|
|||||
Note 12. Segment Reporting
Due to the acquisition of Lone Star in the fourth quarter of FY 2014, the Company re-evaluated the identification of its reportable segments under ASC Topic 280 (see Note 2). As a result of this evaluation, the Company added Lone Star as an operating segment and, along with Pac-Van, includes it as a part of the North American leasing operations. Southern Frac, which is also an operating segment, is the Company’s North American manufacturing operations and,
F-30
Table of Contents
GENERAL FINANCE CORPORATION AND SUBSIDIARIES
NOTES TO CONSOLIDATED FINANCIAL STATEMENTS
along with the North American leasing operations, forms the North America geographic segment. These changes to our reporting segments are consistent with the way management evaluates the performance of operations, develops strategy and allocates capital resources. All prior period disclosures have been adjusted conform to the new presentation.
We have two geographic areas that include four operating segments; the Asia-Pacific area, consisting of the leasing operations of Royal Wolf, and, as discussed above, North America, consisting of the combined leasing operations of Pac-Van and Lone Star, and the manufacturing operations of Southern Frac. Discrete financial data on each of the Company’s products is not available and it would be impractical to collect and maintain financial data in such a manner. In managing the Company’s business, senior management focuses on primarily growing its leasing revenues and operating cash flow (EBITDA), and investing in its lease fleet through capital purchases and acquisitions.
The tables below represent the Company’s revenues from external customers, share-based compensation expense, depreciation and amortization, operating income, interest income and expense, expenditures for additions to long-lived assets (consisting of lease fleet and property, plant and equipment), long-lived assets and goodwill; as attributed to its geographic and operating segments (in thousands):
| Year Ended June 30, 2014 | ||||||||||||||||||||||||||||||||
| North America | Asia – Pacific Leasing |
Consolidated | ||||||||||||||||||||||||||||||
| Leasing | Manufacturing | Corporate and Intercompany Adjustments |
Total | |||||||||||||||||||||||||||||
| Pac-Van | Lone Star |
Combined | ||||||||||||||||||||||||||||||
| Revenues: |
||||||||||||||||||||||||||||||||
| Sales |
$ | 31,516 | $ | — | $ | 31,516 | $ | 48,287 | $ | (31,419 | ) | $ | 48,384 | $ | 87,711 | $ | 136,095 | |||||||||||||||
| Leasing |
62,359 | 14,658 | 77,017 | — | — | 77,017 | 73,993 | 151,010 | ||||||||||||||||||||||||
|
|
|
|
|
|
|
|
|
|
|
|
|
|
|
|
|
|||||||||||||||||
| $ | 93,875 | $ | 14,658 | $ | 108,533 | $ | 48,287 | $ | (31,419 | ) | $ | 125,401 | $ | 161,704 | $ | 287,105 | ||||||||||||||||
|
|
|
|
|
|
|
|
|
|
|
|
|
|
|
|
|
|||||||||||||||||
| Share-based compensation |
$ | 312 | $ | 1 | $ | 313 | $ | 81 | $ | 686 | $ | 1,080 | $ | 858 | $ | 1,938 | ||||||||||||||||
|
|
|
|
|
|
|
|
|
|
|
|
|
|
|
|
|
|||||||||||||||||
| Depreciation and amortization |
$ | 7,928 | $ | 2,656 | $ | 10,584 | $ | 993 | $ | (227 | ) | $ | 11,350 | $ | 15,777 | $ | 27,127 | |||||||||||||||
|
|
|
|
|
|
|
|
|
|
|
|
|
|
|
|
|
|||||||||||||||||
| Operating income |
$ | 13,323 | $ | 4,311 | $ | 17,634 | $ | 6,079 | $ | (11,248 | ) | $ | 12,465 | $ | 27,576 | $ | 40,041 | |||||||||||||||
|
|
|
|
|
|
|
|
|
|
|
|
|
|
|
|
|
|||||||||||||||||
| Interest income |
$ | — | $ | — | $ | — | $ | — | $ | — | $ | — | $ | 52 | $ | 52 | ||||||||||||||||
|
|
|
|
|
|
|
|
|
|
|
|
|
|
|
|
|
|||||||||||||||||
| Interest expense |
$ | 3,402 | $ | 812 | $ | 4,214 | $ | 614 | $ | 809 | $ | 5,637 | $ | 6,315 | $ | 11,952 | ||||||||||||||||
|
|
|
|
|
|
|
|
|
|
|
|
|
|
|
|
|
|||||||||||||||||
| Additions to long-lived assets |
$ | 45,295 | $ | 16,717 | $ | 62,012 | $ | 695 | $ | (5,407 | ) | $ | 57,300 | $ | 44,210 | $ | 101,510 | |||||||||||||||
|
|
|
|
|
|
|
|
|
|
|
|
|
|
|
|
|
|||||||||||||||||
| At June 30, 2014 | ||||||||||||||||||||||||||||||||
| Long-lived assets |
$ | 175,890 | $ | 55,438 | $ | 231,328 | $ | 5,820 | $ | (6,987 | ) | $ | 230,161 | $ | 197,005 | $ | 427,166 | |||||||||||||||
|
|
|
|
|
|
|
|
|
|
|
|
|
|
|
|
|
|||||||||||||||||
| Goodwill |
$ | 36,832 | $ | 20,111 | $ | 56,943 | $ | 2,681 | $ | — | $ | 59,624 | $ | 33,542 | $ | 93,166 | ||||||||||||||||
|
|
|
|
|
|
|
|
|
|
|
|
|
|
|
|
|
|||||||||||||||||
F-31
Table of Contents
GENERAL FINANCE CORPORATION AND SUBSIDIARIES
NOTES TO CONSOLIDATED FINANCIAL STATEMENTS
| Year Ended June 30, 2013 | ||||||||||||||||||||||||
| North America | Asia – Pacific Leasing |
Consolidated | ||||||||||||||||||||||
| Leasing (Pac-Van) |
Manufacturing | Corporate and Intercompany Adjustments |
Total | |||||||||||||||||||||
| Revenues: |
||||||||||||||||||||||||
| Sales |
$ | 23,836 | $ | 31,669 | $ | (12,529 | ) | $ | 42,976 | $ | 79,167 | $ | 122,143 | |||||||||||
| Leasing |
49,226 | — | — | 49,226 | 74,174 | 123,400 | ||||||||||||||||||
|
|
|
|
|
|
|
|
|
|
|
|
|
|||||||||||||
| $ | 73,062 | $ | 31,669 | $ | (12,529 | ) | $ | 92,202 | $ | 153,341 | $ | 245,543 | ||||||||||||
|
|
|
|
|
|
|
|
|
|
|
|
|
|||||||||||||
| Share-based compensation |
$ | 259 | $ | 28 | $ | 447 | $ | 734 | $ | 582 | $ | 1,316 | ||||||||||||
|
|
|
|
|
|
|
|
|
|
|
|
|
|||||||||||||
| Depreciation and amortization |
$ | 6,154 | $ | 681 | $ | 10 | $ | 6,845 | $ | 15,396 | $ | 22,241 | ||||||||||||
|
|
|
|
|
|
|
|
|
|
|
|
|
|||||||||||||
| Operating income |
$ | 8,403 | $ | 607 | $ | (6,646 | ) | $ | 2,364 | $ | 27,127 | $ | 29,491 | |||||||||||
|
|
|
|
|
|
|
|
|
|
|
|
|
|||||||||||||
| Interest income |
$ | — | $ | — | $ | 2 | $ | 2 | $ | 56 | $ | 58 | ||||||||||||
|
|
|
|
|
|
|
|
|
|
|
|
|
|||||||||||||
| Interest expense |
$ | 3,943 | $ | 365 | $ | 398 | $ | 4,706 | $ | 6,263 | $ | 10,969 | ||||||||||||
|
|
|
|
|
|
|
|
|
|
|
|
|
|||||||||||||
| Additions to long-lived assets |
$ | 33,722 | $ | 3,464 | $ | (1,799 | ) | $ | 35,387 | $ | 48,727 | $ | 84,114 | |||||||||||
|
|
|
|
|
|
|
|
|
|
|
|
|
|||||||||||||
| At June 30, 2013 | ||||||||||||||||||||||||
| Long-lived assets |
$ | 138,691 | $ | 5,887 | $ | (1,807 | ) | $ | 142,771 | $ | 167,234 | $ | 310,005 | |||||||||||
|
|
|
|
|
|
|
|
|
|
|
|
|
|||||||||||||
| Goodwill |
$ | 34,206 | $ | 2,751 | $ | — | $ | 36,957 | $ | 31,735 | $ | 68,692 | ||||||||||||
|
|
|
|
|
|
|
|
|
|
|
|
|
|||||||||||||
Intersegment net revenues related to the sales of portable liquid storage containers from Southern Frac to the North American leasing operations totaled $12,529,000 and $28,640,000 during FY 2013 and FY 2014, respectively, and intrasegment net revenues related to the sales of portable liquid storage containers from Pac-Van to Lone Star totaled $2,779,000 during the fourth quarter of FY 2014.
Note 13. Subsequent Events
On July 1, 2014, the Company, through Pac-Van, purchased the business of Black Angus Steel & Supply Co. (“Black Angus”) for approximately $5,150,000, which included the issuance of 16,002 shares of GFN common stock and holdback amounts of $1,515,000. Black Angus leases and sells containers out of two locations in Texas.
On July 17, 2014, the Board of Directors of the Company declared a cash dividend of $2.30 per share on the Series C Preferred Stock (see Note 3). The dividend is for the period commencing on April 30, 2014 through July 30, 2014, and is payable on July 31, 2014 to holders of record as of July 30, 2014.
F-32
Table of Contents
SCHEDULE I — CONDENSED FINANCIAL INFORMATION OF REGISTRANT
GENERAL FINANCE CORPORATION
(PARENT COMPANY INFORMATION)
CONDENSED BALANCE SHEETS
| June 30, | ||||||||
| 2013 | 2014 | |||||||
| (in thousands) | ||||||||
| Cash and cash equivalents |
$ | 3,152 | $ | 102 | ||||
| Receivables, net |
6 | — | ||||||
| Property and equipment, net |
5 | 3 | ||||||
| Other assets |
262 | 4,341 | ||||||
| Investment and intercompany accounts |
139,799 | 253,648 | ||||||
|
|
|
|
|
|||||
| Total Assets |
$ | 143,224 | $ | 258,094 | ||||
|
|
|
|
|
|||||
| Accounts payable, accrued and other liabilities |
$ | 1,035 | $ | 1,641 | ||||
| Senior and other debt |
37 | 97,000 | ||||||
| Other deferred credits |
1,989 | 1,191 | ||||||
| General Finance Corporation stockholders’ equity |
140,163 | 158,262 | ||||||
|
|
|
|
|
|||||
| Total Liabilities and Stockholders’ Equity |
$ | 143,224 | $ | 258,094 | ||||
|
|
|
|
|
|||||
S-1
Table of Contents
SCHEDULE I — CONDENSED FINANCIAL INFORMATION OF REGISTRANT
GENERAL FINANCE CORPORATION
(PARENT COMPANY INFORMATION)
CONDENSED STATEMENTS OF OPERATIONS
| Year Ended June 30, | ||||||||
| 2013 | 2014 | |||||||
| (in thousands) | ||||||||
| General and administrative expenses |
$ | 4,726 | $ | 5,605 | ||||
|
|
|
|
|
|||||
| Equity in earnings of subsidiaries |
3,216 | 3,184 | ||||||
| Intercompany income |
6,070 | 9,824 | ||||||
| Interest expense |
(398 | ) | (809 | ) | ||||
| Other income, net |
2 | — | ||||||
|
|
|
|
|
|||||
| 8,890 | 12,199 | |||||||
|
|
|
|
|
|||||
| Income before income taxes |
4,164 | 6,594 | ||||||
| Income tax provision (benefit) |
466 | (799 | ) | |||||
|
|
|
|
|
|||||
| Net income attributable to stockholders |
3,698 | 7,393 | ||||||
| Preferred stock dividends |
153 | 3,489 | ||||||
|
|
|
|
|
|||||
| Net income attributable to common stockholders |
$ | 3,545 | $ | 3,904 | ||||
|
|
|
|
|
|||||
S-2
Table of Contents
SCHEDULE I — CONDENSED FINANCIAL INFORMATION OF REGISTRANT
GENERAL FINANCE CORPORATION
(PARENT COMPANY INFORMATION)
CONDENSED STATEMENTS OF CASH FLOWS
| Year Ended June 30, | ||||||||
| 2013 | 2014 | |||||||
| Cash flows from operating activities: |
||||||||
| Net income attributable to stockholders |
$ | 3,698 | $ | 7,393 | ||||
| Equity in earnings of subsidiaries |
(3,216 | ) | (3,184 | ) | ||||
| Depreciation and amortization |
41 | 33 | ||||||
| Share-based compensation expense |
447 | 686 | ||||||
| Deferred income taxes |
466 | (799 | ) | |||||
| Changes in operating assets and liabilities |
(11 | ) | 108 | |||||
|
|
|
|
|
|||||
| Net cash provided by operating activities |
1,425 | 4,237 | ||||||
|
|
|
|
|
|||||
| Cash flows from investing activities: |
||||||||
| Business acquisitions, net of cash acquired |
(4,647 | ) | — | |||||
| Purchases of property and equipment |
(3 | ) | — | |||||
|
|
|
|
|
|||||
| Net cash used in investing activities |
(4,650 | ) | — | |||||
|
|
|
|
|
|||||
| Cash flows from financing activities: |
||||||||
| Repayment of senior subordinated note |
(15,000 | ) | — | |||||
| Repayments of senior and other debt borrowings |
(36 | ) | (37 | ) | ||||
| Proceeds from issuances of senior notes |
— | 72,000 | ||||||
| Proceeds from term loan borrowings |
— | 25,000 | ||||||
| Deferred financing costs |
— | (3,605 | ) | |||||
| Proceeds from issuances of common stock |
8,162 | 8 | ||||||
| Net proceeds from issuance of redeemable perpetual preferred stock offering |
37,500 | — | ||||||
| Redemption of cumulative preferred stock |
(1,295 | ) | — | |||||
| Preferred stock dividends |
(153 | ) | (3,489 | ) | ||||
| Intercompany transfers |
(29,239 | ) | (97,164 | ) | ||||
|
|
|
|
|
|||||
| Net cash used in financing activities |
(61 | ) | (7,287 | ) | ||||
|
|
|
|
|
|||||
| Net decrease in cash |
(3,286 | ) | (3,050 | ) | ||||
| Cash at beginning of period |
6,438 | 3,152 | ||||||
|
|
|
|
|
|||||
| Cash at end of period |
$ | 3,152 | $ | 102 | ||||
|
|
|
|
|
|||||
S-3
Table of Contents
EXHIBIT INDEX
| Exhibit |
Exhibit Description | |
| 21.1 | Subsidiaries of General Finance Corporation | |
| 23.1 | Consent of Independent Registered Public Accounting Firm | |
| 31.1 | Certification of Chief Executive Officer Pursuant to SEC Rule 13a-14(a)/15d-14(a) | |
| 31.2 | Certification of Chief Financial Officer Pursuant to SEC Rule 13a-14(a)/15d-14(a) | |
| 32.1 | Certification of Chief Executive Officer Pursuant to 18 U.S.C. §1350 | |
| 32.2 | Certification of Chief Financial Officer Pursuant to 18 U.S.C. §1350 | |