Attached files
| file | filename |
|---|---|
| 8-K - CURRENT REPORT OF MATERIAL EVENTS OR CORPORATE CHANGES - MATTRESS FIRM HOLDING CORP. | a14-20804_18k.htm |
Exhibit 99.1
|
|
Public Lender Presentation September 11, 2014 |

|
|
Important Notice Regarding the Information Contained in this Presentation This presentation is intended to facilitate discussions with representatives of certain institutions regarding a potential syndicated financing for Mattress Firm Holding Corp. (“Mattress Firm” or the “Company”). You should not rely on the information contained in this presentation and this presentation does not purport to be all-inclusive or to contain all of the information that a prospective participant may consider material or desirable in making its decision to become a lender. The information contained in this presentation is provided subject to the terms and conditions set forth in the “Notice to Recipients” contained in that certain Confidential Information Memorandum that accompanies this presentation. The information contained herein must be kept strictly confidential and may not be reproduced or distributed, in whole or in part, in any format without the Company’s prior written consent. 1 |
|
|
Forward Looking Statements and Non-GAAP Information This presentation contains forward-looking statements within the meaning of federal and state securities laws, that are subject to risks and uncertainties. All statements other than statements of historical fact included in this presentation are forward-looking statements. Forward-looking statements give our current expectations and projections relating to our financial condition, results of operations, plans, objectives, future performance and business. You can identify forward-looking statements by the fact that they do not relate strictly to historical or current facts. These statements may include words such as "anticipate," "estimate," "expect," "project," "plan,“ "intend," "believe" and other words and terms of similar meaning in connection with any discussion of the timing or nature of future operating or financial performance or other events. These forward-looking statements are based on assumptions that we have made in light of our industry experience and on our perceptions of historical trends, current conditions, expected future developments and other factors we believe are appropriate under the circumstances. As you consider this presentation, you should understand that these statements are not guarantees of performance or results. They involve risks, uncertainties (some of which are beyond our control) and assumptions. Although we believe that these forward-looking statements are based on reasonable assumptions, you should be aware that many factors could affect our actual financial results and cause them to differ materially from those anticipated in the forward-looking statements. Because of these factors, we caution that you should not place undue reliance on any of our forward-looking statements. Further, any forward-looking statement speaks only as of the date on which it is made. New risks and uncertainties arise from time to time, and it is impossible for us to predict those events or how they may affect us. We have no duty to, and do not intend to, update or revise the forward-looking statements in this presentation after the date of this presentation. This presentation includes “As Adjusted” data, which excludes non-recurring charges relating to our ERP system implementation costs, acquisition-related costs and impairment and severance charges. Such “As Adjusted” data is considered a financial measure not in accordance with the accounting principles generally accepted in the United States, or “GAAP,” and is not in lieu of, or preferable to, “As Reported,” or GAAP, financial data. However, we are providing this information as we believe it facilitates year-over-year comparisons for investors and financial analysts. Please refer to the reconciliation footnotes below for a reconciliation of such non-GAAP financial measures to the most directly comparable GAAP measures. 2 |
|
|
Additional Information Non-GAAP Financial Measures While the Company reports financial results in accordance with accounting principles generally accepted in the U.S., this presentation includes the non-GAAP measure Adjusted EBITDA for the Company which is not in accordance with or a substitute for GAAP measures. Mattress Firm considers Adjusted EBITDA an important supplemental measure of performance and ability to service debt. Adjusted EBITDA is often used to assess performance because it allows comparison of operating performance on a consistent basis across periods by removing the effects of various items. Adjusted EBITDA has various limitations as an analytical tool, and you should not consider it in isolation, or as a substitute for analysis of results as reported under GAAP. This presentation also includes supplemental financial measures related to Mattress Firm’s 2014 acquisition of the assets and operations of Yotes, Inc. (“Yotes”), Mattress Liquidators, Inc. (“Mattress Liquidators”), Best Mattress Co., Inc. (“Best Mattress”) and the 2014 acquisition of the outstanding equity interests in Sleep Experts Partners, L.P. (“Sleep Experts”). This presentation further includes supplemental financial measures relating to certain pending acquisitions, including the anticipated acquisition of the assets and operations of Back to Bed Inc., M World Mattress LLC, MCStores, LLC and TBE Orlando LLC (collectively, “Back to Bed”) and the outstanding equity interests in The Sleep Train Inc. (“Sleep Train”). This data has not been prepared in accordance with the requirements of GAAP, Regulation S-X or any other securities laws relating to the presentation of pro forma financial information. This data is presented for informational purposes only and does not purport to represent what Mattress Firm’s actual financial position or results of operations would have been if the acquisitions have been completed as of an earlier date or that may be achieved in the future. For a reconciliation of Pro Forma Adjusted EBITDA to Adjusted EBITDA, see “Mattress Firm Pro Forma EBITDA Reconciliation” in the appendix. Certain of the Non-GAAP financial measures included herein present prospective financial information. The Company has not provided a quantitative reconciliation between such financial measures to the most comparable financial measure or measures calculated and presented in accordance with GAAP because it is not reasonably practicable to produce such reconciliation for this prospective financial information. Financial Information for Acquired or to be Acquired Businesses The financial information set forth in this presentation for Sleep Train, Yotes, Sleep Experts, Mattress Liquidators, Back to Bed, and Best Mattress are estimates based on the internal financial statements for those businesses that were prepared by their respective prior management. Other than the financial information for Sleep Train, these internal financial statements were not prepared in accordance with GAAP. These internal financial statements have not been audited or, other than the fiscal year financial information for Sleep Train, reviewed by Mattress Firm’s independent auditors or any other accounting firm. The results reflected of audited financial statements may vary from the information provided in this presentation. 3 |
|
|
Today’s Presenters 4 Gavriel Lambert, Managing Director, Barclays Steve Stagner, President & CEO, Mattress Firm Alex Weiss, Chief Financial Officer, Mattress Firm Joe Jordan, Managing Director, Barclays |
|
|
Transaction Overview Mattress Firm Update Sleep Train Overview Acquisition Details and Strategic Rationale Financial Overview Syndication Overview Public Q&A _______________________________________________________________________________ Appendix Topics 5 |
|
|
Transaction Overview |
|
|
Transaction Overview Mattress Firm Holding Corp. ("Mattress Firm”, “MFRM” or the "Company") is the leading specialty retailer of mattresses and accessories in the U.S. On September 4, Mattress Firm announced it had agreed to acquire The Sleep Train, Inc. and subsidiaries (“Sleep Train”) and affirmed pending acquisitions of the assets and operations of two smaller specialty retailers, Best Mattress and Back to Bed (collectively, the “Bolt-Ons”) On September 8, Mattress Firm closed the Best Mattress acquisition Mattress Firm is seeking to refinance its existing Credit Facilities and fund the acquisitions with drawings on a new $125mm ABL Revolver, $720mm in 7-year Term Loan B, $40mm Mattress Firm equity issued directly to Sleep Train, and cash on hand Pro forma for the transaction, total leverage will be 3.3x and lease-adjusted leverage (8x rent) will be 6.0x as of the end of the Company’s second fiscal quarter, including $12.5mm of synergies(1) for Sleep Train, $4mm synergies for Bolt-Ons, and $17mm in LTM new store EBITDA adjustments(2) 7 Of the $20 million of expected synergies to be achieved by Fiscal 2017, the Company expects to achieve $12.5 million of synergies within the first 18 months. For stores that were opened less than a year ago, this pro forma adjustment treats the stores as if they were opened for a full year (see page 53). |
|
|
8 Transaction Summary Pro Forma Capitalization Sources and Uses As a result of additional Free Cash Flow the Company expects to have a lower outstanding balance at closing. Market capitalization assumes total outstanding share count of 34.2mm and share price of $64.66 from market close of 9/9/14. Mattress Firm includes $10.8mm of pro forma results and synergies from acquisitions completed as of end of Q2 as referenced on page 50. Of the $20 million of expected synergies to be achieved by Fiscal 2017, the Company expects to achieve $12.5 million of synergies within the first 18 months. (2) (4) (1) (1) (4) (3) ($ in millions) LTM Q2 2014: Mattress Sleep Pro Firm Train Bolt-ons Adj. Forma Cash $18 -- -- ($18) -- Existing Mattress Firm RCF -- -- -- -- -- $125mm New ABL -- -- -- 42 42 Existing Mattress Firm Term Loan B 297 -- -- (297) -- $720mm New Term Loan -- -- -- 720 720 Equipment Financing 1 -- -- -- 1 Total Secured Debt $297 -- -- $466 $763 Other Notes Payable $4 -- -- -- $4 Total Debt $302 -- -- $466 $767 Market Capitalization $2,210 -- -- 40 $2,250 Total Capitalization $2,512 -- -- -- $3,017 Adj. EBITDA $163 $32 $5 -- $200 Rent 199 45 15 -- 259 Adj. EBITDAR $361 $77 $20 -- $458 Synergies -- $13 $4 -- $17 Adj. EBITDA w/ Synergies 163 45 9 -- 216 New Stores Opened EBITDA Adjustment -- -- -- $17 $17 Adj. EBITDA w/ Synergies and New Stores Adj. 163 45 9 17 233 Capex $62 $7 $1 -- $70 Net Interest 12 -- -- 25 37 LTM Credit Statistics with Synergies Total Debt / Adj. EBITDA 1.9x -- -- -- 3.5x Adj. Total Debt / Adj. EBITDAR (8x rent) 5.2x -- -- -- 6.0x Total Debt / Adj. EBITDA with New Stores Adj. 1.9x -- -- -- 3.3x Adj. Total Debt / Adj. EBITDAR with New Stores Adj. (8x rent) 5.2x -- -- -- 6.0x Total Debt / Total Capitalization 12.0% 25.4% Adj. EBITDA / Net Interest 13.3x -- -- -- 5.8x ($ in millions) Sources Cash from Balance Sheet $18 $125mm New ABL 42 $720mm New Term Loan 720 Mattress Firm Equity Issued 40 Total Sources $821 Uses Purchase of Sleep Train $440 Purchase of Bolt-ons 66 Mattress Firm Existing Debt 297 Illustrative Fees and Expenses 18 Total Uses $821 |
|
|
Mattress Firm Update |
|
|
Key Investment Highlights Proven Track Record of Driving Profitability Compelling Industry Dynamics Best-in-Class Specialty Retailer Highly Achievable Growth Plan Experienced and Invested Management Team Long term stability and consistent growth Fragmented industry with no national chain Specialty Retailers continue to take share Pent-up demand with 80% replacement Largest footprint with significant scale and geographic diversity >90% stores in markets where company is #1 Unique selling proposition Fast <1 year cash on cash payback with new stores High correlation between penetration and profitability History of developing markets through increasing RMS Doubled store count over last three years Currently announced acquisitions will further enhance store growth ability Track record of successfully integrating acquisitions Management aligned with shareholders Top executives have 15+ years of relevant experience Mix between retail and industry experience 10 |
|
|
Mattress Firm Overview Includes franchise locations; as of July 29, 2014. Per internal study completed in August 2014; does not include markets open less than one year or franchise locations. Mattress Firm includes $38.8mm of pro forma results and synergies from acquisitions completed as of end of Q2. Reflects Adjusted EBITDA; EBITDA for 2013 and LTM exclude expenses referenced on page 50. Mattress Firm includes $10.8mm of pro forma results and synergies from acquisitions completed as of end of Q2 as referenced on page 50. Doubled store count in 3 years(1) #1 >90% of stores in markets where we have #1 market share(2) Largest Footprint Best in Class Sales Growth(3) Store Unit Growth Market Share Adj. EBITDA Growth(4) 1,587 locations(1) 11 $57mm $494mm $1,421mm $163mm CAGR: 35% CAGR: 35% CAGR: 28% LTM 14Q2 LTM 14Q2 |

|
|
Mattress Firm Sales and Profit Momentum Sales Performance(1) 35% CAGR In Millions Adjusted EBITDA Performance(2) In Millions Note: Fiscal year ended January of the following year. Mattress Firm includes $38.8mm of pro forma results and synergies from acquisitions completed as of end of Q2. Reflects Adjusted EBITDA; EBITDA for 2013 and LTM exclude expenses referenced on page 50. Mattress Firm includes $10.8mm of pro forma results and synergies from acquisitions completed as of end of Q2 as referenced on page 50. 12 35% CAGR |
|
|
Same Store Sales Performance Four consecutive quarters of same store sales growth Same stores sales growth has been strong in recent periods, driven by steady increases in unit sales Quarterly Sales Performance FY 2010 SSS: 6.3% FY 2011 SSS: 20.5% FY 2012 SSS: 6.1% FY 2013 SSS: 1.3% 13 |
|
|
Strong Free Cash Flow Generation Free Cash Flow defined as CFO less Capex. Minimal taxes paid in 2009 – 2011 due to NOLs. Free Cash Flow(1)(2) Generated $59 million of free cash flow in LTM period Maintained positive free cash flow during the recession Flexible business model that can adjust advertising and other cost levers to maintain profitability during a recession ($ in millions) 14 |
|
|
Attractive Industry Dynamics +24% +11% +16% +23% YOY Sales Growth U.S. Wholesale Bedding Sales Significantly Rebound After Prior Recessions(3) ($ in billions) Recession Recovery Long-term industry growth CAGR of approximately 5% Quick bounce back following recessions 2.5% expected growth in 2014 and 5.5% growth in 2015(2) Source: Furniture Today, September 2013. Source: ISPA Annual Report 2013. Source: ISPA – Mattress Industry U.S. Market Forecast issued April 2014; mattress and foundation sales. Mattress Specialty Retailers Taking Market Share(1) 1993 2012 15 |
|
|
Key Growth Drivers Approximately 80% of mattress sales are replacement Unit growth has been atypical since the last recession as lower-end consumers continue to struggle and manufacturer advertising is below peak levels Approximately 65% of beds are more than eight years old(1) Wholesale Mattress Shipments per Household(2) Wholesale Mattress and Foundation AUP(2) (3) Source: Ideaology – Ipsos DuraTrend May 2013 – February 2014. Source: ISPA – 2013 Mattress Industry Report of Sales & Trends. Source: ISPA – Mattress Industry U.S. Market Forecast issued April 2014. Technological benefits and manufacturer advertising have helped increase the Average Unit Price (“AUP”) at an approximately 4% CAGR since 1994 Continued price growth potential exists within the industry Significant Pent Up Demand and AUP Increases Expected to Drive Growth 16 |
|
|
Relative Market Share Model Driving Profitability Model Market Penetration Relative Market Share Incremental Advertising Market Profitability Comp Sales ADV Spend ADV per Capita Store Count Stores per Capita Sales per Store Adj. EBITDA Adj. EBITDA Margin $0.88 $1.93 Leadership Fortress Developmental Developmental Leadership 1:98k 1:62k 105 stores 65 stores $5.6mm $12.5mm $1.2mm $1.5mm $14.3mm $29.6mm 19.4% 20.5% +27% Case Study: Houston 17 |
|
|
Market Penetration Highly Correlated to Profitability Market Level Adjusted EBITDA1 Sales per Store1 Advertising $ Per Capita1 Note: Based on fiscal year 2013 results, including 91% of total stores (excluding markets not branded as Mattress Firm and markets open less than one year). Annualized weighted average of stores in each category. % of Sales: 12.7% % of Sales: 9.7% Occupancy 21.0% Occupancy 14.6% Occupancy 14.5% % of Sales: 8.8% FY 2013 Penetration level (stores per capita) 1:>170k 1:90k – 170k 1:<90k 1:<90k % of Store Base 4% 27% 47% 22% 18 Occupancy 12.0% % of Sales: 8.5% |
|
|
Accretive New Store Economic Model Includes approximately $40,000 in Year 1 for vendor funds collected upon store opening. Store 4-wall profitability divided by net store investment. Reflects midpoint of respective ranges. Stores Generate Cash on Cash Payback <1 Year Store 4-wall profitability drives improving leverage over market-level costs as store penetration increases 19 |
|
|
Achievable Growth Plan New Stores Organically 70% existing markets 30% new markets Existing franchisees Market leaders Tuck-ins Acquisitions Test Concepts Segmented brands Proprietary product Primary Secondary Alternate Channels E-commerce Special events (state fairs, home shows, etc.) Growth Drivers Franchise Legacy program Limited future growth Parallel growth 20 |
|
|
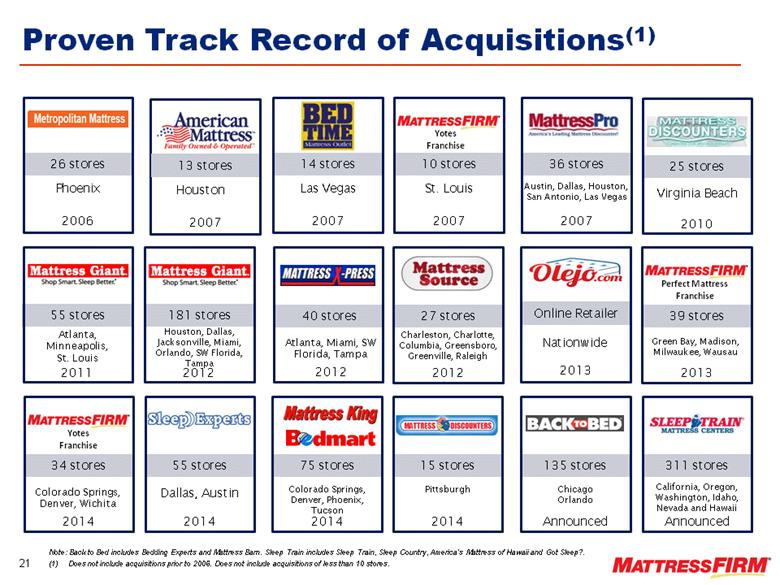
Proven Track Record of Acquisitions(1) 40 stores Atlanta, Miami, SW Florida, Tampa 2012 Austin, Dallas, Houston, San Antonio, Las Vegas 36 stores 2007 27 stores Charleston, Charlotte, Columbia, Greensboro, Greenville, Raleigh 2012 26 stores Phoenix 2006 14 stores Las Vegas 2007 55 stores Atlanta, Minneapolis, St. Louis 2011 34 stores Colorado Springs, Denver, Wichita 2014 Yotes Franchise 181 stores Houston, Dallas, Jacksonville, Miami, Orlando, SW Florida, Tampa 2012 10 stores St. Louis 2007 Yotes Franchise 25 stores Virginia Beach 2010 39 stores Green Bay, Madison, Milwaukee, Wausau 2013 Perfect Mattress Franchise 55 stores Dallas, Austin 2014 Houston 13 stores 2007 75 stores Colorado Springs, Denver, Phoenix, Tucson 2014 Nationwide 15 stores Pittsburgh 2014 135 stores Chicago Orlando Announced 311 stores California, Oregon, Washington, Idaho, Nevada and Hawaii Announced 21 Note: Back to Bed includes Bedding Experts and Mattress Barn. Sleep Train includes Sleep Train, Sleep Country, America’s Mattress of Hawaii and Got Sleep?. (1) Does not include acquisitions prior to 2006. Does not include acquisitions of less than 10 stores. |
|
|
Successful Integration Track Record (1) Monthly Store Average Post Rebranding Former Mattress Giant stores demonstrated strong comp results post rebranding 22 Post Rebranding +56% Post Rebranding 34% |
|
|
Years at Mattress Firm Years of Relevant Experience Experience Steve Stagner President and CEO 18 20 Ken Murphy Chief Operating Officer 15 16 Alex Weiss EVP and Chief Financial Officer 1 10 Kindel Elam EVP and General Counsel 2 10 Steve Fendrich EVP of M&A Integration 17 29 Karrie Forbes EVP of Marketing 15 15 Bruce Levy EVP of RE and Construction 5 26 Craig McAndrews EVP of Merchandising and Retail Concepts 7 20 Cathy Hauslein SVP and Chief Accounting Officer <1 30 Steve Johnson SVP and CIO <1 18 Sam Woods SVP of Sales and Operations 17 17 Experienced and Invested Management 23 |
|
|
Sleep Train Overview |
|
|
#1 Mattress Specialty Retailer in the West 6 Western States Market Share Store Unit Growth Sales Growth Adj. EBITDA Growth(2) #1 >90% of stores in markets with #1 market share(1) 311 Stores $13.8mm $313mm $496mm $32.1mm Per internal study completed in August 2014. Reflects Adjusted EBITDA; EBITDA for 2013 and LTM exclude expenses referenced on page 51. 77 35 7 5 9 178 CAGR: 14.1% CAGR: 27.3% CAGR: 8.6% LTM 14Q2 LTM 14Q2 25 Diversified Banners |

|
|
Strong Sales and Profit Performance Sales Performance 14.1% CAGR In Millions Adjusted EBITDA Performance(1) In Millions Note: Fiscal year ended December. Reflects Adjusted EBITDA; EBITDA for 2013 and LTM exclude expenses referenced on page 51. 27.3% CAGR 26 |
|
|
Same Store Sales Performance Note: Includes only traditional store format sales. FY2012: 11.7% FY2013: 0.8% Same store sales continue upward sequentially and are expected to be +MSD in 2H FY2014 Recent performance impacted by: California drought Personal tax increase including retroactive income Decreased advertising from bedding manufacturers 27 |
|
|
Best in Class Ticket Average and Sales per Store Given Specialty Focus The Specialty Mattress Category commands a >20% premium on average ticket Sleep Train commands an additional 36% over the specialty category Outperformance driven by above average ticket size, which drives higher sales per store of $1.6 million Source: Ideaology – Ipsos DuraTrend Findings for Mattress Firm, May 2013 – February 2014. 28 |
|
|
Diversified Vendor Selection Positioning: Mid to High End Low to Mid End Low to High End Mall 29 |
|
|
Years at Sleep Train Years of Relevant Experience Experience Dale Carlsen CEO and President 29 34 Rob Killgore Chief Operating Officer 28 28 Pete DiCorti Chief Financial Officer 6 41 Mike Combest EVP of Operations 24 24 John Haitz EVP of Finance 12 30 Mike Wilson EVP of Marketing 7 30 Paul Grimm General Counsel 9 30 Hernani Alves VP of Retail Sales 16 20 Matt Anderson VP of Training and Development 19 19 Brian Baxter VP of Merchandising 11 24 Tracy Jackson VP of Human Resources 10 17 Experienced and Deep Management Team Gordon, Odom & Davis Inc. Arthur Young & Co 30 |
|
|
Acquisition Details and Strategic Rationale |
|
|
Acquisitions Highlights Sleep Train is the #1 mattress specialty retailer on the West Coast and the #4 mattress specialty retailer in the U.S., operating 311 stores across California, Hawaii, Idaho, Nevada, Oregon and Washington, with LTM sales and Adj. EBITDA of $496mm and $32mm, respectively Total consideration for Sleep Train will be $440mm, subject to adjustments, an 8.5x multiple of LTM Q2 2014A Adj. EBITDA including $20mm of run-rate synergies 32 Tax Benefits of Transaction Bolt-On Acquisitions Sleep Train Acquisition Back to Bed, the Chicago-based bolt-on, operates 135 stores in the Midwest with LTM sales and EBITDA of $95mm and $5mm, respectively Total consideration for Back to Bed will be $60mm, subject to adjustments, a 7.2x multiple of LTM Q2 2014A EBITDA including $3.5mm of synergies Best Mattress Co. Inc., the Pittsburgh-based bolt-on, operates 15 stores in the Pittsburgh area with LTM sales and EBITDA of $13mm and $0.2mm, respectively Total consideration for Best Mattress Co. Inc. will be $6mm, subject to adjustments, a 7.3x multiple of LTM Q2 2014 EBITDA including $0.6mm of synergies Transaction structure creates an immediate $12.5mm asset step-up tax benefit per year for 15 years from all three acquisitions ($188mm total) Taking the NPV of the tax benefit into account, average EBITDA multiple paid for all three transactions is 6.3x |

|
|
Expands footprint into the West Coast, including key strategic markets Adds 311 retail store locations in major markets in California, Washington, Oregon, Nevada, Idaho and Hawaii from a leading market share player with limited overlap Provides customers with great value, convenience and choice Fortifies Mattress Firm as the leading mattress specialty retailer in the United States Pro forma sales surpassing $2 billion annually and total enterprise locations exceeding 2,000 retail store units Generates significant synergistic opportunities $20 million of identifiable cost and revenue synergy potential by the third year after closing Creates opportunity to begin leveraging national scale benefits Allows for enhanced nationwide delivery and distribution, advertising efficiencies and exclusive partnership opportunities Adds high-volume, established locations with a strong and experienced leadership team 29 year history of well-positioned, long-term leases in “hard to enter” trade areas Immediate scale with a sustained and profitable multi-brand organization Experienced and disciplined culture that is highly aligned with Mattress Firm Enhances financial performance and improves growth prospects Estimated to achieve mid-single digit earnings per diluted share (EPS) percentage accretion, on a generally accepted accounting principles basis, in the first full year after closing Combined business is anticipated to generate significant free cash flow Establishes a foundation to accelerate our proven relative market share model by further penetrating each market to drive market level profitability Strategic Rationale for Sleep Train #1 mattress specialty retailer on the West Coast #4 mattress specialty retailer in the U.S. Operates 311 stores in 6 major Western markets – California, Washington, Oregon, Nevada, Idaho and Hawaii >90% of stores in markets with #1 market share Industry leading average ticket size and sales per store Overview Investment Highlights 33 |
|
|
Current Pro Forma(3) Top Mattress Specialty Retailers(1) Sleep Train and Back to Bed acquisitions expected to strengthen Mattress Firm’s position as the #1 Mattress Specialty Retailer in the fragmented retail bedding environment Market Leading Position 34 Source: Furniture Today Top 100, May 2014. Reflects sales of the respective retailers divided by the estimated size of the U.S. mattress retail market in 2013; Furniture Today 2014 Retail Planning Guide. Assumes the 2012 and 2013 sales for Mattress Firm includes Sleep Train and Back to Bed. ($ in millions) ($ in millions) Rank Company 2013 Stores 2013 Sales YoY Growth Market Share (2) 1 Mattress Firm 1,361 $1,387 18.8% 10.0% 2 Sleepy’s 939 1,000 2.5% 7.2% 3 Sleep Number 440 922 2.3% 6.6% 4 Sleep Train 299 471 5.2% 3.4% 5 America’s Mattress 395 314 4.9% 2.3% 6 Back to Bed 131 106 1.9% 0.8% 7 Sit ‘n Sleep 31 99 2.9% 0.7% 8 Innovative Mattress Solutions 150 93 -3.1% 0.7% 9 Mattress Warehouse 165 91 7.1% 0.7% 10 American Mattress 92 67 -4.3% 0.5% 4,003 $4,551 7.2% 32.7% Top 10 |
|
|
Complementary Acquisitions to Expand National Footprint Includes franchise locations; as of July 29, 2014. Back to Bed also includes Bedding Experts and Mattress Barn. Sleep Train also includes Sleep Train, Sleep Country, America’s Mattress of Hawaii and Got Sleep?. 35 |
|
|
Significant Synergy Potential . Estimated Potential Synergies Cost Sales Sourcing & Procurement Distribution & Logistics Advertising SG&A Professional Services Other Approximately $20 million of estimated synergies by Year 3 Exclusive and Tertiary Products Multi-Channel / Omni-Channel Sales Strategic Partnerships Enhanced use of Customer Financing Other 36 |
|
|
Financial Overview |

|
|
Note: Fiscal year ended January of the following year. Mattress Firm includes $38.8mm of pro forma results and synergies from acquisitions completed as of end of Q2. Strong Sales Growth Strong historical sales growth through new store openings, same store sales growth and acquisitions Actual Annual Sales Performance(1) 35% CAGR (In millions) Pro Forma Annual Sales(1) Mattress Firm Bolt-Ons (In millions) 38 |
|
|
Robust EBITDA Growth Strong historical EBITDA growth through sales increases, cost efficiencies and a pursuit of Relative Market Share Historical focus on increasing EBITDA margin percentage Recent deleverage due to acquisitions, selling initiatives related to the taking comp back initiative and a slower growing bedding environment Actual Annual Adjusted EBITDA Performance(1) 35% CAGR Reflects actual Adjusted EBITDA; LTM Q2 reflects actual Adjusted EBITDA plus $10.8mm pro forma for completed acquisitions as referenced on page 50. Mattress Firm includes $10.8mm of pro forma results and synergies from acquisitions completed as of end of Q2 as referenced on page 50. Pro Forma Adjusted EBITDA(2) (In millions) (In millions) 39 Sleep Train Mattress Firm Bolt-Ons Adj. EBITDA Margin |
|
|
History of Reinvestment in the Business Strong historical sales growth through new store openings, same store sales growth and acquisitions Approximately 30% of LTM capital expenditures were maintenance related Actual Annual CapEx Pro Forma CapEx (In millions) (In millions) Mattress Firm Bolt-Ons 40 |
|
|
CASH CONVERSION CYCLE Day 24: Customer Purchases in Store Day 26: Cash Received by MF 14 days of Vendor Float Day 0: Mattress Arrives in DC Day -2: MF Orders Mattress Day 40: MF Pays Vendor The Company’s cash conversion cycle provides a negative working capital business model which helps to fund store growth Negative Working Capital Helps to Fund Growth 41 |
|
|
History of Strong Free Cash Flow Generation & Deleveraging Free Cash Flow defined as CFO less Capex. Minimal taxes paid in 2010 – 2011 due to NOLs. Reflects actual Adjusted EBITDA plus $10.8mm pro forma for completed acquisitions as referenced on page 50. For illustrative purposes. Based on adjusted EBITDA including synergies for Sleep Train and Bolt-Ons. Includes expected step-up tax benefits from the transactions. Generated $59 million of free cash flow in LTM period Maintained positive free cash flow during the recession Flexible business model that can adjust advertising and other cost levers to maintain profitability during a recession (In millions) Free Cash Flow(1)(2) Debt / Adjusted EBITDA(3) Historical deleverage through: Free cash flow generation Increases in EBITDA Proceeds from the 2011 Initial Public Offering Pro Forma Free Cash Flow(1) (4) Sleep Train Mattress Firm Bolt-Ons PF Combined: MFRM, ST, Bolt-Ons 42 (In millions) |
|
|
Syndication Overview |

|
|
Summary Terms – ABL Revolver 44 Borrower: Mattress Holding Corp. (the “Borrower”) Facility Description: $125 million Asset Based Revolver (the “ABL Facility”) with availability subject to the Borrowing Base Incremental Facility: $75 million; incremental to be on the same terms as the existing ABL Facility Tenor: 5 years, prepayable at par Indicative Margin: L+150 bps for the first full quarter after closing; thereafter L+125-175 bps subject to an availability based grid Commitment Fee: 37.5 bps on the unused portion of the facility for the first full quarter after closing; thereafter 25-37.5 bps subject to a utilization based grid Security: Perfected first priority liens on accounts receivable, credit card receivables, inventory and proceeds thereof (the “ABL Collateral”); second lien on the term loan collateral Guarantors: Mattress Holdco, Inc. and all current and future direct or indirect wholly-owned U.S. restricted subsidiaries, subject to certain exceptions Borrowing Base: The sum of (i) 100% of Qualified Cash, (ii) 85% of eligible accounts receivable, (iii) 90% of eligible credit card receivables, and (iv) 90% of the net orderly liquidation value of eligible inventory, less customary reserves Specified Excess Availability: The sum of (i) Excess Availability and (ii) up to 2.5% of the aggregate commitments under the ABL Facility by the amount the Borrowing Base exceeds the aggregate commitments under the ABL Facility Financial Covenants: Springing fixed charge coverage ratio of 1.0x if at any time Specified Excess Availability is less than the greater of (i) $10 million and (ii) 10% of the lesser of the Borrowing Base and the ABL Facility size (the “Maximum Borrowing Amount”) Cash Management: Springing cash dominion in the event that Specified Excess Availability falls below the greater of (i) $12.5 million and (ii) 12.5% of the Maximum Borrowing Amount for 5 consecutive business days, or during a Specified Default (a “Cash Dominion Period”) Reporting: Financial statements quarterly and annually Borrowing Base reporting monthly springing to weekly during a Cash Dominion Period or Specified Default Field Exam/Appraisal Frequency: One field exam and inventory appraisal per annum springing to two times per annum if Specified Excess Availability falls below 15% of the Maximum Borrowing Amount for 5 consecutive business days, and more frequently during a Specified Default, and one additional field exam and inventory appraisal at the ABL Administrative Agent’s expense during any fiscal year Negative Covenants: Usual and customary for transactions of the type, including limitations on indebtedness, liens, investments, asset sales / leaseback transactions, restricted payments, and junior debt repayments in each case subject to exceptions to be agreed including carve-outs for unlimited investments, repayments of debt and restricted payments when meeting certain Payment Conditions Payment Conditions: Payment Conditions shall be satisfied so long as: (i) (a) Pro Forma Specified Excess Availability for the average trailing 30 day period is in excess of the greater of (1) $20 million and (2) 20% of the Maximum Borrowing Amount ($20 million and $22.5 million for Restricted Payments), or (b) pro forma compliance for the most recent four fiscal quarters with a Fixed Charge Coverage Ratio of 1.0x, and pro forma Specified Excess Availability for the average trailing 30 day period is in excess of the greater of (1) $15 million and (2) 12.5% of the Maximum Borrowing Amount ($15 million and 17.5% for Restricted Payments); and (ii) No Event of Default exists or would result therefrom |
|
|
Summary Terms – Term Loan Facility Borrower: Mattress Holding Corp. (the “Borrower”) Facility Description: $720 million Term Loan B (“Term Loan B”) Incremental Term Facility: $250 million, plus voluntary prepayments and commitment reductions, plus unlimited additional amounts subject to maximum closing Secured Net Leverage Ratio of 4.0x, in each case subject to 50 bps MFN with a 18-month sunset provision; Incremental Term Facility definition to include Incremental Equivalent Debt option, subject to certain conditions Maturity: 7 years Indicative Margin: TBD LIBOR Floor: 1.00% Upfront / OID: TBD Use of Proceeds: Proceeds used to fund the acquisition of Sleep Train and Bolt-Ons, refinance existing indebtedness, and pay related fees and expenses Guarantors: Holdings and all current and future direct or indirect wholly-owned U.S. restricted subsidiaries, subject to certain exceptions Security: Perfected first priority liens on the capital stock of the Borrower; the capital stock of the Borrower or any ABL Guarantor in any subsidiary; all evidence of indebtedness of Holdings, the Borrower, or any ABL Guarantor; all plant, owned real property, and equipment of the loan parties; substantially all other personal property of the loan parties, including investments and intellectual property; in each case subject to certain exceptions; second priority lien on the ABL Collateral Ranking: Pari passu with all existing and future senior indebtedness and senior to all existing and future senior subordinated indebtedness Optional Prepayments: 101 soft call for 6 months, pre-payable at par thereafter Mandatory Prepayments: 100% of asset sales, insurance proceeds, and debt issuances, subject to certain exceptions 50% of excess cash flow with step-downs to 25% and 0% upon achievement of Secured Net Leverage Ratio levels of 0.50x and 0.75x lower, respectively, than those on the Closing Date Amortization: 1% per annum with bullet at maturity Financial Covenants: None Negative Covenants: Usual and customary for transactions of this type, including limitations on indebtedness, liens, investments, asset sales, restricted payments, and junior debt repayments, in each case subject to exceptions; for more information, please consult the Marketing Term Sheet 45 |
|
|
Pro Forma Organizational Structure Public entity. Borrower Guarantor 46 |
|
|
Transaction Timeline Date Key Event September 11th September 25th Week of September 29th Bank Meeting Commitments Due Close & Fund September 2014 S M T W T F S 1 2 3 4 5 6 7 8 9 10 11 12 13 14 15 16 17 18 19 20 21 22 23 24 25 26 27 28 29 30 Bank Holiday October 2014 S M T W T F S 1 2 3 4 5 6 7 8 9 10 11 12 13 14 15 16 17 18 19 20 21 22 23 24 25 26 27 28 29 30 31 Key Transaction Date 47 |
|
|
Public Q&A |

|
|
Appendix |

|
|
Mattress Firm Pro Forma EBITDA Reconciliation 50 ___________________________ Note: Mattress Firm prepares Pro Forma Adjusted EBITDA by further adjusting Adjusted EBITDA to give effect to recent Completed Acquisitions, as well as the pending acquisitions of Sleep Train and the Bolt-Ons, as if those acquisitions had occurred on 7/31/2013, by adding management’s estimate of the Adjusted EBITDA plus purchasing synergies for each such business remaining to be realized in the first year. Completed Acquisitions represent the acquisition of the assets and operations of franchisee Yotes, Inc., partnership enterprise Sleep Experts Partners, L.P, and the assets and operations of mattress specialty retailer Mattress Liquidators, Inc. Additional details regarding these acquisitions can be found in the Company’s public SEC filings. Pro Forma Adjusted EBITDA does not include any additional pro forma contribution from, or additional adjustment for, the recent acquisition of the Virginia assets and operations of Southern Max, LLC., another franchisee. Purchasing synergies are the immediate cost savings derived from the reduction in per unit input costs associated with the products that Mattress Firm sells due to the Company’s scale. Purchasing synergies are estimated based on supplier contracts in effect as of the date of the calculation and do not represent the actual savings that may be realized. The Adjusted EBITDA and purchasing synergies presented in this document for the recent Completed Acquisitions, Sleep Train, and the Bolt-Ons are based on the financial statements for those businesses as prepared by their respective pre-acquisition management and from due diligence procedures performed by Mattress Firm. The synergies, cost savings, and operating expense reductions that have been included herein are reasonably anticipated to be realized within one year of each acquisition closing and factually supportable as determined in good faith by Mattress Firm. Financial statements for the Completed Acquisitions and Bolt-Ons have not been audited or reviewed by independent auditors or any other accounting firm. Investors should be aware that Adjusted EBITDA for these acquired entities may not be entirely comparable to Mattress Firm’s measure of EBITDA or Adjusted EBITDA. Pro Forma Adjusted EBITDA has not been prepared in accordance with the requirements of Regulation S-X or any other securities laws relating to the presentation of pro forma financial information. Pro Forma Adjusted EBITDA is presented for information purposes only and does not purport to represent what Mattress Firm’s actual financial position or results of operations would have been if the acquisitions had been completed as of an earlier date or that may be achieved in the future. ($ in millions) FYE January of the following year 2013 LTM Q2 2014 EBITDA $128.9 $128.1 Stock-Based Compensation 4.8 5.5 Vendor New Store Funds 0.8 (0.6) Acquisition-Related Expenses 1.7 11.1 Loss on Store Closings and Impairment of Store Assets 1.5 1.7 Intangible Asset Impairment Charge -- -- Financial Sponsor Fees and Expenses 0.0 0.0 Other Adjustments 2.1 5.9 Adjusted EBITDA $140.0 $151.7 Pro Forma Adjustments for Completed Acquistions, including purchasing synergies 10.8 Pro Forma Adjusted EBITDA (standalone) $162.6 Pro Forma Adjustments for Sleep Train, including purchasing synergies 44.6 Pro Forma Adjustments for Bolt-Ons, including purchasing synergies 9.1 Pro Forma Adjusted EBITDA $216.3 |

|
|
Sleep Train Pro Forma EBITDA Reconciliation 51 ___________________________ Note: Pro Forma Adjusted EBITDA for the pending acquisition of Sleep Train is derived from the audited fiscal year-end and unaudited quarterly financial statements of The Sleep Train, Inc. and subsidiaries. The Pro Forma Adjusted EBITDA for the LTM Q2 2014 period includes management’s estimate of the Adjusted EBITDA from Sleep Train’s recent acquisition of America’s Mattress stores in Hawaii. Such amount does not give effect to any purchasing synergies Sleep Train realized in the America’s Mattress acquisition. America’s Mattress financial statements have not been audited or reviewed by independent auditors or any other accounting firm. Sleep Train’s Pro Forma Adjusted EBITDA for the LTM Q2 2014 period includes half of the $20 million in run-rate annual purchasing synergies that Mattress Firm reasonably expects to reach within three years of the acquisition closing date, as well as $2.5 million in purchasing synergies that Mattress Firm reasonably expects to realize within the first 18 months of the acquisition closing date. ($ in millions) FYE January of the following year 2013 LTM Q2 2014 EBITDA $26.3 $25.4 Wages Related to ESOP Share-Allocations & SARS 6.5 3.9 Forgiveness of Restricted Stock Notes Receivable 0.6 0.6 Loss on Disposal of Property & Equipment 0.1 0.4 LIFO Adjustment Expense 0.2 -- Severage Costs and Related Payroll Taxes 0.0 0.0 Litigation Settlement Agreement (0.8) -- Adjusted EBITDA $33.0 $30.3 Adjusted EBITDA from America's Mattress acquisition 1.8 50% of Estimated Run-Rate Synergies 10.0 Additional Purchasing Synergies Realizable in 18 Months 2.5 Pro Forma Adjusted EBITDA $44.6 |

|
|
Completed Acquisitions & Bolt-Ons Pro Forma Adjusted EBITDA Reconciliation 52 ___________________________ Pro Forma Adjusted EBITDA for the Completed Acquisitions represents management’s estimate of the Adjusted EBITDA and purchasing synergies realizable for Yotes, Inc., Sleep Experts Partners, L.P, and Mattress Liquidators, Inc. for the period of 7/31/2013 to the closing dates of the respective acquisitions. Pro Forma Adjusted EBITDA for the Bolt-Ons represents management’s estimate of the Adjusted EBITDA and purchasing synergies realizable for Back to Bed and Best Mattress in one year. Effective March 3, 2014, the Company acquired certain leasehold interests, store assets, distribution center assets and related inventories, and assumed certain liabilities of Yotes, Inc. (“Yotes”), a franchisee of the Company, relating to the operation of 34 mattress specialty retail stores located in Colorado and Kansas for a total purchase price of approximately $14.3 million, including working capital adjustments, subject to customary post-closing adjustments Effective April 3, 2014, the Company acquired one hundred percent of the outstanding partnership interests in Sleep Experts Partners, L.P. (“Sleep Experts”), related to the operation of 55 mattress specialty retail stores in Texas under the brand Sleep Experts, for a total purchase price of approximately $67.8 million, including working capital adjustments. Effective June 4, 2014, the Company acquired substantially all of the mattress specialty retail assets and operations of Mattress Liquidators, Inc. (“Mattress Liquidators”), which operated Mattress King retail stores in Colorado and BedMart retail stores in Arizona, related to the operation of 67 mattress specialty retail stores, for a total purchase price of approximately $32.9 million, giving effect to certain preliminary adjustments, and is subject to further customary adjustments. ($ in millions) Completed Acquisitions (1) Bolt-Ons (2) LTM Q2 2014 Yotes (3) Sleep Experts (4) Mattress Liquidators (5) Back To Bed Best Mattress EBITDA $0.1 $3.4 $2.2 $4.8 $0.2 Remaining Year 1 Purchasing Synergies 0.6 2.0 2.5 3.5 0.6 Pro Forma Adjusted EBITDA $0.7 $5.4 $4.7 $8.3 $0.8 Combined Pro Forma Adjusted EBITDA for Completed Acquisitions & Bolt-Ons $10.8 $9.1 |
|
|
Pro Forma LTM New Stores Opened EBITDA Adjustment 53 ___________________________ Corporate EBITDA assumes 50% of market level expenses which includes market overhead, advertising, warehouse occupancy and warehouse operating costs. ($ in millions) LTM Q2 2014 Total Number of LTM New Stores Opened 186 Average Annualized Corporate EBITDA per Store from LTM New Stores Opened (1) $0.175 Pro Forma EBITDA from LTM New Stores Opened $32.5 Less: Actual EBITDA for LTM New Stores Opened (15.7) Pro Forma LTM New Stores Opened EBITDA Adjustment $16.8 |
|
|
54 Pro Forma Borrowing Base Availability Pro Forma Borrowing Base Borrowing Base equals the sum of: (i) 100% of Qualified Cash (ii) 85% of Eligible Accounts Receivable (iii) 90% of Eligible Credit Card Receivables (iv) 90% of the Net Orderly Liquidation Value of Eligible Inventory; Less: Customary Reserves Pro Forma as of July 1, 2014 Borrowing Base Availability: $86 million Excess Availability: $41 million Total Liquidity: $41 million The Facility is secured by (i) a perfected first-priority security interest in substantially all personal property of the ABL Loan Parties consisting of accounts receivable, inventory, cash, deposit accounts, securities, commodity accounts and other related current assets, and (ii) a perfected second priority lien on the term loan collateral The inventory appraisal conducted by Hilco as of July 1, 2014 will be posted for Lenders’ review and will include the actual NOLV to be used for the Eligible Inventory Advance Rates; we have estimated 65% NOLV for illustrative purposes. Sleep Train does not currently track certain ineligible inventory types. To protect the Lenders until the Sleep Train assets are merged onto the Mattress Firm systems, the advance rate on the Sleep Train Inventory will be 85% of the NOLV on Eligible Inventory. ($ in '000) As of July 1, 2014 Mattress Firm Sleep Train TOTAL Credit Card Gross Credit Cards $6,296 $0 $6,296 Ineligible Credit Card Receivables 1,507 - 1,507 Net Eligible Credit Card Receivables 4,790 - 4,790 Advance Rate 90.0% 90.0% 90.0% Gross Credit Card Receivables Availability $4,311 $0 $4,311 3rd Party Financing Receivables 3rd Party Financing Receivables $7,820 $0 $7,820 Ineligible 3rd Party Financing Receivables 872 - 872 Net Eligible 3rd Party Financing Receivables 6,947 - 6,947 Advance Rate 85.0% 85.0% 85.0% Gross 3rd Party Financing Receivables Availability $5,905 $0 $5,905 Other Receivables (Sleep Train Receivables) Credit Cards and 3rd Party Financing Receivables $0 $11,046 $11,046 Ineligible Other Receivables - 2,848 2,848 Eligible Other Receivables - 8,197 8,197 Advance Rate 85.0% 85.0% 85.0% Gross Other Receivables Availability $0 $6,968 $6,968 Receivable Reserves $5,028 $1,487 $6,515 Net Accounts Receivable Availability $5,188 $5,481 $10,669 Inventory Inventory (per the perpetual) $121,431 $45,034 $166,465 Ineligible Inventory 8,671 348 9,020 Net Eligible Inventory 112,759 44,686 157,445 Advance Rate (90% for MF and 85% for ST x 65% Estimated NOLV) (1) (2) 58.5% 55.3% Gross Inventory Availability $65,964 $24,689 $90,653 Inventory Reserves $7,611 $7,275 $14,885 Net Inventory Availability $58,354 $17,414 $75,768 Borrowing Base Availability $63,541 $22,895 $86,436 Less: Pro Forma Loans 42,000 Less: Existing Letters of Credit 1,648 1,445 3,093 Excess Availability $61,893 $21,450 $41,343 Cash & Cash Equivalents $0 Total Liquidity $41,343 |
|
|
[LOGO] |